Embed Size (px)
Citation preview
OECD Agricultural Policies2004AT A GLANCE
«www.oecd.org
Highlights
20042004
ORGANISATION FOR ECONOMIC CO-OPERATION AND DEVELOPMENT
OECD Agricultural Policies 2004
AT A GLANCE
ORGANISATION FOR ECONOMIC CO-OPERATION AND DEVELOPMENT
Pursuant to Article 1 of the Convention signed in Paris on 14th December 1960, and which came
into force on 30th September 1961, the Organisation for Economic Co-operation and Development (OECD)
shall promote policies designed:
– to achieve the highest sustainable economic growth and employment and a rising standard of
living in member countries, while maintaining financial stability, and thus to contribute to the
development of the world economy;
– to contribute to sound economic expansion in member as well as non-member countries in the
process of economic development; and
– to contribute to the expansion of world trade on a multilateral, non-discriminatory basis in
accordance with international obligations.
The original member countries of the OECD are Austria, Belgium, Canada, Denmark, France,
Germany, Greece, Iceland, Ireland, Italy, Luxembourg, the Netherlands, Norway, Portugal, Spain,
Sweden, Switzerland, Turkey, the United Kingdom and the United States. The following countries
became members subsequently through accession at the dates indicated hereafter: Japan
(28th April 1964), Finland (28th January 1969), Australia (7th June 1971), New Zealand (29th May 1973),
Mexico (18th May 1994), the Czech Republic (21st December 1995), Hungary (7th May 1996), Poland
(22nd November 1996), Korea (12th December 1996) and the Slovak Republic (14th December 2000). The
Commission of the European Communities takes part in the work of the OECD (Article 13 of the
OECD Convention).
Publié en français sous le titre :
OCDE Politiques agricoles 2004
EN COUP D'ŒIL
© OECD 2004
Permission to reproduce a portion of this work for non-commercial purposes or classroom use should be obtained through the Centre français
d’exploitation du droit de copie (CFC), 20, rue des Grands-Augustins, 75006 Paris, France, tel. (33-1) 44 07 47 70, fax (33-1) 46 34 67 19, for every country except
the United States. In the United States permission should be obtained through the Copyright Clearance Center, Customer Service, (508)750-8400,
222 Rosewood Drive, Danvers, MA 01923 USA, or CCC Online: www.copyright.com. All other applications for permission to reproduce or translate all or part
of this book should be made to OECD Publications, 2, rue André-Pascal, 75775 Paris Cedex 16, France.
FOREWORD
Foreword
This is the 1st edition of OECD Agricultural Policies: At a Glance, which will be published in
alternate years with the Agricultural Policies in OECD Countries: Monitoring and Evaluation.*
Based on a comprehensive and comparative system for classifying support to agriculture the
report consists of two parts. Part I provides a short description and an overall assessment of
agricultural support policy developments and agricultural support overall in member countries. Part
II provides that information in individual member countries. The publication also contains more
detailed and support estimates and brings also results of support estimates for two non-member
countries – Russia and Ukraine.
The OECD's Working Party on Agricultural Policies and Markets approved the publication of the
Executive Summary and Part I of the report in May 2004. The rest of the report is published under
the responsibility of the Secretary-General of the OECD.
* In 2003 member countries agreed that the Monitoring and Evaluation report will be published everysecond year.
Acknowledgements. This edition of OECD Agricultural Policies – At a Glance, was
prepared by the Food, Agriculture and Fisheries Directorate of the OECD with the
active participation of member countries. The following staff from the OECD
Secretariat contributed to drafting this report: Václav Vojtech (co-ordinator), Jesús
Antón, Ken Ash, Carmel Cahill, Dimitris Diakosavvas, Hsin Huang, Darryl Jones, Yoon
Jong Kim, Osamu Kubota, Andrzej Kwiecinski, Wilfrid Legg, Roger Martini, Olga
Melyukhina, Catherine Moreddu, Kevin Parris, Luis Portugal, and Stefan
Tangermann. Alexandra de Matos Nunes co-ordinated the preparation of the main
tables and graphs for the report. Statistical assistance was provided by Maria-Luisa
Gil Lapetra, Céline Giner, Florence Mauclert, Laetitia Reille, Véronique de Saint-
Martin and Chen Young. Secretarial services were provided by Françoise Benicourt,
Marina Giacalone and Michèle Patterson. Technical assistance in the preparation of
the PSE/CSE database for the website presentation was provided by Eric Espinasse and
Serge Petiteau. Many other colleagues in the OECD Secretariat furnished useful
comments on various drafts of the report.
OECD AGRICULTURAL POLICIES 2004: AT A GLANCE – ISBN 92-64-01603-1 – © OECD 2004 3

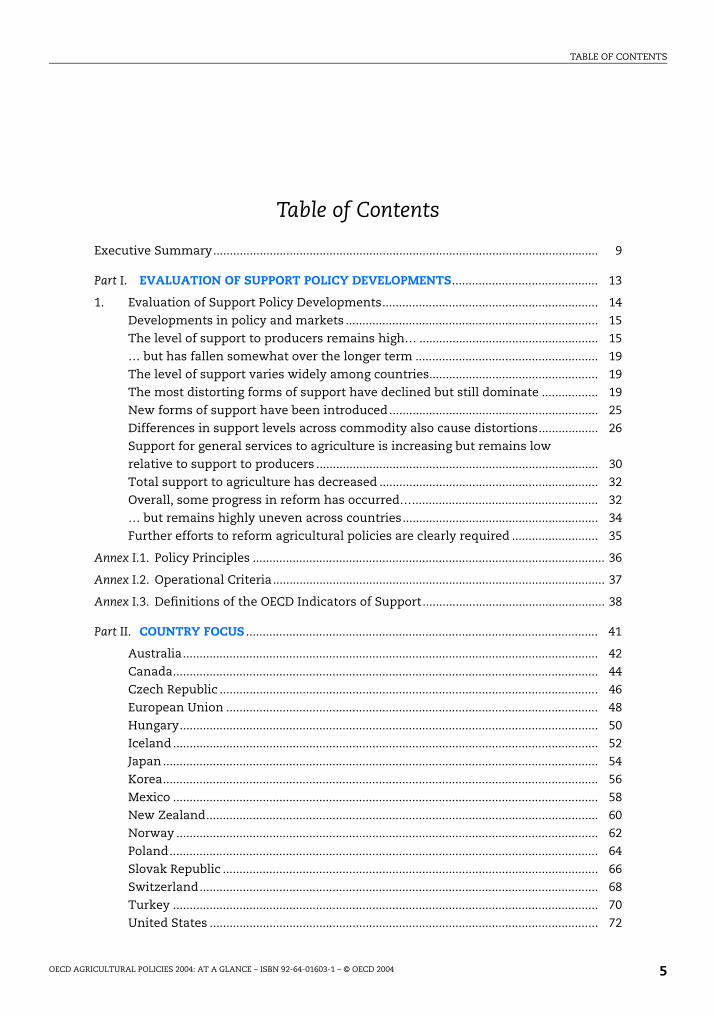
TABLE OF CONTENTS
Table of Contents
Executive Summary.................................................................................................................... 9
Part I. EVALUATION OF SUPPORT POLICY DEVELOPMENTS............................................ 13
1. Evaluation of Support Policy Developments................................................................. 14
Developments in policy and markets ............................................................................ 15
The level of support to producers remains high… ...................................................... 15
… but has fallen somewhat over the longer term ....................................................... 19
The level of support varies widely among countries................................................... 19
The most distorting forms of support have declined but still dominate ................. 19
New forms of support have been introduced............................................................... 25
Differences in support levels across commodity also cause distortions.................. 26
Support for general services to agriculture is increasing but remains low
relative to support to producers ..................................................................................... 30
Total support to agriculture has decreased .................................................................. 32
Overall, some progress in reform has occurred…........................................................ 32
… but remains highly uneven across countries........................................................... 34
Further efforts to reform agricultural policies are clearly required .......................... 35
Annex I.1. Policy Principles .......................................................................................................... 36
Annex I.2. Operational Criteria.................................................................................................... 37
Annex I.3. Definitions of the OECD Indicators of Support....................................................... 38
Part II. COUNTRY FOCUS .......................................................................................................... 41
Australia............................................................................................................................. 42
Canada................................................................................................................................ 44
Czech Republic .................................................................................................................. 46
European Union ................................................................................................................ 48
Hungary.............................................................................................................................. 50
Iceland ................................................................................................................................ 52
Japan................................................................................................................................... 54
Korea................................................................................................................................... 56
Mexico ................................................................................................................................ 58
New Zealand...................................................................................................................... 60
Norway ............................................................................................................................... 62
Poland................................................................................................................................. 64
Slovak Republic ................................................................................................................. 66
Switzerland........................................................................................................................ 68
Turkey ................................................................................................................................ 70
United States ..................................................................................................................... 72
OECD AGRICULTURAL POLICIES 2004: AT A GLANCE – ISBN 92-64-01603-1 – © OECD 2004 5
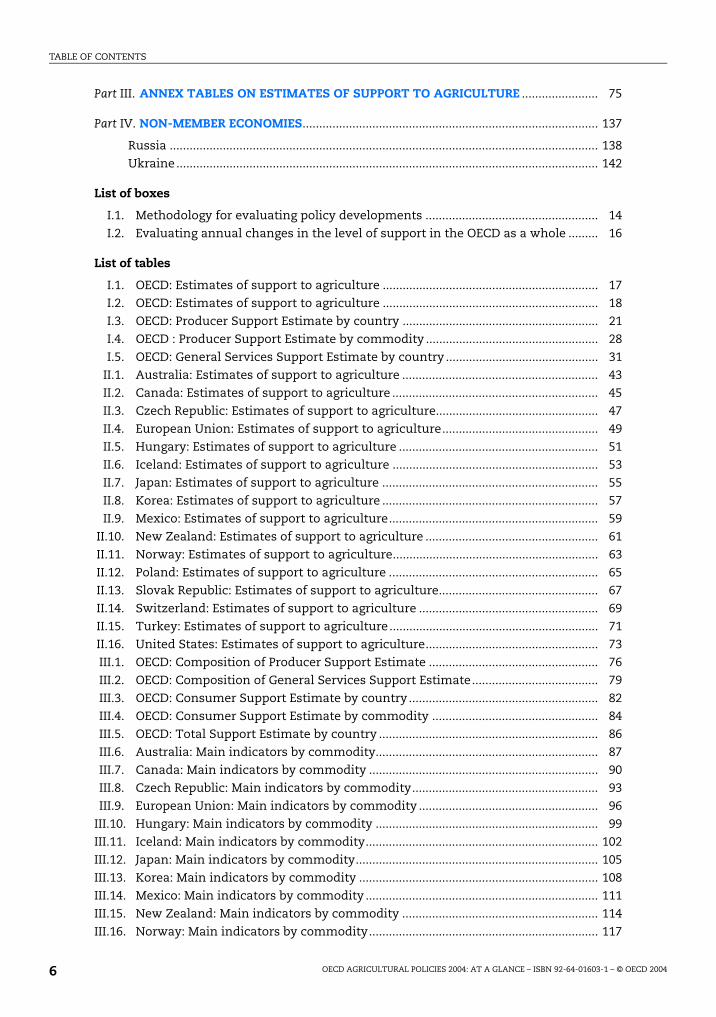
TABLE OF CONTENTS
Part III. ANNEX TABLES ON ESTIMATES OF SUPPORT TO AGRICULTURE ....................... 75
Part IV. NON-MEMBER ECONOMIES......................................................................................... 137
Russia ................................................................................................................................. 138
Ukraine............................................................................................................................... 142
List of boxes
I.1. Methodology for evaluating policy developments .................................................... 14
I.2. Evaluating annual changes in the level of support in the OECD as a whole ......... 16
List of tables
I.1. OECD: Estimates of support to agriculture ................................................................. 17
I.2. OECD: Estimates of support to agriculture ................................................................. 18
I.3. OECD: Producer Support Estimate by country ........................................................... 21
I.4. OECD : Producer Support Estimate by commodity .................................................... 28
I.5. OECD: General Services Support Estimate by country .............................................. 31
II.1. Australia: Estimates of support to agriculture ........................................................... 43
II.2. Canada: Estimates of support to agriculture .............................................................. 45
II.3. Czech Republic: Estimates of support to agriculture................................................. 47
II.4. European Union: Estimates of support to agriculture............................................... 49
II.5. Hungary: Estimates of support to agriculture ............................................................ 51
II.6. Iceland: Estimates of support to agriculture .............................................................. 53
II.7. Japan: Estimates of support to agriculture ................................................................. 55
II.8. Korea: Estimates of support to agriculture ................................................................. 57
II.9. Mexico: Estimates of support to agriculture............................................................... 59
II.10. New Zealand: Estimates of support to agriculture .................................................... 61
II.11. Norway: Estimates of support to agriculture.............................................................. 63
II.12. Poland: Estimates of support to agriculture ............................................................... 65
II.13. Slovak Republic: Estimates of support to agriculture................................................ 67
II.14. Switzerland: Estimates of support to agriculture ...................................................... 69
II.15. Turkey: Estimates of support to agriculture............................................................... 71
II.16. United States: Estimates of support to agriculture.................................................... 73
III.1. OECD: Composition of Producer Support Estimate ................................................... 76
III.2. OECD: Composition of General Services Support Estimate...................................... 79
III.3. OECD: Consumer Support Estimate by country ......................................................... 82
III.4. OECD: Consumer Support Estimate by commodity .................................................. 84
III.5. OECD: Total Support Estimate by country .................................................................. 86
III.6. Australia: Main indicators by commodity................................................................... 87
III.7. Canada: Main indicators by commodity ..................................................................... 90
III.8. Czech Republic: Main indicators by commodity........................................................ 93
III.9. European Union: Main indicators by commodity ...................................................... 96
III.10. Hungary: Main indicators by commodity ................................................................... 99
III.11. Iceland: Main indicators by commodity...................................................................... 102
III.12. Japan: Main indicators by commodity......................................................................... 105
III.13. Korea: Main indicators by commodity ........................................................................ 108
III.14. Mexico: Main indicators by commodity ...................................................................... 111
III.15. New Zealand: Main indicators by commodity ........................................................... 114
III.16. Norway: Main indicators by commodity..................................................................... 117
OECD AGRICULTURAL POLICIES 2004: AT A GLANCE – ISBN 92-64-01603-1 – © OECD 20046
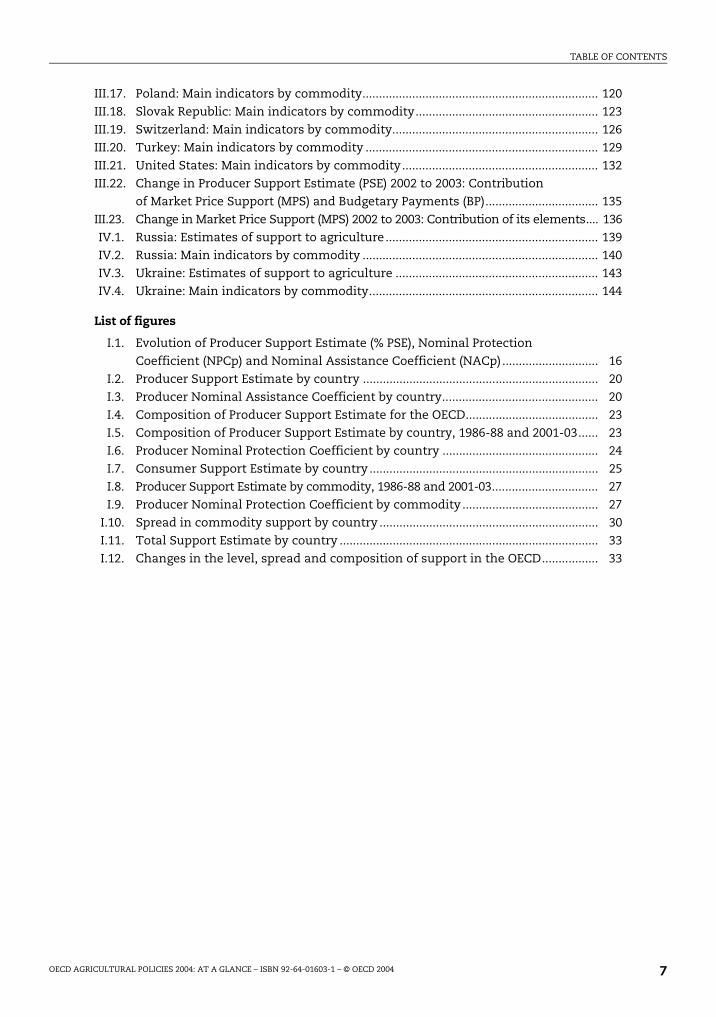
TABLE OF CONTENTS
III.17. Poland: Main indicators by commodity....................................................................... 120
III.18. Slovak Republic: Main indicators by commodity....................................................... 123
III.19. Switzerland: Main indicators by commodity.............................................................. 126
III.20. Turkey: Main indicators by commodity ...................................................................... 129
III.21. United States: Main indicators by commodity........................................................... 132
III.22. Change in Producer Support Estimate (PSE) 2002 to 2003: Contribution
of Market Price Support (MPS) and Budgetary Payments (BP).................................. 135
III.23. Change in Market Price Support (MPS) 2002 to 2003: Contribution of its elements.... 136
IV.1. Russia: Estimates of support to agriculture................................................................ 139
IV.2. Russia: Main indicators by commodity ....................................................................... 140
IV.3. Ukraine: Estimates of support to agriculture ............................................................. 143
IV.4. Ukraine: Main indicators by commodity..................................................................... 144
List of figures
I.1. Evolution of Producer Support Estimate (% PSE), Nominal Protection
Coefficient (NPCp) and Nominal Assistance Coefficient (NACp)............................. 16
I.2. Producer Support Estimate by country ....................................................................... 20
I.3. Producer Nominal Assistance Coefficient by country............................................... 20
I.4. Composition of Producer Support Estimate for the OECD........................................ 23
I.5. Composition of Producer Support Estimate by country, 1986-88 and 2001-03...... 23
I.6. Producer Nominal Protection Coefficient by country ............................................... 24
I.7. Consumer Support Estimate by country ..................................................................... 25
I.8. Producer Support Estimate by commodity, 1986-88 and 2001-03................................ 27
I.9. Producer Nominal Protection Coefficient by commodity ......................................... 27
I.10. Spread in commodity support by country .................................................................. 30
I.11. Total Support Estimate by country .............................................................................. 33
I.12. Changes in the level, spread and composition of support in the OECD................. 33
OECD AGRICULTURAL POLICIES 2004: AT A GLANCE – ISBN 92-64-01603-1 – © OECD 2004 7

ISBN 92-64-01603-1
OECD Agricultural Policies 2004: At a Glance
© OECD 2004
Executive Summary
OECD AGRICULTURAL POLICIES 2004: AT A GLANCE – ISBN 92-64-01603-1 – © OECD 2004 9
EXECUTIVE SUMMARY
The agriculture sector in many OECD countries continued to be characterised by high levels of support and protection.
In 2003 support to producers across the OECD area, as measured by the percentage PSE,
accounted for 32% of farm receipts, a slight increase from 2002, but down from 37% in
1986-88. The PSE in 2003 is estimated at USD 257 billion, or EUR 229 billion.
Reform has been reflected in the composition of support.
The share of the most production and trade distorting forms of support - output and input-
linked support - has declined from over 90% of producer support in 1986-88 to about 75% in
2001-03. There has also been a slight narrowing of the spread of support levels between
commodities. While this progress is notable, there is only a very modest use of policies
targeted to specific objectives and beneficiaries, and hence a need for further efforts in
these directions. Further efforts are also needed to ensure that policies are more
transparent, tailored to specific outcomes, flexible in responding to changing priorities,
and equitable. The still large share of output and input-linked support encourages
domestic production, distorts trade and contributes to depressing world prices of
agricultural commodities. Agricultural policies in OECD countries sometimes impose
unnecessary costs on domestic consumers and taxpayers, and many support policies put
pressure on the environment and penalise competitive suppliers, including those in
developing countries.
Reform of agricultural policies remains highly uneven across countries.
There are large and increasing differences in the levels of support among OECD countries,
and the extent to which further reform is necessary varies considerably. Support to
producers in 2001-03 was below 5% of farm receipts in Australia and New Zealand, 20% or
less in Canada, Mexico, Poland, Slovakia, Turkey and the United States, around 25% in the
Czech Republic and Hungary, 35% in the European Union, and 60% or more in Iceland,
Japan, Korea, Norway and Switzerland.
A number of policy changes were introduced in 2003.
It was the first year of implementation of the Agricultural Policy Framework in Canada and
full implementation of the 2002 FSRI Act in the United States. Norway introduced a new
OECD AGRICULTURAL POLICIES 2004: AT A GLANCE – ISBN 92-64-01603-1 – © OECD 200410
EXECUTIVE SUMMARY
standard per hectare payment available to all farmers for their contribution to the cultural
landscape. Emergency payments were provided in Australia (drought) and Canada (BSE).
Some efforts were made to improve the efficiency of domestic markets behind significant
border protection in Japan and Korea (rice) and Norway (dairy). The Czech Republic,
Hungary, Poland and Slovakia continued to prepare for accession to the European Unionin May 2004, including through changes to producer payments, spending on infrastructure,
and development of food safety systems. Agreement was reached in the European Unionon the reform of the Common Agricultural Policy, involving a significant further step in the
direction of decoupling support from production decisions, to be implemented in 2005-07.
A decision was also reached in Switzerland on the new agricultural reform package, to be
implemented over the period 2004-07, continuing the long-term shift away from the most
trade distorting measures.
Strong world prices for meat and oilseeds, dairy products and rice contrasted with lower
world prices for sugar, wheat and maize in 2003. Meat markets were disrupted by disease
outbreaks in several parts of the world. Significant exchange rate movements, in particular
a weaker US dollar and a stronger Euro, were important factors influencing trade flows.
While a number of countries continued to pursue needed policy reforms on a unilateral
basis, multilateral trade negotiations stalled at the Ministerial meeting in Cancún. Makingprogress at the WTO would invigorate the process of agricultural policy reform.
OECD AGRICULTURAL POLICIES 2004: AT A GLANCE – ISBN 92-64-01603-1 – © OECD 2004 11

ISBN 92-64-01603-1
OECD Agricultural Policies 2004: At a Glance
© OECD 2004
PART I
Evaluation of Support Policy Developments
This chapter details agricultural support in OECD countries, evaluating changesboth in the short-term (2003 compared with 2002) and over the longer term (the2001-03 average compared with the 1986-88 base period). After first setting thecontext with regard to policy and market developments, this chapter discusses thelevel of support provided to producers and how this varies between OECD countries.Changes in the composition of support are then considered.
OECD AGRICULTURAL POLICIES 2004: AT A GLANCE – ISBN 92-64-01603-1 – © OECD 2004 13
I. EVALUATION OF SUPPORT POLICY DEVELOPMENTS
1. Evaluation of Support Policy DevelopmentsThis chapter details agricultural support in OECD countries, evaluating changes both
in the short-term (2003 compared with 2002) and over the longer term (the 2001-03 average
compared with the 1986-88 base period). After first setting the context with regard to policy
and market developments, this chapter discusses the level of support provided to
producers and how this varies between OECD countries. Changes in the composition of
support are then considered. This is important because the effect on production, trade,
income and the environment depend on the way in which support is provided to
producers. Differences in the level of support between commodities are considered
because these also a potential source of distortion. Estimates are then provided on the level
of support to general agricultural services and the total value of transfers that result from
agricultural policies. Finally, some conclusions are drawn about the agricultural policy
reform progress being made in OECD countries in terms of reducing the level of support,
improving its composition and reducing differences in the level of support between
commodities. The following chapter contains details of developments for each OECD
country and two non-OECD countries, Russia and the Ukraine.
Box I.1. Methodology for evaluating policy developments
In 1987 Ministers stressed the need for a progressive reduction in agricultural supportand a move towards those forms of support that are less production and trade distorting inorder to let the agricultural sector respond more to market signals. Ministers alsorecognised that governments need flexibility in the choice of policy measures and in thepace of reform, taking into account the diverse situations in OECD countries, and the needto address a range of policy goals. In 1998 they agreed on a set of principles for agriculturalpolicy reform (Annex I.1) and a set of operational criteria that should apply in designingand implementing policy measures (Annex I.2).
The Producer Support Estimate (PSE) and related indicators (Annex I.3) are the principaltools used to monitor and evaluate agricultural policy developments. It is important todistinguish between transfers that are provided to producers and their impact onindividual production decisions, and those that are provided to general services thatsupport the agricultural sector as a whole.
Policy measures within the PSE are classified in terms of how policies are implemented.This composition of support allows a broad ranking of categories of PSE measures accordingto their potential impacts on production and input use, consumption, trade, income andthe environment. A full explanation of these impacts, the concepts, methodology,interpretation and guidelines for the use of the OECD support indicators in policyevaluation can be found in Methodology for the Measurement of Support and Use in PolicyEvaluation [www.oecd.org/dataoecd/36/47/1937457.pdf].
OECD AGRICULTURAL POLICIES 2004: AT A GLANCE – ISBN 92-64-01603-1 – © OECD 200414
I. EVALUATION OF SUPPORT POLICY DEVELOPMENTS
Developments in policy and markets
The breakdown of the WTO Ministerial meeting in Cancún, Mexico in September 2003
has slowed progress in the Doha Development Agenda round of trade negotiation. This
might further delay the much needed multilateral impetus to agricultural policy reform,
including reductions in tariffs, export competition measures and trade distorting forms of
domestic support. Despite this, some important policy developments occurred in 2003 at
the national level, many of which are implemented in anticipation of further multilateral
commitments.
It was the first year for implementing the Agricultural Policy Framework in Canadaand for fully implementing the 2002 FSRI Act in the United States, providing new forms of
payments to producers for the purpose of stabilising farm incomes. Norway has
introduced a new standard per hectare payment available to all farmers in recognition of
the contribution they make to the cultural landscape. The Czech Republic, Hungary,
Poland and Slovakia continued to prepare for accession to the European Union on
1 May 2004, including changes to producer support payments, spending on infrastructure
and the development of food safety systems. Payments to assist in emergency situations
were provided in Australia (drought) and Canada (BSE). Some efforts were made to improve
the efficiency of domestic markets behind significant border protection in Japan and Korea(rice), and Norway (dairy).
A number of important policy changes were announced. Agreement was reached in
the European Union on the 2003 reform of the Common Agricultural Policy. This will be
implemented from 2004 onwards, including the requirement for member countries to
introduce a new single farm payment to replace most area/headage payments.* A decision
was also reached in Switzerland on the new agricultural reform package that will be
implemented over the period 2004-07.
In 2003, policy measures were implemented in the context of stronger world market
prices for meat and oilseeds, and firmer prices for dairy products and rice. Meat Markets
were disrupted by disease outbreaks in several parts of the world, although the impacts
differed significantly. Slightly lower world prices were experienced for sugar, wheat and
maize. There was also an influence of exchange rate movements, in particular a weaker
US dollar and a stronger EURO.
The level of support to producers remains high…
One indicator of the level of support provided to agricultural producers is to express the
monetary value of transfers from consumers and budgetary payments to producers (PSE) as
a share of gross farm receipts (as measured by the % PSE) compared with 31% in 2002
(Box I.2). Support to producers in the OECD as a whole, as measured by the % PSE, is
estimated at 32% in 2003. In other words, around one-third of current OECD gross farm
receipts result from transfers associated with agricultural policies (Figure I.1;
Tables I.1 and I.2). Producer support has remained fairly constant over the last three years,
averaging 31% for the period 2001-03.
Factors driving this small increase in support at the overall OECD level in 2003 include
a rise in budgetary payments based on either overall farm income in Canada and the
United States, or area/animal numbers in many European countries, particularly those in
* A full analysis of the impact of 2003 CAP reform can be found in Analysis of the 2003 CAP Reform.
OECD AGRICULTURAL POLICIES 2004: AT A GLANCE – ISBN 92-64-01603-1 – © OECD 2004 15
I. EVALUATION OF SUPPORT POLICY DEVELOPMENTS
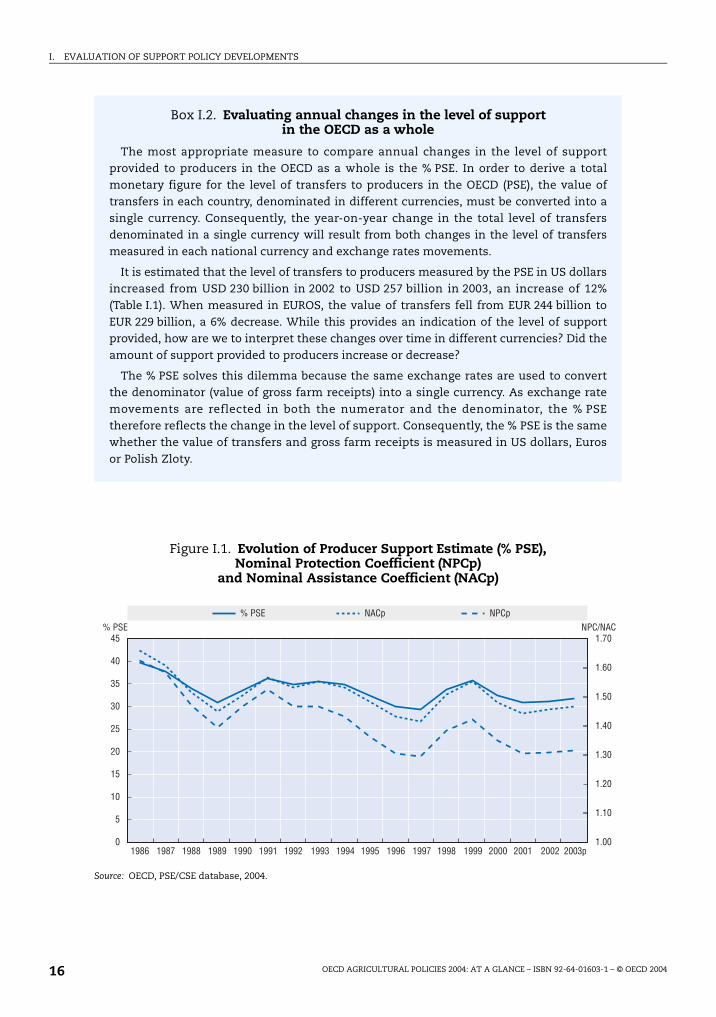
Box I.2. Evaluating annual changes in the level of support in the OECD as a whole
The most appropriate measure to compare annual changes in the level of supportprovided to producers in the OECD as a whole is the % PSE. In order to derive a totalmonetary figure for the level of transfers to producers in the OECD (PSE), the value oftransfers in each country, denominated in different currencies, must be converted into asingle currency. Consequently, the year-on-year change in the total level of transfersdenominated in a single currency will result from both changes in the level of transfersmeasured in each national currency and exchange rates movements.
It is estimated that the level of transfers to producers measured by the PSE in US dollarsincreased from USD 230 billion in 2002 to USD 257 billion in 2003, an increase of 12%(Table I.1). When measured in EUROS, the value of transfers fell from EUR 244 billion toEUR 229 billion, a 6% decrease. While this provides an indication of the level of supportprovided, how are we to interpret these changes over time in different currencies? Did theamount of support provided to producers increase or decrease?
The % PSE solves this dilemma because the same exchange rates are used to convertthe denominator (value of gross farm receipts) into a single currency. As exchange ratemovements are reflected in both the numerator and the denominator, the % PSEtherefore reflects the change in the level of support. Consequently, the % PSE is the samewhether the value of transfers and gross farm receipts is measured in US dollars, Eurosor Polish Zloty.
Figure I.1. Evolution of Producer Support Estimate (% PSE), Nominal Protection Coefficient (NPCp)
and Nominal Assistance Coefficient (NACp)
Source: OECD, PSE/CSE database, 2004.
1986
45% PSE
40
35
30
25
20
15
10
5
01987 1988 1989 1990 1991 1992 1993 1994 1995 1996 1997 1998 1999 2000 2001 2002 2003p
1.70NPC/NAC
1.60
1.50
1.40
1.30
1.20
1.10
1.00
% PSE NACp NPCp
OECD AGRICULTURAL POLICIES 2004: AT A GLANCE – ISBN 92-64-01603-1 – © OECD 200416
I. EVALUATION OF SUPPORT POLICY DEVELOPMENTS
central Europe acceding to the European Union on 1 May 2004. The implicit tax on
consumption which the OECD measures at the farm-gate level and result from market
price support (MPS) policies, as shown by the % CSE, remained stable at 24%.
The level of support can also be measured by the producer Nominal Assistance
Coefficient (NAC), which expresses the monetary value of transfers from consumers and
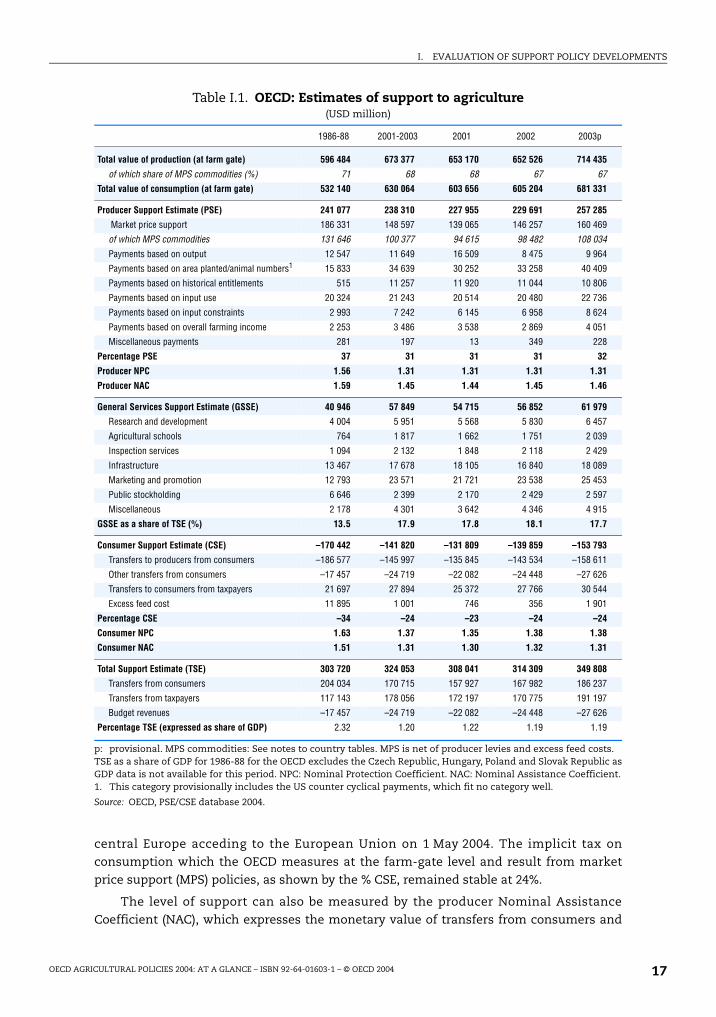
Table I.1. OECD: Estimates of support to agriculture(USD million)
p: provisional. MPS commodities: See notes to country tables. MPS is net of producer levies and excess feed costs. TSE as a share of GDP for 1986-88 for the OECD excludes the Czech Republic, Hungary, Poland and Slovak Republic asGDP data is not available for this period. NPC: Nominal Protection Coefficient. NAC: Nominal Assistance Coefficient.1. This category provisionally includes the US counter cyclical payments, which fit no category well.
Source: OECD, PSE/CSE database 2004.
1986-88 2001-2003 2001 2002 2003p
Total value of production (at farm gate) 596 484 673 377 653 170 652 526 714 435
of which share of MPS commodities (%) 71 68 68 67 67
Total value of consumption (at farm gate) 532 140 630 064 603 656 605 204 681 331
Producer Support Estimate (PSE) 241 077 238 310 227 955 229 691 257 285
Market price support 186 331 148 597 139 065 146 257 160 469
of which MPS commodities 131 646 100 377 94 615 98 482 108 034
Payments based on output 12 547 11 649 16 509 8 475 9 964
Payments based on area planted/animal numbers1 15 833 34 639 30 252 33 258 40 409
Payments based on historical entitlements 515 11 257 11 920 11 044 10 806
Payments based on input use 20 324 21 243 20 514 20 480 22 736
Payments based on input constraints 2 993 7 242 6 145 6 958 8 624
Payments based on overall farming income 2 253 3 486 3 538 2 869 4 051
Miscellaneous payments 281 197 13 349 228
Percentage PSE 37 31 31 31 32
Producer NPC 1.56 1.31 1.31 1.31 1.31
Producer NAC 1.59 1.45 1.44 1.45 1.46
General Services Support Estimate (GSSE) 40 946 57 849 54 715 56 852 61 979
Research and development 4 004 5 951 5 568 5 830 6 457
Agricultural schools 764 1 817 1 662 1 751 2 039
Inspection services 1 094 2 132 1 848 2 118 2 429
Infrastructure 13 467 17 678 18 105 16 840 18 089
Marketing and promotion 12 793 23 571 21 721 23 538 25 453
Public stockholding 6 646 2 399 2 170 2 429 2 597
Miscellaneous 2 178 4 301 3 642 4 346 4 915
GSSE as a share of TSE (%) 13.5 17.9 17.8 18.1 17.7
Consumer Support Estimate (CSE) –170 442 –141 820 –131 809 –139 859 –153 793
Transfers to producers from consumers –186 577 –145 997 –135 845 –143 534 –158 611
Other transfers from consumers –17 457 –24 719 –22 082 –24 448 –27 626
Transfers to consumers from taxpayers 21 697 27 894 25 372 27 766 30 544
Excess feed cost 11 895 1 001 746 356 1 901
Percentage CSE –34 –24 –23 –24 –24
Consumer NPC 1.63 1.37 1.35 1.38 1.38
Consumer NAC 1.51 1.31 1.30 1.32 1.31
Total Support Estimate (TSE) 303 720 324 053 308 041 314 309 349 808
Transfers from consumers 204 034 170 715 157 927 167 982 186 237
Transfers from taxpayers 117 143 178 056 172 197 170 775 191 197
Budget revenues –17 457 –24 719 –22 082 –24 448 –27 626
Percentage TSE (expressed as share of GDP) 2.32 1.20 1.22 1.19 1.19
OECD AGRICULTURAL POLICIES 2004: AT A GLANCE – ISBN 92-64-01603-1 – © OECD 2004 17
I. EVALUATION OF SUPPORT POLICY DEVELOPMENTS
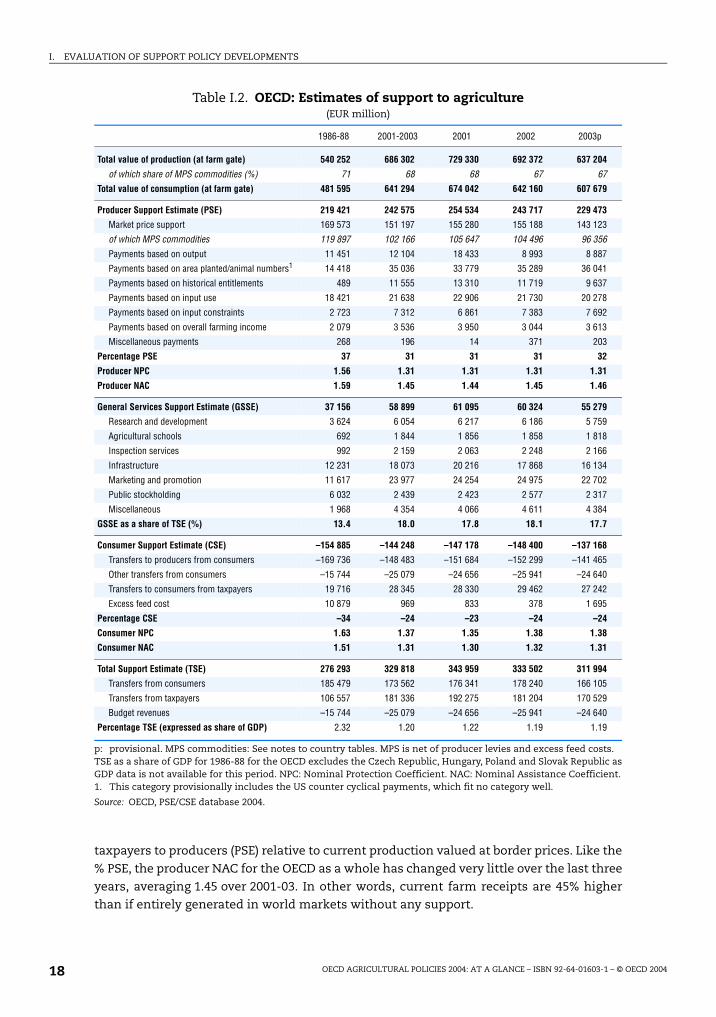
taxpayers to producers (PSE) relative to current production valued at border prices. Like the
% PSE, the producer NAC for the OECD as a whole has changed very little over the last three
years, averaging 1.45 over 2001-03. In other words, current farm receipts are 45% higher
than if entirely generated in world markets without any support.
Table I.2. OECD: Estimates of support to agriculture(EUR million)
p: provisional. MPS commodities: See notes to country tables. MPS is net of producer levies and excess feed costs. TSE as a share of GDP for 1986-88 for the OECD excludes the Czech Republic, Hungary, Poland and Slovak Republic asGDP data is not available for this period. NPC: Nominal Protection Coefficient. NAC: Nominal Assistance Coefficient.1. This category provisionally includes the US counter cyclical payments, which fit no category well.
Source: OECD, PSE/CSE database 2004.
1986-88 2001-2003 2001 2002 2003p
Total value of production (at farm gate) 540 252 686 302 729 330 692 372 637 204
of which share of MPS commodities (%) 71 68 68 67 67
Total value of consumption (at farm gate) 481 595 641 294 674 042 642 160 607 679
Producer Support Estimate (PSE) 219 421 242 575 254 534 243 717 229 473
Market price support 169 573 151 197 155 280 155 188 143 123
of which MPS commodities 119 897 102 166 105 647 104 496 96 356
Payments based on output 11 451 12 104 18 433 8 993 8 887
Payments based on area planted/animal numbers1 14 418 35 036 33 779 35 289 36 041
Payments based on historical entitlements 489 11 555 13 310 11 719 9 637
Payments based on input use 18 421 21 638 22 906 21 730 20 278
Payments based on input constraints 2 723 7 312 6 861 7 383 7 692
Payments based on overall farming income 2 079 3 536 3 950 3 044 3 613
Miscellaneous payments 268 196 14 371 203
Percentage PSE 37 31 31 31 32
Producer NPC 1.56 1.31 1.31 1.31 1.31
Producer NAC 1.59 1.45 1.44 1.45 1.46
General Services Support Estimate (GSSE) 37 156 58 899 61 095 60 324 55 279
Research and development 3 624 6 054 6 217 6 186 5 759
Agricultural schools 692 1 844 1 856 1 858 1 818
Inspection services 992 2 159 2 063 2 248 2 166
Infrastructure 12 231 18 073 20 216 17 868 16 134
Marketing and promotion 11 617 23 977 24 254 24 975 22 702
Public stockholding 6 032 2 439 2 423 2 577 2 317
Miscellaneous 1 968 4 354 4 066 4 611 4 384
GSSE as a share of TSE (%) 13.4 18.0 17.8 18.1 17.7
Consumer Support Estimate (CSE) –154 885 –144 248 –147 178 –148 400 –137 168
Transfers to producers from consumers –169 736 –148 483 –151 684 –152 299 –141 465
Other transfers from consumers –15 744 –25 079 –24 656 –25 941 –24 640
Transfers to consumers from taxpayers 19 716 28 345 28 330 29 462 27 242
Excess feed cost 10 879 969 833 378 1 695
Percentage CSE –34 –24 –23 –24 –24
Consumer NPC 1.63 1.37 1.35 1.38 1.38
Consumer NAC 1.51 1.31 1.30 1.32 1.31
Total Support Estimate (TSE) 276 293 329 818 343 959 333 502 311 994
Transfers from consumers 185 479 173 562 176 341 178 240 166 105
Transfers from taxpayers 106 557 181 336 192 275 181 204 170 529
Budget revenues –15 744 –25 079 –24 656 –25 941 –24 640
Percentage TSE (expressed as share of GDP) 2.32 1.20 1.22 1.19 1.19
OECD AGRICULTURAL POLICIES 2004: AT A GLANCE – ISBN 92-64-01603-1 – © OECD 200418
I. EVALUATION OF SUPPORT POLICY DEVELOPMENTS
… but has fallen somewhat over the longer term
Over a longer period, there has been a slight reduction in the overall level of support
provided to agricultural producers in OECD countries. As a share of gross farm receipts,
producer support has fallen from 37% in 1986-88 to the current three year average of 31%.
Expressed in terms of the producer NAC, in 1986-88 farm receipts were on average 60%
higher than they would be if entirely generated in world markets without any support.
By 2001-03 this had fallen to 45%. This indicates some improvement in market orientation,
with a greater share of farm receipts generated in markets than created by government
intervention. However, since the early 1990s, the % PSE has varied on an annual basis within
the 30-35% range, and the average for 2001-03 remains just above the lowest three year
average of 30% in 1995-97.
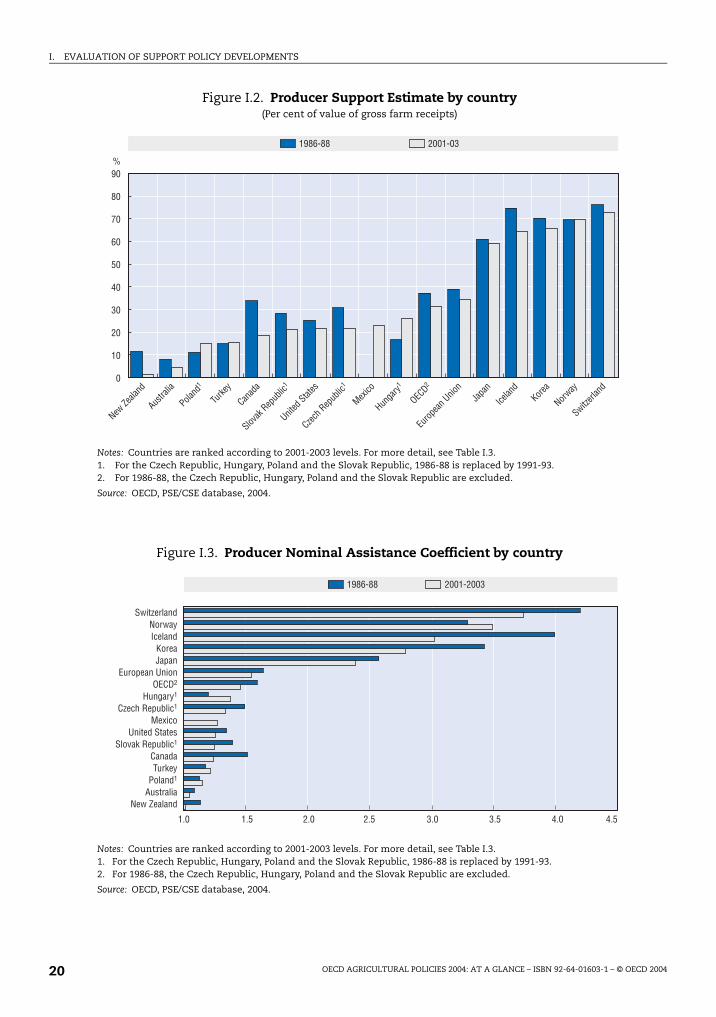
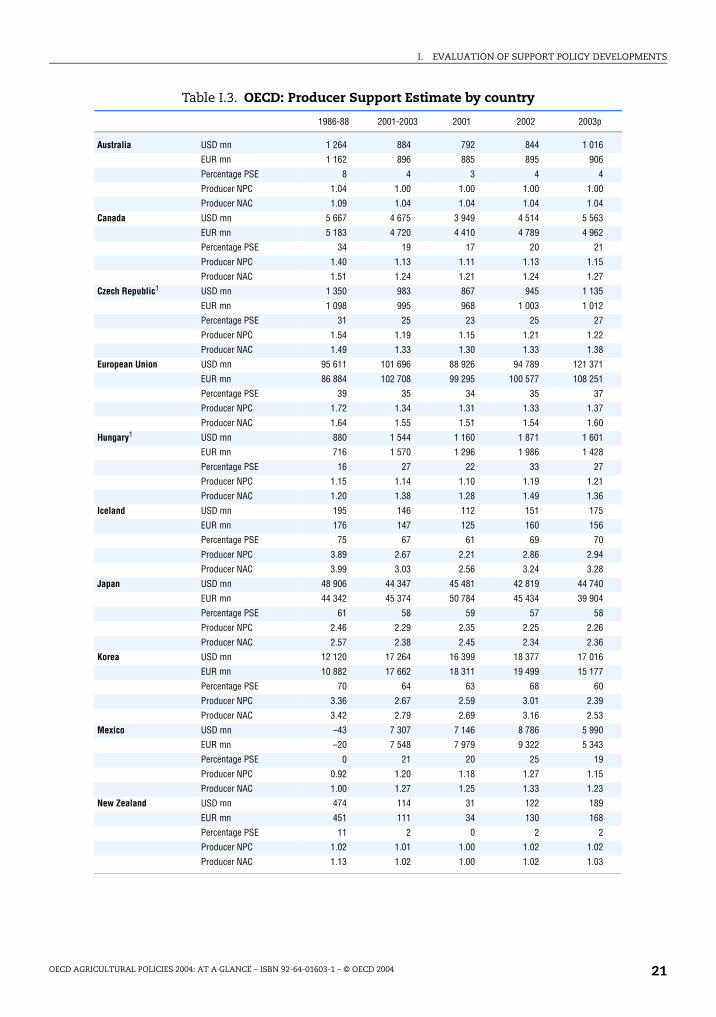
The level of support varies widely among countries
There are large and increasing differences in the levels of support among OECD
countries (Figures I.2 and I.3; Table I.3). These reflect among other things, variations in
policy objectives, different historical uses of policy instruments, and the varying pace and
degrees of progress in agricultural policy reform.
In 2003, support to producers as measured by the % PSE is estimated to have increased
in Canada, the Czech Republic, the European Union, Iceland, Japan and Turkey, although
the rise was marginal in all cases except Turkey. The % PSE decreased, some what in
Norway, Slovakia and the United States significantly, in Hungary, Korea, Mexico and
Poland, and remained constant in Australia, New Zealand and Switzerland.
For many countries variations in MPS had a significant influence on producer support
levels in 2003, in most cases decreasing, but in some cases increasing, producer support.
This was often due to either the influence of a weaker US dollar or a stronger EURO
compared to the national currency, depending on the importance of the European Unionor the United States market for the specific country. These increases/decreases cancelled
each other out at the total OECD level.
The average % PSE for 2001-03 was below 5% in Australia and New Zealand. In North
America (Canada, Mexico and the United States), Poland, Slovakia and Turkey the average
was 20% or less. It wasaround 25% in the Czech Republic and Hungary, and 35% in the
European Union which was slightly above the OECD average. In Iceland, Japan, Korea,
Norway and Switzerland the PSE averaged around 60% or more.
Over the longer term, the level of producer support has fallen in most OECD
countries. The average % PSE in 2001-03 was lower than the 1986-88 average in all
countries, except Hungary, Mexico, Poland (relative to 1991-1993) and Turkey where
support has increased but continues to be relatively low, and Norway where it has
remained unchanged. The largest decreases in percentage terms have occurred in NewZealand, Australia, Canada, the Czech Republic and Slovakia, countries with levels of
support below the OECD average.
The most distorting forms of support have declined but still dominate
While the overall level of producer support for the OECD as a whole has fallen only
slightly, there has been a greater change in the composition of support, with some
movement away from consumer transfers (MPS) to budgetary payments, and also between
the different types of budget payments provided to producers. The share of MPS and output
OECD AGRICULTURAL POLICIES 2004: AT A GLANCE – ISBN 92-64-01603-1 – © OECD 2004 19
I. EVALUATION OF SUPPORT POLICY DEVELOPMENTS
Figure I.2. Producer Support Estimate by country(Per cent of value of gross farm receipts)
Notes: Countries are ranked according to 2001-2003 levels. For more detail, see Table I.3.1. For the Czech Republic, Hungary, Poland and the Slovak Republic, 1986-88 is replaced by 1991-93.2. For 1986-88, the Czech Republic, Hungary, Poland and the Slovak Republic are excluded.
Source: OECD, PSE/CSE database, 2004.
1986-88 2001-03
%90
80
70
60
50
40
30
20
10
0
New Ze
aland
Austra
lia
Poland
1
Turke
y
Canad
a
Slovak
Repub
lic1
United
States
Czech R
epub
lic1
Mexico
Hunga
ry1
OECD2
Europ
ean U
nion
Japa
n
Icelan
dKore
a
Norway
Switzerl
and
Figure I.3. Producer Nominal Assistance Coefficient by country
Notes: Countries are ranked according to 2001-2003 levels. For more detail, see Table I.3.1. For the Czech Republic, Hungary, Poland and the Slovak Republic, 1986-88 is replaced by 1991-93.2. For 1986-88, the Czech Republic, Hungary, Poland and the Slovak Republic are excluded.
Source: OECD, PSE/CSE database, 2004.
1986-88 2001-2003
1.0 1.5 2.0 2.5 3.0 3.5 4.0 4.5
SwitzerlandNorwayIceland
KoreaJapan
European UnionOECD2
Hungary1
Czech Republic1
MexicoUnited States
Slovak Republic1
CanadaTurkey
Poland1
AustraliaNew Zealand
OECD AGRICULTURAL POLICIES 2004: AT A GLANCE – ISBN 92-64-01603-1 – © OECD 200420
I. EVALUATION OF SUPPORT POLICY DEVELOPMENTS
Table I.3. OECD: Producer Support Estimate by country
1986-88 2001-2003 2001 2002 2003p
Australia USD mn 1 264 884 792 844 1 016
EUR mn 1 162 896 885 895 906
Percentage PSE 8 4 3 4 4
Producer NPC 1.04 1.00 1.00 1.00 1.00
Producer NAC 1.09 1.04 1.04 1.04 1.04
Canada USD mn 5 667 4 675 3 949 4 514 5 563
EUR mn 5 183 4 720 4 410 4 789 4 962
Percentage PSE 34 19 17 20 21
Producer NPC 1.40 1.13 1.11 1.13 1.15
Producer NAC 1.51 1.24 1.21 1.24 1.27
Czech Republic1 USD mn 1 350 983 867 945 1 135
EUR mn 1 098 995 968 1 003 1 012
Percentage PSE 31 25 23 25 27
Producer NPC 1.54 1.19 1.15 1.21 1.22
Producer NAC 1.49 1.33 1.30 1.33 1.38
European Union USD mn 95 611 101 696 88 926 94 789 121 371
EUR mn 86 884 102 708 99 295 100 577 108 251
Percentage PSE 39 35 34 35 37
Producer NPC 1.72 1.34 1.31 1.33 1.37
Producer NAC 1.64 1.55 1.51 1.54 1.60
Hungary1 USD mn 880 1 544 1 160 1 871 1 601
EUR mn 716 1 570 1 296 1 986 1 428
Percentage PSE 16 27 22 33 27
Producer NPC 1.15 1.14 1.10 1.19 1.21
Producer NAC 1.20 1.38 1.28 1.49 1.36
Iceland USD mn 195 146 112 151 175
EUR mn 176 147 125 160 156
Percentage PSE 75 67 61 69 70
Producer NPC 3.89 2.67 2.21 2.86 2.94
Producer NAC 3.99 3.03 2.56 3.24 3.28
Japan USD mn 48 906 44 347 45 481 42 819 44 740
EUR mn 44 342 45 374 50 784 45 434 39 904
Percentage PSE 61 58 59 57 58
Producer NPC 2.46 2.29 2.35 2.25 2.26
Producer NAC 2.57 2.38 2.45 2.34 2.36
Korea USD mn 12 120 17 264 16 399 18 377 17 016
EUR mn 10 882 17 662 18 311 19 499 15 177
Percentage PSE 70 64 63 68 60
Producer NPC 3.36 2.67 2.59 3.01 2.39
Producer NAC 3.42 2.79 2.69 3.16 2.53
Mexico USD mn –43 7 307 7 146 8 786 5 990
EUR mn –20 7 548 7 979 9 322 5 343
Percentage PSE 0 21 20 25 19
Producer NPC 0.92 1.20 1.18 1.27 1.15
Producer NAC 1.00 1.27 1.25 1.33 1.23
New Zealand USD mn 474 114 31 122 189
EUR mn 451 111 34 130 168
Percentage PSE 11 2 0 2 2
Producer NPC 1.02 1.01 1.00 1.02 1.02
Producer NAC 1.13 1.02 1.00 1.02 1.03
OECD AGRICULTURAL POLICIES 2004: AT A GLANCE – ISBN 92-64-01603-1 – © OECD 2004 21
I. EVALUATION OF SUPPORT POLICY DEVELOPMENTS
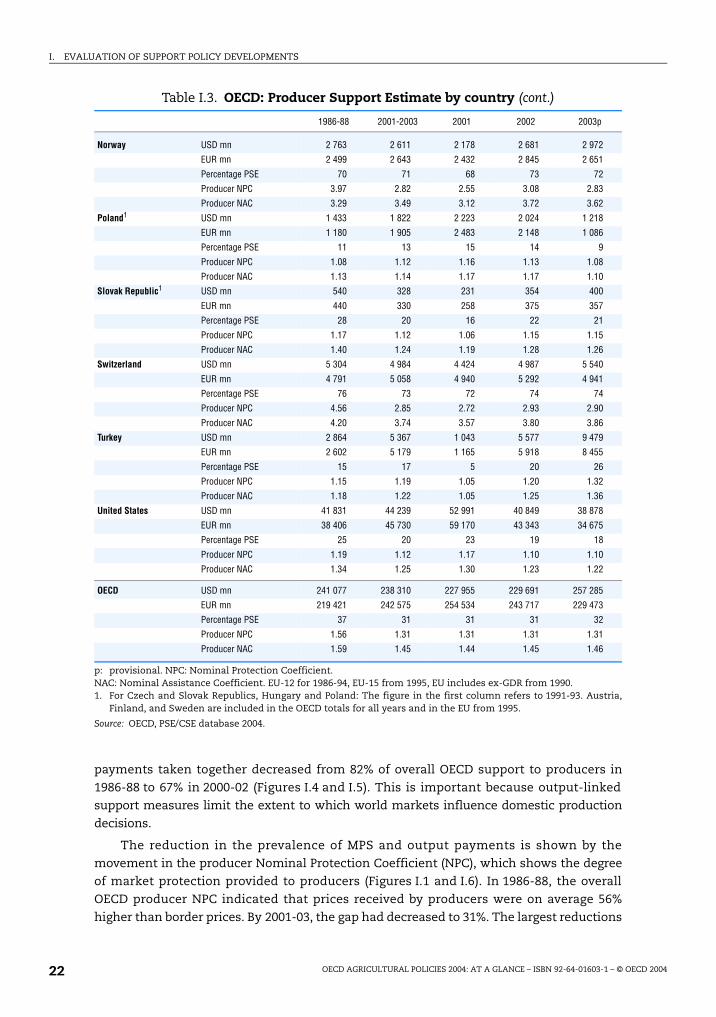
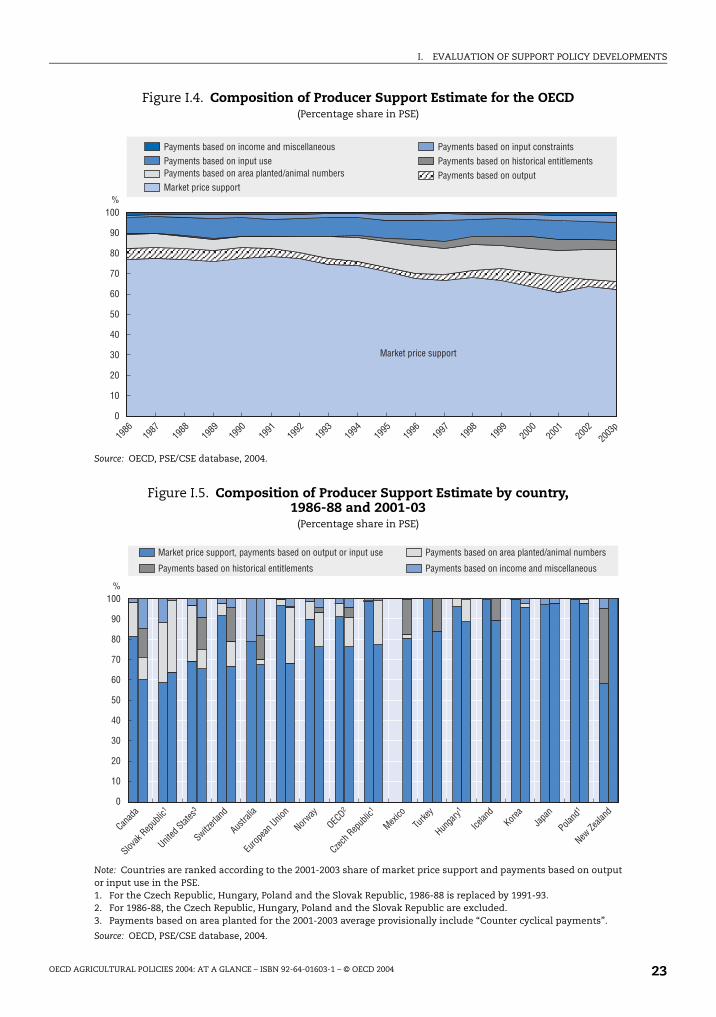
payments taken together decreased from 82% of overall OECD support to producers in
1986-88 to 67% in 2000-02 (Figures I.4 and I.5). This is important because output-linked
support measures limit the extent to which world markets influence domestic production
decisions.
The reduction in the prevalence of MPS and output payments is shown by the
movement in the producer Nominal Protection Coefficient (NPC), which shows the degree
of market protection provided to producers (Figures I.1 and I.6). In 1986-88, the overall
OECD producer NPC indicated that prices received by producers were on average 56%
higher than border prices. By 2001-03, the gap had decreased to 31%. The largest reductions
Table I.3. OECD: Producer Support Estimate by country (cont.)
p: provisional. NPC: Nominal Protection Coefficient.NAC: Nominal Assistance Coefficient. EU-12 for 1986-94, EU-15 from 1995, EU includes ex-GDR from 1990.1. For Czech and Slovak Republics, Hungary and Poland: The figure in the first column refers to 1991-93. Austria,
Finland, and Sweden are included in the OECD totals for all years and in the EU from 1995.
Source: OECD, PSE/CSE database 2004.
1986-88 2001-2003 2001 2002 2003p
Norway USD mn 2 763 2 611 2 178 2 681 2 972
EUR mn 2 499 2 643 2 432 2 845 2 651
Percentage PSE 70 71 68 73 72
Producer NPC 3.97 2.82 2.55 3.08 2.83
Producer NAC 3.29 3.49 3.12 3.72 3.62
Poland1 USD mn 1 433 1 822 2 223 2 024 1 218
EUR mn 1 180 1 905 2 483 2 148 1 086
Percentage PSE 11 13 15 14 9
Producer NPC 1.08 1.12 1.16 1.13 1.08
Producer NAC 1.13 1.14 1.17 1.17 1.10
Slovak Republic1 USD mn 540 328 231 354 400
EUR mn 440 330 258 375 357
Percentage PSE 28 20 16 22 21
Producer NPC 1.17 1.12 1.06 1.15 1.15
Producer NAC 1.40 1.24 1.19 1.28 1.26
Switzerland USD mn 5 304 4 984 4 424 4 987 5 540
EUR mn 4 791 5 058 4 940 5 292 4 941
Percentage PSE 76 73 72 74 74
Producer NPC 4.56 2.85 2.72 2.93 2.90
Producer NAC 4.20 3.74 3.57 3.80 3.86
Turkey USD mn 2 864 5 367 1 043 5 577 9 479
EUR mn 2 602 5 179 1 165 5 918 8 455
Percentage PSE 15 17 5 20 26
Producer NPC 1.15 1.19 1.05 1.20 1.32
Producer NAC 1.18 1.22 1.05 1.25 1.36
United States USD mn 41 831 44 239 52 991 40 849 38 878
EUR mn 38 406 45 730 59 170 43 343 34 675
Percentage PSE 25 20 23 19 18
Producer NPC 1.19 1.12 1.17 1.10 1.10
Producer NAC 1.34 1.25 1.30 1.23 1.22
OECD USD mn 241 077 238 310 227 955 229 691 257 285
EUR mn 219 421 242 575 254 534 243 717 229 473
Percentage PSE 37 31 31 31 32
Producer NPC 1.56 1.31 1.31 1.31 1.31
Producer NAC 1.59 1.45 1.44 1.45 1.46
OECD AGRICULTURAL POLICIES 2004: AT A GLANCE – ISBN 92-64-01603-1 – © OECD 200422
I. EVALUATION OF SUPPORT POLICY DEVELOPMENTS
Figure I.4. Composition of Producer Support Estimate for the OECD(Percentage share in PSE)
Source: OECD, PSE/CSE database, 2004.
1986
100%
90
80
70
60
50
40
30
20
10
0
1987
1988
1989
1990
1991
1992
1993
1994
1995
1996
1997
1998
1999
2000
2001
2002
2003
p
Market price support
Payments based on income and miscellaneous Payments based on input constraintsPayments based on input use Payments based on historical entitlementsPayments based on area planted/animal numbers Payments based on outputMarket price support
Figure I.5. Composition of Producer Support Estimate by country, 1986-88 and 2001-03
(Percentage share in PSE)
Note: Countries are ranked according to the 2001-2003 share of market price support and payments based on outputor input use in the PSE.1. For the Czech Republic, Hungary, Poland and the Slovak Republic, 1986-88 is replaced by 1991-93.2. For 1986-88, the Czech Republic, Hungary, Poland and the Slovak Republic are excluded.3. Payments based on area planted for the 2001-2003 average provisionally include “Counter cyclical payments”.
Source: OECD, PSE/CSE database, 2004.
Payments based on historical entitlements
%100
90
80
70
60
50
40
20
10
0
30
Market price support, payments based on output or input use
Payments based on income and miscellaneous
Payments based on area planted/animal numbers
Korea
Austra
lia
Poland
1
Turke
y
Canad
a
Slovak
Repub
lic1
United
States
3
Czech R
epub
lic1
Mexico
Hunga
ry1
OECD2
Europ
ean U
nion
Japa
n
Icelan
d
New Ze
aland
Norway
Switzerl
and
OECD AGRICULTURAL POLICIES 2004: AT A GLANCE – ISBN 92-64-01603-1 – © OECD 2004 23
I. EVALUATION OF SUPPORT POLICY DEVELOPMENTS
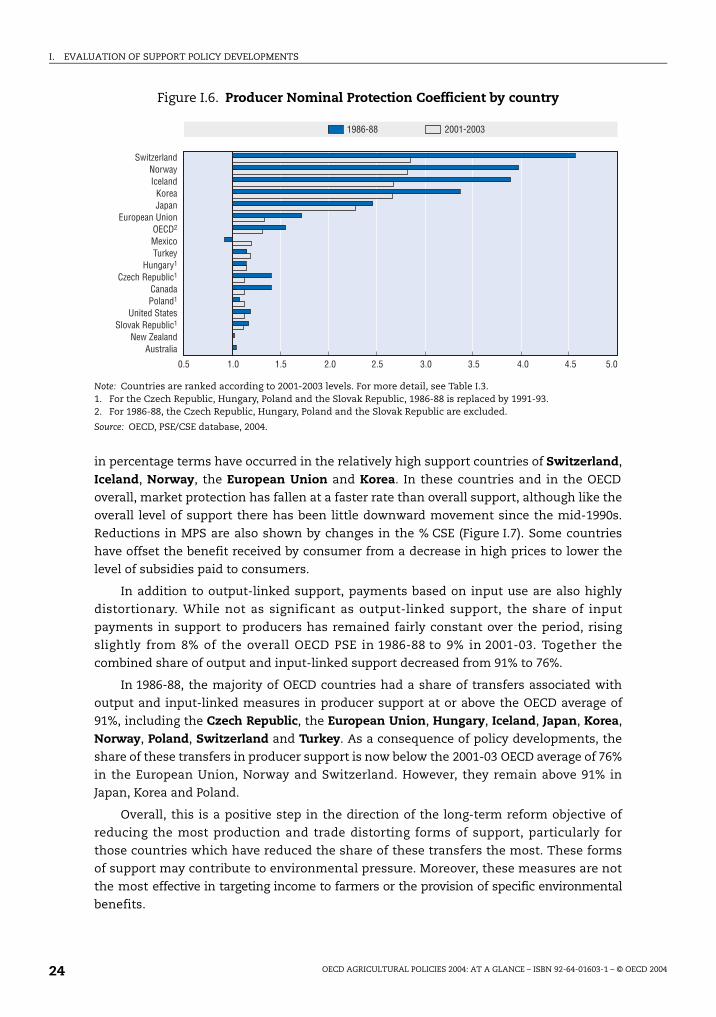
in percentage terms have occurred in the relatively high support countries of Switzerland,
Iceland, Norway, the European Union and Korea. In these countries and in the OECD
overall, market protection has fallen at a faster rate than overall support, although like the
overall level of support there has been little downward movement since the mid-1990s.
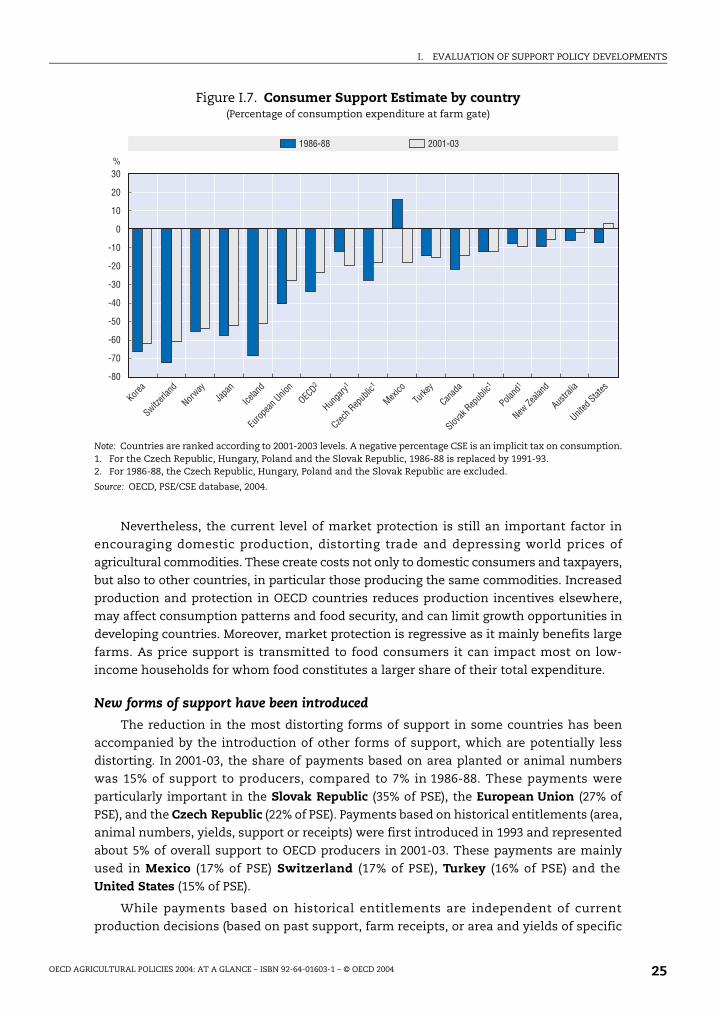
Reductions in MPS are also shown by changes in the % CSE (Figure I.7). Some countries
have offset the benefit received by consumer from a decrease in high prices to lower the
level of subsidies paid to consumers.
In addition to output-linked support, payments based on input use are also highly
distortionary. While not as significant as output-linked support, the share of input
payments in support to producers has remained fairly constant over the period, rising
slightly from 8% of the overall OECD PSE in 1986-88 to 9% in 2001-03. Together the
combined share of output and input-linked support decreased from 91% to 76%.
In 1986-88, the majority of OECD countries had a share of transfers associated with
output and input-linked measures in producer support at or above the OECD average of
91%, including the Czech Republic, the European Union, Hungary, Iceland, Japan, Korea,
Norway, Poland, Switzerland and Turkey. As a consequence of policy developments, the
share of these transfers in producer support is now below the 2001-03 OECD average of 76%
in the European Union, Norway and Switzerland. However, they remain above 91% in
Japan, Korea and Poland.
Overall, this is a positive step in the direction of the long-term reform objective of
reducing the most production and trade distorting forms of support, particularly for
those countries which have reduced the share of these transfers the most. These forms
of support may contribute to environmental pressure. Moreover, these measures are not
the most effective in targeting income to farmers or the provision of specific environmental
benefits.
Figure I.6. Producer Nominal Protection Coefficient by country
Note: Countries are ranked according to 2001-2003 levels. For more detail, see Table I.3.1. For the Czech Republic, Hungary, Poland and the Slovak Republic, 1986-88 is replaced by 1991-93.2. For 1986-88, the Czech Republic, Hungary, Poland and the Slovak Republic are excluded.
Source: OECD, PSE/CSE database, 2004.
1986-88 2001-2003
0.5 1.0 1.5 2.0 2.5 3.5 4.0 5.03.0 4.5
SwitzerlandNorwayIceland
KoreaJapan
European UnionOECD2
MexicoTurkey
Hungary1
Czech Republic1
CanadaPoland1
United StatesSlovak Republic1
New ZealandAustralia
OECD AGRICULTURAL POLICIES 2004: AT A GLANCE – ISBN 92-64-01603-1 – © OECD 200424
I. EVALUATION OF SUPPORT POLICY DEVELOPMENTS
Nevertheless, the current level of market protection is still an important factor in
encouraging domestic production, distorting trade and depressing world prices of
agricultural commodities. These create costs not only to domestic consumers and taxpayers,
but also to other countries, in particular those producing the same commodities. Increased
production and protection in OECD countries reduces production incentives elsewhere,
may affect consumption patterns and food security, and can limit growth opportunities in
developing countries. Moreover, market protection is regressive as it mainly benefits large
farms. As price support is transmitted to food consumers it can impact most on low-
income households for whom food constitutes a larger share of their total expenditure.
New forms of support have been introduced
The reduction in the most distorting forms of support in some countries has been
accompanied by the introduction of other forms of support, which are potentially less
distorting. In 2001-03, the share of payments based on area planted or animal numbers
was 15% of support to producers, compared to 7% in 1986-88. These payments were
particularly important in the Slovak Republic (35% of PSE), the European Union (27% of
PSE), and the Czech Republic (22% of PSE). Payments based on historical entitlements (area,
animal numbers, yields, support or receipts) were first introduced in 1993 and represented
about 5% of overall support to OECD producers in 2001-03. These payments are mainly
used in Mexico (17% of PSE) Switzerland (17% of PSE), Turkey (16% of PSE) and the
United States (15% of PSE).
While payments based on historical entitlements are independent of current
production decisions (based on past support, farm receipts, or area and yields of specific
Figure I.7. Consumer Support Estimate by country(Percentage of consumption expenditure at farm gate)
Note: Countries are ranked according to 2001-2003 levels. A negative percentage CSE is an implicit tax on consumption.1. For the Czech Republic, Hungary, Poland and the Slovak Republic, 1986-88 is replaced by 1991-93.2. For 1986-88, the Czech Republic, Hungary, Poland and the Slovak Republic are excluded.
Source: OECD, PSE/CSE database, 2004.
1986-88 2001-03
%30
20
10
0
-10
-20
-30
-60
-70
-80
-40
-50
Korea
Austra
lia
Poland
1
Turke
y
Canad
a
Slovak
Repub
lic1
United
States
Czech R
epub
lic1
Mexico
Hunga
ry1
OECD2
Europ
ean U
nion
Japa
n
Icelan
d
New Ze
aland
Norway
Switzerl
and
OECD AGRICULTURAL POLICIES 2004: AT A GLANCE – ISBN 92-64-01603-1 – © OECD 2004 25
I. EVALUATION OF SUPPORT POLICY DEVELOPMENTS
commodities), area/headage payments are determined by current planting or animal
numbers. Links to current production parameters makes payments based on area/animal
numbers more production distorting than payments based on historical entitlements.
Both forms of payments may affect current production decisions in so far as they may
lower production risks by reducing the variability of revenues and alter land values,
although they are considerably less distorting than output and input-based support. For
these reasons, attention may need to be paid to any production effects that such
payments may have, in particular where such payments are large, such as in the
European Union and the United States, for example.
Although these payments can be targeted to specific income or environmental
situations, they are most often sector-wide. They partly benefit landowners, who are not
always farmers, and large farms more than small ones. They may also encourage the use
of environmentally fragile land, although payments are sometimes conditional upon
farmers undertaking some type of environmental compliance.
Some countries are increasingly using payments based on input constraintsfor
sharing the costs of reducing, replacing or withdrawing resources from production, or
changing production techniques, including for environmental purposes. While these have
more than doubled since 1986-88, they represent only 3% of the overall OECD PSE. In 2001-03,
the share of these payments in the PSE was 4% in both the European Union and the
United States, 2% in Japan,Norway and Switzerland, 1% in the Czech Republic, and
effectively zero in all other countries.
Payments based on input constraints are among the categories of support having a
smaller impact on the production and trade of specific commodities. However, as these
payments are based on land rental costs and/or costs of adopting and maintaining good
farming practices, which increase with production-linked payments, their level and hence
the costs of providing environmental services or reducing environmental damage are
higher than they would be in the absence of production-linked support. Policies requiring
producers to account for pollution also provide an important contribution to improving the
environmental performance of agriculture.
Some countries also use payments based on overall farming income or revenue, which
are the most effective measures in transferring income to producers and tend to be less
production and trade distorting. In 2001-03 these payments represented around 18% of the PSE
in Australia, 13% in Canada, 5% in the United States and 3% in Norway. While significant in a
few countries, the importance of these payments has remained consistently low at around
1% of the overall support to OECD producers.
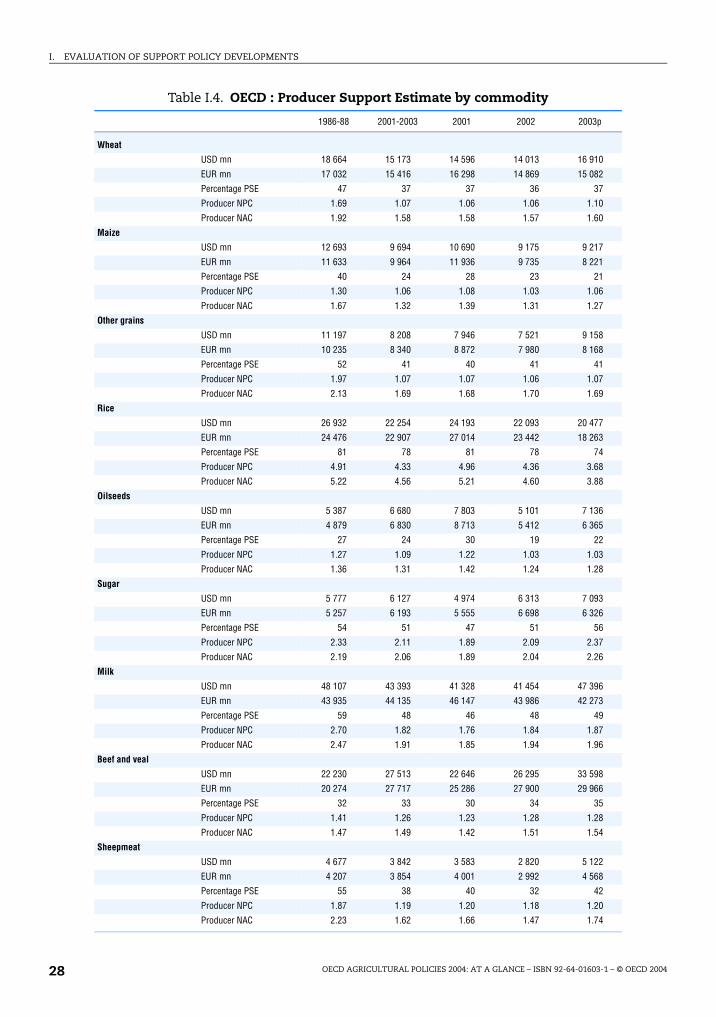
Differences in support levels across commodity also cause distortions
There is also wide difference in the level of support and protection between
commodities (Figures I.8 and I.9; Table I.4). For 2001-2003, the average OECD commodity
% PSE was below the all commodity average of 31% for wool and eggs (under 10%), pigmeat
and poultry (around 20%), and maize and oilseeds (about 25%). It was slightly above the
OECD average for beef (33%), wheat and sheepmeat (just under 40%), and significantly
above for milk and sugar (around 50%) and rice (close to 80%).
Average commodity support levels have decreased compared with 1986-88 for all
commodities except pigmeat and beef and veal which have increased slightly. The largest
decreases, both in absolute and relative terms, have occurred in the non-rice grain sector
OECD AGRICULTURAL POLICIES 2004: AT A GLANCE – ISBN 92-64-01603-1 – © OECD 200426
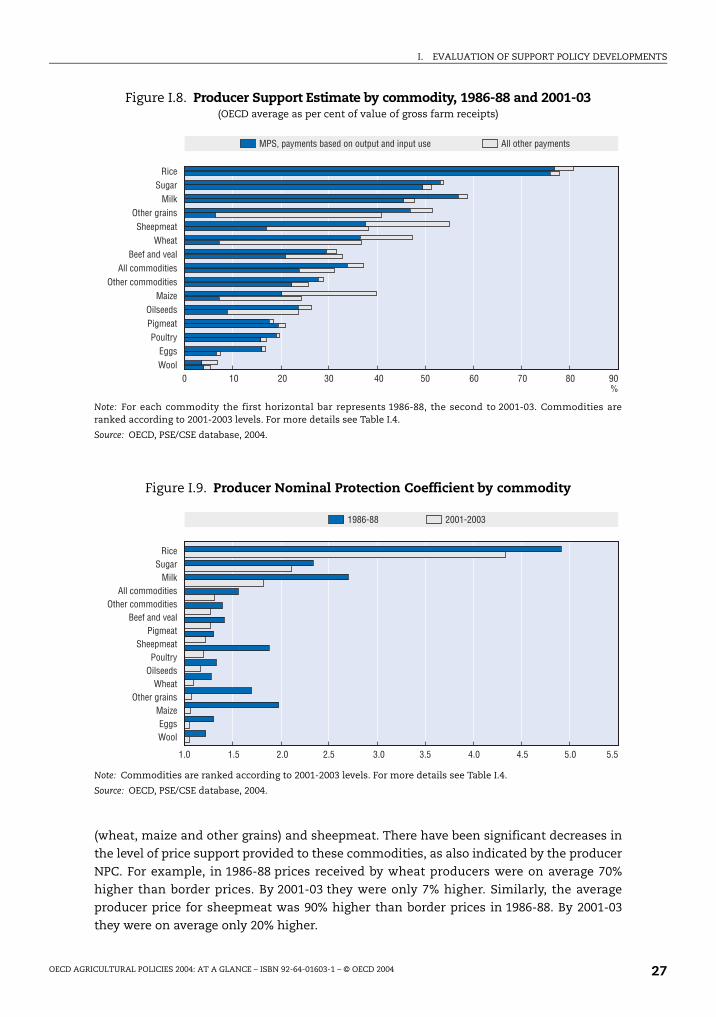
I. EVALUATION OF SUPPORT POLICY DEVELOPMENTS
(wheat, maize and other grains) and sheepmeat. There have been significant decreases in
the level of price support provided to these commodities, as also indicated by the producer
NPC. For example, in 1986-88 prices received by wheat producers were on average 70%
higher than border prices. By 2001-03 they were only 7% higher. Similarly, the average
producer price for sheepmeat was 90% higher than border prices in 1986-88. By 2001-03
they were on average only 20% higher.
Figure I.8. Producer Support Estimate by commodity, 1986-88 and 2001-03(OECD average as per cent of value of gross farm receipts)
Note: For each commodity the first horizontal bar represents 1986-88, the second to 2001-03. Commodities areranked according to 2001-2003 levels. For more details see Table I.4.
Source: OECD, PSE/CSE database, 2004.
MPS, payments based on output and input use All other payments
0 10 20 30 50 9040 60 8070%
RiceSugar
MilkOther grainsSheepmeat
WheatBeef and veal
All commoditiesOther commodities
MaizeOilseedsPigmeatPoultry
EggsWool
Figure I.9. Producer Nominal Protection Coefficient by commodity
Note: Commodities are ranked according to 2001-2003 levels. For more details see Table I.4.
Source: OECD, PSE/CSE database, 2004.
1986-88 2001-2003
1.0 1.5 2.0 2.5 3.5 5.53.0 4.0 5.04.5
RiceSugar
MilkAll commodities
Other commoditiesBeef and veal
PigmeatSheepmeat
PoultryOilseeds
WheatOther grains
MaizeEggsWool
OECD AGRICULTURAL POLICIES 2004: AT A GLANCE – ISBN 92-64-01603-1 – © OECD 2004 27
I. EVALUATION OF SUPPORT POLICY DEVELOPMENTS
Table I.4. OECD : Producer Support Estimate by commodity
1986-88 2001-2003 2001 2002 2003p
Wheat
USD mn 18 664 15 173 14 596 14 013 16 910
EUR mn 17 032 15 416 16 298 14 869 15 082
Percentage PSE 47 37 37 36 37
Producer NPC 1.69 1.07 1.06 1.06 1.10
Producer NAC 1.92 1.58 1.58 1.57 1.60
Maize
USD mn 12 693 9 694 10 690 9 175 9 217
EUR mn 11 633 9 964 11 936 9 735 8 221
Percentage PSE 40 24 28 23 21
Producer NPC 1.30 1.06 1.08 1.03 1.06
Producer NAC 1.67 1.32 1.39 1.31 1.27
Other grains
USD mn 11 197 8 208 7 946 7 521 9 158
EUR mn 10 235 8 340 8 872 7 980 8 168
Percentage PSE 52 41 40 41 41
Producer NPC 1.97 1.07 1.07 1.06 1.07
Producer NAC 2.13 1.69 1.68 1.70 1.69
Rice
USD mn 26 932 22 254 24 193 22 093 20 477
EUR mn 24 476 22 907 27 014 23 442 18 263
Percentage PSE 81 78 81 78 74
Producer NPC 4.91 4.33 4.96 4.36 3.68
Producer NAC 5.22 4.56 5.21 4.60 3.88
Oilseeds
USD mn 5 387 6 680 7 803 5 101 7 136
EUR mn 4 879 6 830 8 713 5 412 6 365
Percentage PSE 27 24 30 19 22
Producer NPC 1.27 1.09 1.22 1.03 1.03
Producer NAC 1.36 1.31 1.42 1.24 1.28
Sugar
USD mn 5 777 6 127 4 974 6 313 7 093
EUR mn 5 257 6 193 5 555 6 698 6 326
Percentage PSE 54 51 47 51 56
Producer NPC 2.33 2.11 1.89 2.09 2.37
Producer NAC 2.19 2.06 1.89 2.04 2.26
Milk
USD mn 48 107 43 393 41 328 41 454 47 396
EUR mn 43 935 44 135 46 147 43 986 42 273
Percentage PSE 59 48 46 48 49
Producer NPC 2.70 1.82 1.76 1.84 1.87
Producer NAC 2.47 1.91 1.85 1.94 1.96
Beef and veal
USD mn 22 230 27 513 22 646 26 295 33 598
EUR mn 20 274 27 717 25 286 27 900 29 966
Percentage PSE 32 33 30 34 35
Producer NPC 1.41 1.26 1.23 1.28 1.28
Producer NAC 1.47 1.49 1.42 1.51 1.54
Sheepmeat
USD mn 4 677 3 842 3 583 2 820 5 122
EUR mn 4 207 3 854 4 001 2 992 4 568
Percentage PSE 55 38 40 32 42
Producer NPC 1.87 1.19 1.20 1.18 1.20
Producer NAC 2.23 1.62 1.66 1.47 1.74
OECD AGRICULTURAL POLICIES 2004: AT A GLANCE – ISBN 92-64-01603-1 – © OECD 200428
I. EVALUATION OF SUPPORT POLICY DEVELOPMENTS
Sugar and milk benefit from relatively high levels of support in most OECD countries,
with the notable exceptions of Australia and New Zealand. Rice is produced in only a few
OECD countries but benefits from high support in Japan, Korea and the United States. As
support for these three commodities is mainly provided through price support, the
associated levels of market protection are also the highest. Prices received by producers
and those paid by consumers were, on average in 2001-03, around twice the level of world
market prices for sugar and milk and about four times higher than the world prices for rice.
Farm receipts from sugar and milk were also twice what they would be without support,
while those of rice were four and a half times higher.
Table I.4. OECD : Producer Support Estimate by commodity (cont.)
p: provisional. NPC: Nominal Protection Coefficient. NAC: Nominal Assistance Coefficient. The PSE for “other commodities” is the residual of the PSE for all commodities minus the PSE for the commoditieslisted above. Austria, Finland and Sweden are included in the total for “all commodities” for all years, and in thecommodity detail from 1995 (since joining the EU).
Source: OECD, PSE/CSE database 2004.
1986-88 2001-2003 2001 2002 2003p
Wool
USD mn 287 113 85 126 128
EUR mn 261 114 95 134 114
Percentage PSE 7 5 5 5 6
Producer NPC 1.01 1.01 1.01 1.01 1.01
Producer NAC 1.07 1.06 1.05 1.06 1.06
Pigmeat
USD mn 8 762 10 624 10 212 10 626 11 032
EUR mn 7 937 10 839 11 403 11 275 9 840
Percentage PSE 18 21 19 23 21
Producer NPC 1.30 1.22 1.19 1.25 1.23
Producer NAC 1.23 1.27 1.24 1.30 1.27
Poultry
USD mn 4 893 6 514 6 013 6 897 6 632
EUR mn 4 389 6 649 6 714 7 318 5 915
Percentage PSE 20 17 15 19 17
Producer NPC 1.33 1.17 1.14 1.19 1.18
Producer NAC 1.25 1.21 1.18 1.24 1.20
Eggs
USD mn 2 638 1 377 1 563 1 437 1 132
EUR mn 2 399 1 426 1 745 1 524 1 009
Percentage PSE 17 8 9 8 5
Producer NPC 1.22 1.06 1.07 1.06 1.04
Producer NAC 1.20 1.08 1.10 1.09 1.06
Other commodities
USD mn 68 833 76 800 72 323 75 820 82 256
EUR mn 62 508 78 190 80 756 80 450 73 364
Percentage PSE 29 26 25 25 27
Producer NPC 1.39 1.27 1.26 1.26 1.28
Producer NAC 1.41 1.35 1.33 1.34 1.36
All commodities
USD mn 241 077 238 310 227 955 229 691 257 285
EUR mn 219 421 242 575 254 534 243 717 229 473
Percentage PSE 37 31 31 31 32
Producer NPC 1.56 1.31 1.31 1.31 1.31
Producer NAC 1.59 1.45 1.44 1.45 1.46
OECD AGRICULTURAL POLICIES 2004: AT A GLANCE – ISBN 92-64-01603-1 – © OECD 2004 29
I. EVALUATION OF SUPPORT POLICY DEVELOPMENTS
Differences in the level of support and protection across commodities within the
agricultural sector of a country can contribute significantly to distortions in resource
allocation. The spread in commodity support levels in 1986-88 was highest in Japan and
Korea, and lowest in Australia (Figure I.10). Norway and Switzerland, which are two high
support countries, have a relatively even distribution in support levels between
commodities. New Zealand had a low level of support but a relatively large variation
between commodities support levels in 1986-88. By 2001-03 the spread in commodity
support levels had fallen in all countries except the European Union, Japan, Korea,Hungary and Iceland where it increased, although the rate of increase or decrease varies.
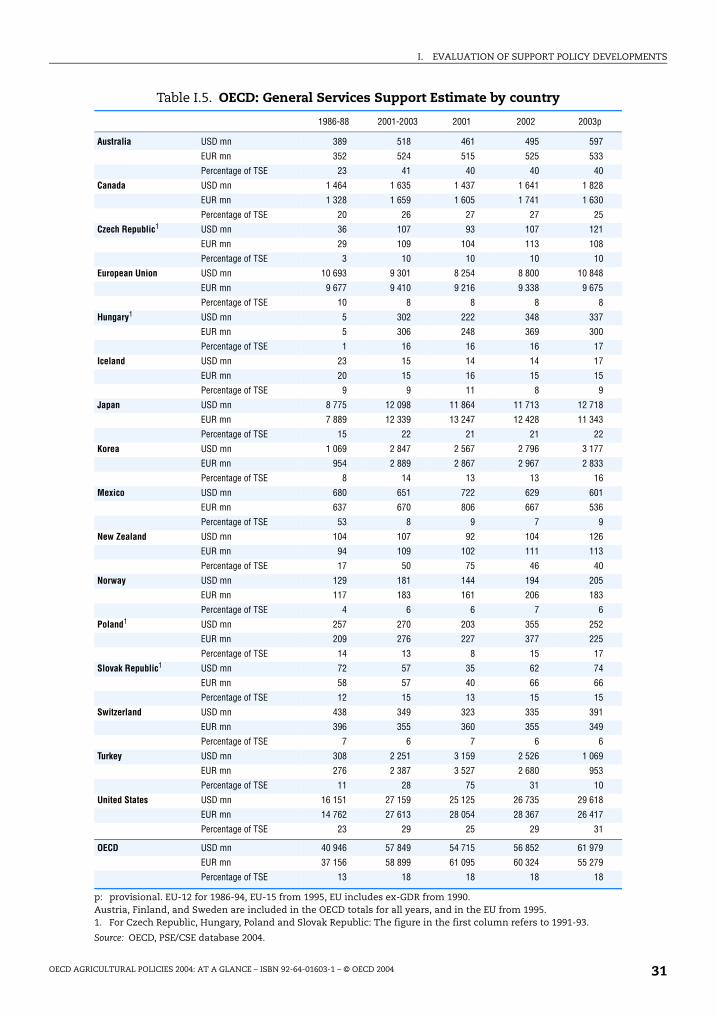
Support for general services to agriculture is increasing but remains low relative to support to producers
While transfers to producers have been falling, there has been an increase in
budgetary transfers for general services to the agricultural sector, i.e. transfers not received
by producers individually. As measured by the % GSSE [General Services Support Estimate],
general service transfers at the overall OECD level have increased from 13% of the total
support estimate (TSE) in 1986-88 to 18% in 2001-03.
The average % GSSE in 2001-03 was above 40% in Australia and New Zealand,
between 20 and 30% in Canada, Japan, Turkey, and the United States, and less than 15% in
all other countries (Table I.5). For all countries, with the exception of the European Unionand Switzerland, this was higher than in 1986-88, both in monetary terms and as a share
of the total support estimate.
There have been some notable changes in the composition of support within the GSSE.
Marketing and promotion support has increased the most since the mid-1980s, rising from
31% in 1986-88 to 41% of the overall GSSE in 2001-03. It has always been the most important
Figure I.10. Spread in commodity support by country(Per cent of value of gross farm receipts)
Note: Spread in commodity support is measured by the coefficient of variation of commodity producer NACs,weighted by value of production, shown in terms of per cent of gross farm receipts.1. For the Czech Republic, Hungary, Mexico, Poland and the Slovak Republic, 1986-88 refers to 1991-93.2. For 1986-88, the Czech and Slovak Republics, Hungary and Poland are excluded.
Source: OECD, PSE/CSE database, 2004.
1986-88 2001-2003
0 20 40 60 80 120 140100%
JapanKorea
IcelandEuropean Union
OECD2
Hungary1
TurkeyNorwayCanada
USASwitzerland
MexicoCzech Republic1
Slovak Republic1
Poland1
New ZealandAustralia
OECD AGRICULTURAL POLICIES 2004: AT A GLANCE – ISBN 92-64-01603-1 – © OECD 200430
I. EVALUATION OF SUPPORT POLICY DEVELOPMENTS
Table I.5. OECD: General Services Support Estimate by country
p: provisional. EU-12 for 1986-94, EU-15 from 1995, EU includes ex-GDR from 1990. Austria, Finland, and Sweden are included in the OECD totals for all years, and in the EU from 1995.1. For Czech Republic, Hungary, Poland and Slovak Republic: The figure in the first column refers to 1991-93.
Source: OECD, PSE/CSE database 2004.
1986-88 2001-2003 2001 2002 2003p
Australia USD mn 389 518 461 495 597
EUR mn 352 524 515 525 533
Percentage of TSE 23 41 40 40 40
Canada USD mn 1 464 1 635 1 437 1 641 1 828
EUR mn 1 328 1 659 1 605 1 741 1 630
Percentage of TSE 20 26 27 27 25
Czech Republic1 USD mn 36 107 93 107 121
EUR mn 29 109 104 113 108
Percentage of TSE 3 10 10 10 10
European Union USD mn 10 693 9 301 8 254 8 800 10 848
EUR mn 9 677 9 410 9 216 9 338 9 675
Percentage of TSE 10 8 8 8 8
Hungary1 USD mn 5 302 222 348 337
EUR mn 5 306 248 369 300
Percentage of TSE 1 16 16 16 17
Iceland USD mn 23 15 14 14 17
EUR mn 20 15 16 15 15
Percentage of TSE 9 9 11 8 9
Japan USD mn 8 775 12 098 11 864 11 713 12 718
EUR mn 7 889 12 339 13 247 12 428 11 343
Percentage of TSE 15 22 21 21 22
Korea USD mn 1 069 2 847 2 567 2 796 3 177
EUR mn 954 2 889 2 867 2 967 2 833
Percentage of TSE 8 14 13 13 16
Mexico USD mn 680 651 722 629 601
EUR mn 637 670 806 667 536
Percentage of TSE 53 8 9 7 9
New Zealand USD mn 104 107 92 104 126
EUR mn 94 109 102 111 113
Percentage of TSE 17 50 75 46 40
Norway USD mn 129 181 144 194 205
EUR mn 117 183 161 206 183
Percentage of TSE 4 6 6 7 6
Poland1 USD mn 257 270 203 355 252
EUR mn 209 276 227 377 225
Percentage of TSE 14 13 8 15 17
Slovak Republic1 USD mn 72 57 35 62 74
EUR mn 58 57 40 66 66
Percentage of TSE 12 15 13 15 15
Switzerland USD mn 438 349 323 335 391
EUR mn 396 355 360 355 349
Percentage of TSE 7 6 7 6 6
Turkey USD mn 308 2 251 3 159 2 526 1 069
EUR mn 276 2 387 3 527 2 680 953
Percentage of TSE 11 28 75 31 10
United States USD mn 16 151 27 159 25 125 26 735 29 618
EUR mn 14 762 27 613 28 054 28 367 26 417
Percentage of TSE 23 29 25 29 31
OECD USD mn 40 946 57 849 54 715 56 852 61 979
EUR mn 37 156 58 899 61 095 60 324 55 279
Percentage of TSE 13 18 18 18 18
OECD AGRICULTURAL POLICIES 2004: AT A GLANCE – ISBN 92-64-01603-1 – © OECD 2004 31
I. EVALUATION OF SUPPORT POLICY DEVELOPMENTS
form of GSSE support in Turkey and the United States, and now also in the European Union.
The costs associated with public stockholding of agricultural products is now a quarter of
its 1986-88 level at 4% of the overall GSSE in 2001-03, reflecting lower public stocks as a result
of a combination of policy and market developments. The fall in this budgetary cost explains
the overall reduction in European Union expenditure on general services.
About one-third of overall GSSE support is for infrastructure. It is particularly
important in Japan and Korea, and has been increasing in the central European countries
of the Czech Republic, Hungary, Poland, and the Slovak Republic. Support for research and
development, and for education remained stable at 13% of the overall GSSE, but is around
50% or more of the GSSE in Australia, New Zealand and Norway. While the share of
inspection services in the overall GSSE remained constant at just 3%, its share rose in a
significant number of countries, reflecting a greater public policy focus on food safety and
the efforts of central European countries to comply with European Union regulations.
Support for general services to agriculture does not depend on individual farmers’
production decisions regarding output or use of factors of production, and does not directly
affect farm receipts. Efforts to ensure plant, animal and human health benefit both
consumers and producers alike. Therefore, while general services in the areas of advisory
services, training, research and development, and inspection services can improve long-
term productivity or expand the sector’s production capacity, the distorting effects on
production and trade are generally much lower than other forms of support.
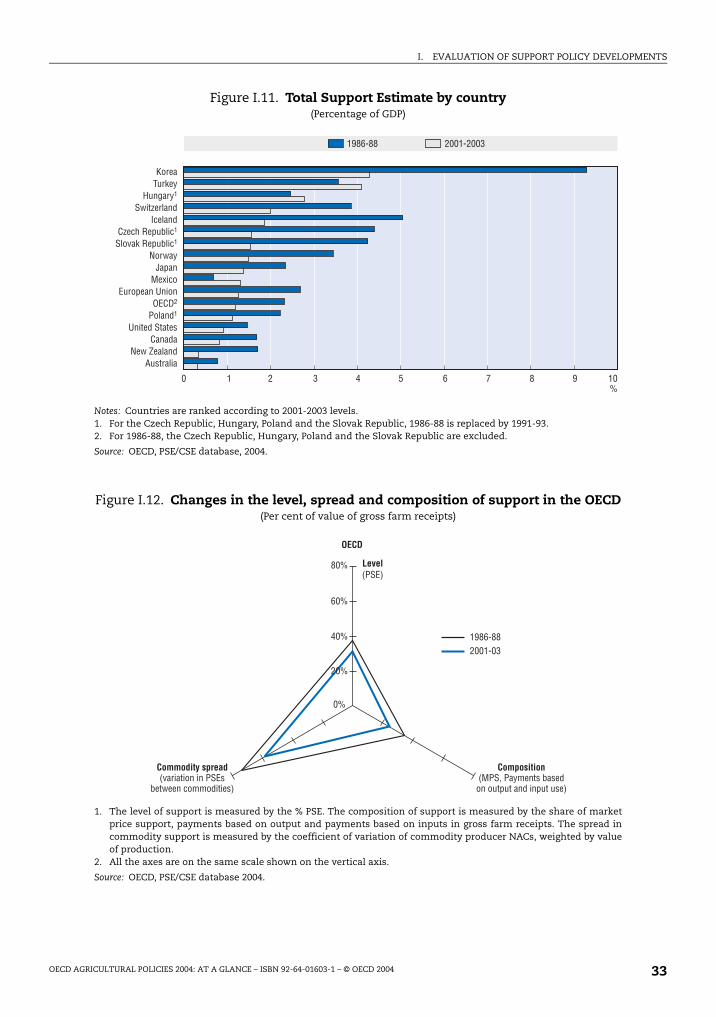
Total support to agriculture has decreased
For the OECD as a whole, transfers to agriculture as measured by the Total Support
Estimate (TSE) amounted to USD 350 billion (EUR 372 billion) in 2003 (Figure I.11). When
measured as a share of GDP (% TSE) overall support remained unchanged from 2002 at
approximately 1.2% of GDP. This is almost half the 1986-88 average of 2.3%. Within the
overall figure there has been a decrease in the transfers from consumers, who on average
pay lower prices for their products, and an increase in transfers from taxpayers, reflecting
the overall change in composition of support.
In 2001-03, the % TSE ranged from less than 0.5% in Australia and New Zealand to
over 4% in Korea and Turkey. Across all OECD countries, the % TSE has fallen by around
50% or more since 1986-88, with the exception of Hungary, Mexico and Turkey where it
has increased. This reflects a combination of factors including overall GDP growth, changes
in the relative contribution of agriculture to GDP, and changes in the monetary value of
transfers associated with agricultural policies.
Overall, some progress in reform has occurred…
Progress towards the long-term objective of policy reform can be shown by downward
trends in three elements of support to producers: the level of support, the share of most
production and trade distorting forms of support, and the spread in support levels among
commodities. The trends in these three support elements for the OECD as whole show that
there has been some progress towards the goal of policy reform, although there have been
year-on-year fluctuations (Figure I.12). There has been a reduction in the level of support, a
greater but modest improvement in the composition of support, and a fall in the difference
in support levels between commodities.
OECD AGRICULTURAL POLICIES 2004: AT A GLANCE – ISBN 92-64-01603-1 – © OECD 200432
I. EVALUATION OF SUPPORT POLICY DEVELOPMENTS
Figure I.11. Total Support Estimate by country(Percentage of GDP)
Notes: Countries are ranked according to 2001-2003 levels.1. For the Czech Republic, Hungary, Poland and the Slovak Republic, 1986-88 is replaced by 1991-93.2. For 1986-88, the Czech Republic, Hungary, Poland and the Slovak Republic are excluded.
Source: OECD, PSE/CSE database, 2004.
1986-88 2001-2003
0 1 2 3 4 6 105%
7 98
KoreaTurkey
Hungary1
SwitzerlandIceland
Czech Republic1
Slovak Republic1
NorwayJapan
MexicoEuropean Union
OECD2
Poland1
United StatesCanada
New ZealandAustralia
Figure I.12. Changes in the level, spread and composition of support in the OECD(Per cent of value of gross farm receipts)
1. The level of support is measured by the % PSE. The composition of support is measured by the share of marketprice support, payments based on output and payments based on inputs in gross farm receipts. The spread incommodity support is measured by the coefficient of variation of commodity producer NACs, weighted by valueof production.
2. All the axes are on the same scale shown on the vertical axis.
Source: OECD, PSE/CSE database 2004.
1986-882001-03
OECD
80%
60%
40%
20%
0%
Composition(MPS, Payments based
on output and input use)
Commodity spread(variation in PSEs
between commodities)
Level(PSE)
OECD AGRICULTURAL POLICIES 2004: AT A GLANCE – ISBN 92-64-01603-1 – © OECD 2004 33
I. EVALUATION OF SUPPORT POLICY DEVELOPMENTS
… but remains highly uneven across countries
Different patterns of support and reform are evidenced across OECD countries as
shown by changes in the level, spread and composition of support between 1986-88
(1991-93 for the Czech Republic, Hungary, Mexico, Poland and Slovakia) and 2001-03
(Part 2). Progress in policy reform, i.e. a reduction in all three elements of support has
occurred in the OECD countries located in the Oceania and North American regions, and in
several European countries, but the extent to which further progress is necessary varies
considerably.
● In Australia, recent reforms in the dairy sector have contributed to a decrease in the
spread of support among commodities.
● In New Zealand, the level of support has been significantly reduced, from a relatively
low base, and there has also been a marked reduction in differences in support levels
between commodities.
● Canada has made progress in reducing the level and the use of the most distorting forms
of support, but there has been less progress in reducing the spread in support levels
among commodities, reflecting in particular the continued relatively high level of
support for milk.
● In the United States, there has been a modest reduction in the level of support and
improvement in the composition of support, with greater progress made on reducing the
spread in support levels across commodities, particularly between cereal and oilseed
products.
● Mexico has made progress in reducing the level and improving the composition of
support but the difference in support levels between commodities has only improved
slightly.
● Switzerland stands out as the high support country making the most significant change.
While the level of support has decreased only a little, improvements have been made in
shifting away from the most distorting forms of support and reducing the difference in
support levels between commodities.
● The Czech Republic, Poland and the Slovak Republic have all reduced the level of
support, the most distorting forms of support and the spread in support levels across
commodities.
Other countries have made progress in some, but not all of the three elements.
● In the European Union, the level of support has fallen marginally, with greater progress
made in reducing the most distorting forms of support. However, the spread in support
levels among commodities has increased, with greater reductions in support for cereals
than for other products such as livestock and sugar.
● A similar situation has occurred in Iceland, where the spread of support has increased
due to relatively greater reforms in the sheepmeat, pigmeat and egg sectors.
● In Korea there has been a slight fall in boththe level and the importance of the most
distorting forms of support, with the spread in support rising slightly.
● Norway has made some progress in lowering the most distorting forms of support, but
no change in the other two elements, although the spread of support remains narrow.
Finally, in a few countries, there has been little change or an increase in all three
support elements.
OECD AGRICULTURAL POLICIES 2004: AT A GLANCE – ISBN 92-64-01603-1 – © OECD 200434
I. EVALUATION OF SUPPORT POLICY DEVELOPMENTS
● In Japan, no change has been observed in reducing the level of support or reducing the
most distorting forms of support, and the difference in support levels across commodities
has increased. While support decreased for some commodities, especially oilseeds,
sugar and beef and veal, it increased for pork, while remained unchanged for rice even
though the domestic prices declined.
● In Turkey, there has been an increase in the level of support and in the spread in support
levels across commodities, although the importance of the most distorting forms of
support has remained constant.
● While starting from a low base, Hungary stands out as the one country where all three
support elements have increased in comparison with the reference period.
Further efforts to reform agricultural policies are clearly required
Government intervention continues to be significant, creating important spill-over
effects on production, trade and the environment. Although some progress has been made
since 1986-88, the current level, composition and spread in support levels across
commodities among OECD countries, and the distortions associated with such policies,
demands further attention. About three-quarters of the total support to agriculture
continues to go to individual producers. Producer support still accounts for about one third
of farm receipts, of which over three-quarters is still generated by the most distorting
forms of support. And there remain wide differences in the level of support between
commodities.
Over 60% of support to producers continues to be provided through policies generating
higher prices. This can bear heavily on low-income households, for whom food constitutes
a larger share of their total expenditure. Moreover, as most of the support provided to
producers is still either output- or input-linked, a high share of support goes to larger
farms. Price support can enhance rather than reduce income disparities.
A number of countries are continuing to undertake unilateral efforts to reform their
agricultural policies. These are often a positive step in the right direction of reducing trade
distortions and improving the targeting of policies to specific objectives, although the
extent of reform varies quite considerably. A successful conclusion to the on-going trade
negotiations in the context of the WTO Doha Development Agenda would invigorate the
process of agricultural policy reform.
OECD AGRICULTURAL POLICIES 2004: AT A GLANCE – ISBN 92-64-01603-1 – © OECD 2004 35
I. EVALUATION OF SUPPORT POLICY DEVELOPMENTS
ANNEX I.1
Policy Principles
OECD Agriculture Ministers in 1998 adopted a set of policy principles, building on the
agricultural policy reform principles agreed by OECD Ministers in 1987 available on the
OECD website (The link is www.oecd.org/agr/policy/, under > Publications & Documents >
Events/Conferences/Meetings Ministerial Communiqués Related to Agricultural Policies).
These principles stress the need to:*
● pursue agricultural policy reform in accordance with Article 20 of the Uruguay Round
Agreement on agriculture and the commitment to undertake further negotiations as
foreseen in that article and to the long-term goal of domestic and international policy
reform to allow for a greater influence of market signals;
● address the problem of additional trade barriers, emerging trade issues and discipline on
export restrictions and export credits;
● strengthen world food security;
● promote innovative policies that facilitate responsiveness to market conditions by
agricultural producers;
● facilitate improvement in the structures of the agriculture and agro-food sectors;
● enhance the contribution of the agro-food sector to the viability of the rural economy;
● take actions to ensure the protection of the environment and sustainable management
of natural resources in agriculture;
● take account of consumer concerns;
● encourage increased innovation, economic efficiency, and sustainability of agro-food
systems;
● preserve and strengthen the multifunctional role of agriculture.
* The full text from the relevant Ministerial Communiqués can be found in www.oecd.org//agr/ministerial/commune.htm.
OECD AGRICULTURAL POLICIES 2004: AT A GLANCE – ISBN 92-64-01603-1 – © OECD 200436
I. EVALUATION OF SUPPORT POLICY DEVELOPMENTS
ANNEX I.2
Operational Criteria
OECD Agriculture Ministers in 1998 agreed that policy measures should seek to meet a
number of operational criteria, to apply in both the domestic and the international
contexts, which should be:*
● transparent: having easily identifiable policy objectives, costs, benefits and beneficiaries;
● targeted: to specific outcomes and as far as possible decoupled;
● tailored: providing transfers no greater than necessary to achieve clearly identified
outcomes;
● flexible: reflecting the diversity of agricultural situations, be able to respond to changing
objectives and priorities, and applicable to the time period needed for the specific
outcome to be achieved;
● equitable: taking into account the effects of the distribution of support between sectors,
farmers and regions.
* The full text from the Ministerial Communiqués can be found at www.oecd.org//agr/ministerial/commune.htm.
OECD AGRICULTURAL POLICIES 2004: AT A GLANCE – ISBN 92-64-01603-1 – © OECD 2004 37
I. EVALUATION OF SUPPORT POLICY DEVELOPMENTS
ANNEX I.3
Definitions of the OECD Indicators of Support
Producer Support Estimate (PSE): the annual monetary value of gross transfers from
consumers and taxpayers to agricultural producers, measured at the farm-gate level,
arising from policy measures that support agriculture, regardless of their nature, objectives
or impacts on farm production or income. It includes market price support and budgetary
payments, i.e. gross transfers from taxpayers to agricultural producers arising from policy
measures based on: current output, area planted/animal numbers, historical entitlements,
input use, input constraints, and overall farming income. The % PSE measures the
transfers as a share of gross farm receipts.
Market Price Support (MPS): the annual monetary value of gross transfers from
consumers and taxpayers to agricultural producers arising from policy measures that
create a gap between domestic market prices and border prices of a specific agricultural
commodity, measured at the farm-gate level.
Producer Nominal Protection Coefficient (NPCp): the ratio between the average price
received by producers (at farm gate), including payments per tonne of current output, and
the border price (measured at farm gate).
Producer Nominal Assistance Coefficient (NACp): the ratio between the value of gross
farm receipts including support and gross farm receipts valued at border prices.
Consumer Support Estimate (CSE): the annual monetary value of gross transfers to
(from) consumers of agricultural commodities, measured at the farm-gate level, arising
from policy measures that support agriculture, regardless of their nature, objectives or
impacts on consumption of farm products. If negative, the CSE measures the burden on
consumers by agricultural policies, from higher prices and consumer charges or subsidies
that lower prices to consumers. The % CSE measures the implicit tax (or subsidy, if CSE is
positive) on consumers as a share of consumption expenditure at the farm gate.
Consumer Nominal Protection Coefficient (NPCc): the ratio between the average price
paid by consumers (at farm gate) and the border price (measured at farm gate).
Consumer Nominal Assistance Coefficient (NACc): the ratio between the value of
consumption expenditure on agricultural commodities (at farm gate) and that valued at
border prices.
General Services Support Estimate (GSSE): the annual monetary value of gross transfers
to general services provided to agriculture collectively, arising from policy measures that
support agriculture regardless of their nature, objectives and impacts on farm production,
income, or consumption.
OECD AGRICULTURAL POLICIES 2004: AT A GLANCE – ISBN 92-64-01603-1 – © OECD 200438
I. EVALUATION OF SUPPORT POLICY DEVELOPMENTS
Total Support Estimate (TSE) the annual monetary value of all gross transfers from
taxpayers and consumers arising from policy measures that support agriculture, net of the
associated budgetary receipts, regardless of their objectives and impacts on farm
production and income, or consumption of farm products. The % TSE measures the overall
transfers from agricultural policy as a percentage of GDP.
Source: OECD (2002), Methodology for Measurement of Support and Use in Policy Evaluation.
www.OECD.org/agr/policy.
OECD AGRICULTURAL POLICIES 2004: AT A GLANCE – ISBN 92-64-01603-1 – © OECD 2004 39

ISBN 92-64-01603-1
OECD Agricultural Policies 2004: At a Glance
© OECD 2004
PART II
Country Focus
This part of the report provides detailed information on the recent and long-termdevelopment of the level, composition and variability of support to agriculture in eachOECD country. It provides a concise, consistent snapshot of support to agriculture inOECD member countries and the European Union as a whole. A substantial databaseunderpins the material in this part, and is publicly available on an OECD website (Thelink is www.oecd.org/agr/policy/ under > Statistics).
OECD AGRICULTURAL POLICIES 2004: AT A GLANCE – ISBN 92-64-01603-1 – © OECD 2004 41
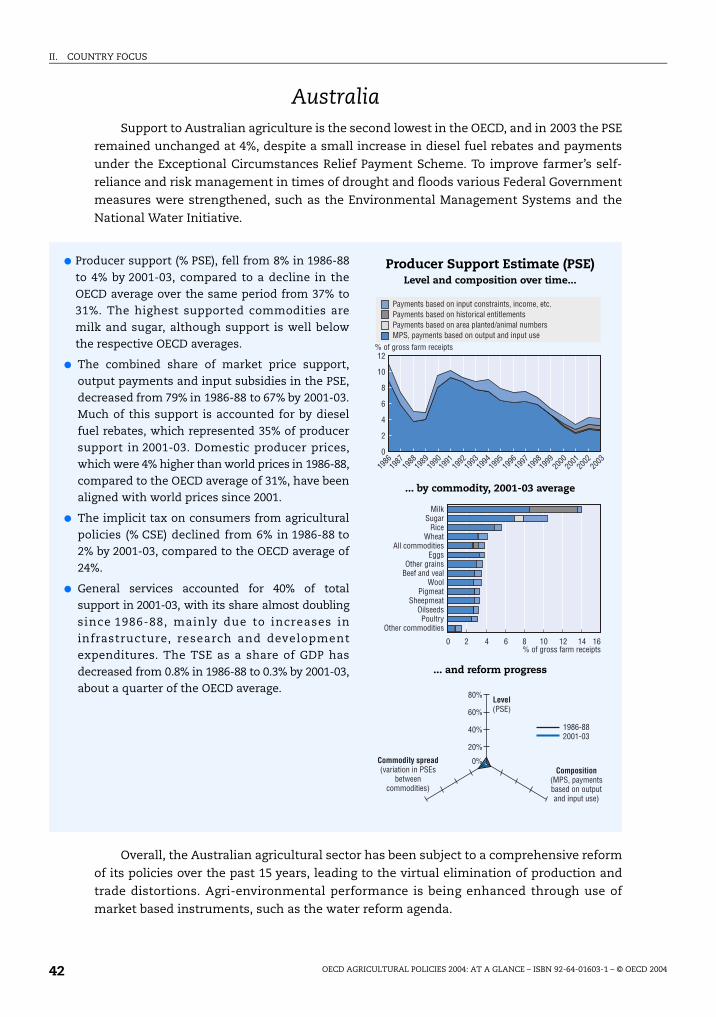
II. COUNTRY FOCUS
AustraliaSupport to Australian agriculture is the second lowest in the OECD, and in 2003 the PSE
remained unchanged at 4%, despite a small increase in diesel fuel rebates and payments
under the Exceptional Circumstances Relief Payment Scheme. To improve farmer’s self-
reliance and risk management in times of drought and floods various Federal Government
measures were strengthened, such as the Environmental Management Systems and the
National Water Initiative.
Overall, the Australian agricultural sector has been subject to a comprehensive reform
of its policies over the past 15 years, leading to the virtual elimination of production and
trade distortions. Agri-environmental performance is being enhanced through use of
market based instruments, such as the water reform agenda.
● Producer support (% PSE), fell from 8% in 1986-88to 4% by 2001-03, compared to a decline in theOECD average over the same period from 37% to31%. The highest supported commodities aremilk and sugar, although support is well belowthe respective OECD averages.
● The combined share of market price support,output payments and input subsidies in the PSE,decreased from 79% in 1986-88 to 67% by 2001-03.Much of this support is accounted for by dieselfuel rebates, which represented 35% of producersupport in 2001-03. Domestic producer prices,which were 4% higher than world prices in 1986-88,compared to the OECD average of 31%, have beenaligned with world prices since 2001.
● The implicit tax on consumers from agriculturalpolicies (% CSE) declined from 6% in 1986-88 to2% by 2001-03, compared to the OECD average of24%.
● General services accounted for 40% of totalsupport in 2001-03, with its share almost doublingsince 1986-88, mainly due to increases ininfrastructure, research and developmentexpenditures. The TSE as a share of GDP hasdecreased from 0.8% in 1986-88 to 0.3% by 2001-03,about a quarter of the OECD average.
Producer Support Estimate (PSE)Level and composition over time...
... by commodity, 2001-03 average
... and reform progress
% of gross farm receipts12
10
8
6
0
1986
1987
1988
1989
1990
1991
1992
1993
1994
1995
1996
1997
1998
1999
2000
2001
2003
2002
Payments based on input constraints, income, etc.
Payments based on area planted/animal numbersMPS, payments based on output and input use
Payments based on historical entitlements
2
4
0% of gross farm receipts
4 8 16122 6 10 14
MilkSugar
RiceWheat
All commoditiesEggs
Other grainsBeef and veal
WoolPigmeat
SheepmeatOilseedsPoultry
Other commodities
1986-882001-03
80%
60%
40%
20%
0%Commodity spread(variation in PSEs
betweencommodities)
Composition(MPS, paymentsbased on outputand input use)
Level(PSE)
OECD AGRICULTURAL POLICIES 2004: AT A GLANCE – ISBN 92-64-01603-1 – © OECD 200442
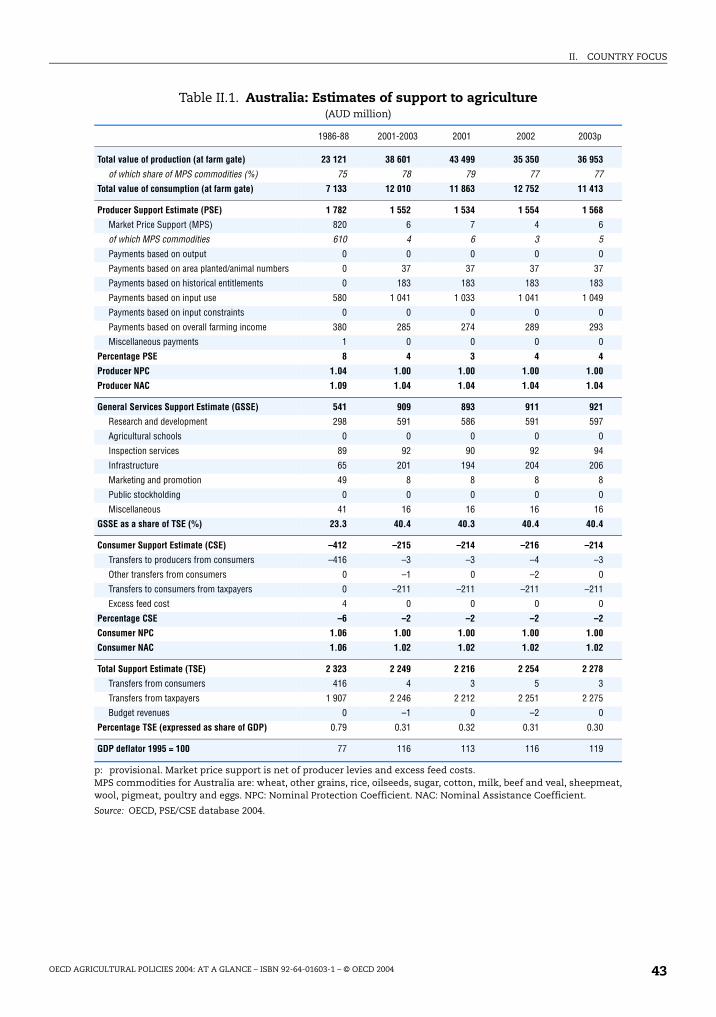
II. COUNTRY FOCUS
Table II.1. Australia: Estimates of support to agriculture(AUD million)
p: provisional. Market price support is net of producer levies and excess feed costs. MPS commodities for Australia are: wheat, other grains, rice, oilseeds, sugar, cotton, milk, beef and veal, sheepmeat,wool, pigmeat, poultry and eggs. NPC: Nominal Protection Coefficient. NAC: Nominal Assistance Coefficient.
Source: OECD, PSE/CSE database 2004.
1986-88 2001-2003 2001 2002 2003p
Total value of production (at farm gate) 23 121 38 601 43 499 35 350 36 953
of which share of MPS commodities (%) 75 78 79 77 77
Total value of consumption (at farm gate) 7 133 12 010 11 863 12 752 11 413
Producer Support Estimate (PSE) 1 782 1 552 1 534 1 554 1 568
Market Price Support (MPS) 820 6 7 4 6
of which MPS commodities 610 4 6 3 5
Payments based on output 0 0 0 0 0
Payments based on area planted/animal numbers 0 37 37 37 37
Payments based on historical entitlements 0 183 183 183 183
Payments based on input use 580 1 041 1 033 1 041 1 049
Payments based on input constraints 0 0 0 0 0
Payments based on overall farming income 380 285 274 289 293
Miscellaneous payments 1 0 0 0 0
Percentage PSE 8 4 3 4 4
Producer NPC 1.04 1.00 1.00 1.00 1.00
Producer NAC 1.09 1.04 1.04 1.04 1.04
General Services Support Estimate (GSSE) 541 909 893 911 921
Research and development 298 591 586 591 597
Agricultural schools 0 0 0 0 0
Inspection services 89 92 90 92 94
Infrastructure 65 201 194 204 206
Marketing and promotion 49 8 8 8 8
Public stockholding 0 0 0 0 0
Miscellaneous 41 16 16 16 16
GSSE as a share of TSE (%) 23.3 40.4 40.3 40.4 40.4
Consumer Support Estimate (CSE) –412 –215 –214 –216 –214
Transfers to producers from consumers –416 –3 –3 –4 –3
Other transfers from consumers 0 –1 0 –2 0
Transfers to consumers from taxpayers 0 –211 –211 –211 –211
Excess feed cost 4 0 0 0 0
Percentage CSE –6 –2 –2 –2 –2
Consumer NPC 1.06 1.00 1.00 1.00 1.00
Consumer NAC 1.06 1.02 1.02 1.02 1.02
Total Support Estimate (TSE) 2 323 2 249 2 216 2 254 2 278
Transfers from consumers 416 4 3 5 3
Transfers from taxpayers 1 907 2 246 2 212 2 251 2 275
Budget revenues 0 –1 0 –2 0
Percentage TSE (expressed as share of GDP) 0.79 0.31 0.32 0.31 0.30
GDP deflator 1995 = 100 77 116 113 116 119
OECD AGRICULTURAL POLICIES 2004: AT A GLANCE – ISBN 92-64-01603-1 – © OECD 2004 43
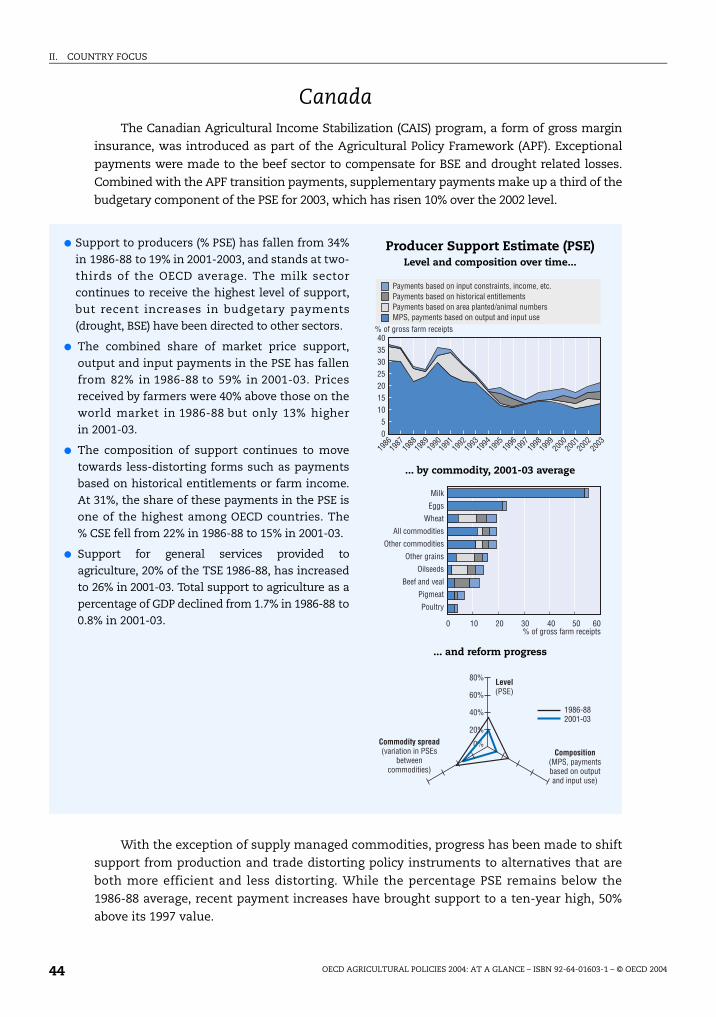
II. COUNTRY FOCUS
CanadaThe Canadian Agricultural Income Stabilization (CAIS) program, a form of gross margin
insurance, was introduced as part of the Agricultural Policy Framework (APF). Exceptional
payments were made to the beef sector to compensate for BSE and drought related losses.
Combined with the APF transition payments, supplementary payments make up a third of the
budgetary component of the PSE for 2003, which has risen 10% over the 2002 level.
With the exception of supply managed commodities, progress has been made to shift
support from production and trade distorting policy instruments to alternatives that are
both more efficient and less distorting. While the percentage PSE remains below the
1986-88 average, recent payment increases have brought support to a ten-year high, 50%
above its 1997 value.
● Support to producers (% PSE) has fallen from 34%in 1986-88 to 19% in 2001-2003, and stands at two-thirds of the OECD average. The milk sectorcontinues to receive the highest level of support,but recent increases in budgetary payments(drought, BSE) have been directed to other sectors.
● The combined share of market price support,output and input payments in the PSE has fallenfrom 82% in 1986-88 to 59% in 2001-03. Pricesreceived by farmers were 40% above those on theworld market in 1986-88 but only 13% higherin 2001-03.
● The composition of support continues to movetowards less-distorting forms such as paymentsbased on historical entitlements or farm income.At 31%, the share of these payments in the PSE isone of the highest among OECD countries. The% CSE fell from 22% in 1986-88 to 15% in 2001-03.
● Support for general services provided toagriculture, 20% of the TSE 1986-88, has increasedto 26% in 2001-03. Total support to agriculture as apercentage of GDP declined from 1.7% in 1986-88 to0.8% in 2001-03.
Producer Support Estimate (PSE)Level and composition over time...
... by commodity, 2001-03 average
... and reform progress
% of gross farm receipts40353025
0
1986
1987
1988
1989
1990
1991
1992
1993
1994
1995
1996
1997
1998
1999
2000
2001
2003
2002
Payments based on input constraints, income, etc.
Payments based on area planted/animal numbersMPS, payments based on output and input use
Payments based on historical entitlements
1520
105
0% of gross farm receipts
20 40 6010 30 50
Milk
Eggs
Wheat
All commodities
Other commodities
Other grains
Oilseeds
Beef and veal
Pigmeat
Poultry
1986-882001-03
80%
60%
40%
20%
0%Commodity spread(variation in PSEs
betweencommodities)
Composition(MPS, paymentsbased on outputand input use)
Level(PSE)
OECD AGRICULTURAL POLICIES 2004: AT A GLANCE – ISBN 92-64-01603-1 – © OECD 200444
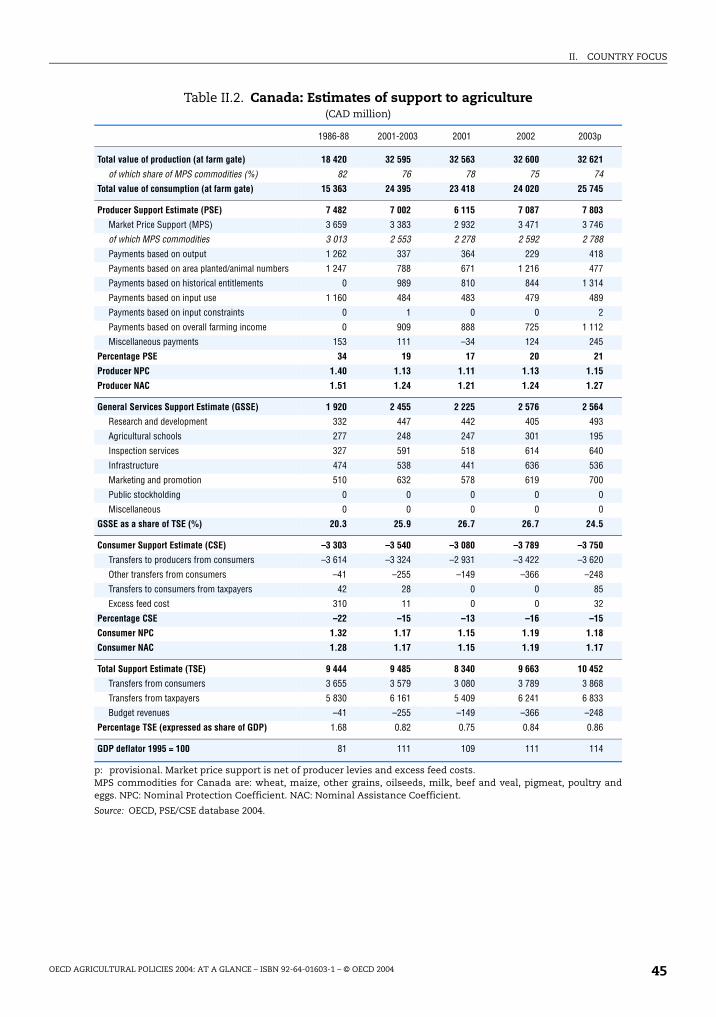
II. COUNTRY FOCUS
Table II.2. Canada: Estimates of support to agriculture(CAD million)
p: provisional. Market price support is net of producer levies and excess feed costs. MPS commodities for Canada are: wheat, maize, other grains, oilseeds, milk, beef and veal, pigmeat, poultry andeggs. NPC: Nominal Protection Coefficient. NAC: Nominal Assistance Coefficient.
Source: OECD, PSE/CSE database 2004.
1986-88 2001-2003 2001 2002 2003p
Total value of production (at farm gate) 18 420 32 595 32 563 32 600 32 621
of which share of MPS commodities (%) 82 76 78 75 74
Total value of consumption (at farm gate) 15 363 24 395 23 418 24 020 25 745
Producer Support Estimate (PSE) 7 482 7 002 6 115 7 087 7 803
Market Price Support (MPS) 3 659 3 383 2 932 3 471 3 746
of which MPS commodities 3 013 2 553 2 278 2 592 2 788
Payments based on output 1 262 337 364 229 418
Payments based on area planted/animal numbers 1 247 788 671 1 216 477
Payments based on historical entitlements 0 989 810 844 1 314
Payments based on input use 1 160 484 483 479 489
Payments based on input constraints 0 1 0 0 2
Payments based on overall farming income 0 909 888 725 1 112
Miscellaneous payments 153 111 –34 124 245
Percentage PSE 34 19 17 20 21
Producer NPC 1.40 1.13 1.11 1.13 1.15
Producer NAC 1.51 1.24 1.21 1.24 1.27
General Services Support Estimate (GSSE) 1 920 2 455 2 225 2 576 2 564
Research and development 332 447 442 405 493
Agricultural schools 277 248 247 301 195
Inspection services 327 591 518 614 640
Infrastructure 474 538 441 636 536
Marketing and promotion 510 632 578 619 700
Public stockholding 0 0 0 0 0
Miscellaneous 0 0 0 0 0
GSSE as a share of TSE (%) 20.3 25.9 26.7 26.7 24.5
Consumer Support Estimate (CSE) –3 303 –3 540 –3 080 –3 789 –3 750
Transfers to producers from consumers –3 614 –3 324 –2 931 –3 422 –3 620
Other transfers from consumers –41 –255 –149 –366 –248
Transfers to consumers from taxpayers 42 28 0 0 85
Excess feed cost 310 11 0 0 32
Percentage CSE –22 –15 –13 –16 –15
Consumer NPC 1.32 1.17 1.15 1.19 1.18
Consumer NAC 1.28 1.17 1.15 1.19 1.17
Total Support Estimate (TSE) 9 444 9 485 8 340 9 663 10 452
Transfers from consumers 3 655 3 579 3 080 3 789 3 868
Transfers from taxpayers 5 830 6 161 5 409 6 241 6 833
Budget revenues –41 –255 –149 –366 –248
Percentage TSE (expressed as share of GDP) 1.68 0.82 0.75 0.84 0.86
GDP deflator 1995 = 100 81 111 109 111 114
OECD AGRICULTURAL POLICIES 2004: AT A GLANCE – ISBN 92-64-01603-1 – © OECD 2004 45
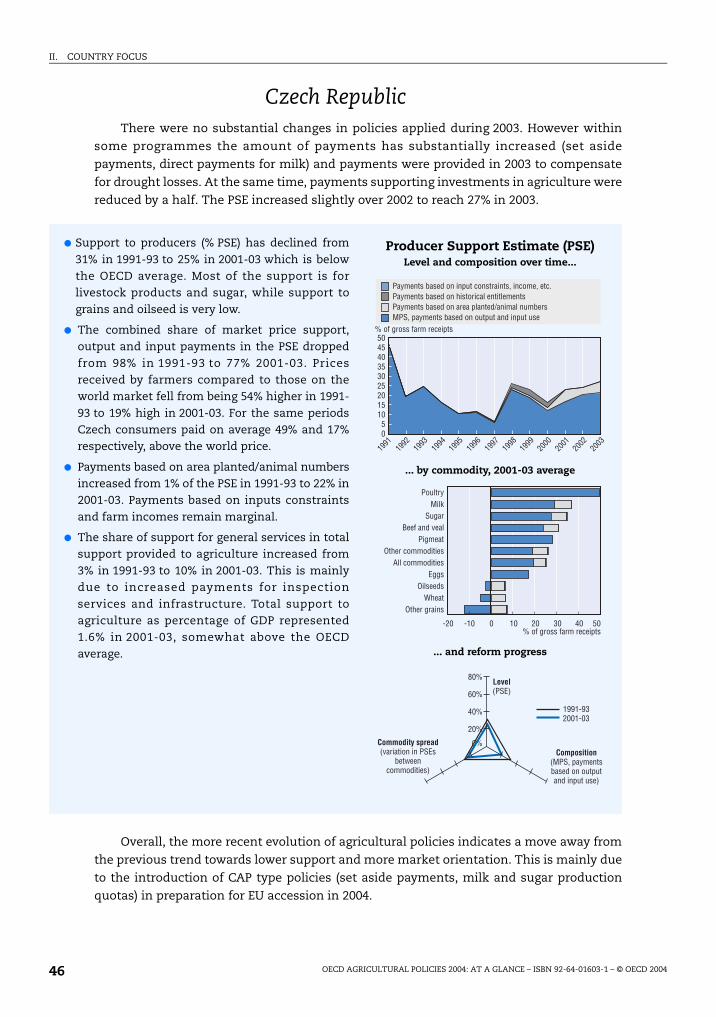
II. COUNTRY FOCUS
Czech RepublicThere were no substantial changes in policies applied during 2003. However within
some programmes the amount of payments has substantially increased (set aside
payments, direct payments for milk) and payments were provided in 2003 to compensate
for drought losses. At the same time, payments supporting investments in agriculture were
reduced by a half. The PSE increased slightly over 2002 to reach 27% in 2003.
Overall, the more recent evolution of agricultural policies indicates a move away from
the previous trend towards lower support and more market orientation. This is mainly due
to the introduction of CAP type policies (set aside payments, milk and sugar production
quotas) in preparation for EU accession in 2004.
● Support to producers (% PSE) has declined from31% in 1991-93 to 25% in 2001-03 which is belowthe OECD average. Most of the support is forlivestock products and sugar, while support tograins and oilseed is very low.
● The combined share of market price support,output and input payments in the PSE droppedfrom 98% in 1991-93 to 77% 2001-03. Pricesreceived by farmers compared to those on theworld market fell from being 54% higher in 1991-93 to 19% high in 2001-03. For the same periodsCzech consumers paid on average 49% and 17%respectively, above the world price.
● Payments based on area planted/animal numbersincreased from 1% of the PSE in 1991-93 to 22% in2001-03. Payments based on inputs constraintsand farm incomes remain marginal.
● The share of support for general services in totalsupport provided to agriculture increased from3% in 1991-93 to 10% in 2001-03. This is mainlydue to increased payments for inspectionservices and infrastructure. Total support toagriculture as percentage of GDP represented1.6% in 2001-03, somewhat above the OECDaverage.
Producer Support Estimate (PSE)Level and composition over time...
... by commodity, 2001-03 average
... and reform progress
% of gross farm receipts50
353025
0
1991
1992
1993
1994
1995
1996
1997
1998
1999
2000
2001
2003
2002
1520
105
4045
Payments based on input constraints, income, etc.
Payments based on area planted/animal numbersMPS, payments based on output and input use
Payments based on historical entitlements
-20% of gross farm receipts
0 20 50-10 10 30 40
PoultryMilk
SugarBeef and veal
PigmeatOther commodities
All commoditiesEggs
OilseedsWheat
Other grains
1991-932001-03
80%
60%
40%
20%
0%Commodity spread(variation in PSEs
betweencommodities)
Composition(MPS, paymentsbased on outputand input use)
Level(PSE)
OECD AGRICULTURAL POLICIES 2004: AT A GLANCE – ISBN 92-64-01603-1 – © OECD 200446
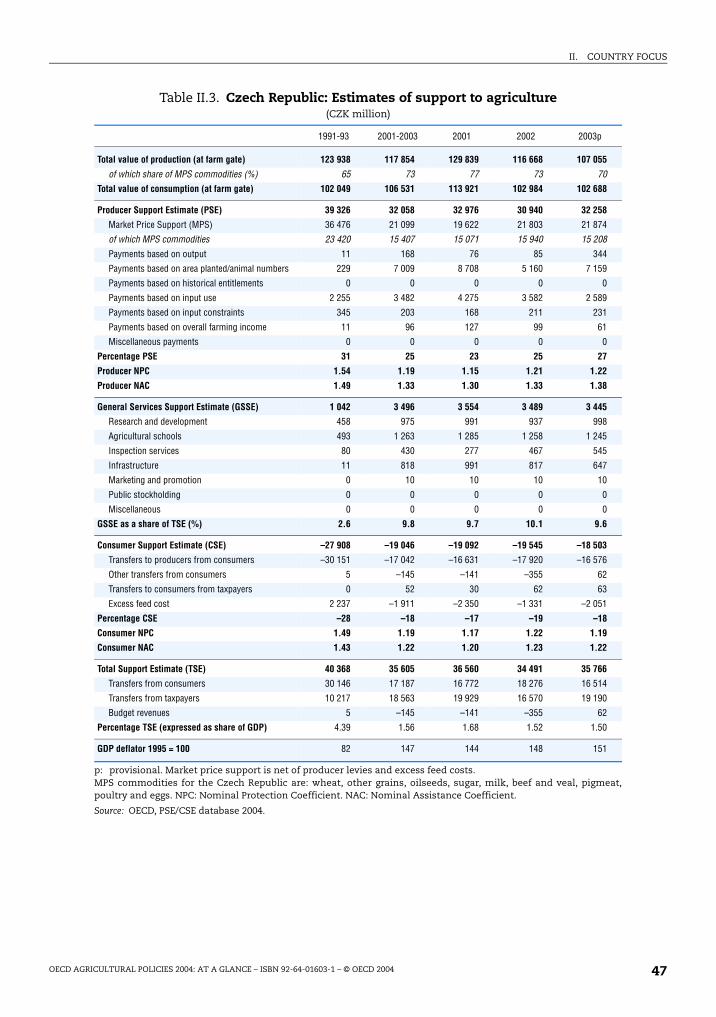
II. COUNTRY FOCUS
Table II.3. Czech Republic: Estimates of support to agriculture(CZK million)
p: provisional. Market price support is net of producer levies and excess feed costs. MPS commodities for the Czech Republic are: wheat, other grains, oilseeds, sugar, milk, beef and veal, pigmeat,poultry and eggs. NPC: Nominal Protection Coefficient. NAC: Nominal Assistance Coefficient.
Source: OECD, PSE/CSE database 2004.
1991-93 2001-2003 2001 2002 2003p
Total value of production (at farm gate) 123 938 117 854 129 839 116 668 107 055
of which share of MPS commodities (%) 65 73 77 73 70
Total value of consumption (at farm gate) 102 049 106 531 113 921 102 984 102 688
Producer Support Estimate (PSE) 39 326 32 058 32 976 30 940 32 258
Market Price Support (MPS) 36 476 21 099 19 622 21 803 21 874
of which MPS commodities 23 420 15 407 15 071 15 940 15 208
Payments based on output 11 168 76 85 344
Payments based on area planted/animal numbers 229 7 009 8 708 5 160 7 159
Payments based on historical entitlements 0 0 0 0 0
Payments based on input use 2 255 3 482 4 275 3 582 2 589
Payments based on input constraints 345 203 168 211 231
Payments based on overall farming income 11 96 127 99 61
Miscellaneous payments 0 0 0 0 0
Percentage PSE 31 25 23 25 27
Producer NPC 1.54 1.19 1.15 1.21 1.22
Producer NAC 1.49 1.33 1.30 1.33 1.38
General Services Support Estimate (GSSE) 1 042 3 496 3 554 3 489 3 445
Research and development 458 975 991 937 998
Agricultural schools 493 1 263 1 285 1 258 1 245
Inspection services 80 430 277 467 545
Infrastructure 11 818 991 817 647
Marketing and promotion 0 10 10 10 10
Public stockholding 0 0 0 0 0
Miscellaneous 0 0 0 0 0
GSSE as a share of TSE (%) 2.6 9.8 9.7 10.1 9.6
Consumer Support Estimate (CSE) –27 908 –19 046 –19 092 –19 545 –18 503
Transfers to producers from consumers –30 151 –17 042 –16 631 –17 920 –16 576
Other transfers from consumers 5 –145 –141 –355 62
Transfers to consumers from taxpayers 0 52 30 62 63
Excess feed cost 2 237 –1 911 –2 350 –1 331 –2 051
Percentage CSE –28 –18 –17 –19 –18
Consumer NPC 1.49 1.19 1.17 1.22 1.19
Consumer NAC 1.43 1.22 1.20 1.23 1.22
Total Support Estimate (TSE) 40 368 35 605 36 560 34 491 35 766
Transfers from consumers 30 146 17 187 16 772 18 276 16 514
Transfers from taxpayers 10 217 18 563 19 929 16 570 19 190
Budget revenues 5 –145 –141 –355 62
Percentage TSE (expressed as share of GDP) 4.39 1.56 1.68 1.52 1.50
GDP deflator 1995 = 100 82 147 144 148 151
OECD AGRICULTURAL POLICIES 2004: AT A GLANCE – ISBN 92-64-01603-1 – © OECD 2004 47
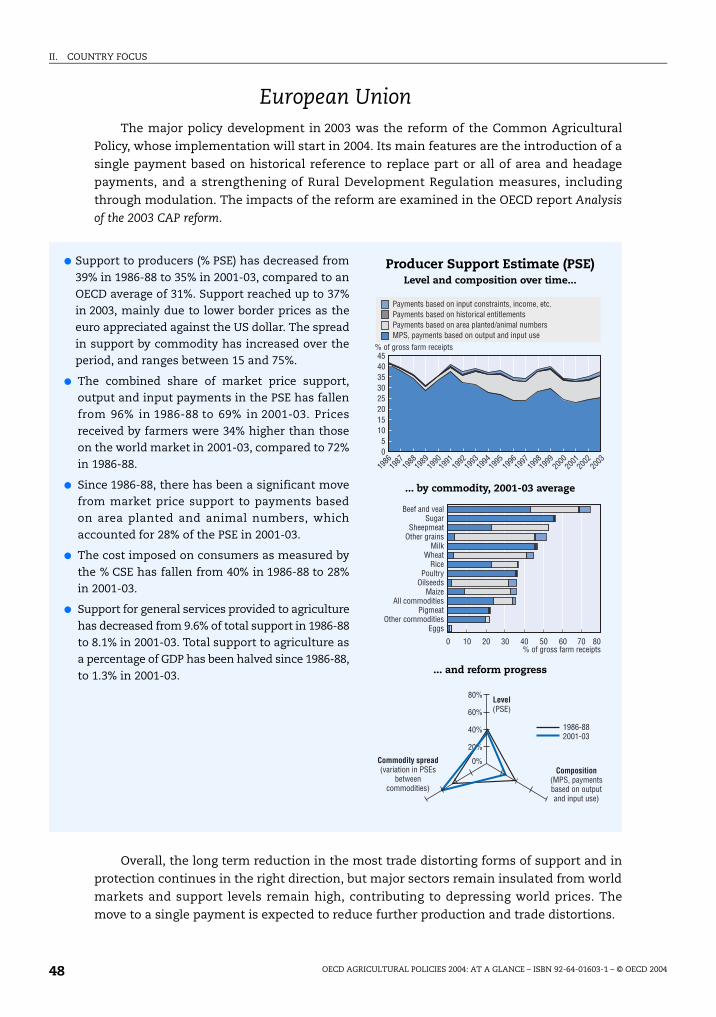
II. COUNTRY FOCUS
European UnionThe major policy development in 2003 was the reform of the Common Agricultural
Policy, whose implementation will start in 2004. Its main features are the introduction of a
single payment based on historical reference to replace part or all of area and headage
payments, and a strengthening of Rural Development Regulation measures, including
through modulation. The impacts of the reform are examined in the OECD report Analysis
of the 2003 CAP reform.
Overall, the long term reduction in the most trade distorting forms of support and in
protection continues in the right direction, but major sectors remain insulated from world
markets and support levels remain high, contributing to depressing world prices. The
move to a single payment is expected to reduce further production and trade distortions.
● Support to producers (% PSE) has decreased from39% in 1986-88 to 35% in 2001-03, compared to anOECD average of 31%. Support reached up to 37%in 2003, mainly due to lower border prices as theeuro appreciated against the US dollar. The spreadin support by commodity has increased over theperiod, and ranges between 15 and 75%.
● The combined share of market price support,output and input payments in the PSE has fallenfrom 96% in 1986-88 to 69% in 2001-03. Pricesreceived by farmers were 34% higher than thoseon the world market in 2001-03, compared to 72%in 1986-88.
● Since 1986-88, there has been a significant movefrom market price support to payments basedon area planted and animal numbers, whichaccounted for 28% of the PSE in 2001-03.
● The cost imposed on consumers as measured bythe % CSE has fallen from 40% in 1986-88 to 28%in 2001-03.
● Support for general services provided to agriculturehas decreased from 9.6% of total support in 1986-88to 8.1% in 2001-03. Total support to agriculture asa percentage of GDP has been halved since 1986-88,to 1.3% in 2001-03.
Producer Support Estimate (PSE)Level and composition over time...
... by commodity, 2001-03 average
... and reform progress
% of gross farm receipts45
353025
0
1986
1987
1988
1989
1990
1991
1992
1993
1994
1995
1996
1997
1998
1999
2000
2001
2003
2002
Payments based on input constraints, income, etc.
Payments based on area planted/animal numbersMPS, payments based on output and input use
Payments based on historical entitlements
1520
105
40
0% of gross farm receipts
20 40 8010 30 50 7060
Beef and vealSugar
SheepmeatOther grains
MilkWheat
RicePoultry
OilseedsMaize
All commoditiesPigmeat
Other commoditiesEggs
1986-882001-03
80%
60%
40%
20%
0%Commodity spread(variation in PSEs
betweencommodities)
Composition(MPS, paymentsbased on outputand input use)
Level(PSE)
OECD AGRICULTURAL POLICIES 2004: AT A GLANCE – ISBN 92-64-01603-1 – © OECD 200448

II. COUNTRY FOCUS
Table II.4. European Union: Estimates of support to agriculture(EUR million)
p: provisional. Market price support is net of producer levies and excess feed costs. MPS commodities for the European Community are: wheat, maize, other grains, rice, oilseeds, sugar, milk, beef andveal, sheepmeat, pigmeat, poultry, eggs and potatoes. NPC: Nominal Protection Coefficient. NAC: Nominal AssistanceCoefficient.
Source: OECD, PSE/CSE database 2004.
1986-88 2001-2003 2001 2002 2003p
Total value of production (at farm gate) 211 407 245 289 249 143 243 694 243 030
of which share of MPS commodities (%) 72 71 71 71 71
Total value of consumption (at farm gate) 163 333 192 236 196 750 190 337 189 620
Producer Support Estimate (PSE) 86 884 102 708 99 295 100 577 108 251
Market Price Support (MPS) 74 751 58 311 55 150 58 231 61 552
of which MPS commodities 53 719 41 128 38 898 41 072 43 413
Payments based on output 4 524 3 792 4 186 3 592 3 599
Payments based on area planted/animal numbers 2 415 28 027 28 289 26 229 29 563
Payments based on historical entitlements 0 608 591 598 633
Payments based on input use 4 525 7 908 7 663 7 725 8 335
Payments based on input constraints 643 4 073 3 515 4 051 4 653
Payments based on overall farming income 0 0 0 0 0
Miscellaneous payments 26 –11 –99 149 –84
Percentage PSE 39 35 34 35 37
Producer NPC 1.72 1.34 1.31 1.33 1.37
Producer NAC 1.64 1.55 1.51 1.54 1.60
General Services Support Estimate (GSSE) 9 677 9 410 9 216 9 338 9 675
Research and development 1 063 1 550 1 643 1 481 1 526
Agricultural schools 93 901 850 858 995
Inspection services 156 369 304 407 396
Infrastructure 1 122 1 973 1 925 1 926 2 066
Marketing and promotion 2 430 3 138 3 026 3 102 3 287
Public stockholding 4 776 1 343 1 334 1 424 1 272
Miscellaneous 38 135 134 139 132
GSSE as a share of TSE (%) 9.6 8.1 8.2 8.2 7.9
Consumer Support Estimate (CSE) –64 293 –51 904 –47 963 –52 299 –55 450
Transfers to producers from consumers –75 246 –55 537 –51 846 –55 373 –59 392
Other transfers from consumers –1 499 –698 –500 –581 –1 013
Transfers to consumers from taxpayers 4 387 3 762 3 676 3 645 3 963
Excess feed cost 8 066 570 707 10 991
Percentage CSE –40 –28 –25 –28 –30
Consumer NPC 1.90 1.42 1.36 1.42 1.47
Consumer NAC 1.69 1.38 1.33 1.39 1.43
Total Support Estimate (TSE) 100 948 115 879 112 187 113 560 121 890
Transfers from consumers 76 745 56 235 52 346 55 954 60 405
Transfers from taxpayers 25 702 60 342 60 341 58 187 62 498
Budget revenues –1 499 –698 –500 –581 –1 013
Percentage TSE (expressed as share of GDP) 2.68 1.27 1.27 1.24 1.32
GDP deflator 1995 = 100 74 113 111 113 116
OECD AGRICULTURAL POLICIES 2004: AT A GLANCE – ISBN 92-64-01603-1 – © OECD 2004 49
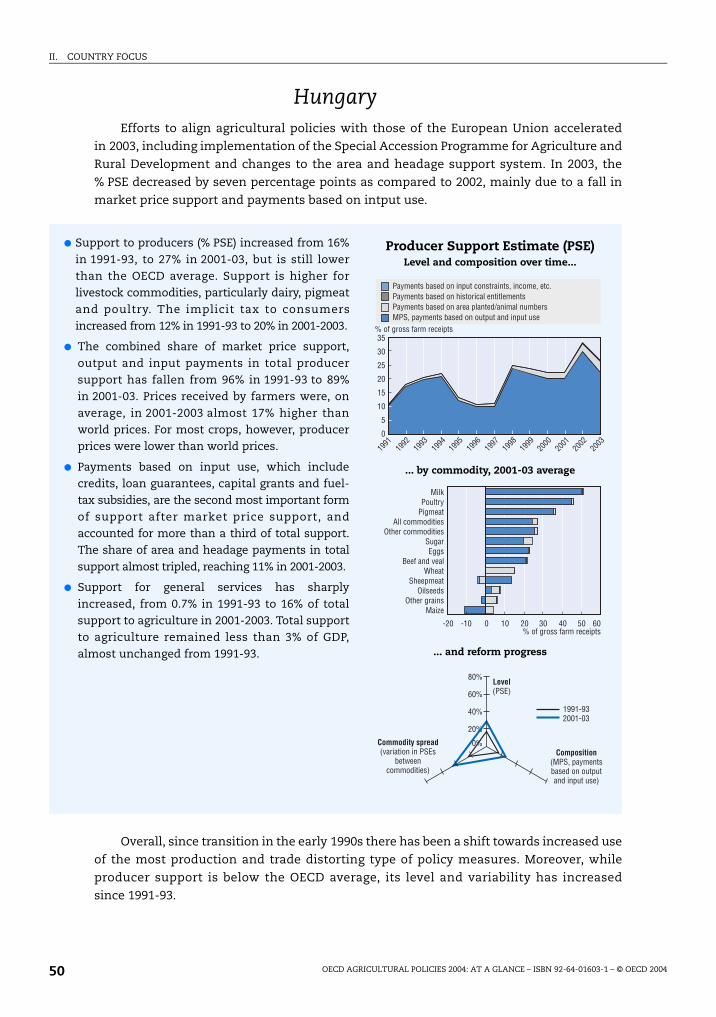
II. COUNTRY FOCUS
HungaryEfforts to align agricultural policies with those of the European Union accelerated
in 2003, including implementation of the Special Accession Programme for Agriculture and
Rural Development and changes to the area and headage support system. In 2003, the
% PSE decreased by seven percentage points as compared to 2002, mainly due to a fall in
market price support and payments based on intput use.
Overall, since transition in the early 1990s there has been a shift towards increased use
of the most production and trade distorting type of policy measures. Moreover, while
producer support is below the OECD average, its level and variability has increased
since 1991-93.
● Support to producers (% PSE) increased from 16%in 1991-93, to 27% in 2001-03, but is still lowerthan the OECD average. Support is higher forlivestock commodities, particularly dairy, pigmeatand poultry. The implicit tax to consumersincreased from 12% in 1991-93 to 20% in 2001-2003.
● The combined share of market price support,output and input payments in total producersupport has fallen from 96% in 1991-93 to 89%in 2001-03. Prices received by farmers were, onaverage, in 2001-2003 almost 17% higher thanworld prices. For most crops, however, producerprices were lower than world prices.
● Payments based on input use, which includecredits, loan guarantees, capital grants and fuel-tax subsidies, are the second most important formof support after market price support, andaccounted for more than a third of total support.The share of area and headage payments in totalsupport almost tripled, reaching 11% in 2001-2003.
● Support for general services has sharplyincreased, from 0.7% in 1991-93 to 16% of totalsupport to agriculture in 2001-2003. Total supportto agriculture remained less than 3% of GDP,almost unchanged from 1991-93.
Producer Support Estimate (PSE)Level and composition over time...
... by commodity, 2001-03 average
... and reform progress
% of gross farm receipts35
30
25
0
1991
1992
1993
1994
1995
1996
1997
1998
1999
2000
2001
2003
2002
15
20
10
5
Payments based on input constraints, income, etc.
Payments based on area planted/animal numbersMPS, payments based on output and input use
Payments based on historical entitlements
-20% of gross farm receipts
0 20 60-10 10 30 5040
MilkPoultry
PigmeatAll commodities
Other commoditiesSugarEggs
Beef and vealWheat
SheepmeatOilseeds
Other grainsMaize
1991-932001-03
80%
60%
40%
20%
0%Commodity spread(variation in PSEs
betweencommodities)
Composition(MPS, paymentsbased on outputand input use)
Level(PSE)
OECD AGRICULTURAL POLICIES 2004: AT A GLANCE – ISBN 92-64-01603-1 – © OECD 200450
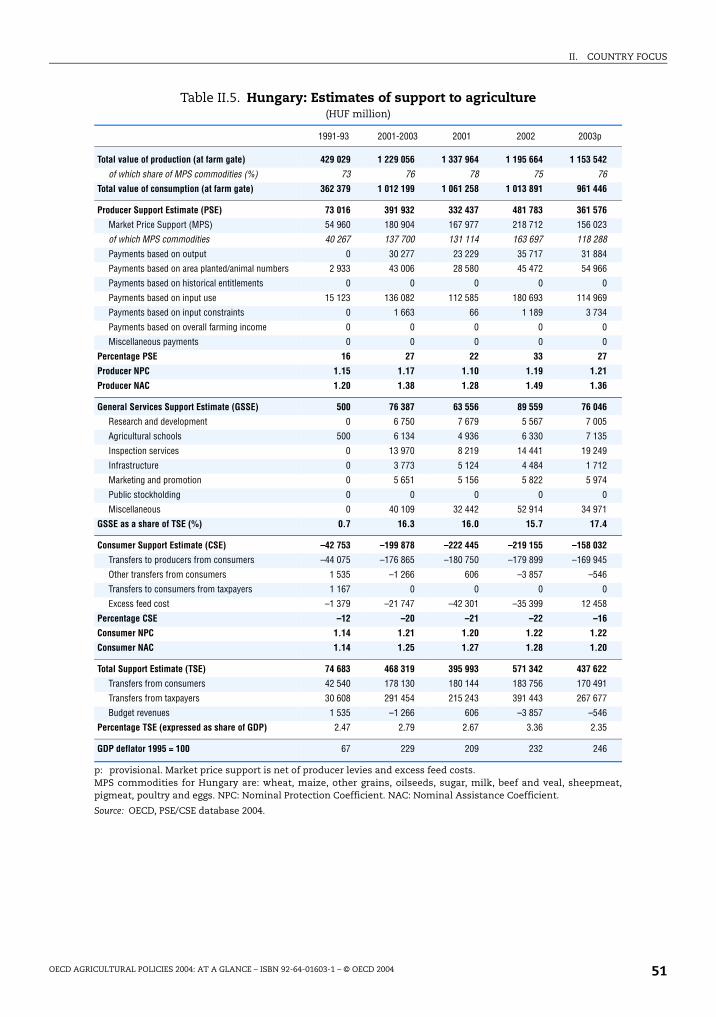
II. COUNTRY FOCUS
Table II.5. Hungary: Estimates of support to agriculture(HUF million)
p: provisional. Market price support is net of producer levies and excess feed costs. MPS commodities for Hungary are: wheat, maize, other grains, oilseeds, sugar, milk, beef and veal, sheepmeat,pigmeat, poultry and eggs. NPC: Nominal Protection Coefficient. NAC: Nominal Assistance Coefficient.
Source: OECD, PSE/CSE database 2004.
1991-93 2001-2003 2001 2002 2003p
Total value of production (at farm gate) 429 029 1 229 056 1 337 964 1 195 664 1 153 542
of which share of MPS commodities (%) 73 76 78 75 76
Total value of consumption (at farm gate) 362 379 1 012 199 1 061 258 1 013 891 961 446
Producer Support Estimate (PSE) 73 016 391 932 332 437 481 783 361 576
Market Price Support (MPS) 54 960 180 904 167 977 218 712 156 023
of which MPS commodities 40 267 137 700 131 114 163 697 118 288
Payments based on output 0 30 277 23 229 35 717 31 884
Payments based on area planted/animal numbers 2 933 43 006 28 580 45 472 54 966
Payments based on historical entitlements 0 0 0 0 0
Payments based on input use 15 123 136 082 112 585 180 693 114 969
Payments based on input constraints 0 1 663 66 1 189 3 734
Payments based on overall farming income 0 0 0 0 0
Miscellaneous payments 0 0 0 0 0
Percentage PSE 16 27 22 33 27
Producer NPC 1.15 1.17 1.10 1.19 1.21
Producer NAC 1.20 1.38 1.28 1.49 1.36
General Services Support Estimate (GSSE) 500 76 387 63 556 89 559 76 046
Research and development 0 6 750 7 679 5 567 7 005
Agricultural schools 500 6 134 4 936 6 330 7 135
Inspection services 0 13 970 8 219 14 441 19 249
Infrastructure 0 3 773 5 124 4 484 1 712
Marketing and promotion 0 5 651 5 156 5 822 5 974
Public stockholding 0 0 0 0 0
Miscellaneous 0 40 109 32 442 52 914 34 971
GSSE as a share of TSE (%) 0.7 16.3 16.0 15.7 17.4
Consumer Support Estimate (CSE) –42 753 –199 878 –222 445 –219 155 –158 032
Transfers to producers from consumers –44 075 –176 865 –180 750 –179 899 –169 945
Other transfers from consumers 1 535 –1 266 606 –3 857 –546
Transfers to consumers from taxpayers 1 167 0 0 0 0
Excess feed cost –1 379 –21 747 –42 301 –35 399 12 458
Percentage CSE –12 –20 –21 –22 –16
Consumer NPC 1.14 1.21 1.20 1.22 1.22
Consumer NAC 1.14 1.25 1.27 1.28 1.20
Total Support Estimate (TSE) 74 683 468 319 395 993 571 342 437 622
Transfers from consumers 42 540 178 130 180 144 183 756 170 491
Transfers from taxpayers 30 608 291 454 215 243 391 443 267 677
Budget revenues 1 535 –1 266 606 –3 857 –546
Percentage TSE (expressed as share of GDP) 2.47 2.79 2.67 3.36 2.35
GDP deflator 1995 = 100 67 229 209 232 246
OECD AGRICULTURAL POLICIES 2004: AT A GLANCE – ISBN 92-64-01603-1 – © OECD 2004 51
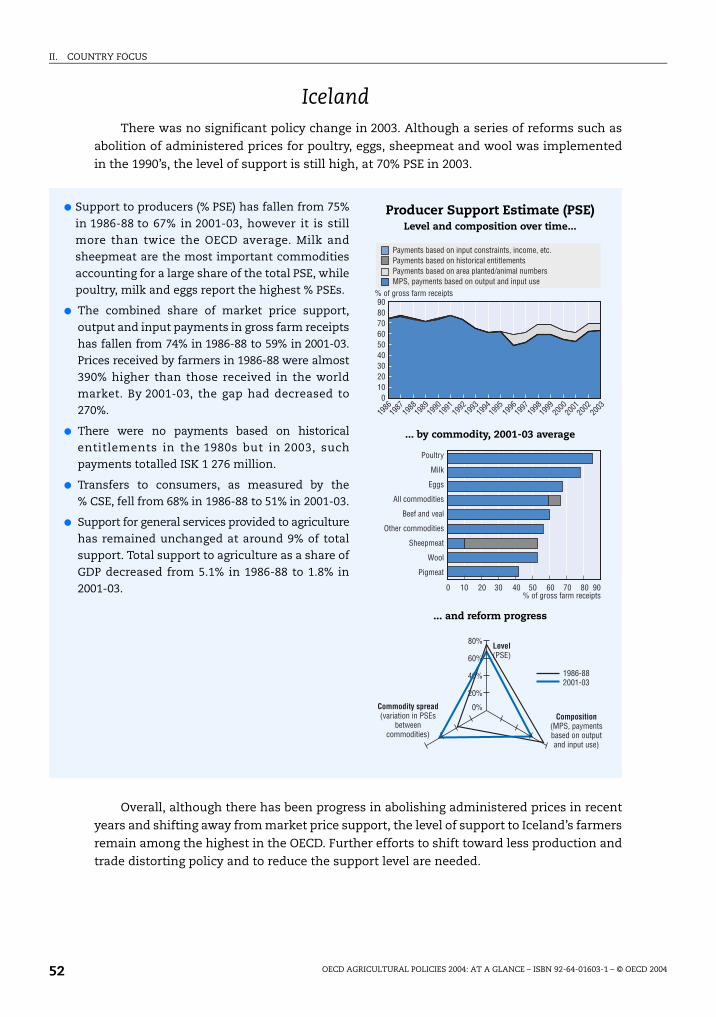
II. COUNTRY FOCUS
IcelandThere was no significant policy change in 2003. Although a series of reforms such as
abolition of administered prices for poultry, eggs, sheepmeat and wool was implemented
in the 1990’s, the level of support is still high, at 70% PSE in 2003.
Overall, although there has been progress in abolishing administered prices in recent
years and shifting away from market price support, the level of support to Iceland’s farmers
remain among the highest in the OECD. Further efforts to shift toward less production and
trade distorting policy and to reduce the support level are needed.
● Support to producers (% PSE) has fallen from 75%in 1986-88 to 67% in 2001-03, however it is stillmore than twice the OECD average. Milk andsheepmeat are the most important commoditiesaccounting for a large share of the total PSE, whilepoultry, milk and eggs report the highest % PSEs.
● The combined share of market price support,output and input payments in gross farm receiptshas fallen from 74% in 1986-88 to 59% in 2001-03.Prices received by farmers in 1986-88 were almost390% higher than those received in the worldmarket. By 2001-03, the gap had decreased to270%.
● There were no payments based on historicalentitlements in the 1980s but in 2003, suchpayments totalled ISK 1 276 million.
● Transfers to consumers, as measured by the% CSE, fell from 68% in 1986-88 to 51% in 2001-03.
● Support for general services provided to agriculturehas remained unchanged at around 9% of totalsupport. Total support to agriculture as a share ofGDP decreased from 5.1% in 1986-88 to 1.8% in2001-03.
Producer Support Estimate (PSE)Level and composition over time...
... by commodity, 2001-03 average
... and reform progress
% of gross farm receipts90
30
0
1986
1987
1988
1989
1990
1991
1992
1993
1994
1995
1996
1997
1998
1999
2000
2001
2003
2002
Payments based on input constraints, income, etc.
Payments based on area planted/animal numbersMPS, payments based on output and input use
Payments based on historical entitlements
2010
4050607080
0% of gross farm receipts
20 40 9010 30 50 7060 80
Poultry
Milk
Eggs
All commodities
Beef and veal
Other commodities
Sheepmeat
Wool
Pigmeat
1986-882001-03
80%
60%
40%
20%
0%Commodity spread(variation in PSEs
betweencommodities)
Composition(MPS, paymentsbased on outputand input use)
Level(PSE)
OECD AGRICULTURAL POLICIES 2004: AT A GLANCE – ISBN 92-64-01603-1 – © OECD 200452
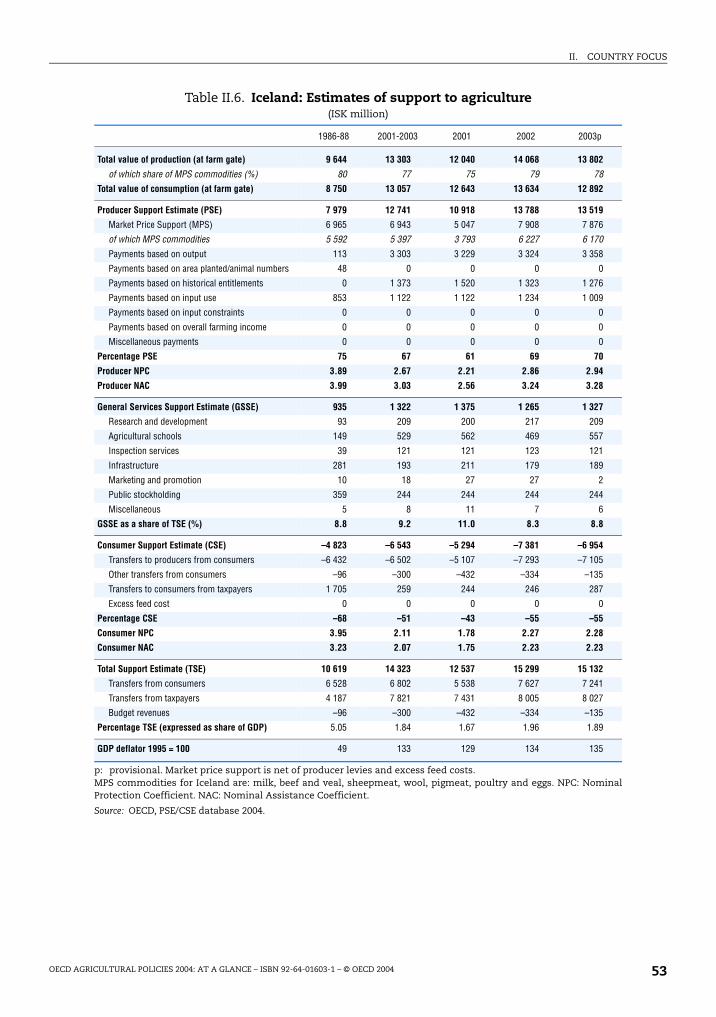
II. COUNTRY FOCUS
Table II.6. Iceland: Estimates of support to agriculture(ISK million)
p: provisional. Market price support is net of producer levies and excess feed costs. MPS commodities for Iceland are: milk, beef and veal, sheepmeat, wool, pigmeat, poultry and eggs. NPC: NominalProtection Coefficient. NAC: Nominal Assistance Coefficient.
Source: OECD, PSE/CSE database 2004.
1986-88 2001-2003 2001 2002 2003p
Total value of production (at farm gate) 9 644 13 303 12 040 14 068 13 802
of which share of MPS commodities (%) 80 77 75 79 78
Total value of consumption (at farm gate) 8 750 13 057 12 643 13 634 12 892
Producer Support Estimate (PSE) 7 979 12 741 10 918 13 788 13 519
Market Price Support (MPS) 6 965 6 943 5 047 7 908 7 876
of which MPS commodities 5 592 5 397 3 793 6 227 6 170
Payments based on output 113 3 303 3 229 3 324 3 358
Payments based on area planted/animal numbers 48 0 0 0 0
Payments based on historical entitlements 0 1 373 1 520 1 323 1 276
Payments based on input use 853 1 122 1 122 1 234 1 009
Payments based on input constraints 0 0 0 0 0
Payments based on overall farming income 0 0 0 0 0
Miscellaneous payments 0 0 0 0 0
Percentage PSE 75 67 61 69 70
Producer NPC 3.89 2.67 2.21 2.86 2.94
Producer NAC 3.99 3.03 2.56 3.24 3.28
General Services Support Estimate (GSSE) 935 1 322 1 375 1 265 1 327
Research and development 93 209 200 217 209
Agricultural schools 149 529 562 469 557
Inspection services 39 121 121 123 121
Infrastructure 281 193 211 179 189
Marketing and promotion 10 18 27 27 2
Public stockholding 359 244 244 244 244
Miscellaneous 5 8 11 7 6
GSSE as a share of TSE (%) 8.8 9.2 11.0 8.3 8.8
Consumer Support Estimate (CSE) –4 823 –6 543 –5 294 –7 381 –6 954
Transfers to producers from consumers –6 432 –6 502 –5 107 –7 293 –7 105
Other transfers from consumers –96 –300 –432 –334 –135
Transfers to consumers from taxpayers 1 705 259 244 246 287
Excess feed cost 0 0 0 0 0
Percentage CSE –68 –51 –43 –55 –55
Consumer NPC 3.95 2.11 1.78 2.27 2.28
Consumer NAC 3.23 2.07 1.75 2.23 2.23
Total Support Estimate (TSE) 10 619 14 323 12 537 15 299 15 132
Transfers from consumers 6 528 6 802 5 538 7 627 7 241
Transfers from taxpayers 4 187 7 821 7 431 8 005 8 027
Budget revenues –96 –300 –432 –334 –135
Percentage TSE (expressed as share of GDP) 5.05 1.84 1.67 1.96 1.89
GDP deflator 1995 = 100 49 133 129 134 135
OECD AGRICULTURAL POLICIES 2004: AT A GLANCE – ISBN 92-64-01603-1 – © OECD 2004 53
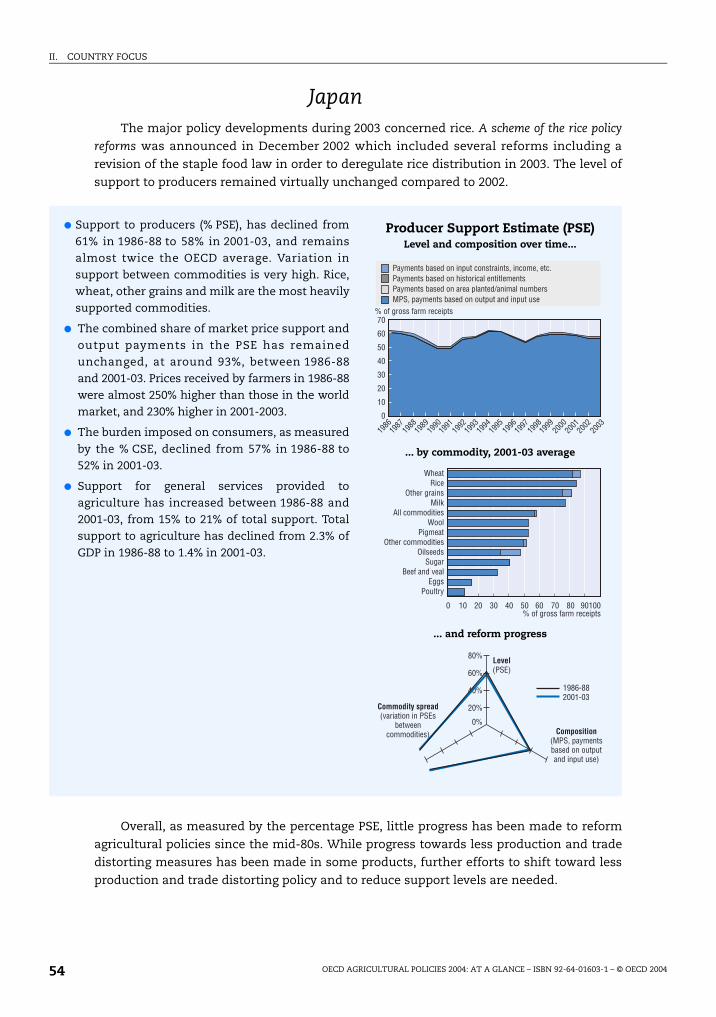
II. COUNTRY FOCUS
JapanThe major policy developments during 2003 concerned rice. A scheme of the rice policy
reforms was announced in December 2002 which included several reforms including a
revision of the staple food law in order to deregulate rice distribution in 2003. The level of
support to producers remained virtually unchanged compared to 2002.
Overall, as measured by the percentage PSE, little progress has been made to reform
agricultural policies since the mid-80s. While progress towards less production and trade
distorting measures has been made in some products, further efforts to shift toward less
production and trade distorting policy and to reduce support levels are needed.
● Support to producers (% PSE), has declined from61% in 1986-88 to 58% in 2001-03, and remainsalmost twice the OECD average. Variation insupport between commodities is very high. Rice,wheat, other grains and milk are the most heavilysupported commodities.
● The combined share of market price support andoutput payments in the PSE has remainedunchanged, at around 93%, between 1986-88and 2001-03. Prices received by farmers in 1986-88were almost 250% higher than those in the worldmarket, and 230% higher in 2001-2003.
● The burden imposed on consumers, as measuredby the % CSE, declined from 57% in 1986-88 to52% in 2001-03.
● Support for general services provided toagriculture has increased between 1986-88 and2001-03, from 15% to 21% of total support. Totalsupport to agriculture has declined from 2.3% ofGDP in 1986-88 to 1.4% in 2001-03.
Producer Support Estimate (PSE)Level and composition over time...
... by commodity, 2001-03 average
... and reform progress
% of gross farm receipts70
30
0
1986
1987
1988
1989
1990
1991
1992
1993
1994
1995
1996
1997
1998
1999
2000
2001
2003
2002
Payments based on input constraints, income, etc.
Payments based on area planted/animal numbersMPS, payments based on output and input use
Payments based on historical entitlements
20
10
40
50
60
0% of gross farm receipts
20 40 10010 30 50 7060 80 90
WheatRice
Other grainsMilk
All commoditiesWool
PigmeatOther commodities
OilseedsSugar
Beef and vealEggs
Poultry
1986-882001-03
80%
60%
40%
20%
0%
Commodity spread(variation in PSEs
betweencommodities) Composition
(MPS, paymentsbased on outputand input use)
Level(PSE)
OECD AGRICULTURAL POLICIES 2004: AT A GLANCE – ISBN 92-64-01603-1 – © OECD 200454
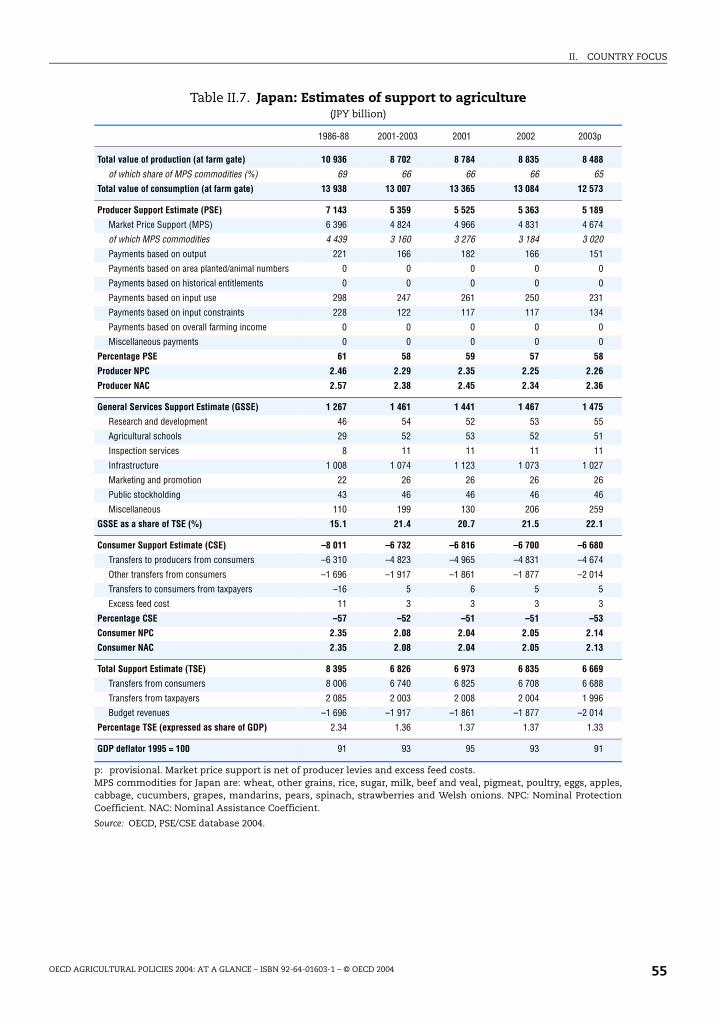
II. COUNTRY FOCUS
Table II.7. Japan: Estimates of support to agriculture(JPY billion)
p: provisional. Market price support is net of producer levies and excess feed costs. MPS commodities for Japan are: wheat, other grains, rice, sugar, milk, beef and veal, pigmeat, poultry, eggs, apples,cabbage, cucumbers, grapes, mandarins, pears, spinach, strawberries and Welsh onions. NPC: Nominal ProtectionCoefficient. NAC: Nominal Assistance Coefficient.
Source: OECD, PSE/CSE database 2004.
1986-88 2001-2003 2001 2002 2003p
Total value of production (at farm gate) 10 936 8 702 8 784 8 835 8 488
of which share of MPS commodities (%) 69 66 66 66 65
Total value of consumption (at farm gate) 13 938 13 007 13 365 13 084 12 573
Producer Support Estimate (PSE) 7 143 5 359 5 525 5 363 5 189
Market Price Support (MPS) 6 396 4 824 4 966 4 831 4 674
of which MPS commodities 4 439 3 160 3 276 3 184 3 020
Payments based on output 221 166 182 166 151
Payments based on area planted/animal numbers 0 0 0 0 0
Payments based on historical entitlements 0 0 0 0 0
Payments based on input use 298 247 261 250 231
Payments based on input constraints 228 122 117 117 134
Payments based on overall farming income 0 0 0 0 0
Miscellaneous payments 0 0 0 0 0
Percentage PSE 61 58 59 57 58
Producer NPC 2.46 2.29 2.35 2.25 2.26
Producer NAC 2.57 2.38 2.45 2.34 2.36
General Services Support Estimate (GSSE) 1 267 1 461 1 441 1 467 1 475
Research and development 46 54 52 53 55
Agricultural schools 29 52 53 52 51
Inspection services 8 11 11 11 11
Infrastructure 1 008 1 074 1 123 1 073 1 027
Marketing and promotion 22 26 26 26 26
Public stockholding 43 46 46 46 46
Miscellaneous 110 199 130 206 259
GSSE as a share of TSE (%) 15.1 21.4 20.7 21.5 22.1
Consumer Support Estimate (CSE) –8 011 –6 732 –6 816 –6 700 –6 680
Transfers to producers from consumers –6 310 –4 823 –4 965 –4 831 –4 674
Other transfers from consumers –1 696 –1 917 –1 861 –1 877 –2 014
Transfers to consumers from taxpayers –16 5 6 5 5
Excess feed cost 11 3 3 3 3
Percentage CSE –57 –52 –51 –51 –53
Consumer NPC 2.35 2.08 2.04 2.05 2.14
Consumer NAC 2.35 2.08 2.04 2.05 2.13
Total Support Estimate (TSE) 8 395 6 826 6 973 6 835 6 669
Transfers from consumers 8 006 6 740 6 825 6 708 6 688
Transfers from taxpayers 2 085 2 003 2 008 2 004 1 996
Budget revenues –1 696 –1 917 –1 861 –1 877 –2 014
Percentage TSE (expressed as share of GDP) 2.34 1.36 1.37 1.37 1.33
GDP deflator 1995 = 100 91 93 95 93 91
OECD AGRICULTURAL POLICIES 2004: AT A GLANCE – ISBN 92-64-01603-1 – © OECD 2004 55
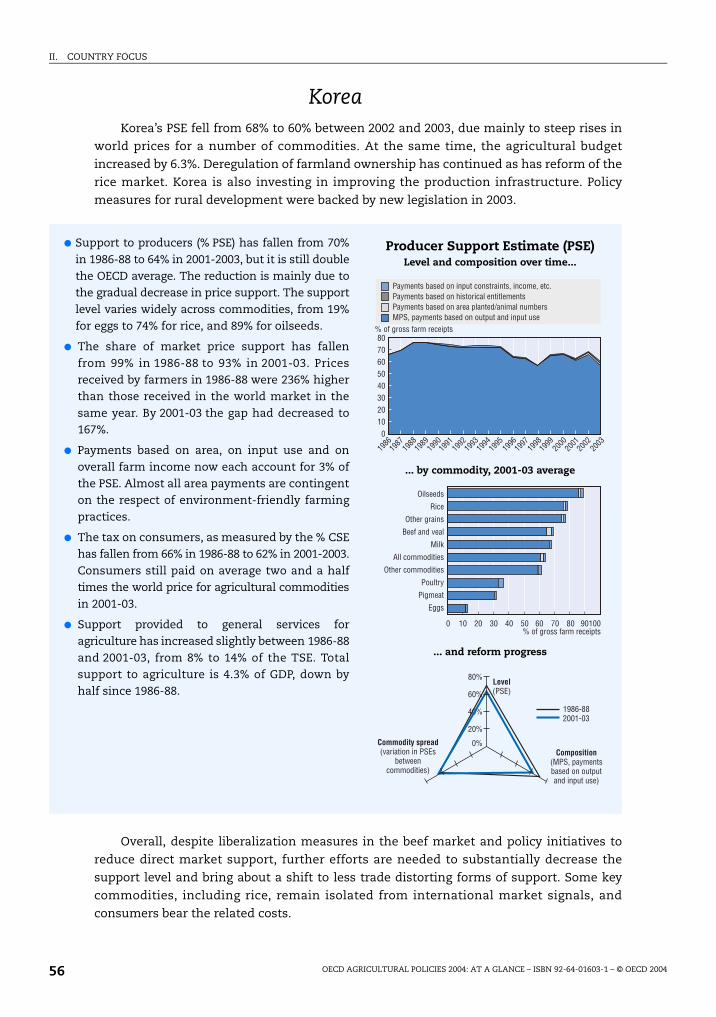
II. COUNTRY FOCUS
KoreaKorea’s PSE fell from 68% to 60% between 2002 and 2003, due mainly to steep rises in
world prices for a number of commodities. At the same time, the agricultural budget
increased by 6.3%. Deregulation of farmland ownership has continued as has reform of the
rice market. Korea is also investing in improving the production infrastructure. Policy
measures for rural development were backed by new legislation in 2003.
Overall, despite liberalization measures in the beef market and policy initiatives to
reduce direct market support, further efforts are needed to substantially decrease the
support level and bring about a shift to less trade distorting forms of support. Some key
commodities, including rice, remain isolated from international market signals, and
consumers bear the related costs.
● Support to producers (% PSE) has fallen from 70%in 1986-88 to 64% in 2001-2003, but it is still doublethe OECD average. The reduction is mainly due tothe gradual decrease in price support. The supportlevel varies widely across commodities, from 19%for eggs to 74% for rice, and 89% for oilseeds.
● The share of market price support has fallenfrom 99% in 1986-88 to 93% in 2001-03. Pricesreceived by farmers in 1986-88 were 236% higherthan those received in the world market in thesame year. By 2001-03 the gap had decreased to167%.
● Payments based on area, on input use and onoverall farm income now each account for 3% ofthe PSE. Almost all area payments are contingenton the respect of environment-friendly farmingpractices.
● The tax on consumers, as measured by the % CSEhas fallen from 66% in 1986-88 to 62% in 2001-2003.Consumers still paid on average two and a halftimes the world price for agricultural commoditiesin 2001-03.
● Support provided to general services foragriculture has increased slightly between 1986-88and 2001-03, from 8% to 14% of the TSE. Totalsupport to agriculture is 4.3% of GDP, down byhalf since 1986-88.
Producer Support Estimate (PSE)Level and composition over time...
... by commodity, 2001-03 average
... and reform progress
% of gross farm receipts80
30
0
1986
1987
1988
1989
1990
1991
1992
1993
1994
1995
1996
1997
1998
1999
2000
2001
2003
2002
Payments based on input constraints, income, etc.
Payments based on area planted/animal numbersMPS, payments based on output and input use
Payments based on historical entitlements
2010
40506070
0% of gross farm receipts
20 40 10010 30 50 7060 80 90
Oilseeds
Rice
Other grains
Beef and veal
Milk
All commodities
Other commodities
Poultry
Pigmeat
Eggs
1986-882001-03
80%
60%
40%
20%
0%Commodity spread(variation in PSEs
betweencommodities)
Composition(MPS, paymentsbased on outputand input use)
Level(PSE)
OECD AGRICULTURAL POLICIES 2004: AT A GLANCE – ISBN 92-64-01603-1 – © OECD 200456
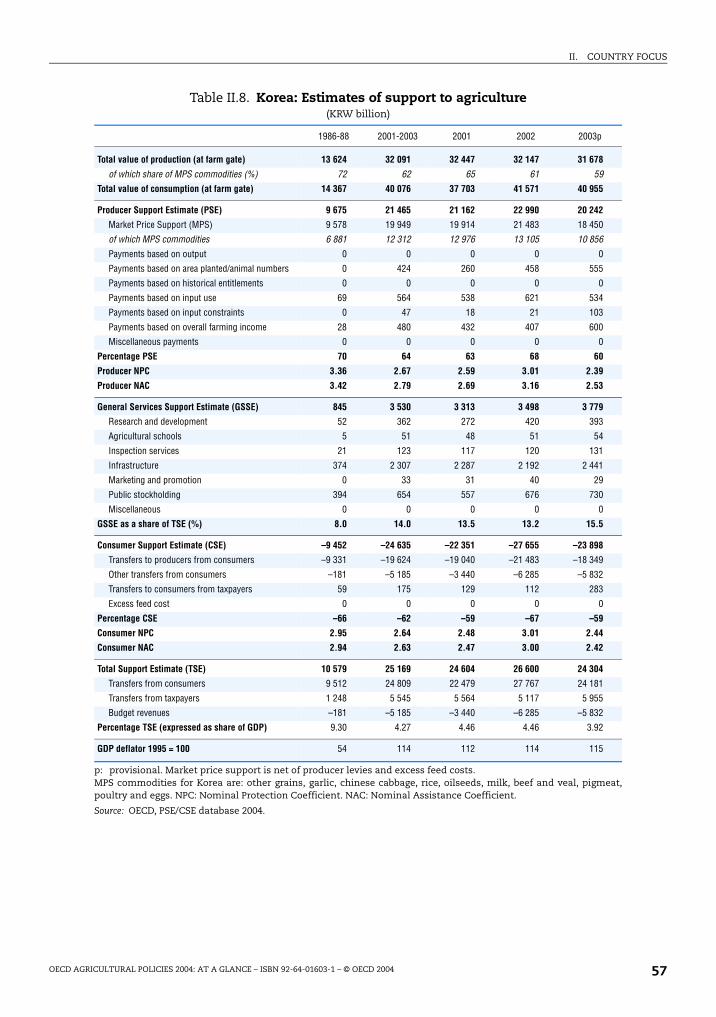
II. COUNTRY FOCUS
Table II.8. Korea: Estimates of support to agriculture(KRW billion)
p: provisional. Market price support is net of producer levies and excess feed costs. MPS commodities for Korea are: other grains, garlic, chinese cabbage, rice, oilseeds, milk, beef and veal, pigmeat,poultry and eggs. NPC: Nominal Protection Coefficient. NAC: Nominal Assistance Coefficient.
Source: OECD, PSE/CSE database 2004.
1986-88 2001-2003 2001 2002 2003p
Total value of production (at farm gate) 13 624 32 091 32 447 32 147 31 678
of which share of MPS commodities (%) 72 62 65 61 59
Total value of consumption (at farm gate) 14 367 40 076 37 703 41 571 40 955
Producer Support Estimate (PSE) 9 675 21 465 21 162 22 990 20 242
Market Price Support (MPS) 9 578 19 949 19 914 21 483 18 450
of which MPS commodities 6 881 12 312 12 976 13 105 10 856
Payments based on output 0 0 0 0 0
Payments based on area planted/animal numbers 0 424 260 458 555
Payments based on historical entitlements 0 0 0 0 0
Payments based on input use 69 564 538 621 534
Payments based on input constraints 0 47 18 21 103
Payments based on overall farming income 28 480 432 407 600
Miscellaneous payments 0 0 0 0 0
Percentage PSE 70 64 63 68 60
Producer NPC 3.36 2.67 2.59 3.01 2.39
Producer NAC 3.42 2.79 2.69 3.16 2.53
General Services Support Estimate (GSSE) 845 3 530 3 313 3 498 3 779
Research and development 52 362 272 420 393
Agricultural schools 5 51 48 51 54
Inspection services 21 123 117 120 131
Infrastructure 374 2 307 2 287 2 192 2 441
Marketing and promotion 0 33 31 40 29
Public stockholding 394 654 557 676 730
Miscellaneous 0 0 0 0 0
GSSE as a share of TSE (%) 8.0 14.0 13.5 13.2 15.5
Consumer Support Estimate (CSE) –9 452 –24 635 –22 351 –27 655 –23 898
Transfers to producers from consumers –9 331 –19 624 –19 040 –21 483 –18 349
Other transfers from consumers –181 –5 185 –3 440 –6 285 –5 832
Transfers to consumers from taxpayers 59 175 129 112 283
Excess feed cost 0 0 0 0 0
Percentage CSE –66 –62 –59 –67 –59
Consumer NPC 2.95 2.64 2.48 3.01 2.44
Consumer NAC 2.94 2.63 2.47 3.00 2.42
Total Support Estimate (TSE) 10 579 25 169 24 604 26 600 24 304
Transfers from consumers 9 512 24 809 22 479 27 767 24 181
Transfers from taxpayers 1 248 5 545 5 564 5 117 5 955
Budget revenues –181 –5 185 –3 440 –6 285 –5 832
Percentage TSE (expressed as share of GDP) 9.30 4.27 4.46 4.46 3.92
GDP deflator 1995 = 100 54 114 112 114 115
OECD AGRICULTURAL POLICIES 2004: AT A GLANCE – ISBN 92-64-01603-1 – © OECD 2004 57
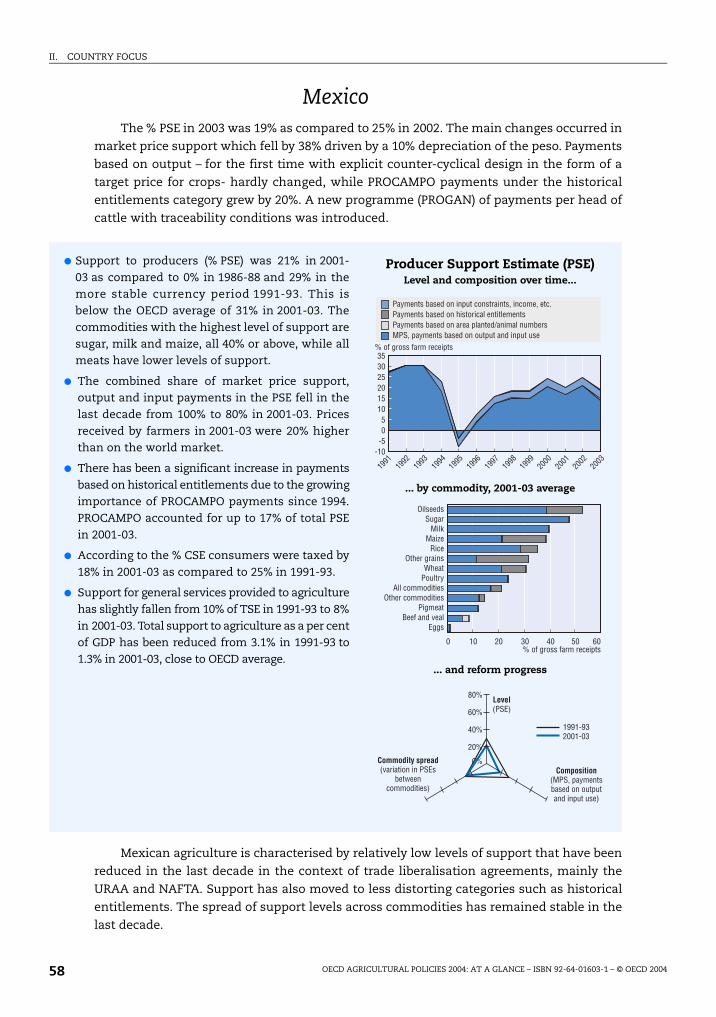
II. COUNTRY FOCUS
MexicoThe % PSE in 2003 was 19% as compared to 25% in 2002. The main changes occurred in
market price support which fell by 38% driven by a 10% depreciation of the peso. Payments
based on output – for the first time with explicit counter-cyclical design in the form of a
target price for crops- hardly changed, while PROCAMPO payments under the historical
entitlements category grew by 20%. A new programme (PROGAN) of payments per head of
cattle with traceability conditions was introduced.
Mexican agriculture is characterised by relatively low levels of support that have been
reduced in the last decade in the context of trade liberalisation agreements, mainly the
URAA and NAFTA. Support has also moved to less distorting categories such as historical
entitlements. The spread of support levels across commodities has remained stable in the
last decade.
● Support to producers (% PSE) was 21% in 2001-03 as compared to 0% in 1986-88 and 29% in themore stable currency period 1991-93. This isbelow the OECD average of 31% in 2001-03. Thecommodities with the highest level of support aresugar, milk and maize, all 40% or above, while allmeats have lower levels of support.
● The combined share of market price support,output and input payments in the PSE fell in thelast decade from 100% to 80% in 2001-03. Pricesreceived by farmers in 2001-03 were 20% higherthan on the world market.
● There has been a significant increase in paymentsbased on historical entitlements due to the growingimportance of PROCAMPO payments since 1994.PROCAMPO accounted for up to 17% of total PSEin 2001-03.
● According to the % CSE consumers were taxed by18% in 2001-03 as compared to 25% in 1991-93.
● Support for general services provided to agriculturehas slightly fallen from 10% of TSE in 1991-93 to 8%in 2001-03. Total support to agriculture as a per centof GDP has been reduced from 3.1% in 1991-93 to1.3% in 2001-03, close to OECD average.
Producer Support Estimate (PSE)Level and composition over time...
... by commodity, 2001-03 average
... and reform progress
% of gross farm receipts353025
-10
1991
1992
1993
1994
1995
1996
1997
1998
1999
2000
2001
2003
2002
1520
1050
-5
Payments based on input constraints, income, etc.
Payments based on area planted/animal numbersMPS, payments based on output and input use
Payments based on historical entitlements
0% of gross farm receipts
20 40 6010 30 50
OilseedsSugar
MilkMaize
RiceOther grains
WheatPoultry
All commoditiesOther commodities
PigmeatBeef and veal
Eggs
1991-932001-03
80%
60%
40%
20%
0%Commodity spread(variation in PSEs
betweencommodities)
Composition(MPS, paymentsbased on outputand input use)
Level(PSE)
OECD AGRICULTURAL POLICIES 2004: AT A GLANCE – ISBN 92-64-01603-1 – © OECD 200458
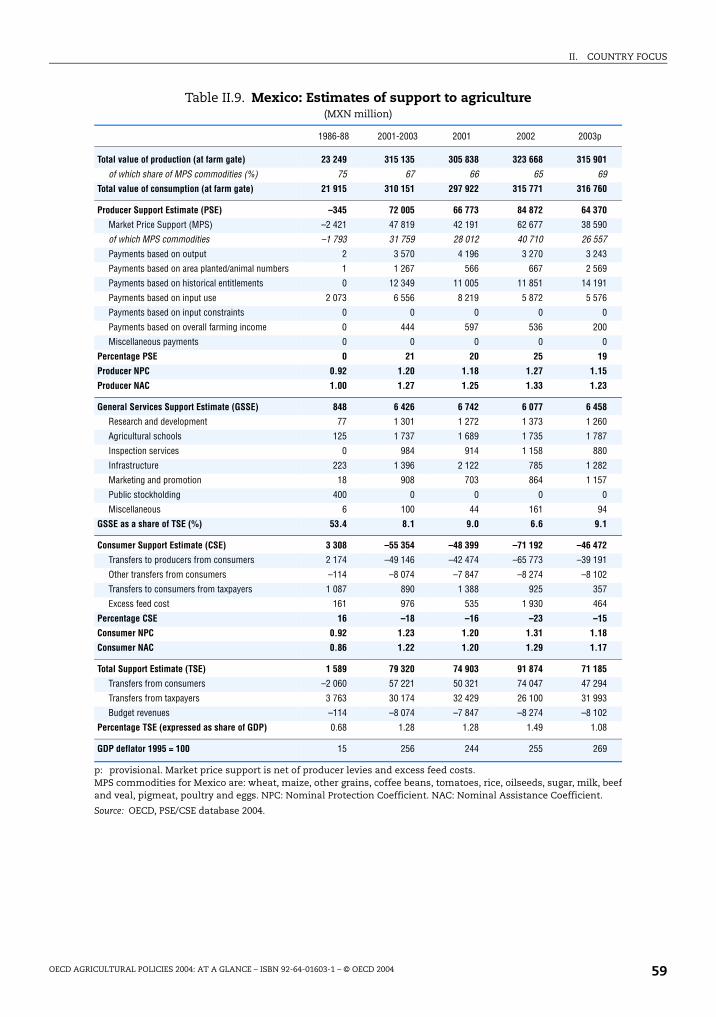
II. COUNTRY FOCUS
Table II.9. Mexico: Estimates of support to agriculture(MXN million)
p: provisional. Market price support is net of producer levies and excess feed costs. MPS commodities for Mexico are: wheat, maize, other grains, coffee beans, tomatoes, rice, oilseeds, sugar, milk, beefand veal, pigmeat, poultry and eggs. NPC: Nominal Protection Coefficient. NAC: Nominal Assistance Coefficient.
Source: OECD, PSE/CSE database 2004.
1986-88 2001-2003 2001 2002 2003p
Total value of production (at farm gate) 23 249 315 135 305 838 323 668 315 901
of which share of MPS commodities (%) 75 67 66 65 69
Total value of consumption (at farm gate) 21 915 310 151 297 922 315 771 316 760
Producer Support Estimate (PSE) –345 72 005 66 773 84 872 64 370
Market Price Support (MPS) –2 421 47 819 42 191 62 677 38 590
of which MPS commodities –1 793 31 759 28 012 40 710 26 557
Payments based on output 2 3 570 4 196 3 270 3 243
Payments based on area planted/animal numbers 1 1 267 566 667 2 569
Payments based on historical entitlements 0 12 349 11 005 11 851 14 191
Payments based on input use 2 073 6 556 8 219 5 872 5 576
Payments based on input constraints 0 0 0 0 0
Payments based on overall farming income 0 444 597 536 200
Miscellaneous payments 0 0 0 0 0
Percentage PSE 0 21 20 25 19
Producer NPC 0.92 1.20 1.18 1.27 1.15
Producer NAC 1.00 1.27 1.25 1.33 1.23
General Services Support Estimate (GSSE) 848 6 426 6 742 6 077 6 458
Research and development 77 1 301 1 272 1 373 1 260
Agricultural schools 125 1 737 1 689 1 735 1 787
Inspection services 0 984 914 1 158 880
Infrastructure 223 1 396 2 122 785 1 282
Marketing and promotion 18 908 703 864 1 157
Public stockholding 400 0 0 0 0
Miscellaneous 6 100 44 161 94
GSSE as a share of TSE (%) 53.4 8.1 9.0 6.6 9.1
Consumer Support Estimate (CSE) 3 308 –55 354 –48 399 –71 192 –46 472
Transfers to producers from consumers 2 174 –49 146 –42 474 –65 773 –39 191
Other transfers from consumers –114 –8 074 –7 847 –8 274 –8 102
Transfers to consumers from taxpayers 1 087 890 1 388 925 357
Excess feed cost 161 976 535 1 930 464
Percentage CSE 16 –18 –16 –23 –15
Consumer NPC 0.92 1.23 1.20 1.31 1.18
Consumer NAC 0.86 1.22 1.20 1.29 1.17
Total Support Estimate (TSE) 1 589 79 320 74 903 91 874 71 185
Transfers from consumers –2 060 57 221 50 321 74 047 47 294
Transfers from taxpayers 3 763 30 174 32 429 26 100 31 993
Budget revenues –114 –8 074 –7 847 –8 274 –8 102
Percentage TSE (expressed as share of GDP) 0.68 1.28 1.28 1.49 1.08
GDP deflator 1995 = 100 15 256 244 255 269
OECD AGRICULTURAL POLICIES 2004: AT A GLANCE – ISBN 92-64-01603-1 – © OECD 2004 59
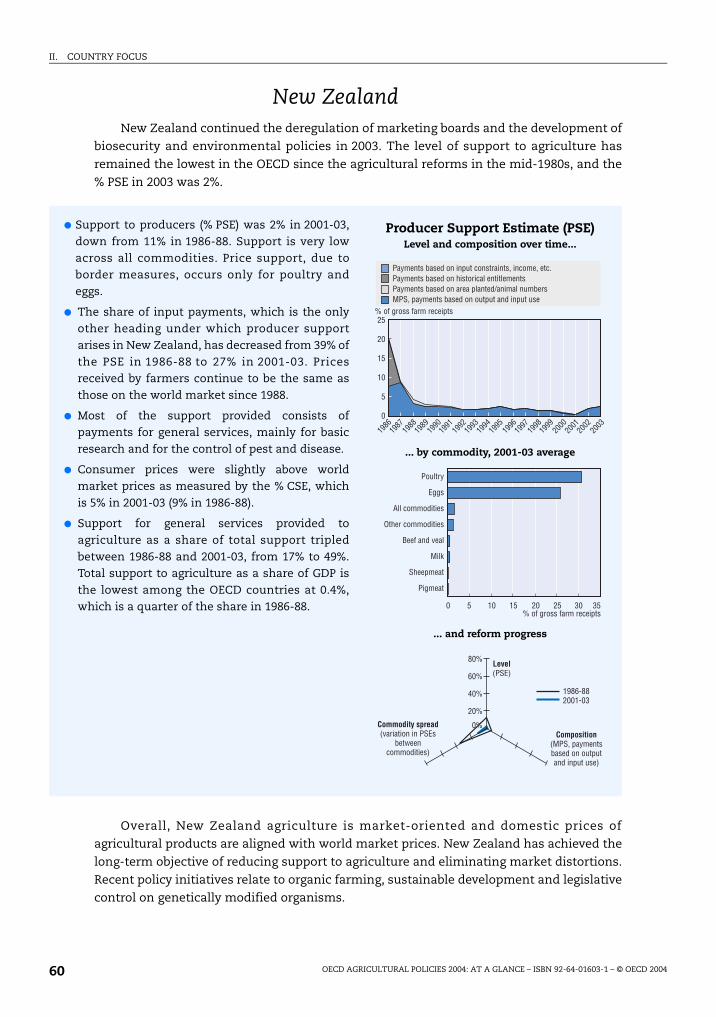
II. COUNTRY FOCUS
New ZealandNew Zealand continued the deregulation of marketing boards and the development of
biosecurity and environmental policies in 2003. The level of support to agriculture has
remained the lowest in the OECD since the agricultural reforms in the mid-1980s, and the
% PSE in 2003 was 2%.
Overall, New Zealand agriculture is market-oriented and domestic prices of
agricultural products are aligned with world market prices. New Zealand has achieved the
long-term objective of reducing support to agriculture and eliminating market distortions.
Recent policy initiatives relate to organic farming, sustainable development and legislative
control on genetically modified organisms.
● Support to producers (% PSE) was 2% in 2001-03,down from 11% in 1986-88. Support is very lowacross all commodities. Price support, due toborder measures, occurs only for poultry andeggs.
● The share of input payments, which is the onlyother heading under which producer supportarises in New Zealand, has decreased from 39% ofthe PSE in 1986-88 to 27% in 2001-03. Pricesreceived by farmers continue to be the same asthose on the world market since 1988.
● Most of the support provided consists ofpayments for general services, mainly for basicresearch and for the control of pest and disease.
● Consumer prices were slightly above worldmarket prices as measured by the % CSE, whichis 5% in 2001-03 (9% in 1986-88).
● Support for general services provided toagriculture as a share of total support tripledbetween 1986-88 and 2001-03, from 17% to 49%.Total support to agriculture as a share of GDP isthe lowest among the OECD countries at 0.4%,which is a quarter of the share in 1986-88.
Producer Support Estimate (PSE)Level and composition over time...
... by commodity, 2001-03 average
... and reform progress
% of gross farm receipts25
0
1986
1987
1988
1989
1990
1991
1992
1993
1994
1995
1996
1997
1998
1999
2000
2001
2003
2002
Payments based on input constraints, income, etc.
Payments based on area planted/animal numbersMPS, payments based on output and input use
Payments based on historical entitlements
20
10
15
5
0% of gross farm receipts
10 25 355 20 3015
Poultry
Eggs
All commodities
Other commodities
Beef and veal
Milk
Sheepmeat
Pigmeat
1986-882001-03
80%
60%
40%
20%
0%Commodity spread(variation in PSEs
betweencommodities)
Composition(MPS, paymentsbased on outputand input use)
Level(PSE)
OECD AGRICULTURAL POLICIES 2004: AT A GLANCE – ISBN 92-64-01603-1 – © OECD 200460
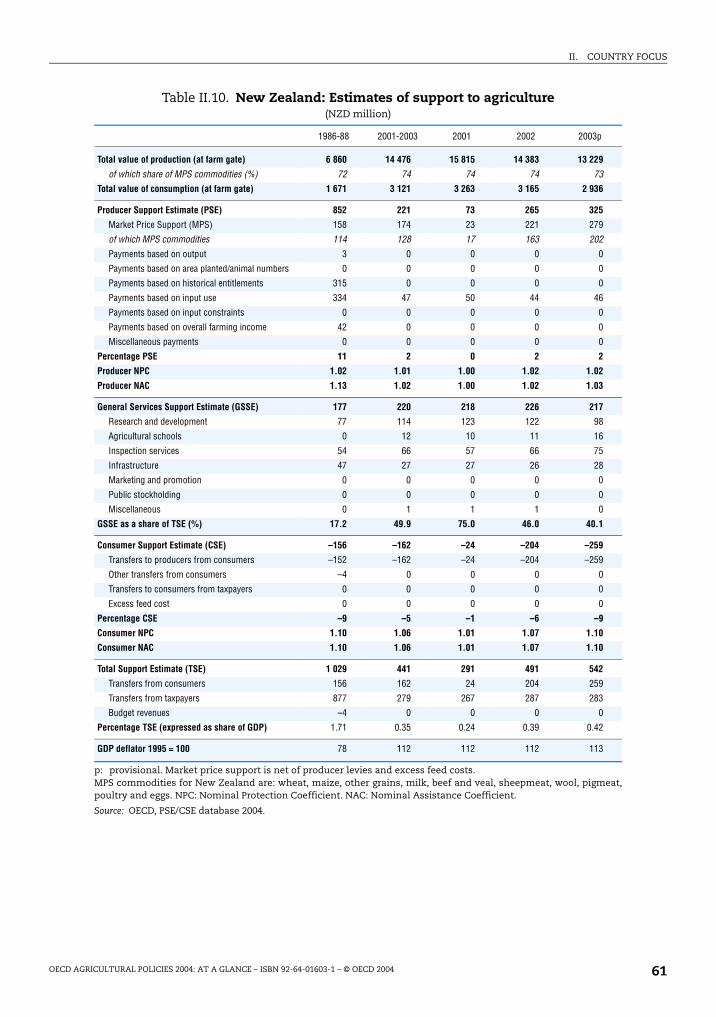
II. COUNTRY FOCUS
Table II.10. New Zealand: Estimates of support to agriculture(NZD million)
p: provisional. Market price support is net of producer levies and excess feed costs. MPS commodities for New Zealand are: wheat, maize, other grains, milk, beef and veal, sheepmeat, wool, pigmeat,poultry and eggs. NPC: Nominal Protection Coefficient. NAC: Nominal Assistance Coefficient.
Source: OECD, PSE/CSE database 2004.
1986-88 2001-2003 2001 2002 2003p
Total value of production (at farm gate) 6 860 14 476 15 815 14 383 13 229
of which share of MPS commodities (%) 72 74 74 74 73
Total value of consumption (at farm gate) 1 671 3 121 3 263 3 165 2 936
Producer Support Estimate (PSE) 852 221 73 265 325
Market Price Support (MPS) 158 174 23 221 279
of which MPS commodities 114 128 17 163 202
Payments based on output 3 0 0 0 0
Payments based on area planted/animal numbers 0 0 0 0 0
Payments based on historical entitlements 315 0 0 0 0
Payments based on input use 334 47 50 44 46
Payments based on input constraints 0 0 0 0 0
Payments based on overall farming income 42 0 0 0 0
Miscellaneous payments 0 0 0 0 0
Percentage PSE 11 2 0 2 2
Producer NPC 1.02 1.01 1.00 1.02 1.02
Producer NAC 1.13 1.02 1.00 1.02 1.03
General Services Support Estimate (GSSE) 177 220 218 226 217
Research and development 77 114 123 122 98
Agricultural schools 0 12 10 11 16
Inspection services 54 66 57 66 75
Infrastructure 47 27 27 26 28
Marketing and promotion 0 0 0 0 0
Public stockholding 0 0 0 0 0
Miscellaneous 0 1 1 1 0
GSSE as a share of TSE (%) 17.2 49.9 75.0 46.0 40.1
Consumer Support Estimate (CSE) –156 –162 –24 –204 –259
Transfers to producers from consumers –152 –162 –24 –204 –259
Other transfers from consumers –4 0 0 0 0
Transfers to consumers from taxpayers 0 0 0 0 0
Excess feed cost 0 0 0 0 0
Percentage CSE –9 –5 –1 –6 –9
Consumer NPC 1.10 1.06 1.01 1.07 1.10
Consumer NAC 1.10 1.06 1.01 1.07 1.10
Total Support Estimate (TSE) 1 029 441 291 491 542
Transfers from consumers 156 162 24 204 259
Transfers from taxpayers 877 279 267 287 283
Budget revenues –4 0 0 0 0
Percentage TSE (expressed as share of GDP) 1.71 0.35 0.24 0.39 0.42
GDP deflator 1995 = 100 78 112 112 112 113
OECD AGRICULTURAL POLICIES 2004: AT A GLANCE – ISBN 92-64-01603-1 – © OECD 2004 61
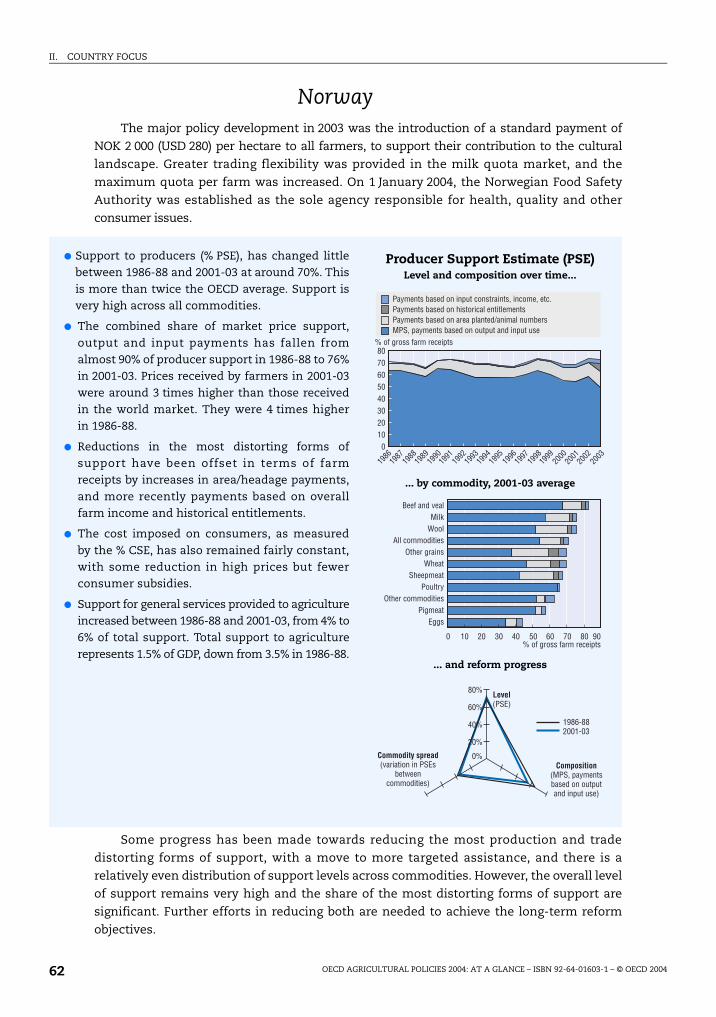
II. COUNTRY FOCUS
NorwayThe major policy development in 2003 was the introduction of a standard payment of
NOK 2 000 (USD 280) per hectare to all farmers, to support their contribution to the cultural
landscape. Greater trading flexibility was provided in the milk quota market, and the
maximum quota per farm was increased. On 1 January 2004, the Norwegian Food Safety
Authority was established as the sole agency responsible for health, quality and other
consumer issues.
Some progress has been made towards reducing the most production and trade
distorting forms of support, with a move to more targeted assistance, and there is a
relatively even distribution of support levels across commodities. However, the overall level
of support remains very high and the share of the most distorting forms of support are
significant. Further efforts in reducing both are needed to achieve the long-term reform
objectives.
● Support to producers (% PSE), has changed littlebetween 1986-88 and 2001-03 at around 70%. Thisis more than twice the OECD average. Support isvery high across all commodities.
● The combined share of market price support,output and input payments has fallen fromalmost 90% of producer support in 1986-88 to 76%in 2001-03. Prices received by farmers in 2001-03were around 3 times higher than those receivedin the world market. They were 4 times higherin 1986-88.
● Reductions in the most distorting forms ofsupport have been offset in terms of farmreceipts by increases in area/headage payments,and more recently payments based on overallfarm income and historical entitlements.
● The cost imposed on consumers, as measuredby the % CSE, has also remained fairly constant,with some reduction in high prices but fewerconsumer subsidies.
● Support for general services provided to agricultureincreased between 1986-88 and 2001-03, from 4% to6% of total support. Total support to agriculturerepresents 1.5% of GDP, down from 3.5% in 1986-88.
Producer Support Estimate (PSE)Level and composition over time...
... by commodity, 2001-03 average
... and reform progress
% of gross farm receipts80
30
0
1986
1987
1988
1989
1990
1991
1992
1993
1994
1995
1996
1997
1998
1999
2000
2001
2003
2002
Payments based on input constraints, income, etc.
Payments based on area planted/animal numbersMPS, payments based on output and input use
Payments based on historical entitlements
2010
40506070
0% of gross farm receipts
20 40 9010 30 50 60 70 80
Beef and vealMilk
WoolAll commodities
Other grainsWheat
SheepmeatPoultry
Other commoditiesPigmeat
Eggs
1986-882001-03
80%
60%
40%
20%
0%Commodity spread(variation in PSEs
betweencommodities)
Composition(MPS, paymentsbased on outputand input use)
Level(PSE)
OECD AGRICULTURAL POLICIES 2004: AT A GLANCE – ISBN 92-64-01603-1 – © OECD 200462
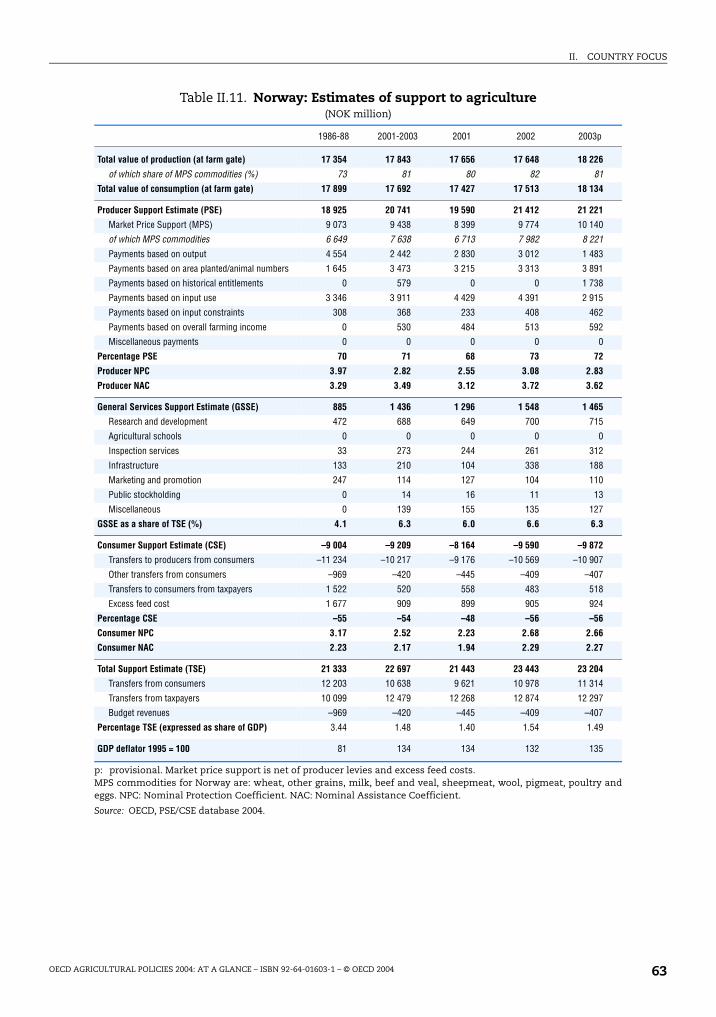
II. COUNTRY FOCUS
Table II.11. Norway: Estimates of support to agriculture(NOK million)
p: provisional. Market price support is net of producer levies and excess feed costs. MPS commodities for Norway are: wheat, other grains, milk, beef and veal, sheepmeat, wool, pigmeat, poultry andeggs. NPC: Nominal Protection Coefficient. NAC: Nominal Assistance Coefficient.
Source: OECD, PSE/CSE database 2004.
1986-88 2001-2003 2001 2002 2003p
Total value of production (at farm gate) 17 354 17 843 17 656 17 648 18 226
of which share of MPS commodities (%) 73 81 80 82 81
Total value of consumption (at farm gate) 17 899 17 692 17 427 17 513 18 134
Producer Support Estimate (PSE) 18 925 20 741 19 590 21 412 21 221
Market Price Support (MPS) 9 073 9 438 8 399 9 774 10 140
of which MPS commodities 6 649 7 638 6 713 7 982 8 221
Payments based on output 4 554 2 442 2 830 3 012 1 483
Payments based on area planted/animal numbers 1 645 3 473 3 215 3 313 3 891
Payments based on historical entitlements 0 579 0 0 1 738
Payments based on input use 3 346 3 911 4 429 4 391 2 915
Payments based on input constraints 308 368 233 408 462
Payments based on overall farming income 0 530 484 513 592
Miscellaneous payments 0 0 0 0 0
Percentage PSE 70 71 68 73 72
Producer NPC 3.97 2.82 2.55 3.08 2.83
Producer NAC 3.29 3.49 3.12 3.72 3.62
General Services Support Estimate (GSSE) 885 1 436 1 296 1 548 1 465
Research and development 472 688 649 700 715
Agricultural schools 0 0 0 0 0
Inspection services 33 273 244 261 312
Infrastructure 133 210 104 338 188
Marketing and promotion 247 114 127 104 110
Public stockholding 0 14 16 11 13
Miscellaneous 0 139 155 135 127
GSSE as a share of TSE (%) 4.1 6.3 6.0 6.6 6.3
Consumer Support Estimate (CSE) –9 004 –9 209 –8 164 –9 590 –9 872
Transfers to producers from consumers –11 234 –10 217 –9 176 –10 569 –10 907
Other transfers from consumers –969 –420 –445 –409 –407
Transfers to consumers from taxpayers 1 522 520 558 483 518
Excess feed cost 1 677 909 899 905 924
Percentage CSE –55 –54 –48 –56 –56
Consumer NPC 3.17 2.52 2.23 2.68 2.66
Consumer NAC 2.23 2.17 1.94 2.29 2.27
Total Support Estimate (TSE) 21 333 22 697 21 443 23 443 23 204
Transfers from consumers 12 203 10 638 9 621 10 978 11 314
Transfers from taxpayers 10 099 12 479 12 268 12 874 12 297
Budget revenues –969 –420 –445 –409 –407
Percentage TSE (expressed as share of GDP) 3.44 1.48 1.40 1.54 1.49
GDP deflator 1995 = 100 81 134 134 132 135
OECD AGRICULTURAL POLICIES 2004: AT A GLANCE – ISBN 92-64-01603-1 – © OECD 2004 63
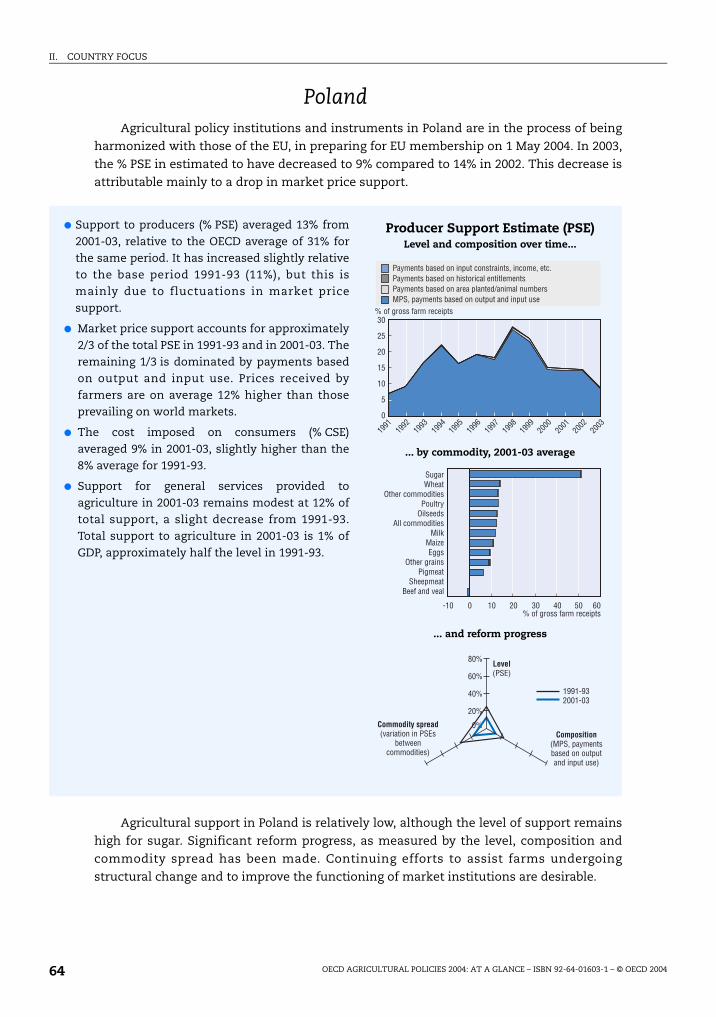
II. COUNTRY FOCUS
PolandAgricultural policy institutions and instruments in Poland are in the process of being
harmonized with those of the EU, in preparing for EU membership on 1 May 2004. In 2003,
the % PSE in estimated to have decreased to 9% compared to 14% in 2002. This decrease is
attributable mainly to a drop in market price support.
Agricultural support in Poland is relatively low, although the level of support remains
high for sugar. Significant reform progress, as measured by the level, composition and
commodity spread has been made. Continuing efforts to assist farms undergoing
structural change and to improve the functioning of market institutions are desirable.
● Support to producers (% PSE) averaged 13% from2001-03, relative to the OECD average of 31% forthe same period. It has increased slightly relativeto the base period 1991-93 (11%), but this ismainly due to fluctuations in market pricesupport.
● Market price support accounts for approximately2/3 of the total PSE in 1991-93 and in 2001-03. Theremaining 1/3 is dominated by payments basedon output and input use. Prices received byfarmers are on average 12% higher than thoseprevailing on world markets.
● The cost imposed on consumers (% CSE)averaged 9% in 2001-03, slightly higher than the8% average for 1991-93.
● Support for general services provided toagriculture in 2001-03 remains modest at 12% oftotal support, a slight decrease from 1991-93.Total support to agriculture in 2001-03 is 1% ofGDP, approximately half the level in 1991-93.
Producer Support Estimate (PSE)Level and composition over time...
... by commodity, 2001-03 average
... and reform progress
% of gross farm receipts30
25
1991
1992
1993
1994
1995
1996
1997
1998
1999
2000
2001
2003
2002
15
20
10
5
0
Payments based on input constraints, income, etc.
Payments based on area planted/animal numbersMPS, payments based on output and input use
Payments based on historical entitlements
-10% of gross farm receipts
10 40 600 30 5020
SugarWheat
Other commoditiesPoultry
OilseedsAll commodities
MilkMaizeEggs
Other grainsPigmeat
SheepmeatBeef and veal
1991-932001-03
80%
60%
40%
20%
0%Commodity spread(variation in PSEs
betweencommodities)
Composition(MPS, paymentsbased on outputand input use)
Level(PSE)
OECD AGRICULTURAL POLICIES 2004: AT A GLANCE – ISBN 92-64-01603-1 – © OECD 200464
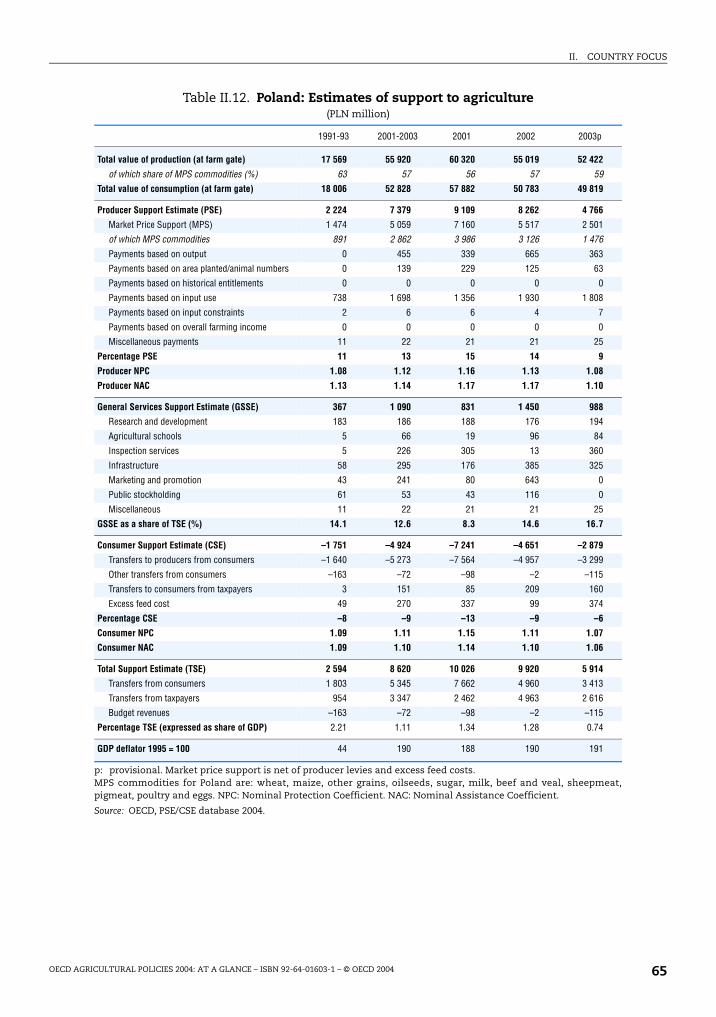
II. COUNTRY FOCUS
Table II.12. Poland: Estimates of support to agriculture(PLN million)
p: provisional. Market price support is net of producer levies and excess feed costs. MPS commodities for Poland are: wheat, maize, other grains, oilseeds, sugar, milk, beef and veal, sheepmeat,pigmeat, poultry and eggs. NPC: Nominal Protection Coefficient. NAC: Nominal Assistance Coefficient.
Source: OECD, PSE/CSE database 2004.
1991-93 2001-2003 2001 2002 2003p
Total value of production (at farm gate) 17 569 55 920 60 320 55 019 52 422
of which share of MPS commodities (%) 63 57 56 57 59
Total value of consumption (at farm gate) 18 006 52 828 57 882 50 783 49 819
Producer Support Estimate (PSE) 2 224 7 379 9 109 8 262 4 766
Market Price Support (MPS) 1 474 5 059 7 160 5 517 2 501
of which MPS commodities 891 2 862 3 986 3 126 1 476
Payments based on output 0 455 339 665 363
Payments based on area planted/animal numbers 0 139 229 125 63
Payments based on historical entitlements 0 0 0 0 0
Payments based on input use 738 1 698 1 356 1 930 1 808
Payments based on input constraints 2 6 6 4 7
Payments based on overall farming income 0 0 0 0 0
Miscellaneous payments 11 22 21 21 25
Percentage PSE 11 13 15 14 9
Producer NPC 1.08 1.12 1.16 1.13 1.08
Producer NAC 1.13 1.14 1.17 1.17 1.10
General Services Support Estimate (GSSE) 367 1 090 831 1 450 988
Research and development 183 186 188 176 194
Agricultural schools 5 66 19 96 84
Inspection services 5 226 305 13 360
Infrastructure 58 295 176 385 325
Marketing and promotion 43 241 80 643 0
Public stockholding 61 53 43 116 0
Miscellaneous 11 22 21 21 25
GSSE as a share of TSE (%) 14.1 12.6 8.3 14.6 16.7
Consumer Support Estimate (CSE) –1 751 –4 924 –7 241 –4 651 –2 879
Transfers to producers from consumers –1 640 –5 273 –7 564 –4 957 –3 299
Other transfers from consumers –163 –72 –98 –2 –115
Transfers to consumers from taxpayers 3 151 85 209 160
Excess feed cost 49 270 337 99 374
Percentage CSE –8 –9 –13 –9 –6
Consumer NPC 1.09 1.11 1.15 1.11 1.07
Consumer NAC 1.09 1.10 1.14 1.10 1.06
Total Support Estimate (TSE) 2 594 8 620 10 026 9 920 5 914
Transfers from consumers 1 803 5 345 7 662 4 960 3 413
Transfers from taxpayers 954 3 347 2 462 4 963 2 616
Budget revenues –163 –72 –98 –2 –115
Percentage TSE (expressed as share of GDP) 2.21 1.11 1.34 1.28 0.74
GDP deflator 1995 = 100 44 190 188 190 191
OECD AGRICULTURAL POLICIES 2004: AT A GLANCE – ISBN 92-64-01603-1 – © OECD 2004 65
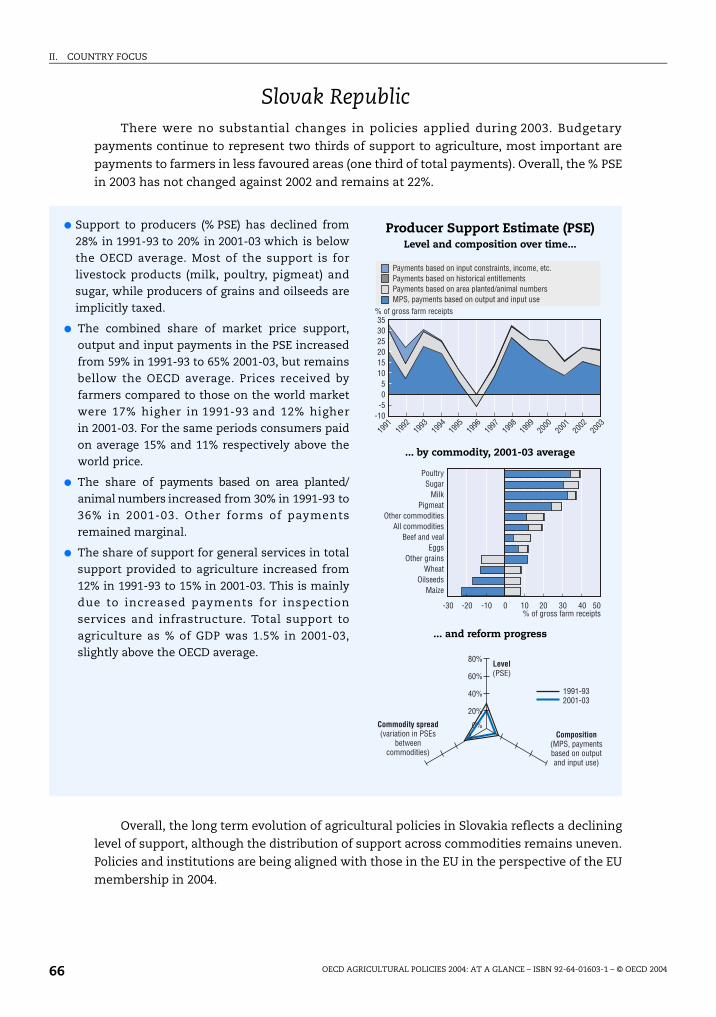
II. COUNTRY FOCUS
Slovak RepublicThere were no substantial changes in policies applied during 2003. Budgetary
payments continue to represent two thirds of support to agriculture, most important are
payments to farmers in less favoured areas (one third of total payments). Overall, the % PSE
in 2003 has not changed against 2002 and remains at 22%.
Overall, the long term evolution of agricultural policies in Slovakia reflects a declining
level of support, although the distribution of support across commodities remains uneven.
Policies and institutions are being aligned with those in the EU in the perspective of the EU
membership in 2004.
● Support to producers (% PSE) has declined from28% in 1991-93 to 20% in 2001-03 which is belowthe OECD average. Most of the support is forlivestock products (milk, poultry, pigmeat) andsugar, while producers of grains and oilseeds areimplicitly taxed.
● The combined share of market price support,output and input payments in the PSE increasedfrom 59% in 1991-93 to 65% 2001-03, but remainsbellow the OECD average. Prices received byfarmers compared to those on the world marketwere 17% higher in 1991-93 and 12% higherin 2001-03. For the same periods consumers paidon average 15% and 11% respectively above theworld price.
● The share of payments based on area planted/animal numbers increased from 30% in 1991-93 to36% in 2001-03. Other forms of paymentsremained marginal.
● The share of support for general services in totalsupport provided to agriculture increased from12% in 1991-93 to 15% in 2001-03. This is mainlydue to increased payments for inspectionservices and infrastructure. Total support toagriculture as % of GDP was 1.5% in 2001-03,slightly above the OECD average.
Producer Support Estimate (PSE)Level and composition over time...
... by commodity, 2001-03 average
... and reform progress
% of gross farm receipts353025
-10
1991
1992
1993
1994
1995
1996
1997
1998
1999
2000
2001
2003
2002
1520
1050
-5
Payments based on input constraints, income, etc.
Payments based on area planted/animal numbersMPS, payments based on output and input use
Payments based on historical entitlements
-30% of gross farm receipts
20 40 5010 300-20 -10
PoultrySugar
MilkPigmeat
Other commoditiesAll commodities
Beef and vealEggs
Other grainsWheat
OilseedsMaize
1991-932001-03
80%
60%
40%
20%
0%Commodity spread(variation in PSEs
betweencommodities)
Composition(MPS, paymentsbased on outputand input use)
Level(PSE)
OECD AGRICULTURAL POLICIES 2004: AT A GLANCE – ISBN 92-64-01603-1 – © OECD 200466
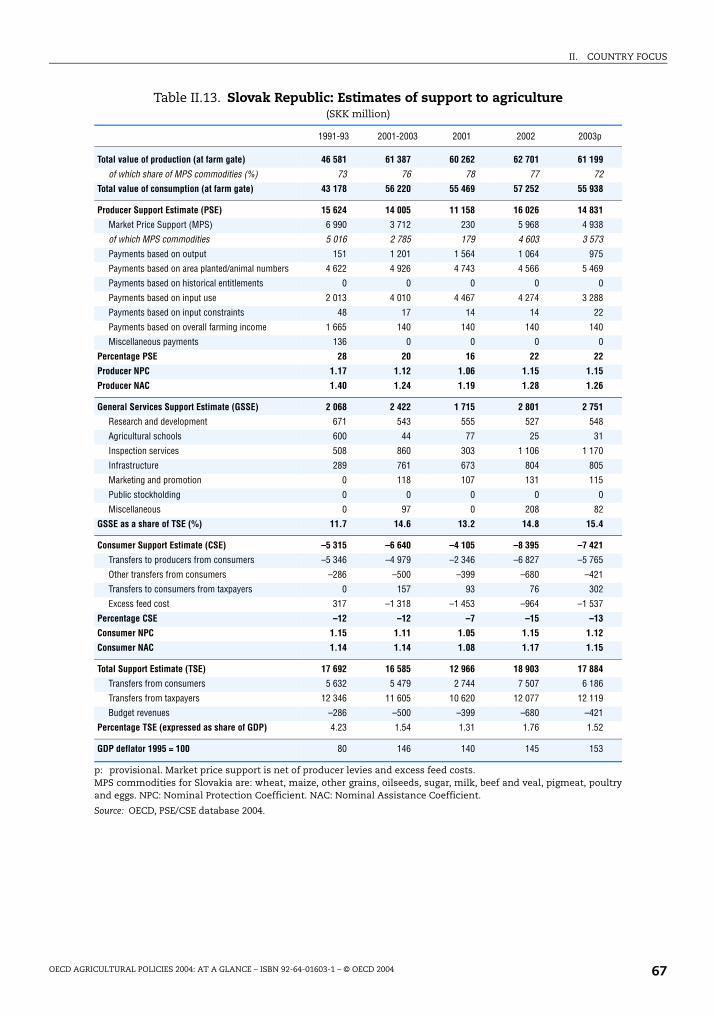
II. COUNTRY FOCUS
Table II.13. Slovak Republic: Estimates of support to agriculture(SKK million)
p: provisional. Market price support is net of producer levies and excess feed costs. MPS commodities for Slovakia are: wheat, maize, other grains, oilseeds, sugar, milk, beef and veal, pigmeat, poultryand eggs. NPC: Nominal Protection Coefficient. NAC: Nominal Assistance Coefficient.
Source: OECD, PSE/CSE database 2004.
1991-93 2001-2003 2001 2002 2003p
Total value of production (at farm gate) 46 581 61 387 60 262 62 701 61 199
of which share of MPS commodities (%) 73 76 78 77 72
Total value of consumption (at farm gate) 43 178 56 220 55 469 57 252 55 938
Producer Support Estimate (PSE) 15 624 14 005 11 158 16 026 14 831
Market Price Support (MPS) 6 990 3 712 230 5 968 4 938
of which MPS commodities 5 016 2 785 179 4 603 3 573
Payments based on output 151 1 201 1 564 1 064 975
Payments based on area planted/animal numbers 4 622 4 926 4 743 4 566 5 469
Payments based on historical entitlements 0 0 0 0 0
Payments based on input use 2 013 4 010 4 467 4 274 3 288
Payments based on input constraints 48 17 14 14 22
Payments based on overall farming income 1 665 140 140 140 140
Miscellaneous payments 136 0 0 0 0
Percentage PSE 28 20 16 22 22
Producer NPC 1.17 1.12 1.06 1.15 1.15
Producer NAC 1.40 1.24 1.19 1.28 1.26
General Services Support Estimate (GSSE) 2 068 2 422 1 715 2 801 2 751
Research and development 671 543 555 527 548
Agricultural schools 600 44 77 25 31
Inspection services 508 860 303 1 106 1 170
Infrastructure 289 761 673 804 805
Marketing and promotion 0 118 107 131 115
Public stockholding 0 0 0 0 0
Miscellaneous 0 97 0 208 82
GSSE as a share of TSE (%) 11.7 14.6 13.2 14.8 15.4
Consumer Support Estimate (CSE) –5 315 –6 640 –4 105 –8 395 –7 421
Transfers to producers from consumers –5 346 –4 979 –2 346 –6 827 –5 765
Other transfers from consumers –286 –500 –399 –680 –421
Transfers to consumers from taxpayers 0 157 93 76 302
Excess feed cost 317 –1 318 –1 453 –964 –1 537
Percentage CSE –12 –12 –7 –15 –13
Consumer NPC 1.15 1.11 1.05 1.15 1.12
Consumer NAC 1.14 1.14 1.08 1.17 1.15
Total Support Estimate (TSE) 17 692 16 585 12 966 18 903 17 884
Transfers from consumers 5 632 5 479 2 744 7 507 6 186
Transfers from taxpayers 12 346 11 605 10 620 12 077 12 119
Budget revenues –286 –500 –399 –680 –421
Percentage TSE (expressed as share of GDP) 4.23 1.54 1.31 1.76 1.52
GDP deflator 1995 = 100 80 146 140 145 153
OECD AGRICULTURAL POLICIES 2004: AT A GLANCE – ISBN 92-64-01603-1 – © OECD 2004 67
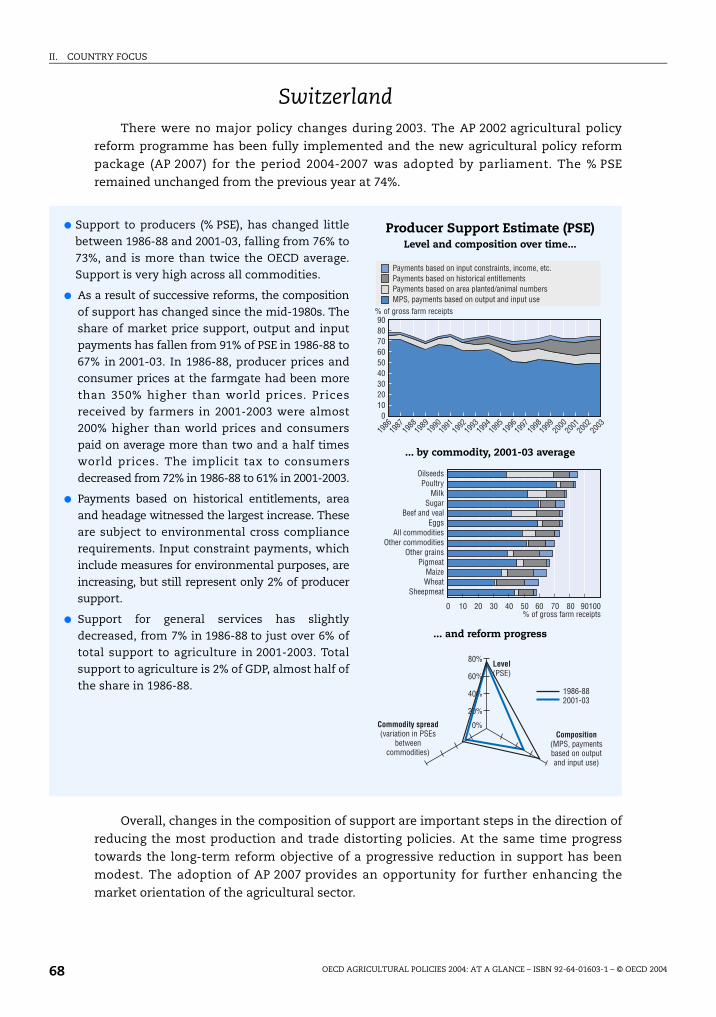
II. COUNTRY FOCUS
SwitzerlandThere were no major policy changes during 2003. The AP 2002 agricultural policy
reform programme has been fully implemented and the new agricultural policy reform
package (AP 2007) for the period 2004-2007 was adopted by parliament. The % PSE
remained unchanged from the previous year at 74%.
Overall, changes in the composition of support are important steps in the direction of
reducing the most production and trade distorting policies. At the same time progress
towards the long-term reform objective of a progressive reduction in support has been
modest. The adoption of AP 2007 provides an opportunity for further enhancing the
market orientation of the agricultural sector.
● Support to producers (% PSE), has changed littlebetween 1986-88 and 2001-03, falling from 76% to73%, and is more than twice the OECD average.Support is very high across all commodities.
● As a result of successive reforms, the compositionof support has changed since the mid-1980s. Theshare of market price support, output and inputpayments has fallen from 91% of PSE in 1986-88 to67% in 2001-03. In 1986-88, producer prices andconsumer prices at the farmgate had been morethan 350% higher than world prices. Pricesreceived by farmers in 2001-2003 were almost200% higher than world prices and consumerspaid on average more than two and a half timesworld prices. The implicit tax to consumersdecreased from 72% in 1986-88 to 61% in 2001-2003.
● Payments based on historical entitlements, areaand headage witnessed the largest increase. Theseare subject to environmental cross compliancerequirements. Input constraint payments, whichinclude measures for environmental purposes, areincreasing, but still represent only 2% of producersupport.
● Support for general services has slightlydecreased, from 7% in 1986-88 to just over 6% oftotal support to agriculture in 2001-2003. Totalsupport to agriculture is 2% of GDP, almost half ofthe share in 1986-88.
Producer Support Estimate (PSE)Level and composition over time...
... by commodity, 2001-03 average
... and reform progress
% of gross farm receipts90
30
0
1986
1987
1988
1989
1990
1991
1992
1993
1994
1995
1996
1997
1998
1999
2000
2001
2003
2002
Payments based on input constraints, income, etc.
Payments based on area planted/animal numbersMPS, payments based on output and input use
Payments based on historical entitlements
2010
4050607080
0% of gross farm receipts
20 40 10010 30 50 7060 80 90
OilseedsPoultry
MilkSugar
Beef and vealEggs
All commoditiesOther commodities
Other grainsPigmeat
MaizeWheat
Sheepmeat
1986-882001-03
80%
60%
40%
20%
0%Commodity spread(variation in PSEs
betweencommodities)
Composition(MPS, paymentsbased on outputand input use)
Level(PSE)
OECD AGRICULTURAL POLICIES 2004: AT A GLANCE – ISBN 92-64-01603-1 – © OECD 200468
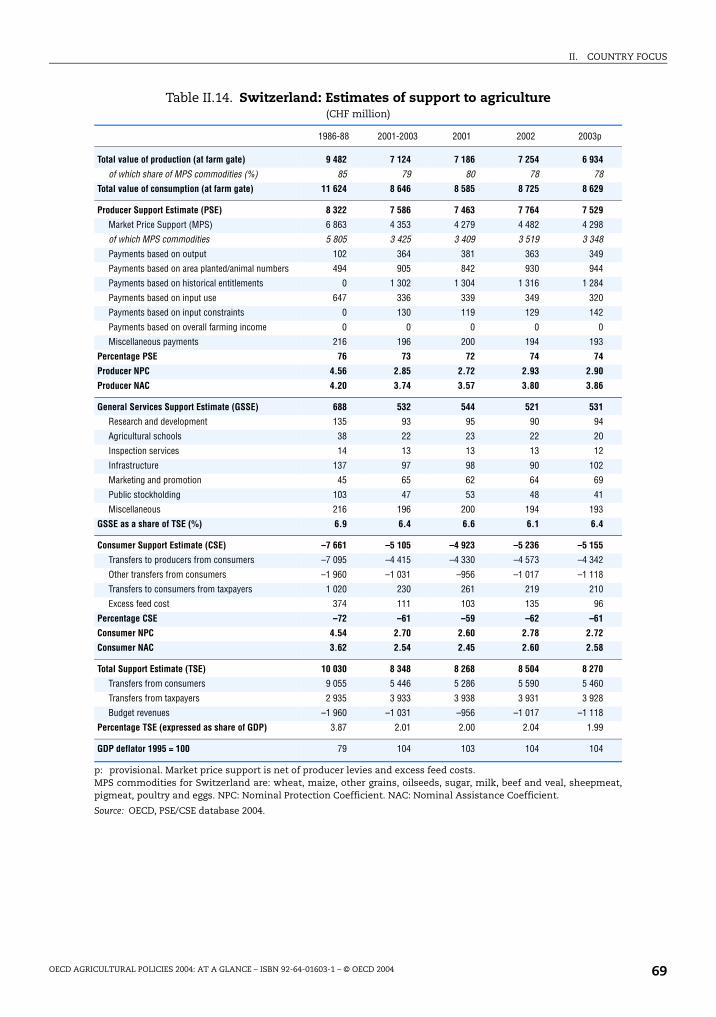
II. COUNTRY FOCUS
Table II.14. Switzerland: Estimates of support to agriculture(CHF million)
p: provisional. Market price support is net of producer levies and excess feed costs. MPS commodities for Switzerland are: wheat, maize, other grains, oilseeds, sugar, milk, beef and veal, sheepmeat,pigmeat, poultry and eggs. NPC: Nominal Protection Coefficient. NAC: Nominal Assistance Coefficient.
Source: OECD, PSE/CSE database 2004.
1986-88 2001-2003 2001 2002 2003p
Total value of production (at farm gate) 9 482 7 124 7 186 7 254 6 934
of which share of MPS commodities (%) 85 79 80 78 78
Total value of consumption (at farm gate) 11 624 8 646 8 585 8 725 8 629
Producer Support Estimate (PSE) 8 322 7 586 7 463 7 764 7 529
Market Price Support (MPS) 6 863 4 353 4 279 4 482 4 298
of which MPS commodities 5 805 3 425 3 409 3 519 3 348
Payments based on output 102 364 381 363 349
Payments based on area planted/animal numbers 494 905 842 930 944
Payments based on historical entitlements 0 1 302 1 304 1 316 1 284
Payments based on input use 647 336 339 349 320
Payments based on input constraints 0 130 119 129 142
Payments based on overall farming income 0 0 0 0 0
Miscellaneous payments 216 196 200 194 193
Percentage PSE 76 73 72 74 74
Producer NPC 4.56 2.85 2.72 2.93 2.90
Producer NAC 4.20 3.74 3.57 3.80 3.86
General Services Support Estimate (GSSE) 688 532 544 521 531
Research and development 135 93 95 90 94
Agricultural schools 38 22 23 22 20
Inspection services 14 13 13 13 12
Infrastructure 137 97 98 90 102
Marketing and promotion 45 65 62 64 69
Public stockholding 103 47 53 48 41
Miscellaneous 216 196 200 194 193
GSSE as a share of TSE (%) 6.9 6.4 6.6 6.1 6.4
Consumer Support Estimate (CSE) –7 661 –5 105 –4 923 –5 236 –5 155
Transfers to producers from consumers –7 095 –4 415 –4 330 –4 573 –4 342
Other transfers from consumers –1 960 –1 031 –956 –1 017 –1 118
Transfers to consumers from taxpayers 1 020 230 261 219 210
Excess feed cost 374 111 103 135 96
Percentage CSE –72 –61 –59 –62 –61
Consumer NPC 4.54 2.70 2.60 2.78 2.72
Consumer NAC 3.62 2.54 2.45 2.60 2.58
Total Support Estimate (TSE) 10 030 8 348 8 268 8 504 8 270
Transfers from consumers 9 055 5 446 5 286 5 590 5 460
Transfers from taxpayers 2 935 3 933 3 938 3 931 3 928
Budget revenues –1 960 –1 031 –956 –1 017 –1 118
Percentage TSE (expressed as share of GDP) 3.87 2.01 2.00 2.04 1.99
GDP deflator 1995 = 100 79 104 103 104 104
OECD AGRICULTURAL POLICIES 2004: AT A GLANCE – ISBN 92-64-01603-1 – © OECD 2004 69
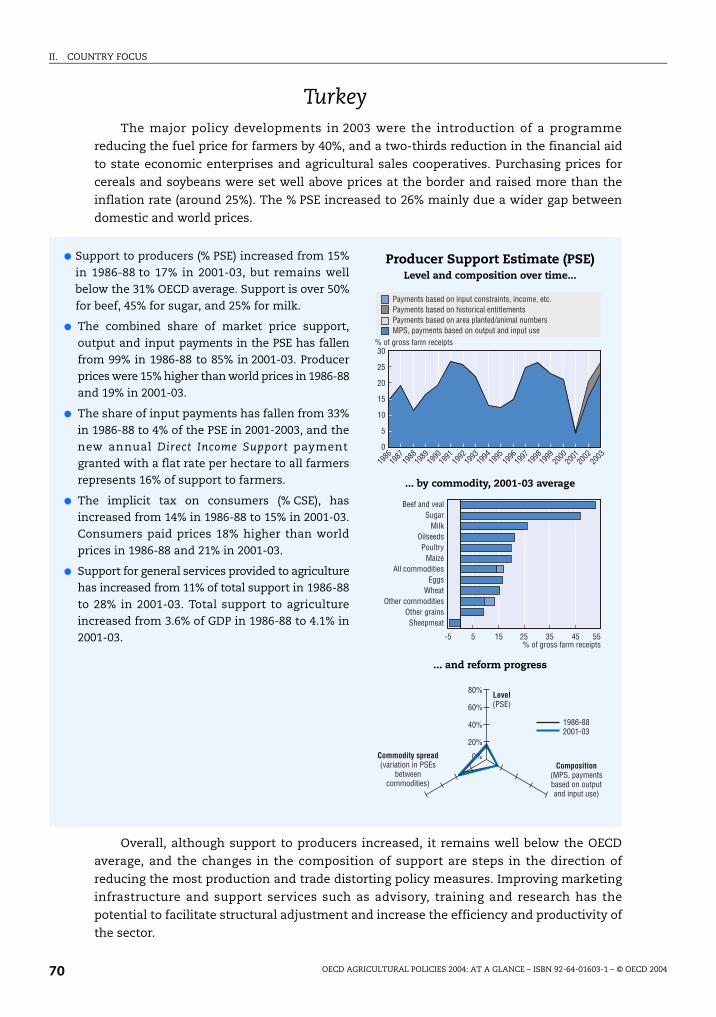
II. COUNTRY FOCUS
TurkeyThe major policy developments in 2003 were the introduction of a programme
reducing the fuel price for farmers by 40%, and a two-thirds reduction in the financial aid
to state economic enterprises and agricultural sales cooperatives. Purchasing prices for
cereals and soybeans were set well above prices at the border and raised more than the
inflation rate (around 25%). The % PSE increased to 26% mainly due a wider gap between
domestic and world prices.
Overall, although support to producers increased, it remains well below the OECD
average, and the changes in the composition of support are steps in the direction of
reducing the most production and trade distorting policy measures. Improving marketing
infrastructure and support services such as advisory, training and research has the
potential to facilitate structural adjustment and increase the efficiency and productivity of
the sector.
● Support to producers (% PSE) increased from 15%in 1986-88 to 17% in 2001-03, but remains wellbelow the 31% OECD average. Support is over 50%for beef, 45% for sugar, and 25% for milk.
● The combined share of market price support,output and input payments in the PSE has fallenfrom 99% in 1986-88 to 85% in 2001-03. Producerprices were 15% higher than world prices in 1986-88and 19% in 2001-03.
● The share of input payments has fallen from 33%in 1986-88 to 4% of the PSE in 2001-2003, and thenew annual Direct Income Support paymentgranted with a flat rate per hectare to all farmersrepresents 16% of support to farmers.
● The implicit tax on consumers (% CSE), hasincreased from 14% in 1986-88 to 15% in 2001-03.Consumers paid prices 18% higher than worldprices in 1986-88 and 21% in 2001-03.
● Support for general services provided to agriculturehas increased from 11% of total support in 1986-88to 28% in 2001-03. Total support to agricultureincreased from 3.6% of GDP in 1986-88 to 4.1% in2001-03.
Producer Support Estimate (PSE)Level and composition over time...
... by commodity, 2001-03 average
... and reform progress
% of gross farm receipts30
10
0
1986
1987
1988
1989
1990
1991
1992
1993
1994
1995
1996
1997
1998
1999
2000
2001
2003
2002
Payments based on input constraints, income, etc.
Payments based on area planted/animal numbersMPS, payments based on output and input use
Payments based on historical entitlements
5
15
20
25
-5% of gross farm receipts
15 35 555 25 45
Beef and vealSugar
MilkOilseedsPoultry
MaizeAll commodities
EggsWheat
Other commoditiesOther grainsSheepmeat
1986-882001-03
80%
60%
40%
20%
0%Commodity spread(variation in PSEs
betweencommodities)
Composition(MPS, paymentsbased on outputand input use)
Level(PSE)
OECD AGRICULTURAL POLICIES 2004: AT A GLANCE – ISBN 92-64-01603-1 – © OECD 200470
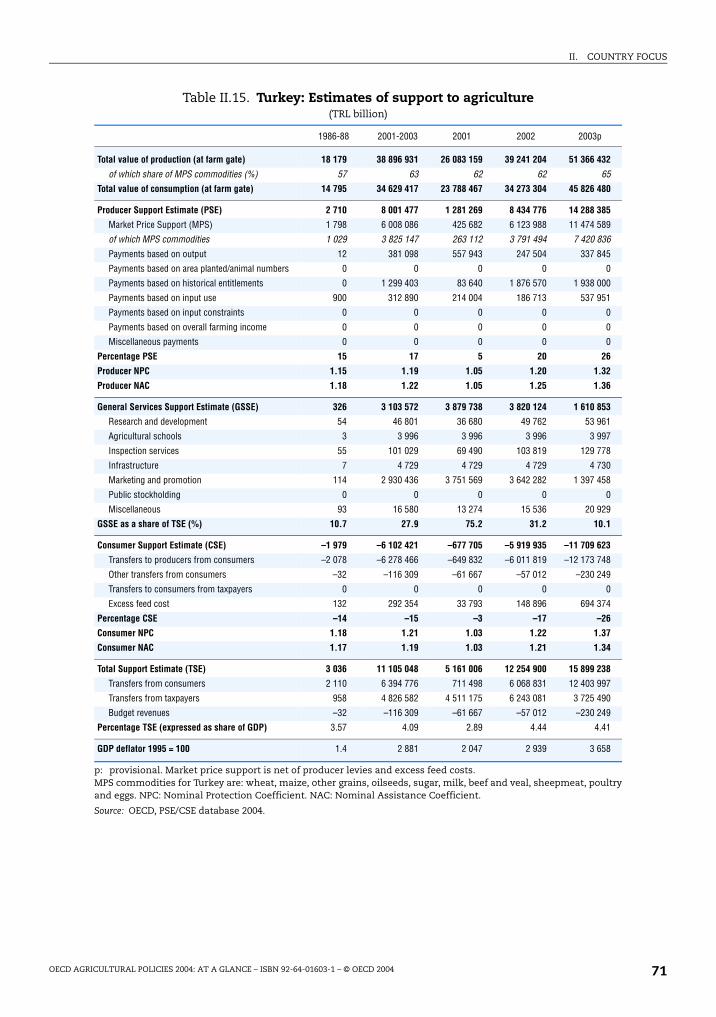
II. COUNTRY FOCUS
Table II.15. Turkey: Estimates of support to agriculture(TRL billion)
p: provisional. Market price support is net of producer levies and excess feed costs. MPS commodities for Turkey are: wheat, maize, other grains, oilseeds, sugar, milk, beef and veal, sheepmeat, poultryand eggs. NPC: Nominal Protection Coefficient. NAC: Nominal Assistance Coefficient.
Source: OECD, PSE/CSE database 2004.
1986-88 2001-2003 2001 2002 2003p
Total value of production (at farm gate) 18 179 38 896 931 26 083 159 39 241 204 51 366 432
of which share of MPS commodities (%) 57 63 62 62 65
Total value of consumption (at farm gate) 14 795 34 629 417 23 788 467 34 273 304 45 826 480
Producer Support Estimate (PSE) 2 710 8 001 477 1 281 269 8 434 776 14 288 385
Market Price Support (MPS) 1 798 6 008 086 425 682 6 123 988 11 474 589
of which MPS commodities 1 029 3 825 147 263 112 3 791 494 7 420 836
Payments based on output 12 381 098 557 943 247 504 337 845
Payments based on area planted/animal numbers 0 0 0 0 0
Payments based on historical entitlements 0 1 299 403 83 640 1 876 570 1 938 000
Payments based on input use 900 312 890 214 004 186 713 537 951
Payments based on input constraints 0 0 0 0 0
Payments based on overall farming income 0 0 0 0 0
Miscellaneous payments 0 0 0 0 0
Percentage PSE 15 17 5 20 26
Producer NPC 1.15 1.19 1.05 1.20 1.32
Producer NAC 1.18 1.22 1.05 1.25 1.36
General Services Support Estimate (GSSE) 326 3 103 572 3 879 738 3 820 124 1 610 853
Research and development 54 46 801 36 680 49 762 53 961
Agricultural schools 3 3 996 3 996 3 996 3 997
Inspection services 55 101 029 69 490 103 819 129 778
Infrastructure 7 4 729 4 729 4 729 4 730
Marketing and promotion 114 2 930 436 3 751 569 3 642 282 1 397 458
Public stockholding 0 0 0 0 0
Miscellaneous 93 16 580 13 274 15 536 20 929
GSSE as a share of TSE (%) 10.7 27.9 75.2 31.2 10.1
Consumer Support Estimate (CSE) –1 979 –6 102 421 –677 705 –5 919 935 –11 709 623
Transfers to producers from consumers –2 078 –6 278 466 –649 832 –6 011 819 –12 173 748
Other transfers from consumers –32 –116 309 –61 667 –57 012 –230 249
Transfers to consumers from taxpayers 0 0 0 0 0
Excess feed cost 132 292 354 33 793 148 896 694 374
Percentage CSE –14 –15 –3 –17 –26
Consumer NPC 1.18 1.21 1.03 1.22 1.37
Consumer NAC 1.17 1.19 1.03 1.21 1.34
Total Support Estimate (TSE) 3 036 11 105 048 5 161 006 12 254 900 15 899 238
Transfers from consumers 2 110 6 394 776 711 498 6 068 831 12 403 997
Transfers from taxpayers 958 4 826 582 4 511 175 6 243 081 3 725 490
Budget revenues –32 –116 309 –61 667 –57 012 –230 249
Percentage TSE (expressed as share of GDP) 3.57 4.09 2.89 4.44 4.41
GDP deflator 1995 = 100 1.4 2 881 2 047 2 939 3 658
OECD AGRICULTURAL POLICIES 2004: AT A GLANCE – ISBN 92-64-01603-1 – © OECD 2004 71
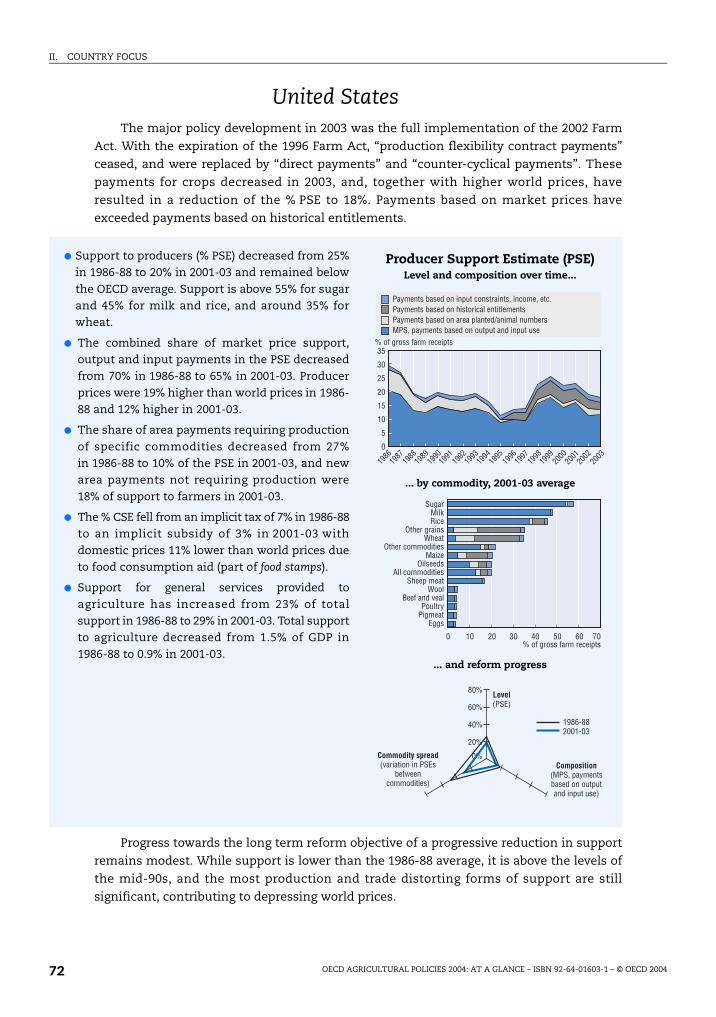
II. COUNTRY FOCUS
United StatesThe major policy development in 2003 was the full implementation of the 2002 Farm
Act. With the expiration of the 1996 Farm Act, “production flexibility contract payments”
ceased, and were replaced by “direct payments” and “counter-cyclical payments”. These
payments for crops decreased in 2003, and, together with higher world prices, have
resulted in a reduction of the % PSE to 18%. Payments based on market prices have
exceeded payments based on historical entitlements.
Progress towards the long term reform objective of a progressive reduction in support
remains modest. While support is lower than the 1986-88 average, it is above the levels of
the mid-90s, and the most production and trade distorting forms of support are still
significant, contributing to depressing world prices.
● Support to producers (% PSE) decreased from 25%in 1986-88 to 20% in 2001-03 and remained belowthe OECD average. Support is above 55% for sugarand 45% for milk and rice, and around 35% forwheat.
● The combined share of market price support,output and input payments in the PSE decreasedfrom 70% in 1986-88 to 65% in 2001-03. Producerprices were 19% higher than world prices in 1986-88 and 12% higher in 2001-03.
● The share of area payments requiring productionof specific commodities decreased from 27%in 1986-88 to 10% of the PSE in 2001-03, and newarea payments not requiring production were18% of support to farmers in 2001-03.
● The % CSE fell from an implicit tax of 7% in 1986-88to an implicit subsidy of 3% in 2001-03 withdomestic prices 11% lower than world prices dueto food consumption aid (part of food stamps).
● Support for general services provided toagriculture has increased from 23% of totalsupport in 1986-88 to 29% in 2001-03. Total supportto agriculture decreased from 1.5% of GDP in1986-88 to 0.9% in 2001-03.
Producer Support Estimate (PSE)Level and composition over time...
... by commodity, 2001-03 average
... and reform progress
% of gross farm receipts35
30
0
1986
1987
1988
1989
1990
1991
1992
1993
1994
1995
1996
1997
1998
1999
2000
2001
2003
2002
Payments based on input constraints, income, etc.
Payments based on area planted/animal numbersMPS, payments based on output and input use
Payments based on historical entitlements
20
10
25
15
5
0% of gross farm receipts
20 40 7010 30 50 60
SugarMilkRice
Other grainsWheat
Other commoditiesMaize
OilseedsAll commodities
Sheep meatWool
Beef and vealPoultry
PigmeatEggs
1986-882001-03
80%
60%
40%
20%
0%Commodity spread(variation in PSEs
betweencommodities)
Composition(MPS, paymentsbased on outputand input use)
Level(PSE)
OECD AGRICULTURAL POLICIES 2004: AT A GLANCE – ISBN 92-64-01603-1 – © OECD 200472
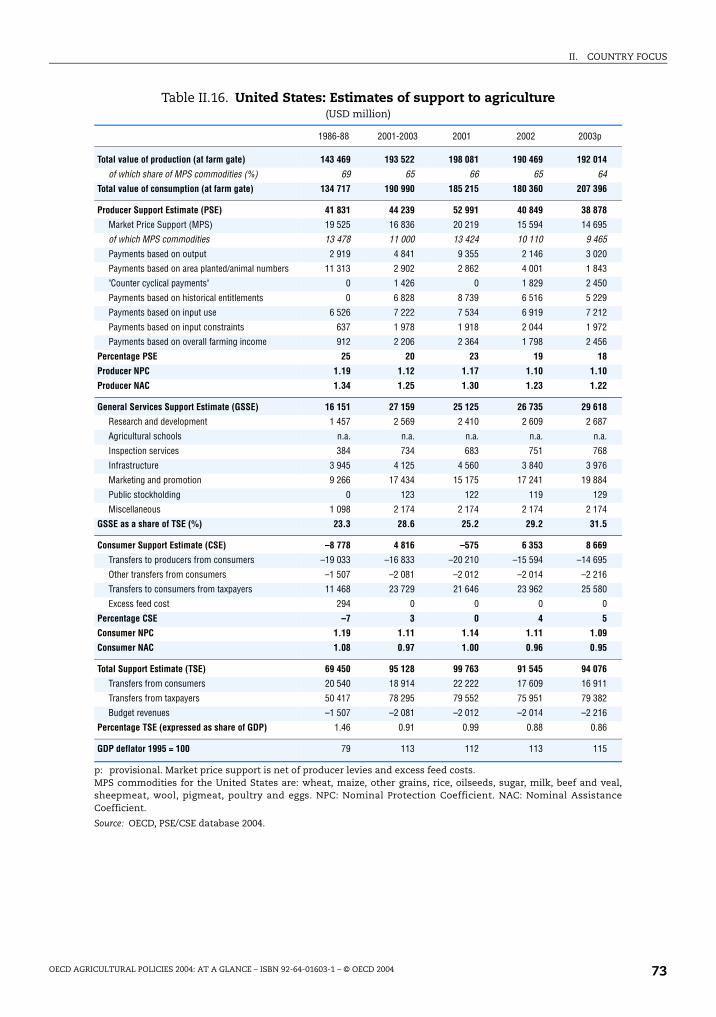
II. COUNTRY FOCUS
Table II.16. United States: Estimates of support to agriculture(USD million)
p: provisional. Market price support is net of producer levies and excess feed costs. MPS commodities for the United States are: wheat, maize, other grains, rice, oilseeds, sugar, milk, beef and veal,sheepmeat, wool, pigmeat, poultry and eggs. NPC: Nominal Protection Coefficient. NAC: Nominal AssistanceCoefficient.
Source: OECD, PSE/CSE database 2004.
1986-88 2001-2003 2001 2002 2003p
Total value of production (at farm gate) 143 469 193 522 198 081 190 469 192 014
of which share of MPS commodities (%) 69 65 66 65 64
Total value of consumption (at farm gate) 134 717 190 990 185 215 180 360 207 396
Producer Support Estimate (PSE) 41 831 44 239 52 991 40 849 38 878
Market Price Support (MPS) 19 525 16 836 20 219 15 594 14 695
of which MPS commodities 13 478 11 000 13 424 10 110 9 465
Payments based on output 2 919 4 841 9 355 2 146 3 020
Payments based on area planted/animal numbers 11 313 2 902 2 862 4 001 1 843
"Counter cyclical payments" 0 1 426 0 1 829 2 450
Payments based on historical entitlements 0 6 828 8 739 6 516 5 229
Payments based on input use 6 526 7 222 7 534 6 919 7 212
Payments based on input constraints 637 1 978 1 918 2 044 1 972
Payments based on overall farming income 912 2 206 2 364 1 798 2 456
Percentage PSE 25 20 23 19 18
Producer NPC 1.19 1.12 1.17 1.10 1.10
Producer NAC 1.34 1.25 1.30 1.23 1.22
General Services Support Estimate (GSSE) 16 151 27 159 25 125 26 735 29 618
Research and development 1 457 2 569 2 410 2 609 2 687
Agricultural schools n.a. n.a. n.a. n.a. n.a.
Inspection services 384 734 683 751 768
Infrastructure 3 945 4 125 4 560 3 840 3 976
Marketing and promotion 9 266 17 434 15 175 17 241 19 884
Public stockholding 0 123 122 119 129
Miscellaneous 1 098 2 174 2 174 2 174 2 174
GSSE as a share of TSE (%) 23.3 28.6 25.2 29.2 31.5
Consumer Support Estimate (CSE) –8 778 4 816 –575 6 353 8 669
Transfers to producers from consumers –19 033 –16 833 –20 210 –15 594 –14 695
Other transfers from consumers –1 507 –2 081 –2 012 –2 014 –2 216
Transfers to consumers from taxpayers 11 468 23 729 21 646 23 962 25 580
Excess feed cost 294 0 0 0 0
Percentage CSE –7 3 0 4 5
Consumer NPC 1.19 1.11 1.14 1.11 1.09
Consumer NAC 1.08 0.97 1.00 0.96 0.95
Total Support Estimate (TSE) 69 450 95 128 99 763 91 545 94 076
Transfers from consumers 20 540 18 914 22 222 17 609 16 911
Transfers from taxpayers 50 417 78 295 79 552 75 951 79 382
Budget revenues –1 507 –2 081 –2 012 –2 014 –2 216
Percentage TSE (expressed as share of GDP) 1.46 0.91 0.99 0.88 0.86
GDP deflator 1995 = 100 79 113 112 113 115
OECD AGRICULTURAL POLICIES 2004: AT A GLANCE – ISBN 92-64-01603-1 – © OECD 2004 73


OECD Agricultural Policies2004AT A GLANCE
«www.oecd.org
Highlights
20042004