Embed Size (px)
Citation preview

Consult this publication on line at http://dx.doi.org/10.1787/agr_outlook-2015-en.
This work is published on the OECD iLibrary, which gathers all OECD books, periodicals and statistical databases.Visit www.oecd-ilibrary.org for more information.
OECD-FAO Agricultural Outlook 2015-2024
OECD-FAO Agricultural Outlook 2015-2024The twenty-fi rst OECD edition of the Agricultural Outlook, and the eleventh prepared jointly with the Food and Agriculture Organization of the United Nations (FAO), provides projections to 2024 for major agricultural commodities, biofuels and fi sh. Notable in the 2015 report is a special feature on Brazil.
Real commodity prices are projected to resume their long-term decline on the basis of on-trend productivity growth and lower input prices. Brazil is poised to become the foremost supplier in meeting additional global demand, mostly originating from Asia. Opportunities exist to extend the benefi ts of Brazil’s growth to the poorest and to reduce the pressure on natural resources.
Contents
Executive summary
Chapter 1. Overview of the OECD-FAO Agricultural Outlook 2015-2024
Chapter 2. Brazilian agriculture: Prospects and challenges
Chapter 3. Commodity snapshots
More detailed commodity chapters are available on line at http://dx.doi.org/10.1787/agr_outlook-2015-en.
The projections and past trends presented in the statistical annex can be viewed in more detail at http://dx.doi.org/10.1787/agr-outl-data-en.
Supplementary information can be found at www.agri-outlook.org.
OE
CD
-FAO
Ag
ricultural Outlo
ok 2015-2024
2015
2015ISBN 978-92-64-23190-0
51 2015 02 1 P 9HSTCQE*cdbjaa+

OECD-FAOAgricultural Outlook
2015-2024
This work is published under the responsibility of the Secretary-General of the OECD and the
Director-General of FAO. The views expressed and conclusions reached in this report do not
necessarily correspond to those of the governments of OECD member countries, or the
governments of the FAO member countries.
This document and any map included herein are without prejudice to the status of or sovereignty
over any territory, to the delimitation of international frontiers and boundaries and to the name of
any territory, city or area.
The designations employed and the presentation of material in this information product do not
imply the expression of any opinion whatsoever on the part of the Food and Agriculture
Organization of the United Nations concerning the legal or development status of any country,
territory, city or area or of its authorities, or concerning the delimitation of its frontiers or
boundaries.
The names of countries and territories used in this joint publication follow the practice of the FAO.
ISBN 978-92-64-23190-0 (print)ISBN 978-92-64-23203-7 (PDF)
Annual: OECD-FAO Agricultural OutlookISSN 1563-0447 (print)ISSN 1999-1142 (online)
FAO:ISBN 978-92-5-108808-1 (print)E-ISBN 978-92-5-108814-2 (PDF)
The statistical data for Israel are supplied by and under the responsibility of the relevant Israeli authorities. The use of suchdata by the OECD is without prejudice to the status of the Golan Heights, East Jerusalem and Israeli settlements in the WestBank under the terms of international law.
The position of the United Nations on the question of Jerusalem is contained in General Assembly Resolution 181(II) of29 November 1947, and subsequent resolutions of the General Assembly and the Security Council concerning this question.
Photos credits: Cover © ASO FUJITA/amanaimagesRF/Thinkstock photos; © agustavop/Thinkstock photos; © Magone/Thinkstock photos; © m-kojot/Thinkstock photos; © luknaja/Thinkstock photos; © wiratgasem/Thinkstock photos;© tomasworks/Thinkstock photos.
Corrigenda to OECD publications may be found on line at: www.oecd.org/about/publishing/corrigenda.htm.
© OECD/FAO 2015
You can copy, download or print OECD content for your own use, and you can include excerpts from OECD publications, databases and multimedia
products in your own documents, presentations, blogs, websites and teaching materials, provided that suitable acknowledgment of OECD and FAO as
source and copyright owner is given. All requests for public or commercial use and translation rights should be submitted to [email protected]. Requests
for permission to photocopy portions of this material for public or commercial use shall be addressed directly to the Copyright Clearance Center (CCC)
at [email protected] or the Centre français d’exploitation du droit de copie (CFC) at [email protected].
Please cite this publication as:OECD/Food and Agriculture Organization of the United Nations (2015), OECD-FAO Agricultural Outlook 2015,OECD Publishing, Paris.http://dx.doi.org/10.1787/agr_outlook-2015-en
FOREWORD
Foreword
The Agricultural Outlook 2015-2024, is a collaborative effort of the Organisation for Economic
Co-operation and Development (OECD) and the Food and Agriculture Organization (FAO) of the
United Nations. It brings together the commodity, policy and country expertise of both organisations
and input from collaborating member countries to provide an annual assessment of prospects for the
coming decade of national, regional and global agricultural commodity markets. The special feature
on Brazil has been prepared in collaboration with analysts associated with the Ministério da
Agricultura, Pecuária e Abastecimento (MAPA) and Empresa Brasileira de Pesquisa Agropecuária
(Embrapa). However, OECD and FAO are responsible for the information and projections contained
in this document, and the views expressed in the special feature do not necessarily reflect those of
Brazilian institutions.
The baseline projection is not a forecast about the future, but rather a plausible scenario based
on specific assumptions regarding the macroeconomic conditions, the agriculture and trade policy
settings, weather conditions, longer term productivity trends, and international market
developments. The projections of production, consumption, stocks, trade and prices for the different
agricultural products described and analysed in this report cover the years 2015 to 2024. The
evolution of markets over the outlook period is typically described using annual growth rates or
percentage changes for the final year 2024 relative to a three-year base period of 2012-14.
The individual commodity projections are subject to critical examination by experts from
national institutions in collaborating countries and international commodity organisations prior to
their finalisation and publication in this report. The risks and uncertainties around the baseline
projections are examined through a number of possible alternative scenarios and stochastic analysis,
which illustrate how market outcomes may differ from the deterministic baseline projections.
The complete Agricultural Outlook, including more detailed commodity chapters, the full
statistical annex and fully documented Outlook database, including historical data and projections,
can be accessed through the OECD-FAO joint Internet site: www.agri-outlook.org. The published
Agricultural Outlook 2015 report provides: an overview of global agriculture and its prospects; an
in-depth analysis of the outlook for Brazilian agriculture and a consideration of some of the
challenges facing the sector; and snapshots for each commodity with associated statistical tables.
The more detailed commodity chapters are contained in the OECD’s iLibrary version of the report.
OECD-FAO AGRICULTURAL OUTLOOK 2015 © OECD/FAO 2015 3
ACKNOWLEDGEMENTS
Acknowledgements
The Agricultural Outlook is jointly prepared by the OECD and FAO Secretariats.
At the OECD, the baseline projections and Outlook report were prepared by members of
the Agro-Food Trade and Markets Division of the Trade and Agriculture Directorate: Marcel
Adenäuer, Jonathan Brooks (Head of Division), Annelies Deuss, Armelle Elasri (publication
co-ordinator), Hubertus Gay, Céline Giner, Gaëlle Gouarin, Pete Liapis, Claude Nenert,
Koki Okawa, Graham Pilgrim and Grégoire Tallard (Outlook co-ordinator). The OECD
Secretariat is grateful for the contributions provided by visiting experts Makgoka
Lekganyane (South African Department of Agriculture, Forestry and Fisheries), Stephen
MacDonald (United States Department of Agriculture), Juanita Rafajlovic (Agriculture and
Agri-Food Canada), and Yumei Zhang (Chinese Academy of Agricultural Sciences). The
organisation of meetings and document preparation were provided by Martina
Abderrahmane, Marina Giacalone-Belkadi, Aurelia Nicault and Özge Taneli-Ziemann.
Technical assistance in the preparation of the Outlook database was provided by
Eric Espinasse and Frano Ilicic. Many other colleagues in the OECD Secretariat and member
country delegations provided useful comments on earlier drafts of the report.
At the FAO, the team of economists and commodity officers from the Trade and
Markets Division contributing to this edition consisted of Abdolreza Abbassian, ElMamoun
Amrouk, Pedro Arias, Boubaker BenBelhassen (EST Division Director), Concepcion Calpe,
Emily Carroll, Kaison Chang, Merritt Cluff, Maria Adelaide D’Arcangelo, Michael Griffin,
Yasmine Iqbal, Ekaterina Krivonos, Pascal Liu, Holger Matthey (Team Leader), Natalia
Merkusheva, Jamie Morrison, Shirley Mustafa, Masato Nakane, Adam Prakash, Shangnan
Shui, Timothy Sulser, and Peter Thoenes. We thank visiting expert Shesadri Banerjee from
the National Council of Applied Economic Research in India. Marion Delport and Tracy
Davids from the Bureau for Food and Agricultural Policy at the University of Pretoria joined
the team as consultants. Stefania Vannuccini from the FAO Fisheries and Aquaculture
Department contributed, with technical support from Pierre Charlebois. Advice on natural
resources and biofuel issues was provided by Marco Colangeli, Olivier Dubois and Michela
Morese from the Global Bioenergy Partnership (GBEP). Research assistance and database
preparation were provided by Claudio Cerquiglini, Julie Claro, Emanuele Marocco, Marco Milo,
Mauro Pace and Pedro Sousa. This edition also benefitted from comments made by other
colleagues from FAO and member country institutions. FAO’s James Edge, Michelle
Kendrick, Yongdong Fu and Juan-Luis Salazar provided invaluable assistance with
publication and communication issues.
Chapter 2 of the Outlook, “Brazilian Agriculture: Prospects and challenges”, was prepared
by the Secretariats at OECD and FAO, with input from Paola Fortucci and in collaboration
with Brazilian colleagues. Alan Jorge Bojanic and Gustavo Chianca of the FAO Permanent
Representation in Brazil provided input, and their colleagues Katia Lucia dos Santos
Medeiros and Helena Carrascosa provided valuable guidance and comments on the initial
OECD-FAO AGRICULTURAL OUTLOOK 2015 © OECD/FAO 20154
ACKNOWLEDGEMENTS
drafts. Julio Cesar Worman (FAO TCRS) and Juliana Rossetto (FAO Brazil) provided material
on South-South co-operation. Andrea Polo Galante (FAO ESN) provided further information
on Brazil food security and nutrition developments. This chapter also benefitted from a
wide range of inputs from several Brazilian experts: Antônio Salazar Pessôa Brandão
(University of Rio de Janeiro), Jose Gasques, Antonio Luiz Machado de Moraes, Carlos
Augusto Mattos Santana, Benedito Rosa (Ministério da Agricultura, Pecuária e
Abastecimento), Geraldo Martha, Geraldo Souza (Empresa Brasileira de Pesquisa
Agropecuária), Marcelo Castello Branco Cavalcanti, Andre Luiz Ferreira dos Santos, Euler
João Geraldo da Silva, Ricardo Nascimento e Silva do Valle, Pedro Nino de Carvalho, Angela
Oliveira da Costa (Empresa de Pesquisa Energética), Antonio Carlos Kfouri Aidar, Cesar
Cunha Campos, Felippe Cauê Serigatti, Fernando Naves Blumenschein, Inez Lopes, Mauro
de Rezende Lopes, and Felipe Serigati (Fundação Getulio Vargas).
Comments and advice received from the European Commission, Sergio René Araujo-
Enciso of the Agrilife Unit of the Joint Research Centre (JRC-IPTS in Seville), and Koen Dillen
of DG Agriculture and Rural Development were very much appreciated.
Finally, information and feedback provided by the International Cotton Advisory
Committee, International Grains Council and International Sugar Organization is gratefully
acknowledged.
OECD-FAO AGRICULTURAL OUTLOOK 2015 © OECD/FAO 2015 5

TABLE OF CONTENTS
Table of contents
Acronyms and abbreviations . . . . . . . . . . . . . . . . . . . . . . . . . . . . . . . . . . . . . . . . . . . . . . . . . 11
Executive summary . . . . . . . . . . . . . . . . . . . . . . . . . . . . . . . . . . . . . . . . . . . . . . . . . . . . . . . . . 15
Part I
Overview and special chapter
Chapter 1. Overview of the OECD-FAO Agricultural Outlook 2015-2024 . . . . . . . . . . . . . . 21
The setting: Divergence in crop and livestock markets in 2014 . . . . . . . . . . . . . . . . . 22
Consumption: Consumption growth remains strongest in developing regions . . . . . . 29
Production: Production growth concentrated in regions where resources are less
constraining . . . . . . . . . . . . . . . . . . . . . . . . . . . . . . . . . . . . . . . . . . . . . . . . . . . . . . . . . . . . 35
Trade: Trade to expand for all commodities, except biofuels . . . . . . . . . . . . . . . . . . . 43
Prices: Real prices follow the long term declining trend . . . . . . . . . . . . . . . . . . . . . . . 49
Notes . . . . . . . . . . . . . . . . . . . . . . . . . . . . . . . . . . . . . . . . . . . . . . . . . . . . . . . . . . . . . . . . . . 59
Chapter 2. Brazilian agriculture: Prospects and challenges. . . . . . . . . . . . . . . . . . . . . . . . 61
Introduction . . . . . . . . . . . . . . . . . . . . . . . . . . . . . . . . . . . . . . . . . . . . . . . . . . . . . . . . . . . . 62
Trends and prospects for Brazilian agriculture . . . . . . . . . . . . . . . . . . . . . . . . . . . . . . . 64
Brazil’s agricultural outlook . . . . . . . . . . . . . . . . . . . . . . . . . . . . . . . . . . . . . . . . . . . . . . . 71
The effects of government policies on Brazilian agricultural markets . . . . . . . . . . . 91
Strategic challenges. . . . . . . . . . . . . . . . . . . . . . . . . . . . . . . . . . . . . . . . . . . . . . . . . . . . . . 105
Notes . . . . . . . . . . . . . . . . . . . . . . . . . . . . . . . . . . . . . . . . . . . . . . . . . . . . . . . . . . . . . . . . . . 107
References . . . . . . . . . . . . . . . . . . . . . . . . . . . . . . . . . . . . . . . . . . . . . . . . . . . . . . . . . . . . . 108
Chapter 3. Commodity snapshots . . . . . . . . . . . . . . . . . . . . . . . . . . . . . . . . . . . . . . . . . . . . . 111
Cereals . . . . . . . . . . . . . . . . . . . . . . . . . . . . . . . . . . . . . . . . . . . . . . . . . . . . . . . . . . . . . . . . . 112
Oilseeds and oilseed products . . . . . . . . . . . . . . . . . . . . . . . . . . . . . . . . . . . . . . . . . . . . . 114
Sugar . . . . . . . . . . . . . . . . . . . . . . . . . . . . . . . . . . . . . . . . . . . . . . . . . . . . . . . . . . . . . . . . . . 117
Meat . . . . . . . . . . . . . . . . . . . . . . . . . . . . . . . . . . . . . . . . . . . . . . . . . . . . . . . . . . . . . . . . . . . 119
Dairy. . . . . . . . . . . . . . . . . . . . . . . . . . . . . . . . . . . . . . . . . . . . . . . . . . . . . . . . . . . . . . . . . . . 121
Fish. . . . . . . . . . . . . . . . . . . . . . . . . . . . . . . . . . . . . . . . . . . . . . . . . . . . . . . . . . . . . . . . . . . . 123
Biofuels . . . . . . . . . . . . . . . . . . . . . . . . . . . . . . . . . . . . . . . . . . . . . . . . . . . . . . . . . . . . . . . . 126
Cotton . . . . . . . . . . . . . . . . . . . . . . . . . . . . . . . . . . . . . . . . . . . . . . . . . . . . . . . . . . . . . . . . . 128
Notes . . . . . . . . . . . . . . . . . . . . . . . . . . . . . . . . . . . . . . . . . . . . . . . . . . . . . . . . . . . . . . . . . . 130
Annex: Commodity snapshot tables . . . . . . . . . . . . . . . . . . . . . . . . . . . . . . . . . . . . . . . . . . 131
Part II
More detailed commodity chapters as well as the Glossary, Methodology and StatisticalAnnex are available on line at http://dx.doi.org/10.1787/agr_outlook-2015-en
OECD-FAO AGRICULTURAL OUTLOOK 2015 © OECD/FAO 2015 7
TABLE OF CONTENTS
Tables1.1. Assumed participation rates in US Farm Bill programmes for major commodities 40
2.1. Summary of production levels of other products in Brazil . . . . . . . . . . . . . . . . . 89
3.A1.1. World cereal projections . . . . . . . . . . . . . . . . . . . . . . . . . . . . . . . . . . . . . . . . . . . . . 132
3.A1.2. World oilseed projections . . . . . . . . . . . . . . . . . . . . . . . . . . . . . . . . . . . . . . . . . . . . 134
3.A1.3. World sugar projections . . . . . . . . . . . . . . . . . . . . . . . . . . . . . . . . . . . . . . . . . . . . . 135
3.A1.4. World meat projections . . . . . . . . . . . . . . . . . . . . . . . . . . . . . . . . . . . . . . . . . . . . . . 136
3.A1.5. World dairy projections: Butter and cheese . . . . . . . . . . . . . . . . . . . . . . . . . . . . . 137
3.A1.6. World dairy projections: Powders and casein. . . . . . . . . . . . . . . . . . . . . . . . . . . . 138
3.A1.7. World fish and seafood projections . . . . . . . . . . . . . . . . . . . . . . . . . . . . . . . . . . . . 139
3.A1.8. Biofuel projections: Ethanol . . . . . . . . . . . . . . . . . . . . . . . . . . . . . . . . . . . . . . . . . . 141
3.A1.9. Biofuel projections: Biodiesel . . . . . . . . . . . . . . . . . . . . . . . . . . . . . . . . . . . . . . . . . 142
3.A1.10. World cotton projections . . . . . . . . . . . . . . . . . . . . . . . . . . . . . . . . . . . . . . . . . . . . . 143
Figures1.1. Average GDP growth rates 2005-2014 and 2015-2024 . . . . . . . . . . . . . . . . . . . . . . 24
1.2. Evolution of Producer Price Index (PPI) and Consumer Price Index (CPI)
in the European Union and in Brazil . . . . . . . . . . . . . . . . . . . . . . . . . . . . . . . . . . . . 27
1.3. Variations in Producer Price Index (PPI) and Consumer Price Index (CPI)
for selected countries . . . . . . . . . . . . . . . . . . . . . . . . . . . . . . . . . . . . . . . . . . . . . . . . 28
1.4. Main uses of cereals in developed and developing countries . . . . . . . . . . . . . . . 30
1.5. Caloric intake per capita in least developed, other developing
and developed countries . . . . . . . . . . . . . . . . . . . . . . . . . . . . . . . . . . . . . . . . . . . . . 31
1.6. Production of roots and tubers, 1994-2013 . . . . . . . . . . . . . . . . . . . . . . . . . . . . . . . 32
1.7. World utilisations of roots and tubers . . . . . . . . . . . . . . . . . . . . . . . . . . . . . . . . . . 33
1.8. Protein intake per capita in least developed, other developing
and developed countries . . . . . . . . . . . . . . . . . . . . . . . . . . . . . . . . . . . . . . . . . . . . . 34
1.9. Projected growth of crop production in least developed, other developing
and developed countries. . . . . . . . . . . . . . . . . . . . . . . . . . . . . . . . . . . . . . . . . . . . . . 35
1.10. Arable crop areas and yield changes in Asia and Pacific region . . . . . . . . . . . . . 36
1.11. Arable crop areas and yield changes in Latin America and Caribbean . . . . . . . 37
1.12. Share of agricultural commodities in total coupled aid in the European Union . . 39
1.13. Projected growth in livestock production in least developed, other developing
and developed countries . . . . . . . . . . . . . . . . . . . . . . . . . . . . . . . . . . . . . . . . . . . . . . 41
1.14. Share of traded production in 2024 compared to 2012-14 . . . . . . . . . . . . . . . . . . 43
1.15. Concentration of exports by commodity, 2024 . . . . . . . . . . . . . . . . . . . . . . . . . . . 45
1.16. Concentration of imports by commodity, 2024 . . . . . . . . . . . . . . . . . . . . . . . . . . . 46
1.17. Monthly pork and poultry imports in Russian Federation, 2014. . . . . . . . . . . . . 48
1.18. Medium term evolution of commodity prices in real terms . . . . . . . . . . . . . . . . 49
1.19. Long-term price of maize in real terms, 1908-2024. . . . . . . . . . . . . . . . . . . . . . . . 50
1.20. Relationship between coarse grain price and crude oil price in 2024 . . . . . . . . 51
1.21. World price effects of higher G20 incomes. . . . . . . . . . . . . . . . . . . . . . . . . . . . . . . 52
1.22. Coarse grain price in nominal terms including variation derived from
stochastic analysis . . . . . . . . . . . . . . . . . . . . . . . . . . . . . . . . . . . . . . . . . . . . . . . . . . 54
1.23. Agricultural price trends in nominal terms including variation derived
from stochastic analysis . . . . . . . . . . . . . . . . . . . . . . . . . . . . . . . . . . . . . . . . . . . . . . 56
1.24. Price trends in nominal terms for biofuels, cotton and fish, including
variation derived from stochastic analysis . . . . . . . . . . . . . . . . . . . . . . . . . . . . . . 57
OECD-FAO AGRICULTURAL OUTLOOK 2015 © OECD/FAO 20158
TABLE OF CONTENTS
1.25. Uncertainty of prices in 2024 by scenario. . . . . . . . . . . . . . . . . . . . . . . . . . . . . . . . 58
2.1. Brazil’s agricultural output, 1990-2013 . . . . . . . . . . . . . . . . . . . . . . . . . . . . . . . . . . 65
2.2. Brazil’s farm structure, 2006 . . . . . . . . . . . . . . . . . . . . . . . . . . . . . . . . . . . . . . . . . . . 65
2.3. Trends in agricultural output and Total Factor Productivity in Brazil, 1975-2013 . . 66
2.4. Brazil’s agro-food trade, 1995-2013. . . . . . . . . . . . . . . . . . . . . . . . . . . . . . . . . . . . . . . 67
2.5. Destination of Brazilian agricultural exports, 2000-2013 . . . . . . . . . . . . . . . . . . 68
2.6. Trend in land used for crop production in Brazil . . . . . . . . . . . . . . . . . . . . . . . . . 72
2.7. Growth in yields for cereals, sugarcane and cotton in Brazil . . . . . . . . . . . . . . . 73
2.8. Production, consumption and exports of oilseeds in Brazil . . . . . . . . . . . . . . . . 74
2.9. Protein meal production, feed use and exports in Brazil . . . . . . . . . . . . . . . . . . 75
2.10. Production, consumption and exports of vegetable oils in Brazil . . . . . . . . . . . 75
2.11. Impact of higher or lower economic growth in China’s on Brazil’s
agricultural sector . . . . . . . . . . . . . . . . . . . . . . . . . . . . . . . . . . . . . . . . . . . . . . . . . . . 77
2.12. Coarse grains production, consumption, exports and stocks in Brazil . . . . . . . 78
2.13. Allocation of sugarcane between ethanol and sugar production in Brazil . . . . 80
2.14. Ethanol use, production and net trade in Brazil . . . . . . . . . . . . . . . . . . . . . . . . . . 81
2.15. Cotton production, consumption, stocks and exports in Brazil . . . . . . . . . . . . . 82
2.16. Beef, pigmeat and poultry production in Brazil . . . . . . . . . . . . . . . . . . . . . . . . . . 83
2.17. Production, consumption and exports of poultry meat in Brazil . . . . . . . . . . . . 84
2.18. Production, consumption and exports of beef and veal in Brazil . . . . . . . . . . . 84
2.19. Production, consumption and exports of pigmeat in Brazil . . . . . . . . . . . . . . . . 85
2.20. Per capita consumption of dairy products in Brazil . . . . . . . . . . . . . . . . . . . . . . . 86
2.21. Fishery production and consumption in Brazil . . . . . . . . . . . . . . . . . . . . . . . . . . 90
2.22. The level and composition of producer support in Brazil and selected
countries . . . . . . . . . . . . . . . . . . . . . . . . . . . . . . . . . . . . . . . . . . . . . . . . . . . . . . . . . . . 95
2.23. Share of general services (GSSE) in total support (TSE) . . . . . . . . . . . . . . . . . . . . 96
3.1. World cereal prices. . . . . . . . . . . . . . . . . . . . . . . . . . . . . . . . . . . . . . . . . . . . . . . . . . . 113
3.2. Exports of oilseeds and oilseed products by origin. . . . . . . . . . . . . . . . . . . . . . . . 115
3.3. Production, consumption and stock-to-use ratio of sugar . . . . . . . . . . . . . . . . . 117
3.4. World meat prices . . . . . . . . . . . . . . . . . . . . . . . . . . . . . . . . . . . . . . . . . . . . . . . . . . . 120
3.5. Exports of dairy products by origin . . . . . . . . . . . . . . . . . . . . . . . . . . . . . . . . . . . . . 122
3.6. Aquaculture and capture fisheries . . . . . . . . . . . . . . . . . . . . . . . . . . . . . . . . . . . . . 124
3.7. Evolution of biofuel world prices . . . . . . . . . . . . . . . . . . . . . . . . . . . . . . . . . . . . . . . 127
3.8. Cotton consumption by major country . . . . . . . . . . . . . . . . . . . . . . . . . . . . . . . . . 129
OECD-FAO AGRICULTURAL OUTLOOK 2015 © OECD/FAO 2015 9
Look for the StatLinks2at the bottom of the tables or graphs in this book.
To download the matching Excel® spreadsheet, just type the link into your
Internet browser, starting with the http://dx.doi.org prefix, or click on the link from
the e-book edition.
Follow OECD Publications on:
Follow FAO on:
This book has... StatLinks2A service that delivers Excel® files from the printed page!
http://twitter.com/OECD_Pubs
http://www.facebook.com/OECDPublications
http://www.linkedin.com/groups/OECD-Publications-4645871
http://www.youtube.com/oecdilibrary
http://www.oecd.org/oecddirect/
www.twitter.com/FAOstatisticswww.twitter.com/FAOnews
www.facebook.com/UNFAO
www.linkedin.com/company/fao#AgOutlook
www.youtube.com/user/FAOVideo
OECD
Alerts
ACRONYMS AND ABBREVIATIONS
Acronyms and abbreviations
ACP African, Caribbean and Pacific countries
ANP National Agency of Petroleum, Natural Gas and Biofuels (Brazil)
ARC Agricultural Risk Coverage (US Farm Bill Instrument)
ARC Agriculture Risk Coverage
ARC-CO Agricultural Risk Coverage based on a county revenue trigger (US Farm Bill
Instrument)
ARC-IC Agricultural Risk Coverage based on an individual farm-level revenue trigger
(US Farm Bill Instrument)
ASF African Swine Fever
Bln Billion
Bln L Billion litres
Bln t Billion tonnes
BRICS Emerging economies of Brazil, Russian Federation, India, China and South Africa
BRIICS Emerging economies of Brazil, Russian Federation, India, Indonesia, China
and South Africa
BSE Bovine spongiform encephalopathy
c.w.e. Carcass weight equivalent
CAP Common Agricultural Policy (European Union)
CET Common External Tariff
CFP Common Fisheries Policy (European Union)
CIS Commonwealth of Independent States
CPI Consumer Price Index
cts/lb Cents per pound
CV Coefficient of variation
DPDP Dairy Product Donation Program (United States)
E10 Blends of biofuel in transport fuel that represent 10% of the fuel volume
E15 Blends of biofuel in transport fuel that represent 15% of the fuel volume
E85 Blends of biofuel in transport fuel that represent 85% of the fuel volume
E100 Blends of biofuel in transport fuel that represent 100% of the fuel volume
EBA Everything-But-Arms Initiative (European Union)
EISA Act Energy Independence and Security Act of 2007 (United States)
El Niño Climatic condition associated with the temperature of major sea currents
EPA US Environmental Protection Agency
est Estimate
EU European Union
EU15 Fifteen member states that joined the European Union before 2004
FAO Food and Agriculture Organization of the United Nations
FDI Foreign direct investment
FTA Free Trade Agreement
OECD-FAO AGRICULTURAL OUTLOOK 2015 © OECD/FAO 2015 11
ACRONYMS AND ABBREVIATIONS
G20 Group of 20 important developed and developing economies (see Glossary)
GDP Gross domestic product
GDPD Gross domestic product deflator
GHG Greenhouse gases
GM Genetically modified
GSSE General Services Support Estimate
ha Hectares
HFCS High fructose corn syrup
hl Hectolitre
IEA International Energy Agency
IFAD International Fund for Agricultural Development
IMF International Monetary Fund
ITC International Trade Centre
IUU Illegal, unreported and unregulated (fishing)
kg Kilogrammes
kt Thousand tonnes
La Niña Climatic condition associated with the temperature of major sea currents
lb Pound
LDCs Least Developed Countries
lw Live weight
MERCOSUR Mercado Común del Sur/Common Market of South America
MFA Multi-fibre Arrangement
MFN Most favoured nation
Mha Million hectares
MPP Margin Protection Program
Mt Million tonnes
NAFTA North American Free Trade Agreement
OECD Organisation for Economic Co-operation and Development
p.a. Per annum
PCE Private consumption expenditure
PEDv Porcine Epidemic Diarrhoea virus
PISA Programme for International Student Assessment
PLC Price Loss Coverage (US Farm Bill instrument)
PPI Producer Price Index
PSE Producer Support Estimate
r.s.e. Raw sugar equivalent
r.t.c. Ready to cook
RED Renewable Energy Directive in the EU
RFS2 Renewable Fuels Standard in the US, which is part of the Energy Policy Act
RTA Regional Trade Agreements
SDA Same-day affirmation
SMP Skim milk powder
SMP Statutory Minimum Price
SPS Single payment scheme (European Union)
STAX Stacked Income Protection Plan (US Farm Bill Instrument)
t Tonnes
t/ha Tonnes/hectare
OECD-FAO AGRICULTURAL OUTLOOK 2015 © OECD/FAO 201512
ACRONYMS AND ABBREVIATIONS
TFP Total Factor Productivity
TRQ Tariff rate quota
TSE Total Support Estimate
UN The United Nations
UNCTAD United Nations Conference on Trade and Development
US United States
USDA United States Department of Agriculture
VAT Value added tax
WFP United Nations World Food Programme
WMP Whole milk powder
WTO World Trade Organization
Brazil specific acronyms and abbreviationsABC Brazilian Co-operation Agency
AGF Aquisição do Governo Federal
BNDES National Bank for Economic and Social Development
CIDE Contribuição sobre Intervenção do Domínio Econônomico
COFINS Social Contribution Tax
CONAB Companhia Nacional de Abastecimento
Embrapa Brazilian Agricultural Research Corporation
EPE Empresa de Pesquisa Energética
FGV Fundação Getulio Vargas
IBGE The Brazilian Institute of Geography and Statistics
ICMS Imposto sobre Circulação de Mercadorias e Serviços
ICO International Coffee Organisation
MAPA Ministry of Agriculture, Livestock and Food Supply
MDA Ministry of Agrarian Development
PAA Family Farming Food Acquisition Program
PGPAF Family Farming Price Guarantee Program
PIS Social Integration Tax
PRONAF National Program for the Strengthening of Family
CurrenciesARS Peso argentin
AUD Australian dollars
BDT Bangladeshi taka
BRL Brazilian real
CAD Canadian dollar
CLP Chilean peso
CNY Chinese yuan renminbi
DZD Algerian dinar
EGP Egyptian pound
EUR Euro (Europe)
IDR Indonesian rupiah
INR Indian rupees
JPY Japanese yen
KRW Korean won
OECD-FAO AGRICULTURAL OUTLOOK 2015 © OECD/FAO 2015 13
ACRONYMS AND ABBREVIATIONS
MXN Mexican peso
MYR Malaysian ringgit
NZD New Zealand dollar
PKR Pakistani rupee
RUB Russian ruble
SAR Saudi riyal
UAH Ukrainian grivna
USD US dollar
UYU Uruguayan peso
ZAR South African rand
OECD-FAO AGRICULTURAL OUTLOOK 2015 © OECD/FAO 201514
OECD-FAO Agricultural Outlook 2015
© OECD/FAO 2015
Executive summary
Prices for crops and livestock products showed diverse trends in 2014. Among crops, two
years of strong harvests put further pressure on prices of cereals and oilseeds. Tighter
supplies due to factors including herd rebuilding and disease outbreaks supported high
meat prices, while the prices of dairy products dropped steeply from historic highs. Further
adjustments to short-term factors are expected in 2015, before the medium-term drivers of
supply and demand take hold.
In real terms, prices for all agricultural products are expected to decrease over the next
ten years, as production growth, helped by on-trend productivity growth and lower input
prices, outpaces slowing demand increases. While this is consistent with the tendency for
long-term secular decline, prices are projected to remain at a higher level than in the years
preceding the 2007-08 price spike. Demand will be subdued by per capita consumption of
staple commodities approaching saturation in many emerging economies and by a
generally sluggish recovery of the global economy.
The major changes in demand are in developing countries, where continued but
slowing population growth, rising per capita incomes and urbanisation all increase the
demand for food. Rising incomes prompt consumers to diversify their diets by increasing
their consumption of animal protein relative to starches. For this reason, the prices of meat
and dairy products are expected to be high relative to the prices of crops; while among
crops the prices of coarse grains and oilseeds used for feed should rise relative to the prices
of food staples. These structural tendencies are in some cases offset by specific factors,
such as a flat demand for maize-based ethanol.
Lower oil prices are a source of downward pressure on prices, principally through their
impact on energy and fertiliser costs. Moreover, under the projected lower oil prices, the
production of first generation biofuels is generally not profitable without mandates or
other incentives. Policies are not expected to lead to significantly higher biofuel production
in either the United States or the European Union. On the other hand, a rise in the
production of sugar-based ethanol in Brazil is expected to flow from the increase in the
mandatory blending ratio in gasoline and the provision of tax incentives, while biodiesel
production is being actively promoted in Indonesia.
In Asia, Europe and North America additional agricultural production will be driven
almost exclusively by yield improvements, whereas in South America yield improvements
and additional agricultural area are projected. Modest production growth is expected in
Africa, although further investments could raise yields and production significantly.
Exports of agricultural commodities are projected to become concentrated in fewer
countries, while imports become more dispersed over a large number of countries. The
importance of relatively few countries in supplying global markets for some key
15
EXECUTIVE SUMMARY
commodities increases market risks, including those associated with natural disasters or
the adoption of disruptive trade measures. Overall, trade is expected to increase more
slowly than in the previous decade, but maintaining a stable share relative to global
production and consumption.
The current baseline reflects fundamental supply and demand conditions on world
agricultural markets. However, the Outlook is subject to a variety of uncertainties, some of
which are explored by stochastic analysis. If historical variations in yields, oil prices and
economic growth are projected into the future, then there is a high probability of at least
one severe shock to international markets within the next ten years.
Commodity highlights● Cereals: High stocks and decreasing production costs are driving nominal cereal prices
further down in the short term, while sustained demand and rising production costs
should increase nominal prices again in the medium term.
● Oilseeds: Strong demand for protein meal will drive further expansion of oilseed
production. This will result in a high contribution of the meal component to the overall
oilseed return and further favour expansion of soybean production especially in Brazil.
● Sugar: Higher sugar demand in developing countries should help prices recover from low
levels, leading to further investment in the sector. The market will depend on the
profitability of sugar versus ethanol in Brazil, the leading producer, and will remain
volatile as a result of the sugar production cycle in some key Asian sugar-producing
countries.
● Meat: Output is expected to respond to an improvement in margins, with lower feed
grain prices set to restore profitability to a sector that has been operating in an
environment of particularly high and volatile feed costs for most of the past decade.
● Fisheries: Worldwide fisheries production is projected to expand by almost 20% by 2024.
Aquaculture is expected to surpass total capture fisheries in 2023.
● Dairy: Exports of dairy products are projected to further concentrate in the four prime
origins: New Zealand, the European Union, the United States and Australia, where
opportunities for domestic demand growth are limited.
● Cotton: Prices will be suppressed in the short term by the drawdown of large stocks in
the People’s Republic of China (hereafter ‘China’), but will recover and stay relatively
stable for the remainder of the outlook period. By 2024, both real and nominal prices are
expected to remain below the levels reached in 2012-14.
● Biofuels: Ethanol and biodiesel use is expected to grow at a slower pace over the next
decade. The level of production is projected to be dependent on policies in major
producing countries. At lower oil prices, trade of biofuels should remain small when
expressed as a share of global production.
BrazilThis year’s Outlook contains a special focus on Brazil. This country ranks among the
world’s ten largest economies and is the second largest global supplier of food and
agricultural products. Brazil is poised to become the foremost supplier in meeting
additional global demand, mostly originating from Asia.
OECD-FAO AGRICULTURAL OUTLOOK 2015 © OECD/FAO 201516
EXECUTIVE SUMMARY
Supply growth is projected to be driven by continued improvements in productivity,
with higher crop yields, some conversion of pasture to cropland and more intensive
livestock production. Structural reforms and a reorientation of support towards
productivity enhancing investments, for example in infrastructure, could foster these
opportunities, as could trade agreements that improve access to foreign markets.
Brazil has made outstanding progress in eliminating hunger and reducing poverty.
Prospects for further reductions in poverty through agricultural development are widening,
in some food crops as well as in higher value products such as coffee, horticulture and
tropical fruits. The realisation of these opportunities calls for further targeting of rural
development policies.
Brazil’s agricultural growth can be achieved sustainably. While additional supply will
continue to come more from productivity gains than area increases, the pressure on
natural resources is expected to be alleviated by environmental and conservation
initiatives, including support for sustainable cultivation practices, the conversion of
natural and degraded cropland to pasture, and the integration of crop and livestock
systems.
OECD-FAO AGRICULTURAL OUTLOOK 2015 © OECD/FAO 2015 17

OECD-FAO Agricultural Outlook 2015
© OECD/FAO 2015
PART I
Overview and special chapter
19

OECD-FAO Agricultural Outlook 2015
© OECD/FAO 2015
PART I
Chapter 1
Overview of theOECD-FAO Agricultural Outlook
2015-2024
This chapter provides an overview of the latest set of quantitative medium-termprojections for global and national agricultural markets. The projections coverproduction, consumption, stocks, trade and prices for 25 agricultural products forthe period 2015 to 2024. The chapter starts with a description of the state ofagricultural markets in 2014 and explains the main macroeconomic and policyassumptions underlying the projections. In the next sections, consumption andproduction trends are examined, with a focus on calorie and protein consumption.The chapter also reviews trade patterns showing the relative concentration ofexports and dispersion of imports across countries for different commodities. Thechapter concludes with global agricultural price projections, which include astochastic analysis to illustrate how uncertainty about the macroeconomicenvironment and yield levels might affect price projections. Over the next ten years,real prices for all agricultural products are projected to decline from their 2014 levelsbut remain above their pre-2007 levels.
The statistical data for Israel are supplied by and under the responsibility of the relevant Israeliauthorities. The useof such data by the OECD is without prejudice to the status of the Golan Heights,East Jerusalem and Israeli settlements in the West Bank under the terms of international law.The position of the United Nations on the question of Jerusalem is contained in General AssemblyResolution 181(II) of 29 November 1947, and subsequent resolutions of the General Assembly andthe Security Council concerning this question.
21
1. OVERVIEW OF THE OECD-FAO AGRICULTURAL OUTLOOK 2015-2024
The setting: Divergence in crop and livestock markets in 2014Following a period of exceptionally high crop prices, good harvests in key production
regions replenished stock levels and sent prices downwards in marketing year 2013 (see
glossary for a definition of marketing year). Production conditions remained favourable in
2014 and consequently, prices of cereals, oilseeds and sugar declined further. Despite the
reduction in feed grain prices, meat prices reached record levels in 2014, as reduced herd
numbers, combined with multiple disease outbreaks, restricted the immediate supply
response. Prices of dairy products were high during the first part of 2014, but dropped in the
second half of the year, while fish prices slightly declined in 2014 but remained higher than
in 2013.
Record harvests for maize and wheat resulted in falling grain prices and ample stocks
in 2014, with wheat prices attaining their lowest level since 2010. Global rice production
was slightly lower in 2014 compared to 2013, but international rice prices remained under
pressure. Global rice utilisation exceeded production for the first time in ten years, which
led to a drawdown of global rice stocks.
Oilseeds production reached a new world record in marketing year 2014, with soybean
production growing the most. With consumption failing to keep pace, oilseed prices fell.
Vegetable oil prices also remained under pressure as both production and demand
experienced slower growth rates. Rising demand made protein meal relatively expensive
compared to feed grains.
International sugar prices continued their decline as production exceeded
consumption for the fifth consecutive season. This decline was particularly pronounced
due to the devaluation of the Brazilian real with respect to the US dollar. The current
season is expected to be a turning point, with nearly no growth in global sugar production
as increases in Europe were offset by large decreases in Brazil and Pakistan. The turn-
around is not expected to be sufficient however and at the start of the outlook, some of the
major sugar producers are expected to cut their production in response to the low prices.
Prices for most meat products, particularly beef, reached record levels in 2014. At the
same time, the outbreak of Porcine Epidemic Diarrhoea virus (PEDv) in the United States
and African swine fever in Belarus and the European Union, impacted pigmeat supply and
prices. Sheep meat prices also increased in 2014 following several years of flock reduction
in New Zealand, which was a result of the transformation of sheep farms into more
profitable dairy operations. Given the substitutability among the various types of meat, the
higher prices for beef, sheep meat and pigmeat also supported poultry prices.
The end of 2013 was characterised by high dairy product prices, due to a production
shortfall in China in 2013 and year-on-year declines in milk production in first half of 2013
in the United States, the European Union, New Zealand and Australia. In the beginning of
2014, prices of dairy products started to decline amidst lower import demand in China,
increasing production in major exporters and the import ban imposed by the Russian
Federation on cheese from several major producing countries.
OECD-FAO AGRICULTURAL OUTLOOK 2015 © OECD/FAO 201522
1. OVERVIEW OF THE OECD-FAO AGRICULTURAL OUTLOOK 2015-2024
ofhicese
oflsoheit,
iesndedch
Fish production, consumption and trade reached record levels in 2014. Prices for fish
and fish products were strong during the first part of 2014 following high feed prices in
2012 and 2013. Later in the year, prices declined due to increased supply of certain fish
species and lower demand in Japan and several European countries, but still remained
higher than in 2013.
Global cotton production exceeded consumption again in 2014, while global stocks
rose for the fifth consecutive year and international prices continued their decline. The
accumulation of stocks was mainly driven by China’s stockholding policies. In addition, the
country has lowered its support to cotton farmers and reduced import quotas, two policy
changes that affected the world cotton market in 2014.
Ethanol and biodiesel prices continued to decline in 2014 as a result of the decrease of
the prices of biofuel feedstock and a strong decline in crude oil prices during the second
half of the year. The policy environment was uncertain with no clear decisions on biofuel
mandates and targets in either the United States or the European Union.
The projections in the Outlook consider the current market conditions for each
commodity as well as macroeconomic and policy developments. The main
macroeconomic and policy assumptions underlying the baseline projection are described
in Box 1.1. One of the most noticeable macroeconomic assumptions concerns the decline
in the crude oil price, which by February 2015 had declined by almost 50% from July 2014
levels. The price of the benchmark Brent crude oil is assumed to reach USD 88.1 per barrel
by 2024. Other macroeconomic influences include moderate GDP growth in the OECD
countries, slower GDP growth in the large emerging market economies, a slowdown in
world population growth, low inflation in OECD countries and a strong US dollar. The
projections also incorporate a detailed evaluation of the movements of the Producer Price
Indices (PPI) and Consumer Price Indices (CPI) (see Box 1.2), which improves the
representation of consumer prices in the model.
Box 1.1. Macroeconomic and policy assumptions
The main assumptions underlying the baseline projection
The Outlook is presented as one baseline scenario that is considered plausible given a rangeconditioning assumptions. These assumptions portray a specific macroeconomic and demograpenvironment which shapes the evolution of demand and supply for agricultural and fish products. Thgeneral factors are described below.
A continuation of the moderate and uneven recovery is likely
Overall, the global economy continues to run in a low gear. At 3% over the past seven years, the paceglobal growth is more than one percentage point below the 2000-07 period. Global trade growth aremains below trend. Recent divergent economic performance in the main OECD areas continues. TUnited States and United Kingdom have surpassed their pre-crisis GDP peaks, Japan has barely attainedand the euro area as a whole is still below, though there are considerable differences among countrwithin the euro area. Labour market conditions are improving in the United States, United Kingdom aJapan but not in the euro area. In the OECD area alone, eleven million more people remain unemploycompared to 2007. A further slowdown could push the euro area closer to persistent stagnation with muweaker growth and inflation.
OECD-FAO AGRICULTURAL OUTLOOK 2015 © OECD/FAO 2015 23
1. OVERVIEW OF THE OECD-FAO AGRICULTURAL OUTLOOK 2015-2024
ainia,
toosssis
ook
utl-
694
Box 1.1. Macroeconomic and policy assumptions (cont.)
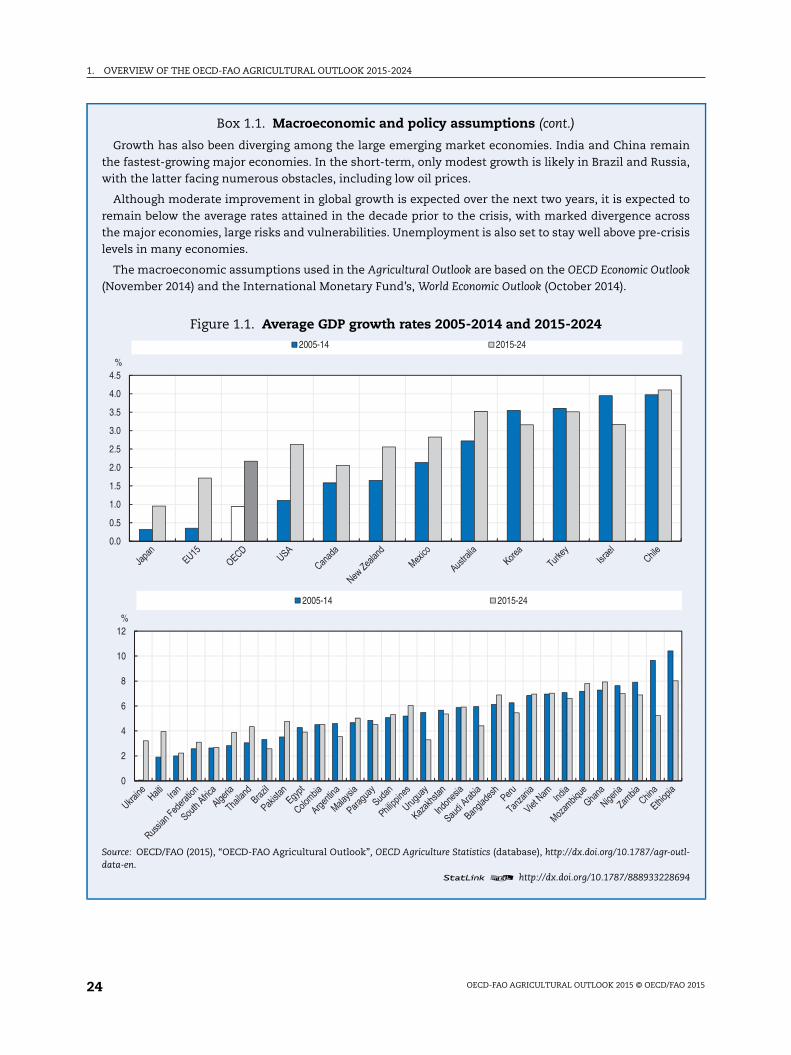
Growth has also been diverging among the large emerging market economies. India and China remthe fastest-growing major economies. In the short-term, only modest growth is likely in Brazil and Russwith the latter facing numerous obstacles, including low oil prices.
Although moderate improvement in global growth is expected over the next two years, it is expectedremain below the average rates attained in the decade prior to the crisis, with marked divergence acrthe major economies, large risks and vulnerabilities. Unemployment is also set to stay well above pre-crilevels in many economies.
The macroeconomic assumptions used in the Agricultural Outlook are based on the OECD Economic Outl(November 2014) and the International Monetary Fund’s, World Economic Outlook (October 2014).
Figure 1.1. Average GDP growth rates 2005-2014 and 2015-2024
Source: OECD/FAO (2015), “OECD-FAO Agricultural Outlook”, OECD Agriculture Statistics (database), http://dx.doi.org/10.1787/agr-odata-en.
1 2 http://dx.doi.org/10.1787/888933228
0.0
0.5
1.0
1.5
2.0
2.5
3.0
3.5
4.0
4.5%
2005-14 2015-24
0
2
4
6
8
10
12%
2005-14 2015-24
OECD-FAO AGRICULTURAL OUTLOOK 2015 © OECD/FAO 201524
1. OVERVIEW OF THE OECD-FAO AGRICULTURAL OUTLOOK 2015-2024
ger15thhe
theryithge
ith.a.7%anver
glytherofue
rthsehe
ionsebein
inby
the
ofingion
owodin
Box 1.1. Macroeconomic and policy assumptions (cont.)
Real GDP growth in OECD countries increased gradually to reach 2.2% in 2014; it should be even stronin 2015 at 2.5%. Over the medium term, growth is expected to maintain an average level of 2.2% p.a. EUmembers as a group are expected to recover gradually after the small recession in 2013 from 1.2% growin 2014 to 1.4% in 2015 and 1.9% in 2016. It should then show a moderate average growth of 1.7% p.a. in tlater years of the projection period.
Among the OECD countries, Chile, Australia and Turkey are expected to exhibit the strongest growduring the next decade at 4.1%, 3.5% and 3.5% p.a. respectively, followed by Korea at 3.2% p.a. The recovis likely to remain moderate in the United States, Mexico and New Zealand during the next ten years, wgrowth rates of 2.6%, 2.8% and 2.6% p.a. respectively, while Canada should maintain an annual averagrowth of 2.1% p.a. Japan should show a small average growth of 1% p.a. over the next ten years.
India is now expected to overtake China and exhibit the strongest growth during the next decade, wan average annual growth rate of 6.6%. China’s growth prospects have been revised downward to 5.2% pBrazil and South Africa average growth should also be weaker than previously expected at 2.6% and 2.p.a. respectively. The Russian Federation is expected to recover quite rapidly over the next ten years ataverage growth of 3.1% p.a. from a slightly positive growth in 2014. Argentina as well should recover quickly othe coming decade, bouncing back from the small recession of 2014 to an average growth rate of 3.5% p.a.
Developing countries in Asia and Africa are expected to grow strongly, but in most cases not as stronas over the previous ten years. In Asia, the Philippines and Malaysia are expected to achieve higher growrates than the previous decade, averaging 6.0% and 5.0% p.a. respectively. However, in general, the slowgrowth of the European Union, Japan and China is anticipated to put downward pressure on the growththe region. In Africa, Sub-Saharan countries should show strong growth led by Ethiopia and Mozambiqwith growth rates during the projection period of 8.0% and at 7.8% p.a. respectively. Countries in NoAfrica are also expected to grow fast, but slower than those in the Sub-Sahara area. Compared with thetwo regions, growth in Latin America is expected to be weaker, partly due to lower commodity prices. Taverage annual growth rate of Columbia is 4.5% p.a. over the next ten years.
Population growth to slow
World population growth is expected to slow to 1% p.a. in the next decade, a total of more than 8 billpeople to feed in 2024. Slower growth is expected in all regions and most countries, including India, whopopulation is nevertheless going to increase by 139 million people. An additional 768 million people willliving on the planet in 2024, nearly half of them in the Asia and Pacific region, although the growth ratethis region is below the growth rate experienced during the last decade.
Among OECD countries, population levels are expected to decrease during the coming ten yearsEurope and in Japan. In Japan’s case, the population will decrease by more than 3 million inhabitants2024. The European Union continues to grow at a rate of 0.13% p.a. Australia, Turkey and Mexico havehighest projected population growth rates among the OECD member countries.
The Russian Federation is another country where the population will be shrinking, with a drop4.8 million expected in the coming decade. The world population growth is still driven by developcountries. Among the developing countries, those in Africa are expected to show the fastest populatgrowth at 2.42% p.a., which is lower than in the last decade.
Inflation growth differ among countries
Inflation in OECD countries is measured by the Private Consumer Expenditure (PCE) deflator. Linflation is set to continue in the OECD, due to persistent slack and the recent sharp falls in oil and foprices, especially in the euro area, the United States and Japan. Inflation is likely to remain below targetmany OECD economies at 2.2% p.a. over the next ten years.
OECD-FAO AGRICULTURAL OUTLOOK 2015 © OECD/FAO 2015 25
1. OVERVIEW OF THE OECD-FAO AGRICULTURAL OUTLOOK 2015-2024
at
he
l inse.
inthehe
zil,
96forhe
ndan
ingthens
oming
ewteshe15forbe
the
he
Box 1.1. Macroeconomic and policy assumptions (cont.)
In the euro area, inflation has drifted down and is now close to zero. In the short term, the euro area isrisk of deflation if growth stagnates or if inflation falls further.
In Japan, after a long period of deflation, inflation became positive in 2014 but it remained well below tBank of Japan’s target of 2%. During the next decade however, inflation is expected to reach 2.1% p.a.
Despite an extended period of moderate growth, underlying inflationary pressures remain substantiamany large emerging market economies. Looking forward, inflationary pressures are projected to easlowly. Sizeable exchange rate depreciations have pushed up prices in some countries, including Russia
US dollar expected to remain strong
The nominal exchange rate for the period 2015-24 is mostly driven by the inflation differentialsrelation to the United States (small change in real terms). The assumptions on exchange rates duringnext decade are characterised by a stronger US dollar compared to other currencies in line with trecovery of the US economy. Nominal exchange rates adjust in line with inflation rates.
Currency depreciation is projected to be very strong in the next decade for some countries like BraIndia, South Africa and Turkey. On the contrary, the Russian ruble should appreciate by 2024.
Drop in energy prices
The world oil price until 2013 is taken from the short term update of the OECD Economic Outlook n°(November 2014). For 2014, the annual average daily spot price is used, while the average daily spot priceDecember 2014 is used as the oil price for 2015. Brent crude oil prices from 2016 are projected to grow at tsame rate as projected by the World Energy Outlook (IEA, November 2014).
Oil prices declined sharply in the second half of 2014, reflecting a combination of weaker global demaand improved supply. In nominal terms, the price is expected to increase over the outlook period ataverage annual growth rate of 3.7%, from USD 63.8 per barrel in 2015 to USD 88.1 per barrel by 2024.
Policy considerations
Policies play an important role in agricultural and fisheries markets, with policy reforms often changthe structure of markets. Policy reforms such as decoupled payments and continued progress towardselimination of direct price supports imply that policies will have a less direct effect on production decisioin many countries. However, import protection, domestic support and price intervention policies still lolarge in many developing countries and with growing impacts that reflect these countries’ increasimportance in international markets and trade.
The projections for the United States take the Agricultural Act of 2014 (Farm Bill) into account. The npayment scheme of the Farm Bill has been incorporated into the model, although final participation raof farmers in the different programmes were not yet available before finalising the projections. Tassumptions were, however, aligned with those of the Congressional Budget Office in their March 20Baseline. In addition, the Environmental Protection Agency (EPA) has not yet issued final rulemakingsthe 2014 and 2015 biofuel mandates. This Outlook assumes biofuel mandate levels in the United States todetermined by the evolution of gasoline use, the ethanol blend wall and the limited development ofcellulosic ethanol industry.
The reform of the Common Agricultural Policy (CAP) in the European Union is now fully reflected in tprojections, including the implementation choices in the EU member states made in August 2014.
OECD-FAO AGRICULTURAL OUTLOOK 2015 © OECD/FAO 201526
1. OVERVIEW OF THE OECD-FAO AGRICULTURAL OUTLOOK 2015-2024
ly,Toicecalok:ket
ucticehisforingforon
t ofan
thesePI.
ing
utl-
707
Box 1.2. Lessons learned from recent evolution of PPI and CPI measures
The OECD-FAO Agricultural Outlook projects the evolution, for major agricultural commodities, of suppdemand, trade as well as prices at the producer and final consumer levels over the medium term.complement this database and allow new types of information aggregation, measures of Producer PrIndices (PPI) and Consumer Price Indices (CPI) have been computed for all countries on the historidatabase.1 Those indices are only based on food products covered by the OECD-FAO Agricultural OutloDairy, Sweeteners, Meats and Fisheries, Cereals and Fats. The harmonised food price index basaccording the United Nations COICOP2 definition includes a wider range of goods.3
CPI measures are already available in the OECD-FAO Agricultural Database for the different food prodgroups covered. These were combined into higher-level aggregates. The country level consumer food prindex corresponds to the sum of the product level CPI weighted by the share of the value of use for tproduct compared to the total value of food use on an annual basis. Similarly it was possible to deriveevery country in the database a Producer Price Index that corresponds to the same food product groupbut at the agricultural stage. The PPI measures the annual per cent change in the prices paid to farmerstheir production. The aggregate PPI weight is the share of the value of production for a given commoditytotal value of production.
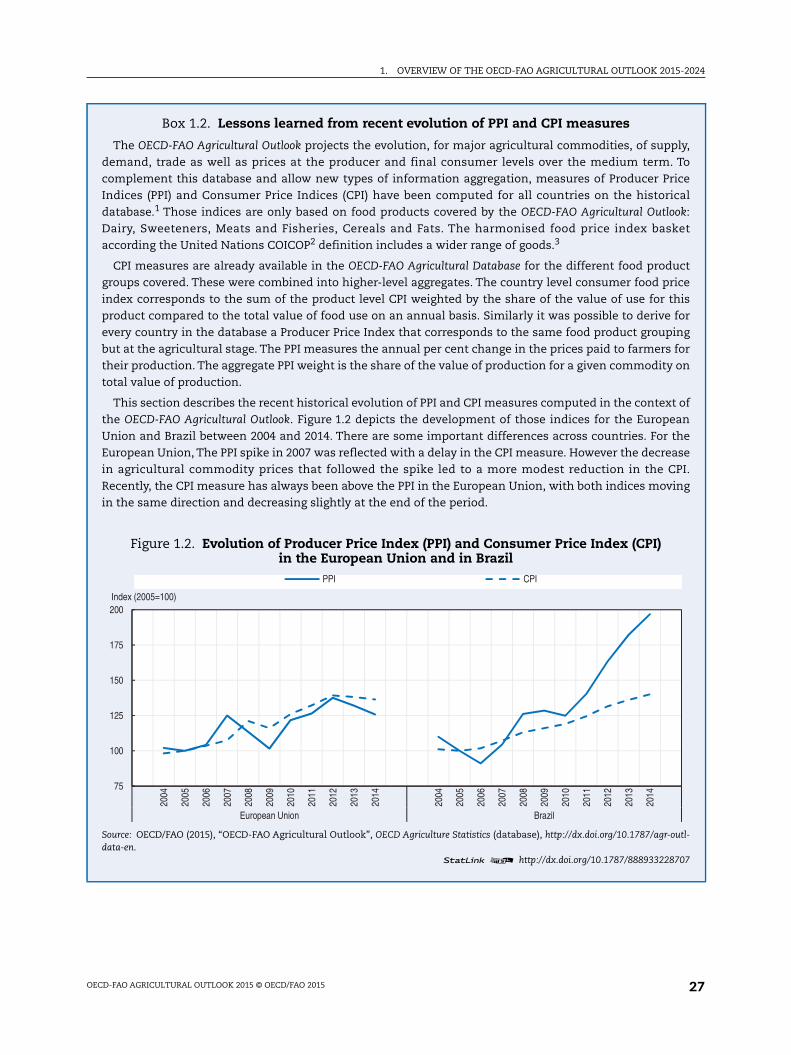
This section describes the recent historical evolution of PPI and CPI measures computed in the contexthe OECD-FAO Agricultural Outlook. Figure 1.2 depicts the development of those indices for the EuropeUnion and Brazil between 2004 and 2014. There are some important differences across countries. ForEuropean Union, The PPI spike in 2007 was reflected with a delay in the CPI measure. However the decreain agricultural commodity prices that followed the spike led to a more modest reduction in the CRecently, the CPI measure has always been above the PPI in the European Union, with both indices movin the same direction and decreasing slightly at the end of the period.
Figure 1.2. Evolution of Producer Price Index (PPI) and Consumer Price Index (CPI)in the European Union and in Brazil
Source: OECD/FAO (2015), “OECD-FAO Agricultural Outlook”, OECD Agriculture Statistics (database), http://dx.doi.org/10.1787/agr-odata-en.
1 2 http://dx.doi.org/10.1787/888933228
75
100
125
150
175
200
2004
2005
2006
2007
2008
2009
2010
2011
2012
2013
2014
2004
2005
2006
2007
2008
2009
2010
2011
2012
2013
2014
European Union Brazil
Index (2005=100)
PPI CPI
OECD-FAO AGRICULTURAL OUTLOOK 2015 © OECD/FAO 2015 27
1. OVERVIEW OF THE OECD-FAO AGRICULTURAL OUTLOOK 2015-2024
14.eeficeainthe
utl-
716
ofndndinhe
tedonng
nal
thes in
tics
its;
Box 1.2. Lessons learned from recent evolution of PPI and CPI measures
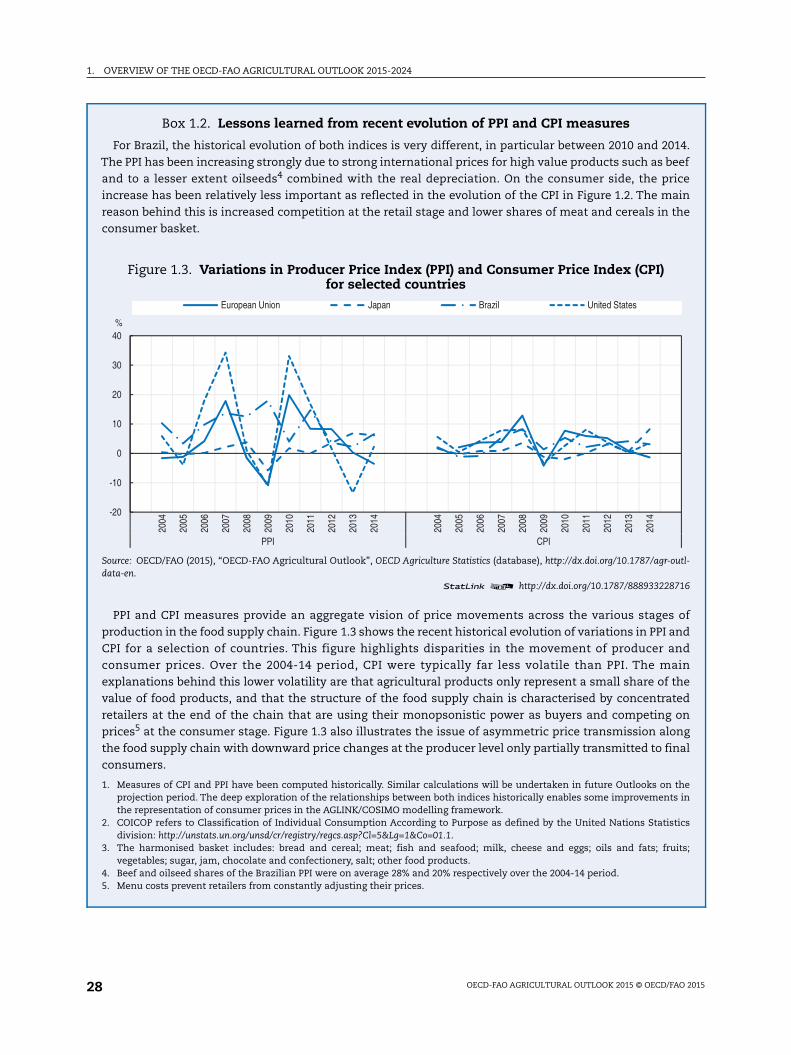
For Brazil, the historical evolution of both indices is very different, in particular between 2010 and 20The PPI has been increasing strongly due to strong international prices for high value products such as band to a lesser extent oilseeds4 combined with the real depreciation. On the consumer side, the princrease has been relatively less important as reflected in the evolution of the CPI in Figure 1.2. The mreason behind this is increased competition at the retail stage and lower shares of meat and cereals inconsumer basket.
Figure 1.3. Variations in Producer Price Index (PPI) and Consumer Price Index (CPI)for selected countries
Source: OECD/FAO (2015), “OECD-FAO Agricultural Outlook”, OECD Agriculture Statistics (database), http://dx.doi.org/10.1787/agr-odata-en.
1 2 http://dx.doi.org/10.1787/888933228
PPI and CPI measures provide an aggregate vision of price movements across the various stagesproduction in the food supply chain. Figure 1.3 shows the recent historical evolution of variations in PPI aCPI for a selection of countries. This figure highlights disparities in the movement of producer aconsumer prices. Over the 2004-14 period, CPI were typically far less volatile than PPI. The maexplanations behind this lower volatility are that agricultural products only represent a small share of tvalue of food products, and that the structure of the food supply chain is characterised by concentraretailers at the end of the chain that are using their monopsonistic power as buyers and competingprices5 at the consumer stage. Figure 1.3 also illustrates the issue of asymmetric price transmission alothe food supply chain with downward price changes at the producer level only partially transmitted to ficonsumers.
1. Measures of CPI and PPI have been computed historically. Similar calculations will be undertaken in future Outlooks onprojection period. The deep exploration of the relationships between both indices historically enables some improvementthe representation of consumer prices in the AGLINK/COSIMO modelling framework.
2. COICOP refers to Classification of Individual Consumption According to Purpose as defined by the United Nations Statisdivision: http://unstats.un.org/unsd/cr/registry/regcs.asp?Cl=5&Lg=1&Co=01.1.
3. The harmonised basket includes: bread and cereal; meat; fish and seafood; milk, cheese and eggs; oils and fats; fruvegetables; sugar, jam, chocolate and confectionery, salt; other food products.
4. Beef and oilseed shares of the Brazilian PPI were on average 28% and 20% respectively over the 2004-14 period.5. Menu costs prevent retailers from constantly adjusting their prices.
-20
-10
0
10
20
30
40
2004
2005
2006
2007
2008
2009
2010
2011
2012
2013
2014
2004
2005
2006
2007
2008
2009
2010
2011
2012
2013
2014
PPI CPI
%
European Union Japan Brazil United States
OECD-FAO AGRICULTURAL OUTLOOK 2015 © OECD/FAO 201528
1. OVERVIEW OF THE OECD-FAO AGRICULTURAL OUTLOOK 2015-2024
Consumption: Consumption growth remains strongest in developing regionsThe demand for agricultural products has expanded rapidly through the past decade,
driven predominantly by increases in developing countries. Steady population growth, rising
per capita incomes and continuous urbanisation not only increased the total demand for food
products, but also allowed consumers in developing regions, particularly within large Asian
economies, to diversify their diets by increasing protein intake relative to traditional starches.
In developed economies, saturated per capita consumption levels combined with limited
population growth resulted in stagnant food consumption. However, the introduction of
policies aimed at improving energy security and environmental sustainability incentivised the
production of biofuels, expanding the demand for the feedstock used in its production.
These same factors will continue to influence the prospects for demand growth over the
Outlook, but the generally sluggish and uneven recovery of the global economy will cause the
demand for agricultural commodities to increase at a slower rate than over the past decade.
Differentiated rates of income and population growth will result in significant regional
differences in consumption growth. Rapidly expanding Asian economies continue to account
for the greatest share of additional food consumption, while expanding population numbers
combined with rising income levels drive total consumption levels higher in Africa. In contrast,
limited growth in food consumption within developed regions, combined with a largely
stagnant biofuel sector results in reduced growth rates in the developed world.
With biofuel demand stagnating, feed use will drive cereal demand
Particularly within the developed world, the emergence of biofuel and other industrial
uses was an important driver of rising demand for cereals throughout the past decade. The
use of coarse grains (predominantly maize) for biofuels almost tripled from 2004 to 2014,
with almost 40% of additional coarse grains consumed over the past decade processed for
biofuels. Over the outlook period however, significantly lower crude oil prices result in
biofuel demand being closely tied to policies mandating their use. The share of US biofuel
mandates that can be met by maize based ethanol remains limited by the E10 blend wall,1
which, with decreasing domestic gasoline use over the medium-term, reduces growth
prospects. As a result, there is limited scope for further expansion in the demand for
biofuel, particularly in the United States and the European Union.
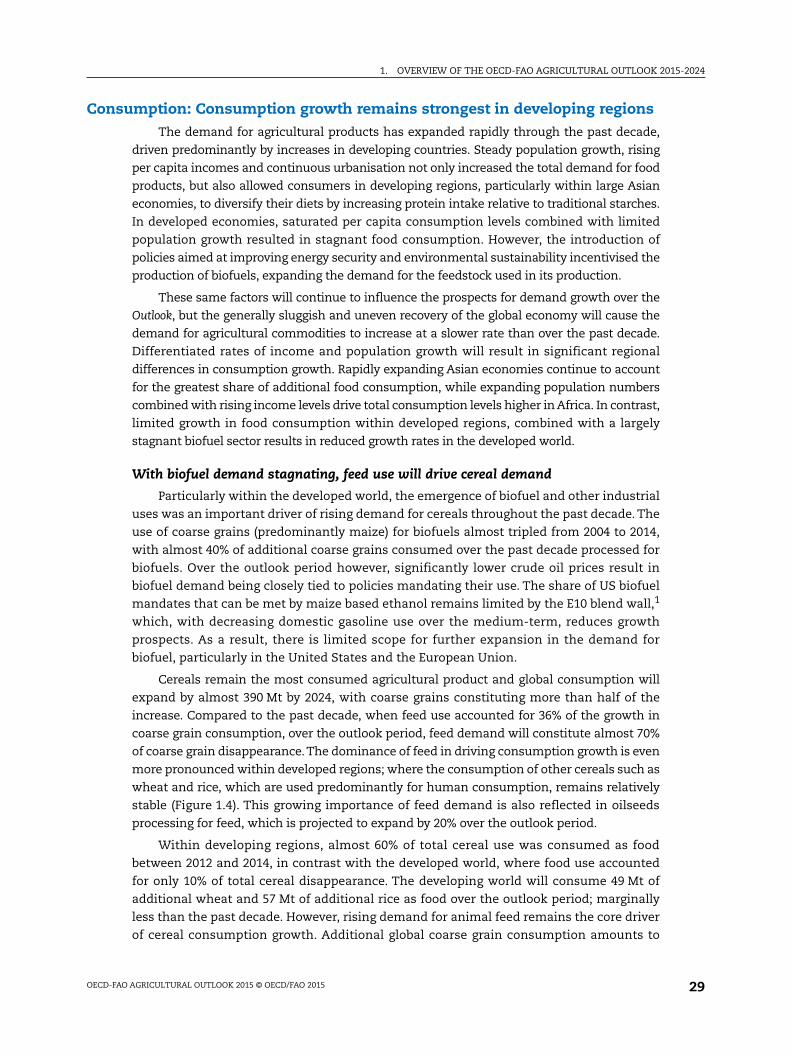
Cereals remain the most consumed agricultural product and global consumption will
expand by almost 390 Mt by 2024, with coarse grains constituting more than half of the
increase. Compared to the past decade, when feed use accounted for 36% of the growth in
coarse grain consumption, over the outlook period, feed demand will constitute almost 70%
of coarse grain disappearance.The dominance of feed in driving consumption growth is even
more pronounced within developed regions; where the consumption of other cereals such as
wheat and rice, which are used predominantly for human consumption, remains relatively
stable (Figure 1.4). This growing importance of feed demand is also reflected in oilseeds
processing for feed, which is projected to expand by 20% over the outlook period.
Within developing regions, almost 60% of total cereal use was consumed as food
between 2012 and 2014, in contrast with the developed world, where food use accounted
for only 10% of total cereal disappearance. The developing world will consume 49 Mt of
additional wheat and 57 Mt of additional rice as food over the outlook period; marginally
less than the past decade. However, rising demand for animal feed remains the core driver
of cereal consumption growth. Additional global coarse grain consumption amounts to
OECD-FAO AGRICULTURAL OUTLOOK 2015 © OECD/FAO 2015 29
1. OVERVIEW OF THE OECD-FAO AGRICULTURAL OUTLOOK 2015-2024
ata-en.228725
2024
225 Mt over the ten year period, of which feed demand constitutes 70%, while more than
68 Mt of additional oilseeds will be processed to feed, reflecting average annual growth
rates of 1.6% p.a. and 1.47% p.a. respectively.
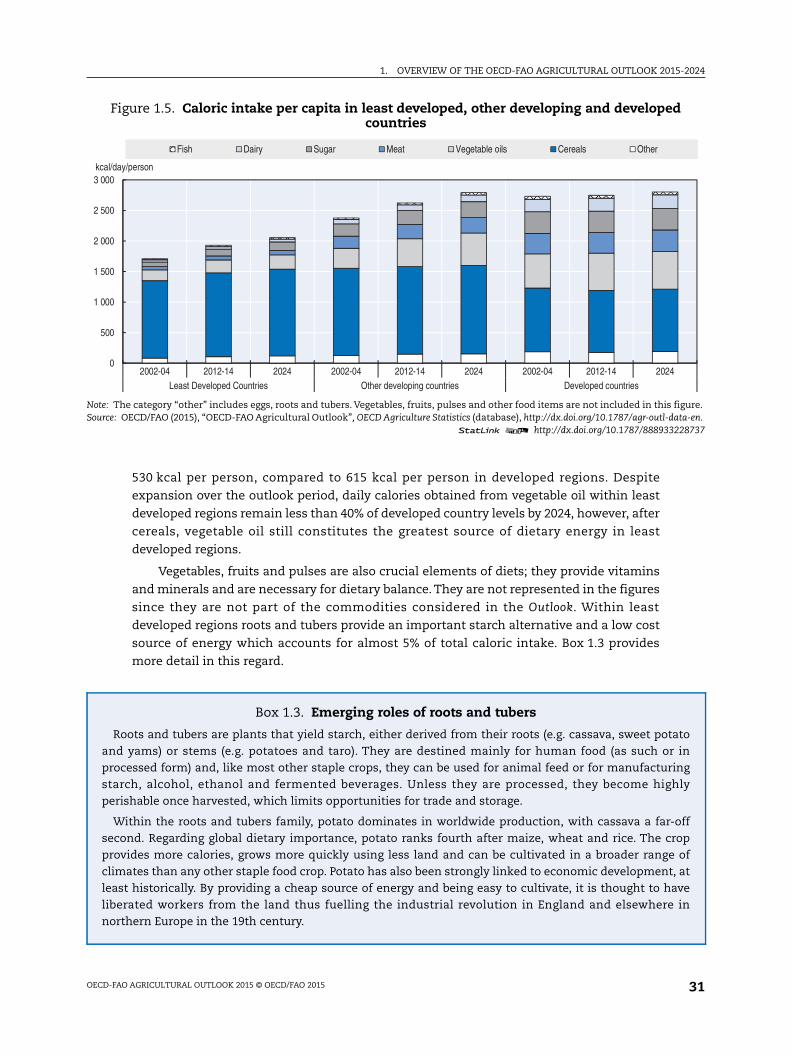
Caloric intake in developing regions continues to rise and diversify
Across most cultures, cereals are still the main staple component of the daily diet and
the single most important source of dietary energy. Rising incomes, changing preferences
and increasing urbanisation have led to dietary diversification, hence cereals currently
account for only 37% of total caloric intake obtained from commodities included in the
Outlook in developed countries, while they still supplied 71% in least developed countries
and 54% in the other developing countries (Figure 1.5). At a global level, total caloric intake
is expected to rise; however the rate of increase differs across regions and income levels.
Increasing by 6% over the 10 year projection period, total caloric intake in least developed
countries surpasses 2 000 kcal per person per day by 2024, which remains well below
developed country levels. Developing economies, excluding the least developed, exhibit
the greatest increase in total caloric intake per capita, rising to almost 2 800 kcal per person
per day by 2024, only marginally below the caloric intake projected for developed regions,
where further expansion of total caloric intake remains limited.
In addition to rising absolute levels, the constituents of total caloric intake from
modelled commodities continues to diversify, reflecting the changing dietary preferences
associated with rising income levels, urbanisation and shifts in consumption habits.
Calories obtained from cereals increase only marginally over the next ten years, but
increasing consumption of convenient, ready-made food results in higher demand for
sugar and vegetable oil, which account for the bulk of increased caloric intake in
developing regions. Global sugar consumption per capita expands by around 1.03% p.a.,
while vegetable oil consumption per capita will grow by an annual average of 0.84%,
however for both products, more than 95% of consumption growth will be concentrated in
the developing world. Vegetable oil in particular represents an affordable source of fat and
by 2024 daily calories obtained from vegetable oil in emerging economies will surpass
Figure 1.4. Main uses of cereals in developed and developing countries
Source: OECD/FAO (2015), “OECD-FAO Agricultural Outlook”, OECD Agriculture Statistics (database), http://dx.doi.org/10.1787/agr-outl-d1 2 http://dx.doi.org/10.1787/888933
0
100
200
300
400
500
600
700
800
900
2002-04 2012-14 2024 2002-04 2012-14 2024 2002-04 2012-14 2024 2002-04 2012-14 2024 2002-04 2012-14 2024 2002-04 2012-14Wheat Coarse grains Rice Wheat Coarse grains Rice
Developing countries Developed countries
Mt
Food Use Feed Use Biofuel Use Other Use
OECD-FAO AGRICULTURAL OUTLOOK 2015 © OECD/FAO 201530
1. OVERVIEW OF THE OECD-FAO AGRICULTURAL OUTLOOK 2015-2024
d
figure.ata-en.228737
atoin
inghly
offopof
, atvein
530 kcal per person, compared to 615 kcal per person in developed regions. Despite
expansion over the outlook period, daily calories obtained from vegetable oil within least
developed regions remain less than 40% of developed country levels by 2024, however, after
cereals, vegetable oil still constitutes the greatest source of dietary energy in least
developed regions.
Vegetables, fruits and pulses are also crucial elements of diets; they provide vitamins
and minerals and are necessary for dietary balance. They are not represented in the figures
since they are not part of the commodities considered in the Outlook. Within least
developed regions roots and tubers provide an important starch alternative and a low cost
source of energy which accounts for almost 5% of total caloric intake. Box 1.3 provides
more detail in this regard.
Figure 1.5. Caloric intake per capita in least developed, other developing and developecountries
Note: The category “other” includes eggs, roots and tubers. Vegetables, fruits, pulses and other food items are not included in thisSource: OECD/FAO (2015), “OECD-FAO Agricultural Outlook”, OECD Agriculture Statistics (database), http://dx.doi.org/10.1787/agr-outl-d
1 2 http://dx.doi.org/10.1787/888933
0
500
1 000
1 500
2 000
2 500
3 000
2002-04 2012-14 2024 2002-04 2012-14 2024 2002-04 2012-14 2024Least Developed Countries Other developing countries Developed countries
kcal/day/person
Fish Dairy Sugar Meat Vegetable oils Cereals Other
Box 1.3. Emerging roles of roots and tubers
Roots and tubers are plants that yield starch, either derived from their roots (e.g. cassava, sweet potand yams) or stems (e.g. potatoes and taro). They are destined mainly for human food (as such orprocessed form) and, like most other staple crops, they can be used for animal feed or for manufacturstarch, alcohol, ethanol and fermented beverages. Unless they are processed, they become higperishable once harvested, which limits opportunities for trade and storage.
Within the roots and tubers family, potato dominates in worldwide production, with cassava a far-second. Regarding global dietary importance, potato ranks fourth after maize, wheat and rice. The crprovides more calories, grows more quickly using less land and can be cultivated in a broader rangeclimates than any other staple food crop. Potato has also been strongly linked to economic developmentleast historically. By providing a cheap source of energy and being easy to cultivate, it is thought to haliberated workers from the land thus fuelling the industrial revolution in England and elsewherenorthern Europe in the 19th century.
OECD-FAO AGRICULTURAL OUTLOOK 2015 © OECD/FAO 2015 31
1. OVERVIEW OF THE OECD-FAO AGRICULTURAL OUTLOOK 2015-2024
ofionestt ithehe
745
ralnt
alebal
st,er
redbebyenof
in,ne,s ana,
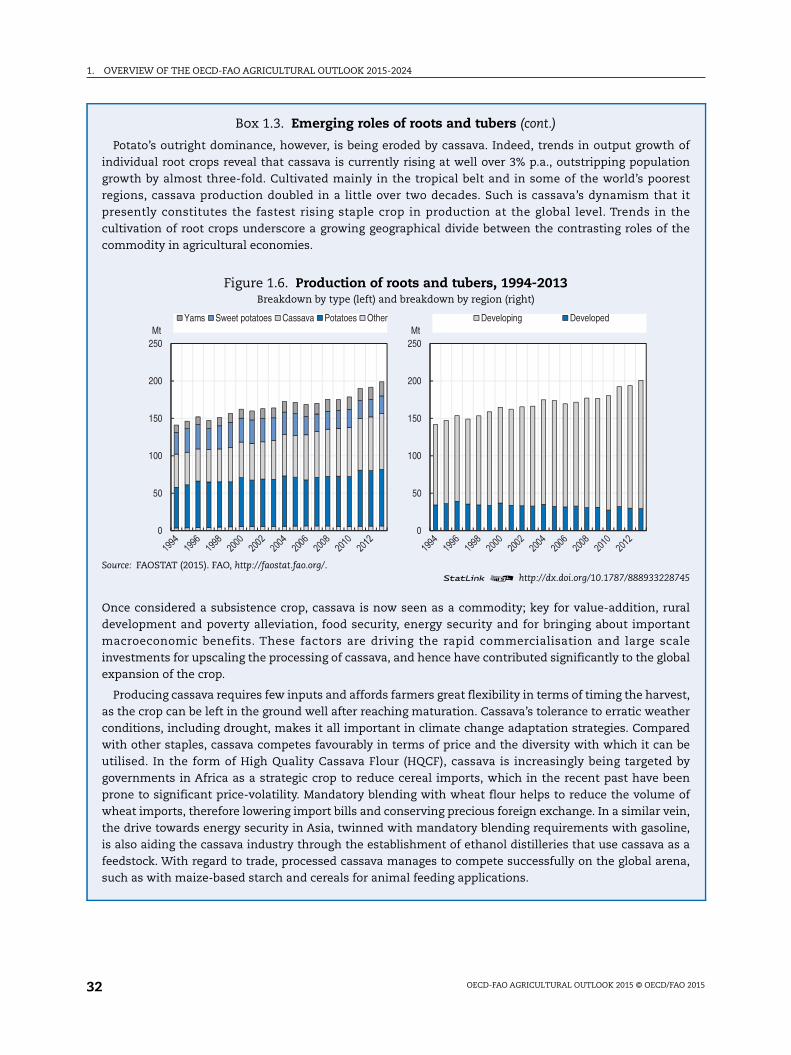
Box 1.3. Emerging roles of roots and tubers (cont.)
Potato’s outright dominance, however, is being eroded by cassava. Indeed, trends in output growthindividual root crops reveal that cassava is currently rising at well over 3% p.a., outstripping populatgrowth by almost three-fold. Cultivated mainly in the tropical belt and in some of the world’s poorregions, cassava production doubled in a little over two decades. Such is cassava’s dynamism thapresently constitutes the fastest rising staple crop in production at the global level. Trends in tcultivation of root crops underscore a growing geographical divide between the contrasting roles of tcommodity in agricultural economies.
Figure 1.6. Production of roots and tubers, 1994-2013Breakdown by type (left) and breakdown by region (right)
Source: FAOSTAT (2015). FAO, http://faostat.fao.org/.1 2 http://dx.doi.org/10.1787/888933228
Once considered a subsistence crop, cassava is now seen as a commodity; key for value-addition, rudevelopment and poverty alleviation, food security, energy security and for bringing about importamacroeconomic benefits. These factors are driving the rapid commercialisation and large scinvestments for upscaling the processing of cassava, and hence have contributed significantly to the gloexpansion of the crop.
Producing cassava requires few inputs and affords farmers great flexibility in terms of timing the harveas the crop can be left in the ground well after reaching maturation. Cassava’s tolerance to erratic weathconditions, including drought, makes it all important in climate change adaptation strategies. Compawith other staples, cassava competes favourably in terms of price and the diversity with which it canutilised. In the form of High Quality Cassava Flour (HQCF), cassava is increasingly being targetedgovernments in Africa as a strategic crop to reduce cereal imports, which in the recent past have beprone to significant price-volatility. Mandatory blending with wheat flour helps to reduce the volumewheat imports, therefore lowering import bills and conserving precious foreign exchange. In a similar vethe drive towards energy security in Asia, twinned with mandatory blending requirements with gasoliis also aiding the cassava industry through the establishment of ethanol distilleries that use cassava afeedstock. With regard to trade, processed cassava manages to compete successfully on the global aresuch as with maize-based starch and cereals for animal feeding applications.
0
50
100
150
200
250Mt
Yams Sweet potatoes Cassava Potatoes Other
0
50
100
150
200
250Mt
Developing Developed
OECD-FAO AGRICULTURAL OUTLOOK 2015 © OECD/FAO 201532
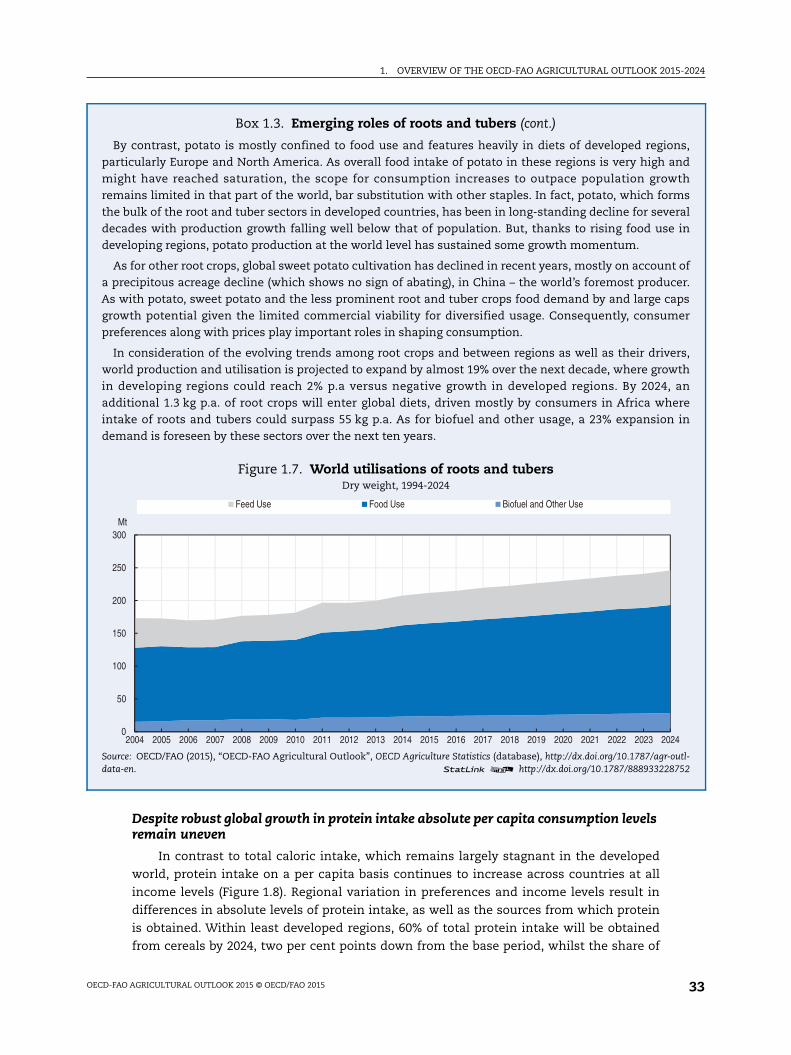
1. OVERVIEW OF THE OECD-FAO AGRICULTURAL OUTLOOK 2015-2024
ns,ndth
msralin
t ofer.pser
rs,than
erein
utl-752
4
Despite robust global growth in protein intake absolute per capita consumption levelsremain uneven
In contrast to total caloric intake, which remains largely stagnant in the developed
world, protein intake on a per capita basis continues to increase across countries at all
income levels (Figure 1.8). Regional variation in preferences and income levels result in
differences in absolute levels of protein intake, as well as the sources from which protein
is obtained. Within least developed regions, 60% of total protein intake will be obtained
from cereals by 2024, two per cent points down from the base period, whilst the share of
Box 1.3. Emerging roles of roots and tubers (cont.)
By contrast, potato is mostly confined to food use and features heavily in diets of developed regioparticularly Europe and North America. As overall food intake of potato in these regions is very high amight have reached saturation, the scope for consumption increases to outpace population growremains limited in that part of the world, bar substitution with other staples. In fact, potato, which forthe bulk of the root and tuber sectors in developed countries, has been in long-standing decline for sevedecades with production growth falling well below that of population. But, thanks to rising food usedeveloping regions, potato production at the world level has sustained some growth momentum.
As for other root crops, global sweet potato cultivation has declined in recent years, mostly on accouna precipitous acreage decline (which shows no sign of abating), in China – the world’s foremost producAs with potato, sweet potato and the less prominent root and tuber crops food demand by and large cagrowth potential given the limited commercial viability for diversified usage. Consequently, consumpreferences along with prices play important roles in shaping consumption.
In consideration of the evolving trends among root crops and between regions as well as their driveworld production and utilisation is projected to expand by almost 19% over the next decade, where growin developing regions could reach 2% p.a versus negative growth in developed regions. By 2024,additional 1.3 kg p.a. of root crops will enter global diets, driven mostly by consumers in Africa whintake of roots and tubers could surpass 55 kg p.a. As for biofuel and other usage, a 23% expansiondemand is foreseen by these sectors over the next ten years.
Figure 1.7. World utilisations of roots and tubersDry weight, 1994-2024
Source: OECD/FAO (2015), “OECD-FAO Agricultural Outlook”, OECD Agriculture Statistics (database), http://dx.doi.org/10.1787/agr-odata-en. 1 2 http://dx.doi.org/10.1787/888933228
0
50
100
150
200
250
300
2004 2005 2006 2007 2008 2009 2010 2011 2012 2013 2014 2015 2016 2017 2018 2019 2020 2021 2022 2023 202
Mt
Feed Use Food Use Biofuel and Other Use
OECD-FAO AGRICULTURAL OUTLOOK 2015 © OECD/FAO 2015 33
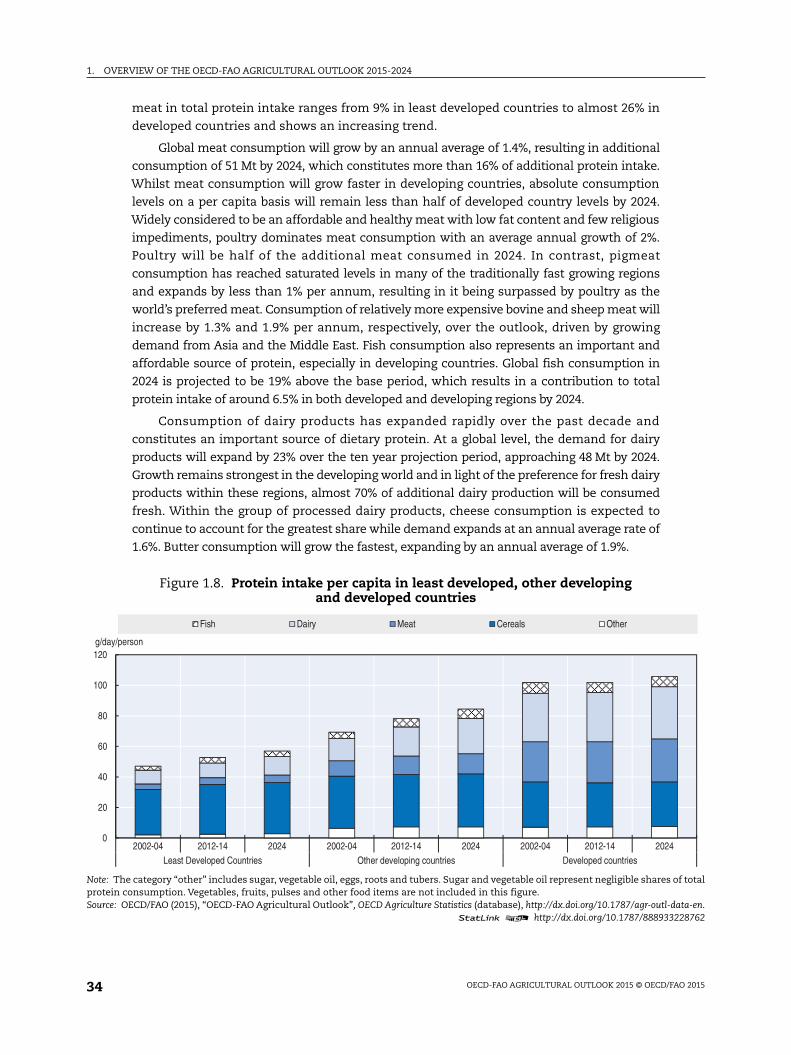
1. OVERVIEW OF THE OECD-FAO AGRICULTURAL OUTLOOK 2015-2024
of total
ata-en.228762
meat in total protein intake ranges from 9% in least developed countries to almost 26% in
developed countries and shows an increasing trend.
Global meat consumption will grow by an annual average of 1.4%, resulting in additional
consumption of 51 Mt by 2024, which constitutes more than 16% of additional protein intake.
Whilst meat consumption will grow faster in developing countries, absolute consumption
levels on a per capita basis will remain less than half of developed country levels by 2024.
Widely considered to be an affordable and healthy meat with low fat content and few religious
impediments, poultry dominates meat consumption with an average annual growth of 2%.
Poultry will be half of the additional meat consumed in 2024. In contrast, pigmeat
consumption has reached saturated levels in many of the traditionally fast growing regions
and expands by less than 1% per annum, resulting in it being surpassed by poultry as the
world’s preferred meat. Consumption of relatively more expensive bovine and sheep meat will
increase by 1.3% and 1.9% per annum, respectively, over the outlook, driven by growing
demand from Asia and the Middle East. Fish consumption also represents an important and
affordable source of protein, especially in developing countries. Global fish consumption in
2024 is projected to be 19% above the base period, which results in a contribution to total
protein intake of around 6.5% in both developed and developing regions by 2024.
Consumption of dairy products has expanded rapidly over the past decade and
constitutes an important source of dietary protein. At a global level, the demand for dairy
products will expand by 23% over the ten year projection period, approaching 48 Mt by 2024.
Growth remains strongest in the developing world and in light of the preference for fresh dairy
products within these regions, almost 70% of additional dairy production will be consumed
fresh. Within the group of processed dairy products, cheese consumption is expected to
continue to account for the greatest share while demand expands at an annual average rate of
1.6%. Butter consumption will grow the fastest, expanding by an annual average of 1.9%.
Figure 1.8. Protein intake per capita in least developed, other developingand developed countries
Note: The category “other” includes sugar, vegetable oil, eggs, roots and tubers. Sugar and vegetable oil represent negligible sharesprotein consumption. Vegetables, fruits, pulses and other food items are not included in this figure.Source: OECD/FAO (2015), “OECD-FAO Agricultural Outlook”, OECD Agriculture Statistics (database), http://dx.doi.org/10.1787/agr-outl-d
1 2 http://dx.doi.org/10.1787/888933
0
20
40
60
80
100
120
2002-04 2012-14 2024 2002-04 2012-14 2024 2002-04 2012-14 2024Least Developed Countries Other developing countries Developed countries
g/day/person
Fish Dairy Meat Cereals Other
OECD-FAO AGRICULTURAL OUTLOOK 2015 © OECD/FAO 201534
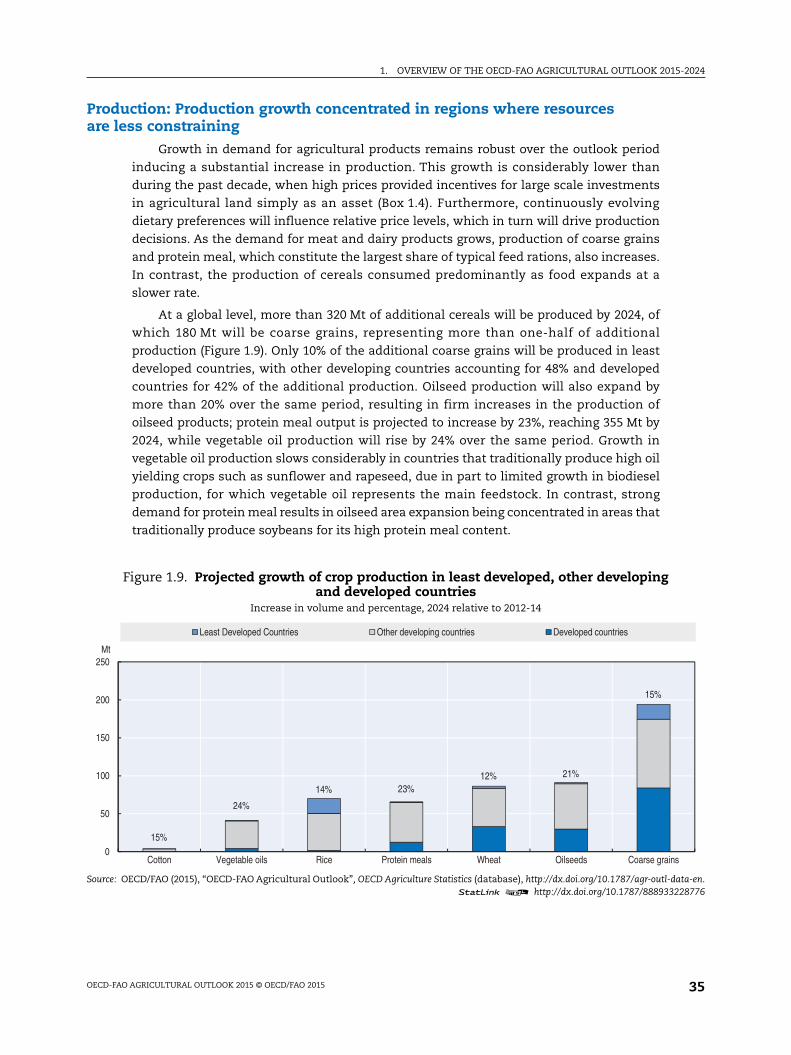
1. OVERVIEW OF THE OECD-FAO AGRICULTURAL OUTLOOK 2015-2024
ata-en.228776
s
Production: Production growth concentrated in regions where resourcesare less constraining
Growth in demand for agricultural products remains robust over the outlook period
inducing a substantial increase in production. This growth is considerably lower than
during the past decade, when high prices provided incentives for large scale investments
in agricultural land simply as an asset (Box 1.4). Furthermore, continuously evolving
dietary preferences will influence relative price levels, which in turn will drive production
decisions. As the demand for meat and dairy products grows, production of coarse grains
and protein meal, which constitute the largest share of typical feed rations, also increases.
In contrast, the production of cereals consumed predominantly as food expands at a
slower rate.
At a global level, more than 320 Mt of additional cereals will be produced by 2024, of
which 180 Mt will be coarse grains, representing more than one-half of additional
production (Figure 1.9). Only 10% of the additional coarse grains will be produced in least
developed countries, with other developing countries accounting for 48% and developed
countries for 42% of the additional production. Oilseed production will also expand by
more than 20% over the same period, resulting in firm increases in the production of
oilseed products; protein meal output is projected to increase by 23%, reaching 355 Mt by
2024, while vegetable oil production will rise by 24% over the same period. Growth in
vegetable oil production slows considerably in countries that traditionally produce high oil
yielding crops such as sunflower and rapeseed, due in part to limited growth in biodiesel
production, for which vegetable oil represents the main feedstock. In contrast, strong
demand for protein meal results in oilseed area expansion being concentrated in areas that
traditionally produce soybeans for its high protein meal content.
Figure 1.9. Projected growth of crop production in least developed, other developingand developed countries
Increase in volume and percentage, 2024 relative to 2012-14
Source: OECD/FAO (2015), “OECD-FAO Agricultural Outlook”, OECD Agriculture Statistics (database), http://dx.doi.org/10.1787/agr-outl-d1 2 http://dx.doi.org/10.1787/888933
15%
24%
14% 23%12% 21%
15%
0
50
100
150
200
250
Cotton Vegetable oils Rice Protein meals Wheat Oilseeds Coarse grain
Mt
Least Developed Countries Other developing countries Developed countries
OECD-FAO AGRICULTURAL OUTLOOK 2015 © OECD/FAO 2015 35
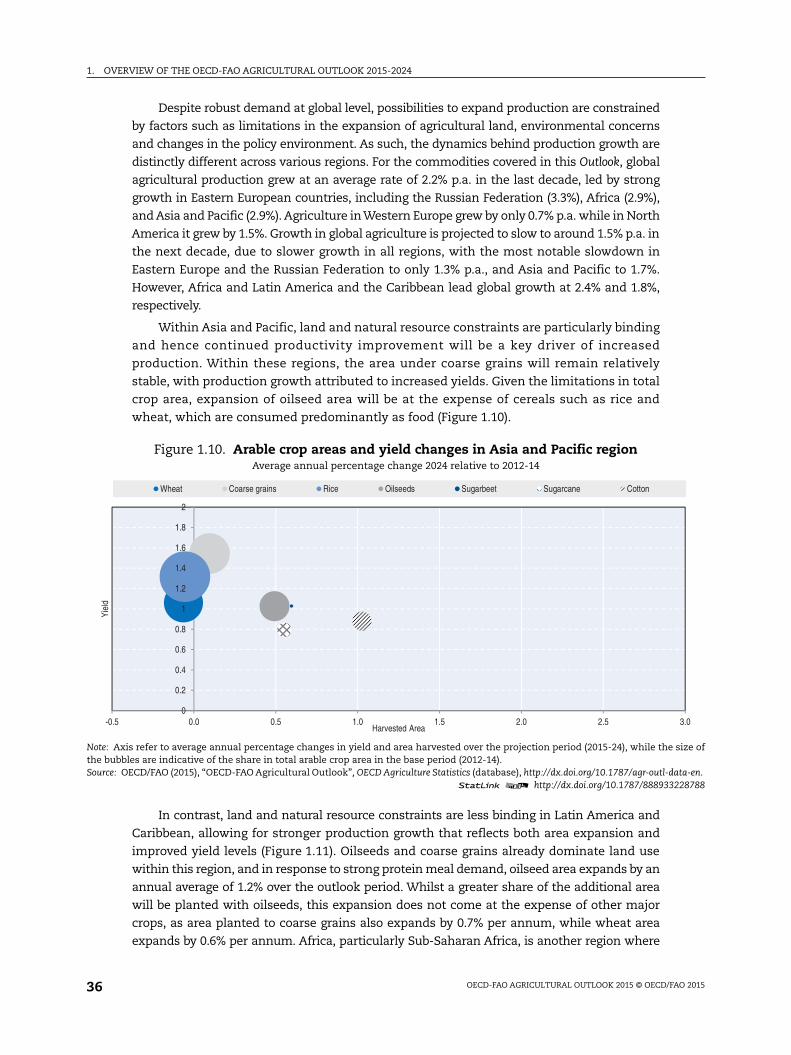
1. OVERVIEW OF THE OECD-FAO AGRICULTURAL OUTLOOK 2015-2024
size of
ata-en.228788
3.0
Despite robust demand at global level, possibilities to expand production are constrained
by factors such as limitations in the expansion of agricultural land, environmental concerns
and changes in the policy environment. As such, the dynamics behind production growth are
distinctly different across various regions. For the commodities covered in this Outlook, global
agricultural production grew at an average rate of 2.2% p.a. in the last decade, led by strong
growth in Eastern European countries, including the Russian Federation (3.3%), Africa (2.9%),
and Asia and Pacific (2.9%). Agriculture in Western Europe grew by only 0.7% p.a. while in North
America it grew by 1.5%. Growth in global agriculture is projected to slow to around 1.5% p.a. in
the next decade, due to slower growth in all regions, with the most notable slowdown in
Eastern Europe and the Russian Federation to only 1.3% p.a., and Asia and Pacific to 1.7%.
However, Africa and Latin America and the Caribbean lead global growth at 2.4% and 1.8%,
respectively.
Within Asia and Pacific, land and natural resource constraints are particularly binding
and hence continued productivity improvement will be a key driver of increased
production. Within these regions, the area under coarse grains will remain relatively
stable, with production growth attributed to increased yields. Given the limitations in total
crop area, expansion of oilseed area will be at the expense of cereals such as rice and
wheat, which are consumed predominantly as food (Figure 1.10).
In contrast, land and natural resource constraints are less binding in Latin America and
Caribbean, allowing for stronger production growth that reflects both area expansion and
improved yield levels (Figure 1.11). Oilseeds and coarse grains already dominate land use
within this region, and in response to strong protein meal demand, oilseed area expands by an
annual average of 1.2% over the outlook period. Whilst a greater share of the additional area
will be planted with oilseeds, this expansion does not come at the expense of other major
crops, as area planted to coarse grains also expands by 0.7% per annum, while wheat area
expands by 0.6% per annum. Africa, particularly Sub-Saharan Africa, is another region where
Figure 1.10. Arable crop areas and yield changes in Asia and Pacific regionAverage annual percentage change 2024 relative to 2012-14
Note: Axis refer to average annual percentage changes in yield and area harvested over the projection period (2015-24), while thethe bubbles are indicative of the share in total arable crop area in the base period (2012-14).Source: OECD/FAO (2015), “OECD-FAO Agricultural Outlook”, OECD Agriculture Statistics (database), http://dx.doi.org/10.1787/agr-outl-d
1 2 http://dx.doi.org/10.1787/888933
0
0.2
0.4
0.6
0.8
1
1.2
1.4
1.6
1.8
2
-0.5 0.0 0.5 1.0 1.5 2.0 2.5
Yiel
d
Harvested Area
Wheat Coarse grains Rice Oilseeds Sugarbeet Sugarcane Cotton
OECD-FAO AGRICULTURAL OUTLOOK 2015 © OECD/FAO 201536
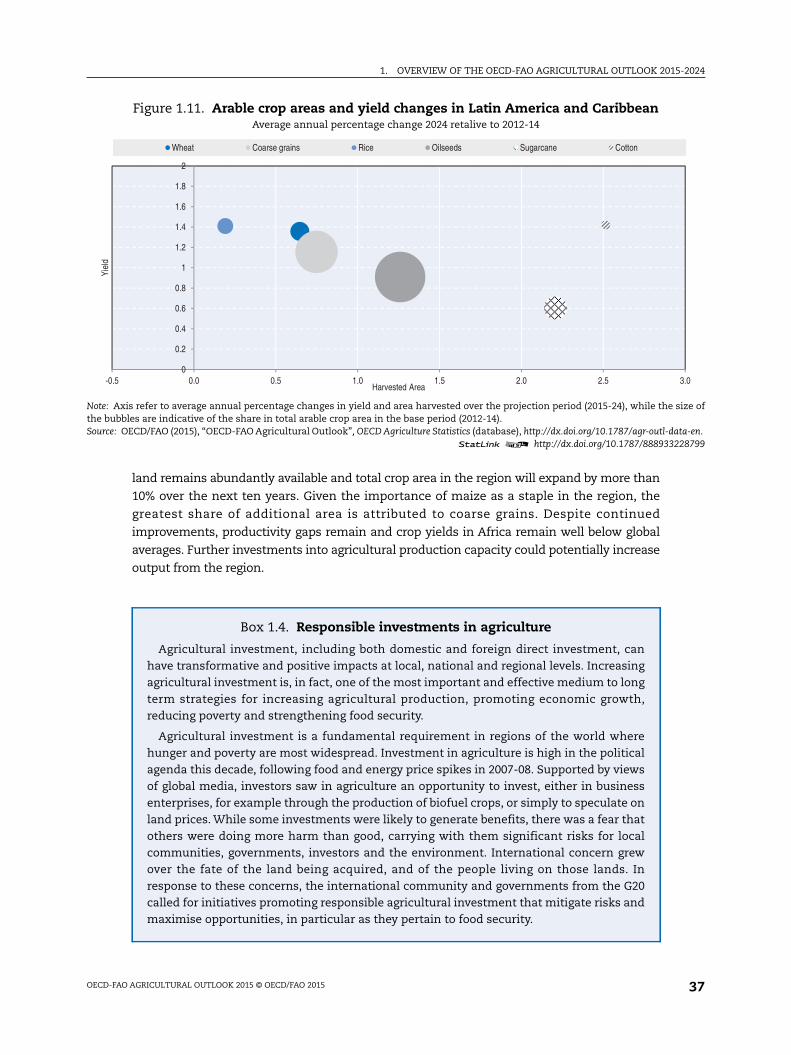
1. OVERVIEW OF THE OECD-FAO AGRICULTURAL OUTLOOK 2015-2024
size of
ata-en.228799
3.0
land remains abundantly available and total crop area in the region will expand by more than
10% over the next ten years. Given the importance of maize as a staple in the region, the
greatest share of additional area is attributed to coarse grains. Despite continued
improvements, productivity gaps remain and crop yields in Africa remain well below global
averages. Further investments into agricultural production capacity could potentially increase
output from the region.
Figure 1.11. Arable crop areas and yield changes in Latin America and CaribbeanAverage annual percentage change 2024 retalive to 2012-14
Note: Axis refer to average annual percentage changes in yield and area harvested over the projection period (2015-24), while thethe bubbles are indicative of the share in total arable crop area in the base period (2012-14).Source: OECD/FAO (2015), “OECD-FAO Agricultural Outlook”, OECD Agriculture Statistics (database), http://dx.doi.org/10.1787/agr-outl-d
1 2 http://dx.doi.org/10.1787/888933
0
0.2
0.4
0.6
0.8
1
1.2
1.4
1.6
1.8
2
-0.5 0.0 0.5 1.0 1.5 2.0 2.5
Yiel
d
Harvested Area
Wheat Coarse grains Rice Oilseeds Sugarcane Cotton
Box 1.4. Responsible investments in agriculture
Agricultural investment, including both domestic and foreign direct investment, canhave transformative and positive impacts at local, national and regional levels. Increasingagricultural investment is, in fact, one of the most important and effective medium to longterm strategies for increasing agricultural production, promoting economic growth,reducing poverty and strengthening food security.
Agricultural investment is a fundamental requirement in regions of the world wherehunger and poverty are most widespread. Investment in agriculture is high in the politicalagenda this decade, following food and energy price spikes in 2007-08. Supported by viewsof global media, investors saw in agriculture an opportunity to invest, either in businessenterprises, for example through the production of biofuel crops, or simply to speculate onland prices. While some investments were likely to generate benefits, there was a fear thatothers were doing more harm than good, carrying with them significant risks for localcommunities, governments, investors and the environment. International concern grewover the fate of the land being acquired, and of the people living on those lands. Inresponse to these concerns, the international community and governments from the G20called for initiatives promoting responsible agricultural investment that mitigate risks andmaximise opportunities, in particular as they pertain to food security.
OECD-FAO AGRICULTURAL OUTLOOK 2015 © OECD/FAO 2015 37
1. OVERVIEW OF THE OECD-FAO AGRICULTURAL OUTLOOK 2015-2024
Despite representing only a small share of total crop area at a global level, cotton is
dynamic, with area expanding by 6% over the ten year projection period. Production growth is
however becoming more concentrated in lower yielding areas and hence, at a global level, yield
improvements will be limited to an average of 1.1% p.a. Nevertheless, the combination of area
expansion and yield increases results in robust production growth across most regions, with
China being the only significant producer where production is not projected to increase.
Policies continue to influence biofuel production decisions
The evolution of the biofuel sector over the past decade has been influenced strongly
by the introduction of various policies including support measures and mandated blending
levels. Over periods of high fossil fuel prices, the use of ethanol as an octane additive
expanded rapidly. However, in light of the significantly lower oil price assumption over the
outlook period, biofuel production will be tied closely to the policies mandating its use. In
the United States and the European Union, these policies are not expected to require
significantly higher biofuel production over the next ten years and limited production
growth in the United States will arise mostly from ligno-cellulosic biomass based ethanol.
In contrast, Brazilian ethanol blending mandates have recently been increased to 27%
and differential taxes have been put in place that favour the domestic hydrous ethanol
industry. The Outlook also assumes that domestic gasoline prices will be kept above
international ones in the early years of the projection period and that logistical issues will
limit ethanol import possibilities in the short run. Consequently, the cost efficient
domestic ethanol industry in Brazil is set to produce over the next ten years two-thirds of
the additional global ethanol supply, with sugarcane as the main feedstock. Global
Box 1.4. Responsible investments in agriculture (cont.)
Various attempts were made to develop normative frameworks that would not justtackle these concerns, but also promote and trigger much needed, and better, agriculturalinvestment. Examples include the Principles for Responsible Investment in Agriculture and FoodSystems, developed by the Committee on World Food Security in 2014 the Principles forResponsible Agricultural Investment that Respects Rights, Livelihoods and Resources jointlydeveloped by FAO, UNCTAD, IFAD and the World Bank in 2009, and the FAO-OECD Guidancefor Responsible Agricultural Supply Chains, currently under development, which providesa synthesis of existing standards. These voluntary instruments, which are complementaryto each other, are meant to provide frameworks for stakeholders to develop nationalpolicies, strategies, regulatory frameworks, corporate social responsibility programmes,individual agreements and contracts.
The analysis presented in this OECD-FAO Agricultural Outlook suggests that theagricultural commodity price levels that triggered large scale investment this decade willfall considerably over the next decade. The profitability of biofuel production is underpressure from low non-renewable fuel prices and as food prices move back to their longterm secular downward trend. The new Outlook scenario is unlikely to sustain the currententhusiasm for investment in agriculture, but this is not a reason for abandoning thesenormative instruments. Quite the opposite; the adoption of normative instruments willhelp make investments profitable for both investors and host communities and istherefore expected to have a positive impact on agricultural production in the mediumterm.
OECD-FAO AGRICULTURAL OUTLOOK 2015 © OECD/FAO 201538
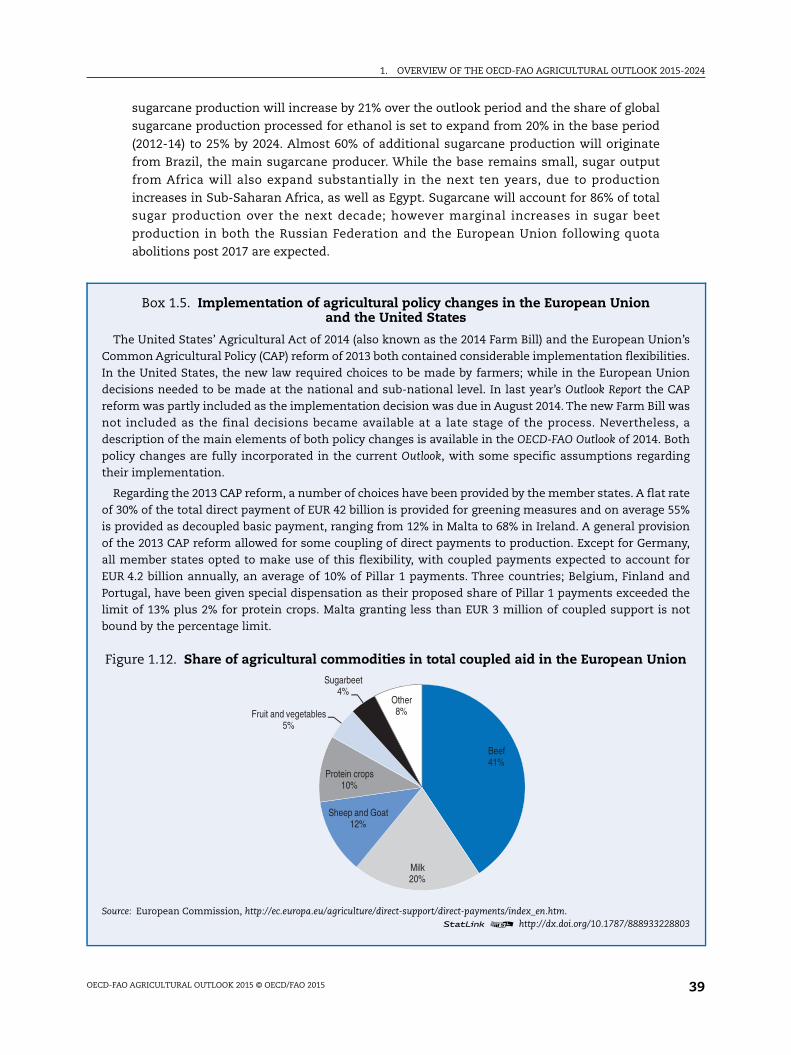
1. OVERVIEW OF THE OECD-FAO AGRICULTURAL OUTLOOK 2015-2024
n’ses.ionAPas, ath
ing
ate5%ionny,fornd
theot
n
803
sugarcane production will increase by 21% over the outlook period and the share of global
sugarcane production processed for ethanol is set to expand from 20% in the base period
(2012-14) to 25% by 2024. Almost 60% of additional sugarcane production will originate
from Brazil, the main sugarcane producer. While the base remains small, sugar output
from Africa will also expand substantially in the next ten years, due to production
increases in Sub-Saharan Africa, as well as Egypt. Sugarcane will account for 86% of total
sugar production over the next decade; however marginal increases in sugar beet
production in both the Russian Federation and the European Union following quota
abolitions post 2017 are expected.
Box 1.5. Implementation of agricultural policy changes in the European Unionand the United States
The United States’ Agricultural Act of 2014 (also known as the 2014 Farm Bill) and the European UnioCommon Agricultural Policy (CAP) reform of 2013 both contained considerable implementation flexibilitiIn the United States, the new law required choices to be made by farmers; while in the European Undecisions needed to be made at the national and sub-national level. In last year’s Outlook Report the Creform was partly included as the implementation decision was due in August 2014. The new Farm Bill wnot included as the final decisions became available at a late stage of the process. Neverthelessdescription of the main elements of both policy changes is available in the OECD-FAO Outlook of 2014. Bopolicy changes are fully incorporated in the current Outlook, with some specific assumptions regardtheir implementation.
Regarding the 2013 CAP reform, a number of choices have been provided by the member states. A flat rof 30% of the total direct payment of EUR 42 billion is provided for greening measures and on average 5is provided as decoupled basic payment, ranging from 12% in Malta to 68% in Ireland. A general provisof the 2013 CAP reform allowed for some coupling of direct payments to production. Except for Germaall member states opted to make use of this flexibility, with coupled payments expected to accountEUR 4.2 billion annually, an average of 10% of Pillar 1 payments. Three countries; Belgium, Finland aPortugal, have been given special dispensation as their proposed share of Pillar 1 payments exceededlimit of 13% plus 2% for protein crops. Malta granting less than EUR 3 million of coupled support is nbound by the percentage limit.
Figure 1.12. Share of agricultural commodities in total coupled aid in the European Unio
Source: European Commission, http://ec.europa.eu/agriculture/direct-support/direct-payments/index_en.htm.1 2 http://dx.doi.org/10.1787/888933228
Beef41%
Milk20%
Sheep and Goat12%
Protein crops10%
Fruit and vegetables5%
Sugarbeet4%
Other8%
OECD-FAO AGRICULTURAL OUTLOOK 2015 © OECD/FAO 2015 39
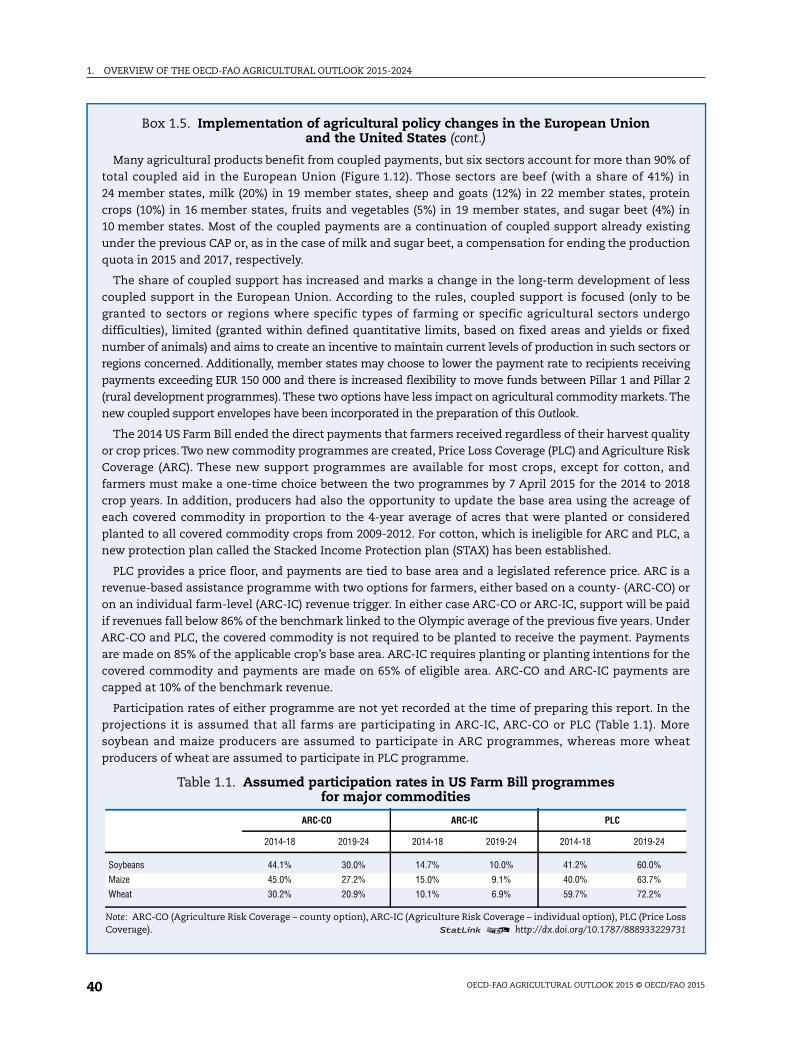
1. OVERVIEW OF THE OECD-FAO AGRICULTURAL OUTLOOK 2015-2024
ofin
einin
ingion
essbe
rgoedor
ingr 2he
lityisknd18ofed, a
s a) oraidderntstheare
here
eat
ss31
Box 1.5. Implementation of agricultural policy changes in the European Unionand the United States (cont.)
Many agricultural products benefit from coupled payments, but six sectors account for more than 90%total coupled aid in the European Union (Figure 1.12). Those sectors are beef (with a share of 41%)24 member states, milk (20%) in 19 member states, sheep and goats (12%) in 22 member states, protcrops (10%) in 16 member states, fruits and vegetables (5%) in 19 member states, and sugar beet (4%)10 member states. Most of the coupled payments are a continuation of coupled support already existunder the previous CAP or, as in the case of milk and sugar beet, a compensation for ending the productquota in 2015 and 2017, respectively.
The share of coupled support has increased and marks a change in the long-term development of lcoupled support in the European Union. According to the rules, coupled support is focused (only togranted to sectors or regions where specific types of farming or specific agricultural sectors undedifficulties), limited (granted within defined quantitative limits, based on fixed areas and yields or fixnumber of animals) and aims to create an incentive to maintain current levels of production in such sectorsregions concerned. Additionally, member states may choose to lower the payment rate to recipients receivpayments exceeding EUR 150 000 and there is increased flexibility to move funds between Pillar 1 and Pilla(rural development programmes). These two options have less impact on agricultural commodity markets. Tnew coupled support envelopes have been incorporated in the preparation of this Outlook.
The 2014 US Farm Bill ended the direct payments that farmers received regardless of their harvest quaor crop prices. Two new commodity programmes are created, Price Loss Coverage (PLC) and Agriculture RCoverage (ARC). These new support programmes are available for most crops, except for cotton, afarmers must make a one-time choice between the two programmes by 7 April 2015 for the 2014 to 20crop years. In addition, producers had also the opportunity to update the base area using the acreageeach covered commodity in proportion to the 4-year average of acres that were planted or considerplanted to all covered commodity crops from 2009-2012. For cotton, which is ineligible for ARC and PLCnew protection plan called the Stacked Income Protection plan (STAX) has been established.
PLC provides a price floor, and payments are tied to base area and a legislated reference price. ARC irevenue-based assistance programme with two options for farmers, either based on a county- (ARC-COon an individual farm-level (ARC-IC) revenue trigger. In either case ARC-CO or ARC-IC, support will be pif revenues fall below 86% of the benchmark linked to the Olympic average of the previous five years. UnARC-CO and PLC, the covered commodity is not required to be planted to receive the payment. Paymeare made on 85% of the applicable crop’s base area. ARC-IC requires planting or planting intentions forcovered commodity and payments are made on 65% of eligible area. ARC-CO and ARC-IC paymentscapped at 10% of the benchmark revenue.
Participation rates of either programme are not yet recorded at the time of preparing this report. In tprojections it is assumed that all farms are participating in ARC-IC, ARC-CO or PLC (Table 1.1). Mosoybean and maize producers are assumed to participate in ARC programmes, whereas more whproducers of wheat are assumed to participate in PLC programme.
Table 1.1. Assumed participation rates in US Farm Bill programmesfor major commodities
ARC-CO ARC-IC PLC
2014-18 2019-24 2014-18 2019-24 2014-18 2019-24
Soybeans 44.1% 30.0% 14.7% 10.0% 41.2% 60.0%
Maize 45.0% 27.2% 15.0% 9.1% 40.0% 63.7%
Wheat 30.2% 20.9% 10.1% 6.9% 59.7% 72.2%
Note: ARC-CO (Agriculture Risk Coverage – county option), ARC-IC (Agriculture Risk Coverage – individual option), PLC (Price LoCoverage). 1 2 http://dx.doi.org/10.1787/8889332297
OECD-FAO AGRICULTURAL OUTLOOK 2015 © OECD/FAO 201540
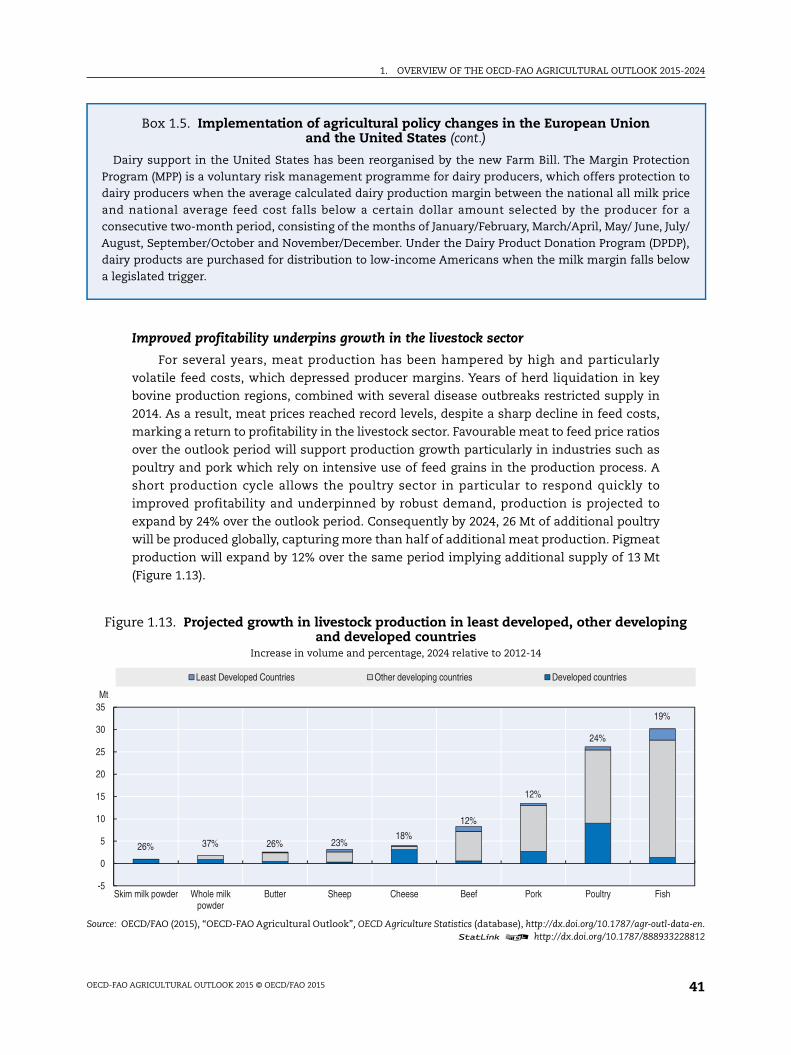
1. OVERVIEW OF THE OECD-FAO AGRICULTURAL OUTLOOK 2015-2024
ionto
icer aly/P),ow
g
ata-en.228812
Improved profitability underpins growth in the livestock sector
For several years, meat production has been hampered by high and particularly
volatile feed costs, which depressed producer margins. Years of herd liquidation in key
bovine production regions, combined with several disease outbreaks restricted supply in
2014. As a result, meat prices reached record levels, despite a sharp decline in feed costs,
marking a return to profitability in the livestock sector. Favourable meat to feed price ratios
over the outlook period will support production growth particularly in industries such as
poultry and pork which rely on intensive use of feed grains in the production process. A
short production cycle allows the poultry sector in particular to respond quickly to
improved profitability and underpinned by robust demand, production is projected to
expand by 24% over the outlook period. Consequently by 2024, 26 Mt of additional poultry
will be produced globally, capturing more than half of additional meat production. Pigmeat
production will expand by 12% over the same period implying additional supply of 13 Mt
(Figure 1.13).
Box 1.5. Implementation of agricultural policy changes in the European Unionand the United States (cont.)
Dairy support in the United States has been reorganised by the new Farm Bill. The Margin ProtectProgram (MPP) is a voluntary risk management programme for dairy producers, which offers protectiondairy producers when the average calculated dairy production margin between the national all milk prand national average feed cost falls below a certain dollar amount selected by the producer foconsecutive two-month period, consisting of the months of January/February, March/April, May/ June, JuAugust, September/October and November/December. Under the Dairy Product Donation Program (DPDdairy products are purchased for distribution to low-income Americans when the milk margin falls bela legislated trigger.
Figure 1.13. Projected growth in livestock production in least developed, other developinand developed countries
Increase in volume and percentage, 2024 relative to 2012-14
Source: OECD/FAO (2015), “OECD-FAO Agricultural Outlook”, OECD Agriculture Statistics (database), http://dx.doi.org/10.1787/agr-outl-d1 2 http://dx.doi.org/10.1787/888933
26% 37% 26% 23%18%
12%
12%
24%
19%
-5
0
5
10
15
20
25
30
35
Skim milk powder Whole milkpowder
Butter Sheep Cheese Beef Pork Poultry Fish
Mt
Least Developed Countries Other developing countries Developed countries
OECD-FAO AGRICULTURAL OUTLOOK 2015 © OECD/FAO 2015 41
1. OVERVIEW OF THE OECD-FAO AGRICULTURAL OUTLOOK 2015-2024
Least developed countries, which are less reliant on feed grains in producing poultry
and pigmeat, will account for a very limited share of additional output. Instead growth is
dominated by other developing countries, where reduced feed prices result in greater
intensification and hence rising use of feed in the production system. In 2024, these
developing countries, excluding the least developed countries, will account for 58% and
77% of the additional poultry and pigmeat production, respectively. Within many
developed regions, environmental regulations combined with more stringent animal
welfare regulations limit the potential for further expansion and hence production growth
is slower.
Bovine production exhibits greater flexibility in feeding regimes and extensive
production in least developed countries accounts for 13% of the additional 8 Mt of bovine
meat produced by 2024. The developing countries, excluding the least developed countries,
continue to dominate and represent 79% of additional bovine production: together, Brazil,
China and India account for 42% of the additional production supply. At a global level,
sheep production will expand at a faster rate relative to the past decade and slightly less
than 40% of the additional 3 Mt of sheep meat produced by 2024 will originate from China.
Sheep production is largely pasture based and particularly in New Zealand, one of the
largest sheep meat exporters, production continues to be influenced by competition for
pasture from the dairy sector.
Rising milk production throughout the past decade was a result of dairy herd
expansion, as average yields declined by an annual average of 0.2%, due to a fast increasing
dairy herd in low yield regions. Over the outlook period, milk production is projected to
increase by an annual average of 1.8%, with the bulk of the additional milk produced in
developing countries, notably India, which overtakes the European Union to become the
largest milk producer in the world. Lower costs will increase feed use in the production
system, resulting in higher milk production per dairy cow. Consequently, within
developing countries, growth in milk production will result from both herd expansion and
productivity gains. In contrast, dairy herds are projected to decline in most developed
countries, reflecting productivity gains, as well as constraints in water and land
availability.
Production of the four main dairy products will follow the trend of milk production
over the outlook period. Butter and whole milk powder (WMP) production will expand
faster, at 2.2% p.a. and 2.7% p.a. respectively, as the bulk of these products are produced in
developing countries. Cheese and skim milk powder (SMP) production is however
concentrated in developed countries and, in line with slower growth in milk production in
these countries, production will grow by an annual average of 1.5% p.a. and 1.8% p.a.,
respectively.
Fishery production will expand by more than 30 Mt over the outlook period, 96% of
which will be produced in developing countries. Aquaculture remains one of the fastest
growing food sectors and while growth slows from the past decade, it accounts for the
majority of additional fish production and is set to surpass captured fisheries by 2023.
Nevertheless, capture remains dominant for certain species and, particularly in developing
countries, captured fish provide an affordable source of protein.
OECD-FAO AGRICULTURAL OUTLOOK 2015 © OECD/FAO 201542
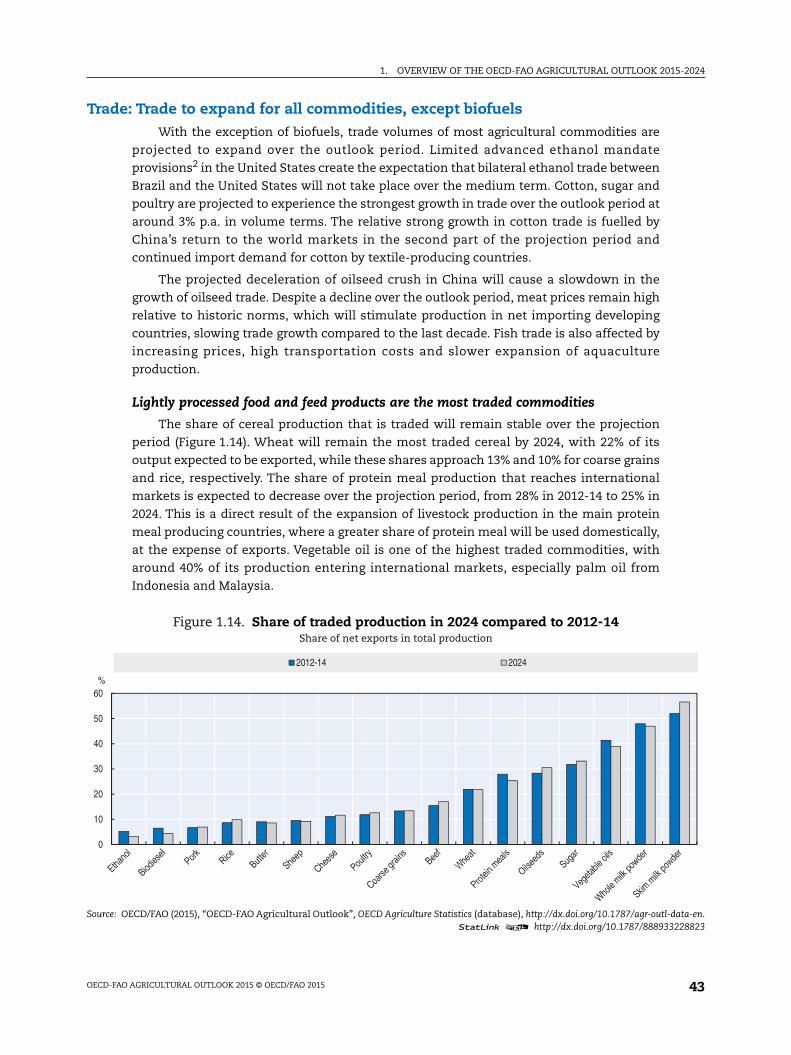
1. OVERVIEW OF THE OECD-FAO AGRICULTURAL OUTLOOK 2015-2024
ata-en.228823
Trade: Trade to expand for all commodities, except biofuelsWith the exception of biofuels, trade volumes of most agricultural commodities are
projected to expand over the outlook period. Limited advanced ethanol mandate
provisions2 in the United States create the expectation that bilateral ethanol trade between
Brazil and the United States will not take place over the medium term. Cotton, sugar and
poultry are projected to experience the strongest growth in trade over the outlook period at
around 3% p.a. in volume terms. The relative strong growth in cotton trade is fuelled by
China’s return to the world markets in the second part of the projection period and
continued import demand for cotton by textile-producing countries.
The projected deceleration of oilseed crush in China will cause a slowdown in the
growth of oilseed trade. Despite a decline over the outlook period, meat prices remain high
relative to historic norms, which will stimulate production in net importing developing
countries, slowing trade growth compared to the last decade. Fish trade is also affected by
increasing prices, high transportation costs and slower expansion of aquaculture
production.
Lightly processed food and feed products are the most traded commodities
The share of cereal production that is traded will remain stable over the projection
period (Figure 1.14). Wheat will remain the most traded cereal by 2024, with 22% of its
output expected to be exported, while these shares approach 13% and 10% for coarse grains
and rice, respectively. The share of protein meal production that reaches international
markets is expected to decrease over the projection period, from 28% in 2012-14 to 25% in
2024. This is a direct result of the expansion of livestock production in the main protein
meal producing countries, where a greater share of protein meal will be used domestically,
at the expense of exports. Vegetable oil is one of the highest traded commodities, with
around 40% of its production entering international markets, especially palm oil from
Indonesia and Malaysia.
Figure 1.14. Share of traded production in 2024 compared to 2012-14Share of net exports in total production
Source: OECD/FAO (2015), “OECD-FAO Agricultural Outlook”, OECD Agriculture Statistics (database), http://dx.doi.org/10.1787/agr-outl-d1 2 http://dx.doi.org/10.1787/888933
0
10
20
30
40
50
60%
2012-14 2024
OECD-FAO AGRICULTURAL OUTLOOK 2015 © OECD/FAO 2015 43
1. OVERVIEW OF THE OECD-FAO AGRICULTURAL OUTLOOK 2015-2024
Ethanol trade as a share of production is expected to decrease over the outlook period
as import demandfrom major consuming countries is expected to remain limited. Meat
exports will expand at a similar rate to production, resulting in relatively constant shares
of trade in total production. Exports from the European Union, the second largest exporter
of meat, will grow marginally as environmental constraints and stringent animal welfare
regulations limit the expansion of domestic supply.
The tradability of the different dairy products varies significantly. Whereas WMP and
SMP are the highest traded commodities, trade in butter and cheese is below average and
very little trade occurs in fresh dairy products (liquid milk, cream, yogurt, etc.). Although
demand for fresh dairy products is much greater than for WMP and SMP, their trade is
limited due to transportability constraints (trade is not depicted in the figure as it is below
1% of world production).
Most trade flowing from few exporters to large number of importers
Exports of agricultural commodities tend to be concentrated in a few countries, while
imports are mostly dispersed over a larger number of countries. The limited number of
exporters for most commodities reflects a comparative advantage in these countries due to
natural endowments, domestic policies and climatic conditions. However, the dependency
on a few countries for the provision of a certain commodity increases the risk that if supply
from one country is disrupted due to a natural disaster or trade protective measures, it
could have significant repercussions on international markets.
Figure 1.15 and Figure 1.16 display the concentration of exports and imports,
respectively, by country and by commodity. These two figures are so-called “heatmaps”,
where a darker shade indicates a higher share in global exports (Figure 1.15) or global
imports (Figure 1.16) for a specific commodity. Comparing these two figures illustrates the
concentration of exporters and dispersion of importers, as Figure 1.15 is composed of fewer
areas that are shaded compared to Figure 1.16, and at the same time the areas in
Figure 1.15 are generally darker than in Figure 1.16.
By 2024, the United States, the European Union and Brazil are expected to remain
among the top exporters. The United States is projected to be the largest exporter of coarse
grains, pork and cotton, with export shares in global trade reaching 33%, 32% and 24%,
respectively. In addition, the United States is among the five top exporters of wheat, rice,
oilseeds, protein meal, beef, poultry, fish, butter, cheese and SMP. Its exports of coarse
grains are expected to rise in terms of volume as domestic demand for biofuel production
is projected to slowdown.
Exports of dairy products will also remain highly concentrated. By 2024, the United
States and the European Union will each account for about a third of SMP exports, while
the European Union will remain the primary cheese exporter with a share of 40%. New
Zealand will be the world’s primary origin of butter and WMP, with export shares reaching
48% and 56%, respectively. Some developing countries are expected to enter the trade
arena, such as Argentina and Saudi Arabia which will export WMP and cheese, respectively.
More than half of the world’s sugar exports will originate in Brazil by 2024. This market
share is lower than in the base year as Thailand and Australia are expected to start
exporting more sugar. Brazil will also become the leading world exporter of beef and
poultry by 2024, with export shares of 20% and 31%, respectively. Brazil and the United
States will account for more than two third of global exports of oilseeds and Argentina will
OECD-FAO AGRICULTURAL OUTLOOK 2015 © OECD/FAO 201544
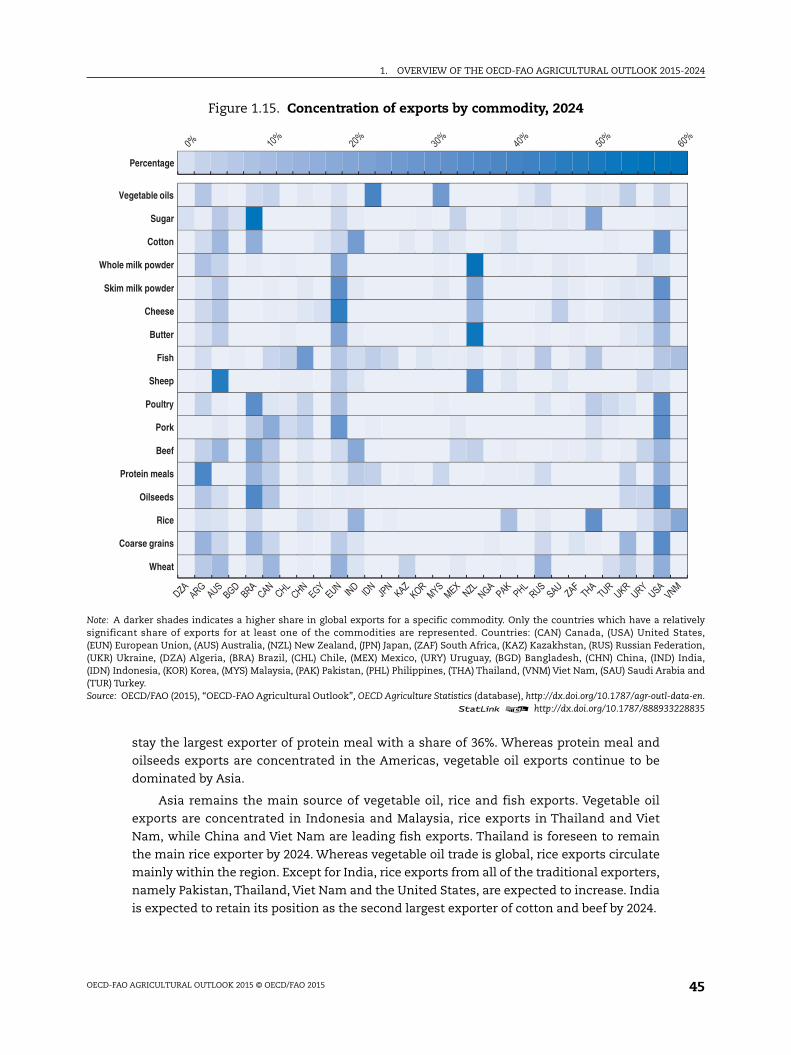
1. OVERVIEW OF THE OECD-FAO AGRICULTURAL OUTLOOK 2015-2024
lativelyStates,ration,India,ia and
ata-en.228835
stay the largest exporter of protein meal with a share of 36%. Whereas protein meal and
oilseeds exports are concentrated in the Americas, vegetable oil exports continue to be
dominated by Asia.
Asia remains the main source of vegetable oil, rice and fish exports. Vegetable oil
exports are concentrated in Indonesia and Malaysia, rice exports in Thailand and Viet
Nam, while China and Viet Nam are leading fish exports. Thailand is foreseen to remain
the main rice exporter by 2024. Whereas vegetable oil trade is global, rice exports circulate
mainly within the region. Except for India, rice exports from all of the traditional exporters,
namely Pakistan, Thailand, Viet Nam and the United States, are expected to increase. India
is expected to retain its position as the second largest exporter of cotton and beef by 2024.
Figure 1.15. Concentration of exports by commodity, 2024
Note: A darker shades indicates a higher share in global exports for a specific commodity. Only the countries which have a resignificant share of exports for at least one of the commodities are represented. Countries: (CAN) Canada, (USA) United(EUN) European Union, (AUS) Australia, (NZL) New Zealand, (JPN) Japan, (ZAF) South Africa, (KAZ) Kazakhstan, (RUS) Russian Fede(UKR) Ukraine, (DZA) Algeria, (BRA) Brazil, (CHL) Chile, (MEX) Mexico, (URY) Uruguay, (BGD) Bangladesh, (CHN) China, (IND)(IDN) Indonesia, (KOR) Korea, (MYS) Malaysia, (PAK) Pakistan, (PHL) Philippines, (THA) Thailand, (VNM) Viet Nam, (SAU) Saudi Arab(TUR) Turkey.Source: OECD/FAO (2015), “OECD-FAO Agricultural Outlook”, OECD Agriculture Statistics (database), http://dx.doi.org/10.1787/agr-outl-d
1 2 http://dx.doi.org/10.1787/888933
Wheat
Coarse grains
Rice
Oilseeds
Protein meals
Beef
Pork
Poultry
Sheep
Fish
Butter
Cheese
Skim milk powder
Whole milk powder
Cotton
Sugar
Vegetable oils
Percentage
OECD-FAO AGRICULTURAL OUTLOOK 2015 © OECD/FAO 2015 45
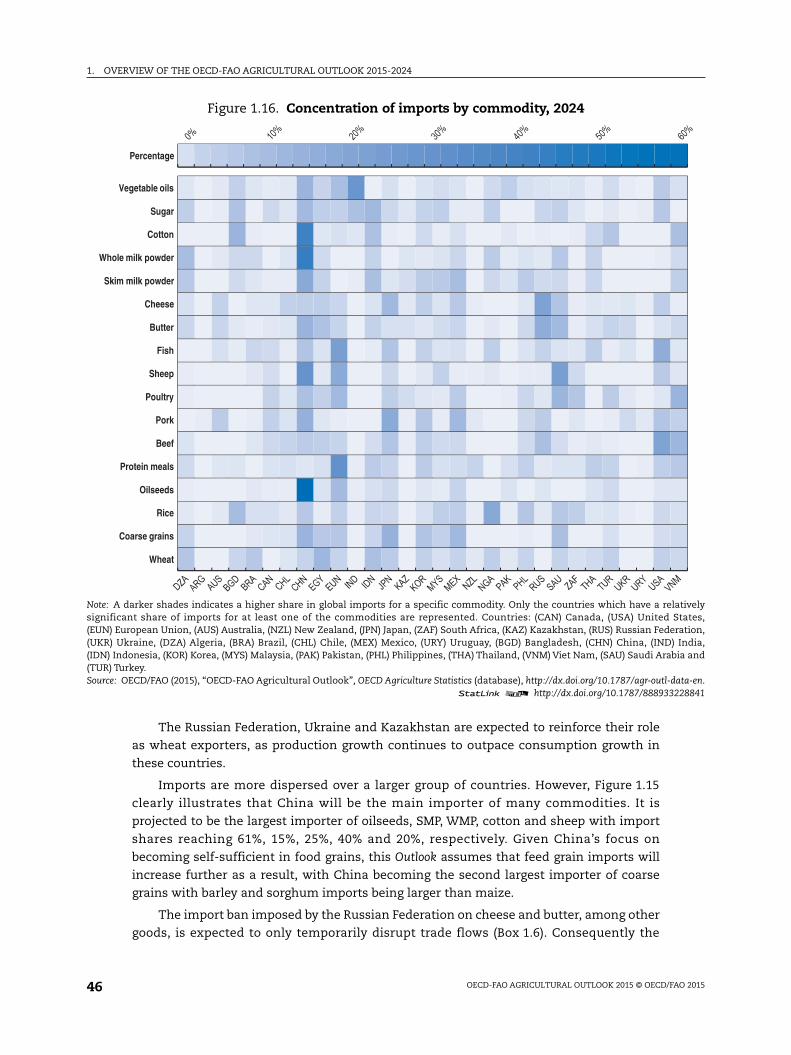
1. OVERVIEW OF THE OECD-FAO AGRICULTURAL OUTLOOK 2015-2024
lativelyStates,ration,India,ia and
ata-en.228841
The Russian Federation, Ukraine and Kazakhstan are expected to reinforce their role
as wheat exporters, as production growth continues to outpace consumption growth in
these countries.
Imports are more dispersed over a larger group of countries. However, Figure 1.15
clearly illustrates that China will be the main importer of many commodities. It is
projected to be the largest importer of oilseeds, SMP, WMP, cotton and sheep with import
shares reaching 61%, 15%, 25%, 40% and 20%, respectively. Given China’s focus on
becoming self-sufficient in food grains, this Outlook assumes that feed grain imports will
increase further as a result, with China becoming the second largest importer of coarse
grains with barley and sorghum imports being larger than maize.
The import ban imposed by the Russian Federation on cheese and butter, among other
goods, is expected to only temporarily disrupt trade flows (Box 1.6). Consequently the
Figure 1.16. Concentration of imports by commodity, 2024
Note: A darker shades indicates a higher share in global imports for a specific commodity. Only the countries which have a resignificant share of imports for at least one of the commodities are represented. Countries: (CAN) Canada, (USA) United(EUN) European Union, (AUS) Australia, (NZL) New Zealand, (JPN) Japan, (ZAF) South Africa, (KAZ) Kazakhstan, (RUS) Russian Fede(UKR) Ukraine, (DZA) Algeria, (BRA) Brazil, (CHL) Chile, (MEX) Mexico, (URY) Uruguay, (BGD) Bangladesh, (CHN) China, (IND)(IDN) Indonesia, (KOR) Korea, (MYS) Malaysia, (PAK) Pakistan, (PHL) Philippines, (THA) Thailand, (VNM) Viet Nam, (SAU) Saudi Arab(TUR) Turkey.Source: OECD/FAO (2015), “OECD-FAO Agricultural Outlook”, OECD Agriculture Statistics (database), http://dx.doi.org/10.1787/agr-outl-d
1 2 http://dx.doi.org/10.1787/888933
Wheat
Coarse grains
Rice
Oilseeds
Protein meals
Beef
Pork
Poultry
Sheep
Fish
Butter
Cheese
Skim milk powder
Whole milk powder
Cotton
Sugar
Vegetable oils
Percentage
OECD-FAO AGRICULTURAL OUTLOOK 2015 © OECD/FAO 201546
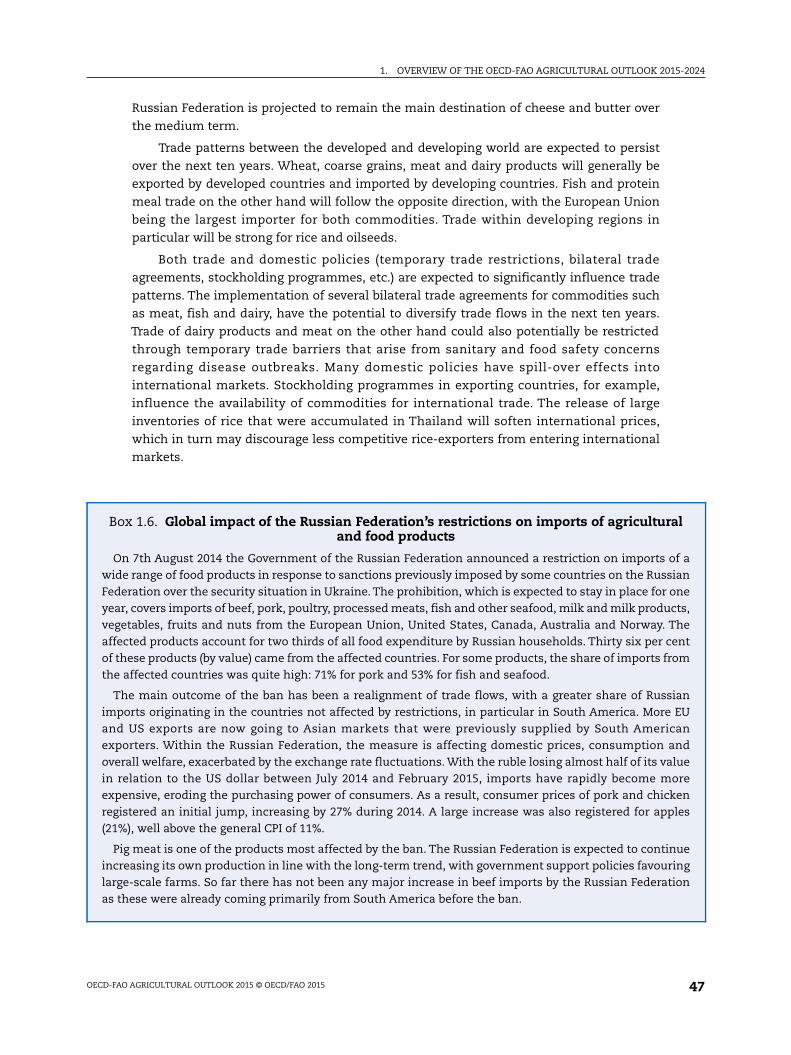
1. OVERVIEW OF THE OECD-FAO AGRICULTURAL OUTLOOK 2015-2024
l
f aiannets,he
entom
ianEUanndlueoreenles
ueingion
Russian Federation is projected to remain the main destination of cheese and butter over
the medium term.
Trade patterns between the developed and developing world are expected to persist
over the next ten years. Wheat, coarse grains, meat and dairy products will generally be
exported by developed countries and imported by developing countries. Fish and protein
meal trade on the other hand will follow the opposite direction, with the European Union
being the largest importer for both commodities. Trade within developing regions in
particular will be strong for rice and oilseeds.
Both trade and domestic policies (temporary trade restrictions, bilateral trade
agreements, stockholding programmes, etc.) are expected to significantly influence trade
patterns. The implementation of several bilateral trade agreements for commodities such
as meat, fish and dairy, have the potential to diversify trade flows in the next ten years.
Trade of dairy products and meat on the other hand could also potentially be restricted
through temporary trade barriers that arise from sanitary and food safety concerns
regarding disease outbreaks. Many domestic policies have spill-over effects into
international markets. Stockholding programmes in exporting countries, for example,
influence the availability of commodities for international trade. The release of large
inventories of rice that were accumulated in Thailand will soften international prices,
which in turn may discourage less competitive rice-exporters from entering international
markets.
Box 1.6. Global impact of the Russian Federation’s restrictions on imports of agriculturaand food products
On 7th August 2014 the Government of the Russian Federation announced a restriction on imports owide range of food products in response to sanctions previously imposed by some countries on the RussFederation over the security situation in Ukraine. The prohibition, which is expected to stay in place for oyear, covers imports of beef, pork, poultry, processed meats, fish and other seafood, milk and milk producvegetables, fruits and nuts from the European Union, United States, Canada, Australia and Norway. Taffected products account for two thirds of all food expenditure by Russian households. Thirty six per cof these products (by value) came from the affected countries. For some products, the share of imports frthe affected countries was quite high: 71% for pork and 53% for fish and seafood.
The main outcome of the ban has been a realignment of trade flows, with a greater share of Russimports originating in the countries not affected by restrictions, in particular in South America. Moreand US exports are now going to Asian markets that were previously supplied by South Americexporters. Within the Russian Federation, the measure is affecting domestic prices, consumption aoverall welfare, exacerbated by the exchange rate fluctuations. With the ruble losing almost half of its vain relation to the US dollar between July 2014 and February 2015, imports have rapidly become mexpensive, eroding the purchasing power of consumers. As a result, consumer prices of pork and chickregistered an initial jump, increasing by 27% during 2014. A large increase was also registered for app(21%), well above the general CPI of 11%.
Pig meat is one of the products most affected by the ban. The Russian Federation is expected to continincreasing its own production in line with the long-term trend, with government support policies favourlarge-scale farms. So far there has not been any major increase in beef imports by the Russian Federatas these were already coming primarily from South America before the ban.
OECD-FAO AGRICULTURAL OUTLOOK 2015 © OECD/FAO 2015 47
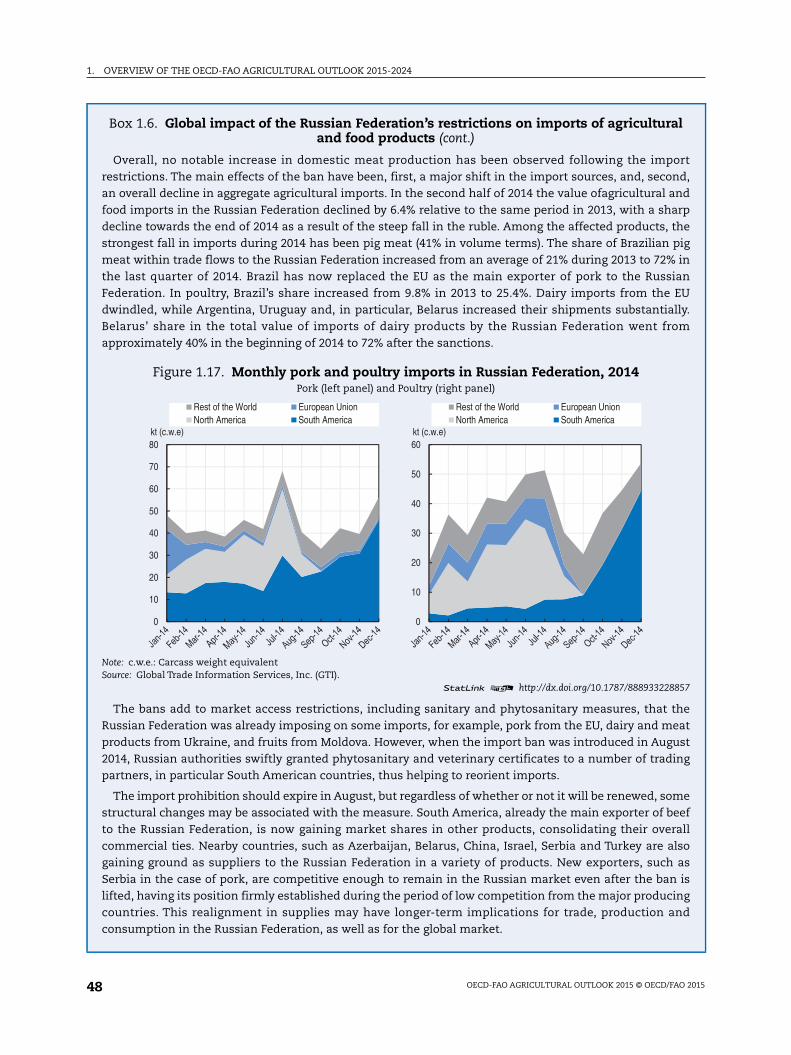
1. OVERVIEW OF THE OECD-FAO AGRICULTURAL OUTLOOK 2015-2024
l
ortnd,ndrp
thepigin
ianEUlly.m
857
heeatusting
meeefalllsoasis
ingnd
Box 1.6. Global impact of the Russian Federation’s restrictions on imports of agriculturaand food products (cont.)
Overall, no notable increase in domestic meat production has been observed following the imprestrictions. The main effects of the ban have been, first, a major shift in the import sources, and, secoan overall decline in aggregate agricultural imports. In the second half of 2014 the value ofagricultural afood imports in the Russian Federation declined by 6.4% relative to the same period in 2013, with a shadecline towards the end of 2014 as a result of the steep fall in the ruble. Among the affected products,strongest fall in imports during 2014 has been pig meat (41% in volume terms). The share of Brazilianmeat within trade flows to the Russian Federation increased from an average of 21% during 2013 to 72%the last quarter of 2014. Brazil has now replaced the EU as the main exporter of pork to the RussFederation. In poultry, Brazil’s share increased from 9.8% in 2013 to 25.4%. Dairy imports from thedwindled, while Argentina, Uruguay and, in particular, Belarus increased their shipments substantiaBelarus’ share in the total value of imports of dairy products by the Russian Federation went froapproximately 40% in the beginning of 2014 to 72% after the sanctions.
Figure 1.17. Monthly pork and poultry imports in Russian Federation, 2014Pork (left panel) and Poultry (right panel)
Note: c.w.e.: Carcass weight equivalentSource: Global Trade Information Services, Inc. (GTI).
1 2 http://dx.doi.org/10.1787/888933228
The bans add to market access restrictions, including sanitary and phytosanitary measures, that tRussian Federation was already imposing on some imports, for example, pork from the EU, dairy and mproducts from Ukraine, and fruits from Moldova. However, when the import ban was introduced in Aug2014, Russian authorities swiftly granted phytosanitary and veterinary certificates to a number of tradpartners, in particular South American countries, thus helping to reorient imports.
The import prohibition should expire in August, but regardless of whether or not it will be renewed, sostructural changes may be associated with the measure. South America, already the main exporter of bto the Russian Federation, is now gaining market shares in other products, consolidating their overcommercial ties. Nearby countries, such as Azerbaijan, Belarus, China, Israel, Serbia and Turkey are againing ground as suppliers to the Russian Federation in a variety of products. New exporters, suchSerbia in the case of pork, are competitive enough to remain in the Russian market even after the banlifted, having its position firmly established during the period of low competition from the major produccountries. This realignment in supplies may have longer-term implications for trade, production aconsumption in the Russian Federation, as well as for the global market.
0
10
20
30
40
50
60
70
80kt (c.w.e)
Rest of the World European UnionNorth America South America
0
10
20
30
40
50
60kt (c.w.e)
Rest of the World European UnionNorth America South America
OECD-FAO AGRICULTURAL OUTLOOK 2015 © OECD/FAO 201548
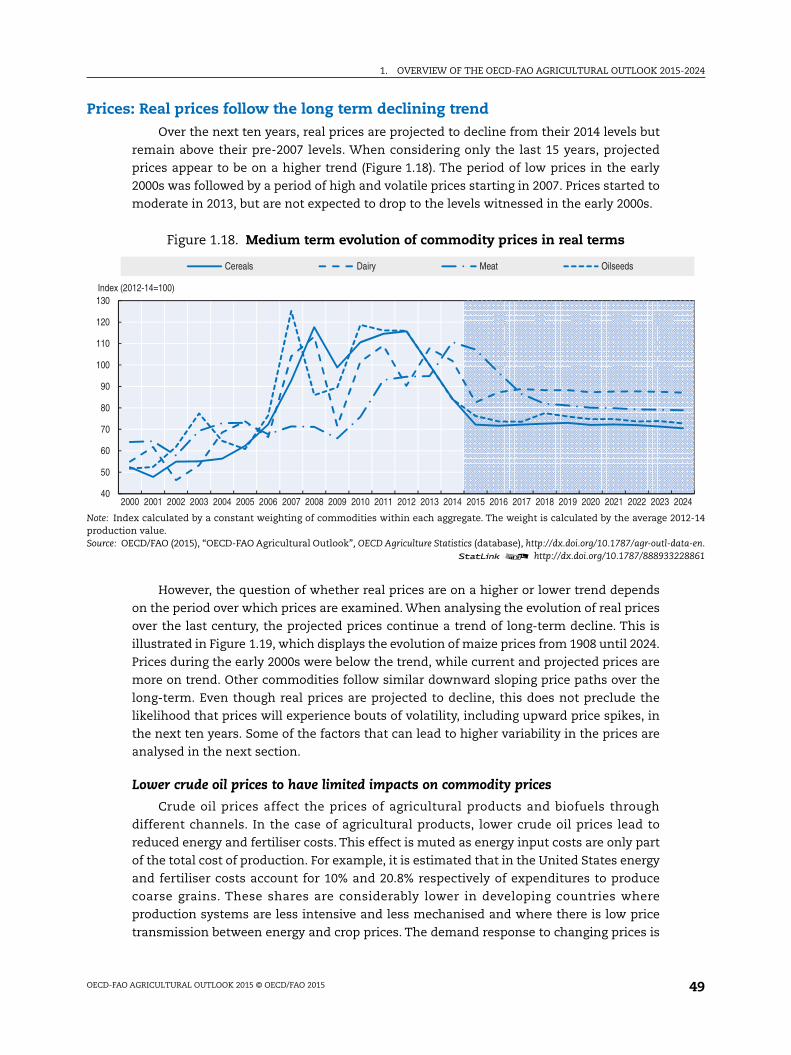
1. OVERVIEW OF THE OECD-FAO AGRICULTURAL OUTLOOK 2015-2024
012-14
ata-en.228861
2024
Prices: Real prices follow the long term declining trendOver the next ten years, real prices are projected to decline from their 2014 levels but
remain above their pre-2007 levels. When considering only the last 15 years, projected
prices appear to be on a higher trend (Figure 1.18). The period of low prices in the early
2000s was followed by a period of high and volatile prices starting in 2007. Prices started to
moderate in 2013, but are not expected to drop to the levels witnessed in the early 2000s.
However, the question of whether real prices are on a higher or lower trend depends
on the period over which prices are examined. When analysing the evolution of real prices
over the last century, the projected prices continue a trend of long-term decline. This is
illustrated in Figure 1.19, which displays the evolution of maize prices from 1908 until 2024.
Prices during the early 2000s were below the trend, while current and projected prices are
more on trend. Other commodities follow similar downward sloping price paths over the
long-term. Even though real prices are projected to decline, this does not preclude the
likelihood that prices will experience bouts of volatility, including upward price spikes, in
the next ten years. Some of the factors that can lead to higher variability in the prices are
analysed in the next section.
Lower crude oil prices to have limited impacts on commodity prices
Crude oil prices affect the prices of agricultural products and biofuels through
different channels. In the case of agricultural products, lower crude oil prices lead to
reduced energy and fertiliser costs. This effect is muted as energy input costs are only part
of the total cost of production. For example, it is estimated that in the United States energy
and fertiliser costs account for 10% and 20.8% respectively of expenditures to produce
coarse grains. These shares are considerably lower in developing countries where
production systems are less intensive and less mechanised and where there is low price
transmission between energy and crop prices. The demand response to changing prices is
Figure 1.18. Medium term evolution of commodity prices in real terms
Note: Index calculated by a constant weighting of commodities within each aggregate. The weight is calculated by the average 2production value.Source: OECD/FAO (2015), “OECD-FAO Agricultural Outlook”, OECD Agriculture Statistics (database), http://dx.doi.org/10.1787/agr-outl-d
1 2 http://dx.doi.org/10.1787/888933
40
50
60
70
80
90
100
110
120
130
2000 2001 2002 2003 2004 2005 2006 2007 2008 2009 2010 2011 2012 2013 2014 2015 2016 2017 2018 2019 2020 2021 2022 2023
Index (2012-14=100)
Cereals Dairy Meat Oilseeds
OECD-FAO AGRICULTURAL OUTLOOK 2015 © OECD/FAO 2015 49
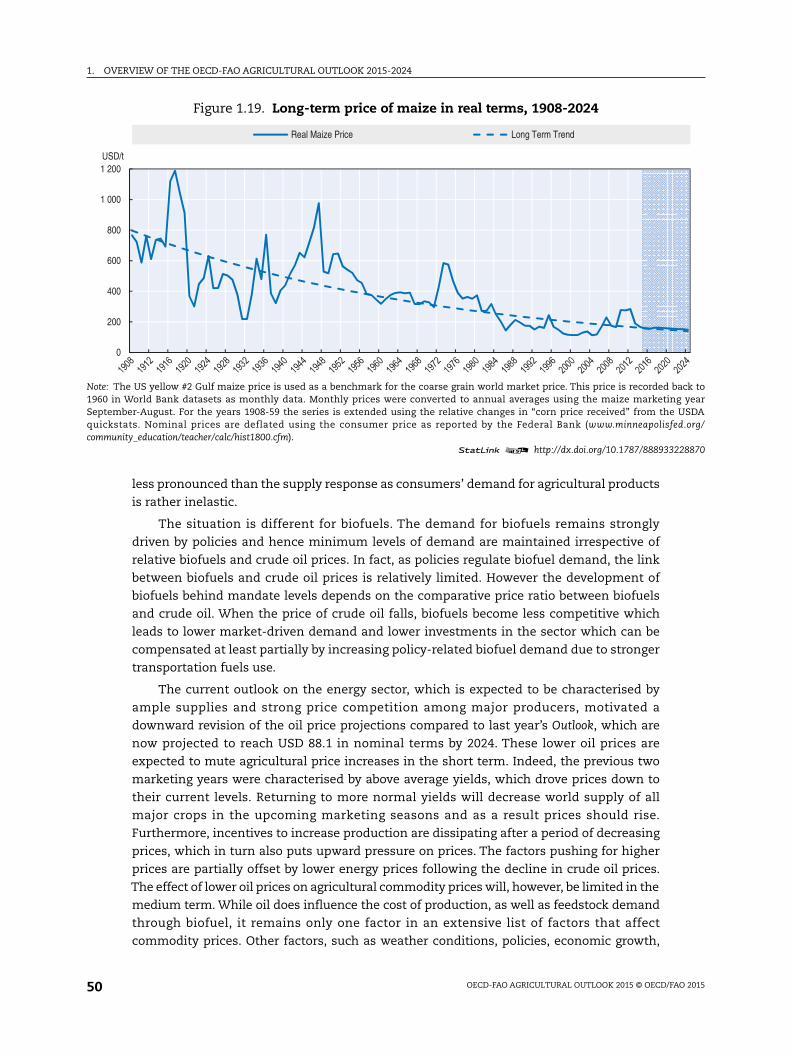
1. OVERVIEW OF THE OECD-FAO AGRICULTURAL OUTLOOK 2015-2024
back tog yearUSDA
ed.org/
228870
less pronounced than the supply response as consumers’ demand for agricultural products
is rather inelastic.
The situation is different for biofuels. The demand for biofuels remains strongly
driven by policies and hence minimum levels of demand are maintained irrespective of
relative biofuels and crude oil prices. In fact, as policies regulate biofuel demand, the link
between biofuels and crude oil prices is relatively limited. However the development of
biofuels behind mandate levels depends on the comparative price ratio between biofuels
and crude oil. When the price of crude oil falls, biofuels become less competitive which
leads to lower market-driven demand and lower investments in the sector which can be
compensated at least partially by increasing policy-related biofuel demand due to stronger
transportation fuels use.
The current outlook on the energy sector, which is expected to be characterised by
ample supplies and strong price competition among major producers, motivated a
downward revision of the oil price projections compared to last year’s Outlook, which are
now projected to reach USD 88.1 in nominal terms by 2024. These lower oil prices are
expected to mute agricultural price increases in the short term. Indeed, the previous two
marketing years were characterised by above average yields, which drove prices down to
their current levels. Returning to more normal yields will decrease world supply of all
major crops in the upcoming marketing seasons and as a result prices should rise.
Furthermore, incentives to increase production are dissipating after a period of decreasing
prices, which in turn also puts upward pressure on prices. The factors pushing for higher
prices are partially offset by lower energy prices following the decline in crude oil prices.
The effect of lower oil prices on agricultural commodity prices will, however, be limited in the
medium term. While oil does influence the cost of production, as well as feedstock demand
through biofuel, it remains only one factor in an extensive list of factors that affect
commodity prices. Other factors, such as weather conditions, policies, economic growth,
Figure 1.19. Long-term price of maize in real terms, 1908-2024
Note: The US yellow #2 Gulf maize price is used as a benchmark for the coarse grain world market price. This price is recorded1960 in World Bank datasets as monthly data. Monthly prices were converted to annual averages using the maize marketinSeptember-August. For the years 1908-59 the series is extended using the relative changes in “corn price received” from thequickstats. Nominal prices are deflated using the consumer price as reported by the Federal Bank (www.minneapolisfcommunity_education/teacher/calc/hist1800.cfm).
1 2 http://dx.doi.org/10.1787/888933
0
200
400
600
800
1 000
1 200USD/t
Real Maize Price Long Term Trend
OECD-FAO AGRICULTURAL OUTLOOK 2015 © OECD/FAO 201550
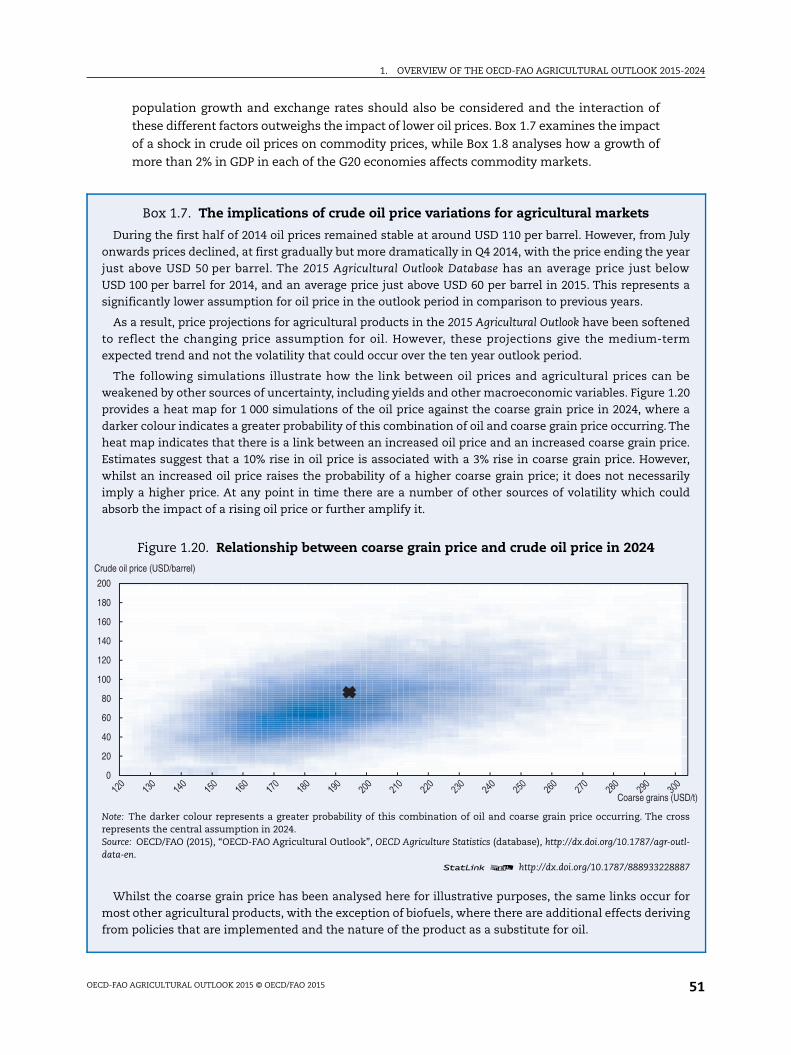
1. OVERVIEW OF THE OECD-FAO AGRICULTURAL OUTLOOK 2015-2024
ulyearows a
edrm
be.20e ahece.er,
rilyuld
oss
utl-
887
foring
USD/t)
population growth and exchange rates should also be considered and the interaction of
these different factors outweighs the impact of lower oil prices. Box 1.7 examines the impact
of a shock in crude oil prices on commodity prices, while Box 1.8 analyses how a growth of
more than 2% in GDP in each of the G20 economies affects commodity markets.
Box 1.7. The implications of crude oil price variations for agricultural markets
During the first half of 2014 oil prices remained stable at around USD 110 per barrel. However, from Jonwards prices declined, at first gradually but more dramatically in Q4 2014, with the price ending the yjust above USD 50 per barrel. The 2015 Agricultural Outlook Database has an average price just belUSD 100 per barrel for 2014, and an average price just above USD 60 per barrel in 2015. This representsignificantly lower assumption for oil price in the outlook period in comparison to previous years.
As a result, price projections for agricultural products in the 2015 Agricultural Outlook have been softento reflect the changing price assumption for oil. However, these projections give the medium-teexpected trend and not the volatility that could occur over the ten year outlook period.
The following simulations illustrate how the link between oil prices and agricultural prices canweakened by other sources of uncertainty, including yields and other macroeconomic variables. Figure 1provides a heat map for 1 000 simulations of the oil price against the coarse grain price in 2024, wherdarker colour indicates a greater probability of this combination of oil and coarse grain price occurring. Theat map indicates that there is a link between an increased oil price and an increased coarse grain priEstimates suggest that a 10% rise in oil price is associated with a 3% rise in coarse grain price. Howevwhilst an increased oil price raises the probability of a higher coarse grain price; it does not necessaimply a higher price. At any point in time there are a number of other sources of volatility which coabsorb the impact of a rising oil price or further amplify it.
Figure 1.20. Relationship between coarse grain price and crude oil price in 2024
Note: The darker colour represents a greater probability of this combination of oil and coarse grain price occurring. The crrepresents the central assumption in 2024.Source: OECD/FAO (2015), “OECD-FAO Agricultural Outlook”, OECD Agriculture Statistics (database), http://dx.doi.org/10.1787/agr-odata-en.
1 2 http://dx.doi.org/10.1787/888933228
Whilst the coarse grain price has been analysed here for illustrative purposes, the same links occurmost other agricultural products, with the exception of biofuels, where there are additional effects derivfrom policies that are implemented and the nature of the product as a substitute for oil.
0
20
40
60
80
100
120
140
160
180
200
Crude oil price (USD/barrel)
Coarse grains (
OECD-FAO AGRICULTURAL OUTLOOK 2015 © OECD/FAO 2015 51
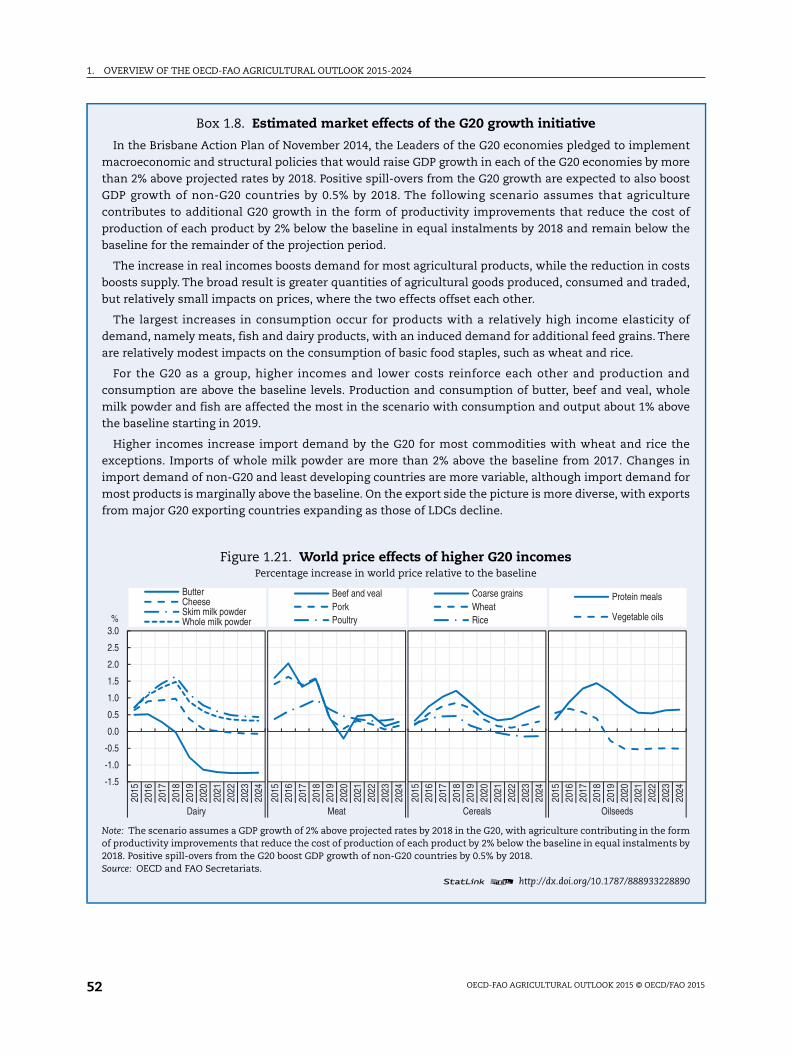
1. OVERVIEW OF THE OECD-FAO AGRICULTURAL OUTLOOK 2015-2024
entoreostreof
the
stsed,
ofere
ndoleve
hein
forrts
rms by
890
2024
Box 1.8. Estimated market effects of the G20 growth initiative
In the Brisbane Action Plan of November 2014, the Leaders of the G20 economies pledged to implemmacroeconomic and structural policies that would raise GDP growth in each of the G20 economies by mthan 2% above projected rates by 2018. Positive spill-overs from the G20 growth are expected to also boGDP growth of non-G20 countries by 0.5% by 2018. The following scenario assumes that agricultucontributes to additional G20 growth in the form of productivity improvements that reduce the costproduction of each product by 2% below the baseline in equal instalments by 2018 and remain belowbaseline for the remainder of the projection period.
The increase in real incomes boosts demand for most agricultural products, while the reduction in coboosts supply. The broad result is greater quantities of agricultural goods produced, consumed and tradbut relatively small impacts on prices, where the two effects offset each other.
The largest increases in consumption occur for products with a relatively high income elasticitydemand, namely meats, fish and dairy products, with an induced demand for additional feed grains. Thare relatively modest impacts on the consumption of basic food staples, such as wheat and rice.
For the G20 as a group, higher incomes and lower costs reinforce each other and production aconsumption are above the baseline levels. Production and consumption of butter, beef and veal, whmilk powder and fish are affected the most in the scenario with consumption and output about 1% abothe baseline starting in 2019.
Higher incomes increase import demand by the G20 for most commodities with wheat and rice texceptions. Imports of whole milk powder are more than 2% above the baseline from 2017. Changesimport demand of non-G20 and least developing countries are more variable, although import demandmost products is marginally above the baseline. On the export side the picture is more diverse, with expofrom major G20 exporting countries expanding as those of LDCs decline.
Figure 1.21. World price effects of higher G20 incomesPercentage increase in world price relative to the baseline
Note: The scenario assumes a GDP growth of 2% above projected rates by 2018 in the G20, with agriculture contributing in the foof productivity improvements that reduce the cost of production of each product by 2% below the baseline in equal instalment2018. Positive spill-overs from the G20 boost GDP growth of non-G20 countries by 0.5% by 2018.Source: OECD and FAO Secretariats.
1 2 http://dx.doi.org/10.1787/888933228
-1.5
-1.0
-0.5
0.0
0.5
1.0
1.5
2.0
2.5
3.0
2015
2016
2017
2018
2019
2020
2021
2022
2023
2024
Dairy
%
ButterCheeseSkim milk powderWhole milk powder
2015
2016
2017
2018
2019
2020
2021
2022
2023
2024
Meat
Beef and vealPorkPoultry
2015
2016
2017
2018
2019
2020
2021
2022
2023
2024
Cereals
Coarse grainsWheatRice
2015
2016
2017
2018
2019
2020
2021
2022
2023
Oilseeds
Protein meals
Vegetable oils
OECD-FAO AGRICULTURAL OUTLOOK 2015 © OECD/FAO 201552
1. OVERVIEW OF THE OECD-FAO AGRICULTURAL OUTLOOK 2015-2024
sees
cesceshe
theplyityeyonnd
henlyor
not
Nominal prices to increase marginally for crops and dairy, meat prices to followthe same trend with a lag of two years
International crop prices have been declining since 2013, in response to two successive
record harvests in grains and oilseeds. The resulting situation of ample supplies and
replenished stocks, gives rise to expectations of nominal prices declining further in the short
term, before returning to a marginally upward trend for the rest of the projection period. Meat
prices reached record highs in 2014 and are projected to decline over the next ten years in
response to lower feed costs and slowing global demand growth.
The projections are based on specific assumptions about a set of factors that influence the
supply, demand, trade and prices of commodities. These factors include policy settings, crop
yields, and macroeconomic assumptions such as income growth, exchange rates and oil prices.
To examine the sensitivity of commodity prices to these factors, the price projections
specifically incorporate the impact of varying yields and macroeconomic conditions. Box 1.9
explains in detail how these partial stochastics were performed and how to interpret the
results.
Box 1.8. Estimated market effects of the G20 growth initiative (cont.)
The effects on markets vary over time. In the Aglink-Cosimo model, supply exhibits a delayed responto cost reductions, so prices first rise before the effects of production responses take hold. Once incomand production costs have stabilised after 2018, changes to demand and supply resulting from differenin relative prices, lead to moderately declining and then stabilising prices (Figure 1.21). In most cases priare higher in 2024, although the effects are small. The biggest effects are for those products where tconsumption increases are greatest, namely meat, fish and some dairy.
In this scenario, non-G20 countries only benefit from the spill-over effect on incomes and not fromreduction in agricultural costs. This raises demands in these countries, and induces a domestic supresponse. Any upward pressure on prices in these countries could be offset by agricultural productivimprovements. Focusing more policy effort on improving agricultural productivity growth is a krecommendation of the inter-agency report lead by FAO and OECD for the Australian Presidency of the G20Opportunities for Economic Growth and Job Creation in Relation to Food Security and Nutrition (FAO aOECD, 2014).
Box 1.9. Stochastics explained
Why perform a partial stochastic analysis on price projections?
The objective of the stochastic analysis is to assess how uncertainty on key assumptions about tmacroeconomic environment and yield levels might affect price projections. The stochastic analysis is opartial as it does not capture all sources of variability. For example, uncertainty related to policy changesanimal diseases are not considered.
What are the assumptions behind the stochastic analysis?
Stochastic analysis gives an estimation of possible future variations based on historical variations. It doesprovide a confidence interval for the future or probability of a particular price occurring. It considers that:
● The central assumption is correct
● Historic variations and correlations will continue into the future
● The considered factors are the only causes of volatility
OECD-FAO AGRICULTURAL OUTLOOK 2015 © OECD/FAO 2015 53
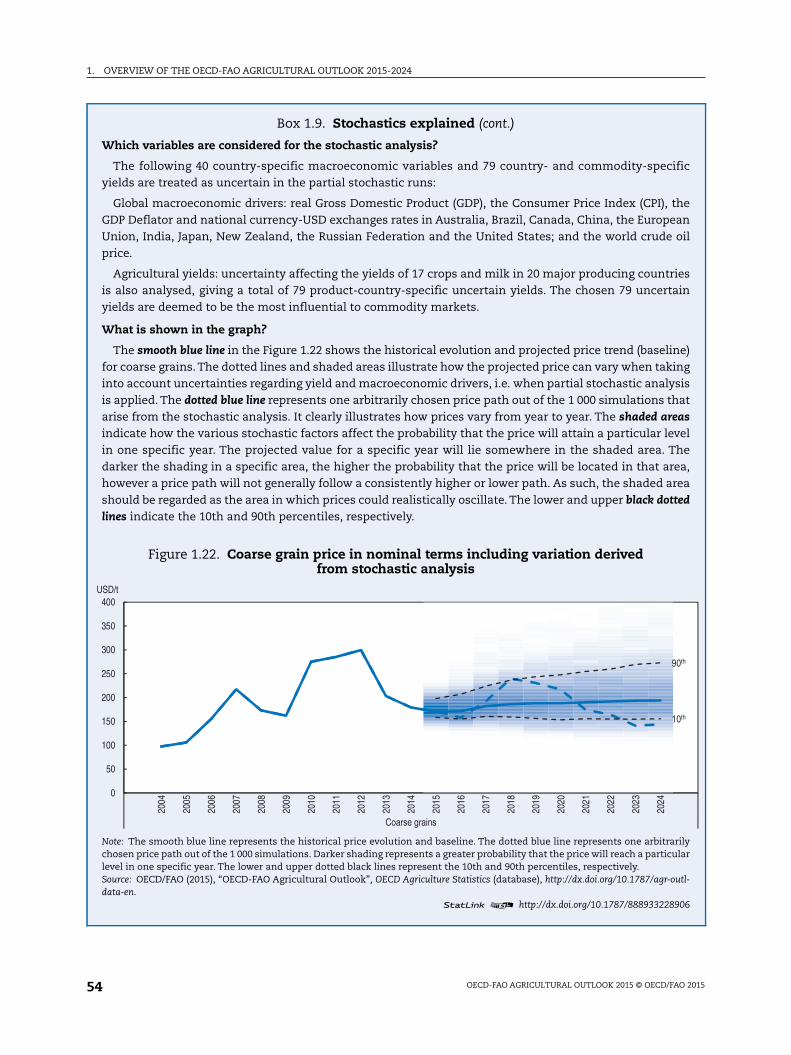
1. OVERVIEW OF THE OECD-FAO AGRICULTURAL OUTLOOK 2015-2024
ific
theanoil
iesain
ne)ingsisat
easvelheea,reated
rilylar
utl-
906
10th
90th
Box 1.9. Stochastics explained (cont.)
Which variables are considered for the stochastic analysis?
The following 40 country-specific macroeconomic variables and 79 country- and commodity-specyields are treated as uncertain in the partial stochastic runs:
Global macroeconomic drivers: real Gross Domestic Product (GDP), the Consumer Price Index (CPI),GDP Deflator and national currency-USD exchanges rates in Australia, Brazil, Canada, China, the EuropeUnion, India, Japan, New Zealand, the Russian Federation and the United States; and the world crudeprice.
Agricultural yields: uncertainty affecting the yields of 17 crops and milk in 20 major producing countris also analysed, giving a total of 79 product-country-specific uncertain yields. The chosen 79 uncertyields are deemed to be the most influential to commodity markets.
What is shown in the graph?
The smooth blue line in the Figure 1.22 shows the historical evolution and projected price trend (baselifor coarse grains. The dotted lines and shaded areas illustrate how the projected price can vary when takinto account uncertainties regarding yield and macroeconomic drivers, i.e. when partial stochastic analyis applied. The dotted blue line represents one arbitrarily chosen price path out of the 1 000 simulations tharise from the stochastic analysis. It clearly illustrates how prices vary from year to year. The shaded arindicate how the various stochastic factors affect the probability that the price will attain a particular lein one specific year. The projected value for a specific year will lie somewhere in the shaded area. Tdarker the shading in a specific area, the higher the probability that the price will be located in that arhowever a price path will not generally follow a consistently higher or lower path. As such, the shaded ashould be regarded as the area in which prices could realistically oscillate. The lower and upper black dotlines indicate the 10th and 90th percentiles, respectively.
Figure 1.22. Coarse grain price in nominal terms including variation derivedfrom stochastic analysis
Note: The smooth blue line represents the historical price evolution and baseline. The dotted blue line represents one arbitrachosen price path out of the 1 000 simulations. Darker shading represents a greater probability that the price will reach a particulevel in one specific year. The lower and upper dotted black lines represent the 10th and 90th percentiles, respectively.Source: OECD/FAO (2015), “OECD-FAO Agricultural Outlook”, OECD Agriculture Statistics (database), http://dx.doi.org/10.1787/agr-odata-en.
1 2 http://dx.doi.org/10.1787/888933228
0
50
100
150
200
250
300
350
400
2004
2005
2006
2007
2008
2009
2010
2011
2012
2013
2014
2015
2016
2017
2018
2019
2020
2021
2022
2023
2024
Coarse grains
USD/t
OECD-FAO AGRICULTURAL OUTLOOK 2015 © OECD/FAO 201554
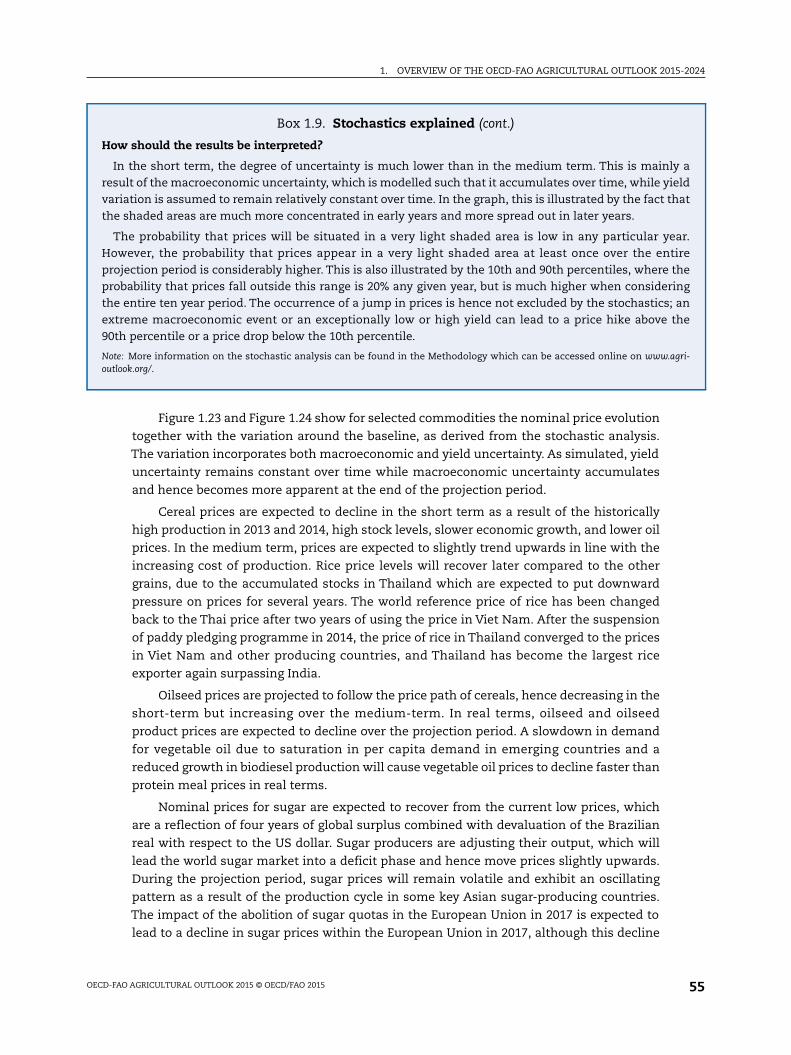
1. OVERVIEW OF THE OECD-FAO AGRICULTURAL OUTLOOK 2015-2024
y aeldat
ar.ire
theinganhe
gri-
Figure 1.23 and Figure 1.24 show for selected commodities the nominal price evolution
together with the variation around the baseline, as derived from the stochastic analysis.
The variation incorporates both macroeconomic and yield uncertainty. As simulated, yield
uncertainty remains constant over time while macroeconomic uncertainty accumulates
and hence becomes more apparent at the end of the projection period.
Cereal prices are expected to decline in the short term as a result of the historically
high production in 2013 and 2014, high stock levels, slower economic growth, and lower oil
prices. In the medium term, prices are expected to slightly trend upwards in line with the
increasing cost of production. Rice price levels will recover later compared to the other
grains, due to the accumulated stocks in Thailand which are expected to put downward
pressure on prices for several years. The world reference price of rice has been changed
back to the Thai price after two years of using the price in Viet Nam. After the suspension
of paddy pledging programme in 2014, the price of rice in Thailand converged to the prices
in Viet Nam and other producing countries, and Thailand has become the largest rice
exporter again surpassing India.
Oilseed prices are projected to follow the price path of cereals, hence decreasing in the
short-term but increasing over the medium-term. In real terms, oilseed and oilseed
product prices are expected to decline over the projection period. A slowdown in demand
for vegetable oil due to saturation in per capita demand in emerging countries and a
reduced growth in biodiesel production will cause vegetable oil prices to decline faster than
protein meal prices in real terms.
Nominal prices for sugar are expected to recover from the current low prices, which
are a reflection of four years of global surplus combined with devaluation of the Brazilian
real with respect to the US dollar. Sugar producers are adjusting their output, which will
lead the world sugar market into a deficit phase and hence move prices slightly upwards.
During the projection period, sugar prices will remain volatile and exhibit an oscillating
pattern as a result of the production cycle in some key Asian sugar-producing countries.
The impact of the abolition of sugar quotas in the European Union in 2017 is expected to
lead to a decline in sugar prices within the European Union in 2017, although this decline
Box 1.9. Stochastics explained (cont.)
How should the results be interpreted?
In the short term, the degree of uncertainty is much lower than in the medium term. This is mainlresult of the macroeconomic uncertainty, which is modelled such that it accumulates over time, while yivariation is assumed to remain relatively constant over time. In the graph, this is illustrated by the fact ththe shaded areas are much more concentrated in early years and more spread out in later years.
The probability that prices will be situated in a very light shaded area is low in any particular yeHowever, the probability that prices appear in a very light shaded area at least once over the entprojection period is considerably higher. This is also illustrated by the 10th and 90th percentiles, whereprobability that prices fall outside this range is 20% any given year, but is much higher when considerthe entire ten year period. The occurrence of a jump in prices is hence not excluded by the stochastics;extreme macroeconomic event or an exceptionally low or high yield can lead to a price hike above t90th percentile or a price drop below the 10th percentile.
Note: More information on the stochastic analysis can be found in the Methodology which can be accessed online on www.aoutlook.org/.
OECD-FAO AGRICULTURAL OUTLOOK 2015 © OECD/FAO 2015 55
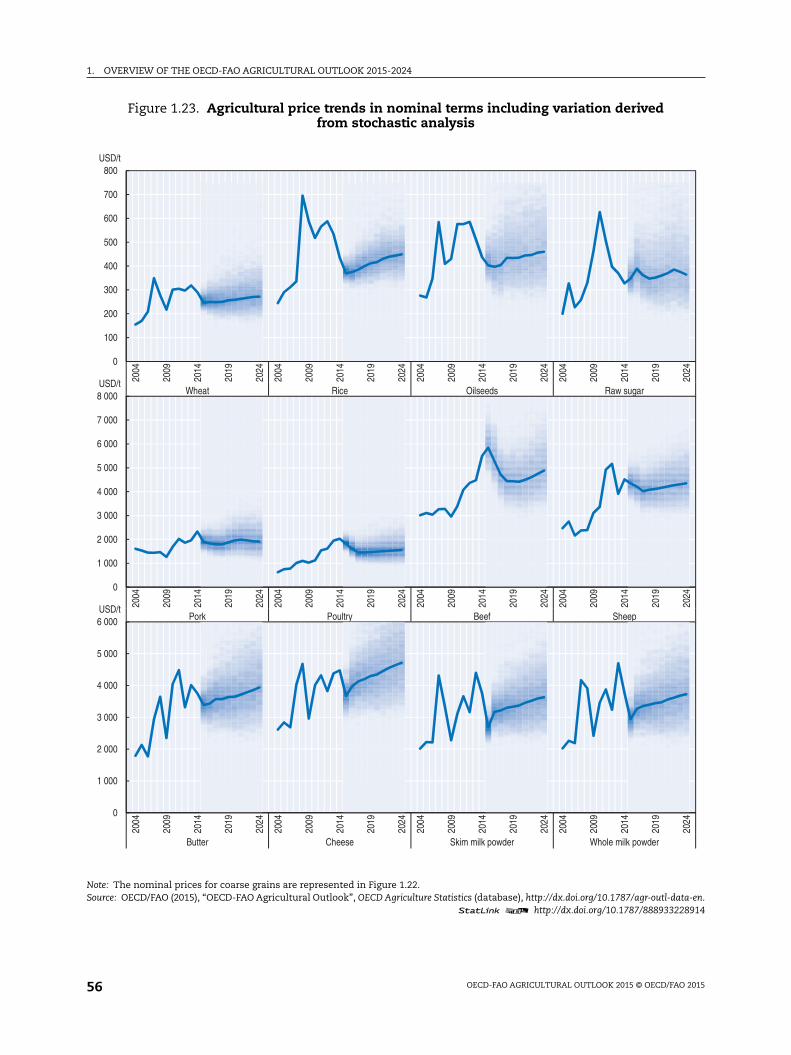
1. OVERVIEW OF THE OECD-FAO AGRICULTURAL OUTLOOK 2015-2024
ata-en.228914
2024
2024
2024
Figure 1.23. Agricultural price trends in nominal terms including variation derivedfrom stochastic analysis
Note: The nominal prices for coarse grains are represented in Figure 1.22.Source: OECD/FAO (2015), “OECD-FAO Agricultural Outlook”, OECD Agriculture Statistics (database), http://dx.doi.org/10.1787/agr-outl-d
1 2 http://dx.doi.org/10.1787/888933
0
100
200
300
400
500
600
700
800
2004
2009
2014
2019
2024
2004
2009
2014
2019
2024
2004
2009
2014
2019
2024
2004
2009
2014
2019
Wheat Rice Oilseeds Raw sugar
USD/t
0
1 000
2 000
3 000
4 000
5 000
6 000
7 000
8 000
2004
2009
2014
2019
2024
2004
2009
2014
2019
2024
2004
2009
2014
2019
2024
2004
2009
2014
2019
Pork Poultry Beef Sheep
USD/t
0
1 000
2 000
3 000
4 000
5 000
6 000
2004
2009
2014
2019
2024
2004
2009
2014
2019
2024
2004
2009
2014
2019
2024
2004
2009
2014
2019
Butter Cheese Skim milk powder Whole milk powder
USD/t
OECD-FAO AGRICULTURAL OUTLOOK 2015 © OECD/FAO 201556
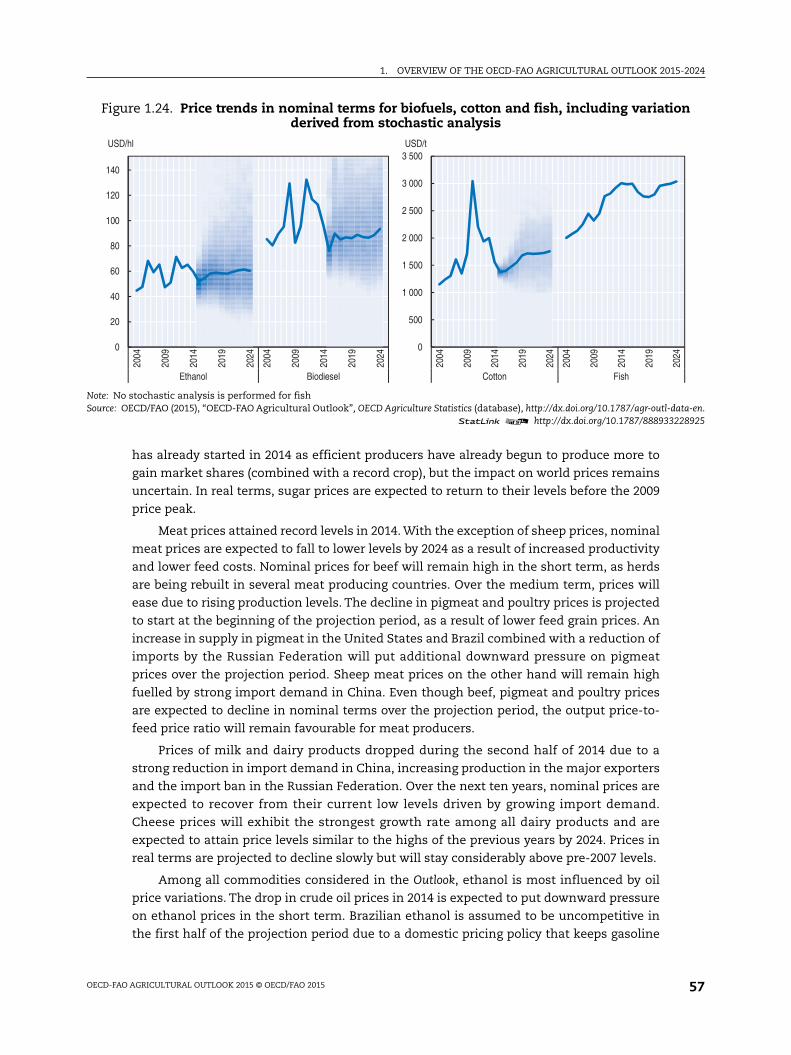
1. OVERVIEW OF THE OECD-FAO AGRICULTURAL OUTLOOK 2015-2024
on
ata-en.228925
2024
has already started in 2014 as efficient producers have already begun to produce more to
gain market shares (combined with a record crop), but the impact on world prices remains
uncertain. In real terms, sugar prices are expected to return to their levels before the 2009
price peak.
Meat prices attained record levels in 2014. With the exception of sheep prices, nominal
meat prices are expected to fall to lower levels by 2024 as a result of increased productivity
and lower feed costs. Nominal prices for beef will remain high in the short term, as herds
are being rebuilt in several meat producing countries. Over the medium term, prices will
ease due to rising production levels. The decline in pigmeat and poultry prices is projected
to start at the beginning of the projection period, as a result of lower feed grain prices. An
increase in supply in pigmeat in the United States and Brazil combined with a reduction of
imports by the Russian Federation will put additional downward pressure on pigmeat
prices over the projection period. Sheep meat prices on the other hand will remain high
fuelled by strong import demand in China. Even though beef, pigmeat and poultry prices
are expected to decline in nominal terms over the projection period, the output price-to-
feed price ratio will remain favourable for meat producers.
Prices of milk and dairy products dropped during the second half of 2014 due to a
strong reduction in import demand in China, increasing production in the major exporters
and the import ban in the Russian Federation. Over the next ten years, nominal prices are
expected to recover from their current low levels driven by growing import demand.
Cheese prices will exhibit the strongest growth rate among all dairy products and are
expected to attain price levels similar to the highs of the previous years by 2024. Prices in
real terms are projected to decline slowly but will stay considerably above pre-2007 levels.
Among all commodities considered in the Outlook, ethanol is most influenced by oil
price variations. The drop in crude oil prices in 2014 is expected to put downward pressure
on ethanol prices in the short term. Brazilian ethanol is assumed to be uncompetitive in
the first half of the projection period due to a domestic pricing policy that keeps gasoline
Figure 1.24. Price trends in nominal terms for biofuels, cotton and fish, including variatiderived from stochastic analysis
Note: No stochastic analysis is performed for fishSource: OECD/FAO (2015), “OECD-FAO Agricultural Outlook”, OECD Agriculture Statistics (database), http://dx.doi.org/10.1787/agr-outl-d
1 2 http://dx.doi.org/10.1787/888933
0
20
40
60
80
100
120
140
2004
2009
2014
2019
2024
2004
2009
2014
2019
2024
Ethanol Biodiesel
USD/hl
0
500
1 000
1 500
2 000
2 500
3 000
3 500
2004
2009
2014
2019
2024
2004
2009
2014
2019
Cotton Fish
USD/t
OECD-FAO AGRICULTURAL OUTLOOK 2015 © OECD/FAO 2015 57
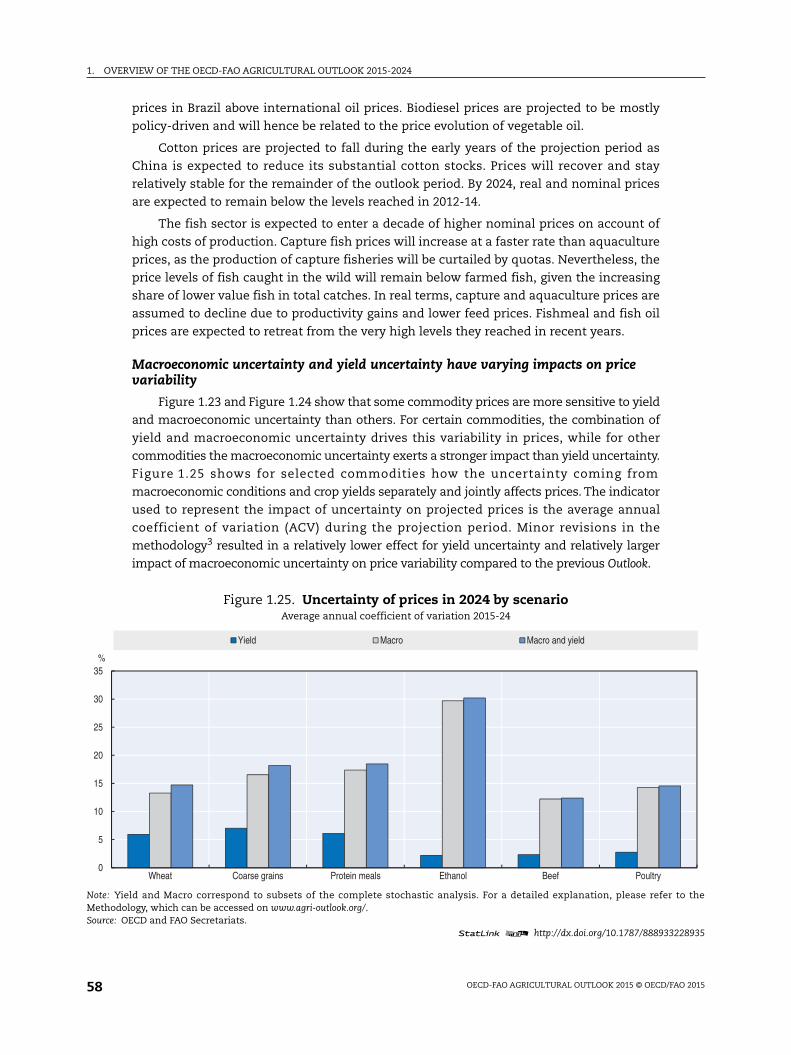
1. OVERVIEW OF THE OECD-FAO AGRICULTURAL OUTLOOK 2015-2024
to the
228935
prices in Brazil above international oil prices. Biodiesel prices are projected to be mostly
policy-driven and will hence be related to the price evolution of vegetable oil.
Cotton prices are projected to fall during the early years of the projection period as
China is expected to reduce its substantial cotton stocks. Prices will recover and stay
relatively stable for the remainder of the outlook period. By 2024, real and nominal prices
are expected to remain below the levels reached in 2012-14.
The fish sector is expected to enter a decade of higher nominal prices on account of
high costs of production. Capture fish prices will increase at a faster rate than aquaculture
prices, as the production of capture fisheries will be curtailed by quotas. Nevertheless, the
price levels of fish caught in the wild will remain below farmed fish, given the increasing
share of lower value fish in total catches. In real terms, capture and aquaculture prices are
assumed to decline due to productivity gains and lower feed prices. Fishmeal and fish oil
prices are expected to retreat from the very high levels they reached in recent years.
Macroeconomic uncertainty and yield uncertainty have varying impacts on pricevariability
Figure 1.23 and Figure 1.24 show that some commodity prices are more sensitive to yield
and macroeconomic uncertainty than others. For certain commodities, the combination of
yield and macroeconomic uncertainty drives this variability in prices, while for other
commodities the macroeconomic uncertainty exerts a stronger impact than yield uncertainty.
Figure 1.25 shows for selected commodities how the uncertainty coming from
macroeconomic conditions and crop yields separately and jointly affects prices. The indicator
used to represent the impact of uncertainty on projected prices is the average annual
coefficient of variation (ACV) during the projection period. Minor revisions in the
methodology3 resulted in a relatively lower effect for yield uncertainty and relatively larger
impact of macroeconomic uncertainty on price variability compared to the previous Outlook.
Figure 1.25. Uncertainty of prices in 2024 by scenarioAverage annual coefficient of variation 2015-24
Note: Yield and Macro correspond to subsets of the complete stochastic analysis. For a detailed explanation, please referMethodology, which can be accessed on www.agri-outlook.org/.Source: OECD and FAO Secretariats.
1 2 http://dx.doi.org/10.1787/888933
0
5
10
15
20
25
30
35
Wheat Coarse grains Protein meals Ethanol Beef Poultry
%
Yield Macro Macro and yield
OECD-FAO AGRICULTURAL OUTLOOK 2015 © OECD/FAO 201558
1. OVERVIEW OF THE OECD-FAO AGRICULTURAL OUTLOOK 2015-2024
Arable crops clearly experience a larger influence from yield uncertainty than other
commodities because yield uncertainty directly affects the production of arable crops.
These effects get transmitted to other products as coarse grains are used for feed and
biofuel feedstock. Since poultry production relies much more on the intensive use of feed
grains and protein meals than beef, it experiences a higher impact from yield uncertainty.
Macroeconomic uncertainty plays a bigger role than yield uncertainty as it includes a
combination of factors, which influence prices through a variety of channels. The price of
crude oil and the GDP deflator, for example, influence input prices, while GDP growth and
CPI determine consumption levels.
Protein meal prices move together with coarse grain prices as both commodities are
used for feed. As a result, prices of protein meals display a similar sensitivity to
macroeconomic uncertainty as coarse grains.
Ethanol prices demonstrate only a small impact of yield uncertainty compared to
macroeconomic uncertainty. Most of this uncertainty is driven by Brazil, as it is the only
country where ethanol consumption is at the same time market-driven and determined by
policies through the compulsory blending of ethanol in regular gasoline. In Brazil, market-
based ethanol demand is directly related to the ratio between domestic prices of gasoline
and of ethanol. The macroeconomic environment in Brazil is affecting the level of domestic
gasoline use and thus the amount of ethanol that has to be blended into gasoline.
Notes
1. The blend wall term refers to short run technical constraints that act as an impediment toincreased ethanol use. E10 refers to gasohol with 10% volume of ethanol blended into petrol. E10 isstill the most commonly available gasohol in the United States.
2. Sugarcane based ethanol qualifies as an advanced biofuels in the United States.
3. For a detailed explanation, please refer to the Methodology, which can be accessed on www.agri-outlook.org/.
OECD-FAO AGRICULTURAL OUTLOOK 2015 © OECD/FAO 2015 59

OECD-FAO Agricultural Outlook 2015
© OECD/FAO 2015
PART I
Chapter 2
Brazilian agriculture:Prospects and challenges
This chapter reviews the prospects and challenges facing Brazil’s agriculture, biofueland fish sectors over the next decade. It reviews sector performance, outlines thecurrent market context, provides detailed quantitative medium term projections forthe ten-year period 2015-24, and assesses key risks and uncertainties. Brazil’s mainchallenges lie in sustaining productivity and production growth, while ensuring thatsuch growth is reconciled with the country’s poverty and inequality reductionobjectives and the need for environmental sustainability. The chapter describes themain domestic and trade policies seeking to address these multiple objectives andsuggests some strategic priorities, in the areas of productivity-enhancinginvestments, as well as targeted measures to ensure broad based sustainabledevelopment. Brazil is projected to maintain its role as a leading supplier tointernational food and agriculture markets over the next decade while also meetingthe needs of an expanding and increasingly wealthy population. The key risks tothis optimistic outlook pertain to Brazil’s macroeconomic performance, the pace ofstructural reforms, and external factors including China’s import demand.
The statistical data for Israel are supplied by and under the responsibility of the relevant Israeli authorities. Theuseof such data by the OECD is without prejudice to the status of the Golan Heights, East Jerusalem and Israelisettlements in the West Bank under the terms of international law.
The position of the United Nations on the question of Jerusalem is contained in General Assembly Resolution 181(II) of29 November 1947, and subsequent resolutions of the General Assembly and the Security Council concerning thisquestion.
61
2. BRAZILIAN AGRICULTURE: PROSPECTS AND CHALLENGES
IntroductionBrazil is among the world’s ten largest economies, with a GDP of over USD 2 trillion in
2013. It has the fifth highest population (now over 200 million) and the fifth largest surface
area. Real GDP per capita has grown at an average of nearly 5% per year since 1995,
enabling per capita incomes to reach USD 11 200 in 2013 and consolidating Brazil’s position
as an “upper middle income” country (World Development Indicators, 2014). In recent
years, the country has made outstanding progress in poverty reduction, with the
proportion of the population living on less than USD 1.25 per day falling from 7.2% to 3.8%
between 2005 and 2012, and the proportion living on less than USD 2 per day falling from
15.5% to 6.8% over the same period. Nevertheless, over one-half of households live with per
capita income at or below the minimum wage, and, despite some progress over the past
decade, income distribution remains one of the world’s most uneven. In 2012 the highest
earning 10% of households accounted for 42% of total income, and the lowest earning 10%
responded for just 1% (World Development Indicators, 2014).
The agricultural sector plays an important role in underpinning Brazil’s economic
performance, even though agriculture’s share of GDP is no more than one would expect
given the country’s level of development, at 5.4% in 2010-13. Brazilian agriculture has seen
strong growth for over three decades. Total agricultural output has more than doubled in
volume compared to its level in 1990 and livestock production has almost trebled, primarily
on the basis of productivity improvements. The sector makes an important contribution to
the country’s trade balance. Exports by agriculture and agro-food industries totalled over
USD 86 billion in 2013, accounting for 36% of total exports. These exports more than offset
deficits in other sectors and have been rising in importance, strengthening the sector’s role
as an earner of foreign currency. Brazil’s agricultural exports make it a major player on
international markets. Brazil is the world’s second largest agricultural exporter and the
biggest supplier of sugar, orange juice and coffee. In 2013 it surpassed the United States as
the largest supplier of soybeans and it is a major exporter of tobacco and poultry. It is also
a major producer of maize, rice and beef – the majority of which are absorbed by the large
domestic market.
The agricultural sector absorbed about 13% of Brazil’s employment in 2012, or almost
three times its share in GDP. The implied low labour productivity compared to the rest of
the economy reflects in part the dualistic nature of farming in Brazil, where capital-
intensive and large-scale production co-exists with traditional farms, including many
small and resource-poor farms producing for self-consumption or local markets.
Nevertheless, the labour productivity gap in agriculture is declining, with rapid
improvements in labour productivity driven mainly by more capital-intensive production.
Some of that growth occurred among small-scale farms producing high value products.
The country is relatively urbanised, with 15% of the population living in rural areas in 2013
(World Bank, 2015). The majority of the poor live in urban areas and spend a significant
share of their income on food. The rural poor are less numerous, but the incidence of
OECD-FAO AGRICULTURAL OUTLOOK 2015 © OECD/FAO 201562
2. BRAZILIAN AGRICULTURE: PROSPECTS AND CHALLENGES
poverty is more than double that in urban areas, at nearly 30%. Agriculture is also a buyer
and supplier for a significant part of the rest of the economy – the agricultural input
sectors, agro-processing and retailing altogether contribute an additional 17% to GDP and
around 18% to employment (OECD, 2014).
One of the most outstanding developments of the Brazilian economy over the past
decade has been the pronounced reduction in poverty and hunger. A new approach to
tackling these problems was implemented in 2003 with the launching of the Zero Hunger
Program. The model adopted in Brazil represented a breakthrough, by making the war on
poverty and hunger a central policy priority and by recognising that the multi-sectoral
dimensions of the problems required concerted actions across government departments,
with widened involvement of civil society. This approach has attracted widespread interest
internationally, and efforts to implement the Brazilian approach are being pursued in
numerous countries of Latin America and also in certain countries of Africa and Asia. In
Brazil, as in many other countries, access to food, rather than availability of supplies, was
identified as the most significant factor contributing to hunger and food insecurity. Broad-
based social protection and development measures aimed at strengthening the inclusion
of vulnerable populations in economic growth and improving their access to food were
complemented by targeted measures to raise productivity and production among “family”
farms.1 This inclusive approach continues to represent an over-riding national priority as
reflected in the Brazil without Extreme Poverty Plan of 2011. While the measures
implemented since the early 2000s have been effective in eradicating hunger as measured
by the FAO’s undernourishment indicator (FAO, 2014), the Government considers that still
much remains to be done to tackle poverty, including among rural populations that depend
on agriculture for their livelihoods.
The rise in agricultural productivity over the past three decades has had an important
impact on access to food supplies in the domestic market. Since the mid-1970s, the prices
of basic foods have decreased continuously, raising real incomes and lowering inflationary
pressures (Tollini, 2007). Agriculture is also expected to make an increasing contribution to
enhanced environmental sustainability through the adoption of policies and implementation
of targeted programmes, such as those promoting environmentally sound agricultural
practices, incentives to low carbon agricultural initiatives and support to biofuel
production.
Finally, agriculture in Brazil is an important contributor to the country’s energy supply.
Renewable energy from agriculture, comprises of sugarcane biomass (42%), hydraulic
energy (28%), firewood (20%) and other sources (10%). These account for almost half of the
total energy supply (MME/EPE, 2013b).
For the past twenty years, Brazil’s agricultural sector has grown rapidly on the basis of
increased productivity, as well as expansion and consolidation of the agricultural frontier
in the Centre-West and Northern regions. Although the internal market absorbs the largest
part of Brazilian agricultural output, this growth has been mainly driven by the expansion
of the production of export-oriented products, especially soybeans, sugar and poultry. The
share of these products exported increased sharply in the 1990s, but has generally
stabilised. In 2013, China replaced the European Union as the single most important
market for Brazil’s agriculture-based exports, reinforcing the recent trend towards new
commercial partners, such as countries in East Asia and the Pacific, the Middle East, and
Latin America.
OECD-FAO AGRICULTURAL OUTLOOK 2015 © OECD/FAO 2015 63
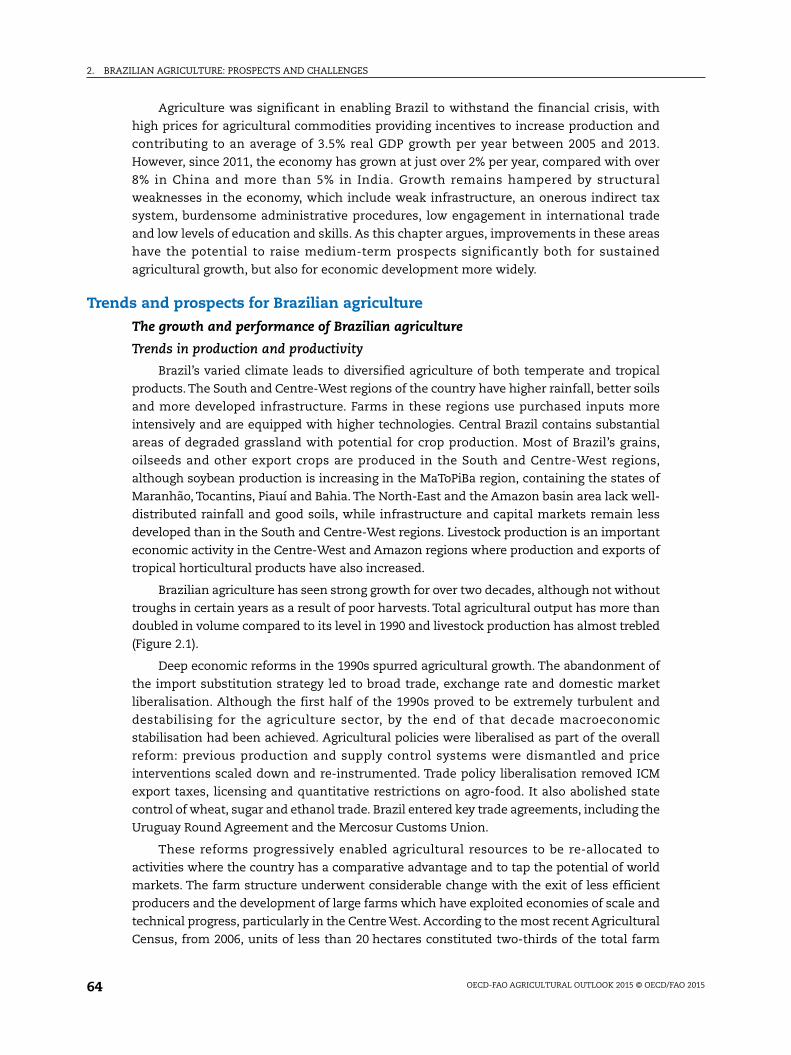
2. BRAZILIAN AGRICULTURE: PROSPECTS AND CHALLENGES
Agriculture was significant in enabling Brazil to withstand the financial crisis, with
high prices for agricultural commodities providing incentives to increase production and
contributing to an average of 3.5% real GDP growth per year between 2005 and 2013.
However, since 2011, the economy has grown at just over 2% per year, compared with over
8% in China and more than 5% in India. Growth remains hampered by structural
weaknesses in the economy, which include weak infrastructure, an onerous indirect tax
system, burdensome administrative procedures, low engagement in international trade
and low levels of education and skills. As this chapter argues, improvements in these areas
have the potential to raise medium-term prospects significantly both for sustained
agricultural growth, but also for economic development more widely.
Trends and prospects for Brazilian agriculture
The growth and performance of Brazilian agriculture
Trends in production and productivity
Brazil’s varied climate leads to diversified agriculture of both temperate and tropical
products. The South and Centre-West regions of the country have higher rainfall, better soils
and more developed infrastructure. Farms in these regions use purchased inputs more
intensively and are equipped with higher technologies. Central Brazil contains substantial
areas of degraded grassland with potential for crop production. Most of Brazil’s grains,
oilseeds and other export crops are produced in the South and Centre-West regions,
although soybean production is increasing in the MaToPiBa region, containing the states of
Maranhão, Tocantins, Piauí and Bahia. The North-East and the Amazon basin area lack well-
distributed rainfall and good soils, while infrastructure and capital markets remain less
developed than in the South and Centre-West regions. Livestock production is an important
economic activity in the Centre-West and Amazon regions where production and exports of
tropical horticultural products have also increased.
Brazilian agriculture has seen strong growth for over two decades, although not without
troughs in certain years as a result of poor harvests. Total agricultural output has more than
doubled in volume compared to its level in 1990 and livestock production has almost trebled
(Figure 2.1).
Deep economic reforms in the 1990s spurred agricultural growth. The abandonment of
the import substitution strategy led to broad trade, exchange rate and domestic market
liberalisation. Although the first half of the 1990s proved to be extremely turbulent and
destabilising for the agriculture sector, by the end of that decade macroeconomic
stabilisation had been achieved. Agricultural policies were liberalised as part of the overall
reform: previous production and supply control systems were dismantled and price
interventions scaled down and re-instrumented. Trade policy liberalisation removed ICM
export taxes, licensing and quantitative restrictions on agro-food. It also abolished state
control of wheat, sugar and ethanol trade. Brazil entered key trade agreements, including the
Uruguay Round Agreement and the Mercosur Customs Union.
These reforms progressively enabled agricultural resources to be re-allocated to
activities where the country has a comparative advantage and to tap the potential of world
markets. The farm structure underwent considerable change with the exit of less efficient
producers and the development of large farms which have exploited economies of scale and
technical progress, particularly in the Centre West. According to the most recent Agricultural
Census, from 2006, units of less than 20 hectares constituted two-thirds of the total farm
OECD-FAO AGRICULTURAL OUTLOOK 2015 © OECD/FAO 201564
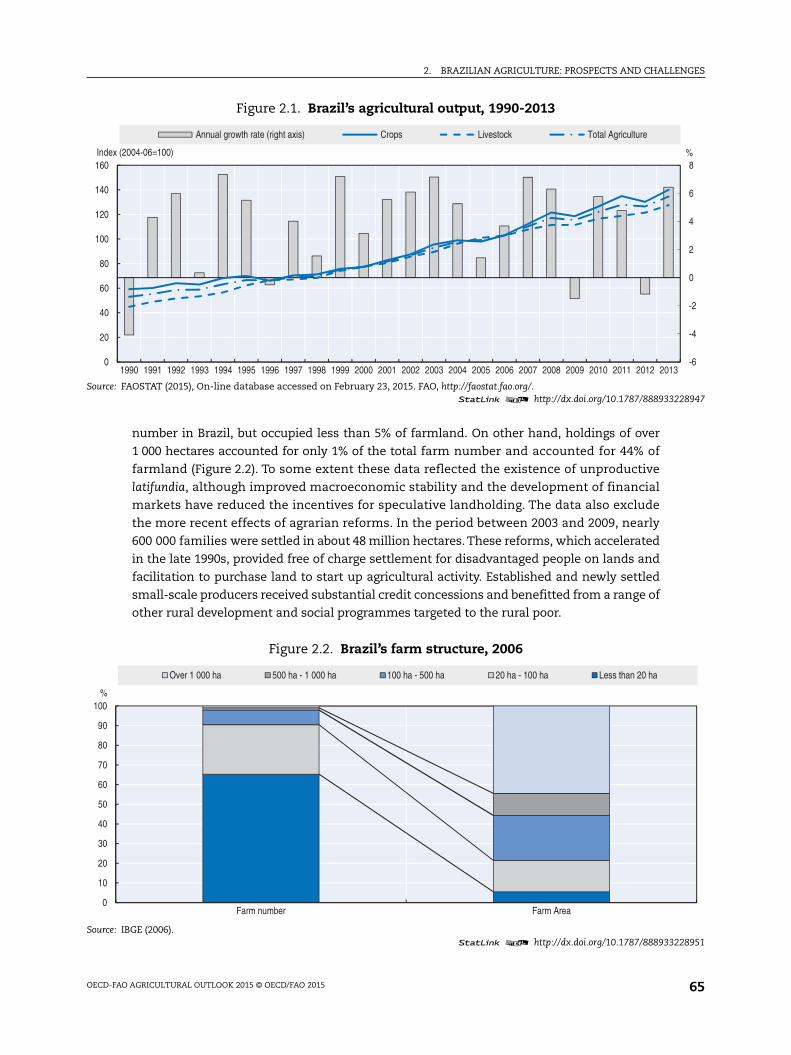
2. BRAZILIAN AGRICULTURE: PROSPECTS AND CHALLENGES
228947
-6
-4
-2
0
2
4
6
8
3
%
228951
number in Brazil, but occupied less than 5% of farmland. On other hand, holdings of over
1 000 hectares accounted for only 1% of the total farm number and accounted for 44% of
farmland (Figure 2.2). To some extent these data reflected the existence of unproductive
latifundia, although improved macroeconomic stability and the development of financial
markets have reduced the incentives for speculative landholding. The data also exclude
the more recent effects of agrarian reforms. In the period between 2003 and 2009, nearly
600 000 families were settled in about 48 million hectares. These reforms, which accelerated
in the late 1990s, provided free of charge settlement for disadvantaged people on lands and
facilitation to purchase land to start up agricultural activity. Established and newly settled
small-scale producers received substantial credit concessions and benefitted from a range of
other rural development and social programmes targeted to the rural poor.
Figure 2.1. Brazil’s agricultural output, 1990-2013
Source: FAOSTAT (2015), On-line database accessed on February 23, 2015. FAO, http://faostat.fao.org/.1 2 http://dx.doi.org/10.1787/888933
0
20
40
60
80
100
120
140
160
1990 1991 1992 1993 1994 1995 1996 1997 1998 1999 2000 2001 2002 2003 2004 2005 2006 2007 2008 2009 2010 2011 2012 201
Index (2004-06=100)
Annual growth rate (right axis) Crops Livestock Total Agriculture
Figure 2.2. Brazil’s farm structure, 2006
Source: IBGE (2006).1 2 http://dx.doi.org/10.1787/888933
0
10
20
30
40
50
60
70
80
90
100
Farm number Farm Area
%
Over 1 000 ha 500 ha - 1 000 ha 100 ha - 500 ha 20 ha - 100 ha Less than 20 ha
OECD-FAO AGRICULTURAL OUTLOOK 2015 © OECD/FAO 2015 65
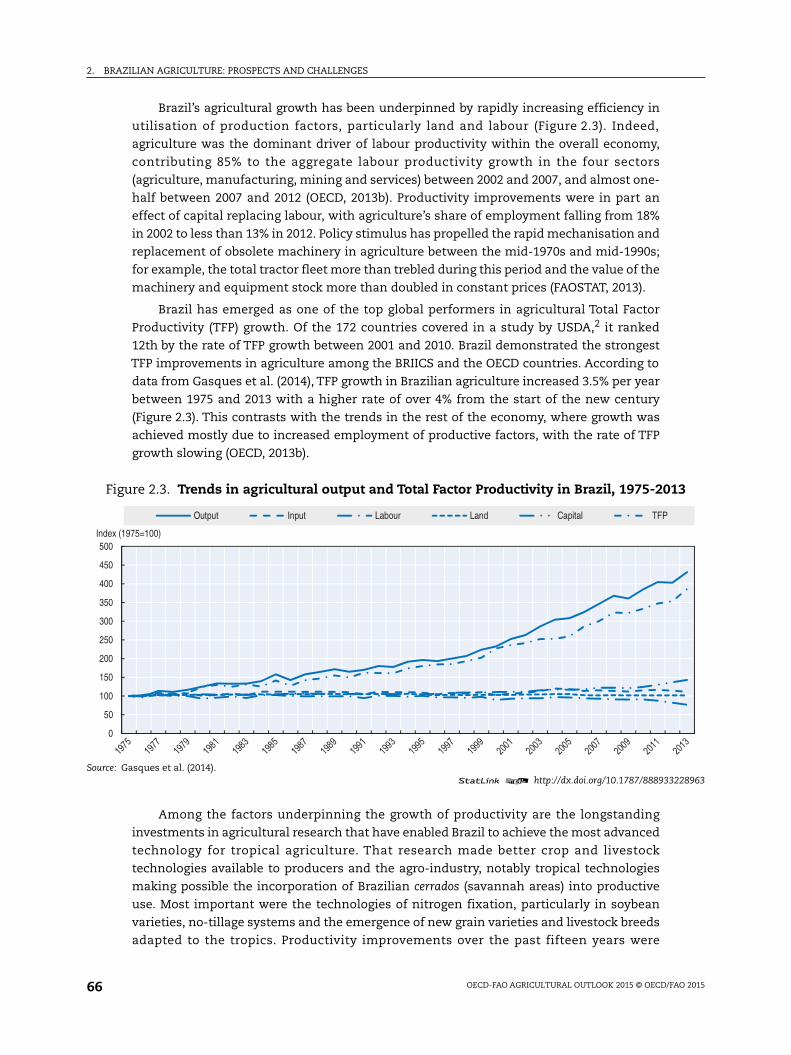
2. BRAZILIAN AGRICULTURE: PROSPECTS AND CHALLENGES
3
228963
Brazil’s agricultural growth has been underpinned by rapidly increasing efficiency in
utilisation of production factors, particularly land and labour (Figure 2.3). Indeed,
agriculture was the dominant driver of labour productivity within the overall economy,
contributing 85% to the aggregate labour productivity growth in the four sectors
(agriculture, manufacturing, mining and services) between 2002 and 2007, and almost one-
half between 2007 and 2012 (OECD, 2013b). Productivity improvements were in part an
effect of capital replacing labour, with agriculture’s share of employment falling from 18%
in 2002 to less than 13% in 2012. Policy stimulus has propelled the rapid mechanisation and
replacement of obsolete machinery in agriculture between the mid-1970s and mid-1990s;
for example, the total tractor fleet more than trebled during this period and the value of the
machinery and equipment stock more than doubled in constant prices (FAOSTAT, 2013).
Brazil has emerged as one of the top global performers in agricultural Total Factor
Productivity (TFP) growth. Of the 172 countries covered in a study by USDA,2 it ranked
12th by the rate of TFP growth between 2001 and 2010. Brazil demonstrated the strongest
TFP improvements in agriculture among the BRIICS and the OECD countries. According to
data from Gasques et al. (2014), TFP growth in Brazilian agriculture increased 3.5% per year
between 1975 and 2013 with a higher rate of over 4% from the start of the new century
(Figure 2.3). This contrasts with the trends in the rest of the economy, where growth was
achieved mostly due to increased employment of productive factors, with the rate of TFP
growth slowing (OECD, 2013b).
Among the factors underpinning the growth of productivity are the longstanding
investments in agricultural research that have enabled Brazil to achieve the most advanced
technology for tropical agriculture. That research made better crop and livestock
technologies available to producers and the agro-industry, notably tropical technologies
making possible the incorporation of Brazilian cerrados (savannah areas) into productive
use. Most important were the technologies of nitrogen fixation, particularly in soybean
varieties, no-tillage systems and the emergence of new grain varieties and livestock breeds
adapted to the tropics. Productivity improvements over the past fifteen years were
Figure 2.3. Trends in agricultural output and Total Factor Productivity in Brazil, 1975-201
Source: Gasques et al. (2014).1 2 http://dx.doi.org/10.1787/888933
0
50
100
150
200
250
300
350
400
450
500Index (1975=100)
Output Input Labour Land Capital TFP
OECD-FAO AGRICULTURAL OUTLOOK 2015 © OECD/FAO 201566
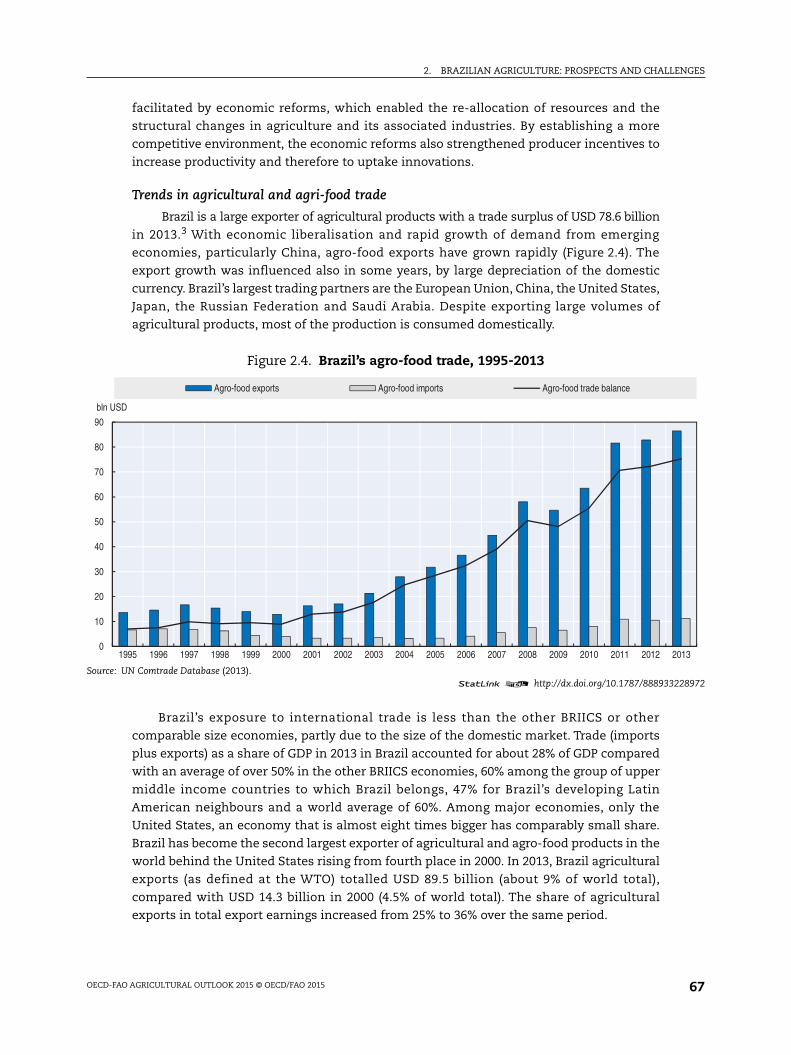
2. BRAZILIAN AGRICULTURE: PROSPECTS AND CHALLENGES
228972
2013
facilitated by economic reforms, which enabled the re-allocation of resources and the
structural changes in agriculture and its associated industries. By establishing a more
competitive environment, the economic reforms also strengthened producer incentives to
increase productivity and therefore to uptake innovations.
Trends in agricultural and agri-food trade
Brazil is a large exporter of agricultural products with a trade surplus of USD 78.6 billion
in 2013.3 With economic liberalisation and rapid growth of demand from emerging
economies, particularly China, agro-food exports have grown rapidly (Figure 2.4). The
export growth was influenced also in some years, by large depreciation of the domestic
currency. Brazil’s largest trading partners are the European Union, China, the United States,
Japan, the Russian Federation and Saudi Arabia. Despite exporting large volumes of
agricultural products, most of the production is consumed domestically.
Brazil’s exposure to international trade is less than the other BRIICS or other
comparable size economies, partly due to the size of the domestic market. Trade (imports
plus exports) as a share of GDP in 2013 in Brazil accounted for about 28% of GDP compared
with an average of over 50% in the other BRIICS economies, 60% among the group of upper
middle income countries to which Brazil belongs, 47% for Brazil’s developing Latin
American neighbours and a world average of 60%. Among major economies, only the
United States, an economy that is almost eight times bigger has comparably small share.
Brazil has become the second largest exporter of agricultural and agro-food products in the
world behind the United States rising from fourth place in 2000. In 2013, Brazil agricultural
exports (as defined at the WTO) totalled USD 89.5 billion (about 9% of world total),
compared with USD 14.3 billion in 2000 (4.5% of world total). The share of agricultural
exports in total export earnings increased from 25% to 36% over the same period.
Figure 2.4. Brazil’s agro-food trade, 1995-2013
Source: UN Comtrade Database (2013).1 2 http://dx.doi.org/10.1787/888933
0
10
20
30
40
50
60
70
80
90
1995 1996 1997 1998 1999 2000 2001 2002 2003 2004 2005 2006 2007 2008 2009 2010 2011 2012
bln USD
Agro-food exports Agro-food imports Agro-food trade balance
OECD-FAO AGRICULTURAL OUTLOOK 2015 © OECD/FAO 2015 67
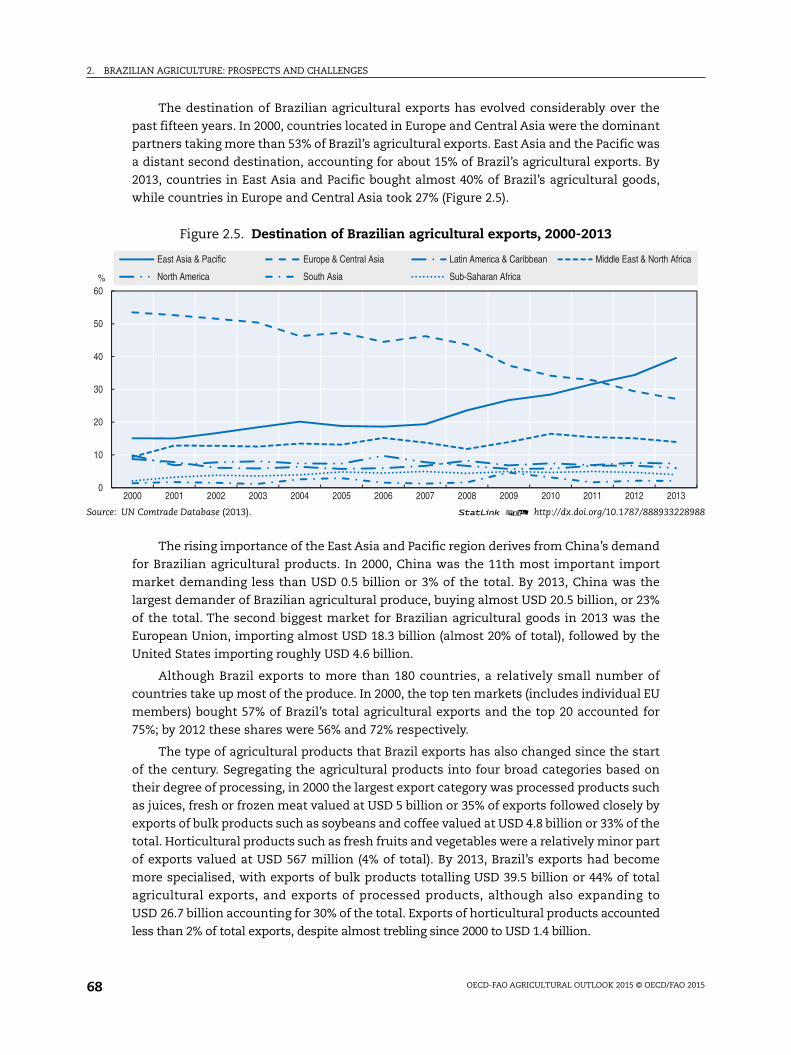
2. BRAZILIAN AGRICULTURE: PROSPECTS AND CHALLENGES
228988
13
frica
The destination of Brazilian agricultural exports has evolved considerably over the
past fifteen years. In 2000, countries located in Europe and Central Asia were the dominant
partners taking more than 53% of Brazil’s agricultural exports. East Asia and the Pacific was
a distant second destination, accounting for about 15% of Brazil’s agricultural exports. By
2013, countries in East Asia and Pacific bought almost 40% of Brazil’s agricultural goods,
while countries in Europe and Central Asia took 27% (Figure 2.5).
The rising importance of the East Asia and Pacific region derives from China’s demand
for Brazilian agricultural products. In 2000, China was the 11th most important import
market demanding less than USD 0.5 billion or 3% of the total. By 2013, China was the
largest demander of Brazilian agricultural produce, buying almost USD 20.5 billion, or 23%
of the total. The second biggest market for Brazilian agricultural goods in 2013 was the
European Union, importing almost USD 18.3 billion (almost 20% of total), followed by the
United States importing roughly USD 4.6 billion.
Although Brazil exports to more than 180 countries, a relatively small number of
countries take up most of the produce. In 2000, the top ten markets (includes individual EU
members) bought 57% of Brazil’s total agricultural exports and the top 20 accounted for
75%; by 2012 these shares were 56% and 72% respectively.
The type of agricultural products that Brazil exports has also changed since the start
of the century. Segregating the agricultural products into four broad categories based on
their degree of processing, in 2000 the largest export category was processed products such
as juices, fresh or frozen meat valued at USD 5 billion or 35% of exports followed closely by
exports of bulk products such as soybeans and coffee valued at USD 4.8 billion or 33% of the
total. Horticultural products such as fresh fruits and vegetables were a relatively minor part
of exports valued at USD 567 million (4% of total). By 2013, Brazil’s exports had become
more specialised, with exports of bulk products totalling USD 39.5 billion or 44% of total
agricultural exports, and exports of processed products, although also expanding to
USD 26.7 billion accounting for 30% of the total. Exports of horticultural products accounted
less than 2% of total exports, despite almost trebling since 2000 to USD 1.4 billion.
Figure 2.5. Destination of Brazilian agricultural exports, 2000-2013
Source: UN Comtrade Database (2013). 1 2 http://dx.doi.org/10.1787/888933
0
10
20
30
40
50
60
2000 2001 2002 2003 2004 2005 2006 2007 2008 2009 2010 2011 2012 20
%
East Asia & Pacific Europe & Central Asia Latin America & Caribbean Middle East & North A
North America South Asia Sub-Saharan Africa
OECD-FAO AGRICULTURAL OUTLOOK 2015 © OECD/FAO 201568
2. BRAZILIAN AGRICULTURE: PROSPECTS AND CHALLENGES
Brazil is relatively heavily dependent upon a few products to generate most of its
export earnings from the sector. In 2013, soybean exports totalled USD 23 billion,
representing 26% of agricultural export earnings. The top ten products generated almost
82% of export earnings from agricultural goods – compared to 79% in 2000 (MAPA,
Intercambio Comercial do Agronegócio: principais mercados de destino, 2013). The
composition of the top products and relative rankings changed somewhat between the two
years however with maize and ethyl alcohol surpassing soybean oil and prepared meats.
The rise in ethyl alcohol exports, which was driven by US biofuel policy, is not projected to
be sustained in the current Outlook.
In addition, Brazil is relatively unintegrated with global value chains, with a modest
10% of intermediate inputs originating overseas, while a relatively small share of Brazilian
exports are used by other economies to generate their own exports. One explanation is
Brazil’s relatively high protection of its manufacturing sector.
While Brazil has increased its export share of the international agricultural and food
market, its imports of food and its products have also risen. An increase from USD 4.1 billion in
2000 to USD 11.1 billion in 2013 covered domestic shortfalls in certain commodities, and
provided consumers with additional choices. Imports of wheat account for about 20% of the
imported value, while other major imports include dairy products, olive oil and various food
preparations.
Development of the Brazilian ethanol industry
The blending of sugarcane based ethanol with gasoline in Brazil dates back to 1931.
Cheap crude oil prices after the Second World War meant that the blending of ethanol into
regular gasoline was not commercially viable. However, in November 1975 in response to the
first crude oil crisis, the Brazilian government created the National Alcohol Program,“Proálcool”. This programme enacted the obligatory blending of anhydrous ethanol with
gasoline (hereafter referred as gasohol) for fuels used by ordinary cars, which enabled the
sugarcane based ethanol industry to increase its producing capacities. Proálcool successfully
reduced the impact of the oil crisis on the Brazilian trade balance and increased the country’s
energy self-sufficiency. Nevertheless, when the second oil crisis occurred in 1979, Brazil was
still importing the majority of its oil which renewed the government’s focus on Proálcool and
led to increased subsidies for both producers and consumers and credit for investment into
the sector. The first car running on hydrous ethanol was launched in 1979.
A succession of factors in the second half of the 1980s, including the downward oil
price shock, increased international sugar prices, the debt crisis and deregulation of the
Brazilian economy, reduced the profitability of the ethanol sector until the early 2000s
when it became the target of massive investments. Growing concerns about global
warming, greenhouse gas emission and energy security led a certain number of developed
and developing countries to implement ambitious biofuel targets or mandates as well as
other support measures to the biofuel sector. Under the Renewable Fuel Standard (RFS2),
set in 2007 in the United States, Brazilian sugarcane based ethanol qualified as an
advanced fuel, which increased demand for Brazilian ethanol on the international market.
In addition, the introduction of flex-fuel vehicles in March 2003 contributed to the
rebound of the ethanol industry. This new technology was widely accepted by automobile
manufacturers and consumers (MME/EPE, 2013a): In 2004, flex-fuel vehicles represented 22% of
light vehicles sales in Brazil. In 2014, their share reached more than 88%. Domestic Brazilian
OECD-FAO AGRICULTURAL OUTLOOK 2015 © OECD/FAO 2015 69
2. BRAZILIAN AGRICULTURE: PROSPECTS AND CHALLENGES
ethanol demand jumped from about four billion litres in 2003 to 16.5 billion in 2009, with an
annual growth rate exceeding 15% (MME/EPE, 2014) boosted by the increase in fuel use and by
the competitive price of hydrous ethanol with respect to gasohol. During the same period, total
ethanol production increased from 14.5 to 26.1 billion litres, in order to meet not only domestic
demand, but also international contracts and other uses. This boost in production was made
possible by extensive debt financing from the sugar and ethanol industries.
The global economic crisis at the end of the last decade interrupted the upward trend
of the Brazilian ethanol industry, reducing the construction of new plants and capital
investment in the existing units. As a consequence, the expansion of sugarcane production
fell. This was felt strongly from 2010, as the sector was highly indebted and investments
were cut, which resulted in higher production costs. This, along with several climatic
problems that resulted in low sugarcane yields, contributed to the rise in the international
sugar price amplified the negative impacts on the ethanol industry.
From 2006, Brazil’s fossil fuel pricing policy, adopted in order to contain inflation and
applied by Petrobras,4 kept the Brazilian gasoline price insulated from the crude oil price
fluctuations in the international market.This affected ethanol prices and profits of the ethanol
industry. Uncertainty concerning the future of biofuel policies in the United States and to a
lesser extent in the European Union added to the ethanol crisis. Given the strong decrease of
international crude oil prices in 2014, Brazilian petrol retail prices are at present slightly above
international prices.This coupled with differentiated taxation between ethanol and gasohol as
well as the increased blending requirement for anhydrous ethanol that entered in place in 2015
should help the Brazilian ethanol industry in the short term.
Sustainability performance of agriculture
Although driven mainly by strongly increasing productivity, agricultural growth was
also associated with an expansion of agricultural land, which increased by 34 million
hectares between 1990 and 2012. On a global scale, this was one of the largest expansions
during that time period. In the first half of the 1990s, this occurred mostly due to the
outstretching of pastureland – a process driven by the introduction of new land
management technologies and policy stimulus, but which virtually stopped by the end of
that decade. Since then, agricultural land has increased mainly due to expansion of arable
areas, which in over only four crop years, 2000/01 to 2003/04, soared by 9 million hectares,
with soybean plantings increasing by 50%. The expansion of soybean area, particularly in
the Centre West, has in turn boosted plantings of crops that are rotated with soybeans,
notably second crop maize and cotton.
Recent decades have also seen a shrinking of native forest land, the share of which in
total land fell from 68% to 61% between 1990 and 2011. There is continued debate on how
and to what degree agriculture contributed directly or indirectly to this process.5 A
significant share of deforestation was due to illegal logging activities, with cleared land
subsequently used for pasture. This led to concerns regarding the expansion of agriculture
in the Amazon region in particular, which together with surrounding cerrado savannah
contains the largest portion of the world’s terrestrial biodiversity. The accumulated area of
deforestation in the legal Amazon6 increased from 43 million hectares in 1990 to 75 million
hectares in 2010 (IBGE, 2013). Since the mid-2000s, Amazon deforestation rates have been
consistently decelerating, reflecting progressive tightening of land use monitoring. This
trend was temporarily reversed with a rise in deforestation in 2013 of 5 891 km2, but the
latest estimates for 2014 indicate a reduction of 18% to 4 848 km2 (National Institute for
OECD-FAO AGRICULTURAL OUTLOOK 2015 © OECD/FAO 201570
2. BRAZILIAN AGRICULTURE: PROSPECTS AND CHALLENGES
Spatial Research). Some analyses tend to link recent deforestation rates with infrastructure
projects carried out in the Amazon region, rather than with the expansion of agriculture
(FGV, 2013). The environmental impact of agricultural expansion in the Amazon region and
cerrado has received much public attention, both nationally and internationally.
The available data suggest that fertiliser and agricultural chemical use in Brazil has
intensified. However, according to the 2006 Agricultural Census, almost 70% of farms
reported they did not use any fertiliser during the census year, and the same share reported
no use of agricultural chemicals. This implies that the impacts of fertiliser and chemical
use are strongly differentiated by the type of agricultural system and by region (Helfand et
al., 2013). Given the abundance of rainfall and water resources, the importance of irrigation
in Brazil is small, with only around 2% of agricultural land equipped with irrigation. This
share, nevertheless, has tended to increase since 1990, with agriculture currently making
almost 60% of annual freshwater withdrawals. Brazil ranks fifth worldwide in terms of
overall greenhouse gas (GHG) emissions, although total emissions have fallen sharply as a
result of reduced deforestation. Agriculture is a significant source of GHG emissions, as a
result of both land-use change and considerable growth in livestock inventories, which
rose by almost 40% between 1990 and 2010 in cattle equivalents, among the most
important increases globally (USDA, 2013). The expansion of inventory doubled livestock
density, from 3 heads per hectare of agricultural land in 1990 to 6 heads in 2011. These
levels are comparable with those in New Zealand where a pastoral system prevails, but are
low compared to world regions with more intensive livestock production (e.g. the European
Union with an average total cattle number per hectare of 9.6 heads).
Average figures for Brazil disguise substantial differentiation in the nature and scale of
environmental pressures across Brazil resulting from different farming systems. For
example, commercial farming in the southern states of Rio Grande do Sul, São Paulo and
Paraná is input intensive, with high fertiliser use. Farming systems in these areas are
associated with concerns on the impact of agricultural water use on resource levels, and
pesticide use on water quality. In the Centre West farming systems are more extensive.
Farmers in these regions increasingly use direct planting which also reduces the risks of
erosion; however, a loss of natural forest cover and biodiversity is a significant concern in
these parts of the country (OECD, 2005). The use of no tillage or minimum tillage practices
(direct planting) mitigates some of the pressures on the soil and requires less fuel. At the
same time it facilitates the use of double or even triple cropping. Direct planting is also
associated with the use of GMOs, which leads to less use of pesticides.
Brazil’s agricultural outlookThe outlook for Brazilian agriculture remains positive, despite the prospect of slower
growth in both domestic and international demand, and declining real prices for most
agricultural commodities. On the supply side, producers are expected to benefit from
continued productivity growth, complemented by a depreciating Brazilian real (BRL). The
current projections assume that there are no significant changes to agricultural policy
settings over the next ten years, and that “normal” weather with no severe events prevails
from one year to the next. Projections for macroeconomic changes in Brazil and the rest of
the world are based on the OECD Economic Outlook (November 2014) and the International
Monetary Fund’s, World Economic Outlook (October 2014), while international oil prices are
projected to grow at the same rate as projected by the IEA’s World Economic Outlook (see
Chapter 1). Changes in any of these assumptions can significantly alter the projections.
OECD-FAO AGRICULTURAL OUTLOOK 2015 © OECD/FAO 2015 71

2. BRAZILIAN AGRICULTURE: PROSPECTS AND CHALLENGES
ata-en.228998
2024
Brazil exhibited relatively strong growth in real income averaging 3.5% per annum
from 2000 to 2007. With the onset of the global financial crisis, growth diminished
somewhat from 2008 to 2013 averaging 3.1% per annum. Until 2016, growth is not expected
to exceed 2% per year. From 2017 to the end of the projection period, real GDP growth is
expected to average 2.6% per annum. The exchange rate of the Brazilian real (BRL) relative
to the USD is expected to depreciate throughout the outlook period making Brazil’s export
sectors more competitive in world markets but also increasing the cost of imports. This is
not expected to put undue pressure on consumer prices, with inflation remaining low.
Crops
During the next ten years, Brazil’s crop sector is expected to continue growing on the
basis of yield growth and increase in agricultural area. Producer prices are expected to rise
briskly during the next ten years, but when adjusted for inflation, crop prices are relatively
flat. Land use for the major crops in 2024, (oilseeds, coarse grains, rice, wheat, sugarcane
and cotton), is expected to reach 69.4 million hectares (Mha), 20% greater than the average
area used during the three years 2012-14, representing a growth rate of some 1.5% per
annum (Figure 2.6).7 In relative terms, this area expansion is primarily driven by the 37%
(relative to the base period)8 expected increase in land allocated to sugarcane production,
followed by the 35% and 23% increase in area allocated to cotcoarse grains, domestic feed
demand for an expanding livestock sector accounts for most of the additionalexpected to
tas expton and oilseed production respectively. In absolute terms however, oilseeds,
predominantly soybeans, will continue to dominate land use in Brazil over the next ten
years taking up almost half of the additional crop area in 2024.
A growing domestic market is expected to take up most of the additional coarse grains
and sugarcane production. In the case of coarse grains, domestic feed demand for an
expanding livestock sector accounts for most of the additional production whereas in the
case of sugarcane it is the expanding ethanol market. Consequently, for these crops, the
share of production going to international markets is relatively flat during the next ten
Figure 2.6. Trend in land used for crop production in Brazil
Source: OECD/FAO (2015), “OECD-FAO Agricultural Outlook”, OECD Agriculture Statistics (database), http://dx.doi.org/10.1787/agr-outl-d1 2 http://dx.doi.org/10.1787/888933
0
10
20
30
40
50
60
70
80
2000 2001 2002 2003 2004 2005 2006 2007 2008 2009 2010 2011 2012 2013 2014 2015 2016 2017 2018 2019 2020 2021 2022 2023
Mha
Cotton Sugarcane Oilseeds Rice Coarse grains Wheat
OECD-FAO AGRICULTURAL OUTLOOK 2015 © OECD/FAO 201572
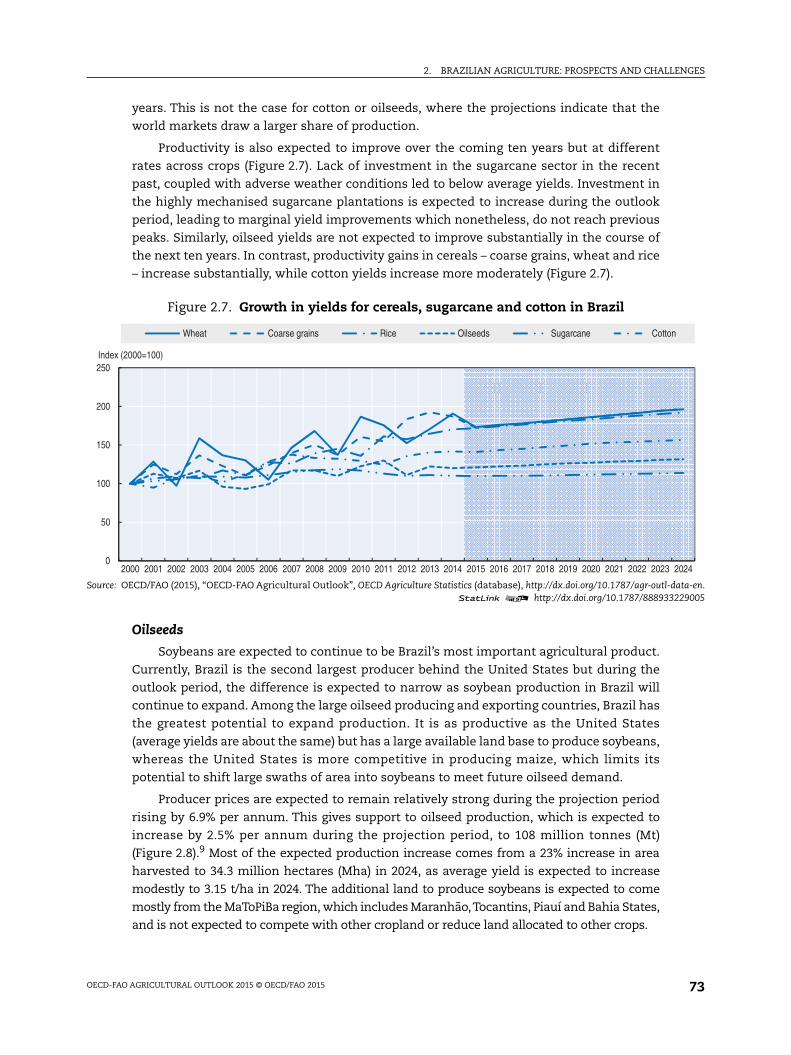
2. BRAZILIAN AGRICULTURE: PROSPECTS AND CHALLENGES
ata-en.229005
2024
years. This is not the case for cotton or oilseeds, where the projections indicate that the
world markets draw a larger share of production.
Productivity is also expected to improve over the coming ten years but at different
rates across crops (Figure 2.7). Lack of investment in the sugarcane sector in the recent
past, coupled with adverse weather conditions led to below average yields. Investment in
the highly mechanised sugarcane plantations is expected to increase during the outlook
period, leading to marginal yield improvements which nonetheless, do not reach previous
peaks. Similarly, oilseed yields are not expected to improve substantially in the course of
the next ten years. In contrast, productivity gains in cereals – coarse grains, wheat and rice
– increase substantially, while cotton yields increase more moderately (Figure 2.7).
Oilseeds
Soybeans are expected to continue to be Brazil’s most important agricultural product.
Currently, Brazil is the second largest producer behind the United States but during the
outlook period, the difference is expected to narrow as soybean production in Brazil will
continue to expand. Among the large oilseed producing and exporting countries, Brazil has
the greatest potential to expand production. It is as productive as the United States
(average yields are about the same) but has a large available land base to produce soybeans,
whereas the United States is more competitive in producing maize, which limits its
potential to shift large swaths of area into soybeans to meet future oilseed demand.
Producer prices are expected to remain relatively strong during the projection period
rising by 6.9% per annum. This gives support to oilseed production, which is expected to
increase by 2.5% per annum during the projection period, to 108 million tonnes (Mt)
(Figure 2.8).9 Most of the expected production increase comes from a 23% increase in area
harvested to 34.3 million hectares (Mha) in 2024, as average yield is expected to increase
modestly to 3.15 t/ha in 2024. The additional land to produce soybeans is expected to come
mostly from the MaToPiBa region, which includes Maranhão,Tocantins, Piauí and Bahia States,
and is not expected to compete with other cropland or reduce land allocated to other crops.
Figure 2.7. Growth in yields for cereals, sugarcane and cotton in Brazil
Source: OECD/FAO (2015), “OECD-FAO Agricultural Outlook”, OECD Agriculture Statistics (database), http://dx.doi.org/10.1787/agr-outl-d1 2 http://dx.doi.org/10.1787/888933
0
50
100
150
200
250
2000 2001 2002 2003 2004 2005 2006 2007 2008 2009 2010 2011 2012 2013 2014 2015 2016 2017 2018 2019 2020 2021 2022 2023
Index (2000=100)
Wheat Coarse grains Rice Oilseeds Sugarcane Cotton
OECD-FAO AGRICULTURAL OUTLOOK 2015 © OECD/FAO 2015 73
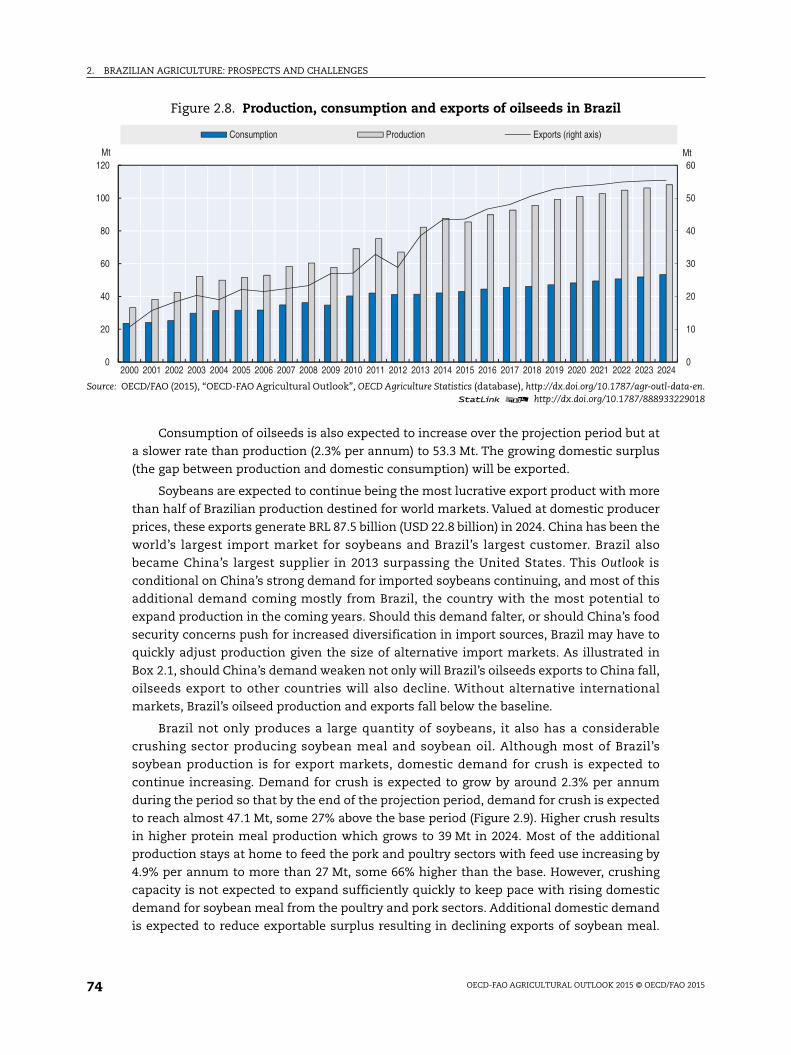
2. BRAZILIAN AGRICULTURE: PROSPECTS AND CHALLENGES
ata-en.229018
0
10
20
30
40
50
60Mt
Consumption of oilseeds is also expected to increase over the projection period but at
a slower rate than production (2.3% per annum) to 53.3 Mt. The growing domestic surplus
(the gap between production and domestic consumption) will be exported.
Soybeans are expected to continue being the most lucrative export product with more
than half of Brazilian production destined for world markets. Valued at domestic producer
prices, these exports generate BRL 87.5 billion (USD 22.8 billion) in 2024. China has been the
world’s largest import market for soybeans and Brazil’s largest customer. Brazil also
became China’s largest supplier in 2013 surpassing the United States. This Outlook is
conditional on China’s strong demand for imported soybeans continuing, and most of this
additional demand coming mostly from Brazil, the country with the most potential to
expand production in the coming years. Should this demand falter, or should China’s food
security concerns push for increased diversification in import sources, Brazil may have to
quickly adjust production given the size of alternative import markets. As illustrated in
Box 2.1, should China’s demand weaken not only will Brazil’s oilseeds exports to China fall,
oilseeds export to other countries will also decline. Without alternative international
markets, Brazil’s oilseed production and exports fall below the baseline.
Brazil not only produces a large quantity of soybeans, it also has a considerable
crushing sector producing soybean meal and soybean oil. Although most of Brazil’s
soybean production is for export markets, domestic demand for crush is expected to
continue increasing. Demand for crush is expected to grow by around 2.3% per annum
during the period so that by the end of the projection period, demand for crush is expected
to reach almost 47.1 Mt, some 27% above the base period (Figure 2.9). Higher crush results
in higher protein meal production which grows to 39 Mt in 2024. Most of the additional
production stays at home to feed the pork and poultry sectors with feed use increasing by
4.9% per annum to more than 27 Mt, some 66% higher than the base. However, crushing
capacity is not expected to expand sufficiently quickly to keep pace with rising domestic
demand for soybean meal from the poultry and pork sectors. Additional domestic demand
is expected to reduce exportable surplus resulting in declining exports of soybean meal.
Figure 2.8. Production, consumption and exports of oilseeds in Brazil
Source: OECD/FAO (2015), “OECD-FAO Agricultural Outlook”, OECD Agriculture Statistics (database), http://dx.doi.org/10.1787/agr-outl-d1 2 http://dx.doi.org/10.1787/888933
0
20
40
60
80
100
120
2000 2001 2002 2003 2004 2005 2006 2007 2008 2009 2010 2011 2012 2013 2014 2015 2016 2017 2018 2019 2020 2021 2022 2023 2024
Mt
Consumption Production Exports (right axis)
OECD-FAO AGRICULTURAL OUTLOOK 2015 © OECD/FAO 201574
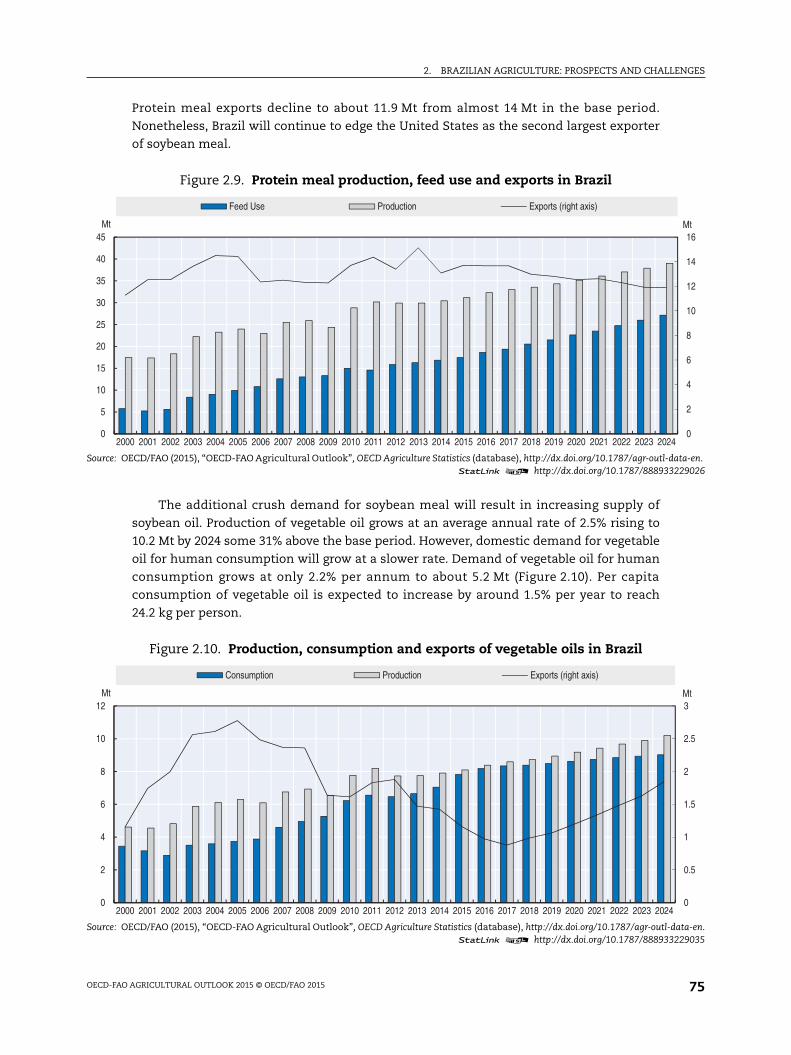
2. BRAZILIAN AGRICULTURE: PROSPECTS AND CHALLENGES
ata-en.229026
0
2
4
6
8
10
12
14
16Mt
ata-en.229035
0
0.5
1
1.5
2
2.5
3Mt
Protein meal exports decline to about 11.9 Mt from almost 14 Mt in the base period.
Nonetheless, Brazil will continue to edge the United States as the second largest exporter
of soybean meal.
The additional crush demand for soybean meal will result in increasing supply of
soybean oil. Production of vegetable oil grows at an average annual rate of 2.5% rising to
10.2 Mt by 2024 some 31% above the base period. However, domestic demand for vegetable
oil for human consumption will grow at a slower rate. Demand of vegetable oil for human
consumption grows at only 2.2% per annum to about 5.2 Mt (Figure 2.10). Per capita
consumption of vegetable oil is expected to increase by around 1.5% per year to reach
24.2 kg per person.
Figure 2.9. Protein meal production, feed use and exports in Brazil
Source: OECD/FAO (2015), “OECD-FAO Agricultural Outlook”, OECD Agriculture Statistics (database), http://dx.doi.org/10.1787/agr-outl-d1 2 http://dx.doi.org/10.1787/888933
0
5
10
15
20
25
30
35
40
45
2000 2001 2002 2003 2004 2005 2006 2007 2008 2009 2010 2011 2012 2013 2014 2015 2016 2017 2018 2019 2020 2021 2022 2023 2024
Mt
Feed Use Production Exports (right axis)
Figure 2.10. Production, consumption and exports of vegetable oils in Brazil
Source: OECD/FAO (2015), “OECD-FAO Agricultural Outlook”, OECD Agriculture Statistics (database), http://dx.doi.org/10.1787/agr-outl-d1 2 http://dx.doi.org/10.1787/888933
0
2
4
6
8
10
12
2000 2001 2002 2003 2004 2005 2006 2007 2008 2009 2010 2011 2012 2013 2014 2015 2016 2017 2018 2019 2020 2021 2022 2023 2024
Mt
Consumption Production Exports (right axis)
OECD-FAO AGRICULTURAL OUTLOOK 2015 © OECD/FAO 2015 75
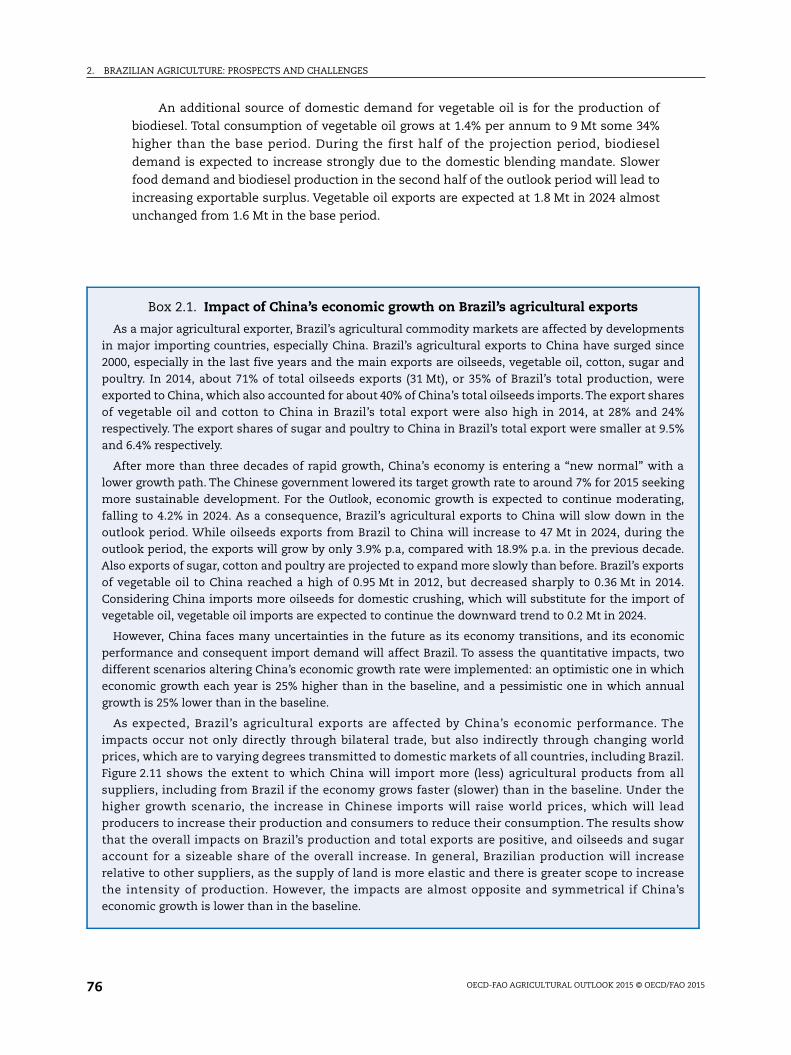
2. BRAZILIAN AGRICULTURE: PROSPECTS AND CHALLENGES
tsced
rees%%
ag
g,eee.ts4.of
icohal
eldil.lledwarsese’s
An additional source of domestic demand for vegetable oil is for the production of
biodiesel. Total consumption of vegetable oil grows at 1.4% per annum to 9 Mt some 34%
higher than the base period. During the first half of the projection period, biodiesel
demand is expected to increase strongly due to the domestic blending mandate. Slower
food demand and biodiesel production in the second half of the outlook period will lead to
increasing exportable surplus. Vegetable oil exports are expected at 1.8 Mt in 2024 almost
unchanged from 1.6 Mt in the base period.
Box 2.1. Impact of China’s economic growth on Brazil’s agricultural exports
As a major agricultural exporter, Brazil’s agricultural commodity markets are affected by developmenin major importing countries, especially China. Brazil’s agricultural exports to China have surged sin2000, especially in the last five years and the main exports are oilseeds, vegetable oil, cotton, sugar anpoultry. In 2014, about 71% of total oilseeds exports (31 Mt), or 35% of Brazil’s total production, weexported to China, which also accounted for about 40% of China’s total oilseeds imports. The export sharof vegetable oil and cotton to China in Brazil’s total export were also high in 2014, at 28% and 24respectively. The export shares of sugar and poultry to China in Brazil’s total export were smaller at 9.5and 6.4% respectively.
After more than three decades of rapid growth, China’s economy is entering a “new normal” withlower growth path. The Chinese government lowered its target growth rate to around 7% for 2015 seekinmore sustainable development. For the Outlook, economic growth is expected to continue moderatinfalling to 4.2% in 2024. As a consequence, Brazil’s agricultural exports to China will slow down in thoutlook period. While oilseeds exports from Brazil to China will increase to 47 Mt in 2024, during thoutlook period, the exports will grow by only 3.9% p.a, compared with 18.9% p.a. in the previous decadAlso exports of sugar, cotton and poultry are projected to expand more slowly than before. Brazil’s exporof vegetable oil to China reached a high of 0.95 Mt in 2012, but decreased sharply to 0.36 Mt in 201Considering China imports more oilseeds for domestic crushing, which will substitute for the importvegetable oil, vegetable oil imports are expected to continue the downward trend to 0.2 Mt in 2024.
However, China faces many uncertainties in the future as its economy transitions, and its economperformance and consequent import demand will affect Brazil. To assess the quantitative impacts, twdifferent scenarios altering China’s economic growth rate were implemented: an optimistic one in whiceconomic growth each year is 25% higher than in the baseline, and a pessimistic one in which annugrowth is 25% lower than in the baseline.
As expected, Brazil’s agricultural exports are affected by China’s economic performance. Thimpacts occur not only directly through bilateral trade, but also indirectly through changing worprices, which are to varying degrees transmitted to domestic markets of all countries, including BrazFigure 2.11 shows the extent to which China will import more (less) agricultural products from asuppliers, including from Brazil if the economy grows faster (slower) than in the baseline. Under thhigher growth scenario, the increase in Chinese imports will raise world prices, which will leaproducers to increase their production and consumers to reduce their consumption. The results shothat the overall impacts on Brazil’s production and total exports are positive, and oilseeds and sugaccount for a sizeable share of the overall increase. In general, Brazilian production will increarelative to other suppliers, as the supply of land is more elastic and there is greater scope to increathe intensity of production. However, the impacts are almost opposite and symmetrical if Chinaeconomic growth is lower than in the baseline.
OECD-FAO AGRICULTURAL OUTLOOK 2015 © OECD/FAO 201576
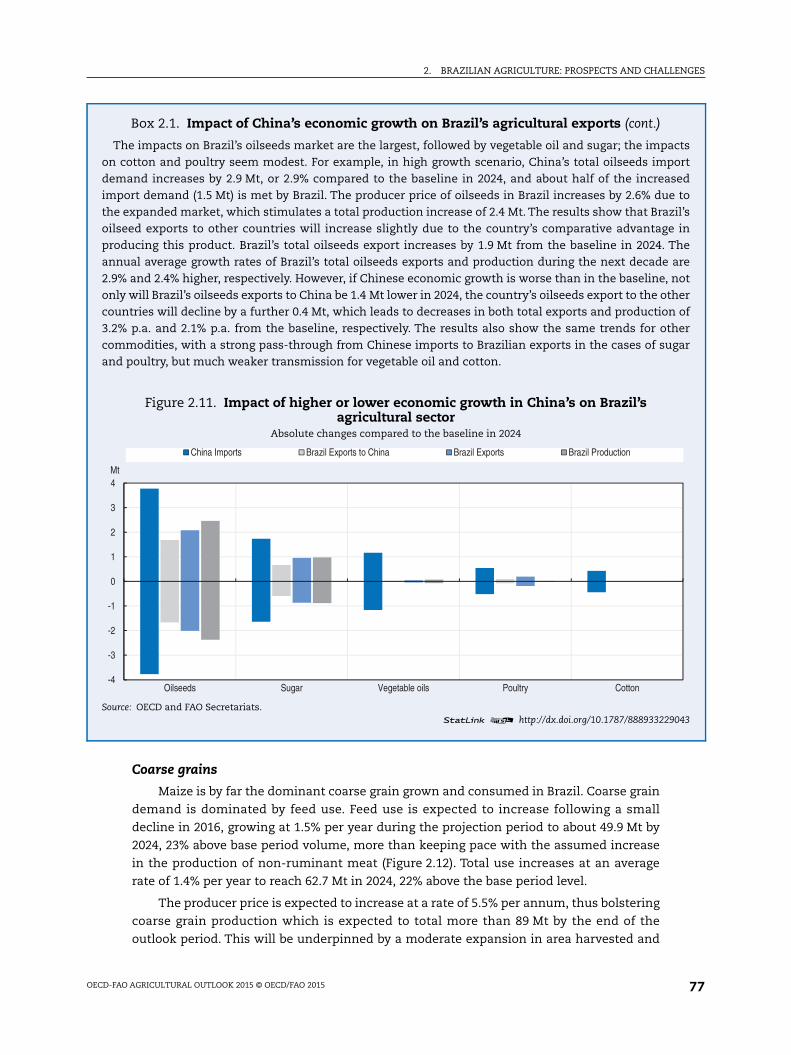
2. BRAZILIAN AGRICULTURE: PROSPECTS AND CHALLENGES
ctsortedto
il’sinhe
areoterofer
gar
043
Coarse grains
Maize is by far the dominant coarse grain grown and consumed in Brazil. Coarse grain
demand is dominated by feed use. Feed use is expected to increase following a small
decline in 2016, growing at 1.5% per year during the projection period to about 49.9 Mt by
2024, 23% above base period volume, more than keeping pace with the assumed increase
in the production of non-ruminant meat (Figure 2.12). Total use increases at an average
rate of 1.4% per year to reach 62.7 Mt in 2024, 22% above the base period level.
The producer price is expected to increase at a rate of 5.5% per annum, thus bolstering
coarse grain production which is expected to total more than 89 Mt by the end of the
outlook period. This will be underpinned by a moderate expansion in area harvested and
Box 2.1. Impact of China’s economic growth on Brazil’s agricultural exports (cont.)
The impacts on Brazil’s oilseeds market are the largest, followed by vegetable oil and sugar; the impaon cotton and poultry seem modest. For example, in high growth scenario, China’s total oilseeds impdemand increases by 2.9 Mt, or 2.9% compared to the baseline in 2024, and about half of the increasimport demand (1.5 Mt) is met by Brazil. The producer price of oilseeds in Brazil increases by 2.6% duethe expanded market, which stimulates a total production increase of 2.4 Mt. The results show that Brazoilseed exports to other countries will increase slightly due to the country’s comparative advantageproducing this product. Brazil’s total oilseeds export increases by 1.9 Mt from the baseline in 2024. Tannual average growth rates of Brazil’s total oilseeds exports and production during the next decade2.9% and 2.4% higher, respectively. However, if Chinese economic growth is worse than in the baseline, nonly will Brazil’s oilseeds exports to China be 1.4 Mt lower in 2024, the country’s oilseeds export to the othcountries will decline by a further 0.4 Mt, which leads to decreases in both total exports and production3.2% p.a. and 2.1% p.a. from the baseline, respectively. The results also show the same trends for othcommodities, with a strong pass-through from Chinese imports to Brazilian exports in the cases of suand poultry, but much weaker transmission for vegetable oil and cotton.
Figure 2.11. Impact of higher or lower economic growth in China’s on Brazil’sagricultural sector
Absolute changes compared to the baseline in 2024
Source: OECD and FAO Secretariats.1 2 http://dx.doi.org/10.1787/888933229
-4
-3
-2
-1
0
1
2
3
4
Oilseeds Sugar Vegetable oils Poultry Cotton
Mt
China Imports Brazil Exports to China Brazil Exports Brazil Production
OECD-FAO AGRICULTURAL OUTLOOK 2015 © OECD/FAO 2015 77
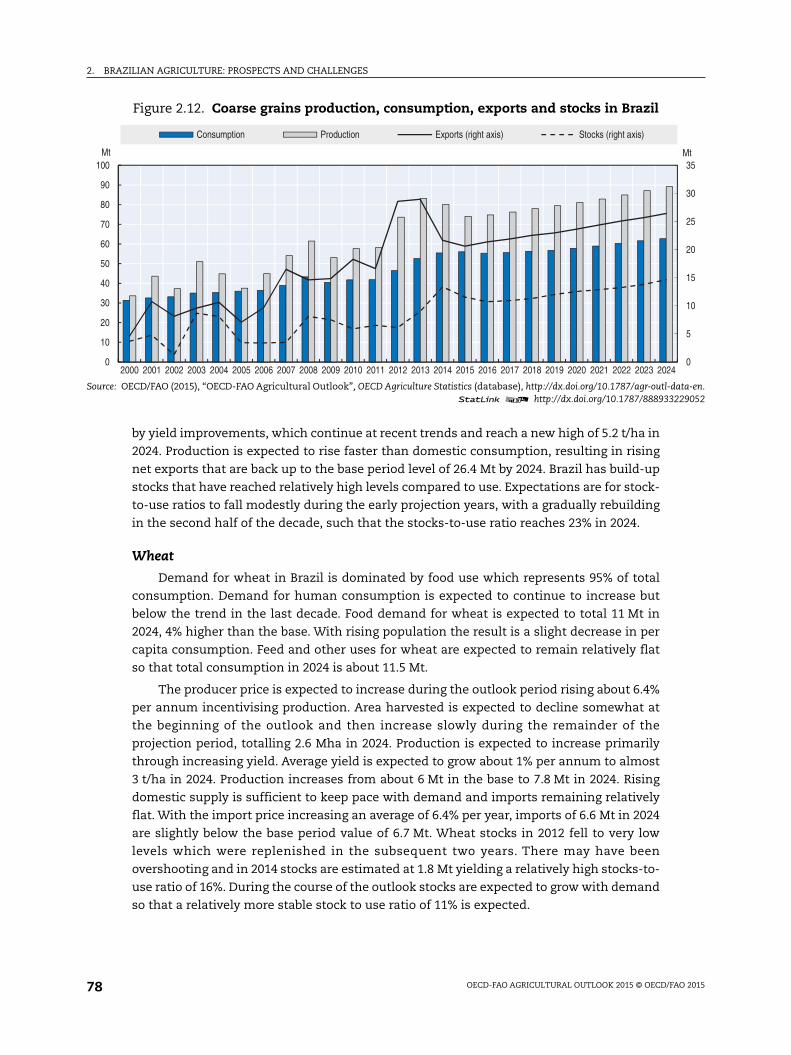
2. BRAZILIAN AGRICULTURE: PROSPECTS AND CHALLENGES
ata-en.229052
0
5
10
15
20
25
30
35Mt
by yield improvements, which continue at recent trends and reach a new high of 5.2 t/ha in
2024. Production is expected to rise faster than domestic consumption, resulting in rising
net exports that are back up to the base period level of 26.4 Mt by 2024. Brazil has build-up
stocks that have reached relatively high levels compared to use. Expectations are for stock-
to-use ratios to fall modestly during the early projection years, with a gradually rebuilding
in the second half of the decade, such that the stocks-to-use ratio reaches 23% in 2024.
Wheat
Demand for wheat in Brazil is dominated by food use which represents 95% of total
consumption. Demand for human consumption is expected to continue to increase but
below the trend in the last decade. Food demand for wheat is expected to total 11 Mt in
2024, 4% higher than the base. With rising population the result is a slight decrease in per
capita consumption. Feed and other uses for wheat are expected to remain relatively flat
so that total consumption in 2024 is about 11.5 Mt.
The producer price is expected to increase during the outlook period rising about 6.4%
per annum incentivising production. Area harvested is expected to decline somewhat at
the beginning of the outlook and then increase slowly during the remainder of the
projection period, totalling 2.6 Mha in 2024. Production is expected to increase primarily
through increasing yield. Average yield is expected to grow about 1% per annum to almost
3 t/ha in 2024. Production increases from about 6 Mt in the base to 7.8 Mt in 2024. Rising
domestic supply is sufficient to keep pace with demand and imports remaining relatively
flat. With the import price increasing an average of 6.4% per year, imports of 6.6 Mt in 2024
are slightly below the base period value of 6.7 Mt. Wheat stocks in 2012 fell to very low
levels which were replenished in the subsequent two years. There may have been
overshooting and in 2014 stocks are estimated at 1.8 Mt yielding a relatively high stocks-to-
use ratio of 16%. During the course of the outlook stocks are expected to grow with demand
so that a relatively more stable stock to use ratio of 11% is expected.
Figure 2.12. Coarse grains production, consumption, exports and stocks in Brazil
Source: OECD/FAO (2015), “OECD-FAO Agricultural Outlook”, OECD Agriculture Statistics (database), http://dx.doi.org/10.1787/agr-outl-d1 2 http://dx.doi.org/10.1787/888933
0
10
20
30
40
50
60
70
80
90
100
2000 2001 2002 2003 2004 2005 2006 2007 2008 2009 2010 2011 2012 2013 2014 2015 2016 2017 2018 2019 2020 2021 2022 2023 2024
Mt
Consumption Production Exports (right axis) Stocks (right axis)
OECD-FAO AGRICULTURAL OUTLOOK 2015 © OECD/FAO 201578
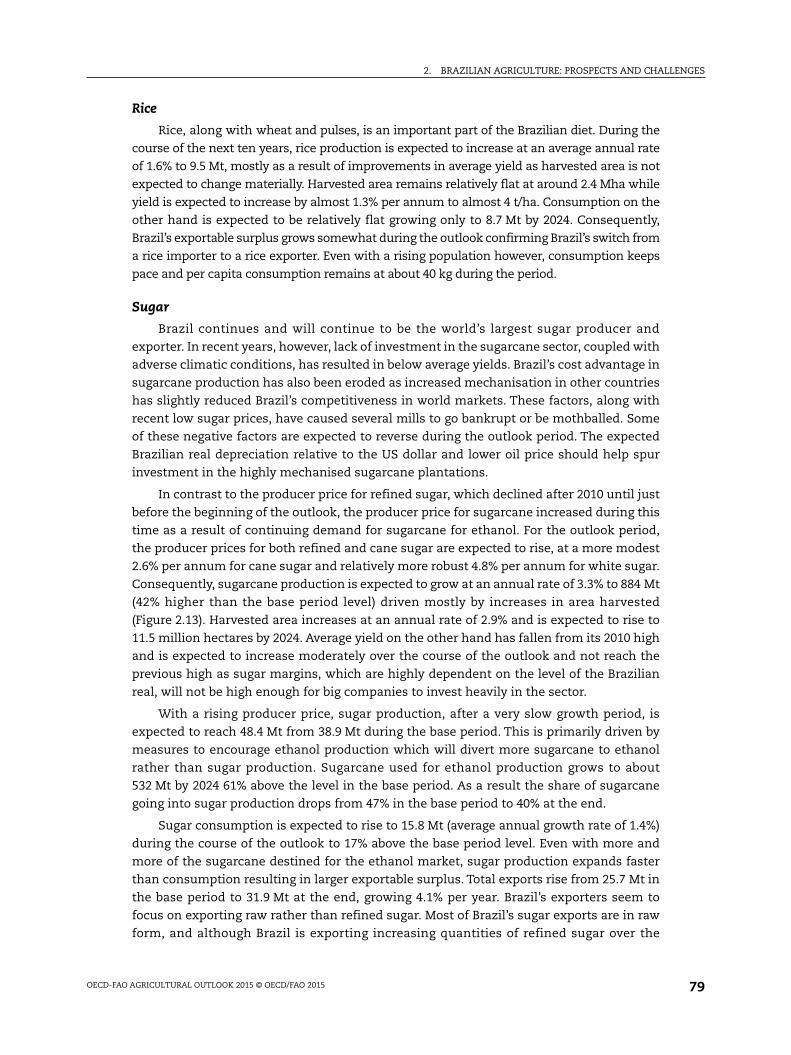
2. BRAZILIAN AGRICULTURE: PROSPECTS AND CHALLENGES
Rice
Rice, along with wheat and pulses, is an important part of the Brazilian diet. During the
course of the next ten years, rice production is expected to increase at an average annual rate
of 1.6% to 9.5 Mt, mostly as a result of improvements in average yield as harvested area is not
expected to change materially. Harvested area remains relatively flat at around 2.4 Mha while
yield is expected to increase by almost 1.3% per annum to almost 4 t/ha. Consumption on the
other hand is expected to be relatively flat growing only to 8.7 Mt by 2024. Consequently,
Brazil’s exportable surplus grows somewhat during the outlook confirming Brazil’s switch from
a rice importer to a rice exporter. Even with a rising population however, consumption keeps
pace and per capita consumption remains at about 40 kg during the period.
Sugar
Brazil continues and will continue to be the world’s largest sugar producer and
exporter. In recent years, however, lack of investment in the sugarcane sector, coupled with
adverse climatic conditions, has resulted in below average yields. Brazil’s cost advantage in
sugarcane production has also been eroded as increased mechanisation in other countries
has slightly reduced Brazil’s competitiveness in world markets. These factors, along with
recent low sugar prices, have caused several mills to go bankrupt or be mothballed. Some
of these negative factors are expected to reverse during the outlook period. The expected
Brazilian real depreciation relative to the US dollar and lower oil price should help spur
investment in the highly mechanised sugarcane plantations.
In contrast to the producer price for refined sugar, which declined after 2010 until just
before the beginning of the outlook, the producer price for sugarcane increased during this
time as a result of continuing demand for sugarcane for ethanol. For the outlook period,
the producer prices for both refined and cane sugar are expected to rise, at a more modest
2.6% per annum for cane sugar and relatively more robust 4.8% per annum for white sugar.
Consequently, sugarcane production is expected to grow at an annual rate of 3.3% to 884 Mt
(42% higher than the base period level) driven mostly by increases in area harvested
(Figure 2.13). Harvested area increases at an annual rate of 2.9% and is expected to rise to
11.5 million hectares by 2024. Average yield on the other hand has fallen from its 2010 high
and is expected to increase moderately over the course of the outlook and not reach the
previous high as sugar margins, which are highly dependent on the level of the Brazilian
real, will not be high enough for big companies to invest heavily in the sector.
With a rising producer price, sugar production, after a very slow growth period, is
expected to reach 48.4 Mt from 38.9 Mt during the base period. This is primarily driven by
measures to encourage ethanol production which will divert more sugarcane to ethanol
rather than sugar production. Sugarcane used for ethanol production grows to about
532 Mt by 2024 61% above the level in the base period. As a result the share of sugarcane
going into sugar production drops from 47% in the base period to 40% at the end.
Sugar consumption is expected to rise to 15.8 Mt (average annual growth rate of 1.4%)
during the course of the outlook to 17% above the base period level. Even with more and
more of the sugarcane destined for the ethanol market, sugar production expands faster
than consumption resulting in larger exportable surplus. Total exports rise from 25.7 Mt in
the base period to 31.9 Mt at the end, growing 4.1% per year. Brazil’s exporters seem to
focus on exporting raw rather than refined sugar. Most of Brazil’s sugar exports are in raw
form, and although Brazil is exporting increasing quantities of refined sugar over the
OECD-FAO AGRICULTURAL OUTLOOK 2015 © OECD/FAO 2015 79
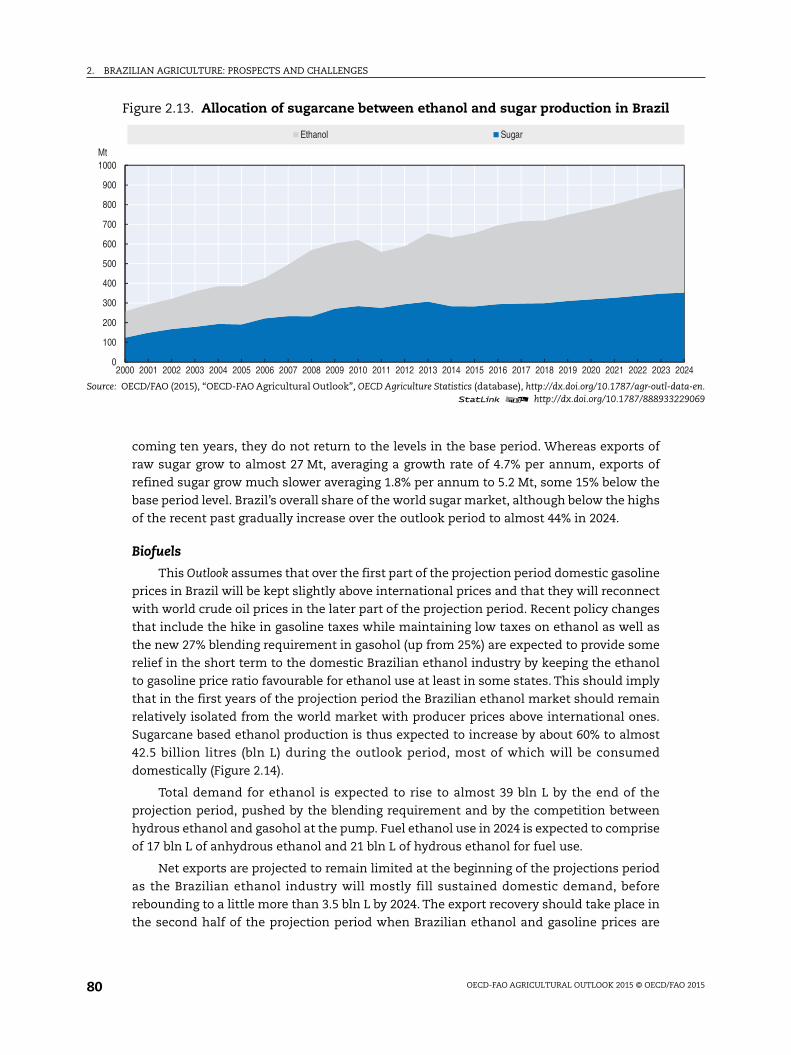
2. BRAZILIAN AGRICULTURE: PROSPECTS AND CHALLENGES
ata-en.229069
2024
coming ten years, they do not return to the levels in the base period. Whereas exports of
raw sugar grow to almost 27 Mt, averaging a growth rate of 4.7% per annum, exports of
refined sugar grow much slower averaging 1.8% per annum to 5.2 Mt, some 15% below the
base period level. Brazil’s overall share of the world sugar market, although below the highs
of the recent past gradually increase over the outlook period to almost 44% in 2024.
Biofuels
This Outlook assumes that over the first part of the projection period domestic gasoline
prices in Brazil will be kept slightly above international prices and that they will reconnect
with world crude oil prices in the later part of the projection period. Recent policy changes
that include the hike in gasoline taxes while maintaining low taxes on ethanol as well as
the new 27% blending requirement in gasohol (up from 25%) are expected to provide some
relief in the short term to the domestic Brazilian ethanol industry by keeping the ethanol
to gasoline price ratio favourable for ethanol use at least in some states. This should imply
that in the first years of the projection period the Brazilian ethanol market should remain
relatively isolated from the world market with producer prices above international ones.
Sugarcane based ethanol production is thus expected to increase by about 60% to almost
42.5 billion litres (bln L) during the outlook period, most of which will be consumed
domestically (Figure 2.14).
Total demand for ethanol is expected to rise to almost 39 bln L by the end of the
projection period, pushed by the blending requirement and by the competition between
hydrous ethanol and gasohol at the pump. Fuel ethanol use in 2024 is expected to comprise
of 17 bln L of anhydrous ethanol and 21 bln L of hydrous ethanol for fuel use.
Net exports are projected to remain limited at the beginning of the projections period
as the Brazilian ethanol industry will mostly fill sustained domestic demand, before
rebounding to a little more than 3.5 bln L by 2024. The export recovery should take place in
the second half of the projection period when Brazilian ethanol and gasoline prices are
Figure 2.13. Allocation of sugarcane between ethanol and sugar production in Brazil
Source: OECD/FAO (2015), “OECD-FAO Agricultural Outlook”, OECD Agriculture Statistics (database), http://dx.doi.org/10.1787/agr-outl-d1 2 http://dx.doi.org/10.1787/888933
0
100
200
300
400
500
600
700
800
900
1000
2000 2001 2002 2003 2004 2005 2006 2007 2008 2009 2010 2011 2012 2013 2014 2015 2016 2017 2018 2019 2020 2021 2022 2023
Mt
Ethanol Sugar
OECD-FAO AGRICULTURAL OUTLOOK 2015 © OECD/FAO 201580
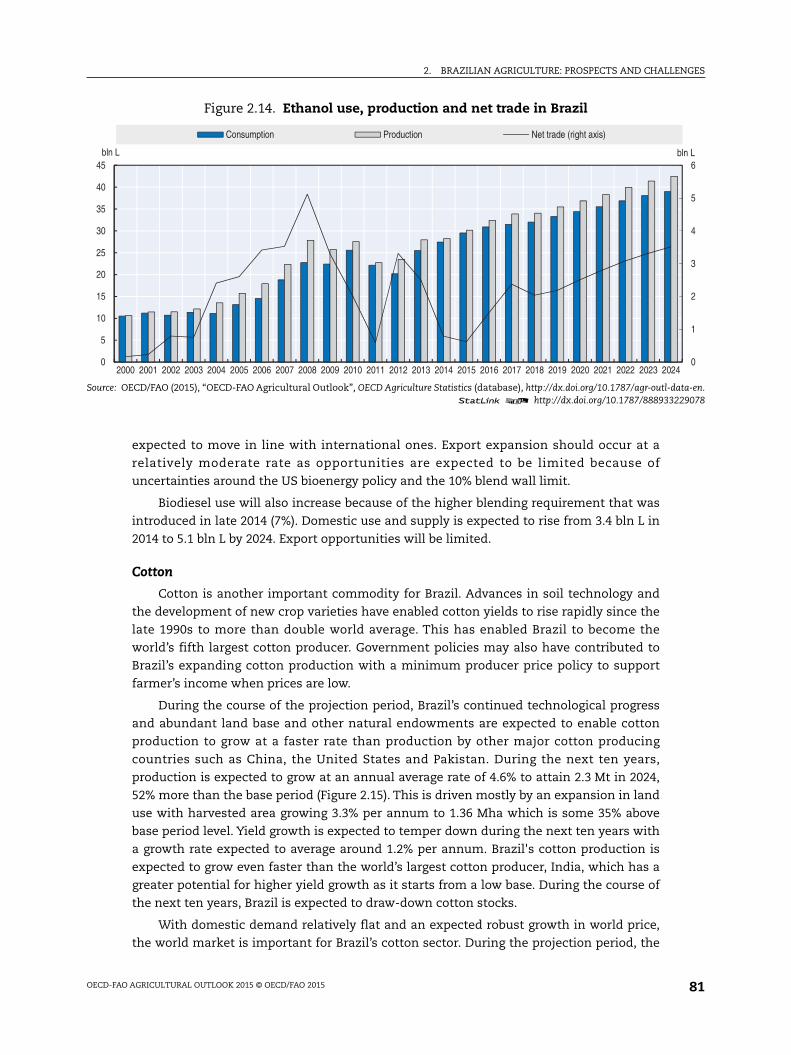
2. BRAZILIAN AGRICULTURE: PROSPECTS AND CHALLENGES
ata-en.229078
0
1
2
3
4
5
6
4
bln L
expected to move in line with international ones. Export expansion should occur at a
relatively moderate rate as opportunities are expected to be limited because of
uncertainties around the US bioenergy policy and the 10% blend wall limit.
Biodiesel use will also increase because of the higher blending requirement that was
introduced in late 2014 (7%). Domestic use and supply is expected to rise from 3.4 bln L in
2014 to 5.1 bln L by 2024. Export opportunities will be limited.
Cotton
Cotton is another important commodity for Brazil. Advances in soil technology and
the development of new crop varieties have enabled cotton yields to rise rapidly since the
late 1990s to more than double world average. This has enabled Brazil to become the
world’s fifth largest cotton producer. Government policies may also have contributed to
Brazil’s expanding cotton production with a minimum producer price policy to support
farmer’s income when prices are low.
During the course of the projection period, Brazil’s continued technological progress
and abundant land base and other natural endowments are expected to enable cotton
production to grow at a faster rate than production by other major cotton producing
countries such as China, the United States and Pakistan. During the next ten years,
production is expected to grow at an annual average rate of 4.6% to attain 2.3 Mt in 2024,
52% more than the base period (Figure 2.15). This is driven mostly by an expansion in land
use with harvested area growing 3.3% per annum to 1.36 Mha which is some 35% above
base period level. Yield growth is expected to temper down during the next ten years with
a growth rate expected to average around 1.2% per annum. Brazil's cotton production is
expected to grow even faster than the world’s largest cotton producer, India, which has a
greater potential for higher yield growth as it starts from a low base. During the course of
the next ten years, Brazil is expected to draw-down cotton stocks.
With domestic demand relatively flat and an expected robust growth in world price,
the world market is important for Brazil’s cotton sector. During the projection period, the
Figure 2.14. Ethanol use, production and net trade in Brazil
Source: OECD/FAO (2015), “OECD-FAO Agricultural Outlook”, OECD Agriculture Statistics (database), http://dx.doi.org/10.1787/agr-outl-d1 2 http://dx.doi.org/10.1787/888933
0
5
10
15
20
25
30
35
40
45
2000 2001 2002 2003 2004 2005 2006 2007 2008 2009 2010 2011 2012 2013 2014 2015 2016 2017 2018 2019 2020 2021 2022 2023 202
bln L
Consumption Production Net trade (right axis)
OECD-FAO AGRICULTURAL OUTLOOK 2015 © OECD/FAO 2015 81
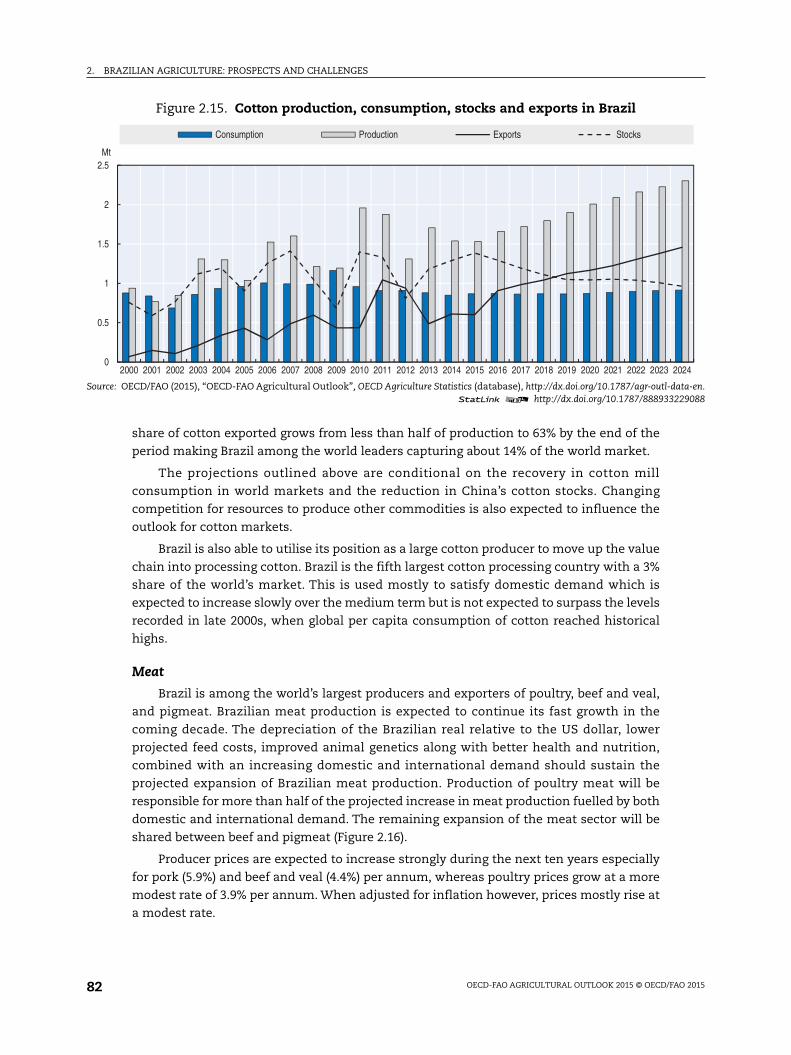
2. BRAZILIAN AGRICULTURE: PROSPECTS AND CHALLENGES
ata-en.229088
2024
share of cotton exported grows from less than half of production to 63% by the end of the
period making Brazil among the world leaders capturing about 14% of the world market.
The projections outlined above are conditional on the recovery in cotton mill
consumption in world markets and the reduction in China’s cotton stocks. Changing
competition for resources to produce other commodities is also expected to influence the
outlook for cotton markets.
Brazil is also able to utilise its position as a large cotton producer to move up the value
chain into processing cotton. Brazil is the fifth largest cotton processing country with a 3%
share of the world’s market. This is used mostly to satisfy domestic demand which is
expected to increase slowly over the medium term but is not expected to surpass the levels
recorded in late 2000s, when global per capita consumption of cotton reached historical
highs.
Meat
Brazil is among the world’s largest producers and exporters of poultry, beef and veal,
and pigmeat. Brazilian meat production is expected to continue its fast growth in the
coming decade. The depreciation of the Brazilian real relative to the US dollar, lower
projected feed costs, improved animal genetics along with better health and nutrition,
combined with an increasing domestic and international demand should sustain the
projected expansion of Brazilian meat production. Production of poultry meat will be
responsible for more than half of the projected increase in meat production fuelled by both
domestic and international demand. The remaining expansion of the meat sector will be
shared between beef and pigmeat (Figure 2.16).
Producer prices are expected to increase strongly during the next ten years especially
for pork (5.9%) and beef and veal (4.4%) per annum, whereas poultry prices grow at a more
modest rate of 3.9% per annum. When adjusted for inflation however, prices mostly rise at
a modest rate.
Figure 2.15. Cotton production, consumption, stocks and exports in Brazil
Source: OECD/FAO (2015), “OECD-FAO Agricultural Outlook”, OECD Agriculture Statistics (database), http://dx.doi.org/10.1787/agr-outl-d1 2 http://dx.doi.org/10.1787/888933
0
0.5
1
1.5
2
2.5
2000 2001 2002 2003 2004 2005 2006 2007 2008 2009 2010 2011 2012 2013 2014 2015 2016 2017 2018 2019 2020 2021 2022 2023
Mt
Consumption Production Exports Stocks
OECD-FAO AGRICULTURAL OUTLOOK 2015 © OECD/FAO 201582
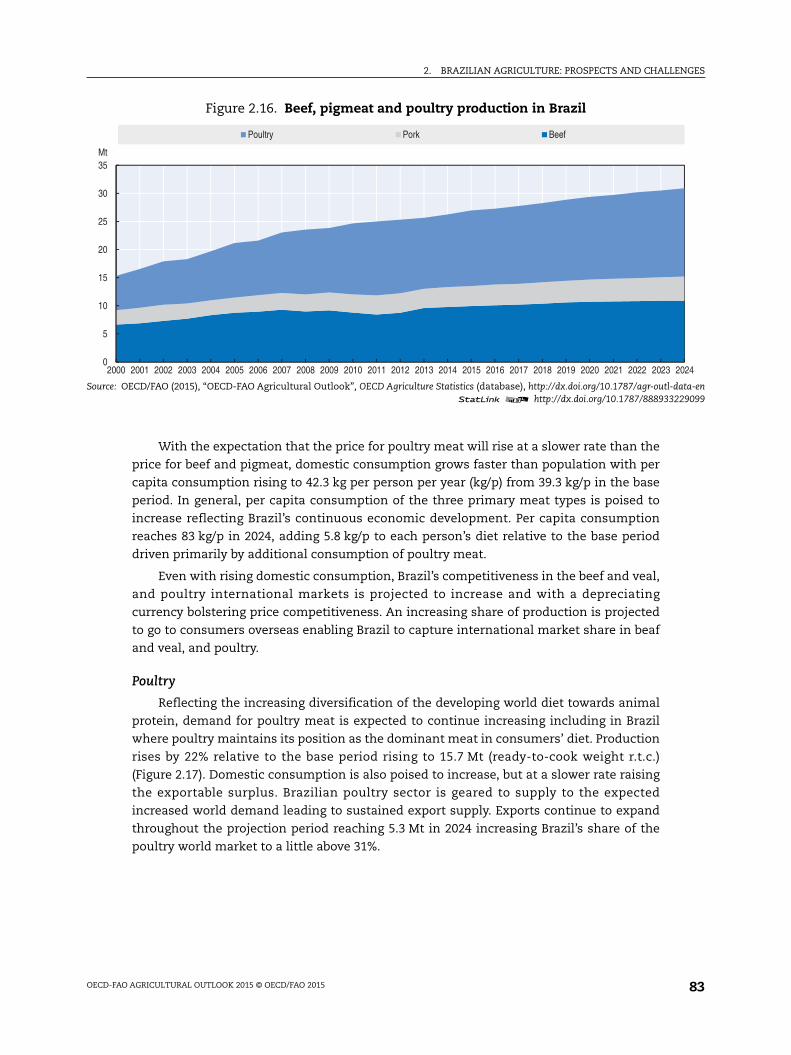
2. BRAZILIAN AGRICULTURE: PROSPECTS AND CHALLENGES
data-en229099
2024
With the expectation that the price for poultry meat will rise at a slower rate than the
price for beef and pigmeat, domestic consumption grows faster than population with per
capita consumption rising to 42.3 kg per person per year (kg/p) from 39.3 kg/p in the base
period. In general, per capita consumption of the three primary meat types is poised to
increase reflecting Brazil’s continuous economic development. Per capita consumption
reaches 83 kg/p in 2024, adding 5.8 kg/p to each person’s diet relative to the base period
driven primarily by additional consumption of poultry meat.
Even with rising domestic consumption, Brazil’s competitiveness in the beef and veal,
and poultry international markets is projected to increase and with a depreciating
currency bolstering price competitiveness. An increasing share of production is projected
to go to consumers overseas enabling Brazil to capture international market share in beaf
and veal, and poultry.
Poultry
Reflecting the increasing diversification of the developing world diet towards animal
protein, demand for poultry meat is expected to continue increasing including in Brazil
where poultry maintains its position as the dominant meat in consumers’ diet. Production
rises by 22% relative to the base period rising to 15.7 Mt (ready-to-cook weight r.t.c.)
(Figure 2.17). Domestic consumption is also poised to increase, but at a slower rate raising
the exportable surplus. Brazilian poultry sector is geared to supply to the expected
increased world demand leading to sustained export supply. Exports continue to expand
throughout the projection period reaching 5.3 Mt in 2024 increasing Brazil’s share of the
poultry world market to a little above 31%.
Figure 2.16. Beef, pigmeat and poultry production in Brazil
Source: OECD/FAO (2015), “OECD-FAO Agricultural Outlook”, OECD Agriculture Statistics (database), http://dx.doi.org/10.1787/agr-outl-1 2 http://dx.doi.org/10.1787/888933
0
5
10
15
20
25
30
35
2000 2001 2002 2003 2004 2005 2006 2007 2008 2009 2010 2011 2012 2013 2014 2015 2016 2017 2018 2019 2020 2021 2022 2023
Mt
Poultry Pork Beef
OECD-FAO AGRICULTURAL OUTLOOK 2015 © OECD/FAO 2015 83
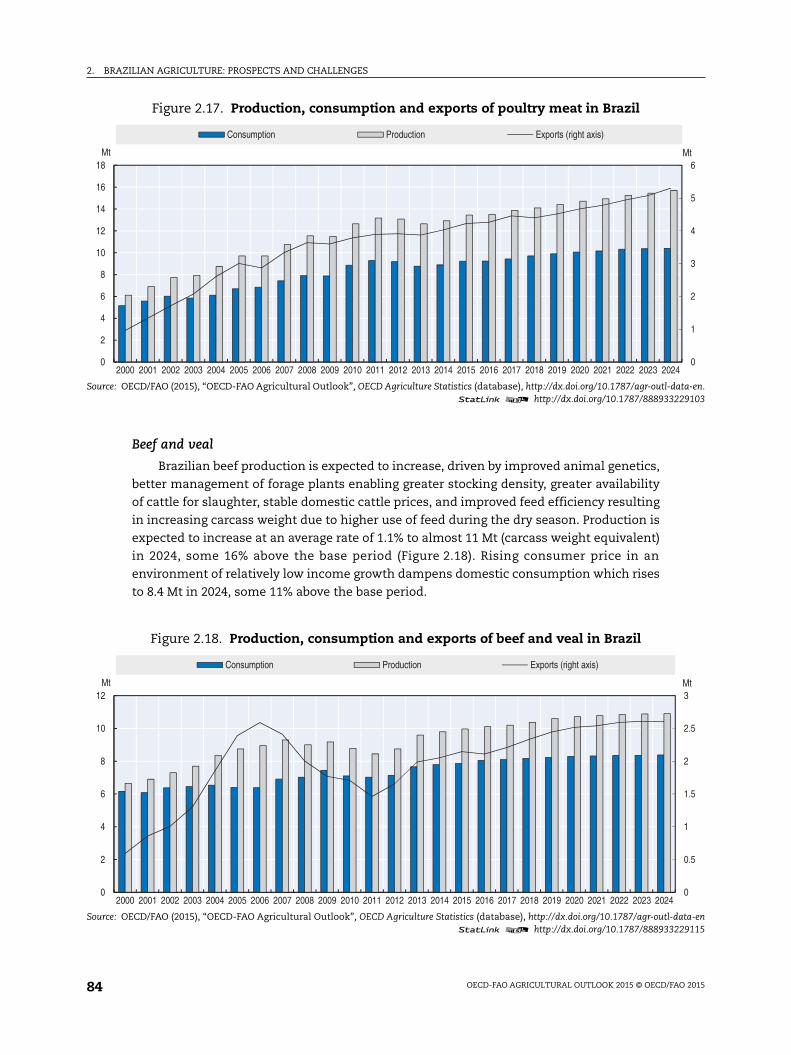
2. BRAZILIAN AGRICULTURE: PROSPECTS AND CHALLENGES
ata-en.229103
0
1
2
3
4
5
6
4
Mt
data-en229115
0
0.5
1
1.5
2
2.5
3Mt
Beef and veal
Brazilian beef production is expected to increase, driven by improved animal genetics,
better management of forage plants enabling greater stocking density, greater availability
of cattle for slaughter, stable domestic cattle prices, and improved feed efficiency resulting
in increasing carcass weight due to higher use of feed during the dry season. Production is
expected to increase at an average rate of 1.1% to almost 11 Mt (carcass weight equivalent)
in 2024, some 16% above the base period (Figure 2.18). Rising consumer price in an
environment of relatively low income growth dampens domestic consumption which rises
to 8.4 Mt in 2024, some 11% above the base period.
Figure 2.17. Production, consumption and exports of poultry meat in Brazil
Source: OECD/FAO (2015), “OECD-FAO Agricultural Outlook”, OECD Agriculture Statistics (database), http://dx.doi.org/10.1787/agr-outl-d1 2 http://dx.doi.org/10.1787/888933
0
2
4
6
8
10
12
14
16
18
2000 2001 2002 2003 2004 2005 2006 2007 2008 2009 2010 2011 2012 2013 2014 2015 2016 2017 2018 2019 2020 2021 2022 2023 202
Mt
Consumption Production Exports (right axis)
Figure 2.18. Production, consumption and exports of beef and veal in Brazil
Source: OECD/FAO (2015), “OECD-FAO Agricultural Outlook”, OECD Agriculture Statistics (database), http://dx.doi.org/10.1787/agr-outl-1 2 http://dx.doi.org/10.1787/888933
0
2
4
6
8
10
12
2000 2001 2002 2003 2004 2005 2006 2007 2008 2009 2010 2011 2012 2013 2014 2015 2016 2017 2018 2019 2020 2021 2022 2023 2024
Mt
Consumption Production Exports (right axis)
OECD-FAO AGRICULTURAL OUTLOOK 2015 © OECD/FAO 201584
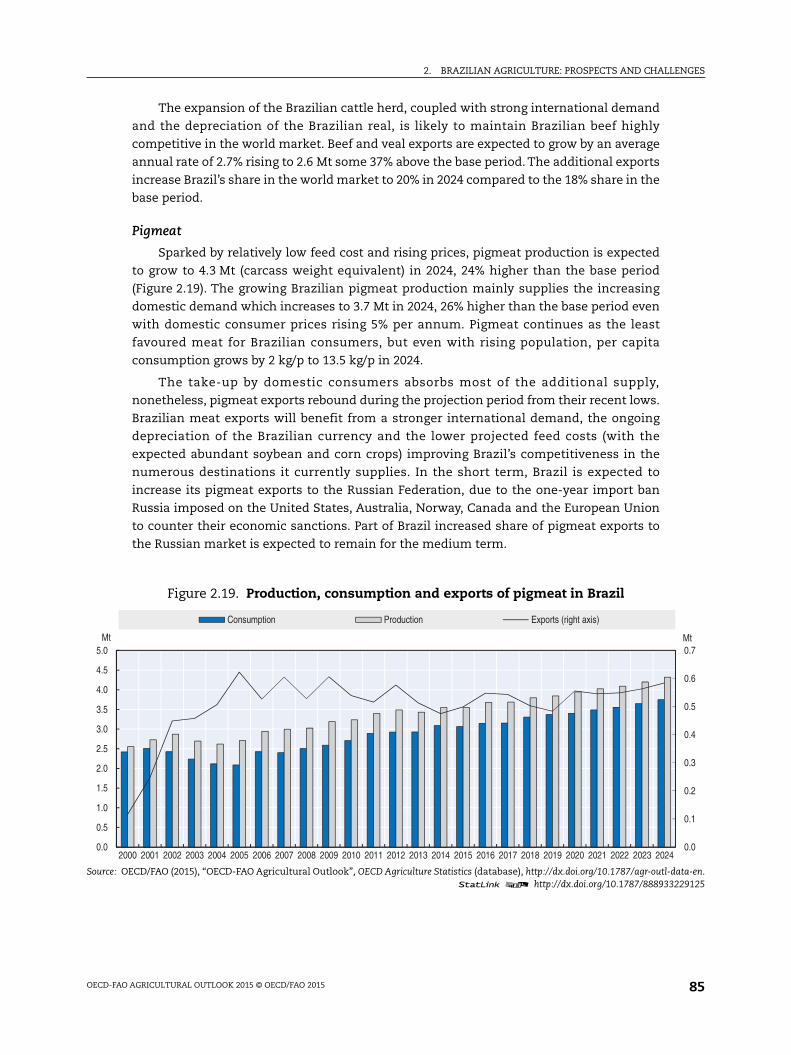
2. BRAZILIAN AGRICULTURE: PROSPECTS AND CHALLENGES
ata-en.229125
0.0
0.1
0.2
0.3
0.4
0.5
0.6
0.7Mt
The expansion of the Brazilian cattle herd, coupled with strong international demand
and the depreciation of the Brazilian real, is likely to maintain Brazilian beef highly
competitive in the world market. Beef and veal exports are expected to grow by an average
annual rate of 2.7% rising to 2.6 Mt some 37% above the base period. The additional exports
increase Brazil’s share in the world market to 20% in 2024 compared to the 18% share in the
base period.
Pigmeat
Sparked by relatively low feed cost and rising prices, pigmeat production is expected
to grow to 4.3 Mt (carcass weight equivalent) in 2024, 24% higher than the base period
(Figure 2.19). The growing Brazilian pigmeat production mainly supplies the increasing
domestic demand which increases to 3.7 Mt in 2024, 26% higher than the base period even
with domestic consumer prices rising 5% per annum. Pigmeat continues as the least
favoured meat for Brazilian consumers, but even with rising population, per capita
consumption grows by 2 kg/p to 13.5 kg/p in 2024.
The take-up by domestic consumers absorbs most of the additional supply,
nonetheless, pigmeat exports rebound during the projection period from their recent lows.
Brazilian meat exports will benefit from a stronger international demand, the ongoing
depreciation of the Brazilian currency and the lower projected feed costs (with the
expected abundant soybean and corn crops) improving Brazil’s competitiveness in the
numerous destinations it currently supplies. In the short term, Brazil is expected to
increase its pigmeat exports to the Russian Federation, due to the one-year import ban
Russia imposed on the United States, Australia, Norway, Canada and the European Union
to counter their economic sanctions. Part of Brazil increased share of pigmeat exports to
the Russian market is expected to remain for the medium term.
Figure 2.19. Production, consumption and exports of pigmeat in Brazil
Source: OECD/FAO (2015), “OECD-FAO Agricultural Outlook”, OECD Agriculture Statistics (database), http://dx.doi.org/10.1787/agr-outl-d1 2 http://dx.doi.org/10.1787/888933
0.0
0.5
1.0
1.5
2.0
2.5
3.0
3.5
4.0
4.5
5.0
2000 2001 2002 2003 2004 2005 2006 2007 2008 2009 2010 2011 2012 2013 2014 2015 2016 2017 2018 2019 2020 2021 2022 2023 2024
Mt
Consumption Production Exports (right axis)
OECD-FAO AGRICULTURAL OUTLOOK 2015 © OECD/FAO 2015 85
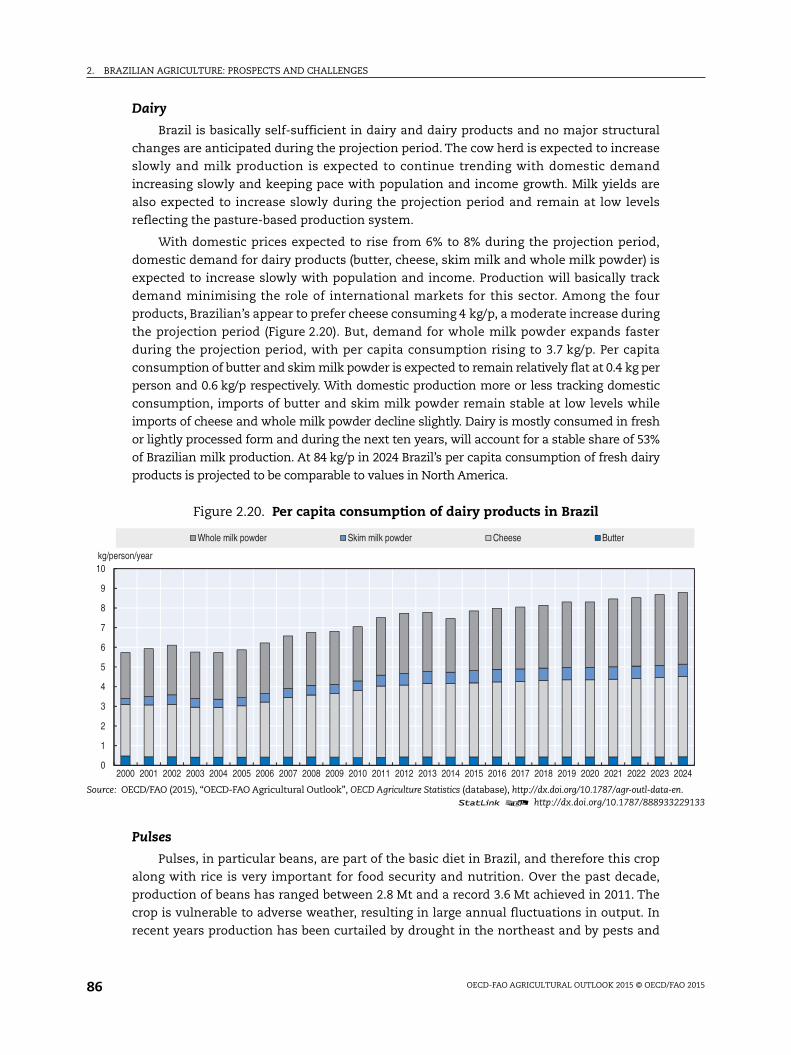
2. BRAZILIAN AGRICULTURE: PROSPECTS AND CHALLENGES
n.229133
2024
Dairy
Brazil is basically self-sufficient in dairy and dairy products and no major structural
changes are anticipated during the projection period. The cow herd is expected to increase
slowly and milk production is expected to continue trending with domestic demand
increasing slowly and keeping pace with population and income growth. Milk yields are
also expected to increase slowly during the projection period and remain at low levels
reflecting the pasture-based production system.
With domestic prices expected to rise from 6% to 8% during the projection period,
domestic demand for dairy products (butter, cheese, skim milk and whole milk powder) is
expected to increase slowly with population and income. Production will basically track
demand minimising the role of international markets for this sector. Among the four
products, Brazilian’s appear to prefer cheese consuming 4 kg/p, a moderate increase during
the projection period (Figure 2.20). But, demand for whole milk powder expands faster
during the projection period, with per capita consumption rising to 3.7 kg/p. Per capita
consumption of butter and skim milk powder is expected to remain relatively flat at 0.4 kg per
person and 0.6 kg/p respectively. With domestic production more or less tracking domestic
consumption, imports of butter and skim milk powder remain stable at low levels while
imports of cheese and whole milk powder decline slightly. Dairy is mostly consumed in fresh
or lightly processed form and during the next ten years, will account for a stable share of 53%
of Brazilian milk production. At 84 kg/p in 2024 Brazil’s per capita consumption of fresh dairy
products is projected to be comparable to values in North America.
Pulses
Pulses, in particular beans, are part of the basic diet in Brazil, and therefore this crop
along with rice is very important for food security and nutrition. Over the past decade,
production of beans has ranged between 2.8 Mt and a record 3.6 Mt achieved in 2011. The
crop is vulnerable to adverse weather, resulting in large annual fluctuations in output. In
recent years production has been curtailed by drought in the northeast and by pests and
Figure 2.20. Per capita consumption of dairy products in Brazil
Source: OECD/FAO (2015), “OECD-FAO Agricultural Outlook”, OECD Agriculture Statistics (database), http://dx.doi.org/10.1787/agr-outl-data-e1 2 http://dx.doi.org/10.1787/888933
0
1
2
3
4
5
6
7
8
9
10
2000 2001 2002 2003 2004 2005 2006 2007 2008 2009 2010 2011 2012 2013 2014 2015 2016 2017 2018 2019 2020 2021 2022 2023
kg/person/year
Whole milk powder Skim milk powder Cheese Butter
OECD-FAO AGRICULTURAL OUTLOOK 2015 © OECD/FAO 201586
2. BRAZILIAN AGRICULTURE: PROSPECTS AND CHALLENGES
disease in the centre-south. The domestic market absorbs about 3.5 Mt of beans annually.
Imports are needed to bridge the gap. In recent years they have fluctuated between 120 kt
and as much as 400 kt. In the period to 2023/24, production is expected to remain stable at
about 3.2 Mt, although short-term crop shortfalls may occur. The upward trend in yields
would be maintained thanks to the further application of existing technologies and the
ongoing improvements to infrastructure, such as irrigation, particularly in larger scale
production units. Over the next decade, domestic consumption is expected to increase to
about 3.6 Mt, suggesting that imports will persist at current levels
Coffee
Brazil is the world’s largest coffee producer and exporter, accounting for about one
third of global production and exports. Production has been growing steadily over the
years, driven by gains in yields. The area harvested actually declined since the early 2000s
due to climate shocks (e.g frost and drought) as well as damage caused by pests and
diseases. Total coffee production and consumption in Brazil has increased over the last
decade by 3.7% and 2.7% respectively. Although output in 2014/15 is expected to decline
due to the severe drought that hit the main producing areas, domestic consumption is
foreseen to remain stable at the levels of the previous year.
Total coffee exports for 2014/15 also contracted, as a result of the production setback.
About 90% of Brazilian coffee exports are in the form of green beans, with shipments of
instant coffee accounting for most of the remainder. Brazil’s Integrated Processed Coffee
Export Program (PSI) aims to position Brazilian coffee further up the value chain by
boosting the share of processed coffee products.
Brazilian exports are mainly shipped to the United States market followed by
Germany, Japan and Italy. As a result of steady growth in domestic consumption, Brazil is
now the world’s second largest market after the United States. Demand for quality coffee
has expanded driven by shifts in consumer preferences as well as development in the retail
market, in particular increased presence of international coffee shops.
In the next decade, coffee production is expected to reach 61 million 60 kg bags in
2023/24, up 25% from 2013/14. This growth reflects continued increases in yields sustained
by further investment and better crop management. Moreover, there is considerable scope
for production expansion among smallholders.
Coffee exports are foreseen to rise by 25% to 40 million 60 kg bags thereby
consolidating Brazil as the main producer and exporter world-wide. Although the
projected growth is slower than in the past decade, several factors could have an impact on
export levels. In particular, rapid growth in domestic consumption could curtail export
supplies. The expanding domestic market has dampened exports somewhat with
projected export levels as a share of production falling to 65% compared to 68% currently.
Another factor is that the increasing emphasis on export of processed coffee products
could encounter less favourable prospects due to existing tariff escalation in several
markets. However, the fact that Brazil offers a wide range of coffees (instant, roasted beans,
roasted ground, special, organic, etc.) gives it a competitive edge over many other
producing and exporting countries.
OECD-FAO AGRICULTURAL OUTLOOK 2015 © OECD/FAO 2015 87
2. BRAZILIAN AGRICULTURE: PROSPECTS AND CHALLENGES
Oranges and orange juice
Brazil is the world’s largest exporter of processed citrus, in particular frozen
concentrated orange juice (FCOJ). Production of oranges is destined mostly to processing
for export. The domestic market for processed fruit is relatively small, with domestic
consumption being mostly in fresh form. Production of oranges in Brazil has remained
stable during the past decade following rapid growth in previous periods. More recently,
farmers in some regions have abandoned their orchards due to continuing losses in the
fresh fruit market.
Production of oranges is expected to increase in the coming decade, although at a
slower pace. By 2023/24 total output could reach 17.5 Mt, about 7% above the 2013/14 level.
Continued increases in productivity would more than offset further reductions in areas
that would drop by about 13% during the decade.The domestic market is expected to continue
to absorb only relatively small volumes of fresh fruit. The share of production destined to
processing increases in the period to 2023/24, and exports of orange juice rise to 2.6 Mt.
Fruits
Brazil is one of the world’s largest producers of fruit. Its output is largely absorbed by
the domestic market. Among the major fruits produced are bananas, apples, grapes,
melons and tropical fruits, particularly mango, avocado, pineapple and papaya. The exact
areas of cultivation and volumes of production are difficult to ascertain because a large
share of output takes place on small farms for self-consumption or sale at local markets.
Over the past decade, increasing emphasis has been given to the production of organics
and targeted technical assistance and support measures are being extended to family farm
units engaged in this type of cultivation.
For all major fruit varieties, both expansion of areas and improvements in yields have
contributed to higher output levels. In terms of total volumes, the most important fruit is
pineapple. Over the past decade, production ranged between 2.2 Mt and 2.7 Mt, with the
average output of recent years amounting to about 2.5 Mt. Production may expand to 2.9 Mt
over the next decade, largely in line with rising domestic demand. The domestic market
absorbs the near totality of production, and exports have dwindled to virtually nil. Apples
also represent a very large volume crop, with production ranging around 1.25Mt.
Production of apples has experienced a strong upward trend over the past decade,
reflecting mainly rapidly increasing yields. Export volumes have fluctuated from year-to-
year, but on average amounted to less than 10% of production. The domestic market has
been growing rapidly and absorbs the bulk of output. By 2023/24, apple production is
projected to reach more than 1.6 Mt as a result of greater planted areas and further
increases in yields.
Continued strong growth to 2023/24 is also projected for grape production. The crop is
largely irrigated and makes use of advanced cultivation and harvesting technologies. Since
2005 production has increased steadily to more than 1.4 Mt. Over the next decade, with
expanded areas and higher yields the crop could reach 1.65 Mt. Production is mostly
destined to the domestic market.
Over the past decade, melon and cantaloupe production has also expanded because of
both greater plantings and higher yields. Among fruits varieties, melons are more
dependent on world markets with around a third of production exported. However, this
share has fallen over the past decade owing to rising domestic demand.
OECD-FAO AGRICULTURAL OUTLOOK 2015 © OECD/FAO 201588
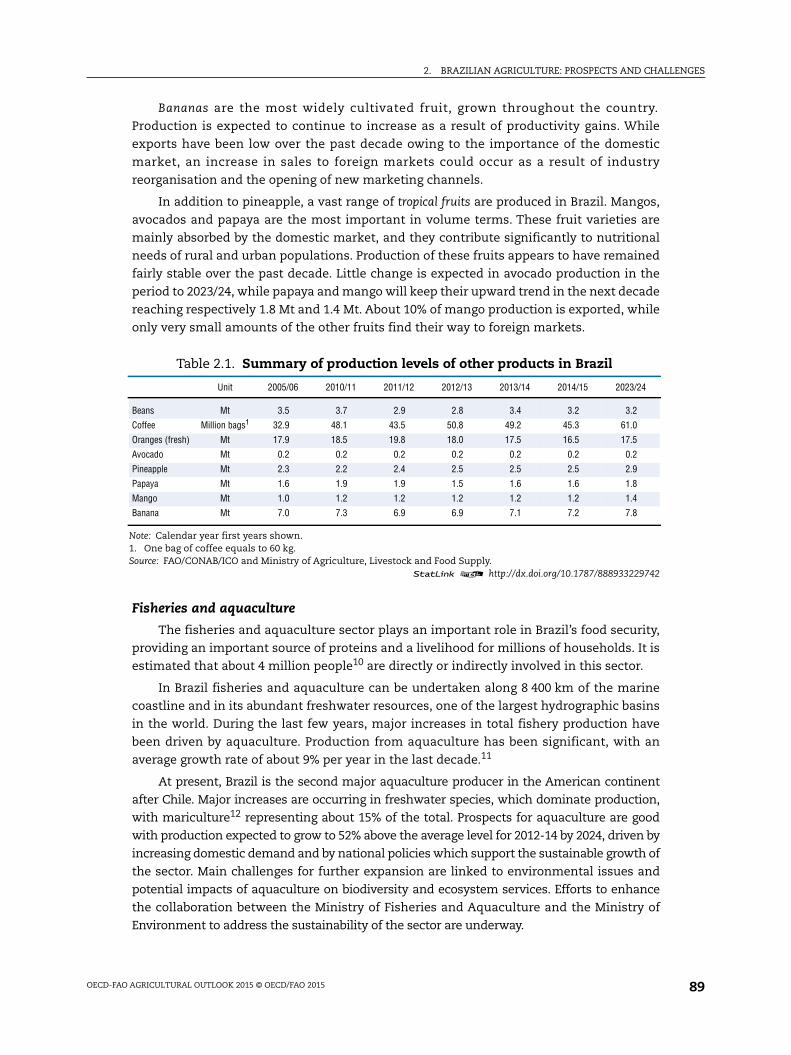
2. BRAZILIAN AGRICULTURE: PROSPECTS AND CHALLENGES
Bananas are the most widely cultivated fruit, grown throughout the country.
Production is expected to continue to increase as a result of productivity gains. While
exports have been low over the past decade owing to the importance of the domestic
market, an increase in sales to foreign markets could occur as a result of industry
reorganisation and the opening of new marketing channels.
In addition to pineapple, a vast range of tropical fruits are produced in Brazil. Mangos,
avocados and papaya are the most important in volume terms. These fruit varieties are
mainly absorbed by the domestic market, and they contribute significantly to nutritional
needs of rural and urban populations. Production of these fruits appears to have remained
fairly stable over the past decade. Little change is expected in avocado production in the
period to 2023/24, while papaya and mango will keep their upward trend in the next decade
reaching respectively 1.8 Mt and 1.4 Mt. About 10% of mango production is exported, while
only very small amounts of the other fruits find their way to foreign markets.
Fisheries and aquaculture
The fisheries and aquaculture sector plays an important role in Brazil’s food security,
providing an important source of proteins and a livelihood for millions of households. It is
estimated that about 4 million people10 are directly or indirectly involved in this sector.
In Brazil fisheries and aquaculture can be undertaken along 8 400 km of the marine
coastline and in its abundant freshwater resources, one of the largest hydrographic basins
in the world. During the last few years, major increases in total fishery production have
been driven by aquaculture. Production from aquaculture has been significant, with an
average growth rate of about 9% per year in the last decade.11
At present, Brazil is the second major aquaculture producer in the American continent
after Chile. Major increases are occurring in freshwater species, which dominate production,
with mariculture12 representing about 15% of the total. Prospects for aquaculture are good
with production expected to grow to 52% above the average level for 2012-14 by 2024, driven by
increasing domestic demand and by national policies which support the sustainable growth of
the sector. Main challenges for further expansion are linked to environmental issues and
potential impacts of aquaculture on biodiversity and ecosystem services. Efforts to enhance
the collaboration between the Ministry of Fisheries and Aquaculture and the Ministry of
Environment to address the sustainability of the sector are underway.
Table 2.1. Summary of production levels of other products in Brazil
Unit 2005/06 2010/11 2011/12 2012/13 2013/14 2014/15 2023/24
Beans Mt 3.5 3.7 2.9 2.8 3.4 3.2 3.2
Coffee Million bags1 32.9 48.1 43.5 50.8 49.2 45.3 61.0
Oranges (fresh) Mt 17.9 18.5 19.8 18.0 17.5 16.5 17.5
Avocado Mt 0.2 0.2 0.2 0.2 0.2 0.2 0.2
Pineapple Mt 2.3 2.2 2.4 2.5 2.5 2.5 2.9
Papaya Mt 1.6 1.9 1.9 1.5 1.6 1.6 1.8
Mango Mt 1.0 1.2 1.2 1.2 1.2 1.2 1.4
Banana Mt 7.0 7.3 6.9 6.9 7.1 7.2 7.8
Note: Calendar year first years shown.1. One bag of coffee equals to 60 kg.Source: FAO/CONAB/ICO and Ministry of Agriculture, Livestock and Food Supply.
1 2 http://dx.doi.org/10.1787/888933229742
OECD-FAO AGRICULTURAL OUTLOOK 2015 © OECD/FAO 2015 89
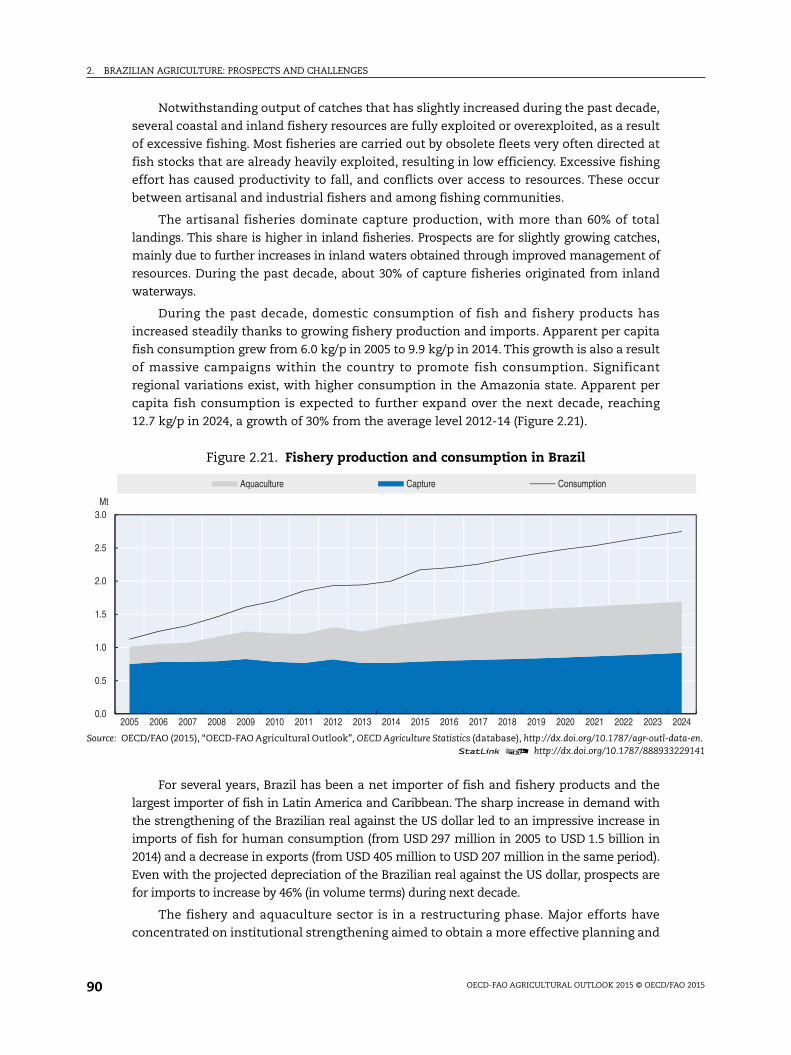
2. BRAZILIAN AGRICULTURE: PROSPECTS AND CHALLENGES
ata-en.229141
2024
Notwithstanding output of catches that has slightly increased during the past decade,
several coastal and inland fishery resources are fully exploited or overexploited, as a result
of excessive fishing. Most fisheries are carried out by obsolete fleets very often directed at
fish stocks that are already heavily exploited, resulting in low efficiency. Excessive fishing
effort has caused productivity to fall, and conflicts over access to resources. These occur
between artisanal and industrial fishers and among fishing communities.
The artisanal fisheries dominate capture production, with more than 60% of total
landings. This share is higher in inland fisheries. Prospects are for slightly growing catches,
mainly due to further increases in inland waters obtained through improved management of
resources. During the past decade, about 30% of capture fisheries originated from inland
waterways.
During the past decade, domestic consumption of fish and fishery products has
increased steadily thanks to growing fishery production and imports. Apparent per capita
fish consumption grew from 6.0 kg/p in 2005 to 9.9 kg/p in 2014. This growth is also a result
of massive campaigns within the country to promote fish consumption. Significant
regional variations exist, with higher consumption in the Amazonia state. Apparent per
capita fish consumption is expected to further expand over the next decade, reaching
12.7 kg/p in 2024, a growth of 30% from the average level 2012-14 (Figure 2.21).
For several years, Brazil has been a net importer of fish and fishery products and the
largest importer of fish in Latin America and Caribbean. The sharp increase in demand with
the strengthening of the Brazilian real against the US dollar led to an impressive increase in
imports of fish for human consumption (from USD 297 million in 2005 to USD 1.5 billion in
2014) and a decrease in exports (from USD 405 million to USD 207 million in the same period).
Even with the projected depreciation of the Brazilian real against the US dollar, prospects are
for imports to increase by 46% (in volume terms) during next decade.
The fishery and aquaculture sector is in a restructuring phase. Major efforts have
concentrated on institutional strengthening aimed to obtain a more effective planning and
Figure 2.21. Fishery production and consumption in Brazil
Source: OECD/FAO (2015), “OECD-FAO Agricultural Outlook”, OECD Agriculture Statistics (database), http://dx.doi.org/10.1787/agr-outl-d1 2 http://dx.doi.org/10.1787/888933
0.0
0.5
1.0
1.5
2.0
2.5
3.0
2005 2006 2007 2008 2009 2010 2011 2012 2013 2014 2015 2016 2017 2018 2019 2020 2021 2022 2023
Mt
Aquaculture Capture Consumption
OECD-FAO AGRICULTURAL OUTLOOK 2015 © OECD/FAO 201590
2. BRAZILIAN AGRICULTURE: PROSPECTS AND CHALLENGES
management of fisheries. Current government policies towards the sector are based,
among other things, on the following criteria: sustainability, social inclusion, adequate
structuring of production chains, strengthening the domestic market, territorial
approaches for management and development programmes, increased competitiveness,
and consolidation of state policies.
Government policies are also looking to improve post-harvest activities, with the aim
of reducing losses due to improper handling and storage of fish. These wastes occur in
particular in artisanal fisheries, but also in industrial fisheries. The Ministry of Fisheries
and Aquaculture estimates that adoption of measures to reduce these losses could
increase income from fishing by 40%. Furthermore, the legal framework is also seeking to
stimulate private sector involvement in all aspects of fish production, processing and
marketing. It encourages the establishment and operation of fish processing industries
and of industries that provide basic inputs for the fisheries sector.
The effects of government policies on Brazilian agricultural marketsThe government of Brazil pursues three broad kinds of policies towards the
agricultural sector: an economic one of supporting continued growth of the sector, and the
associated generation of income; a social one related to the livelihoods of poorer households
and their costs of food purchases; and an environmental one related to the conservation of
natural resources and biodiversity. This section looks at specific policies in these three areas,
with a view to identifying some strategic priorities for the coming decade.
Macroeconomic and structural policies
Since the elimination of import substitution policies in the late 1980s, an important
determinant of the performance of Brazil’s agriculture has been the broader context in
which the sector operates. Determining factors include the macroeconomic context,
governance and the quality of public institutions, the regulatory environment, finance and
tax policy, investment policy, labour market policies, the development of hard and soft
infrastructure, and education and human capital.
In terms of the overall macroeconomic context, Brazil has achieved much improved
stability since the mid-1990s, but real interest rates remain high (reflecting the so-called
“Brazil cost”), with financing at market interest rates accounting for more than 30% of crop
costs for those crop farmers obliged to borrow at commercial rates. By international
standards, Brazil provides relatively high rates of protection, with an average applied tariff
of around 10%. This raises the cost of imports including inputs used for agriculture. As a
result, Brazil has a low participation in global value chains, while the import content for all
Brazilian exports is estimated to reach only 10%, and 7% for exports of primary agricultural
commodities and food products. In addition to protection at the border, Brazil uses local
content provisions in publicly-financed projects; this condition is also imposed by the National
Bank for Economic and Social Development (BNDES) on loans for capital goods, including by
the agro-food and agro-processing sectors. Imported capital goods are not financed under the
National Rural Credit System, except if there is no similar product made domestically, while
those products are subject to a minimum of 60% local content provision.
On the other hand, Brazil has a relatively open FDI regime, and in mid-2012 was the
world’s sixth largest recipient of FDI. However, FDI is restricted in several sectors, including
acquisition of rural land by foreign legal or physical persons reflecting concerns regarding
OECD-FAO AGRICULTURAL OUTLOOK 2015 © OECD/FAO 2015 91
2. BRAZILIAN AGRICULTURE: PROSPECTS AND CHALLENGES
potential “land grabbing” following the global food price hikes of 2007 and 2008. The agro-
processing sector faces much fewer restrictions. Foreign investment, for example, has
contributed to the development of fertiliser production in Brazil; FDI has also been very
important in the sugar and ethanol sectors, driving their technological development.
Financial markets in Brazil are largely bank based. Free market borrowing costs are high,
for a variety of reasons including a high Central Bank refinancing rate, compulsory bank
reserves that are high by international standards, and a high level of taxation of the banking
sector. This increases the cost of capital and creates a bias toward short-term high-risk
investment instead of long-term investment. Some farmers and agribusinesses benefit from
the existence of directed credit BNDES at rates higher than the ones under the National Rural
Credit System, mainly the long-term interest rate fixed by the government (TJLP) plus
administrative fees.
Over the last two decades, Brazil’s tax and contribution systems increased public revenues
from 24% to 34% of GDP, a share which is comparable to that of many developed economies but
is high relative to most Latin American and other BRIICS economies (e.g. 17% in China, 18% in
India, 12% in Indonesia and 27% in South Africa). Brazil’s taxes are also difficult to comply with,
in particular the indirect taxes, including the state VAT (Imposto sobre Circulação de Mercadorias e
Serviços, ICMS), for which each of Brazil’s states has its own tax code, tax base and tax rates.
Agriculture and agro-processing sectors are exempt from the ICMS tax on raw material
and semi-processed products destined for export, which effectively applies to the bulk of
Brazilian agricultural exports. This preference, since its introduction in mid-1990s, has
been one of the factors contributing to the expansion of agricultural exports. ICMS
preferences are also granted on sales of agricultural inputs. Thus, various reductions in the
ICMS taxable base apply to inter-state trade in agricultural inputs. Federal legislation also
empowers states to adopt similar preferences for transactions within states. Other
preferences concern social security contributions. Exports, including agro-food exports,
are free from PIS/COFINS taxes; PIS/COFINS rates are also set at zero on imported
agricultural inputs, and the payment of these taxes is suspended on some domestically
produced primary agricultural products supplied for processing. Agricultural producers
also have the right to write off losses incurred in the previous year from taxable income,
and companies engaged in agricultural activity may depreciate the integrity of the value of
acquired capital goods in the same fiscal year (OECD, 2005; World Bank and PwC, 2013a).
Numerous studies cite weaknesses in transport and other physical infrastructures as
a critical structural impediment to the Brazil’s economic and social development. Road and
railway density in Brazil is less than half of the average for the rest of BRIICS, and far below
that of the key OECD economies (although such a comparison is limited given the
differences in the countries’ geographic conditions and development levels). During the
2013 soybean harvest, lorries queued for 25 kilometres to get to the port in Santos. The
weakness of Brazilian infrastructure is recognised by the government, which since the
mid-1990s has undertaken important institutional and regulatory reforms in the
infrastructure sectors, and from the mid-2000s introduced various federal and state
programmes. Governments at the federal and state levels have also introduced various tax
and credit incentives to increase private investment in infrastructure.
The overall national policy on infrastructure development has important implications
for the agro-food system. Several projects implemented by the Ministry of Transport and
the Secretariat of Sea Ports are not specific to agriculture but have high potential to
OECD-FAO AGRICULTURAL OUTLOOK 2015 © OECD/FAO 201592
2. BRAZILIAN AGRICULTURE: PROSPECTS AND CHALLENGES
improve the capacity and the time involved in the handling and transport of agricultural
commodities. Other activities include the development of electronic systems to facilitate
the control of shipments in ports and other border points, and financial support for private
and public storage. The agro-system should gain significantly from these policies and
investments, which will increase capacity and reduce the time involved in the handling
and transport of agricultural commodities, and significantly improve cost competitiveness.
The nation’s education improvement became a national policy in the 1980s, although
Brazil continues to lag in education both in terms of education attainment levels and
student performance. Brazil’s performance was close to the average for Latin American
countries in the OECD’s PISA tests for 2012 but 2.5 years of schooling below the average for
OECD countries. Agricultural education has seen a strong rise in university enrolments and
in the disciplines offered driven by the agricultural boom in Brazil, but the performance of
rural schoolchildren still lags that of their urban counterparts. In 2014, the 2014-24 national
education plan (Plano Nacional de Educação, PNE) was approved, stipulating than no less than
7% of GDP will be allocated to education in 2019 and no less than 10% in 2024. It also
prioritises reducing inequality and promotes education access.
Agricultural support policies
The main agricultural policy instruments are price support, concessional credit and
insurance support, although specifically targeted policies are also in place to raise incomes and
food security in vulnerable family farms. The specifics of these programmes are described in
Box 2.2. They are complemented by regulations on land use, the specification of which
agricultural zones are suitable for given crops (and therefore more likely to receive official
credit), as well as regulations on biofuel use and organic production. Brazil also directs
substantial public funds into land reform to empower the poor to generate better incomes.
These funds provide disadvantaged groups with access to agricultural land, financial resources,
and the knowledge and skills necessary to undertake farming and other economic activities.
The OECD’s annual measurement of support to agriculture attaches a monetary value to
the different forms in which support can be provided to the agricultural sector. Support is
classified according to its tendency to distort production of trade, but it also gives an indication
of how policies priorities vary across the sector. One element is support to farmers, which can
be provided by supporting prices above world market levels or by making direct budgetary
payments. This support is captured by the Producer Support Estimate (PSE). A second element
is budgetary support to agriculture in the form of “general services”, for example for research
and development, advisory systems, and food inspection. These are captured by the General
Services Support Estimate (GSSE). Moreover, in some countries governments also transfer
taxpayers’ money to (often poorer) consumers through food subsidies. Together, the producer
support, general services support and taxpayer transfers to poorer consumers represent the
OECD’s Total Support Estimate (TSE).
Brazil provides a much lower rate of support to farmers than the OECD average, or than
most of the emerging economies covered by the OECD’s annual Monitoring and Evaluation
(Figure 2.22). In 2012-14, the share of farmers’ gross receipts coming from support (%PSE)
averaged 4% in Brazil. This compares with rates of and 3% in Chile and 12% in Mexico, two
Latin America OECD countries. It is considerably lower than the average of 19% in the European
Union and 19% in China, its two major markets. It is also lower than the 8% average in the
United States, its main competitor for several products. The OECD average is 18%. Although
Brazil’s PSE is relatively low, most support is provided through distorting instruments,
OECD-FAO AGRICULTURAL OUTLOOK 2015 © OECD/FAO 2015 93
2. BRAZILIAN AGRICULTURE: PROSPECTS AND CHALLENGES
ofetsses
edPA)smns,ortGF)iosofm
sess,
nsodge
ereFor) ineren),
thral,emCRral,F-
ersoth
sostheowat
erss.
13.ionialof
ing
Box 2.2. Agricultural price, credit and insurance programmes in Brazil
Market price support aims to reduce price volatility, protect farmers’ incomes, improve the availabilityfood supplies and offset the additional costs of producers in regions that are distant from the main markand ports. There are also specific programmes that target small-scale agriculture, with some purchabeing distributed via food programmes.
Minimum guaranteed prices are reviewed annually, covering thirty-three crops. They are announcregionally through the PGPM (Política de Garantia de Preços Mínimos) by the Secretary of Agricultural Policy (Soperated by the National Food Supply Agency (Companhia Nacional de Abastecimento, CONAB). This mechanicovers a great variety of crops from rice, wheat, maize, cotton, soybeans, to regional crops like cassava, beaaçaí, guaraná, sisal, and a few livestock products like cow and goat milk, and honey. Other price suppmechanisms for commercial agriculture are the direct government purchases (Aquisição do Governo Federal, Aand the provision financing of storage by the FEPM (Financiamento para Estocagem de Produtos Agropecuárintegrantes da Política de Garantia de Preços Mínimos) former Empréstimo do Governo Federal-EGF. The MinistryAgrarian Development (MDA) supports the development of family farming, and makes use of the minimuprices policy. Instruments that support prices and target small-scale agriculture are government purchasimilar to AGF (Programa de Aquisição de Alimentos, PAA) and the minimum prices programme for family farm(Programa de Garantia de Preços para a Agricultura Familiar, PGPAF). Under PAA, CONAB makes direct acquisitiofrom family farms at market prices, with the product either going into stock or distributed as part of a foprogramme. The PGPAF ensures that small-scale farmers receive a guaranteed price based on the averaregional production cost of family farms.
In 2014, under the minimum prices policy, for the commercial sector BRL 5.6 billion (USD 2.5 billion) wspent on price support, government purchases of agricultural products and maintenance of public stocks.family agriculture the PAA programme (government purchases) allocated BRL 1.2 million (USD 516 million2014. In 2013, deficiency payments through the Premio Equalizador Pago ao Produtor (PEPRO) programme wgiven to mostly maize farmers (USD 211 million). For 2014, PEPRO was available for wheat (USD 35 milliocotton (USD 105 million) and maize (USD 110 million).
Agricultural credit is the main producer support instrument for the sector and it is provided to bocommercial and small-scale family farms. The National Rural Credit System (Sistema Nacional do Credito RuSNCR) directs credit to farmers at preferential interest rates. For commercial agriculture the SNCR systprovides credit for marketing, working capital and investment. Some investment credit allocations under SNare funded by BNDES and managed by MAPA like Programa ABC, Moderagro, Moderinfra, Moderfrota, PSI ruProdecoop, Pronamp, Procap-Agro, Inovagro and PCA. Credit for family farms falls under the auspices of PRONACredit of MDA and provides only working capital and investment loans. Support is also provided to producthrough debt rescheduling. Major debt rescheduling occurred during the late 1990s and early 2000s for bcommercial and family producers. Debt rescheduling contributed 10% of the PSE in Brazil in 2012-14.
Sources of funding for concessional credit come from “compulsory” resources (Exigibilidade dos RecurObrigatórios) where banks are obliged to either hold 34% of their sight deposits as obligatory reserves atCentral Bank at zero interest rate or to allocate the same proportion in loans to agricultural activities at belmarket interest rates. It is also mandatory that banks allocate 72% of their savings deposits to rural creditmarket interest rates, although for part of these the interest rate may be preferential if the government covthe difference. In addition, “constitutional” funds are available for the North, Northeast and Midwest region
Concessional credit provided to farmers continued to increase in 2014, growing by 13% compared to 20Credit allocated to agriculture reached BRL 177 billion (USD 76 billion) in 2014, of which 13% (BRL 24 billor USD 10 billion) was allocated to family agriculture. The remaining 87% was allocated to commercagriculture. In recent years, rural credit investment programmes have been strengthened with the aimexpanding grain storage capacity, promoting technological innovation in rural properties and extendthe use of agricultural machineries.
OECD-FAO AGRICULTURAL OUTLOOK 2015 © OECD/FAO 201594
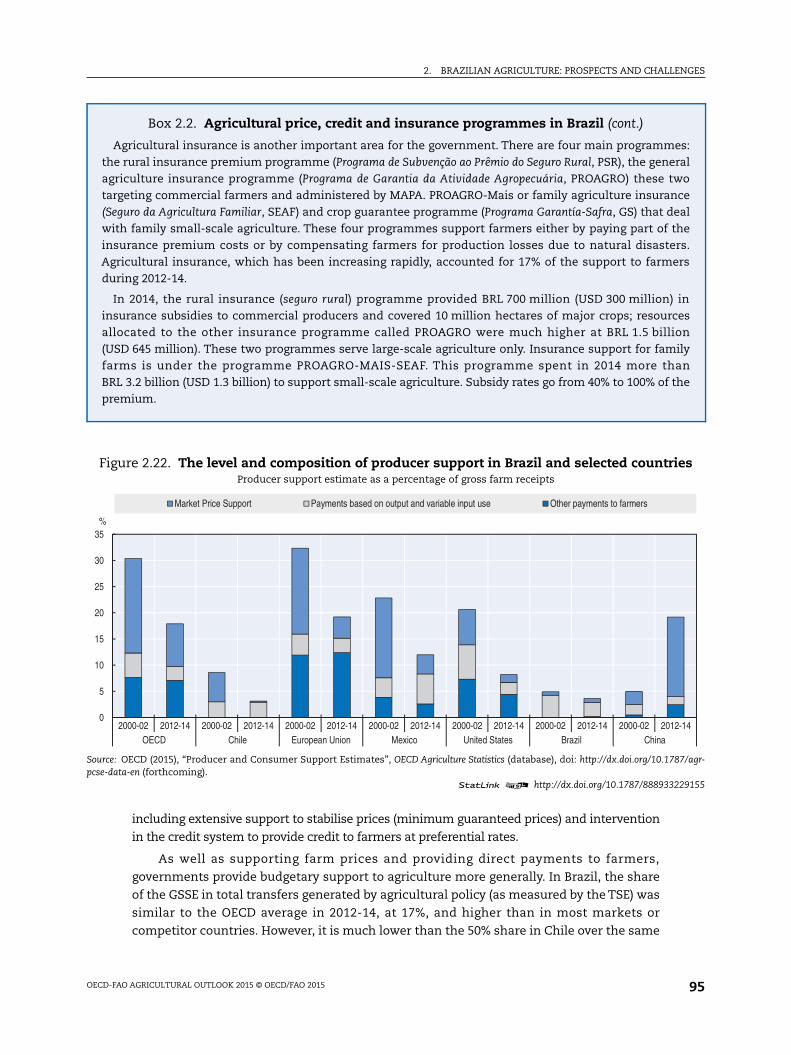
2. BRAZILIAN AGRICULTURE: PROSPECTS AND CHALLENGES
es:ralwoce
ealthers.
ers
incesonilyan
the
ies
87/agr-
229155
2-14
including extensive support to stabilise prices (minimum guaranteed prices) and intervention
in the credit system to provide credit to farmers at preferential rates.
As well as supporting farm prices and providing direct payments to farmers,
governments provide budgetary support to agriculture more generally. In Brazil, the share
of the GSSE in total transfers generated by agricultural policy (as measured by the TSE) was
similar to the OECD average in 2012-14, at 17%, and higher than in most markets or
competitor countries. However, it is much lower than the 50% share in Chile over the same
Box 2.2. Agricultural price, credit and insurance programmes in Brazil (cont.)
Agricultural insurance is another important area for the government. There are four main programmthe rural insurance premium programme (Programa de Subvenção ao Prêmio do Seguro Rural, PSR), the geneagriculture insurance programme (Programa de Garantia da Atividade Agropecuária, PROAGRO) these ttargeting commercial farmers and administered by MAPA. PROAGRO-Mais or family agriculture insuran(Seguro da Agricultura Familiar, SEAF) and crop guarantee programme (Programa Garantía-Safra, GS) that dwith family small-scale agriculture. These four programmes support farmers either by paying part ofinsurance premium costs or by compensating farmers for production losses due to natural disasteAgricultural insurance, which has been increasing rapidly, accounted for 17% of the support to farmduring 2012-14.
In 2014, the rural insurance (seguro rural) programme provided BRL 700 million (USD 300 million)insurance subsidies to commercial producers and covered 10 million hectares of major crops; resourallocated to the other insurance programme called PROAGRO were much higher at BRL 1.5 billi(USD 645 million). These two programmes serve large-scale agriculture only. Insurance support for famfarms is under the programme PROAGRO-MAIS-SEAF. This programme spent in 2014 more thBRL 3.2 billion (USD 1.3 billion) to support small-scale agriculture. Subsidy rates go from 40% to 100% ofpremium.
Figure 2.22. The level and composition of producer support in Brazil and selected countrProducer support estimate as a percentage of gross farm receipts
Source: OECD (2015), “Producer and Consumer Support Estimates”, OECD Agriculture Statistics (database), doi: http://dx.doi.org/10.17pcse-data-en (forthcoming).
1 2 http://dx.doi.org/10.1787/888933
0
5
10
15
20
25
30
35
2000-02 2012-14 2000-02 2012-14 2000-02 2012-14 2000-02 2012-14 2000-02 2012-14 2000-02 2012-14 2000-02 201OECD Chile European Union Mexico United States Brazil China
%
Market Price Support Payments based on output and variable input use Other payments to farmers
OECD-FAO AGRICULTURAL OUTLOOK 2015 © OECD/FAO 2015 95
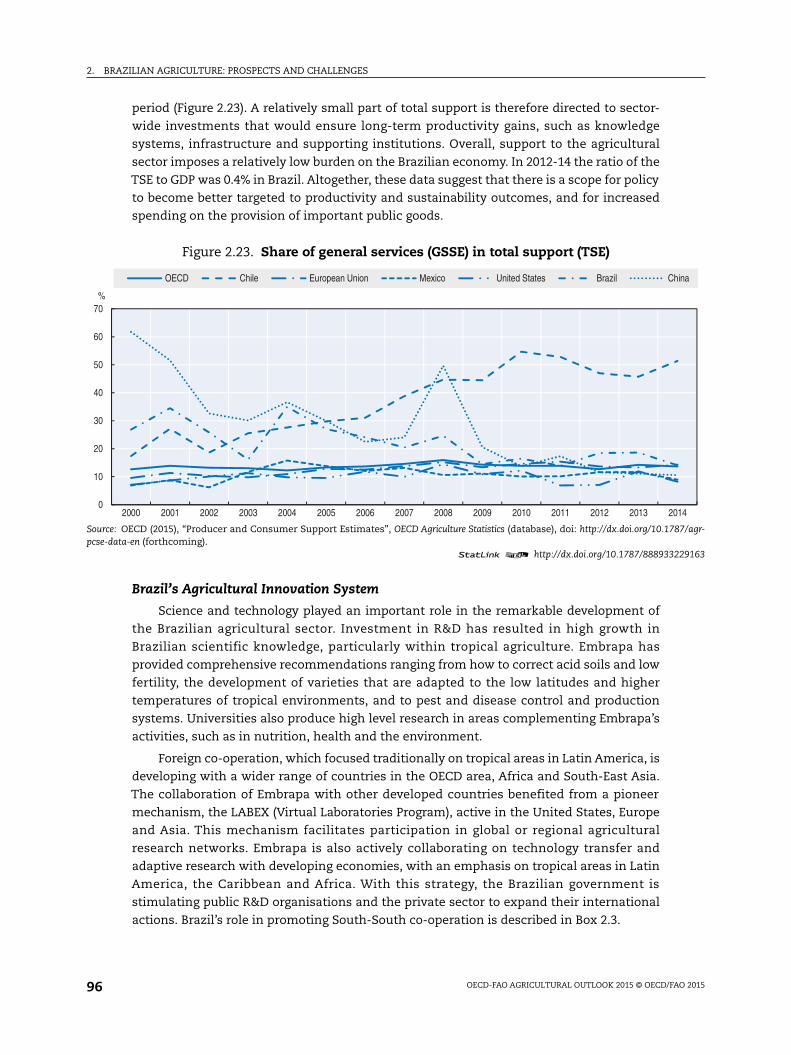
2. BRAZILIAN AGRICULTURE: PROSPECTS AND CHALLENGES
87/agr-
229163
014
hina
period (Figure 2.23). A relatively small part of total support is therefore directed to sector-
wide investments that would ensure long-term productivity gains, such as knowledge
systems, infrastructure and supporting institutions. Overall, support to the agricultural
sector imposes a relatively low burden on the Brazilian economy. In 2012-14 the ratio of the
TSE to GDP was 0.4% in Brazil. Altogether, these data suggest that there is a scope for policy
to become better targeted to productivity and sustainability outcomes, and for increased
spending on the provision of important public goods.
Brazil’s Agricultural Innovation System
Science and technology played an important role in the remarkable development of
the Brazilian agricultural sector. Investment in R&D has resulted in high growth in
Brazilian scientific knowledge, particularly within tropical agriculture. Embrapa has
provided comprehensive recommendations ranging from how to correct acid soils and low
fertility, the development of varieties that are adapted to the low latitudes and higher
temperatures of tropical environments, and to pest and disease control and production
systems. Universities also produce high level research in areas complementing Embrapa’s
activities, such as in nutrition, health and the environment.
Foreign co-operation, which focused traditionally on tropical areas in Latin America, is
developing with a wider range of countries in the OECD area, Africa and South-East Asia.
The collaboration of Embrapa with other developed countries benefited from a pioneer
mechanism, the LABEX (Virtual Laboratories Program), active in the United States, Europe
and Asia. This mechanism facilitates participation in global or regional agricultural
research networks. Embrapa is also actively collaborating on technology transfer and
adaptive research with developing economies, with an emphasis on tropical areas in Latin
America, the Caribbean and Africa. With this strategy, the Brazilian government is
stimulating public R&D organisations and the private sector to expand their international
actions. Brazil’s role in promoting South-South co-operation is described in Box 2.3.
Figure 2.23. Share of general services (GSSE) in total support (TSE)
Source: OECD (2015), “Producer and Consumer Support Estimates”, OECD Agriculture Statistics (database), doi: http://dx.doi.org/10.17pcse-data-en (forthcoming).
1 2 http://dx.doi.org/10.1787/888933
0
10
20
30
40
50
60
70
2000 2001 2002 2003 2004 2005 2006 2007 2008 2009 2010 2011 2012 2013 2
%
OECD Chile European Union Mexico United States Brazil C
OECD-FAO AGRICULTURAL OUTLOOK 2015 © OECD/FAO 201596
2. BRAZILIAN AGRICULTURE: PROSPECTS AND CHALLENGES
ahentn-
aa
re),
als,
alcalkorth
ryed
henkis
rty
llysod,
so,inticC’stal14.ng
onin
ndorhelic
Box 2.3. Brazil’s role in promoting South-South co-operation
Brazil is a strong promoter of South-South co-operation. Over the past decade, there has beensubstantial increase in the Brazilian resources allocated to technical co-operation. As a result, tcountry has gradually switched from a position of recipient to a position of provider of developmeassistance. The technical co-operation provided by Brazil is characterised as being demand-driven, noconditional and observant of equality among development partners.
Agriculture tops the list of priority fields of Brazilian technical co-operation. Embrapa, consideredsource of cutting-edge expertise on tropical agriculture, research, technology and training, has seensurge in demand for Brazilian technical co-operation support. Between 2003 and 2012, agricultuaccounted for nearly 20 per cent of total initiatives, followed by projects in the sectors of health (15%education (11%), public security (11%) and environment (6%). Other areas accounting for individushares of less than 5% included social development, energy, science and technology, communicationand many more.
The Ministry of External Relations (MRE) has shaped the focus and geographical location of technicco-operation initiatives which are coordinated by its Brazilian Co-operation Agency (ABC). Africontinues to be the top destination, accounting for about 55 per cent of total allocations, with the buof these for Portuguese-speaking countries. During 2013-15 technical co-operation projects, at designimplementation stage, amounted to USD 36 million and benefitted 42 countries of Africa, wiagriculture accounting for 19% of the regional total.
More recently technical co-operation has become increasingly diversified in terms of countcoverage, co-operation modalities and thematic focus. During 2013-15, projects also benefitt31 countries of Latin America and the Caribbean and 21 of Asia, Oceania and the Near East.
The broadening of Brazil’s technical co-operation in agriculture is illustrated by its participation in tAfrica-Brazil-Latin America and Caribbean Agricultural Innovation Market Place that aims to liexperts and institutions to develop co-operative research projects for development. Its primary focuson smallholder farmers, increasing food production and contributing to reducing hunger and pove(www.mktplace.org).
With accumulating expertise and increasing size of operations, Brazilian co-operation is graduamoving from small-scale ad hoc projects to larger projects with longer time horizons, addressing alsustainability and capacity building needs. Cotton Four was the first structural project of this kinlaunched in 2009, with Embrapa as the implementing agency, in partnership with Benin, Burkina FaChad and Mali. Its aim was to promote sustainable development of the region’s cotton value chathrough the transfer of Brazilian tropical farming technology, in particular improvement of the genebase of cotton plants, integrated pest management and introduction of the no-till farming system. ABbudget for the first phase of the project was USD 5.2 million. A second phase of this horizonpartnership, Cotton 4 + 1, between Brazil and the four countries of West Africa plus Togo began in 20Other longer term projects involving Embrapa technical support include the development of rice farmiin Senegal and several inter-related initiatives to strengthen the agricultural sector of Mozambique.
The rise in Brazil’s technical co-operation has been accompanied by increased trilateral co-operatiarrangements with other donor countries and UN agencies. In Mozambique, Embrapa is engagedthree large projects i) Platform with the United States aimed at training for technological innovation adevelopment of agriculture; ii) Food Security with the United States to strengthen family and/subsistence horticulture; and iii) ProSavannah with Japan to adapt Brazil’s successful experience in tCerrado for agricultural development of the Mozambican Savannahs in the Nacala Corridor. Both puband private contributions are supporting parts of this very large and long term project.
OECD-FAO AGRICULTURAL OUTLOOK 2015 © OECD/FAO 2015 97
2. BRAZILIAN AGRICULTURE: PROSPECTS AND CHALLENGES
ofhetoenin
rmnd
forndianger
e.ikend,
The role of the private sector in the Brazilian Agricultural Innovation System (AIS) has
grown significantly over the last two decades due to the boom in agribusiness, especially in
the Cerrado region of central Brazil. Its role is primarily oriented to the supply of inputs and
technical assistance to farmers, but agricultural research is growing (seeds, equipment,
machines, feed, agrochemicals, etc.).
It is important to foster and support private investment in agricultural R&D by
adapting regulatory and policy impediments for investment in innovation and simplifying
programmes that finance private innovation. The capacity of businesses to participate in
local innovation projects could be strengthened, for example by supporting networking
and actions to raise awareness and facilitate exchanges of staff and trainees with public
research organisations. Different agencies such as BNDES (Brazilian Development Bank)
and FINEP (Funding Agency for Projects and Programs) have specific programmes to boost
private-public partnerships. A new programme launched in March 2015 invites external
agents to open R&D laboratories in Brazil (www.innovateinbrasil.com.br/).
The Ministry of Agriculture, Livestock and Food Supply (MAPA) is responsible for the
coordination of agricultural research at the federal level through Embrapa. The Ministry of
Agrarian Development (MDA) leads rural technical assistance and extension services
which focus on family agriculture. At the national level, the priorities for R&D are
established by the national government through the different ministries involved in
innovation, led by the Ministry of Science, Technology and Innovation (MCTI) which also
has a strong role in providing resources for agricultural research, especially at the
university R&D level. Agricultural research is thus integrated into the national innovation
system, as reflected in the National Strategy for the Development of Science, Technology
and Innovation 2012-15, and follows clear mechanisms at both the federal and state levels.
Stakeholders are represented in councils and boards that discuss sectoral demands and
priorities. Embrapa applies regular performance and impact evaluations, internally or with
outside experts, and the results are made available to the public. Estimates of the social
benefits of research have been published yearly for over ten years.
Box 2.3. Brazil’s role in promoting South-South co-operation (cont.)
Aside from technology and training, another area of technical co-operation draws on the transferBrazil’s experience in the field of policies for agricultural and rural development. Beginning in 2010 with tBrazil-Africa Dialogue, the idea of providing support to partner countries to adapt Brazil’s policiespromote agricultural development has attracted interest. Thus, the Brazilian Programme to StrengthFamily Farming provided inspiration for the More Food International Programme which offers exchangepublic policies expertise and credit facilities to improve productivity through the purchase of famachinery and equipment. Participating countries include Ghana, Kenya, Mozambique, Senegal aZimbabwe.
A food acquisition programme, similar to that implemented in Brazil, called Purchase from AfricansAfrica (PAA Africa) aims to address food security through public procurement from small farmers adonations to vulnerable families, school feeding programmes, and building of stocks. The Brazilgovernment has committed USD 2.4 million to support the project in Ethiopia, Malawi, Mozambique, Niand Senegal. FAO and WFP are assisting in the implementation of this trilateral co-operation programmWith the support of FAO, the Brazilian experience in developing innovative policies and programmes lthe “Fome Zero” is being shared with a great number of countries in Latin America and the Caribbean, aprogressively, in Africa.
OECD-FAO AGRICULTURAL OUTLOOK 2015 © OECD/FAO 201598
2. BRAZILIAN AGRICULTURE: PROSPECTS AND CHALLENGES
In order to overcome the constraints to poorer farmers not linked to a supply chain or
credit market, the Politica Nacional de Assistencia Tecnica e Extensao Rural (PNATER)
called for targeted technical assistance services for family farms. During 2003-09 some BRL
1.5 billion were allocated to assist 2.5 million farm families. The National Agency for
Technical Assistance and Rural Extension (ANATER) was created in 2013 by the Federal
government to expand the resources and scope of public extension services to poorer
farmers and to address sustainability issues. While ANATER is being structured, the
Brazilian Government is supporting family farming with the National Program for the
Strengthening of Family Farming (PRONAF), the Plano Safra 2014-15 and the National Policy
for Organic Farming and Agroecology launched in 2013 with the support of the MDA.
Policies to improve the environmental sustainability of agriculture
Agricultural policy has increasingly focused on sustainable agricultural development.
Agricultural zoning represents an important instrument linking agricultural support to
environmental sustainability of farming activity. Respect of zoning rules is used as a
condition of producers’ eligibility for concessional credit and subsidised insurance
programmes. Brazil has voluntarily committed to reduce its greenhouse gas emissions by
between 36.1% and 38.9% in the period to 2020. To this end, the government launched in
2010 a key credit programme named Plano ABC, Low Carbon Agriculture, which promotes
the recovery of pasture areas that have suffered soil degradation and puts into place a
system of integrated production of crop, livestock and forestry. Since its inception until
early 2015, some 32 000 contracts have been approved with the release of credit amounting
to about USD 10 billion.
A range of specific programmes promote sustainable agricultural practices. Such
programmes are designed for both the commercial and family farm segments. Several
credit programmes for the family farm segment have an environmental focus. These
include credit for plantings on unproductive and degraded soils, credit for forest planting
including palm oil for biofuel, and credit to modernise production systems and preserve
natural resources. PRONAF’s Agroecology programme provides investment credit for the
introduction of environmentally sustainable agricultural systems and organic
production. However, possibly the most far-reaching longer run impacts may derive from
environmental rules applicable to the use of agricultural land, including the requirement
that farms set aside areas as preservation land. The implementation of the new forest
code of 2012 calls for the registration of farm units with the Rural Environmental Register
(Cadastro Ambiental Rural – CAR). After May 2017, rural properties not included in the
CAR will not have access to agricultural credit. However, farmers may commit to
complying with environmental requirements according to the relative Environmental
Compliance Plan (PRA), including forest restoration, soil conservation and the above-
mentioned maintenance of a share of the property under natural cover. In addition to
having 20 years to comply with the PRA, they will receive financial support (particularly
small farmers) to assist rehabilitation. Implementing this Plan, which aims to better
regulate land use, preserving river bank areas, reducing deforestation in the Amazon and
strengthening reforestation efforts, is a major challenge for the government and the
sector.
OECD-FAO AGRICULTURAL OUTLOOK 2015 © OECD/FAO 2015 99
2. BRAZILIAN AGRICULTURE: PROSPECTS AND CHALLENGES
Biofuel policies
In addition to promoting sustainable agricultural practices, the government is
implementing a range of agro-energy policies, Brazil’s main sources of agricultural
renewable energy are sugarcane (ethanol and biogases), planted forests (firewood and
charcoal) and biodiesel. The Brazilian government has provided strong support for biofuel
via measures, which include: lending to construct ethanol plants and storages; tax
incentives on flex-fuel cars which can run on any combination of ethanol and gasoline;
and mandatory blending ratios for both gasoline and diesel. The mandatory blending of
ethanol with gasoline in fuel mixtures continues to take place, as well as the mandatory
blending of biodiesel with fossil diesel. The current blending ratios are 27% and 7%
respectively. Most of the biodiesel comes from soybean oil, although the use of palm oil is
increasing. Other programmes like animal and plant health continue to be important in
the agricultural policy framework. More than BRL 240 million (USD 123 million) have been
spent annually in this area over the last five years.
Given the current context, measures to provide relief in the short term to the Brazilian
sugar and ethanol industry are more or less restricted to a differentiated taxation between
hydrous ethanol and gasohol and an expansion in the mandatory anhydrous ethanol blend
in gasoline.
Differentiated taxation has existed for a long time. ICMS, whose rate is set
independently by each state of the federation, is the main tax levied on hydrous ethanol
and gasohol sales. The lowest tax rate for hydrous ethanol (12%) is charged in São Paulo
State, the largest producer and consumer state, whereas the average country tax rate is
16%. For gasoline, the average country tax rate is about 25%.
Relief measures were introduced at the beginning of 2015: the anhydrous ethanol
blend in gasoline increased to 27%, the CIDE tax was reintroduced for gasoline and PIS/
COFINS tax levels were increased for gasoline only. However, the scope of these measures
remains relatively limited, providing relief only for the most efficient and least indebted
groups in this sector.
The National Programme for Biodiesel Production and Use (PNPB) was launched by the
Brazilian Government in 2005. It brings together both large-scale agribusinesses and
smallholder farmers (MDA, 2011). The programme introduced a mandatory content of 2%
(B2) biofuel added to fossil diesel in 2008 and set a 5% (B5) goal for 2013, though in reality
this was reached in 2010. Brazil became the world’s third largest producer and consumer of
biodiesel in 2014, and towards the end of the year a new mandatory content of 7% (B7) was
established (Presidência da República, 2014). The consumption in that year reached 3.4 billion
litres (bln L) (ANP, 2014).
An important initiative implemented under the PNPB was the Social Fuel Seal scheme
that is awarded to biodiesel producers that make from 10-30% (a share that varies by
region) of their feedstock purchases from smallholders. Incentives to purchase from
smallholders include tax reductions, favourable credit terms and, importantly, the
possibility to participate in the 80% volume share stage of biodiesel auctions.13 In addition
to the Social Fuel Seal Scheme, the Ministry of Agrarian Development (MDA) established a
biodiesel production centre project that aimed to increase small-scale farmer
participation. By 2014, 85 000 farms were participating in the PNPB and 42 companies,
accounting for 99% of national biodiesel production, had the Social Fuel Seal (MDA, 2014).
OECD-FAO AGRICULTURAL OUTLOOK 2015 © OECD/FAO 2015100
2. BRAZILIAN AGRICULTURE: PROSPECTS AND CHALLENGES
The programme has had positive impacts on job creation in rural areas and has also
enabled the introduction of up-to-date technology and training to small farmers, leading to
increased productivity on degraded land (FAO, 2013).
Domestic social policies impacting on agriculture
Since the early 2000s, improved macroeconomic conditions along with targeted social
safety-net policies have been reflected in significant reductions in national poverty.
Between 2001 and 2012 overall poverty declined from 24.3% to 8.4% of the population,14
while extreme poverty fell from 14% to 3.5%.15 Over this period, the income of the poorest
20% of the population grew by three times as much as that of the wealthiest 20%,16 with a
resultant narrowing the inequality gap which nevertheless remains large.
In parallel with poverty reduction, Brazil has made rapid progress in reducing hunger.
In fact, it has already achieved both the Millennium Development Goals (MDG) target of
halving by the end of 2015 the proportion of its people who suffer from hunger as well as
the more stringent 1996 World Food Summit (WFS) target of reducing the absolute number
of hungry people.17 Since the early 2000s, the undernourishment rate in Brazil has fallen
by half from 10.7% to below 5%. According to recent analysis by the Ministry of Social
Development and Fight against Hunger the undernourishment rate fell to less than 2%
in 2013.
Although policies already existed in the late 1990s to redress regional economic and
social inequality, the greatest acceleration in poverty reduction occurred when ending
hunger was put in the centre of Brazil’s political agenda by former President Luis Ignacio
Lula da Silva. The launching of the Zero Hunger programme in 2003 introduced a new
approach that gave utmost priority to food security as well as social and economic
inclusion for vulnerable population groups, through coordinated macroeconomic, social
and agricultural policies.
The Zero Hunger programme became the core of the Food and Nutrition Security Policy
adopted by the government in 2006; and this inclusive food security model was gradually
incorporated into national laws aimed at promoting the progressive realisation of the
human right to adequate food, as enshrined in Brazil’s Constitution in 2010. The Brazil
without Extreme Poverty strategy adopted in 2011 builds on the success of Zero Hunger and
targets the extremely poor. The current National Food and Nutrition Security Plan
incorporates more than 40 programmes and actions with total expenditures amounting to
some USD 35 billion in 2013.
The main thrusts of the Food and Nutrition Security Policy involve economic policies
and social protection measures, in particular the Bolsa Família cash transfer mechanism
(described in Box 2.4), combined with innovative measures to strengthen family farming.
These two major components aimed at promoting, in an integrated manner, income
generation, job creation, growth of agricultural production and improved access to food.
Policy actions to enhance food security and nutrition were subsequently extended to cover
other areas having implications for the agricultural sector, including sustainable
agricultural practices and education in nutrition and food habits.
OECD-FAO AGRICULTURAL OUTLOOK 2015 © OECD/FAO 2015 101
2. BRAZILIAN AGRICULTURE: PROSPECTS AND CHALLENGES
Family farming
The strengthening of family farming under the Zero Hunger programme was the other
key element in the programme for improving income, employment and access to food among
vulnerable populations. In 2013, expenditures to support family farmers totalled USD 5.6
billion.18 The numbers of such family farms are impressive, representing more than 80% of
production units. Overall, more than 12 million persons, or about 75% of total rural
employment, work in family establishments.19 Additionally, family farming accounted for 38%
of the gross value of agricultural production in 2006 (FAO/INCRA 2006). At the inception of the
Zero Hunger programme more than 25% of Brazil’s poor population was living in rural areas
where the poverty rates exceeded 45%. Between 2003 and 2009, more than 5 million people in
rural areas were removed from poverty and the incidence of poverty dropped from 45% to 28%.
In these regions, family farming remains the dominant economic activity.
The National Program for the Strengthening of Family Farming (PRONAF) aimed at
redressing market failures that had led to depressed prices and condemned smallholders to
shrinking production, falling incomes and precarious access to food. Among the main
measures in favour of family farming, PRONAF provides low interest credit, the bulk of which
has been destined to agriculture. Over the past decade, family farm categories were gradually
increased to include units with higher gross annual income, thereby broadening access to
targeted rural credit. Between 2003 and 2014, PRONAF credit resources increased from BRL 2.4
billion to about BRL 25 billion. Of the total credit provided in 2014, nearly 60% was for
investment.
PRONAF operations are supported by the Family Farming Price Guarantee Program
(PGPAF), an insurance programme that provides discounts on credit contracts to offset
drops in farm revenue owing to reductions in market prices or climate-induced crop losses.
In addition, a harvest insurance fund specifically targets farmers in Brazil’s semi-arid
region when drought causes severe crop losses for family farmers.
Box 2.4. Bolsa Família
Bolsa Familia, launched in 2003, represents the largest programme of this sort world-wide. Since 2011 Bolsa Familia has been a part of the Brazil without Extreme Poverty Planthat targets the extreme poor. This programme currently provides direct income transfersto more than 13.8 million low-income families. These transfers have had an immediateimpact in increasing access to food which in turn has stimulated production and localfarm income growth.
Over the longer run, the transfers represent an investment in human capital andproductivity as a result of the conditions that must be met to qualify for the allowances.Aside from health monitoring and immunisation of children, the requirement of schoolattendance has contributed to improving opportunities for social and economic inclusionof future generations. Analysis of evidence from the 2010 census indicates that BolsaFamilia was associated with a pronounced increase in continued studying, or at leaststudying and working, as contrasted to working only, in both urban and rural areas. Theprobability of working only declined most in rural areas, especially for boys.
Investment in this programme tripled in ten years, reaching nearly USD 11 billion in2013, and currently accounting for about one-third of Federal expenditure on food securityand nutrition programmes (CAISAN, 2014).
OECD-FAO AGRICULTURAL OUTLOOK 2015 © OECD/FAO 2015102
2. BRAZILIAN AGRICULTURE: PROSPECTS AND CHALLENGES
The Family Farming Food Acquisition Program (PAA) implemented in 2003 was initially
intended to provide incentives to family farms to increase food production both for self-
consumption and for sale at guaranteed prices to public sector procurement agencies.
Procurement is made from family farm enterprises registered with PRONAF in order to
sustain prices, enhance marketing opportunities and through donations improve food
availability of vulnerable populations. Since the middle of the last decade, by far the largest
share of procurement has been for simultaneous donation. In 2014, 85% of procurement
funds were used in this manner (CONAB-PAA, 2014). A significant share of PAA procured
supplies (34% in 2014) is used for the school meal programme. In 2009 the National School
Meal Program (PNAE) required public schools to allocate at least 30% of food expenditures
to direct purchases from family farmers. Under the PNAE an estimated 47 million free-of-
charge meals are served in schools every day.20
Between 2003 and 2014 about BRL 3.3 billion was spent under the PAA, and the total
number of suppliers was more than 51 000. Since 2011 under the Brazil without Extreme
Poverty Plan, PAA procurement is specifically targeted to the 16 million persons living in
extreme poverty with monthly income below BRL 70. In 2014, nearly 24 000 PAA suppliers,
or 47%, fell within this category.
The prioritisation of family farming was also reflected by measures to transfer suitably
adapted technologies by Embrapaand state research organisations as well as the
implementation of projects to promote development in a number of sectors such as animal
husbandry, fruits and vegetables and staple food crops. The National Program for Biodiesel
Production and Use (PNPB), which contains special provisions for family farmers, was
launched by the Brazilian Government in 2005.
Agricultural trade policies
Brazil undertook radical trade reforms in the late 1980s and early 1990s. Tariff
reductions, and the liberalisation of domestic markets, coupled with important
technological and structural shifts in the agro-food sector, created a new incentive
structure in Brazilian agriculture. Currently, agricultural and food commodities imported to
Brazil are subject to ad valorem tariffs, and no specific tariffs or special safeguards are
imposed. Only a very small percentage (0.2%) of agricultural tariff lines has a tariff quota.
Brazil, along with Argentina, Uruguay, Paraguay and Venezuela is a member of
MERCOSUR. Bolivia started a process of accession in December 2012 which has not yet
concluded. The Mercosur Common External Tariff (CET) constitutes the core of Brazil’s
import tariff structure. The CET incorporates 1 030 agricultural tariff lines with tariff rates
ranging from 0% to 20%. However, each Mercosur member country has a list of exceptions
to the CET.
Using the WTO definition of agriculture, the simple average most-favoured nation
(MFN) tariff in 2014 was 10.2%. About 8% of agricultural MFN applied tariff rates were duty
free in 2013 and most (57%) were between 5-10%. About 1.6% of tariff lines exceed 25%
(WTO, ITC and UNCTAD, World Tariff Profiles 2014). Groups of products facing above
average tariffs include: dairy products (18.3%), sugar and confectionary (16.5%), beverages,
spirits and tobacco (17.0%), and coffee and tea (13.3%), while imports of cotton (6.9%),
oilseeds, fats and oils and their products (7.9%), and animals and animal products (8.2%),
are subject to tariffs lower than the average.
OECD-FAO AGRICULTURAL OUTLOOK 2015 © OECD/FAO 2015 103
2. BRAZILIAN AGRICULTURE: PROSPECTS AND CHALLENGES
Brazil’s simple average WTO bound tariff rate for 2004 (final year of the implementation
period for developing countries) was 35.3%. Brazil’s average bound tariff rate for agricultural
goods is more than three times the average applied MFN rate. The minimum and maximum
bound tariff rates coincide with the minimum and maximum applied MFN rates. However,
while over 250 tariff lines were bound at the maximum of 55%, only two are actually fixed at
this level. This “tariff overhang” is largely due to the existence of the Mercosur CET which sets
the effective border protection at levels much below the country’s bindings.
MERCOSUR has signed different agreements with almost all countries in Latin America. In
2009, MERCOSUR signed a Free Trade Agreement (FTA) with Israel, with Egypt in 2010 and with
Palestine in 2011. Preferential agreements between MERCOSUR and India and with the South
African Customs Union (SACU) were signed in 2009. No trade agreements have been signed
since then. The trade agreements with Israel and India are in force, but the agreements with
Egypt, Palestine and SACU still need to be ratified by the National Congress.
The majority of agricultural imports from MERCOSUR enter the member countries duty
free, while the average tariff on agricultural imports from non-MERCOSUR countries is close to
12%. Brazilian exporters face relatively low duties when exporting to most of their major
partners. Exports of all goods to the European Union in 2012 faced a trade-weighted average
MFN rate of 6.2% while exports to the United States and China faced tariffs averaging
respectively 3.4% and 7%. However, Brazilian goods entering the Russian Federation faced
duties averaging 21.4% while to enter Japan they had to overcome an 83% average tariff.
There has been a rapid growth in Brazil’s agricultural exports, although those exports
remain centred around bulk and lightly processed commodities and there is relatively little
integration with global value chains. One reason for this is high tariffs on manufacture relative
to other countries, which raises the cost of imported inputs. Although Brazil has liberalised its
trade over time, the average applied tariff rate on manufactured products fell from 16% in 1996
to 10% in 2012. That rate is higher than the applied rate by the other BRIICS and about three
times higher than the world average.
Box 2.5. Sanitary and phyto-sanitary regulations in Brazil
Importation of products subject to SPS controls requires a non-automatic license. TheMinistry of Agriculture, Livestock and Food Supply (MAPA), through its Secretariat ofAgricultural Protections (SDA), is responsible for the protection of animal and plant health.The SDA is vested with authority to control the SPS aspects of production andinternational trade of all livestock, fruits, vegetables, grains, plants, veterinary drugs,pesticides and the components; it also registers and inspects products and activities thatuse genetically modified organisms, on behalf of the National Technical Commission onBiotechology (CTNBio), which issues the relevant authorisation. The Ministry of Fisheriesand Aquaculture (MPA) is responsible for aquatic, animal health; its General CoordinationOffice for Aquatic Animal Health (CGSAP) carries out sanitary controls to protect thenatural and reproduction environments in Brazil, including on imports of fish and aquaticanimals and their reproductive materials. The Brazilian Health Surveillance Agency(ANVISA), an autonomous entity linked to the Ministry of Health under a managementcontract, is in charge of controlling the production and marketing of products and servicessubject to sanitary surveillance for the protection of human health. ANVISA is responsiblefor, among other things, approving the importation of food products and performing sanitaryinspections at the points of entry into Brazil.
OECD-FAO AGRICULTURAL OUTLOOK 2015 © OECD/FAO 2015104
2. BRAZILIAN AGRICULTURE: PROSPECTS AND CHALLENGES
Imports of agricultural products are subject to Brazil’s sanitary and phyto-sanitary (SPS)
standards. Brazil’s system is based on risk analysis that generally takes into account an
import’s origin and product characteristics (see Box 2.5). Brazil accepts phytosanitary and
zoosanitary certificates issued by official sanitary services in countries that follow the
guidelines of the Codex Alimentarius Commission, the World Organisation for Animal Health,
the International Plant Protection Convention and other international scientific organisations.
A total of 3 275 product lines at the HS-8 digit level are subject to SDA controls with 2 675 of
these lines requiring SDA authorisation prior to shipment or arrival at Brazil’s borders.
Strategic challengesThe prospects for Brazilian agriculture over the next ten years are favourable,
notwithstanding the prospects of slower growth in both domestic and international
demand, and real prices declining from recent peaks for most agricultural commodities.
Both domestic and international markets are expected to grow, with a shift in the
composition of demand towards products in which Brazil is a competitive producer; in
particular meat and associated feed requirements (maize and oilseeds), sugar, and higher
value products such as tropical fruits. That growth will provide further opportunities for
Brazil’s commercial agriculture, but will add new opportunities for family farms in
products where economies of scale are less evident, notably coffee, tropical fruits and
horticulture. As a result of this growth, agriculture will continue to play an important role
in terms of employment, income generation and export earnings. Increased incomes for
family farms and abundant supplies of a diverse range of foods will also contribute to
further improvements in food security and nutrition.
The dynamism of Brazilian agriculture was founded on the availability of new
technologies adapted to tropical agriculture, the adoption of modern management
methods, including financial instruments, and changes in policies. The key to future
growth is sustaining improvements in agricultural productivity, which will come from a
combination of improvements in crop yields, some conversion of pasture (including
degraded and abandoned pasture lands) to cropland, and more intensive livestock
production. Brazil’s agricultural research and innovation system has been hugely
successful, bringing new technologies to farming in tropical areas, and making available
innovative new production and management practices. That success can be leveraged
through greater private sector engagement. The full potential of the private sector to
contribute to agricultural innovation can be realised by strengthening the enabling
regulatory framework, improving infrastructure, promoting qualified human capital and
developing investment partnerships for research and development between the public and
private sectors. At the same time, continued commitment by the government to
agricultural research and development, including in new areas such as biotechnology and
responses to climate change, are needed to address problems confronting the agricultural
sector generally.
The participation of farmers in Brazil’s economic growth can be enhanced by further
investment in education, training and extension services which provide wider
dissemination of existing technologies. However for many traditional farmers, the key to
their development will be balanced rural development that creates jobs outside as well as
within agriculture. Broad based support, including education and public health support,
can help consolidate Brazil’s successes in reducing poverty and eliminating hunger,
ensuring incomes rise to sustainable levels well beyond the poverty threshold.
OECD-FAO AGRICULTURAL OUTLOOK 2015 © OECD/FAO 2015 105
2. BRAZILIAN AGRICULTURE: PROSPECTS AND CHALLENGES
Among the factors influencing the competitive position of Brazil’s agricultural sector,
improvement in logistics and transport infrastructure is a key priority. This would reduce
the costs of Brazil’s export oriented producers, while benefiting farmers of all types
through improved access to domestic markets. The strengthening of animal and plant
health and inspection systems is another area that can also underpin the longer term
development of domestic and international markets for the Brazilian agricultural sector.
In general, Brazil allocates a relatively low share of its agricultural support to sector-
wide investments, such as infrastructure, extension services, and institutional support and
knowledge systems. While short term benefits accrue to farmers from price support and
credit programmes, in the longer run sector-wide investments can have a higher pay-off to
farmers. Although Brazil provides comparatively low support to farmers, there may be
opportunities to gradually transfer additional resources to public investment in the light of
the expected improvements in agricultural productivity and the associated profitability of
the sector. Moreover, the expansion of credit facilities from private sector sources could
release further public resources for longer term investment
The lack of a Doha Round WTO agreement has impeded market access for Brazilian
producers to many parts of the world. Without a comprehensive WTO agreement, Brazil
would gain from a deepening of trade reforms within Mercosur and the broader pursuit of
trade agreements with existing and potential partners. Over the past decade a large share
of Brazil’s exports has gone to China. As China’s growth slows, other Asian markets will be
progressively more important. At the same time, cross-sectoral liberalisation would
eliminate biases in incentives across sectors and reduce the costs of imported inputs. This
would help promote value addition in agriculture and greater insertion into global value
chains – both of which remain underdeveloped by international standards. Those gains
could be reinforced by reforms to the country’s complex and costly tax system, and by the
removal of administrative obstacles that producers face in establishing and conducting
businesses.
One of the overriding challenges for Brazilian agriculture in the long run is the
strengthening of productivity growth and the maintenance of international cost
competitiveness while making further progress in reducing poverty and inequality. Under
the Zero Hunger programme and subsequent National Food Security and Nutrition
Program, significant reductions in hunger and poverty rates have taken place in the
country over the past decade. Since 2011 the focus given under the Brazil without Extreme
Poverty Plan to assisting particularly needy families, most of whom are located in rural
areas, can contribute to lessening the economic and social exclusion of these vulnerable
groups. Aside from conditional cash transfer payments, longer term benefits can accrue
from targeted rural technical assistance.
The improvements in agricultural production can be achieved sustainably. Most of the
anticipated increases in production will come from productivity gains, and the stress on
natural resources - especially land, but in some regions water too – can be alleviated. There
is also scope for further development of more sustainable production practices, including
the conversion of existing and degraded cropland to pasture and the integration of crop
and livestock systems. Brazil has a large amount of land that can be exploited for
agricultural production without further encroaching on the Amazon rainforest. This will
imply tighter regulations on illegal activity, and technical and financing support to the
Forest Code. It could be further strengthened by assigning property rights on land that has
OECD-FAO AGRICULTURAL OUTLOOK 2015 © OECD/FAO 2015106
2. BRAZILIAN AGRICULTURE: PROSPECTS AND CHALLENGES
already been cleared. Clearer property rights would also improve the sustainability of land
use in other regions.
The benefits of sustainable growth in Brazil’s agriculture are vast. Simultaneously it
improves food availability for both domestic and international consumers, while
generating income opportunities for a diverse constituency of farmers. Those gains are
fully compatible with the government’s emphasis on reducing poverty and income
inequality, and simultaneously improving the environmental sustainability of the
agricultural sector.
Notes
1. Brazil has an official definition of a “family farm” that is adopted in this chapter (Law 11.326/2006of 24 July 2006, Administrative order Ministry of Agrarian Development No. 111 of 20 November 2003and Resolution No. 3.467 of 2 July 2007). A family farm must be managed by the owner, use principallyfamily labour, and have a size of less than 4 fiscal modules. A fiscal module is a tax-relatedmeasure based on the potential income generation from the land, ranging between 5 and110 hectares, depending on the geographical area. Using this definition, 84% of Brazil’s farms arefamily farms, averaging 18.4 hectares. By contrast non-family farms average 309 hectares.
2. USDA use data published by FAOSTAT to calculate TFP growth as the difference between outputgrowth and input growth (www.ers.usda.gov/data-products/international-agricultural-productivity.aspx). The aggregate index of output volume is based on Agricultural Gross Productionin constant 2004-06 USD, smoothed over time using a Hodrick-Prescott filter. The aggregate indexof input use is calculated as the average of land, livestock, machinery, fertiliser and feed useindexes, weighted by the shares of these inputs in agricultural production available in theliterature.
3. This value is based on the WTO definition of agricultural products which does not include fish andfish products.
4. Petrobras is a semi-public Brazilian multinational energy corporation. Petrobras’s activities includethe exploration and production of oil and natural gas, oil refining, transportation and distributionof natural gas and oil products, electricity generation and petrochemical production.
5. The different perspectives are summarised, for example, in Box 1.1, “The impact of agriculture onthe Brazilian Amazon” in OECD (2005), and in FGV (2013), pp. 26-29.
6. “Legal Amazon” encompasses nine Brazilian states and covers five million square kilometres –more than 50% of Brazil’s total area.
7. Because of double or even triple cropping along with area substitution among the various crops,the figures may overstate the extent that new land is brought into production.
8. Unless indicated otherwise, all references to relative change in the value in 2024 are with respectto the average value during the three years 2012 to 2014. The term base period is also used to referto the average value for 2012 to 2014.
9. The Brazilian Ministry of Agriculture, Livestock and Food Supply (MAPA) projects soybeanproduction for 2024 at 118.0 million tons. Methodological differences help to explain the differentresults for this crop as well as for wheat and rice, as MAPA uses forecasting models based on timeseries while the FAO-OECD projections are based on a structural model.
10. www.mpa.gov.br/files/Docs/Planos_e_Politicas/Plano%20Safra%28Cartilha%29.pdf.
11. Aquaculture data have been recently revised by the Ministry of Fisheries and Aquaculture (MPA).
12. Mariculture: Cultivation, management and harvesting of marine organisms in their natural habitator in specially constructed rearing units, e.g. ponds, cages, pens, enclosures or tanks.
13. Auctions are run by the Brazilian National Agency of Petroleum, Natural Gas and Biofuels. Eightypercent of the total biodiesel volume supplied in fulfilment of the mandatory blend is reserved forSocial Fuel Seal holders, while the remaining 20% is open to competition for producers with orwithout the Social Fuel Seal.
14. CAISAN. 2014. Balanco das Acoes do Plano Nacional de Seguraca Alimentar e Nutricional – Plansan 2012/2015.Brasilia.
OECD-FAO AGRICULTURAL OUTLOOK 2015 © OECD/FAO 2015 107
2. BRAZILIAN AGRICULTURE: PROSPECTS AND CHALLENGES
15. IPEA. 2014. Objetivos de Desenvolvimento do Milenio. Relatorio nacional de acompanhamento. Brasilia,Institute of Applied Economic Research IPEA.
16. Government of Brazil. 2014. Indicadores de Desenvolvimento Brasileiro 2001-2012. Brasilia.
17. FAO, IFAD, WFP: The State of Food Insecurity in the World 2014, pp. 23-26.
18. CONSEA. 2014. Analise dos indicadores de seguranca alimentar e nutritional. 4° Conferencia National deSeguranca Alimentar e Nutricional +2. Brasilia.
19. Del Grossi, M.E. 2011.”Poverty Reduction: From 44 million to 29.6million people” in J. Grazianoda Silva, M.E. Del Grossi and C. Galvao de Franca (eds), The Fome Zero (Zero Hunger Programme: TheBrazilian Experience. Rome, Food and Agriculture Organization of the United Nations.
20. A. Veiga Aranha. 2011. “Zero Hunger: A Project turned into a Government Strategy” in J. Grazianoda Silva, M.E. Del Grossi and C. Galvao de Franca (eds), The Fome Zero (Zero Hunger Programme: TheBrazilian Experience. Rome, Food and Agriculture Organization of the United Nations.
References
Brandão, A., de Rezende, G.C. and R. da Costa Marques (2005), “Agricultural Growth in the Period1999-2004, Outburst in Soybean Area and Environmental Impacts in Brazil”, Texto Para DiscussãoNo. 1062, Rio de Janeiro, http://dx.doi.org/10.2139/ssrn.660442.
CONAB (2014), Programa de Aquisicao de Alimentos (PAA), Resultado das Acoes da CONAB em 2014,Brasilia, DF, www.conab.gov.br/conteudos.php?a=1592&t=2.
Empresa Brasileira de Pesquisa Agropecuaria (Embrapa) – Ministry of Agriculture, Livestock and FoodSupply MAPA (2014), Technological solutions and innovation: Embrapa in the International Year of FamilyFarming, Brasilia, DF,http://ainfo.cnptia.embrapa.br/digital/bitstream/item/113140/1/Anuario-Separata-Embrapa-2014-INGLES.pdf.
FAO (2014), “The State of Food and Agriculture 2014: Innovation in family farming”, FAO, Rome,www.fao.org/3/a-i4040e.pdf.
FAO, IFAD and WFP (2014), “The State of Food Insecurity in the World 2014: Strengthening the enablingenvironment for food security and nutrition”, FAO, Rome, www.fao.org/3/a-i4030e.pdf.
FAOSTAT (2013), On-line database, FAO, Rome, http://faostat.fao.org/.
FAO and OECD (2014), “Opportunities for Economic Growth and Job Creation in Relation to FoodSecurity and Nutrition, Report to the G20 Development Working Group”,https://g20.org/wp-content/uploads/2014/12/opportunities_economic_growth_job_creation_FSN.pdf.
FGV (2013), Agroanalysis, The Agribusiness Magazine from FGV, Special edition, Fundação GetulioVargas, Rio De Janeiro, http://fgvprojetos.fgv.br/en/publicacao/agroanalysis-special-edition-0.
Gasques, J.G., E.T. Bastos, C. Valdez, and M.R.P. Bacchi (2014), “Produtividade da agricultura Resultadospara o Brasil e estados selecionados”, Embrapa, Brasília, DF,www.agricultura.gov.br/arq_editor/RPA%203%202014.pdf#page=88.
Graziano da Silva, J., Del Grossi, M.E. & de Franca, C.G., eds. (2010), The Fome Zero (Zero Hungerprogramme): The Brazilian experience, FAO and the Ministry of Agrarian Development, Brasilia,www.fao.org/docrep/016/i3023e/i3023e.pdf.
Helfand, S., M. Pereira and W. Soares (2014), “Pequenos e Médios Produtores na Agricultura Brasileira:Situação Atual e Perspectivas”. In: Buainain, A., E. Alves, J.M. Silveira and Z. Navarro (EditoresTécnicos). “O mundo rural no Brasil do século 21: a formação de um novo padrão agrário e agrícola”,Embrapa, Brasília, DF: p. 533-557, http://www.alice.cnptia.embrapa.br/handle/doc/994073.
IBGE: The Brazilian Institute of Geography and Statistics (2006), Censo Agropecuario 2006, Rio DeJaneiro, www.ibge.gov.br/home/estatistica/economia/agropecuaria/censoagro/2006/.
Ministerio do Desenvolvimento Agrario (MDA) & Ministerio do Desenvolvimento Social e Combate aFome (MDS), Plano Brasil sem Miseria, Resultados no meio rural 2011/2014,www.mda.gov.br/sitemda/sites/sitemda/files/user_arquivos_25/Caderno%20de%20Graficos%20BSM%20-%203%2C5%20anos%20-%20Rural.pdf
Ministério de Minas e Energia, Empresa de Pesquisa Energética (MME/EPE) (2013a), Avaliação DoComportamento Dos Usuários De Veículos Flex Fuel No Consumo De Combustíveis No Brasil,www.epe.gov.br/Petroleo/Documents/DPG_Docs/EPE-DPG-SDB-001-2013-r0.pdf.
OECD-FAO AGRICULTURAL OUTLOOK 2015 © OECD/FAO 2015108
2. BRAZILIAN AGRICULTURE: PROSPECTS AND CHALLENGES
Ministério de Minas e Energia, Empresa de Pesquisa Energética (MME/EPE) (2013b), “Balanço EnergéticoNacional”, https://ben.epe.gov.br/default2013.aspx.
Ministério de Minas e Energia, Empresa de Pesquisa Energética (MME/EPE) (2014), “Análise de Conjunturados Biocombustíveis”,www.epe.gov.br/Petroleo/Documents/An%C3%A1lise%20de%20Conjuntura%20dos%20Biocombust%C3%ADveis%20-%20boletins%20peri%C3%B3dicos/An%C3%A1lise%20de%20Conjuntura%20-%20Ano%202014r.pdf.
Ministry of Agriculture, Livestock and Food Supply (MAPA/ACS) (2014), Projections of agribusiness: Brazil2013/14 to 2023/24 Long-term Projections, Brasilia.
OECD (2005), OECD Review of Agricultural Policies: Brazil 2005, OECD Publishing, Paris. doi: http://dx.doi.org/10.1787/9789264012554-en.
OECD (2013), OECD Economic Surveys: Brazil 2013, OECD Publishing, Paris,doi: http://dx.doi.org/10.1787/eco_surveys-bra-2013-en.
OECD (2014), “Innovation for Agriculture Productivity and Sustainability: Review of Brazilian Policies”,OECD, Paris,www.oecd.org/officialdocuments/publicdisplaydocumentpdf/?cote=TAD/CA/APM/WP(2014)23/FINAL&docLanguage=En.
OECD (2014), “Analysing Policies to improve agricultural productivity growth, sustainably: Revisedframework”, OECD, Paris,www.oecd.org/tad/agricultural-policies/Analysing-policies-improve-agricultural productivity-growth-sustainably-december-2014.pdf.
OECD (2014), OECD Economic Outlook, Vol. 2014/2, OECD Publishing, Paris,doi: http://dx.doi.org/10.1787/eco_outlook-v2014-2-en.
OECD/CAF/ECLAC (2014), Latin American Economic Outlook 2015: Education, Skills and Innovation forDevelopment, OECD Publishing, Paris, doi: http://dx.doi.org/10.1787/leo-2015-en.
World Bank (2014), World Development Indicators 2014, World Bank, Washington, DC,doi: http://dx.doi.org/10.1596/978-1-4648-0163-1.
OECD-FAO AGRICULTURAL OUTLOOK 2015 © OECD/FAO 2015 109

OECD-FAO Agricultural Outlook 2015
© OECD/FAO 2015
PART I
Chapter 3
Commodity snapshots
This chapter describes the market situation and highlights of the latest set ofquantitative medium-term projections for world and national agricultural markets,for the ten-year period 2015-24. Each one of the commodity highlights iscomplemented by a more detailed discussion in the full online version. It providesinformation on prices, production, use, trade and main uncertainties for cereals,oilseeds, sugar, meat, dairy products, fish, biofuels and cotton. The quantitativeprojections are developed with the aid of the partial equilibrium model Aglink-Cosimo of world agriculture. The chapter also includes a description of themacroeconomic and policy assumptions underlying the projections, and each of thecommodity highlights is followed by statistical tables.
111
3. COMMODITY SNAPSHOTS
CEREALS
Market situation
The grains market situation in the marketing year 2014 (see glossary for a definition of
marketing year) was characterised by ample supply. Two consecutive record maize
harvests in the United States, above average maize, barley and yields in the European
Union and the Russian Federation drove global coarse grain stocks up to record levels and
market prices to their lowest levels in the past five years. The wheat market situation was
similar since harvests were good in most of the major wheat producing countries with
significant production gains in Argentina, the Commonwealth of Independent States (CIS)
and the European Union. However, wheat production in 2015 is expected below the 2014
record output, reflecting an expected decline in winter wheat production in Europe with
yields anticipated to return to average levels from the previous year’s highs. Global rice
production in 2014 reached almost 495 Mt in milled rice equivalent, slightly lower than
2013 and well below levels that would have been attained had growth continued at its ten
year trend of 2% p.a. This outcome is largely due to climatic setbacks in Asia resulting in
production declines in India, Indonesia, Nepal, Sri Lanka and Thailand. For the first time in
a decade, global rice utilisation surpassed production, resulting in a drawdown of global
rice stocks to 177 Mt.
Projection highlights
Cereal prices start from low levels in 2014 compared to those recorded since 2007. In
the short term, slower economic growth, historically high production over the past two
years that led to stocks build-up, as well as low oil prices may cause prices to decrease
further. However in the medium term, the price development in nominal terms is expected
to be cost driven, increasing slightly behind inflation and thus moderately declining in real
terms. For rice, the turning point to an increasing nominal price path is expected a season
later than for other grains, given huge rice stocks accumulated in Thailand. Average
nominal prices of the three cereals over the outlook period are projected to be from 6% to
15% lower than in the previous decade (Figure 3.1).
Production of cereals is expected to increase over the next decade. In 2024 production
will be 14% greater than the base period (2012-14) mainly driven by yield improvements
while area expansion is expected to be limited. Relative to the base period, production in
2024 is projected to increase by similar magnitudes for wheat (12%), coarse grains (15%)
and rice (14%). An additional 86 Mt of global wheat supply is projected with a large share
being produced in India (15 Mt), the Russian Federation (13 Mt), China (8 Mt) as well as the
European Union and Argentina (7 Mt each). Coarse grain production is set to increase by
194 Mt (United States 51 Mt, China 37 Mt, European Union 12 Mt, the Russian Federation
6 Mt and Ukraine 6 Mt). The global increase of 70 Mt in rice production is expected to be
dominated by Asian countries (61 Mt) mainly India (17 Mt), Indonesia (8 Mt), Bangladesh,
Thailand (6 Mt), Viet Nam and China (5 Mt).
Global cereal consumption is expected to grow by 388 Mt reaching 2 786 Mt by 2024.
Wheat consumption increases by 13% compared to the base period and continues to be
dominated by food use at a constant share of about 69% of total use. Feed use of wheat is
OECD-FAO AGRICULTURAL OUTLOOK 2015 © OECD/FAO 2015112
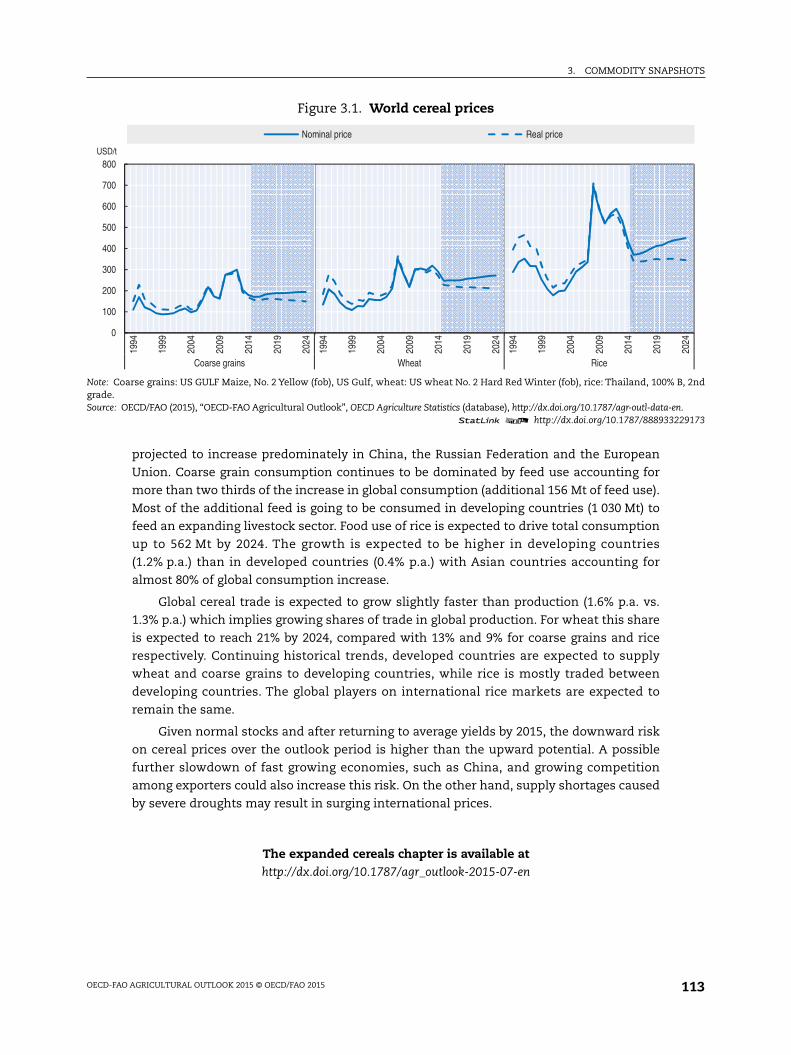
3. COMMODITY SNAPSHOTS
B, 2nd
n.229173
2024
projected to increase predominately in China, the Russian Federation and the European
Union. Coarse grain consumption continues to be dominated by feed use accounting for
more than two thirds of the increase in global consumption (additional 156 Mt of feed use).
Most of the additional feed is going to be consumed in developing countries (1 030 Mt) to
feed an expanding livestock sector. Food use of rice is expected to drive total consumption
up to 562 Mt by 2024. The growth is expected to be higher in developing countries
(1.2% p.a.) than in developed countries (0.4% p.a.) with Asian countries accounting for
almost 80% of global consumption increase.
Global cereal trade is expected to grow slightly faster than production (1.6% p.a. vs.
1.3% p.a.) which implies growing shares of trade in global production. For wheat this share
is expected to reach 21% by 2024, compared with 13% and 9% for coarse grains and rice
respectively. Continuing historical trends, developed countries are expected to supply
wheat and coarse grains to developing countries, while rice is mostly traded between
developing countries. The global players on international rice markets are expected to
remain the same.
Given normal stocks and after returning to average yields by 2015, the downward risk
on cereal prices over the outlook period is higher than the upward potential. A possible
further slowdown of fast growing economies, such as China, and growing competition
among exporters could also increase this risk. On the other hand, supply shortages caused
by severe droughts may result in surging international prices.
The expanded cereals chapter is available athttp://dx.doi.org/10.1787/agr_outlook-2015-07-en
Figure 3.1. World cereal prices
Note: Coarse grains: US GULF Maize, No. 2 Yellow (fob), US Gulf, wheat: US wheat No. 2 Hard Red Winter (fob), rice: Thailand, 100%grade.Source: OECD/FAO (2015), “OECD-FAO Agricultural Outlook”, OECD Agriculture Statistics (database), http://dx.doi.org/10.1787/agr-outl-data-e
1 2 http://dx.doi.org/10.1787/888933
0
100
200
300
400
500
600
700
800
1994
1999
2004
2009
2014
2019
2024
1994
1999
2004
2009
2014
2019
2024
1994
1999
2004
2009
2014
2019
Coarse grains Wheat Rice
USD/t
Nominal price Real price
OECD-FAO AGRICULTURAL OUTLOOK 2015 © OECD/FAO 2015 113
3. COMMODITY SNAPSHOTS
OILSEEDS AND OILSEED PRODUCTS
Market situation
Global oilseeds production in the 2014 marketing year (see glossary for a definition of
marketing year) reached record levels for the second year in a row. Thus, oilseed prices
have fallen considerably and remain under pressure. At the same time soybean production
increased faster than production of rapeseed, sunflower and groundnuts (the other
included oilseeds), increasing the sector’s concentration.
Vegetable oil production did not increase commensurate with oilseeds production due
to a slower expansion of palm oil and the increasing share of soybeans, which have
considerably lower oil content than other main oilseeds. On the other hand, demand
growth has slowed in recent times due to stagnating biodiesel production from vegetable
oils in developed countries. This has resulted in low vegetable oil prices. Current low prices
are expected to result in increasing food demand in the near future.
Continuously growing demand for protein meal has been the main driver behind the
expansion of oilseed production in recent years. This has increased the share of protein
meal in the value of oilseeds and favoured soybeans over other oilseeds. Compared with
coarse grains and other feed ingredients, protein meal prices have stayed relatively high;
but a correction might be expected during 2015.
Projection highlights
In nominal terms all oilseeds and oilseed product prices are projected to increase less
than the assumed inflation rate over the outlook period. Resulting real prices will decline
slightly, based on the assumption of further efficiency gains in the sector which enables it
to satisfy the growing global demand at real prices below the current level. The price
relationships within the sector will shift slightly. Due to saturation in per capita food
demand in many emerging economies and reduced growth in biodiesel production from
vegetable oils, real vegetable oil prices will decline faster than real protein meal prices.
During the outlook period, global oilseeds production is expected to continue its
expansion, yet at a growth rate of 1.6% p.a. it will fall short of the 3.5% p.a. experienced
during the last decade. Production of rapeseed in Canada and the European Union is
expected to grow much slower than in the previous decade as high oil-containing oilseeds
like rapeseed are more affected by the slower growth in vegetable oil prices.
International oilseeds trade accounts for a consistently high share of global
production of around 31% during the next decade. The main flow continues from the
Americas (United States and Brazil) to Asia (mainly China). Globally, crushing of oilseeds
into meal (cake) and oil dominates the use of oilseeds; direct food use is significant only in
a few Asian countries. By 2024 more than 87% of the world oilseed production will be
crushed.
Vegetable oil includes the oil from crushing oilseeds (around 53%), palm (36%), palm
kernel, coconut and cottonseed. World vegetable oil production will remain concentrated
among a few countries in the coming decade. Despite a slowdown in area expansion,
significant growth still occurs in the main palm oil producing regions of Indonesia and
OECD-FAO AGRICULTURAL OUTLOOK 2015 © OECD/FAO 2015114
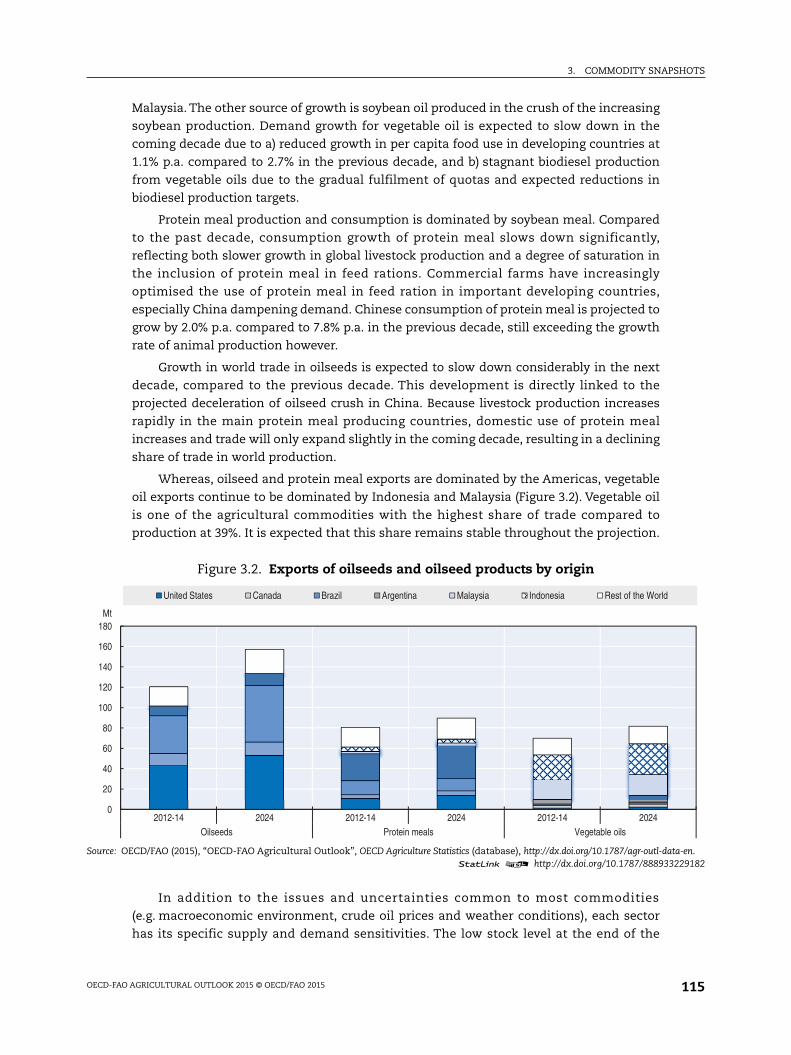
3. COMMODITY SNAPSHOTS
ta-en.229182
Malaysia. The other source of growth is soybean oil produced in the crush of the increasing
soybean production. Demand growth for vegetable oil is expected to slow down in the
coming decade due to a) reduced growth in per capita food use in developing countries at
1.1% p.a. compared to 2.7% in the previous decade, and b) stagnant biodiesel production
from vegetable oils due to the gradual fulfilment of quotas and expected reductions in
biodiesel production targets.
Protein meal production and consumption is dominated by soybean meal. Compared
to the past decade, consumption growth of protein meal slows down significantly,
reflecting both slower growth in global livestock production and a degree of saturation in
the inclusion of protein meal in feed rations. Commercial farms have increasingly
optimised the use of protein meal in feed ration in important developing countries,
especially China dampening demand. Chinese consumption of protein meal is projected to
grow by 2.0% p.a. compared to 7.8% p.a. in the previous decade, still exceeding the growth
rate of animal production however.
Growth in world trade in oilseeds is expected to slow down considerably in the next
decade, compared to the previous decade. This development is directly linked to the
projected deceleration of oilseed crush in China. Because livestock production increases
rapidly in the main protein meal producing countries, domestic use of protein meal
increases and trade will only expand slightly in the coming decade, resulting in a declining
share of trade in world production.
Whereas, oilseed and protein meal exports are dominated by the Americas, vegetable
oil exports continue to be dominated by Indonesia and Malaysia (Figure 3.2). Vegetable oil
is one of the agricultural commodities with the highest share of trade compared to
production at 39%. It is expected that this share remains stable throughout the projection.
In addition to the issues and uncertainties common to most commodities
(e.g. macroeconomic environment, crude oil prices and weather conditions), each sector
has its specific supply and demand sensitivities. The low stock level at the end of the
Figure 3.2. Exports of oilseeds and oilseed products by origin
Source: OECD/FAO (2015), “OECD-FAO Agricultural Outlook”, OECD Agriculture Statistics (database), http://dx.doi.org/10.1787/agr-outl-da1 2 http://dx.doi.org/10.1787/888933
0
20
40
60
80
100
120
140
160
180
2012-14 2024 2012-14 2024 2012-14 2024Oilseeds Protein meals Vegetable oils
Mt
United States Canada Brazil Argentina Malaysia Indonesia Rest of the World
OECD-FAO AGRICULTURAL OUTLOOK 2015 © OECD/FAO 2015 115
3. COMMODITY SNAPSHOTS
outlook period is a source of uncertainty for the stability of prices, for example, if the sector
is affected by adverse weather events. Biofuel policies in the United States, European Union
and Indonesia are a source of major uncertainties in the vegetable oil sector, because they
have an impact on a large share of the demand in these countries.
The expanded oilseed chapter is available athttp://dx.doi.org/10.1787/agr_outlook-2015-08-en
OECD-FAO AGRICULTURAL OUTLOOK 2015 © OECD/FAO 2015116
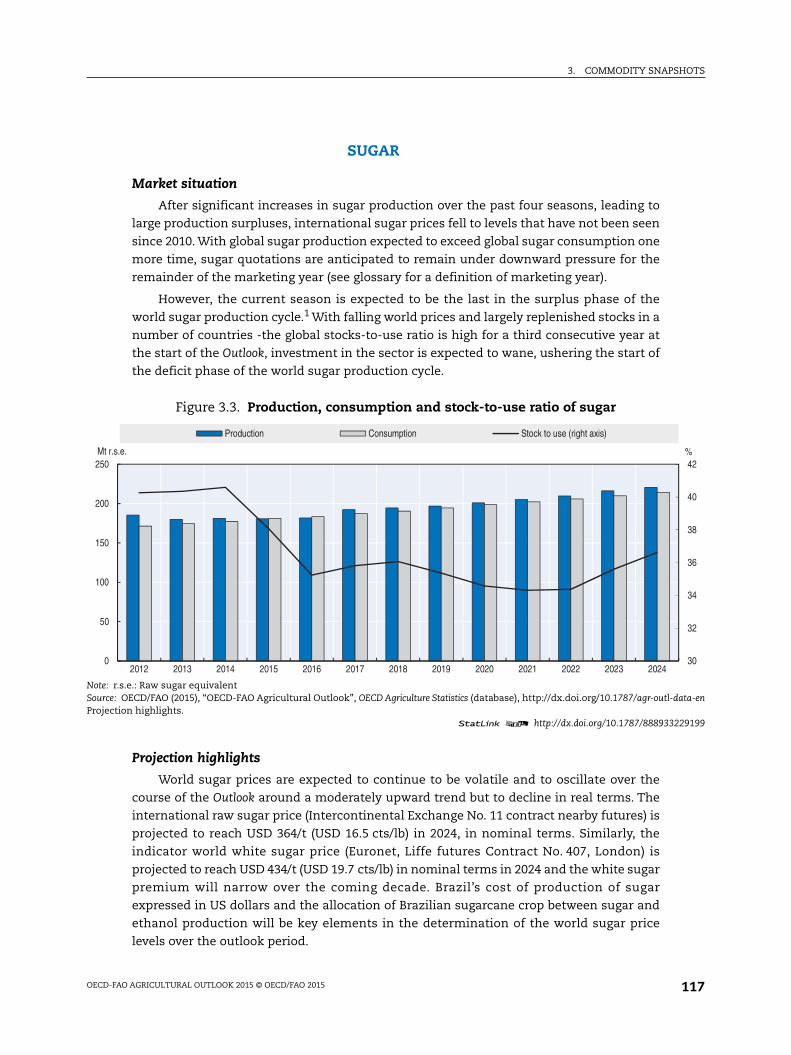
3. COMMODITY SNAPSHOTS
data-en
229199
30
32
34
36
38
40
42%
SUGAR
Market situation
After significant increases in sugar production over the past four seasons, leading to
large production surpluses, international sugar prices fell to levels that have not been seen
since 2010. With global sugar production expected to exceed global sugar consumption one
more time, sugar quotations are anticipated to remain under downward pressure for the
remainder of the marketing year (see glossary for a definition of marketing year).
However, the current season is expected to be the last in the surplus phase of the
world sugar production cycle.1 With falling world prices and largely replenished stocks in a
number of countries -the global stocks-to-use ratio is high for a third consecutive year at
the start of the Outlook, investment in the sector is expected to wane, ushering the start of
the deficit phase of the world sugar production cycle.
Projection highlights
World sugar prices are expected to continue to be volatile and to oscillate over the
course of the Outlook around a moderately upward trend but to decline in real terms. The
international raw sugar price (Intercontinental Exchange No. 11 contract nearby futures) is
projected to reach USD 364/t (USD 16.5 cts/lb) in 2024, in nominal terms. Similarly, the
indicator world white sugar price (Euronet, Liffe futures Contract No. 407, London) is
projected to reach USD 434/t (USD 19.7 cts/lb) in nominal terms in 2024 and the white sugar
premium will narrow over the coming decade. Brazil’s cost of production of sugar
expressed in US dollars and the allocation of Brazilian sugarcane crop between sugar and
ethanol production will be key elements in the determination of the world sugar price
levels over the outlook period.
Figure 3.3. Production, consumption and stock-to-use ratio of sugar
Note: r.s.e.: Raw sugar equivalentSource: OECD/FAO (2015), “OECD-FAO Agricultural Outlook”, OECD Agriculture Statistics (database), http://dx.doi.org/10.1787/agr-outl-Projection highlights.
1 2 http://dx.doi.org/10.1787/888933
0
50
100
150
200
250
2012 2013 2014 2015 2016 2017 2018 2019 2020 2021 2022 2023 2024
Mt r.s.e.
Production Consumption Stock to use (right axis)
OECD-FAO AGRICULTURAL OUTLOOK 2015 © OECD/FAO 2015 117
3. COMMODITY SNAPSHOTS
Based on normal weather conditions and the set of macroeconomic expectations
assumed, global sugar production is projected to increase by 2.2% p.a. in the coming
decade to reach nearly 220 Mt by 2024, an increase of around 38 Mt over the base period
(2012-14).2 Most of the additional production will originate in countries producing
sugarcane rather than sugar beet, and is more attributed to area expansion notably in
Brazil, even though yield improvements are foreseen for sugar crops and sugar processing.
A higher share of the world’s sugarcane production will be devoted to producing ethanol,
rising from about 20% during the base period to 26% in 2024.
Sustained by a steady growth in sugar demand, global consumption of sugar is
projected to grow at around 2% p.a., slightly higher than in the previous decade, to reach
214 Mt in 2024. World sugar demand growth will occur mainly in some developing
countries in Africa and Asia. In contrast, sugar consumption is projected to show little, or
no growth, in many of the developed countries consistent with their status as mature or
saturated sugar markets. As a result, the global stock-to-use ratio is expected to decrease
and average at 36% on the outlook period, compared to 40% during the base period.
Over the coming decade, exports are expected to remain highly concentrated, with
Brazil keeping its position as the world’s leading exporter (around 40%) and Thailand
boosting its market share. Imports, on the other hand, will remain more diversified.
Depending on its level of sugar production, India will continue to face large imports or
exports. The share of sugar that is traded relative to global sugar production should
increase slightly to reach 33% in 2024 with growing domestic production helping to support
growing consumption in developing countries.
On the medium term, alternative sweeteners, in particular high fructose corn syrup,
are set to compete further with sugar in the sweetener market. However, sugar’s share of
the global sweeteners market will continue to account for about 80% of the total.
The projections in this Outlook are based on the assumption that sugar prices will be
sufficiently attractive in the short term to encourage new investments in producing
countries, both at the farm and processing level. Any shocks, such as changes in sugar
policies originating from the major producing countries, economic situation, oil price
(especially for highly mechanised producers and processors), exchange rates or weather
conditions could impact the results of this Outlook, with consequences for producers and
consumers.
The expanded sugar chapter is available athttp://dx.doi.org/10.1787/agr_outlook-2015-09-en
OECD-FAO AGRICULTURAL OUTLOOK 2015 © OECD/FAO 2015118
3. COMMODITY SNAPSHOTS
MEAT
Market situation
Meat prices reached record levels in 2014, driven mainly by an increasing beef price. At the
same time, the Porcine Epidemic Diarrhoea virus (PEDv) in the United States and African swine
fever in Europe, lowered pigmeat supply in 2014 pushing pigmeat prices upwards. Sheepmeat
prices also increased in 2014 following several years of flock reduction in New Zealand,
induced by the conversion of sheep farms to more profitable dairy operations and accentuated
by drought conditions whilst substitutability among the various meats ensured firm demand
and strong poultry prices.
After several years of cow herd liquidation in major producing regions, the United States
bovine sector in particular started a cattle herd rebuilding phase in 2014 that sent beef prices
higher. Although herd rebuilding is expected to support beef prices in the short term, the
effects of PEDv are abating and hence the price of pork and poultry should follow lower feed
grain prices. Sheep meat prices remain high along with other meats, supported by higher
import demand, particularly from China for mutton and the EU for lamb, combined with flock
rebuilding in Australia
Projection highlights
The Outlook for the meat market remains largely positive, with feed grain prices set to
remain low for the projection period restoring profitability in a sector that had been operating
in an environment of particularly high and volatile feed costs over most of the past decade.
Production is projected to expand, as a result of increased profitability, particularly in the
pigmeat and poultry sectors, as well as in regions such as the Americas where feed grains are
used intensively to produce meat. However, this year’s Outlook is projecting weaker economic
growth for both developed and developing countries, somewhat limiting consumption growth.
Nominal meat prices are expected to remain high throughout the outlook period,
although below 2014 levels with the exception of beef which is expected to remain high for
another two years, as herds are rebuilt in several parts of the world. By 2024, prices for beef and
pigmeat are projected to increase to around USD 4 900/t carcass weight equivalent (c.w.e.) and
USD 1 900/t c.w.e. respectively, while world sheep meat and poultry prices are expected to rise
to around USD 4 350/t c.w.e. and USD 1 550/t c.w.e. respectively. In real terms meat prices are
expected to trend down from their latest high levels, although they will remain higher than in
the previous decade (Figure 3.4).
Global meat production rose by almost 20% over the last decade, led by growth in poultry
and pigmeat. Over the next decade, global meat production will expand at a slower rate, and in
2024 will be 17% higher than the base period (2012-14). Developing countries are projected to
account for the vast majority of the total increase through a more intensive use of protein meal
in feed rations in the region. Poultry meat will capture more than half of the additional meat
produced globally by 2024, compared to the base period. In general production will also benefit
from both improved meat-to-feed price margins as well as better feed conversion ratios in the
next decade.
Global annual meat consumption per capita is expected to reach 35.5 kg retail weight
equivalent (r.w.e.) by 2024, an increase of 1.6 kg r.w.e. compared to the base period. This
OECD-FAO AGRICULTURAL OUTLOOK 2015 © OECD/FAO 2015 119
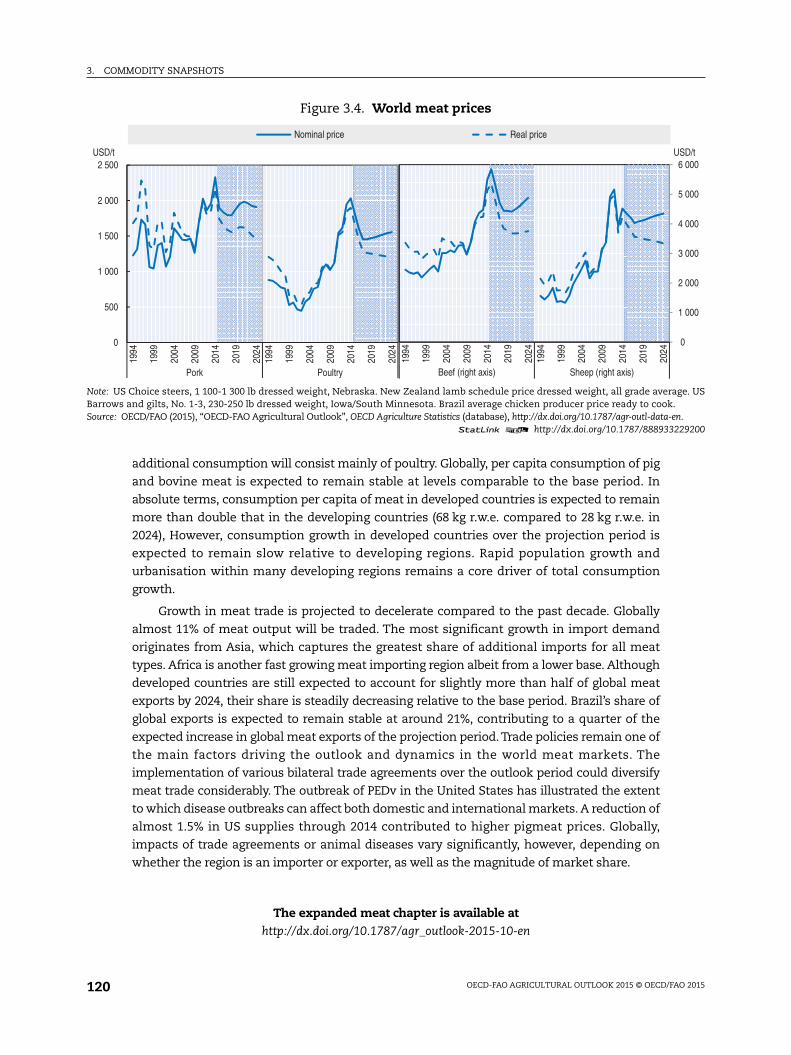
3. COMMODITY SNAPSHOTS
age. US.n.229200
0
1 000
2 000
3 000
4 000
5 000
6 000USD/t
additional consumption will consist mainly of poultry. Globally, per capita consumption of pig
and bovine meat is expected to remain stable at levels comparable to the base period. In
absolute terms, consumption per capita of meat in developed countries is expected to remain
more than double that in the developing countries (68 kg r.w.e. compared to 28 kg r.w.e. in
2024), However, consumption growth in developed countries over the projection period is
expected to remain slow relative to developing regions. Rapid population growth and
urbanisation within many developing regions remains a core driver of total consumption
growth.
Growth in meat trade is projected to decelerate compared to the past decade. Globally
almost 11% of meat output will be traded. The most significant growth in import demand
originates from Asia, which captures the greatest share of additional imports for all meat
types. Africa is another fast growing meat importing region albeit from a lower base. Although
developed countries are still expected to account for slightly more than half of global meat
exports by 2024, their share is steadily decreasing relative to the base period. Brazil’s share of
global exports is expected to remain stable at around 21%, contributing to a quarter of the
expected increase in global meat exports of the projection period. Trade policies remain one of
the main factors driving the outlook and dynamics in the world meat markets. The
implementation of various bilateral trade agreements over the outlook period could diversify
meat trade considerably. The outbreak of PEDv in the United States has illustrated the extent
to which disease outbreaks can affect both domestic and international markets. A reduction of
almost 1.5% in US supplies through 2014 contributed to higher pigmeat prices. Globally,
impacts of trade agreements or animal diseases vary significantly, however, depending on
whether the region is an importer or exporter, as well as the magnitude of market share.
The expanded meat chapter is available athttp://dx.doi.org/10.1787/agr_outlook-2015-10-en
Figure 3.4. World meat prices
Note: US Choice steers, 1 100-1 300 lb dressed weight, Nebraska. New Zealand lamb schedule price dressed weight, all grade averBarrows and gilts, No. 1-3, 230-250 lb dressed weight, Iowa/South Minnesota. Brazil average chicken producer price ready to cookSource: OECD/FAO (2015), “OECD-FAO Agricultural Outlook”, OECD Agriculture Statistics (database), http://dx.doi.org/10.1787/agr-outl-data-e
1 2 http://dx.doi.org/10.1787/888933
0
500
1 000
1 500
2 000
2 500
1994
1999
2004
2009
2014
2019
2024
1994
1999
2004
2009
2014
2019
2024
Pork Poultry
USD/t
Nominal price Real price
1994
1999
2004
2009
2014
2019
2024
1994
1999
2004
2009
2014
2019
2024
Beef (right axis) Sheep (right axis)
OECD-FAO AGRICULTURAL OUTLOOK 2015 © OECD/FAO 2015120
3. COMMODITY SNAPSHOTS
DAIRY
Market situation
Chinese milk production declined by 5.7% in 2013 leading to strong import demand for
dairy products and to higher world prices. Additionally, during the first half of 2013, major
players on the world dairy market – the United States, the European Union, New Zealand
and Australia – produced less milk than a year ago. The main reasons were high feed cost
and adverse weather conditions in Oceania and parts of Europe. Prices for skim milk
powder (SMP) and whole milk powder (WMP) reached a new peak in April 2013, above the
2007-08 commodity boom level.
Production in the major dairy exporting countries started to increase in mid-2013, as
feed prices declined and milk margins improved. Nevertheless, due to continued strong
demand on the world market, dairy prices remained high into early 2014.
Prices of dairy products started declining in the beginning of 2014. This price decline
accelerated in August with China’s declining demand for WMP and the Russian
Federation’s import ban, for among other products, cheeses from the European Union, the
United States, Australia and other origins. Since late 2014, the EU production is less
dynamic especially because of binding milk quotas until March 2015, while the seasonal
decline in Oceania is stronger than a year ago. On the other hand, the devaluation of the
Euro makes EU exports more competitive and results in increasing EU exports of dairy
products, and US milk production remains considerably above the year ago level.
Projection highlights
International prices of several dairy products declined in 2014 following new highs
attained in 2013. Nominal prices over the medium term are expected to firm. Real prices
are projected to decline slightly in the next decade, albeit remaining considerably above
the pre-2007 levels.
World milk production is projected to increase by 175 Mt (23%) by 2024 when
compared to the base years (2012-14), the majority of which (75%) is anticipated to come
from developing countries, especially from Asia. The growth rate for milk production over
the projection period is expected to average 1.8% p.a. which is below the 1.9% p.a.
witnessed in the last decade. Dairy cow numbers are expected to decline in developed
countries, whereas herd expansion in developing countries is projected to slow down. In
terms of yield per dairy cow, faster increases are expected than in the previous decade,
mainly in developing countries.
Production growth of the main dairy products (butter, cheese, SMP and WMP) is
increasing at the world level at similar pace as milk production. Resulting in a slightly
faster increase in the production of fresh dairy products especially in developing countries
by 3.0% p.a. where the majority of consumption is in the form of milk or other fresh dairy
products.
Per capita consumption of dairy products in developing countries is expected to
increase by 1.4% to 2.0% p.a. The expansion in demand reflects continuing albeit more
modest income growth and further globalisation of diets. By contrast, per capita
consumption in the developed world, reflecting the already relatively high per capita
OECD-FAO AGRICULTURAL OUTLOOK 2015 © OECD/FAO 2015 121
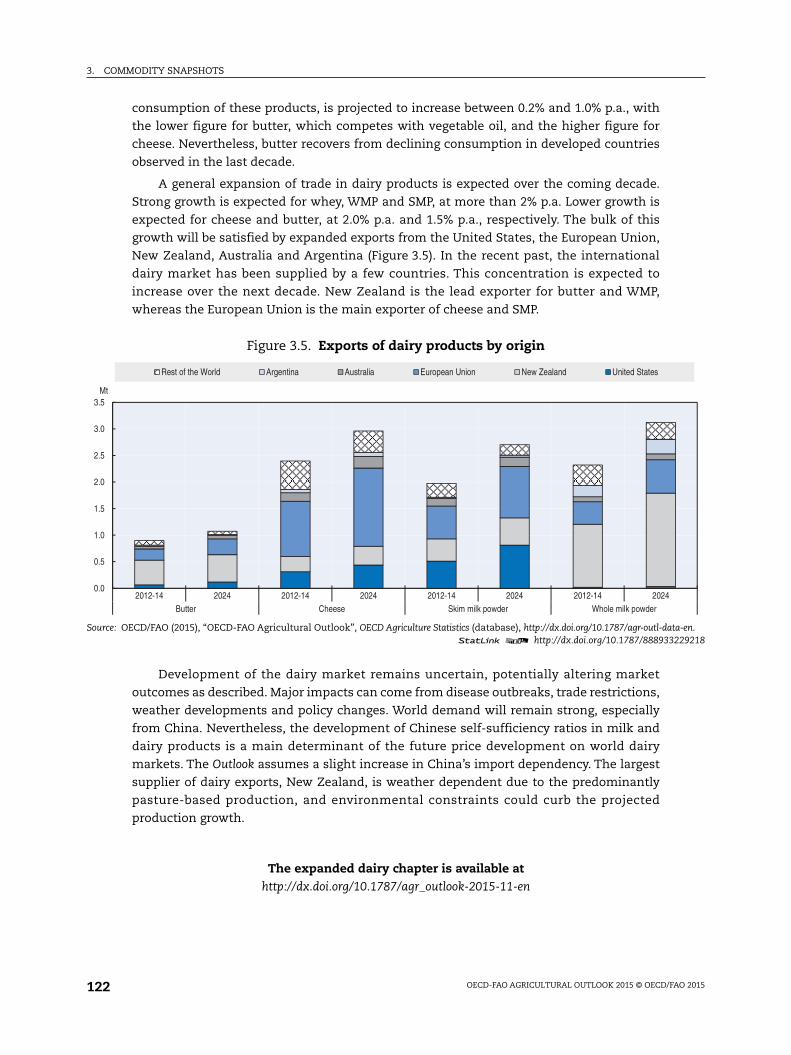
3. COMMODITY SNAPSHOTS
ta-en.229218
consumption of these products, is projected to increase between 0.2% and 1.0% p.a., with
the lower figure for butter, which competes with vegetable oil, and the higher figure for
cheese. Nevertheless, butter recovers from declining consumption in developed countries
observed in the last decade.
A general expansion of trade in dairy products is expected over the coming decade.
Strong growth is expected for whey, WMP and SMP, at more than 2% p.a. Lower growth is
expected for cheese and butter, at 2.0% p.a. and 1.5% p.a., respectively. The bulk of this
growth will be satisfied by expanded exports from the United States, the European Union,
New Zealand, Australia and Argentina (Figure 3.5). In the recent past, the international
dairy market has been supplied by a few countries. This concentration is expected to
increase over the next decade. New Zealand is the lead exporter for butter and WMP,
whereas the European Union is the main exporter of cheese and SMP.
Development of the dairy market remains uncertain, potentially altering market
outcomes as described. Major impacts can come from disease outbreaks, trade restrictions,
weather developments and policy changes. World demand will remain strong, especially
from China. Nevertheless, the development of Chinese self-sufficiency ratios in milk and
dairy products is a main determinant of the future price development on world dairy
markets. The Outlook assumes a slight increase in China’s import dependency. The largest
supplier of dairy exports, New Zealand, is weather dependent due to the predominantly
pasture-based production, and environmental constraints could curb the projected
production growth.
The expanded dairy chapter is available athttp://dx.doi.org/10.1787/agr_outlook-2015-11-en
Figure 3.5. Exports of dairy products by origin
Source: OECD/FAO (2015), “OECD-FAO Agricultural Outlook”, OECD Agriculture Statistics (database), http://dx.doi.org/10.1787/agr-outl-da1 2 http://dx.doi.org/10.1787/888933
0.0
0.5
1.0
1.5
2.0
2.5
3.0
3.5
2012-14 2024 2012-14 2024 2012-14 2024 2012-14 2024Butter Cheese Skim milk powder Whole milk powder
Mt
Rest of the World Argentina Australia European Union New Zealand United States
OECD-FAO AGRICULTURAL OUTLOOK 2015 © OECD/FAO 2015122
3. COMMODITY SNAPSHOTS
FISH
Market situation
The market prospects for fish continue to be positive. The year 2014 was characterised
by historical peaks in production, trade and consumption, only slightly affected by events
such as the Russian Federation’s import ban and reduced catches in South America.
Apparent per capita fish consumption is estimated to have reached about 20 kg in
2014, with aquaculture overtaking capture fisheries as the main source of fish for human
consumption for the first time.
Developing countries, in particular in Asia, will continue to drive major changes and
expansion in global fishery production, trade and consumption, being the main producers,
exporters and growing consumers. However, in 2014, trade increased faster in developed
countries than in developing countries. This is counter to the long-term trend, which has
seen developing countries, particularly in South America and South and East Asia, steadily
increase their proportion of world trade in fishery products. The major factors behind this
reversal were booming growth in the United States market and a record-breaking year for
key producer and exporter Norway.
Fish prices grew sharply during the first part of 2014 and weakened during the rest of
the year due to softening consumer demand in many European markets and Japan, and
improving supply situation of certain fishery species. However, fish prices remained above
2013 levels for most species and products, in particular for farmed species. The FAO Fish
Price Index (base 2002-04 = 100) indicates that prices are at record heights reaching a peak
in March 2014 (at 164, with aquaculture species at 168).
Projection highlights
The main drivers affecting world fish prices for capture, aquaculture and traded
products will be income and population growth, limited increase in capture fisheries
production, high meat prices in the short term, and feed prices. All these factors will
contribute to high fish prices in the near future followed by a decline in the remaining
years of this decade and an increase in the 2020s. In real terms, prices are expected to
decline from the record high of 2014. The aquaculture to coarse grains price ratio is
expected to be cyclical over 2015-24 and to eventually stabilise slightly lower than the
historical average (1990-2014). The price ratio between aquaculture and fishmeal will
remain relatively stable. Since the feed demand for fishmeal from aquaculture and
livestock sectors is growing faster than supply, an increase in the fishmeal to oilseed meal
price ratio is expected. The popularity of the Omega-3 fatty acids in human diets and the
growth in aquaculture production have both contributed to a rise in the fish oil to oilseed
price ratio since 2012, which is expected to be maintained over the medium term. However,
since fish oil and oilseed oil prices are starting from very high levels, a decline is expected
in nominal terms for the rest of this decade.
Fisheries production worldwide is projected to expand by 19% between the 2012-14
base period and 2024, to reach 191 Mt. The main driver of this increase will be aquaculture,
which is expected to reach 96 Mt by 2024, 38% higher than the base period (average 2012-14)
level. Aquaculture will remain one of the fastest growing food sectors, notwithstanding a
OECD-FAO AGRICULTURAL OUTLOOK 2015 © OECD/FAO 2015 123
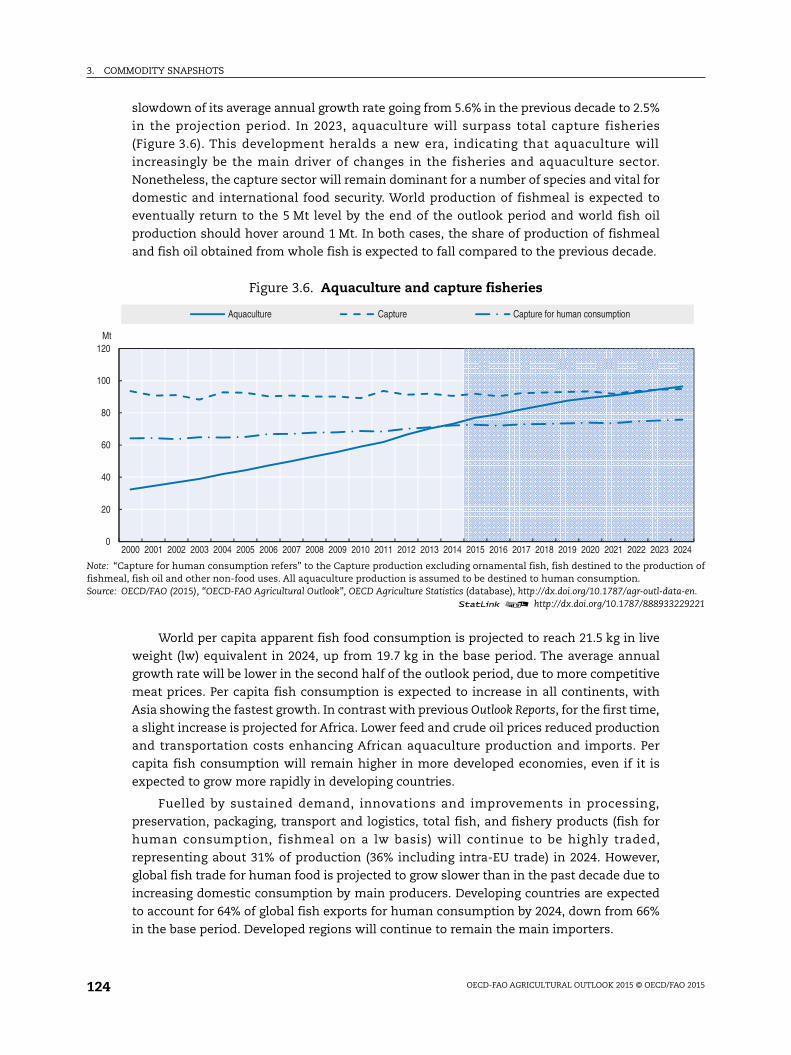
3. COMMODITY SNAPSHOTS
tion of
ta-en.229221
2024
slowdown of its average annual growth rate going from 5.6% in the previous decade to 2.5%
in the projection period. In 2023, aquaculture will surpass total capture fisheries
(Figure 3.6). This development heralds a new era, indicating that aquaculture will
increasingly be the main driver of changes in the fisheries and aquaculture sector.
Nonetheless, the capture sector will remain dominant for a number of species and vital for
domestic and international food security. World production of fishmeal is expected to
eventually return to the 5 Mt level by the end of the outlook period and world fish oil
production should hover around 1 Mt. In both cases, the share of production of fishmeal
and fish oil obtained from whole fish is expected to fall compared to the previous decade.
World per capita apparent fish food consumption is projected to reach 21.5 kg in live
weight (lw) equivalent in 2024, up from 19.7 kg in the base period. The average annual
growth rate will be lower in the second half of the outlook period, due to more competitive
meat prices. Per capita fish consumption is expected to increase in all continents, with
Asia showing the fastest growth. In contrast with previous Outlook Reports, for the first time,
a slight increase is projected for Africa. Lower feed and crude oil prices reduced production
and transportation costs enhancing African aquaculture production and imports. Per
capita fish consumption will remain higher in more developed economies, even if it is
expected to grow more rapidly in developing countries.
Fuelled by sustained demand, innovations and improvements in processing,
preservation, packaging, transport and logistics, total fish, and fishery products (fish for
human consumption, fishmeal on a lw basis) will continue to be highly traded,
representing about 31% of production (36% including intra-EU trade) in 2024. However,
global fish trade for human food is projected to grow slower than in the past decade due to
increasing domestic consumption by main producers. Developing countries are expected
to account for 64% of global fish exports for human consumption by 2024, down from 66%
in the base period. Developed regions will continue to remain the main importers.
Figure 3.6. Aquaculture and capture fisheries
Note: “Capture for human consumption refers” to the Capture production excluding ornamental fish, fish destined to the producfishmeal, fish oil and other non-food uses. All aquaculture production is assumed to be destined to human consumption.Source: OECD/FAO (2015), “OECD-FAO Agricultural Outlook”, OECD Agriculture Statistics (database), http://dx.doi.org/10.1787/agr-outl-da
1 2 http://dx.doi.org/10.1787/888933
0
20
40
60
80
100
120
2000 2001 2002 2003 2004 2005 2006 2007 2008 2009 2010 2011 2012 2013 2014 2015 2016 2017 2018 2019 2020 2021 2022 2023
Mt
Aquaculture Capture Capture for human consumption
OECD-FAO AGRICULTURAL OUTLOOK 2015 © OECD/FAO 2015124
3. COMMODITY SNAPSHOTS
The key uncertainty for the fish projections remains the productivity gains in
aquaculture, which might be affected by several factors, including availability and
accessibility to land, water, financial resources, improvement in technology, feeds, etc. In
addition, animal disease outbreaks have shown to the potential to affect aquaculture
production and subsequently domestic and international markets depending on the size
and the species involved. Natural productivity of fish stocks and ecosystem and the
occurrence of El Niño are the key uncertainties impacting capture fisheries and also the
fishmeal and fish oil outlook. Trade policies, and in particular bilateral trade agreements,
remain an important factor influencing the dynamics of the world fish markets.
The expanded fish chapter is available athttp://dx.doi.org/10.1787/agr_outlook-2015-12-en
OECD-FAO AGRICULTURAL OUTLOOK 2015 © OECD/FAO 2015 125
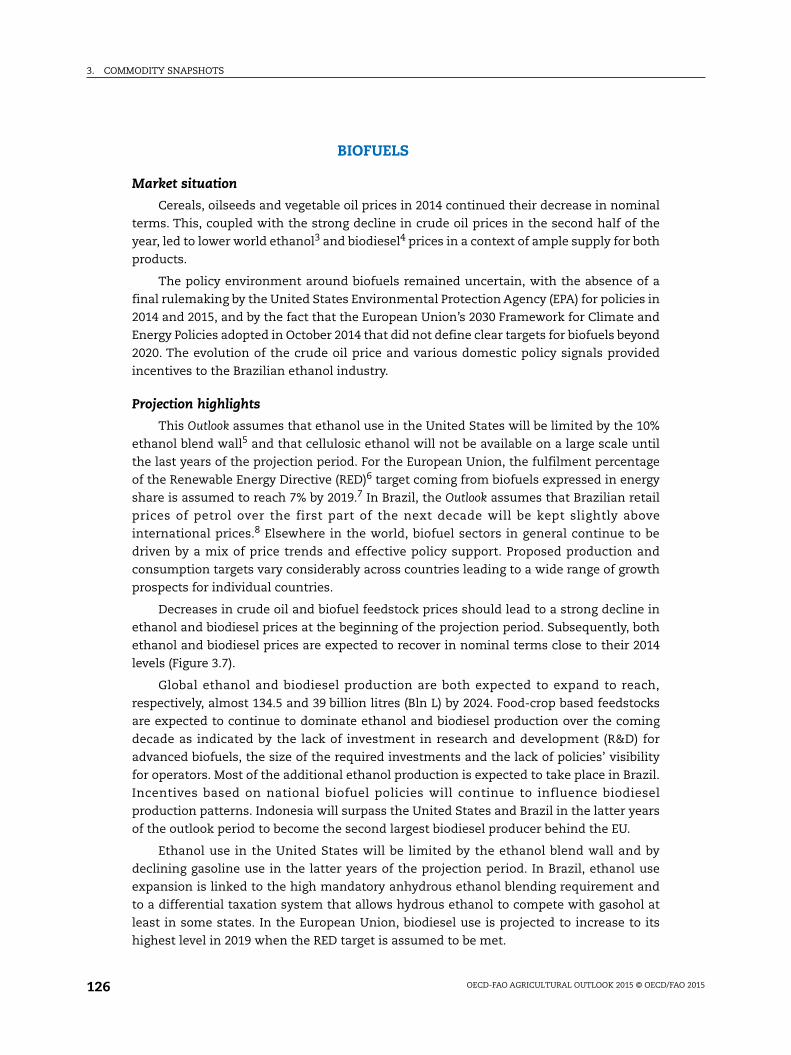
3. COMMODITY SNAPSHOTS
BIOFUELS
Market situation
Cereals, oilseeds and vegetable oil prices in 2014 continued their decrease in nominal
terms. This, coupled with the strong decline in crude oil prices in the second half of the
year, led to lower world ethanol3 and biodiesel4 prices in a context of ample supply for both
products.
The policy environment around biofuels remained uncertain, with the absence of a
final rulemaking by the United States Environmental Protection Agency (EPA) for policies in
2014 and 2015, and by the fact that the European Union’s 2030 Framework for Climate and
Energy Policies adopted in October 2014 that did not define clear targets for biofuels beyond
2020. The evolution of the crude oil price and various domestic policy signals provided
incentives to the Brazilian ethanol industry.
Projection highlights
This Outlook assumes that ethanol use in the United States will be limited by the 10%
ethanol blend wall5 and that cellulosic ethanol will not be available on a large scale until
the last years of the projection period. For the European Union, the fulfilment percentage
of the Renewable Energy Directive (RED)6 target coming from biofuels expressed in energy
share is assumed to reach 7% by 2019.7 In Brazil, the Outlook assumes that Brazilian retail
prices of petrol over the first part of the next decade will be kept slightly above
international prices.8 Elsewhere in the world, biofuel sectors in general continue to be
driven by a mix of price trends and effective policy support. Proposed production and
consumption targets vary considerably across countries leading to a wide range of growth
prospects for individual countries.
Decreases in crude oil and biofuel feedstock prices should lead to a strong decline in
ethanol and biodiesel prices at the beginning of the projection period. Subsequently, both
ethanol and biodiesel prices are expected to recover in nominal terms close to their 2014
levels (Figure 3.7).
Global ethanol and biodiesel production are both expected to expand to reach,
respectively, almost 134.5 and 39 billion litres (Bln L) by 2024. Food-crop based feedstocks
are expected to continue to dominate ethanol and biodiesel production over the coming
decade as indicated by the lack of investment in research and development (R&D) for
advanced biofuels, the size of the required investments and the lack of policies’ visibility
for operators. Most of the additional ethanol production is expected to take place in Brazil.
Incentives based on national biofuel policies will continue to influence biodiesel
production patterns. Indonesia will surpass the United States and Brazil in the latter years
of the outlook period to become the second largest biodiesel producer behind the EU.
Ethanol use in the United States will be limited by the ethanol blend wall and by
declining gasoline use in the latter years of the projection period. In Brazil, ethanol use
expansion is linked to the high mandatory anhydrous ethanol blending requirement and
to a differential taxation system that allows hydrous ethanol to compete with gasohol at
least in some states. In the European Union, biodiesel use is projected to increase to its
highest level in 2019 when the RED target is assumed to be met.
OECD-FAO AGRICULTURAL OUTLOOK 2015 © OECD/FAO 2015126
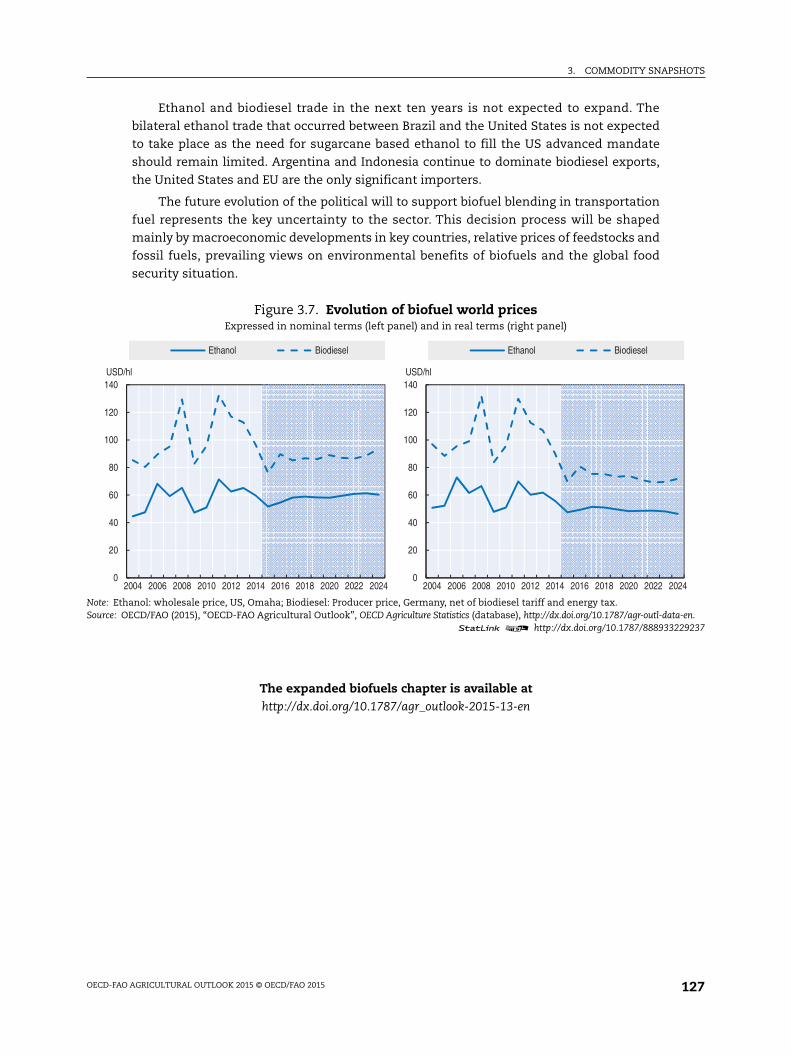
3. COMMODITY SNAPSHOTS
ta-en.229237
024
Ethanol and biodiesel trade in the next ten years is not expected to expand. The
bilateral ethanol trade that occurred between Brazil and the United States is not expected
to take place as the need for sugarcane based ethanol to fill the US advanced mandate
should remain limited. Argentina and Indonesia continue to dominate biodiesel exports,
the United States and EU are the only significant importers.
The future evolution of the political will to support biofuel blending in transportation
fuel represents the key uncertainty to the sector. This decision process will be shaped
mainly by macroeconomic developments in key countries, relative prices of feedstocks and
fossil fuels, prevailing views on environmental benefits of biofuels and the global food
security situation.
The expanded biofuels chapter is available athttp://dx.doi.org/10.1787/agr_outlook-2015-13-en
Figure 3.7. Evolution of biofuel world pricesExpressed in nominal terms (left panel) and in real terms (right panel)
Note: Ethanol: wholesale price, US, Omaha; Biodiesel: Producer price, Germany, net of biodiesel tariff and energy tax.Source: OECD/FAO (2015), “OECD-FAO Agricultural Outlook”, OECD Agriculture Statistics (database), http://dx.doi.org/10.1787/agr-outl-da
1 2 http://dx.doi.org/10.1787/888933
0
20
40
60
80
100
120
140
2004 2006 2008 2010 2012 2014 2016 2018 2020 2022 2024
USD/hl
Ethanol Biodiesel
0
20
40
60
80
100
120
140
2004 2006 2008 2010 2012 2014 2016 2018 2020 2022 2
USD/hl
Ethanol Biodiesel
OECD-FAO AGRICULTURAL OUTLOOK 2015 © OECD/FAO 2015 127
3. COMMODITY SNAPSHOTS
COTTON
Market situation
The world cotton market in 2014 was affected by policy changes in China, which
reduced the amount of support offered to farmers. This policy change lowered the gap
between domestic and international cotton prices introduced in 2011. Falling domestic
prices increased mill consumption after several seasons of decline, and a reduction in import
quotas sharply reduced China's demand for cotton from the rest of the world.
Global cotton production has decreased and consumption increased over the last few
years, but the international market has yet to equilibrate. Global production at 25.8 Mt in
2014 exceeds consumption and global cotton stock rose for the fifth consecutive year as the
stocks-to-use ratio climbed to 86%. The United States and Pakistan increased production in
2014, but falling international prices in the beginning of 2014 resulted in lower production in
southern hemisphere countries such as Brazil and Australia. Global mill consumption
continued to rebound in 2014. Except for Brazil, major cotton mill users, namely China, India,
Pakistan, Turkey, Bangladesh, the United States and Indonesia increased consumption.
Global cotton imports declined for the second consecutive season to 7.6 Mt, with China,
Indonesia and Turkey reducing imports. Policy changes in China and lower import demand
elsewhere caused cotton exports to decline. India’s exports also declined sharply, but as
harvested area expanded, India moved past China as the world’s largest cotton producer
in 2014.
Projection highlights
Relatively stable cotton prices are expected during 2015-24 as the volatility
surrounding the 2010 spike in cotton prices subsides. The shift from building stocks to
reducing them in China is one of the major factors behind a drop foreseen in world cotton
prices during the early years of the outlook period. By 2024, world cotton prices are
expected to be lower than in 2012-14 in both real and nominal terms. The world price in
2024 in real terms is expected to be 23% lower than in the base period (2012-14), and 9%
lower than its 2000-09 average.
World production is expected to grow more slowly than consumption during the first
years of the outlook period, reflecting the anticipated lower prices with the large global
stocks that accumulated between 2010 and 2015 influencing the market. The stock-to-use
ratio becomes 46% in 2024. World cotton area grows throughout the projection period, but
does not surpass the peaks seen in 2004 and 2011. Yields rise around the world, but global
average yield grows slowly as production switches from relatively high yielding countries,
like China, to relatively low-yielding ones in South Asia and Sub-Saharan Africa.
World cotton use is expected to grow at 1.8% p.a., a rate slightly above the long term
average of 1.7% during the last 20 years. In 2006 and 2007, world consumption reached a peak
of 26.5 Mt, and following significant declines during 2008-11 – and with a relatively slow
recovery – this peak is not likely to be surpassed again until 2017. World per capita
consumption of cotton increases, but the level in 2024 is nonetheless expected to remain below
historical peaks. China is expected to remain the largest consumer of cotton fibre, but its
consumption growth is expected to become lower than India’s and other growing consumers
OECD-FAO AGRICULTURAL OUTLOOK 2015 © OECD/FAO 2015128
3. COMMODITY SNAPSHOTS
ata-en.229240
2024
such as Bangladesh and Viet Nam. Consequently, China’s share of world consumption is
expected to stagnate (Figure 3.8). While reforms of China’s cotton support policy will help
sustain its share of world textile mill use of cotton, wage gains and demographic shifts are
significant factors limiting that share. India’s consumption is expected to rise by 39% over the
medium term, to make it the leading beneficiary of growing world consumption.
World trade rises at a rate above its long-term average in the Outlook, with exports in 2024
19% above those in the base period.The United States retains its position as the world’s largest
exporter accounting for 24% of world trade. India retains its position as the world’s second
largest source of cotton while increasing its global share from 18% in the base period to 20% by
2024. Brazil and least developed countries (LDCs) in Sub-Saharan Africa are also expected to
increase their export shares. China retains its position as the world’s largest import market for
cotton throughout the outlook period. Reflecting the rebound of its consumption, China’s
share of world trade is foreseen to increase to 39% in 2024. Bangladesh’s share rises more than
any other importer, up from 10% to 13%. Imports are also expected to increase inViet Nam and
Indonesia increasing their share of the international cotton market.
Important sources of uncertainty in the current Outlook are the level of consumer
demand and its relationship to industrial demand for cotton fibre, the largest among
natural fibres of vegetable or animal origin. Due to significant value-added in the
production of consumer products, and substantial opportunities to substitute synthetic
fibres for cotton, the relationship between consumer spending on clothing and the volume
of cotton consumed can vary significantly. China’s cotton policies and prospects for
productivity gains around the world are another source of uncertainty.
The expanded cotton chapter is available athttp://dx.doi.org/10.1787/agr_outlook-2015-14-en
Figure 3.8. Cotton consumption by major country
Source: OECD/FAO (2015), “OECD-FAO Agricultural Outlook”, OECD Agriculture Statistics (database), http://dx.doi.org/10.1787/agr-outl-d1 2 http://dx.doi.org/10.1787/888933
0
2
4
6
8
10
12
2004 2005 2006 2007 2008 2009 2010 2011 2012 2013 2014 2015 2016 2017 2018 2019 2020 2021 2022 2023
Mt
China India Pakistan Rest of the World
OECD-FAO AGRICULTURAL OUTLOOK 2015 © OECD/FAO 2015 129
3. COMMODITY SNAPSHOTS
Notes
1. In some key Asian producing countries such as India, contrary movements between administeredsugarcane and market determined sugar prices generate payment arrears by mills to sugarcanegrowers, leading to periods of surplus followed by periods of deficit.
2. See the glossary for the definition of the sugar crop year. The assumptions underlying the baselineprojections can be found in the Box on macroeconomic assumptions.
3. Wholesale price, United States, Omaha.
4. Producer price, Germany, net of biodiesel tariff and of energy tax.
5. The term blend wall refers to short run technical constraints that act as an impediment toincreased ethanol use. It is assumed in this Outlook that US cars will not be able to consumegasohol with more than 10% of ethanol mixed with petrol.
6. http://eur-lex.europa.eu/LexUriServ/LexUriServ.do?uri=OJ:L:2009:140:0016:0062:EN:PDF.
7. The remainder of the RED target will at least be partly filled by electric cars and other sources.
8. A description of the Brazilian ethanol industry and its link with the level of gasoline prices isprovided in Chapter 2.
OECD-FAO AGRICULTURAL OUTLOOK 2015 © OECD/FAO 2015130
ANNEX: COMMODITY SNAPSHOT TABLES
Annex: Commodity snapshot tables
OECD-FAO AGRICULTURAL OUTLOOK 2015 © OECD/FAO 2015 131
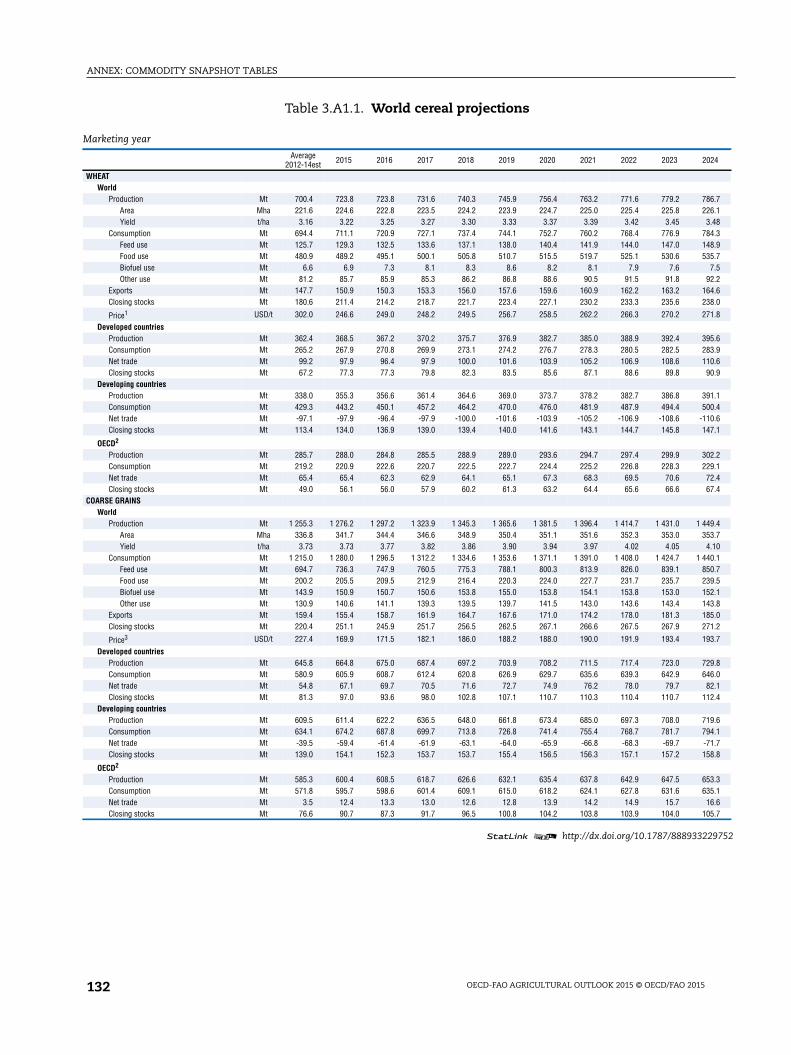
ANNEX: COMMODITY SNAPSHOT TABLES
Table 3.A1.1. World cereal projections
1 2 http://dx.doi.org/10.1787/888933229752
Marketing year
Average2012-14est 2015 2016 2017 2018 2019 2020 2021 2022 2023 2024
WHEATWorld
Production Mt 700.4 723.8 723.8 731.6 740.3 745.9 756.4 763.2 771.6 779.2 786.7Area Mha 221.6 224.6 222.8 223.5 224.2 223.9 224.7 225.0 225.4 225.8 226.1Yield t/ha 3.16 3.22 3.25 3.27 3.30 3.33 3.37 3.39 3.42 3.45 3.48
Consumption Mt 694.4 711.1 720.9 727.1 737.4 744.1 752.7 760.2 768.4 776.9 784.3Feed use Mt 125.7 129.3 132.5 133.6 137.1 138.0 140.4 141.9 144.0 147.0 148.9Food use Mt 480.9 489.2 495.1 500.1 505.8 510.7 515.5 519.7 525.1 530.6 535.7Biofuel use Mt 6.6 6.9 7.3 8.1 8.3 8.6 8.2 8.1 7.9 7.6 7.5Other use Mt 81.2 85.7 85.9 85.3 86.2 86.8 88.6 90.5 91.5 91.8 92.2
Exports Mt 147.7 150.9 150.3 153.3 156.0 157.6 159.6 160.9 162.2 163.2 164.6Closing stocks Mt 180.6 211.4 214.2 218.7 221.7 223.4 227.1 230.2 233.3 235.6 238.0
Price1 USD/t 302.0 246.6 249.0 248.2 249.5 256.7 258.5 262.2 266.3 270.2 271.8
Developed countriesProduction Mt 362.4 368.5 367.2 370.2 375.7 376.9 382.7 385.0 388.9 392.4 395.6Consumption Mt 265.2 267.9 270.8 269.9 273.1 274.2 276.7 278.3 280.5 282.5 283.9Net trade Mt 99.2 97.9 96.4 97.9 100.0 101.6 103.9 105.2 106.9 108.6 110.6Closing stocks Mt 67.2 77.3 77.3 79.8 82.3 83.5 85.6 87.1 88.6 89.8 90.9
Developing countriesProduction Mt 338.0 355.3 356.6 361.4 364.6 369.0 373.7 378.2 382.7 386.8 391.1Consumption Mt 429.3 443.2 450.1 457.2 464.2 470.0 476.0 481.9 487.9 494.4 500.4Net trade Mt -97.1 -97.9 -96.4 -97.9 -100.0 -101.6 -103.9 -105.2 -106.9 -108.6 -110.6Closing stocks Mt 113.4 134.0 136.9 139.0 139.4 140.0 141.6 143.1 144.7 145.8 147.1
OECD2
Production Mt 285.7 288.0 284.8 285.5 288.9 289.0 293.6 294.7 297.4 299.9 302.2Consumption Mt 219.2 220.9 222.6 220.7 222.5 222.7 224.4 225.2 226.8 228.3 229.1Net trade Mt 65.4 65.4 62.3 62.9 64.1 65.1 67.3 68.3 69.5 70.6 72.4Closing stocks Mt 49.0 56.1 56.0 57.9 60.2 61.3 63.2 64.4 65.6 66.6 67.4
COARSE GRAINSWorld
Production Mt 1 255.3 1 276.2 1 297.2 1 323.9 1 345.3 1 365.6 1 381.5 1 396.4 1 414.7 1 431.0 1 449.4Area Mha 336.8 341.7 344.4 346.6 348.9 350.4 351.1 351.6 352.3 353.0 353.7Yield t/ha 3.73 3.73 3.77 3.82 3.86 3.90 3.94 3.97 4.02 4.05 4.10
Consumption Mt 1 215.0 1 280.0 1 296.5 1 312.2 1 334.6 1 353.6 1 371.1 1 391.0 1 408.0 1 424.7 1 440.1Feed use Mt 694.7 736.3 747.9 760.5 775.3 788.1 800.3 813.9 826.0 839.1 850.7Food use Mt 200.2 205.5 209.5 212.9 216.4 220.3 224.0 227.7 231.7 235.7 239.5Biofuel use Mt 143.9 150.9 150.7 150.6 153.8 155.0 153.8 154.1 153.8 153.0 152.1Other use Mt 130.9 140.6 141.1 139.3 139.5 139.7 141.5 143.0 143.6 143.4 143.8
Exports Mt 159.4 155.4 158.7 161.9 164.7 167.6 171.0 174.2 178.0 181.3 185.0Closing stocks Mt 220.4 251.1 245.9 251.7 256.5 262.5 267.1 266.6 267.5 267.9 271.2
Price3 USD/t 227.4 169.9 171.5 182.1 186.0 188.2 188.0 190.0 191.9 193.4 193.7
Developed countriesProduction Mt 645.8 664.8 675.0 687.4 697.2 703.9 708.2 711.5 717.4 723.0 729.8Consumption Mt 580.9 605.9 608.7 612.4 620.8 626.9 629.7 635.6 639.3 642.9 646.0Net trade Mt 54.8 67.1 69.7 70.5 71.6 72.7 74.9 76.2 78.0 79.7 82.1Closing stocks Mt 81.3 97.0 93.6 98.0 102.8 107.1 110.7 110.3 110.4 110.7 112.4
Developing countriesProduction Mt 609.5 611.4 622.2 636.5 648.0 661.8 673.4 685.0 697.3 708.0 719.6Consumption Mt 634.1 674.2 687.8 699.7 713.8 726.8 741.4 755.4 768.7 781.7 794.1Net trade Mt -39.5 -59.4 -61.4 -61.9 -63.1 -64.0 -65.9 -66.8 -68.3 -69.7 -71.7Closing stocks Mt 139.0 154.1 152.3 153.7 153.7 155.4 156.5 156.3 157.1 157.2 158.8
OECD2
Production Mt 585.3 600.4 608.5 618.7 626.6 632.1 635.4 637.8 642.9 647.5 653.3Consumption Mt 571.8 595.7 598.6 601.4 609.1 615.0 618.2 624.1 627.8 631.6 635.1Net trade Mt 3.5 12.4 13.3 13.0 12.6 12.8 13.9 14.2 14.9 15.7 16.6Closing stocks Mt 76.6 90.7 87.3 91.7 96.5 100.8 104.2 103.8 103.9 104.0 105.7
OECD-FAO AGRICULTURAL OUTLOOK 2015 © OECD/FAO 2015132
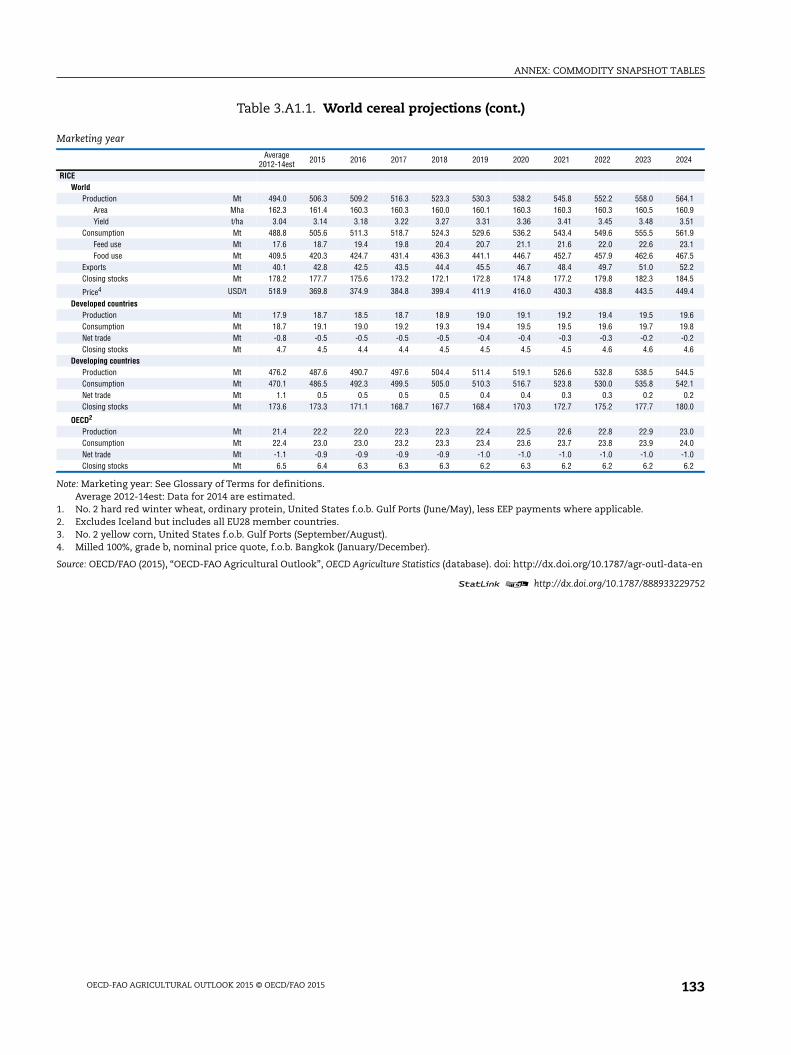
ANNEX: COMMODITY SNAPSHOT TABLES
Table 3.A1.1. World cereal projections (cont.)
1 2 http://dx.doi.org/10.1787/888933229752
Note: Marketing year: See Glossary of Terms for definitions.Average 2012-14est: Data for 2014 are estimated.
1. No. 2 hard red winter wheat, ordinary protein, United States f.o.b. Gulf Ports (June/May), less EEP payments where applicable.2. Excludes Iceland but includes all EU28 member countries.3. No. 2 yellow corn, United States f.o.b. Gulf Ports (September/August).4. Milled 100%, grade b, nominal price quote, f.o.b. Bangkok (January/December).
Source: OECD/FAO (2015), “OECD-FAO Agricultural Outlook”, OECD Agriculture Statistics (database). doi: http://dx.doi.org/10.1787/agr-outl-data-en
Marketing year
Average2012-14est 2015 2016 2017 2018 2019 2020 2021 2022 2023 2024
RICEWorld
Production Mt 494.0 506.3 509.2 516.3 523.3 530.3 538.2 545.8 552.2 558.0 564.1Area Mha 162.3 161.4 160.3 160.3 160.0 160.1 160.3 160.3 160.3 160.5 160.9Yield t/ha 3.04 3.14 3.18 3.22 3.27 3.31 3.36 3.41 3.45 3.48 3.51
Consumption Mt 488.8 505.6 511.3 518.7 524.3 529.6 536.2 543.4 549.6 555.5 561.9Feed use Mt 17.6 18.7 19.4 19.8 20.4 20.7 21.1 21.6 22.0 22.6 23.1Food use Mt 409.5 420.3 424.7 431.4 436.3 441.1 446.7 452.7 457.9 462.6 467.5
Exports Mt 40.1 42.8 42.5 43.5 44.4 45.5 46.7 48.4 49.7 51.0 52.2Closing stocks Mt 178.2 177.7 175.6 173.2 172.1 172.8 174.8 177.2 179.8 182.3 184.5
Price4 USD/t 518.9 369.8 374.9 384.8 399.4 411.9 416.0 430.3 438.8 443.5 449.4
Developed countriesProduction Mt 17.9 18.7 18.5 18.7 18.9 19.0 19.1 19.2 19.4 19.5 19.6Consumption Mt 18.7 19.1 19.0 19.2 19.3 19.4 19.5 19.5 19.6 19.7 19.8Net trade Mt -0.8 -0.5 -0.5 -0.5 -0.5 -0.4 -0.4 -0.3 -0.3 -0.2 -0.2Closing stocks Mt 4.7 4.5 4.4 4.4 4.5 4.5 4.5 4.5 4.6 4.6 4.6
Developing countriesProduction Mt 476.2 487.6 490.7 497.6 504.4 511.4 519.1 526.6 532.8 538.5 544.5Consumption Mt 470.1 486.5 492.3 499.5 505.0 510.3 516.7 523.8 530.0 535.8 542.1Net trade Mt 1.1 0.5 0.5 0.5 0.5 0.4 0.4 0.3 0.3 0.2 0.2Closing stocks Mt 173.6 173.3 171.1 168.7 167.7 168.4 170.3 172.7 175.2 177.7 180.0
OECD2
Production Mt 21.4 22.2 22.0 22.3 22.3 22.4 22.5 22.6 22.8 22.9 23.0Consumption Mt 22.4 23.0 23.0 23.2 23.3 23.4 23.6 23.7 23.8 23.9 24.0Net trade Mt -1.1 -0.9 -0.9 -0.9 -0.9 -1.0 -1.0 -1.0 -1.0 -1.0 -1.0Closing stocks Mt 6.5 6.4 6.3 6.3 6.3 6.2 6.3 6.2 6.2 6.2 6.2
OECD-FAO AGRICULTURAL OUTLOOK 2015 © OECD/FAO 2015 133
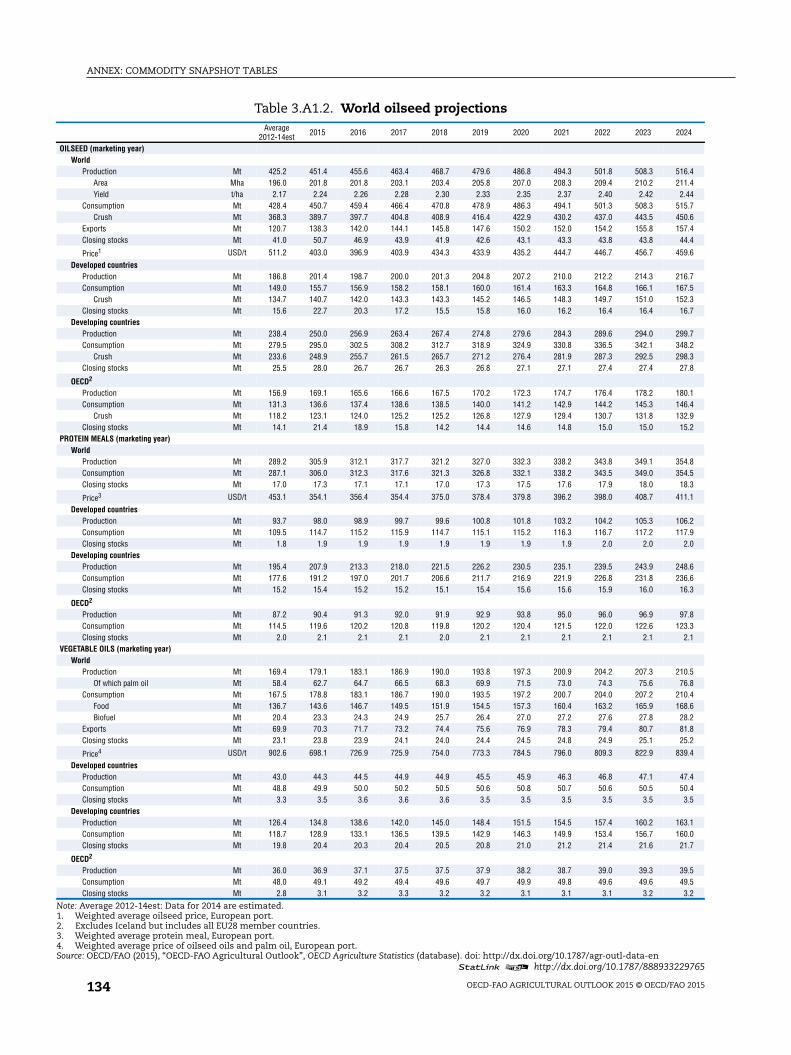
ANNEX: COMMODITY SNAPSHOT TABLES
Table 3.A1.2. World oilseed projections
1 2 http://dx.doi.org/10.1787/888933229765
Note: Average 2012-14est: Data for 2014 are estimated.1. Weighted average oilseed price, European port.2. Excludes Iceland but includes all EU28 member countries.3. Weighted average protein meal, European port.4. Weighted average price of oilseed oils and palm oil, European port.Source: OECD/FAO (2015), “OECD-FAO Agricultural Outlook”, OECD Agriculture Statistics (database). doi: http://dx.doi.org/10.1787/agr-outl-data-en
Average2012-14est 2015 2016 2017 2018 2019 2020 2021 2022 2023 2024
OILSEED (marketing year)World
Production Mt 425.2 451.4 455.6 463.4 468.7 479.6 486.8 494.3 501.8 508.3 516.4Area Mha 196.0 201.8 201.8 203.1 203.4 205.8 207.0 208.3 209.4 210.2 211.4Yield t/ha 2.17 2.24 2.26 2.28 2.30 2.33 2.35 2.37 2.40 2.42 2.44
Consumption Mt 428.4 450.7 459.4 466.4 470.8 478.9 486.3 494.1 501.3 508.3 515.7Crush Mt 368.3 389.7 397.7 404.8 408.9 416.4 422.9 430.2 437.0 443.5 450.6
Exports Mt 120.7 138.3 142.0 144.1 145.8 147.6 150.2 152.0 154.2 155.8 157.4Closing stocks Mt 41.0 50.7 46.9 43.9 41.9 42.6 43.1 43.3 43.8 43.8 44.4
Price1 USD/t 511.2 403.0 396.9 403.9 434.3 433.9 435.2 444.7 446.7 456.7 459.6
Developed countriesProduction Mt 186.8 201.4 198.7 200.0 201.3 204.8 207.2 210.0 212.2 214.3 216.7Consumption Mt 149.0 155.7 156.9 158.2 158.1 160.0 161.4 163.3 164.8 166.1 167.5
Crush Mt 134.7 140.7 142.0 143.3 143.3 145.2 146.5 148.3 149.7 151.0 152.3Closing stocks Mt 15.6 22.7 20.3 17.2 15.5 15.8 16.0 16.2 16.4 16.4 16.7
Developing countriesProduction Mt 238.4 250.0 256.9 263.4 267.4 274.8 279.6 284.3 289.6 294.0 299.7Consumption Mt 279.5 295.0 302.5 308.2 312.7 318.9 324.9 330.8 336.5 342.1 348.2
Crush Mt 233.6 248.9 255.7 261.5 265.7 271.2 276.4 281.9 287.3 292.5 298.3Closing stocks Mt 25.5 28.0 26.7 26.7 26.3 26.8 27.1 27.1 27.4 27.4 27.8
OECD2
Production Mt 156.9 169.1 165.6 166.6 167.5 170.2 172.3 174.7 176.4 178.2 180.1Consumption Mt 131.3 136.6 137.4 138.6 138.5 140.0 141.2 142.9 144.2 145.3 146.4
Crush Mt 118.2 123.1 124.0 125.2 125.2 126.8 127.9 129.4 130.7 131.8 132.9Closing stocks Mt 14.1 21.4 18.9 15.8 14.2 14.4 14.6 14.8 15.0 15.0 15.2
PROTEIN MEALS (marketing year)World
Production Mt 289.2 305.9 312.1 317.7 321.2 327.0 332.3 338.2 343.8 349.1 354.8Consumption Mt 287.1 306.0 312.3 317.6 321.3 326.8 332.1 338.2 343.5 349.0 354.5Closing stocks Mt 17.0 17.3 17.1 17.1 17.0 17.3 17.5 17.6 17.9 18.0 18.3
Price3 USD/t 453.1 354.1 356.4 354.4 375.0 378.4 379.8 396.2 398.0 408.7 411.1
Developed countriesProduction Mt 93.7 98.0 98.9 99.7 99.6 100.8 101.8 103.2 104.2 105.3 106.2Consumption Mt 109.5 114.7 115.2 115.9 114.7 115.1 115.2 116.3 116.7 117.2 117.9Closing stocks Mt 1.8 1.9 1.9 1.9 1.9 1.9 1.9 1.9 2.0 2.0 2.0
Developing countriesProduction Mt 195.4 207.9 213.3 218.0 221.5 226.2 230.5 235.1 239.5 243.9 248.6Consumption Mt 177.6 191.2 197.0 201.7 206.6 211.7 216.9 221.9 226.8 231.8 236.6Closing stocks Mt 15.2 15.4 15.2 15.2 15.1 15.4 15.6 15.6 15.9 16.0 16.3
OECD2
Production Mt 87.2 90.4 91.3 92.0 91.9 92.9 93.8 95.0 96.0 96.9 97.8Consumption Mt 114.5 119.6 120.2 120.8 119.8 120.2 120.4 121.5 122.0 122.6 123.3Closing stocks Mt 2.0 2.1 2.1 2.1 2.0 2.1 2.1 2.1 2.1 2.1 2.1
VEGETABLE OILS (marketing year)World
Production Mt 169.4 179.1 183.1 186.9 190.0 193.8 197.3 200.9 204.2 207.3 210.5Of which palm oil Mt 58.4 62.7 64.7 66.5 68.3 69.9 71.5 73.0 74.3 75.6 76.8
Consumption Mt 167.5 178.8 183.1 186.7 190.0 193.5 197.2 200.7 204.0 207.2 210.4Food Mt 136.7 143.6 146.7 149.5 151.9 154.5 157.3 160.4 163.2 165.9 168.6Biofuel Mt 20.4 23.3 24.3 24.9 25.7 26.4 27.0 27.2 27.6 27.8 28.2
Exports Mt 69.9 70.3 71.7 73.2 74.4 75.6 76.9 78.3 79.4 80.7 81.8Closing stocks Mt 23.1 23.8 23.9 24.1 24.0 24.4 24.5 24.8 24.9 25.1 25.2
Price4 USD/t 902.6 698.1 726.9 725.9 754.0 773.3 784.5 796.0 809.3 822.9 839.4
Developed countriesProduction Mt 43.0 44.3 44.5 44.9 44.9 45.5 45.9 46.3 46.8 47.1 47.4Consumption Mt 48.8 49.9 50.0 50.2 50.5 50.6 50.8 50.7 50.6 50.5 50.4Closing stocks Mt 3.3 3.5 3.6 3.6 3.6 3.5 3.5 3.5 3.5 3.5 3.5
Developing countriesProduction Mt 126.4 134.8 138.6 142.0 145.0 148.4 151.5 154.5 157.4 160.2 163.1Consumption Mt 118.7 128.9 133.1 136.5 139.5 142.9 146.3 149.9 153.4 156.7 160.0Closing stocks Mt 19.8 20.4 20.3 20.4 20.5 20.8 21.0 21.2 21.4 21.6 21.7
OECD2
Production Mt 36.0 36.9 37.1 37.5 37.5 37.9 38.2 38.7 39.0 39.3 39.5Consumption Mt 48.0 49.1 49.2 49.4 49.6 49.7 49.9 49.8 49.6 49.6 49.5Closing stocks Mt 2.8 3.1 3.2 3.3 3.2 3.2 3.1 3.1 3.1 3.2 3.2
OECD-FAO AGRICULTURAL OUTLOOK 2015 © OECD/FAO 2015134
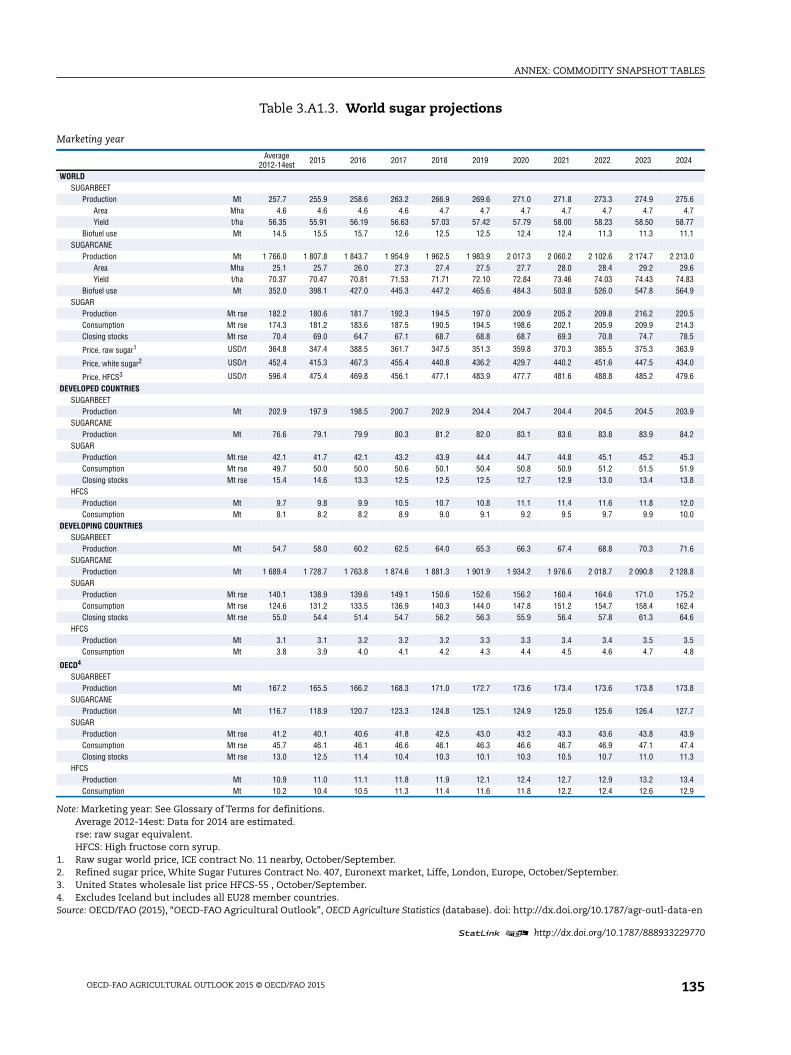
ANNEX: COMMODITY SNAPSHOT TABLES
Table 3.A1.3. World sugar projections
1 2 http://dx.doi.org/10.1787/888933229770
Note: Marketing year: See Glossary of Terms for definitions.Average 2012-14est: Data for 2014 are estimated.rse: raw sugar equivalent.HFCS: High fructose corn syrup.
1. Raw sugar world price, ICE contract No. 11 nearby, October/September.2. Refined sugar price, White Sugar Futures Contract No. 407, Euronext market, Liffe, London, Europe, October/September.3. United States wholesale list price HFCS-55 , October/September.4. Excludes Iceland but includes all EU28 member countries.Source: OECD/FAO (2015), “OECD-FAO Agricultural Outlook”, OECD Agriculture Statistics (database). doi: http://dx.doi.org/10.1787/agr-outl-data-en
Marketing year
Average2012-14est 2015 2016 2017 2018 2019 2020 2021 2022 2023 2024
WORLDSUGARBEET
Production Mt 257.7 255.9 258.6 263.2 266.9 269.6 271.0 271.8 273.3 274.9 275.6Area Mha 4.6 4.6 4.6 4.6 4.7 4.7 4.7 4.7 4.7 4.7 4.7Yield t/ha 56.35 55.91 56.19 56.63 57.03 57.42 57.79 58.00 58.23 58.50 58.77
Biofuel use Mt 14.5 15.5 15.7 12.6 12.5 12.5 12.4 12.4 11.3 11.3 11.1SUGARCANE
Production Mt 1 766.0 1 807.8 1 843.7 1 954.9 1 962.5 1 983.9 2 017.3 2 060.2 2 102.6 2 174.7 2 213.0Area Mha 25.1 25.7 26.0 27.3 27.4 27.5 27.7 28.0 28.4 29.2 29.6Yield t/ha 70.37 70.47 70.81 71.53 71.71 72.10 72.84 73.46 74.03 74.43 74.83
Biofuel use Mt 352.0 398.1 427.0 445.3 447.2 465.6 484.3 503.8 526.0 547.8 564.9SUGAR
Production Mt rse 182.2 180.6 181.7 192.3 194.5 197.0 200.9 205.2 209.8 216.2 220.5Consumption Mt rse 174.3 181.2 183.6 187.5 190.5 194.5 198.6 202.1 205.9 209.9 214.3Closing stocks Mt rse 70.4 69.0 64.7 67.1 68.7 68.8 68.7 69.3 70.8 74.7 78.5
Price, raw sugar1 USD/t 364.8 347.4 388.5 361.7 347.5 351.3 359.8 370.3 385.5 375.3 363.9
Price, white sugar2 USD/t 452.4 415.3 467.3 455.4 440.8 436.2 429.7 440.2 451.6 447.5 434.0
Price, HFCS3 USD/t 596.4 475.4 469.8 456.1 477.1 483.9 477.7 481.6 488.8 485.2 479.6
DEVELOPED COUNTRIESSUGARBEET
Production Mt 202.9 197.9 198.5 200.7 202.9 204.4 204.7 204.4 204.5 204.5 203.9SUGARCANE
Production Mt 76.6 79.1 79.9 80.3 81.2 82.0 83.1 83.6 83.8 83.9 84.2SUGAR
Production Mt rse 42.1 41.7 42.1 43.2 43.9 44.4 44.7 44.8 45.1 45.2 45.3Consumption Mt rse 49.7 50.0 50.0 50.6 50.1 50.4 50.8 50.9 51.2 51.5 51.9Closing stocks Mt rse 15.4 14.6 13.3 12.5 12.5 12.5 12.7 12.9 13.0 13.4 13.8
HFCSProduction Mt 9.7 9.8 9.9 10.5 10.7 10.8 11.1 11.4 11.6 11.8 12.0Consumption Mt 8.1 8.2 8.2 8.9 9.0 9.1 9.2 9.5 9.7 9.9 10.0
DEVELOPING COUNTRIESSUGARBEET
Production Mt 54.7 58.0 60.2 62.5 64.0 65.3 66.3 67.4 68.8 70.3 71.6SUGARCANE
Production Mt 1 689.4 1 728.7 1 763.8 1 874.6 1 881.3 1 901.9 1 934.2 1 976.6 2 018.7 2 090.8 2 128.8SUGAR
Production Mt rse 140.1 138.9 139.6 149.1 150.6 152.6 156.2 160.4 164.6 171.0 175.2Consumption Mt rse 124.6 131.2 133.5 136.9 140.3 144.0 147.8 151.2 154.7 158.4 162.4Closing stocks Mt rse 55.0 54.4 51.4 54.7 56.2 56.3 55.9 56.4 57.8 61.3 64.6
HFCSProduction Mt 3.1 3.1 3.2 3.2 3.2 3.3 3.3 3.4 3.4 3.5 3.5Consumption Mt 3.8 3.9 4.0 4.1 4.2 4.3 4.4 4.5 4.6 4.7 4.8
OECD4
SUGARBEETProduction Mt 167.2 165.5 166.2 168.3 171.0 172.7 173.6 173.4 173.6 173.8 173.8
SUGARCANEProduction Mt 116.7 118.9 120.7 123.3 124.8 125.1 124.9 125.0 125.6 126.4 127.7
SUGARProduction Mt rse 41.2 40.1 40.6 41.8 42.5 43.0 43.2 43.3 43.6 43.8 43.9Consumption Mt rse 45.7 46.1 46.1 46.6 46.1 46.3 46.6 46.7 46.9 47.1 47.4Closing stocks Mt rse 13.0 12.5 11.4 10.4 10.3 10.1 10.3 10.5 10.7 11.0 11.3
HFCSProduction Mt 10.9 11.0 11.1 11.8 11.9 12.1 12.4 12.7 12.9 13.2 13.4Consumption Mt 10.2 10.4 10.5 11.3 11.4 11.6 11.8 12.2 12.4 12.6 12.9
OECD-FAO AGRICULTURAL OUTLOOK 2015 © OECD/FAO 2015 135
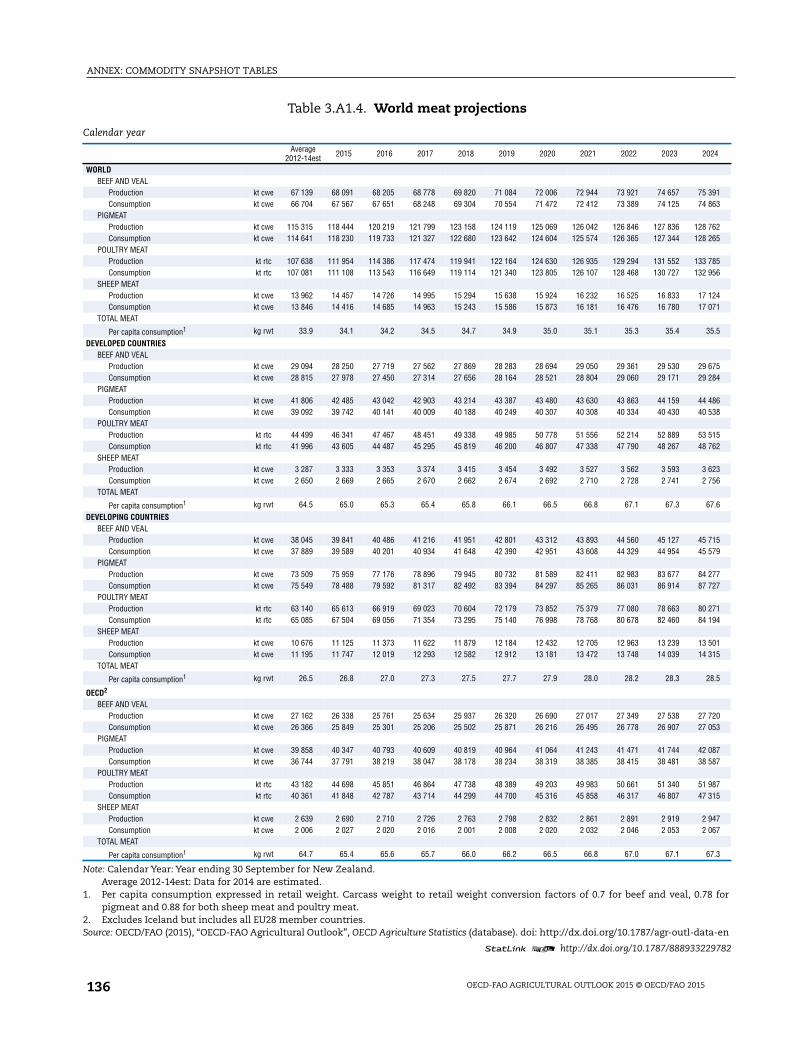
ANNEX: COMMODITY SNAPSHOT TABLES
Table 3.A1.4. World meat projections
1 2 http://dx.doi.org/10.1787/888933229782
Note: Calendar Year: Year ending 30 September for New Zealand.Average 2012-14est: Data for 2014 are estimated.
1. Per capita consumption expressed in retail weight. Carcass weight to retail weight conversion factors of 0.7 for beef and veal, 0.78 forpigmeat and 0.88 for both sheep meat and poultry meat.
2. Excludes Iceland but includes all EU28 member countries.Source: OECD/FAO (2015), “OECD-FAO Agricultural Outlook”, OECD Agriculture Statistics (database). doi: http://dx.doi.org/10.1787/agr-outl-data-en
Calendar year
Average2012-14est 2015 2016 2017 2018 2019 2020 2021 2022 2023 2024
WORLDBEEF AND VEAL
Production kt cwe 67 139 68 091 68 205 68 778 69 820 71 084 72 006 72 944 73 921 74 657 75 391Consumption kt cwe 66 704 67 567 67 651 68 248 69 304 70 554 71 472 72 412 73 389 74 125 74 863
PIGMEATProduction kt cwe 115 315 118 444 120 219 121 799 123 158 124 119 125 069 126 042 126 846 127 836 128 762Consumption kt cwe 114 641 118 230 119 733 121 327 122 680 123 642 124 604 125 574 126 365 127 344 128 265
POULTRY MEATProduction kt rtc 107 638 111 954 114 386 117 474 119 941 122 164 124 630 126 935 129 294 131 552 133 785Consumption kt rtc 107 081 111 108 113 543 116 649 119 114 121 340 123 805 126 107 128 468 130 727 132 956
SHEEP MEATProduction kt cwe 13 962 14 457 14 726 14 995 15 294 15 638 15 924 16 232 16 525 16 833 17 124Consumption kt cwe 13 846 14 416 14 685 14 963 15 243 15 586 15 873 16 181 16 476 16 780 17 071
TOTAL MEAT
Per capita consumption1 kg rwt 33.9 34.1 34.2 34.5 34.7 34.9 35.0 35.1 35.3 35.4 35.5
DEVELOPED COUNTRIESBEEF AND VEAL
Production kt cwe 29 094 28 250 27 719 27 562 27 869 28 283 28 694 29 050 29 361 29 530 29 675Consumption kt cwe 28 815 27 978 27 450 27 314 27 656 28 164 28 521 28 804 29 060 29 171 29 284
PIGMEATProduction kt cwe 41 806 42 485 43 042 42 903 43 214 43 387 43 480 43 630 43 863 44 159 44 486Consumption kt cwe 39 092 39 742 40 141 40 009 40 188 40 249 40 307 40 308 40 334 40 430 40 538
POULTRY MEATProduction kt rtc 44 499 46 341 47 467 48 451 49 338 49 985 50 778 51 556 52 214 52 889 53 515Consumption kt rtc 41 996 43 605 44 487 45 295 45 819 46 200 46 807 47 338 47 790 48 267 48 762
SHEEP MEATProduction kt cwe 3 287 3 333 3 353 3 374 3 415 3 454 3 492 3 527 3 562 3 593 3 623Consumption kt cwe 2 650 2 669 2 665 2 670 2 662 2 674 2 692 2 710 2 728 2 741 2 756
TOTAL MEAT
Per capita consumption1 kg rwt 64.5 65.0 65.3 65.4 65.8 66.1 66.5 66.8 67.1 67.3 67.6
DEVELOPING COUNTRIESBEEF AND VEAL
Production kt cwe 38 045 39 841 40 486 41 216 41 951 42 801 43 312 43 893 44 560 45 127 45 715Consumption kt cwe 37 889 39 589 40 201 40 934 41 648 42 390 42 951 43 608 44 329 44 954 45 579
PIGMEATProduction kt cwe 73 509 75 959 77 176 78 896 79 945 80 732 81 589 82 411 82 983 83 677 84 277Consumption kt cwe 75 549 78 488 79 592 81 317 82 492 83 394 84 297 85 265 86 031 86 914 87 727
POULTRY MEATProduction kt rtc 63 140 65 613 66 919 69 023 70 604 72 179 73 852 75 379 77 080 78 663 80 271Consumption kt rtc 65 085 67 504 69 056 71 354 73 295 75 140 76 998 78 768 80 678 82 460 84 194
SHEEP MEATProduction kt cwe 10 676 11 125 11 373 11 622 11 879 12 184 12 432 12 705 12 963 13 239 13 501Consumption kt cwe 11 195 11 747 12 019 12 293 12 582 12 912 13 181 13 472 13 748 14 039 14 315
TOTAL MEAT
Per capita consumption1 kg rwt 26.5 26.8 27.0 27.3 27.5 27.7 27.9 28.0 28.2 28.3 28.5
OECD2
BEEF AND VEALProduction kt cwe 27 162 26 338 25 761 25 634 25 937 26 320 26 690 27 017 27 349 27 538 27 720Consumption kt cwe 26 366 25 849 25 301 25 206 25 502 25 871 26 216 26 495 26 778 26 907 27 053
PIGMEATProduction kt cwe 39 858 40 347 40 793 40 609 40 819 40 964 41 064 41 243 41 471 41 744 42 087Consumption kt cwe 36 744 37 791 38 219 38 047 38 178 38 234 38 319 38 385 38 415 38 481 38 587
POULTRY MEATProduction kt rtc 43 182 44 698 45 851 46 864 47 738 48 389 49 203 49 983 50 661 51 340 51 987Consumption kt rtc 40 361 41 848 42 787 43 714 44 299 44 700 45 316 45 858 46 317 46 807 47 315
SHEEP MEATProduction kt cwe 2 639 2 690 2 710 2 726 2 763 2 798 2 832 2 861 2 891 2 919 2 947Consumption kt cwe 2 006 2 027 2 020 2 016 2 001 2 008 2 020 2 032 2 046 2 053 2 067
TOTAL MEAT
Per capita consumption1 kg rwt 64.7 65.4 65.6 65.7 66.0 66.2 66.5 66.8 67.0 67.1 67.3
OECD-FAO AGRICULTURAL OUTLOOK 2015 © OECD/FAO 2015136
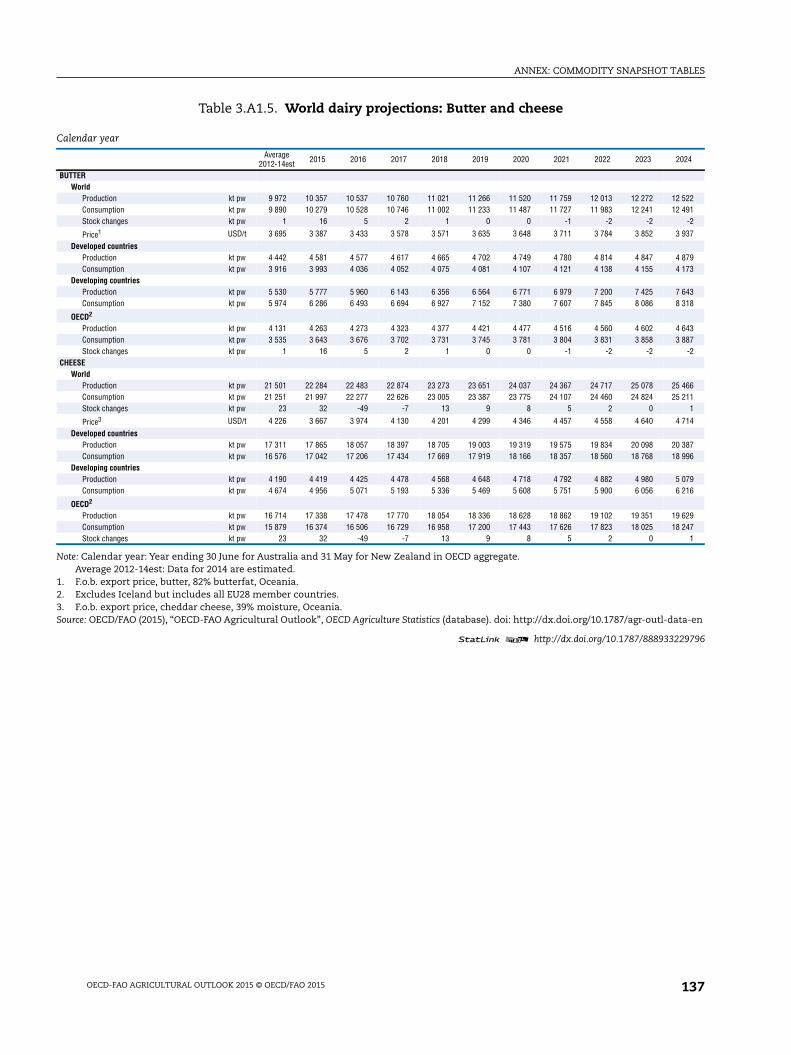
ANNEX: COMMODITY SNAPSHOT TABLES
Table 3.A1.5. World dairy projections: Butter and cheese
1 2 http://dx.doi.org/10.1787/888933229796
Note: Calendar year: Year ending 30 June for Australia and 31 May for New Zealand in OECD aggregate.Average 2012-14est: Data for 2014 are estimated.
1. F.o.b. export price, butter, 82% butterfat, Oceania.2. Excludes Iceland but includes all EU28 member countries.3. F.o.b. export price, cheddar cheese, 39% moisture, Oceania.Source: OECD/FAO (2015), “OECD-FAO Agricultural Outlook”, OECD Agriculture Statistics (database). doi: http://dx.doi.org/10.1787/agr-outl-data-en
Calendar year
Average2012-14est 2015 2016 2017 2018 2019 2020 2021 2022 2023 2024
BUTTERWorld
Production kt pw 9 972 10 357 10 537 10 760 11 021 11 266 11 520 11 759 12 013 12 272 12 522Consumption kt pw 9 890 10 279 10 528 10 746 11 002 11 233 11 487 11 727 11 983 12 241 12 491Stock changes kt pw 1 16 5 2 1 0 0 -1 -2 -2 -2
Price1 USD/t 3 695 3 387 3 433 3 578 3 571 3 635 3 648 3 711 3 784 3 852 3 937
Developed countriesProduction kt pw 4 442 4 581 4 577 4 617 4 665 4 702 4 749 4 780 4 814 4 847 4 879Consumption kt pw 3 916 3 993 4 036 4 052 4 075 4 081 4 107 4 121 4 138 4 155 4 173
Developing countriesProduction kt pw 5 530 5 777 5 960 6 143 6 356 6 564 6 771 6 979 7 200 7 425 7 643Consumption kt pw 5 974 6 286 6 493 6 694 6 927 7 152 7 380 7 607 7 845 8 086 8 318
OECD2
Production kt pw 4 131 4 263 4 273 4 323 4 377 4 421 4 477 4 516 4 560 4 602 4 643Consumption kt pw 3 535 3 643 3 676 3 702 3 731 3 745 3 781 3 804 3 831 3 858 3 887Stock changes kt pw 1 16 5 2 1 0 0 -1 -2 -2 -2
CHEESEWorld
Production kt pw 21 501 22 284 22 483 22 874 23 273 23 651 24 037 24 367 24 717 25 078 25 466Consumption kt pw 21 251 21 997 22 277 22 626 23 005 23 387 23 775 24 107 24 460 24 824 25 211Stock changes kt pw 23 32 -49 -7 13 9 8 5 2 0 1
Price3 USD/t 4 226 3 667 3 974 4 130 4 201 4 299 4 346 4 457 4 558 4 640 4 714
Developed countriesProduction kt pw 17 311 17 865 18 057 18 397 18 705 19 003 19 319 19 575 19 834 20 098 20 387Consumption kt pw 16 576 17 042 17 206 17 434 17 669 17 919 18 166 18 357 18 560 18 768 18 996
Developing countriesProduction kt pw 4 190 4 419 4 425 4 478 4 568 4 648 4 718 4 792 4 882 4 980 5 079Consumption kt pw 4 674 4 956 5 071 5 193 5 336 5 469 5 608 5 751 5 900 6 056 6 216
OECD2
Production kt pw 16 714 17 338 17 478 17 770 18 054 18 336 18 628 18 862 19 102 19 351 19 629Consumption kt pw 15 879 16 374 16 506 16 729 16 958 17 200 17 443 17 626 17 823 18 025 18 247Stock changes kt pw 23 32 -49 -7 13 9 8 5 2 0 1
OECD-FAO AGRICULTURAL OUTLOOK 2015 © OECD/FAO 2015 137
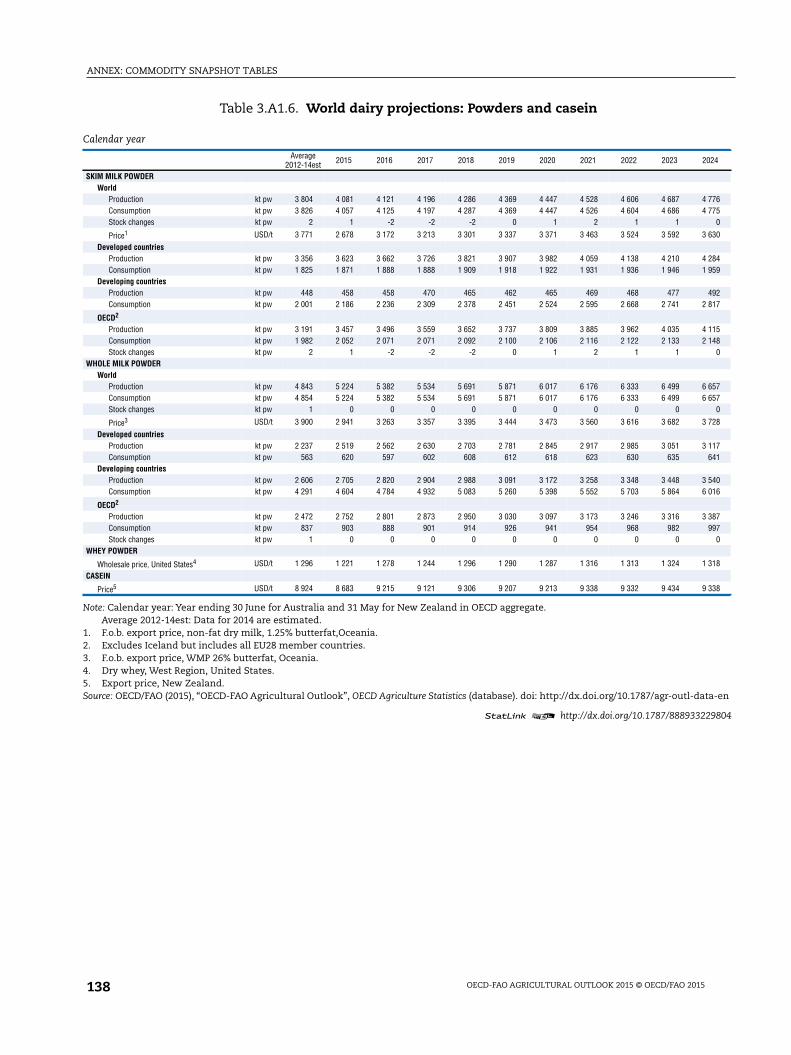
ANNEX: COMMODITY SNAPSHOT TABLES
Table 3.A1.6. World dairy projections: Powders and casein
1 2 http://dx.doi.org/10.1787/888933229804
Note: Calendar year: Year ending 30 June for Australia and 31 May for New Zealand in OECD aggregate.Average 2012-14est: Data for 2014 are estimated.
1. F.o.b. export price, non-fat dry milk, 1.25% butterfat,Oceania.2. Excludes Iceland but includes all EU28 member countries.3. F.o.b. export price, WMP 26% butterfat, Oceania.4. Dry whey, West Region, United States.5. Export price, New Zealand.Source: OECD/FAO (2015), “OECD-FAO Agricultural Outlook”, OECD Agriculture Statistics (database). doi: http://dx.doi.org/10.1787/agr-outl-data-en
Calendar year
Average2012-14est 2015 2016 2017 2018 2019 2020 2021 2022 2023 2024
SKIM MILK POWDERWorld
Production kt pw 3 804 4 081 4 121 4 196 4 286 4 369 4 447 4 528 4 606 4 687 4 776Consumption kt pw 3 826 4 057 4 125 4 197 4 287 4 369 4 447 4 526 4 604 4 686 4 775Stock changes kt pw 2 1 -2 -2 -2 0 1 2 1 1 0
Price1 USD/t 3 771 2 678 3 172 3 213 3 301 3 337 3 371 3 463 3 524 3 592 3 630
Developed countriesProduction kt pw 3 356 3 623 3 662 3 726 3 821 3 907 3 982 4 059 4 138 4 210 4 284Consumption kt pw 1 825 1 871 1 888 1 888 1 909 1 918 1 922 1 931 1 936 1 946 1 959
Developing countriesProduction kt pw 448 458 458 470 465 462 465 469 468 477 492Consumption kt pw 2 001 2 186 2 236 2 309 2 378 2 451 2 524 2 595 2 668 2 741 2 817
OECD2
Production kt pw 3 191 3 457 3 496 3 559 3 652 3 737 3 809 3 885 3 962 4 035 4 115Consumption kt pw 1 982 2 052 2 071 2 071 2 092 2 100 2 106 2 116 2 122 2 133 2 148Stock changes kt pw 2 1 -2 -2 -2 0 1 2 1 1 0
WHOLE MILK POWDERWorld
Production kt pw 4 843 5 224 5 382 5 534 5 691 5 871 6 017 6 176 6 333 6 499 6 657Consumption kt pw 4 854 5 224 5 382 5 534 5 691 5 871 6 017 6 176 6 333 6 499 6 657Stock changes kt pw 1 0 0 0 0 0 0 0 0 0 0
Price3 USD/t 3 900 2 941 3 263 3 357 3 395 3 444 3 473 3 560 3 616 3 682 3 728
Developed countriesProduction kt pw 2 237 2 519 2 562 2 630 2 703 2 781 2 845 2 917 2 985 3 051 3 117Consumption kt pw 563 620 597 602 608 612 618 623 630 635 641
Developing countriesProduction kt pw 2 606 2 705 2 820 2 904 2 988 3 091 3 172 3 258 3 348 3 448 3 540Consumption kt pw 4 291 4 604 4 784 4 932 5 083 5 260 5 398 5 552 5 703 5 864 6 016
OECD2
Production kt pw 2 472 2 752 2 801 2 873 2 950 3 030 3 097 3 173 3 246 3 316 3 387Consumption kt pw 837 903 888 901 914 926 941 954 968 982 997Stock changes kt pw 1 0 0 0 0 0 0 0 0 0 0
WHEY POWDER
Wholesale price, United States4 USD/t 1 296 1 221 1 278 1 244 1 296 1 290 1 287 1 316 1 313 1 324 1 318
CASEIN
Price5 USD/t 8 924 8 683 9 215 9 121 9 306 9 207 9 213 9 338 9 332 9 434 9 338
OECD-FAO AGRICULTURAL OUTLOOK 2015 © OECD/FAO 2015138
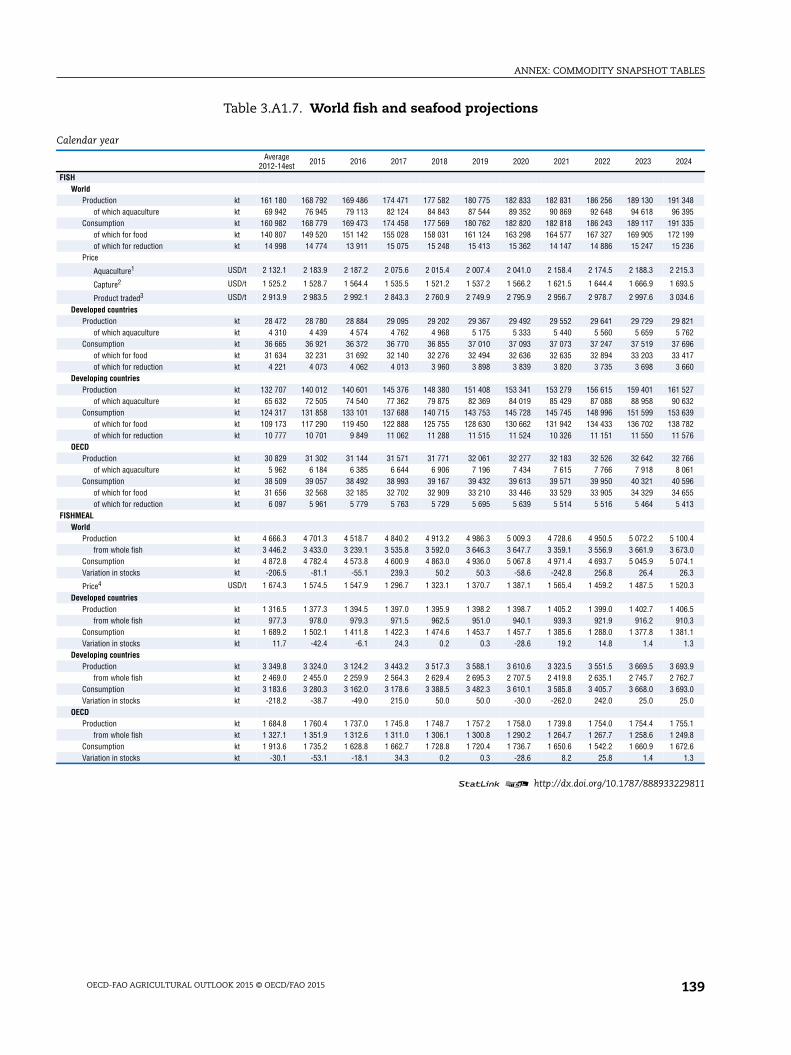
ANNEX: COMMODITY SNAPSHOT TABLES
Table 3.A1.7. World fish and seafood projections
1 2 http://dx.doi.org/10.1787/888933229811
Calendar year
Average2012-14est 2015 2016 2017 2018 2019 2020 2021 2022 2023 2024
FISHWorld
Production kt 161 180 168 792 169 486 174 471 177 582 180 775 182 833 182 831 186 256 189 130 191 348of which aquaculture kt 69 942 76 945 79 113 82 124 84 843 87 544 89 352 90 869 92 648 94 618 96 395
Consumption kt 160 982 168 779 169 473 174 458 177 569 180 762 182 820 182 818 186 243 189 117 191 335of which for food kt 140 807 149 520 151 142 155 028 158 031 161 124 163 298 164 577 167 327 169 905 172 199of which for reduction kt 14 998 14 774 13 911 15 075 15 248 15 413 15 362 14 147 14 886 15 247 15 236
Price
Aquaculture1 USD/t 2 132.1 2 183.9 2 187.2 2 075.6 2 015.4 2 007.4 2 041.0 2 158.4 2 174.5 2 188.3 2 215.3
Capture2 USD/t 1 525.2 1 528.7 1 564.4 1 535.5 1 521.2 1 537.2 1 566.2 1 621.5 1 644.4 1 666.9 1 693.5
Product traded3 USD/t 2 913.9 2 983.5 2 992.1 2 843.3 2 760.9 2 749.9 2 795.9 2 956.7 2 978.7 2 997.6 3 034.6
Developed countriesProduction kt 28 472 28 780 28 884 29 095 29 202 29 367 29 492 29 552 29 641 29 729 29 821
of which aquaculture kt 4 310 4 439 4 574 4 762 4 968 5 175 5 333 5 440 5 560 5 659 5 762Consumption kt 36 665 36 921 36 372 36 770 36 855 37 010 37 093 37 073 37 247 37 519 37 696
of which for food kt 31 634 32 231 31 692 32 140 32 276 32 494 32 636 32 635 32 894 33 203 33 417of which for reduction kt 4 221 4 073 4 062 4 013 3 960 3 898 3 839 3 820 3 735 3 698 3 660
Developing countriesProduction kt 132 707 140 012 140 601 145 376 148 380 151 408 153 341 153 279 156 615 159 401 161 527
of which aquaculture kt 65 632 72 505 74 540 77 362 79 875 82 369 84 019 85 429 87 088 88 958 90 632Consumption kt 124 317 131 858 133 101 137 688 140 715 143 753 145 728 145 745 148 996 151 599 153 639
of which for food kt 109 173 117 290 119 450 122 888 125 755 128 630 130 662 131 942 134 433 136 702 138 782of which for reduction kt 10 777 10 701 9 849 11 062 11 288 11 515 11 524 10 326 11 151 11 550 11 576
OECDProduction kt 30 829 31 302 31 144 31 571 31 771 32 061 32 277 32 183 32 526 32 642 32 766
of which aquaculture kt 5 962 6 184 6 385 6 644 6 906 7 196 7 434 7 615 7 766 7 918 8 061Consumption kt 38 509 39 057 38 492 38 993 39 167 39 432 39 613 39 571 39 950 40 321 40 596
of which for food kt 31 656 32 568 32 185 32 702 32 909 33 210 33 446 33 529 33 905 34 329 34 655of which for reduction kt 6 097 5 961 5 779 5 763 5 729 5 695 5 639 5 514 5 516 5 464 5 413
FISHMEALWorld
Production kt 4 666.3 4 701.3 4 518.7 4 840.2 4 913.2 4 986.3 5 009.3 4 728.6 4 950.5 5 072.2 5 100.4from whole fish kt 3 446.2 3 433.0 3 239.1 3 535.8 3 592.0 3 646.3 3 647.7 3 359.1 3 556.9 3 661.9 3 673.0
Consumption kt 4 872.8 4 782.4 4 573.8 4 600.9 4 863.0 4 936.0 5 067.8 4 971.4 4 693.7 5 045.9 5 074.1Variation in stocks kt -206.5 -81.1 -55.1 239.3 50.2 50.3 -58.6 -242.8 256.8 26.4 26.3
Price4 USD/t 1 674.3 1 574.5 1 547.9 1 296.7 1 323.1 1 370.7 1 387.1 1 565.4 1 459.2 1 487.5 1 520.3
Developed countriesProduction kt 1 316.5 1 377.3 1 394.5 1 397.0 1 395.9 1 398.2 1 398.7 1 405.2 1 399.0 1 402.7 1 406.5
from whole fish kt 977.3 978.0 979.3 971.5 962.5 951.0 940.1 939.3 921.9 916.2 910.3Consumption kt 1 689.2 1 502.1 1 411.8 1 422.3 1 474.6 1 453.7 1 457.7 1 385.6 1 288.0 1 377.8 1 381.1Variation in stocks kt 11.7 -42.4 -6.1 24.3 0.2 0.3 -28.6 19.2 14.8 1.4 1.3
Developing countriesProduction kt 3 349.8 3 324.0 3 124.2 3 443.2 3 517.3 3 588.1 3 610.6 3 323.5 3 551.5 3 669.5 3 693.9
from whole fish kt 2 469.0 2 455.0 2 259.9 2 564.3 2 629.4 2 695.3 2 707.5 2 419.8 2 635.1 2 745.7 2 762.7Consumption kt 3 183.6 3 280.3 3 162.0 3 178.6 3 388.5 3 482.3 3 610.1 3 585.8 3 405.7 3 668.0 3 693.0Variation in stocks kt -218.2 -38.7 -49.0 215.0 50.0 50.0 -30.0 -262.0 242.0 25.0 25.0
OECDProduction kt 1 684.8 1 760.4 1 737.0 1 745.8 1 748.7 1 757.2 1 758.0 1 739.8 1 754.0 1 754.4 1 755.1
from whole fish kt 1 327.1 1 351.9 1 312.6 1 311.0 1 306.1 1 300.8 1 290.2 1 264.7 1 267.7 1 258.6 1 249.8Consumption kt 1 913.6 1 735.2 1 628.8 1 662.7 1 728.8 1 720.4 1 736.7 1 650.6 1 542.2 1 660.9 1 672.6Variation in stocks kt -30.1 -53.1 -18.1 34.3 0.2 0.3 -28.6 8.2 25.8 1.4 1.3
OECD-FAO AGRICULTURAL OUTLOOK 2015 © OECD/FAO 2015 139
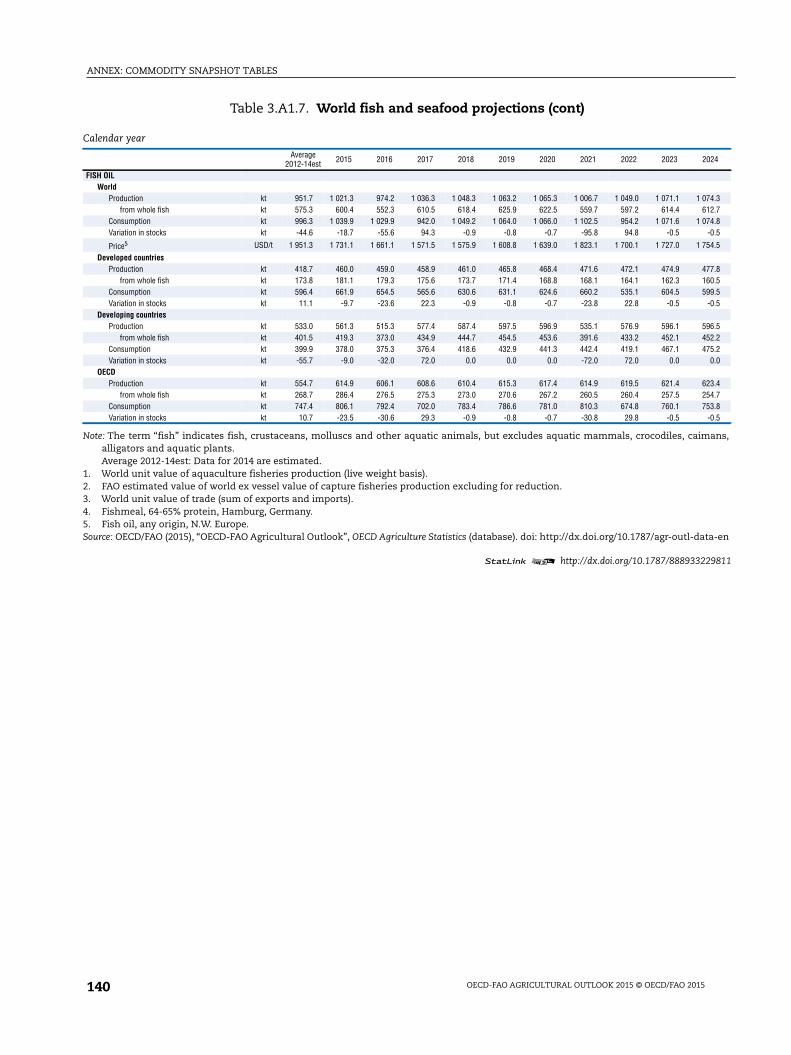
ANNEX: COMMODITY SNAPSHOT TABLES
Table 3.A1.7. World fish and seafood projections (cont)
1 2 http://dx.doi.org/10.1787/888933229811
Note: The term “fish” indicates fish, crustaceans, molluscs and other aquatic animals, but excludes aquatic mammals, crocodiles, caimans,alligators and aquatic plants.Average 2012-14est: Data for 2014 are estimated.
1. World unit value of aquaculture fisheries production (live weight basis).2. FAO estimated value of world ex vessel value of capture fisheries production excluding for reduction.3. World unit value of trade (sum of exports and imports).4. Fishmeal, 64-65% protein, Hamburg, Germany.5. Fish oil, any origin, N.W. Europe.Source: OECD/FAO (2015), “OECD-FAO Agricultural Outlook”, OECD Agriculture Statistics (database). doi: http://dx.doi.org/10.1787/agr-outl-data-en
Calendar year
Average2012-14est 2015 2016 2017 2018 2019 2020 2021 2022 2023 2024
FISH OILWorld
Production kt 951.7 1 021.3 974.2 1 036.3 1 048.3 1 063.2 1 065.3 1 006.7 1 049.0 1 071.1 1 074.3from whole fish kt 575.3 600.4 552.3 610.5 618.4 625.9 622.5 559.7 597.2 614.4 612.7
Consumption kt 996.3 1 039.9 1 029.9 942.0 1 049.2 1 064.0 1 066.0 1 102.5 954.2 1 071.6 1 074.8Variation in stocks kt -44.6 -18.7 -55.6 94.3 -0.9 -0.8 -0.7 -95.8 94.8 -0.5 -0.5
Price5 USD/t 1 951.3 1 731.1 1 661.1 1 571.5 1 575.9 1 608.8 1 639.0 1 823.1 1 700.1 1 727.0 1 754.5
Developed countriesProduction kt 418.7 460.0 459.0 458.9 461.0 465.8 468.4 471.6 472.1 474.9 477.8
from whole fish kt 173.8 181.1 179.3 175.6 173.7 171.4 168.8 168.1 164.1 162.3 160.5Consumption kt 596.4 661.9 654.5 565.6 630.6 631.1 624.6 660.2 535.1 604.5 599.5Variation in stocks kt 11.1 -9.7 -23.6 22.3 -0.9 -0.8 -0.7 -23.8 22.8 -0.5 -0.5
Developing countriesProduction kt 533.0 561.3 515.3 577.4 587.4 597.5 596.9 535.1 576.9 596.1 596.5
from whole fish kt 401.5 419.3 373.0 434.9 444.7 454.5 453.6 391.6 433.2 452.1 452.2Consumption kt 399.9 378.0 375.3 376.4 418.6 432.9 441.3 442.4 419.1 467.1 475.2Variation in stocks kt -55.7 -9.0 -32.0 72.0 0.0 0.0 0.0 -72.0 72.0 0.0 0.0
OECDProduction kt 554.7 614.9 606.1 608.6 610.4 615.3 617.4 614.9 619.5 621.4 623.4
from whole fish kt 268.7 286.4 276.5 275.3 273.0 270.6 267.2 260.5 260.4 257.5 254.7Consumption kt 747.4 806.1 792.4 702.0 783.4 786.6 781.0 810.3 674.8 760.1 753.8Variation in stocks kt 10.7 -23.5 -30.6 29.3 -0.9 -0.8 -0.7 -30.8 29.8 -0.5 -0.5
OECD-FAO AGRICULTURAL OUTLOOK 2015 © OECD/FAO 2015140
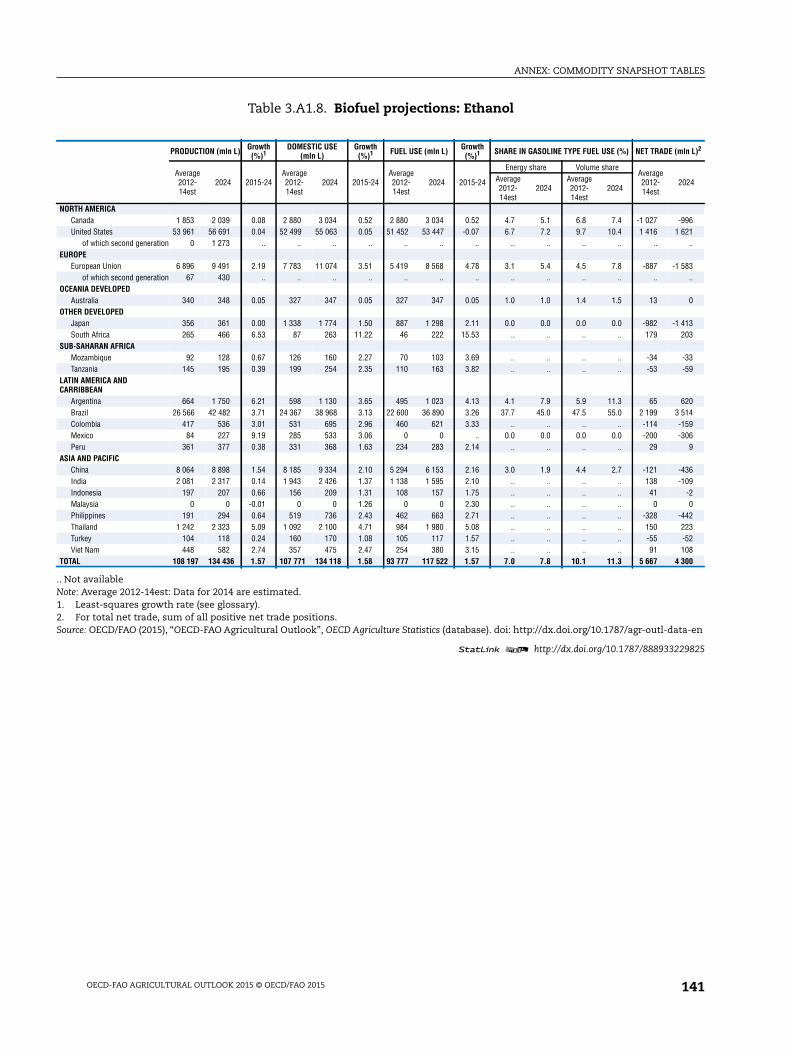
ANNEX: COMMODITY SNAPSHOT TABLES
Table 3.A1.8. Biofuel projections: Ethanol
1 2 http://dx.doi.org/10.1787/888933229825
.. Not availableNote: Average 2012-14est: Data for 2014 are estimated.1. Least-squares growth rate (see glossary).2. For total net trade, sum of all positive net trade positions.Source: OECD/FAO (2015), “OECD-FAO Agricultural Outlook”, OECD Agriculture Statistics (database). doi: http://dx.doi.org/10.1787/agr-outl-data-en
PRODUCTION (mln L) Growth(%)1
DOMESTIC USE(mln L)
Growth(%)1 FUEL USE (mln L) Growth
(%)1 SHARE IN GASOLINE TYPE FUEL USE (%) NET TRADE (mln L)2
Average2012-14est
2024 2015-24Average2012-14est
2024 2015-24Average2012-14est
2024 2015-24
Energy share Volume shareAverage2012-14est
2024Average2012-14est
2024Average2012-14est
2024
NORTH AMERICACanada 1 853 2 039 0.08 2 880 3 034 0.52 2 880 3 034 0.52 4.7 5.1 6.8 7.4 -1 027 -996United States 53 961 56 691 0.04 52 499 55 063 0.05 51 452 53 447 -0.07 6.7 7.2 9.7 10.4 1 416 1 621
of which second generation 0 1 273 .. .. .. .. .. .. .. .. .. .. .. .. ..EUROPE
European Union 6 896 9 491 2.19 7 783 11 074 3.51 5 419 8 568 4.78 3.1 5.4 4.5 7.8 -887 -1 583of which second generation 67 430 .. .. .. .. .. .. .. .. .. .. .. .. ..
OCEANIA DEVELOPEDAustralia 340 348 0.05 327 347 0.05 327 347 0.05 1.0 1.0 1.4 1.5 13 0
OTHER DEVELOPEDJapan 356 361 0.00 1 338 1 774 1.50 887 1 298 2.11 0.0 0.0 0.0 0.0 -982 -1 413South Africa 265 466 6.53 87 263 11.22 46 222 15.53 .. .. .. .. 179 203
SUB-SAHARAN AFRICAMozambique 92 128 0.67 126 160 2.27 70 103 3.69 .. .. .. .. -34 -33Tanzania 145 195 0.39 199 254 2.35 110 163 3.82 .. .. .. .. -53 -59
LATIN AMERICA ANDCARRIBBEAN
Argentina 664 1 750 6.21 598 1 130 3.65 495 1 023 4.13 4.1 7.9 5.9 11.3 65 620Brazil 26 566 42 482 3.71 24 367 38 968 3.13 22 600 36 890 3.26 37.7 45.0 47.5 55.0 2 199 3 514Colombia 417 536 3.01 531 695 2.96 460 621 3.33 .. .. .. .. -114 -159Mexico 84 227 9.19 285 533 3.06 0 0 .. 0.0 0.0 0.0 0.0 -200 -306Peru 361 377 0.38 331 368 1.63 234 283 2.14 .. .. .. .. 29 9
ASIA AND PACIFICChina 8 064 8 898 1.54 8 185 9 334 2.10 5 294 6 153 2.16 3.0 1.9 4.4 2.7 -121 -436India 2 081 2 317 0.14 1 943 2 426 1.37 1 138 1 595 2.10 .. .. .. .. 138 -109Indonesia 197 207 0.66 156 209 1.31 108 157 1.75 .. .. .. .. 41 -2Malaysia 0 0 -0.01 0 0 1.26 0 0 2.30 .. .. .. .. 0 0Philippines 191 294 0.64 519 736 2.43 462 663 2.71 .. .. .. .. -328 -442Thailand 1 242 2 323 5.09 1 092 2 100 4.71 984 1 980 5.08 .. .. .. .. 150 223Turkey 104 118 0.24 160 170 1.08 105 117 1.57 .. .. .. .. -55 -52Viet Nam 448 582 2.74 357 475 2.47 254 380 3.15 .. .. .. .. 91 108
TOTAL 108 197 134 436 1.57 107 771 134 118 1.58 93 777 117 522 1.57 7.0 7.8 10.1 11.3 5 667 4 300
OECD-FAO AGRICULTURAL OUTLOOK 2015 © OECD/FAO 2015 141
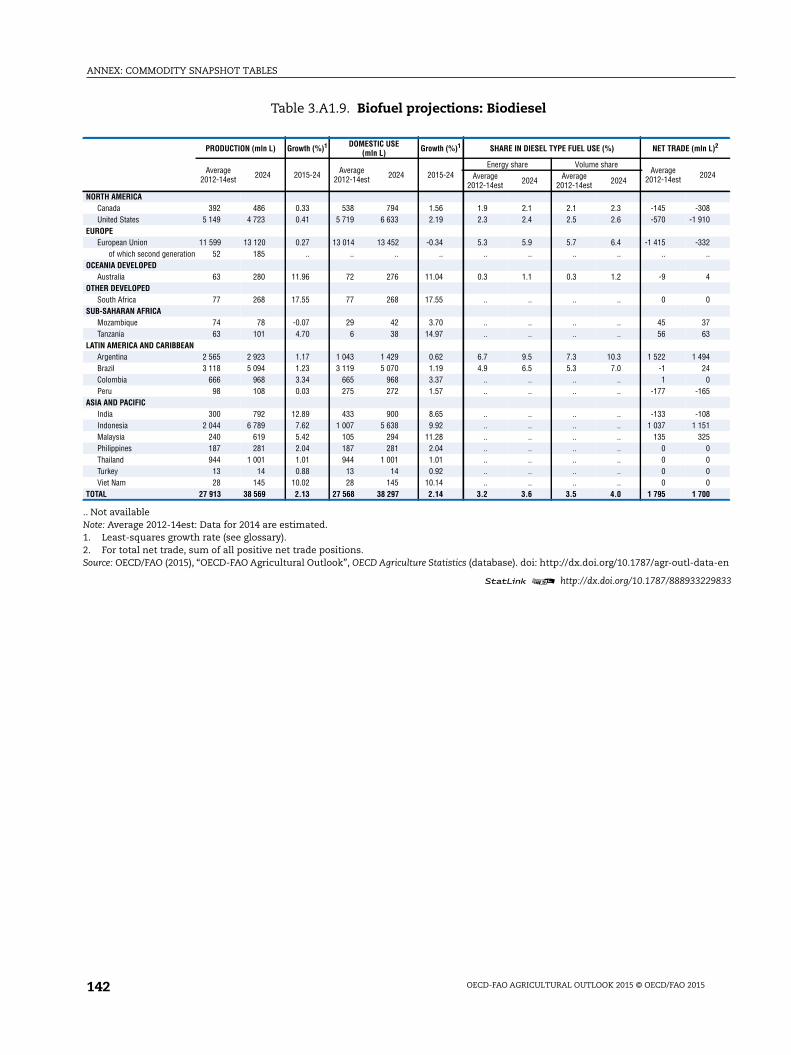
ANNEX: COMMODITY SNAPSHOT TABLES
Table 3.A1.9. Biofuel projections: Biodiesel
1 2 http://dx.doi.org/10.1787/888933229833
.. Not availableNote: Average 2012-14est: Data for 2014 are estimated.1. Least-squares growth rate (see glossary).2. For total net trade, sum of all positive net trade positions.Source: OECD/FAO (2015), “OECD-FAO Agricultural Outlook”, OECD Agriculture Statistics (database). doi: http://dx.doi.org/10.1787/agr-outl-data-en
PRODUCTION (mln L) Growth (%)1 DOMESTIC USE(mln L) Growth (%)1 SHARE IN DIESEL TYPE FUEL USE (%) NET TRADE (mln L)2
Average2012-14est 2024 2015-24 Average
2012-14est 2024 2015-24Energy share Volume share
Average2012-14est 2024Average
2012-14est 2024 Average2012-14est 2024
NORTH AMERICACanada 392 486 0.33 538 794 1.56 1.9 2.1 2.1 2.3 -145 -308United States 5 149 4 723 0.41 5 719 6 633 2.19 2.3 2.4 2.5 2.6 -570 -1 910
EUROPEEuropean Union 11 599 13 120 0.27 13 014 13 452 -0.34 5.3 5.9 5.7 6.4 -1 415 -332
of which second generation 52 185 .. .. .. .. .. .. .. .. .. ..OCEANIA DEVELOPED
Australia 63 280 11.96 72 276 11.04 0.3 1.1 0.3 1.2 -9 4OTHER DEVELOPED
South Africa 77 268 17.55 77 268 17.55 .. .. .. .. 0 0SUB-SAHARAN AFRICA
Mozambique 74 78 -0.07 29 42 3.70 .. .. .. .. 45 37Tanzania 63 101 4.70 6 38 14.97 .. .. .. .. 56 63
LATIN AMERICA AND CARIBBEANArgentina 2 565 2 923 1.17 1 043 1 429 0.62 6.7 9.5 7.3 10.3 1 522 1 494Brazil 3 118 5 094 1.23 3 119 5 070 1.19 4.9 6.5 5.3 7.0 -1 24Colombia 666 968 3.34 665 968 3.37 .. .. .. .. 1 0Peru 98 108 0.03 275 272 1.57 .. .. .. .. -177 -165
ASIA AND PACIFICIndia 300 792 12.89 433 900 8.65 .. .. .. .. -133 -108Indonesia 2 044 6 789 7.62 1 007 5 638 9.92 .. .. .. .. 1 037 1 151Malaysia 240 619 5.42 105 294 11.28 .. .. .. .. 135 325Philippines 187 281 2.04 187 281 2.04 .. .. .. .. 0 0Thailand 944 1 001 1.01 944 1 001 1.01 .. .. .. .. 0 0Turkey 13 14 0.88 13 14 0.92 .. .. .. .. 0 0Viet Nam 28 145 10.02 28 145 10.14 .. .. .. .. 0 0
TOTAL 27 913 38 569 2.13 27 568 38 297 2.14 3.2 3.6 3.5 4.0 1 795 1 700
OECD-FAO AGRICULTURAL OUTLOOK 2015 © OECD/FAO 2015142
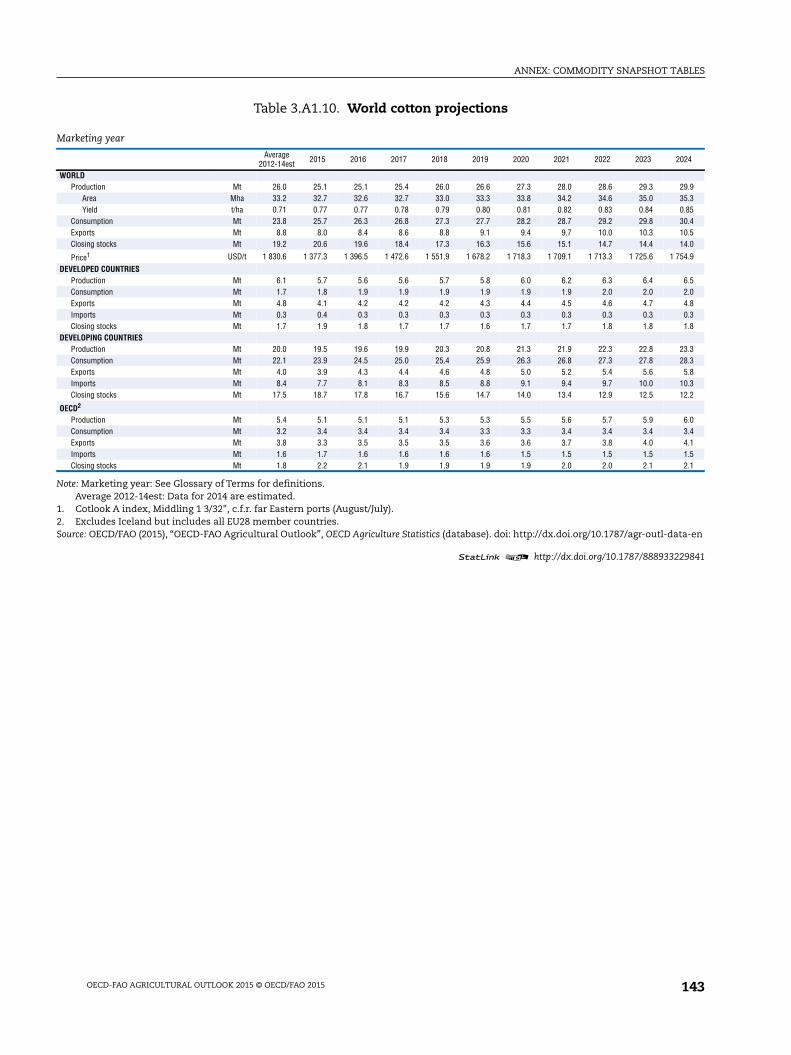
ANNEX: COMMODITY SNAPSHOT TABLES
Table 3.A1.10. World cotton projections
1 2 http://dx.doi.org/10.1787/888933229841
Note: Marketing year: See Glossary of Terms for definitions.Average 2012-14est: Data for 2014 are estimated.
1. Cotlook A index, Middling 1 3/32", c.f.r. far Eastern ports (August/July).2. Excludes Iceland but includes all EU28 member countries.Source: OECD/FAO (2015), “OECD-FAO Agricultural Outlook”, OECD Agriculture Statistics (database). doi: http://dx.doi.org/10.1787/agr-outl-data-en
Marketing year
Average2012-14est 2015 2016 2017 2018 2019 2020 2021 2022 2023 2024
WORLDProduction Mt 26.0 25.1 25.1 25.4 26.0 26.6 27.3 28.0 28.6 29.3 29.9
Area Mha 33.2 32.7 32.6 32.7 33.0 33.3 33.8 34.2 34.6 35.0 35.3Yield t/ha 0.71 0.77 0.77 0.78 0.79 0.80 0.81 0.82 0.83 0.84 0.85
Consumption Mt 23.8 25.7 26.3 26.8 27.3 27.7 28.2 28.7 29.2 29.8 30.4Exports Mt 8.8 8.0 8.4 8.6 8.8 9.1 9.4 9.7 10.0 10.3 10.5Closing stocks Mt 19.2 20.6 19.6 18.4 17.3 16.3 15.6 15.1 14.7 14.4 14.0
Price1 USD/t 1 830.6 1 377.3 1 396.5 1 472.6 1 551.9 1 678.2 1 718.3 1 709.1 1 713.3 1 725.6 1 754.9
DEVELOPED COUNTRIESProduction Mt 6.1 5.7 5.6 5.6 5.7 5.8 6.0 6.2 6.3 6.4 6.5Consumption Mt 1.7 1.8 1.9 1.9 1.9 1.9 1.9 1.9 2.0 2.0 2.0Exports Mt 4.8 4.1 4.2 4.2 4.2 4.3 4.4 4.5 4.6 4.7 4.8Imports Mt 0.3 0.4 0.3 0.3 0.3 0.3 0.3 0.3 0.3 0.3 0.3Closing stocks Mt 1.7 1.9 1.8 1.7 1.7 1.6 1.7 1.7 1.8 1.8 1.8
DEVELOPING COUNTRIESProduction Mt 20.0 19.5 19.6 19.9 20.3 20.8 21.3 21.9 22.3 22.8 23.3Consumption Mt 22.1 23.9 24.5 25.0 25.4 25.9 26.3 26.8 27.3 27.8 28.3Exports Mt 4.0 3.9 4.3 4.4 4.6 4.8 5.0 5.2 5.4 5.6 5.8Imports Mt 8.4 7.7 8.1 8.3 8.5 8.8 9.1 9.4 9.7 10.0 10.3Closing stocks Mt 17.5 18.7 17.8 16.7 15.6 14.7 14.0 13.4 12.9 12.5 12.2
OECD2
Production Mt 5.4 5.1 5.1 5.1 5.3 5.3 5.5 5.6 5.7 5.9 6.0Consumption Mt 3.2 3.4 3.4 3.4 3.4 3.3 3.3 3.4 3.4 3.4 3.4Exports Mt 3.8 3.3 3.5 3.5 3.5 3.6 3.6 3.7 3.8 4.0 4.1Imports Mt 1.6 1.7 1.6 1.6 1.6 1.6 1.5 1.5 1.5 1.5 1.5Closing stocks Mt 1.8 2.2 2.1 1.9 1.9 1.9 1.9 2.0 2.0 2.1 2.1
OECD-FAO AGRICULTURAL OUTLOOK 2015 © OECD/FAO 2015 143


OECD PUBLISHING, 2, rue André-Pascal, 75775 PARIS CEDEX 16
(51 2015 02 1) ISBN 978-92-64-23190-0 – 2015
Consult this publication on line at http://dx.doi.org/10.1787/agr_outlook-2015-en.
This work is published on the OECD iLibrary, which gathers all OECD books, periodicals and statistical databases.Visit www.oecd-ilibrary.org for more information.
OECD-FAO Agricultural Outlook 2015-2024
OECD-FAO Agricultural Outlook 2015-2024The twenty-fi rst OECD edition of the Agricultural Outlook, and the eleventh prepared jointly with the Food and Agriculture Organization of the United Nations (FAO), provides projections to 2024 for major agricultural commodities, biofuels and fi sh. Notable in the 2015 report is a special feature on Brazil.
Real commodity prices are projected to resume their long-term decline on the basis of on-trend productivity growth and lower input prices. Brazil is poised to become the foremost supplier in meeting additional global demand, mostly originating from Asia. Opportunities exist to extend the benefi ts of Brazil’s growth to the poorest and to reduce the pressure on natural resources.
Contents
Executive summary
Chapter 1. Overview of the OECD-FAO Agricultural Outlook 2015-2024
Chapter 2. Brazilian agriculture: Prospects and challenges
Chapter 3. Commodity snapshots
More detailed commodity chapters are available on line at http://dx.doi.org/10.1787/agr_outlook-2015-en.
The projections and past trends presented in the statistical annex can be viewed in more detail at http://dx.doi.org/10.1787/agr-outl-data-en.
Supplementary information can be found at www.agri-outlook.org.
OE
CD
-FAO
Ag
ricultural Outlo
ok 2015-2024
2015
2015ISBN 978-92-64-23190-0
51 2015 02 1 P 9HSTCQE*cdbjaa+