Embed Size (px)
Citation preview

The University of Manchester Research
Occupational safety and health management in developingcountriesDOI:10.1080/10803548.2018.1482649
Document VersionAccepted author manuscript
Link to publication record in Manchester Research Explorer
Citation for published version (APA):Simukonda, W., Manu, P., Mahamadu, A. M., & Dziekonski, K. (2018). Occupational safety and healthmanagement in developing countries: a study of construction companies in Malawi. International Journal ofOccupational Safety and Ergonomics. https://doi.org/10.1080/10803548.2018.1482649
Published in:International Journal of Occupational Safety and Ergonomics
Citing this paperPlease note that where the full-text provided on Manchester Research Explorer is the Author Accepted Manuscriptor Proof version this may differ from the final Published version. If citing, it is advised that you check and use thepublisher's definitive version.
General rightsCopyright and moral rights for the publications made accessible in the Research Explorer are retained by theauthors and/or other copyright owners and it is a condition of accessing publications that users recognise andabide by the legal requirements associated with these rights.
Takedown policyIf you believe that this document breaches copyright please refer to the University of Manchester’s TakedownProcedures [http://man.ac.uk/04Y6Bo] or contact [email protected] providingrelevant details, so we can investigate your claim.
Download date:11. Nov. 2020

OCCUPATIONAL SAFETY AND HEALTH MANAGEMENT IN DEVELOPING COUNTRIES: A STUDY OF CONSTRUCTION COMPANIES IN MALAWI
a Wakisa Simukonda, b Patrick Manu*, b Abdul-Majeed Mahamadu, and b Krzysztof Dziekonski
a Faculty of Built Environment, University of Malawi-The Polytechnic, Blantyre, Malawi.
b Department of Architecture and the Built Environment, University of the West of England, Bristol, BS16 1QY, United Kingdom.
*Corresponding Author: Dr Patrick Manu Email: [email protected]
The Version of Record of this manuscript has been published and is available in the International Journal of Occupational Safety and Ergonomics, published on 30th May 2018, at https://www.tandfonline.com/doi/abs/10.1080/10803548.2018.1482649

Abstract
Purpose: Whilst occupational safety and health (OSH) management is recognised as an important mechanism for addressing poor OSH performance, limited empirical insight is available on OSH management by construction companies in sub-Saharan Africa. This study investigated OSH management by construction companies (i.e. contractors) in Malawi in order to unpick implementation issues that need attention.
Materials and methods: 46 OSH management practices were probed through a survey of contractors.
Results: Implementation of OSH practices amongst contractors is low, particularly for practices related to the policy, organising, measuring and reviewing, and auditing elements of OSH management. Company size, is associated with implementation of nearly a half of the 46 OSH practices. Certification of company to Standard No. OHSAS 1800:2007 is associated with the implementation of fewer practices.
Conclusions: OSH management improvement efforts would need to focus on the elements with particularly low implementation of practices as well as include initiatives that focus on helping micro enterprises to improve their OSH management. Association between business characteristics and OSH management may be more evident with certain elements such as the organising element. Furthermore, certification to Standard No. OHSAS 1800:2007 may not necessarily translate into greater implementation of OSH management practices, especially in developing countries.
Keywords: construction; developing countries; occupational safety and health management; sub-Saharan Africa; survey.
1. Introduction
Construction workers’ occupational safety and health (OSH) continues to be a problem in several countries as the industry is characterised by high numbers of work-related injuries and illnesses [1-4]. In the US, the construction industry was responsible for 774 and 991 fatal injuries in 2010 and 2016, respectively [5,6]. In the UK, the Health and Safety Executive (HSE) [7] states that 6% of construction workers either suffer from illnesses or sustain injuries caused or aggravated by the nature of their construction work, annually. Construction sites in developing countries are not in the state of utopia either. The fatal injury rate (i.e., the number of occupational fatal injuries per 100,000 workers) and accidents rate (i.e., the number of occupational accidents per 100,000 workers) for sub-Saharan African countries are estimated to be 21 per 100,000 workers and 16,012 per 100,000 workers, respectively [8]. The construction industry is ranked second in Tanzania [9] and third in South Africa [8] as the largest contributor to occupational accidents. Whilst it is responsible for 9.6% of fatal injuries in Tanzania [10], the industry accounted for 376 fatal injuries in South Africa for the period of 2004 to 2008 [8]. Statistics for construction safety and health accidents in Malawi are not available because data is non-existent [11,12]. However, the International Labour Organisation

(ILO) OSH estimates for Malawi in all occupations indicate that the number of accidents causing more than 3 days of absence from work was almost a million for the period of 2004 to 2009 [13], an average of 200,000 accidents per year. Inferring from the construction OSH situation in Tanzania and South Africa, which share similar characteristics with Malawi, the construction OSH situation in Malawi can also be said to be poor. The economic impacts of occupational injuries and illnesses on enterprise performance are unprecedented. Among others, occupational injuries and illnesses disrupt production process, deteriorate human capital and damage the corporate image [2,14,15]. In the UK, occupational injuries and illnesses in construction were associated with an estimated loss of 1.7 million working days and GBP 0.9 billion for the period of 2014 to 2015 and 2013 to 2014, respectively [7]. Overall, occupational injuries and illnesses account for a loss of about 1% to 6% of a nation’s gross domestic product [16] and about 4% of the global gross domestic product [12]. However, occupational safety and health management systems (OSH MSs) have been recognised as an important means for improving OSH performance. OSH MSs are reported to promote safety climate and corporate image, increase production and prevent the loss of human capital and associated costs [14,17-19]. Realising the importance of OSH management, the Malawi government launched a five-year national OSH programme to improve safety and health in workplaces in line with the Malawi decent work agenda for the period of 2011 to 2016 [12]. Its overarching goal was to achieve a continual reduction of at least 5% in occupational fatal injuries through systematic management of OSH, annually [12]. The specific objectives of the programme endeavoured to improve OSH management systems and infrastructure, enhance information management and dissemination, increase awareness of occupational tuberculosis and other diseases, and strengthen the legal OSH framework [12]. These objectives were designed to be realised through the formulation of a coherent national OSH policy, harmonisation of OSH legislation, increasing OSH awareness and improving accidents data recording system, among others [12]. While an evaluation of the impact of the programme is yet to be released, a textual analysis of the programme reveals some potential inadequacies. For instance, the OSH programme lacks initiatives targeting micro, small and medium-sized firms (SMEs) which according to previous studies [e.g., 20,21] struggle with OSH management. Furthermore, the programme neither explicitly mentions OSH MSs nor provides -direction as to which elements and practices of OSH management need attention so that improvement efforts can be targeted at those elements and practices. OSH management still depends on compliance with minimum regulations, presumably unknown by consumers and sluggishly enforced by authorities [13]. Additionally, studies have highlighted the dearth of literature on OSH management in construction within the sub-Saharan African region [22,23]. In Malawi, the only published study on OSH in the construction industry assessed the knowledge of legislation relative to safety and health and safety culture among construction industry professionals [11]. Thus, an in-depth analysis of OSH management practices of construction firms in Malawi is non-existent, creating a knowledge gap which needs to be addressed. Hence, the focus of this study is an investigation of OSH management practices implemented by construction firms in Malawi in order to unpick implementation issues that need attention.
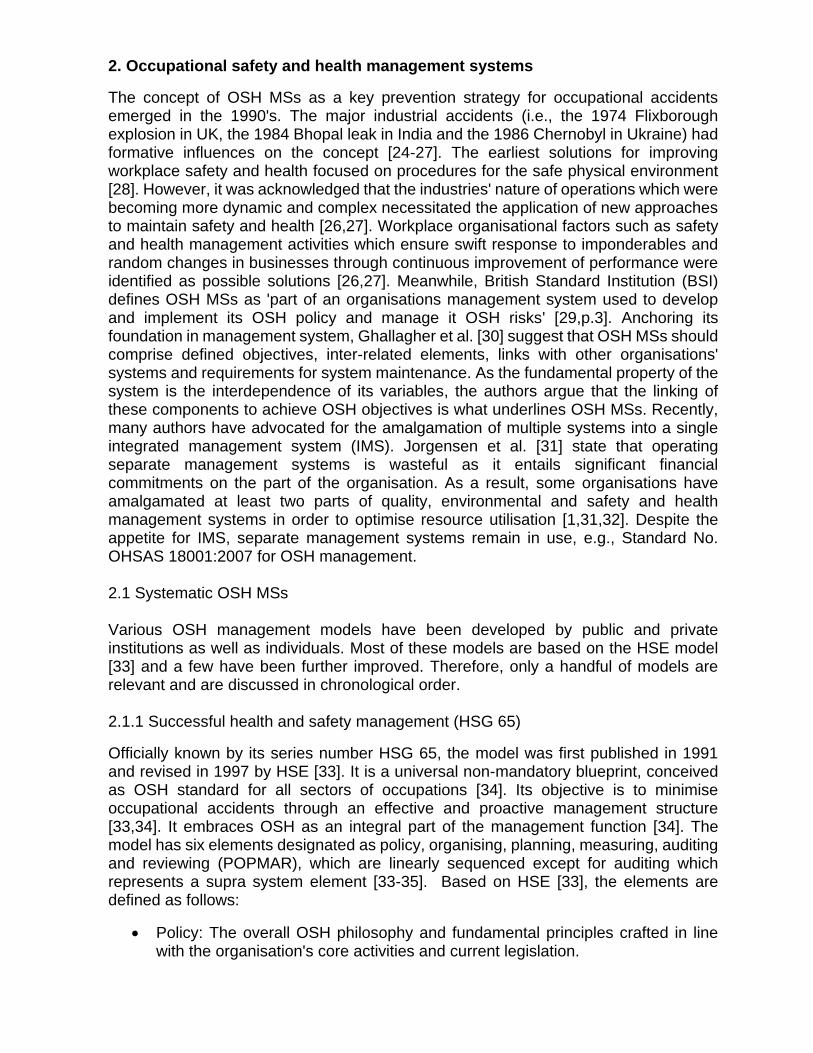
2. Occupational safety and health management systems
The concept of OSH MSs as a key prevention strategy for occupational accidents emerged in the 1990's. The major industrial accidents (i.e., the 1974 Flixborough explosion in UK, the 1984 Bhopal leak in India and the 1986 Chernobyl in Ukraine) had formative influences on the concept [24-27]. The earliest solutions for improving workplace safety and health focused on procedures for the safe physical environment [28]. However, it was acknowledged that the industries' nature of operations which were becoming more dynamic and complex necessitated the application of new approaches to maintain safety and health [26,27]. Workplace organisational factors such as safety and health management activities which ensure swift response to imponderables and random changes in businesses through continuous improvement of performance were identified as possible solutions [26,27]. Meanwhile, British Standard Institution (BSI) defines OSH MSs as 'part of an organisations management system used to develop and implement its OSH policy and manage it OSH risks' [29,p.3]. Anchoring its foundation in management system, Ghallagher et al. [30] suggest that OSH MSs should comprise defined objectives, inter-related elements, links with other organisations' systems and requirements for system maintenance. As the fundamental property of the system is the interdependence of its variables, the authors argue that the linking of these components to achieve OSH objectives is what underlines OSH MSs. Recently, many authors have advocated for the amalgamation of multiple systems into a single integrated management system (IMS). Jorgensen et al. [31] state that operating separate management systems is wasteful as it entails significant financial commitments on the part of the organisation. As a result, some organisations have amalgamated at least two parts of quality, environmental and safety and health management systems in order to optimise resource utilisation [1,31,32]. Despite the appetite for IMS, separate management systems remain in use, e.g., Standard No. OHSAS 18001:2007 for OSH management. 2.1 Systematic OSH MSs Various OSH management models have been developed by public and private institutions as well as individuals. Most of these models are based on the HSE model [33] and a few have been further improved. Therefore, only a handful of models are relevant and are discussed in chronological order. 2.1.1 Successful health and safety management (HSG 65)
Officially known by its series number HSG 65, the model was first published in 1991 and revised in 1997 by HSE [33]. It is a universal non-mandatory blueprint, conceived as OSH standard for all sectors of occupations [34]. Its objective is to minimise occupational accidents through an effective and proactive management structure [33,34]. It embraces OSH as an integral part of the management function [34]. The model has six elements designated as policy, organising, planning, measuring, auditing and reviewing (POPMAR), which are linearly sequenced except for auditing which represents a supra system element [33-35]. Based on HSE [33], the elements are defined as follows:
Policy: The overall OSH philosophy and fundamental principles crafted in line with the organisation's core activities and current legislation.

Organising: Designing an effective management structure and allocating resources for delivery of OSH policy.
Planning and implementation: Sequencing action steps to guide implementation of safety and health policy through a systematic OSH management structure and the actual operation.
Measuring performance: Actual measurement of performance against the set standards to determine areas which need improvement through active and reactive monitoring.
Auditing: Conducting an independent audit of the performance of the overall OSH MSs to ensure its perfect functioning for the continuous improvement of the OSH MS.
Reviewing performance: The systematic review of the effectiveness of OSH MSs based on feedback from measuring and auditing and applying lessons learnt to improve the systems' performance.
Whilst the model is easier to comprehend, it has been criticised for lack of clarity and specification of its inputs and outputs, lack of empirical evidence to support its practicality and redundancy of auditing and measuring performance [35,36]. Nevertheless, the model is the basis of succeeding OSH management models. 2.1.2 Standard No. OHSAS 18001:2007
In late 1990's, OSH MSs certification was becoming a long-range strategy for organisation's business competition and conformance in a number of areas [32,36]. As a result, organisations started demanding OSH MSs against which their safety and health management systems could be evaluated and certified [29,37]. This led to the development of Standard No. OHSAS 18001:1999 which was revised in 2007. The main objective of the standard is to create and maintain a safe working environment [37] and promote good health of workers [18,38] through systematic safety and health management [37,39]. Its main elements include OSH policy, planning, implementation and operation, checking and corrective action, and management review [29]. The standard is based on Deming's philosophy of plan, do, check, act (PDCA) process which promotes principles of continuous improvement and internalisation of safety and health into core business management [17,35,37]. Other standards (e.g., Standard No. ISO 9001:2000 (quality management system-requirements) and Standard No. ISO 14001:2004 (environmental management system-requirements with guidance for use)) adopt the same approach and therefore are compatible with Standard No. OHSAS 18001:2007 [40]. Despite being criticised for lack of cogent direction and clarification on the purpose of non-financial audit [35], Standard No. OHSAS 18001:2007 is a compellable international OSH MS of choice [29].
2.1.3 McDonald's et al. safety management model
The model coalesces salient components of the HSE model and safety culture of Pidgeon and O'Leary [33,41]. It is a self-regulatory feedback model with seven elements divided into two levels of safety management functions, namely, operational performance and system auditing [35]. Operational performance comprises policy,

standards, planning and organising and normal operational practice and the whole system is subject to audit and review [41]. Overall, the model is comprehensible and its linear-structured elements are easy to follow. Nevertheless, the model lacks clear interrelated relationships among its elements and supplementary pragmatic evidence [35] to corroborate its effectiveness in addressing safety issues in its niche. 2.1.4 Perezgonzalez's safety management model
Perezgonzalez's [35] model presents an enhanced hypothetical safety management model by exploiting gaps in the HSE [33] and McDonald's et al. [41] models. Its main elements include policy, planning and organisation, operational practice and monitoring [35]. It also has pre-adjustment and change and post adjustment and change stages which inform operational practice and organisational OSH goals at the higher level in order to influence desired outcomes [35].
2.1.5 ILO-OSH 2001
The model reflects the universal principles enshrined in ILO's OSH model particularly OSH convention of 1981 (i.e., No. 155) [26]. It is intended to be used at both the organisational and the national levels, non-mandatorily [26,27]. At the organisational level, the guidance promotes incorporation of OSH MSs components into the organisational overall policy and management arrangements while at the national level, it encourages the establishment of a national framework for OSH MSs supported by national laws and regulations [27]. The model has five elements including OSH policy, planning, implementation, measuring and evaluation, and management review [26,27].
2.1.6 HSE managing for health and safety
The HSE [42] OSH management model abandons the POPMAR structure and adopts a plan, do, check, act (PDCA) approach. Like previous versions, the model seeks to help organisations develop and implement OSH management arrangements while abiding by the law [42]. The elements of this model include plan (i.e., policy and planning), do (i.e., risk profiling, organising and implementing the plan), check (i.e., measuring performance and investigating incidents, and act (i.e., learning lessons and reviewing performance) [33]. Overall, the majority of the models are based on the original model of HSE [33] in terms of their elements and corresponding safety and health practices. As such, the models inherit the weaknesses of the HSE [33] model, particularly by presenting a management process rather than a management system for addressing the OSH incidences. Table 1 summarises the key elements of the models discussed above.
[Insert Table 1 approximately here]
2.2 Effectiveness of OSH MSs: The research evidence
Robson et al. [17] state that the current strand of literature does not unequivocally demonstrate the practical effectiveness of OSH MSs in addressing safety and health challenges. Nevertheless, there are arguments in favour of the value of OSH MSs in addressing safety and health challenges in all sectors, including the construction industry. Robson et al. [17] conducted a systematic literature review of thirteen articles

on the effectiveness of OSH MSs in addressing occupational accidents. The findings revealed that accidents frequency decreased by 24% to 34% and 18% for voluntary and mandatory OSH MSs, respectively [17]. In addition, 13% to 52% decrease in workers' compensation was recorded over a period of three years [17]. Yoon et al. [19] conducted a study on the effect of OSH MSs on work-related accident rates in the South Korean construction industry. They found annual average accident rates of 0.18 and 0.30 victims per 100 employees for OSH MS certified and non-certified construction companies, respectively [19]. Furthermore, the fatal accident rates for OSH MS certified companies plummeted by 10.3% when compared to non-certified companies [19]. On the other hand, Abad et al. [2] studied the impact of Standard No. OHSAS 18001:2007 on safety performance and labour productivity in 149 Spanish companies between 2006 and 2009. The study revealed a 1.43% decrease in the rate of accidents, a 4.21% increase in labour productivity and a deeper embedded safety culture as a result of an extra year of safety experience, yielding a further 0.80% reduction in accidents rates [2]. These studies and others, demonstrate the effectiveness of OSH MSs in addressing OSH management performance challenges. 3. Research Design
The overarching aim of the study was to investigate the OSH management practices implemented by construction companies in Malawi in order to identify the safety and health management elements and practices which need improvement. In order to achieve the aim, a quantitative research design, in particular, a survey was adopted. The quantitative survey was used due to its suitability for obtaining a generalised view of a phenomenon [43], which in the case of this study is the OSH management practices of construction companies in Malawi. The survey strategy has also been used by previous studies that examined OSH management practices by construction companies in other developing countries [20,21]. This study targeted senior company management personnel such as directors, OSH managers and engineers as they are more likely to have good knowledge of their companies' safety and health management practices [21].
3.1 Survey design
A questionnaire instrument was designed for the survey. The questionnaire comprised multiple questions with fixed response categories, i.e., dichotomous yes or no and multiple choices, as well as open-ended questions. The questionnaire comprised three sections as follows: (a) introduction (i.e., a prefatory section containing general instructions for filling the questionnaire); (b) respondents' and company profile (i.e., sought information related to professional roles, experience, company size and age) which was used for establishing the relationship between business characteristics and implementation of OSH management practices; and (c) business safety and health management practices. Drawing from practices within OSH management elements (i.e., summarised in Table 1), the last section elicited responses on the OSH management practices implemented by construction companies in Malawi. A total of 46 OSH management practices were probed.
Prospective respondents were drawn from a list of construction firms compiled by Malawi’s National Construction Industry Council (NCIC) and registered for 2016 to 2017 financial year. The list comprised 1527 construction firms registered in building, civil and electrical engineering categories. A simple random sampling (SRS) aided by Microsoft Excel version 2016 was employed to draw a list of 320 firms from the population. Using

researchers' contacts in Malawi, the email addresses of the sampled contractors were obtained for the administration of the questionnaire. Where this was unsuccessful, the selected contractors were randomly replaced to maintain the sample size. A softcopy of the questionnaire together with a link to an online version hosted by Bristol Online Survey (BOS) was emailed to the selected contractors. Accompanying the questionnaire was a request for a company personnel in management role to complete the questionnaire.
3.2 Data analysis
The data was screened and coded in order to obtain numerical values for analysis. Subsequently, the data was exported to IBM Statistical Package for Social Science (SPSS) version 23.0. The level of implementation of OSH management practices by the construction companies was assessed based on Manu et al. [21] categorisation of the implementation levels, i.e., low implementation (i.e., where 0% to 49% of companies implement a practice), moderate implementation (i.e., where 50% to 59% of companies implement a practice) and high implementation (i.e., where over 70% of companies implement a practice). The procedure adopted for establishing the associations between business characteristics and the implementation of OSH management practices involved using Pearson's χ2 test as employed by Kheni et al. [20] and Manu et al. [21]. The dependent variables (i.e., implementation of OSH management practices) were dichotomous yes or no and were defined as yes (i.e., implementation of OSH management practice) and no (i.e., non-implementation of OSH management practice). Three hypotheses were formulated and tested. The hypotheses include: (a) H1: certification to Standard No. OHSAS 18001:2007 will be significantly associated with implementation of OSH management practice; (b) H2: company age (i.e., the number of years the company has been in operation) will be significantly associated with implementation of OSH management practice [20]; and (c) H3: company size will be significantly associated with implementation of OSH management practice [20]. 4. Results
The results of the study are presented below under three sections: (a) respondents' and company profile; (b) OSH management practices; and (c) the relationship between the business characteristics and implementation of OSH management practices.
4.1 Respondents' and company profile
The response rate and professional roles of the respondents are shown in Tables 2 and 3, respectively. The response rate is regarded as good considering that the normal response rate in construction ranges from 20% to 30% [44]. The mean working experience (in years) of the respondents is 7.0 and a banded distribution of their experience is also shown in Figure 1. Taken together, the responses provided by the respondents can thus be considered to be an accurate depiction of their companies' OSH management practices.
[Insert Table 2 approximately here]
[Insert Table 3 approximately here]

[Insert Figure 1 approximately here] Figure 1: Respondents’ working experience
(Note: Sum of % is less than 100% due to non-response by some participant)
Table 4 summarises the companies' profile. Over 70% of the companies are micro and small companies. This is in consonance with the demographic profile of companies in the construction industry of other countries [20,21,45], where the sector is largely dominated by micro and small enterprises. Just like in other countries [21], the category of firm's registration in Malawi is not mutually exclusive as companies sometimes undertake multiple work categories such as building works and civil engineering works as evidenced by the results in Table 4. Figure 2 also shows that fewer than 20% of the companies are certified to Standard No. OHSAS 18001:2007.
[Insert Table 4 approximately here]
[Insert Figure 2 approximately here]
Figure 2: Certification to Standard No. OHSAS 18001: 2007 by construction companies (Note: Sum of % is less than 100% due to non-response by some participants)
4.2 OSH management practices
Table 5 presents results of statistical analysis of OSH management practices. As previously mentioned the practices were dichotomous yes or no and were defined as follows: 1 = yes (i.e., implementation of safety and health management practice) and 0 = no (i.e., non-implementation of safety and health management practice). In order to show the OSH management practices implemented across the sample of construction firms, attention is drawn to the percentage of companies that implement a practice. As highlighted earlier, the levels of implementation are categorised into low implementation (i.e., 0% to 49%), moderate implementation (i.e., 50% to 69%) and high implementation (i.e., over 70%) [21]. The findings are discussed below under the key elements of safety and health management.
Policy: This element assessed two safety and health management practices. The findings indicate low implementation for pol1 and pol2 (i.e., 44.0% and 41.3%, respectively).
Organising: Fourteen practices were assessed within this element. Org3 recorded high implementation (i.e., 70.7%) while org1 and org9 showed moderate implementation (i.e., 52.0% and 56.0%, respectively). Low implementation was registered for the remaining eleven practices.
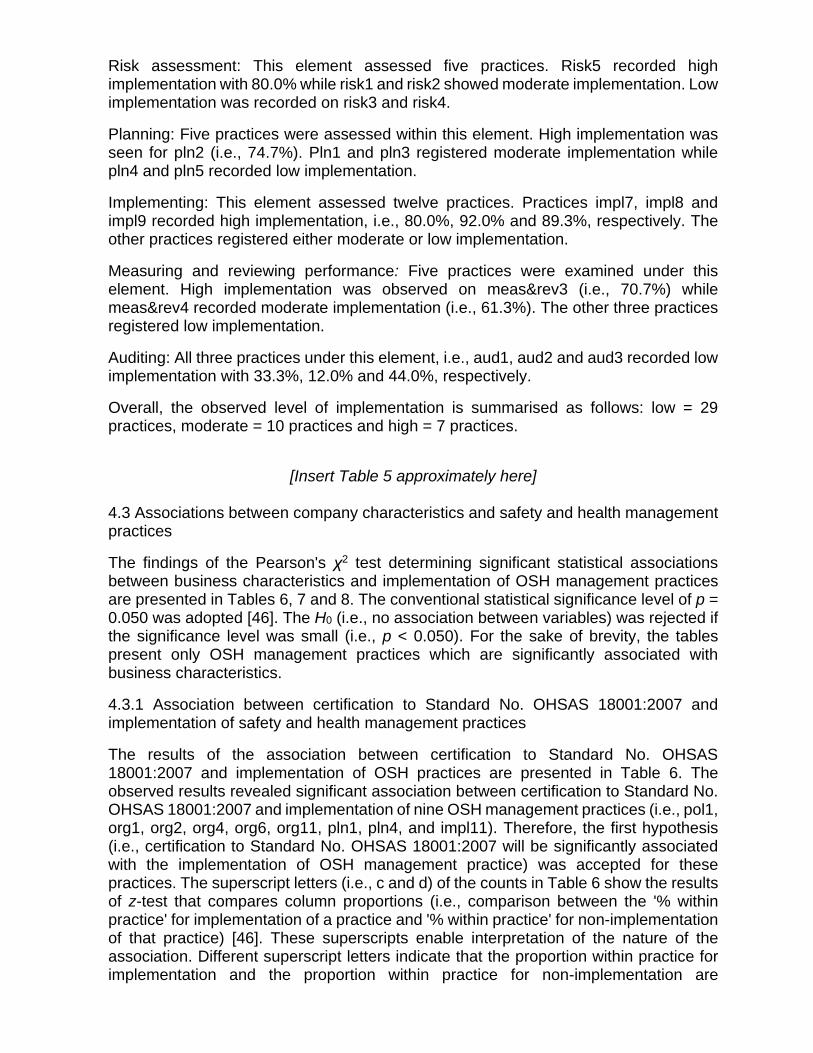
Risk assessment: This element assessed five practices. Risk5 recorded high implementation with 80.0% while risk1 and risk2 showed moderate implementation. Low implementation was recorded on risk3 and risk4.
Planning: Five practices were assessed within this element. High implementation was seen for pln2 (i.e., 74.7%). Pln1 and pln3 registered moderate implementation while pln4 and pln5 recorded low implementation.
Implementing: This element assessed twelve practices. Practices impl7, impl8 and impl9 recorded high implementation, i.e., 80.0%, 92.0% and 89.3%, respectively. The other practices registered either moderate or low implementation.
Measuring and reviewing performance: Five practices were examined under this element. High implementation was observed on meas&rev3 (i.e., 70.7%) while meas&rev4 recorded moderate implementation (i.e., 61.3%). The other three practices registered low implementation.
Auditing: All three practices under this element, i.e., aud1, aud2 and aud3 recorded low implementation with 33.3%, 12.0% and 44.0%, respectively.
Overall, the observed level of implementation is summarised as follows: low = 29 practices, moderate = 10 practices and high = 7 practices.
[Insert Table 5 approximately here]
4.3 Associations between company characteristics and safety and health management practices
The findings of the Pearson's χ2 test determining significant statistical associations between business characteristics and implementation of OSH management practices are presented in Tables 6, 7 and 8. The conventional statistical significance level of p = 0.050 was adopted [46]. The H0 (i.e., no association between variables) was rejected if the significance level was small (i.e., p < 0.050). For the sake of brevity, the tables present only OSH management practices which are significantly associated with business characteristics.
4.3.1 Association between certification to Standard No. OHSAS 18001:2007 and implementation of safety and health management practices
The results of the association between certification to Standard No. OHSAS 18001:2007 and implementation of OSH practices are presented in Table 6. The observed results revealed significant association between certification to Standard No. OHSAS 18001:2007 and implementation of nine OSH management practices (i.e., pol1, org1, org2, org4, org6, org11, pln1, pln4, and impl11). Therefore, the first hypothesis (i.e., certification to Standard No. OHSAS 18001:2007 will be significantly associated with the implementation of OSH management practice) was accepted for these practices. The superscript letters (i.e., c and d) of the counts in Table 6 show the results of z-test that compares column proportions (i.e., comparison between the '% within practice' for implementation of a practice and '% within practice' for non-implementation of that practice) [46]. These superscripts enable interpretation of the nature of the association. Different superscript letters indicate that the proportion within practice for implementation and the proportion within practice for non-implementation are

significantly different [46]. For example, for pol1, the different superscript letters for 36 and 21 means that 90.0% is significantly different from 67.7%. Similarly, the 10.0% and 32.3% are significantly different. Thus the proportion of companies not certified to Standard No. OHSAS 18001:2007 that do not implement pol1 (i.e., 90.0%) is significantly greater than the proportion of non-certified companies that implement pol1 (i.e., 67.7%). Conversely, the proportion of companies certified to Standard No. OHSAS 18001:2007 that do not implement pol1 (i.e., 10.0%) is significantly less than the proportion that implement pol1 (i.e., 32.3%). The pattern of association thus suggests that companies that are certified to Standard No. OHSAS 18001:2007 are more likely to implement pol1. This pattern of association applies to the other practices in Table 6 as shown by the different superscript letters for the counts of those practices.
4.3.2 Association between company age and the implementation of safety and health management practices
The cross-tabulation (see Table 7), presents findings of the association between company age and the implementation of OSH management practices. The findings reveal that company age is significantly associated with 10 OSH practices, namely, pol2, org1, org3, org7, org8, org13, risk2, pln1, impl11 and aud1. As such, the second hypothesis (i.e., company age will be significantly associated with the implementation of OSH management) is accepted for these practices. An examination of the superscript letters of the counts in Table 7 reveals an overall pattern such that, as companies get older (i.e., company age increases), the more likely they are to implement these practices. For instance for pol2, a significantly greater proportion of the companies aged up to 10 years do not implement pol2. Amongst companies aged between 11 and 50 years there is no significant difference between the proportion that implement and the proportion that do not implement pol2. However, for companies aged over 50 years, a significantly greater proportion implement pol2.
4.3.3 Association between business size and implementation of OSH management practices The contingency Table 8 presents findings of the association between company size and implementation of OSH management practices. Likelihood ratio was used to interpret the results because more than 20% of the expected counts were less than 5 [46]. The findings reveal significant associations between company size and 20 OSH management practices. Therefore, the third hypothesis (i.e., company size will be significantly associated with the implementation of OSH management practice) is accepted for these practices. An examination of the superscript letters of the counts in Table 8 reveals a general pattern of association such that, as company size moves from micro to medium, a company is more likely to implement those practices. For example, for pol1, pol2, org1, org2, org3, org4 and others, a significantly greater proportion of micro companies do not implement these practices. However, a significantly greater proportion of medium-sized companies implement those practices.
[Insert Table 6 approximately here]

[Insert Table 7 approximately here]
[Insert Table 8 approximately here]
5. Discussion
As highlighted above, the findings can be considered to give a credible reflection of the firms’ OSH management practices in view of the profile of the respondents, i.e., almost all of the respondents are in construction management related roles and they also have reasonable working experience in their roles. Similar respondents’ profiles were observed by Kheni et al. [20] and Manu et al. [21] in their studies on OSH management practices of construction businesses in Ghana, Malaysia, Thailand and Cambodia. Micro-sized firms and SMEs constituted over 90% of the companies which is again in consonance with previous studies [21,22]. Many of these companies were registered in over 1 billion MWK on NCIC scale of classification of contractors. Companies in this class are considered capable of executing large projects either independently or in partnerships. The study has revealed that the implementation of OSH management practices by construction firms in Malawi is generally poor. The general low implementation of OSH management practices observed in this study is in accord with the study by Takala et al. [47] which indicated an inverse relationship between national competitiveness (i.e., as measured by the World Economic Forum [48] global competitiveness index) and rate of occupational fatal accidents. National competitiveness is defined as, ‘the set of institutions, policies and factors that determine the level of productivity’ [48, p. ix]. This inverse relationship suggests that countries, like Malawi, which have a low competitiveness index [48], would have higher rates of occupational fatal accidents and by inference also have weaker systems for managing OSH. As summarised in Table 9, policy and auditing elements of OSH management are the least considered, with all practices within these elements registering low implementation. Other elements with unsatisfactory implementation levels of the OSH practices are organising (i.e., 78.6%), measuring and reviewing performance (i.e., 60%) and implementing (i.e., 50%). The low level of implementation of OSH practices within these elements is not surprising considering that the majority of firms are micro and SMEs. The implementation of OSH practices within these elements requires a commitment of resources. However, previous studies have noted that SMEs usually lack resources to enable them to invest in OSH management and other areas [22,49]. The observed association between the size of business and implementation of OSH management practices is thus in line with the extant literature. Kheni et al. [20] and Manu et al. [21] similarly reported associations between company size and implementation of OSH management practices. In addition, the results of the Pearson's χ2 test revealed that company age and firms' certification to Standard No. OHSAS 18001:2007 are significantly associated with the implementation of some OSH practices, particularly the practices within the organising

element. Thus younger firms and companies without certification to Standard No. OHSAS 18001:2007 are less likely to implement those OSH management practices. The association between certification to Standard No. OHSAS 18001:2007 and implementation of safety and health management practices is indirectly supported by the work of Yoon et al. [19] and Abad et al. [2] in which OSH management certification was associated with better OSH performance, and by inference better implementation of OSH management. However, it is interesting to note that certification to Standard No. OHSAS 18001:2007 is associated with the implementation of less than a quarter of the 46 practices (i.e., nine practices). Whilst this suggests that certification to Standard No. OHSAS 18001:2007 may be of low added value to OSH management by construction companies in Malawi, a plausible explanation for the observed limited association could be the cost involved in sustaining the requirements/expectations of the certification. This view is supported by studies which have reported that cost of implementation is a major barrier to the implementation of international management systems (e.g., environmental management systems) in developing countries [50,51]. The association between certification to Standard No. OHSAS 18001:2007 and the limited number of practices also raises a concern about: (1) the quality of the OSH management audits undertaken by the certifying organisations; and (2) the quality of routine monitoring undertaken by the certifying organisations to check that the requirements of the certification are being upheld. The auditing and routine monitoring are lax as shown by Table 5 (i.e., all the practices within auditing element registered low implementation). Furthermore, there was no association between certification to Standard No. OHSAS 18001:2007 and the implementation of practices within the auditing element (see Table 6). Thus, regarding (internal or external) OSH management auditing, there is no significant difference between certified and non-certified companies. This further confirms a laxity in the auditing and routine monitoring undertaken by certifying organisations. Literature shows that a national OSH programme can be instrumental as part of efforts to improve OSH performance [52,53]. For instance, an evaluation by the HSE Construction Division [53], in respect of the UK nation-wide safety and health initiative, namely, ‘Revitalising Health and Safety’ (RHS), showed that injury rates in construction persistently met the national RHS targets. Furthermore, an evaluation of the Vietnamese national OSH programme for the period 2006 to 2010 highlighted several impacts of the programme including: (a) a reduction in the rate of fatal injuries; (b) a decrease in the number of new cases of occupational diseases; (c) an increased attention amongst businesses to the development of safety and health management system; and (e) an increased awareness amongst enterprises about the importance of safety and health to production and productivity [52]. A subsequent iteration of the Vietnamese programme for the period 2011 to 2015 included specific objectives which focused on SMEs (e.g., a target to attain an annual average increase of 2000 SMEs which effectively apply safety and health management system) [52]. Such recognition of the need to pay attention to OSH management by SMEs could be useful, given the tendency for SMEs to lag in OSH management implementation as shown by this study and others [20,21]. However, referring to the Malawi national OSH programme, the programme seems to parade a one size fits all approach as it does not discriminate businesses based on characteristics such as size as recommended by Kheni et al. [20]. This approach can be ineffective in the construction sector due to the varied nature of construction activities/works and businesses undertaking those activities/works [54]. As

a result, it would be helpful for the Malawi national OSH programme to incorporate initiatives that seek to strengthen the capacity of micro companies in OSH management.
[Insert Table 9 approximately here]
6. Conclusion
Against the backdrop of the poor status of OSH in construction, particularly in developing countries, and coupled with the significance of OSH management by companies to OSH performance, this study inquired into the implementation of OSH management practices by contractors in Malawi. Overall, a low level of implementation of OSH management practices was observed. The least implemented OSH management practices were also observed to be related to the policy, organising, measuring and reviewing, and auditing elements of OSH management. Additionally, business characteristics, namely, company size, age and certification to Standard No. OHSAS 18001:2007 were associated with the implementation of some OSH practices, especially practices related to the organising element of OSH management. However, the association between company size and the implementation of OSH practices is more prominent. It would therefore be helpful if efforts aimed at improving OSH management within the construction sector of Malawi focus on the OSH management elements with particularly low implementation of practices. Additionally, such efforts would need to include initiatives that focus on helping micro enterprises to improve their OSH management. Aligned to this, subsequent iterations of the Malawi national OSH programme could incorporate interventions targeted at these OSH management elements as well as micro businesses. The findings also contribute to the wider discourse on OSH management by suggesting that the association between business characteristics and OSH management may be more evident with certain elements such as the organising element. Furthermore, within the context of developing countries (where cost is a major barrier to implementation of international management systems), certification to Standard No. OHSAS 1800:2007 may not necessarily translate into greater implementation of OSH management practices. Organisations that offer certification services would therefore need to tighten the quality of their OSH management audits and routine monitoring.
REFERENCES
[1] Zeng S, Tam W, Tam C. Towards occupational health and safety systems in the
construction industry in China. Saf Sci. 2008;46(8):1155-1168.
[2] Abad J, Lafuente E, Vilajosana J. An assessment of the OHSAS 18001
certification process: Objective and drivers and consequences on safety
performance and labour productivity. Saf Sci. 2013;60:47-56.
[3] Sousa V, Almeida NM, Dias LA. Risk-based management of occupational safety
and health in the construction industry-Part 1: Background knowledge. Saf Sci.
2014;66:75-86.
[4] Chandra HP. Initial investigation for potential motivators to achieve sustainable
construction safety and health. Proc Eng. 2015;125:103-108.
[5] Zhou Z, Goh Y, Li Q. Overview and analysis of safety management studies in the
construction industry. Saf Sci. 2015;72:337-350.
[6] Bureau of Labor Statistics [Internet]. Washington (DC): Bureau of Labor
Statistics; 2017. Census of fatal occupational injuries summary, 2016; 2017 Dec
17 [cited 2018 Jan 5]; [about 2 screens]. Available from:
https://www.bls.gov/news.release/cfoi.nr0.htm
[7] Health and Safety Executive. Health and safety in construction sector in Great
Britain 2014/15. Bootle: Health and Safety Executive; 2015.
[8] Construction Industry Development Board. Construction health and safety in
South Africa. Pretoria: Construction Industry Development Board; 2008.
[9] Mbuya E, Lema NM. Towards development of framework for integration of
safety and quality management techniques in construction project delivery
process. In: Boshoff F, editor. Proceedings of the 1st International Conference of
CIB W107; 2002 Nov 11-13; Stellenbosch. Delft: CIB; 2002.
[10] Kitumbo HI, Kirenga AP. Construction industry in Tanzania. Afr Newsl Occup
Health Saf. 2001;11(1):8-9.
[11] Chiocha C, Smallwood J, Emuze J. Health and safety in the Malawian
construction industry. Acta Structilia. 2011;18(1):68-80.
[12] International Labour Organisation. Malawi national occupational safety and
health programme 2011-2016. Lusaka: International Labour Organisation; 2011.
[13] International Labour Organisation. Malawi country profile on occupational safety
and health 2009. Lusaka: International Labour Organisation; 2009.
[14] Frick K. Worker influence on voluntary OHS management systems - Review of
its ends and means. Saf Sci. 2011;49(7):974-987.
[15] Santos G, Barros S, Mendes F, Lopes N. The main benefits associated with
health and safety management systems certification in Portuguese small and
medium enterprises post quality management system certification. Saf Sci.
2013;51(1):29-36.
[16] Nenonem N, Saarela K, Takala J, et al. Global estimates of occupational
accidents and work-related illnesses in 2014. Kallang: Workplace Safety and
Health Institute; 2014.
[17] Robson LS, Clarke JA, Cullen K, et al. The effectiveness of occupational health
and safety management systems interventions: A systematic review. Saf Sci.
2007; 45(3):329-353.

[18] Fernandez-Muniz B, Montes-Peon JM, Vazquez-Ordas CJ. Occupational risk
management under the OHSAS 18001 Standard: Analysis of perceptions and
attitudes of certified firms. J Clean Prod. 2012; 24:36-47.
[19] Yoon SJ, Lin HK, Chen G, et al. Effect of occupational health and safety
management system on work-related accident rate and differences of
occupational health and safety management system awareness between
managers in South Korea's construction industry. Saf Health Work. 2013;4(4):201-
209.
[20] Kheni NA, Dainty ARJ, Gibb AGF. Health and safety management in developing
countries: a study of construction SMEs in Ghana. Constr Manage Econ.
2008;26(11):1159-1169.
[21] Manu P, Mahamadu A, Phung VM, et al. Health and safety management
practices of contractors in South East Asia: A multi country study of Cambodia,
Vietnam and Malaysia. Saf Sci. 2018;107:188-201.
[22] Kheni NA. Impact of health and safety management on safety performance of
small and medium-sized construction businesses in Ghana [dissertation].
Loughborough: Loughborough University; 2008.
[23] Mwombeki FK. Roles when collaborating on enhancing construction site health
and safety: Tanzania experience and way forward. In: Fang D, Choudhry RM,
Hinze JW, editors. Proceedings of CIB W99 international conference on global
unity for safety and health in construction; 2006 June 28-30; Beijing. Beijing:
Tsinghua University Press; 2006. p. 419-427.
[24] Willey RJ, Crowl DA, Lepkowski W. The Bhopal tragedy: Its influence on process
and community safety as practiced in the United States. J Loss Prev Proc.
2005;18(4-6):365-374.
[25] Vayrynen S, Hakkienen K, Niskanen T., editors. Integrated occupational safety
and health management solutions and industrial cases. Cham: Springer; 2015.
[26] International Labour Organisation. OSH management system: A tool for
continual improvement. Geneva: International Labour Organisation; 2011.
[27] International Labour Organisation. Guidelines on occupational safety and health
management systems: ILO-OSH 2001. Geneva: International Labour
Organisation; 2001.
[28] Lingard H, Rowlingnson S. Occupational health and safety in construction project
managements. Abingdon: Spon Press; 2005.
[29] British Standard Institution (BSI). Occupational health and safety management
systems - requirements. London: BSI; 2007. Standard No. BS OHSAS
18001:2007.

[30] Ghallagher C, Underhill E, Rimmer M. Occupational health and safety
management systems: A review of their effectiveness in securing healthy and
safe workplaces. Sydney: National Occupational Health and Safety Commission;
2001.
[31] Jorgensen TH, Remmen A, Mellado MD. Integrated management systems –
Three different levels of integration. J Clean Prod. 2006;14(8):713-722.
[32] Zutshi A, Sohal S. Integrated management system: The experiences of three
Australian organisations. J Manuf Technol Manage. 2005;16(2):211-232.
[33] Health and Safety Executive. Successful health and safety management. 2nd ed.
Bootle: Health and Safety Executive; 1997.
[34] Snowball D. Safety management system assessment criteria. In: IChemE
Symposium Series No. 144; 1998 Nov 10-12. Rugby: Institution of Chemical
Engineers; 1998; p. 53-64.
[35] Perezgonzalez J. Construction safety management, A systems approach.
Dublin: [“publisher unknown”]; 2005.
[36] Hasle, P. and Zwetsloot, G. Editorial: Occupational health and safety
management systems: Issues and challenges. Saf Sci. 2011;49(7):961-963.
[37] Bevilacqua M, Ciarapica FE, Sanctis ID. How to successfully implement OHSAS
18001: The Italian case. J Loss Prev Proc. 2016;44:31-43.
[38] Chen C, Wu G, Chuang K, et al. A comparative analysis of the factors affecting
the implementation of occupational health and safety management systems in
the printed circuit board industry in Taiwan. J Loss Prev Proc. 2009;22(2):210-
215.
[39] Vinodkumar M, Bhasi M. A study on the impact of management system
certification on safety management. Saf Sci. 2011;49(3):498-507.
[40] Suarez-Garcia H. Quality, safety and environmental systems integration. Occup
Health Saf (Waco, Tex.). 2001;70(11):56-56.
[41] McDonald N, Corrigan S, Daly C, et al. Safety management systems and safety
culture in aircraft maintenance organisations. Saf Sci. 2000;34(1-3):151-176.
[42] Health and Safety Executive. Managing for health and safety. Bootle: Health and
Safety Executive; 2013.
[43] Creswell J. Research design: Qualitative, quantitative and mixed methods
approaches. Los Angeles (CA): Sage Publications; 2014.
[44] Takim R, Adnan H. Analysis of effectiveness measures of construction project
success in Malaysia. Asian Soc Sci. 2008;4(7):74-91.

[45] Office for National Statistics. Construction statistics. Newport: Office for National
Statistics; 2012. (Construction statistics; No. 13, 2012 ed.)
[46] Field A. Discovering statistics using IBM SPSS statistic. 4th ed. Los Angeles
(CA): Sage Publications; 2013.
[47] Takala J, Hämäläinen P, Saarela L, et al. Global estimates of the burden of injury
and illness at work in 2012. J Occup Environ Hyg. 2014;11(5):326-337.
[48] Schwab K. The global competitiveness report 2017-2018. Geneva. World
Economic Forum: 2017.
[49] Navendren D, Manu P, Shelbourn M, et al. Challenges to building information
modelling implementation in UK: designers' perspectives. In: Raiden AB,
Aboagye-Nimo E, editors. Proceedings of 30th annual ARCOM conference: 2014
Sep 1-3; Portsmouth. Reading: Association of Researchers in Construction
Management; 2014. p. 733-742.
[50] Ayarkwa PJ, Dansoh A, Amoah P. Barriers to implementation of EMS in
construction industry in Ghana. Int J Eng Sci. 2010;2(4):37–45.
[51] Igwe PU. Barriers to implementation of environmental management systems in
tourism industry in Anambra State, Nigeria. Int J Eng Manag Sci. 2016;7(2):137-
144.
[52] Ministry of Labour, Invalids and Social Welfare. National programme on
occupational safety and occupational health in period of 2011-2015. Hanoi:
International Labour Organisation; 2012.
[53] Health and Safety Executive Construction Division. Underlying causes of
construction fatal accidents –A comprehensive review of recent work to
consolidate and summarise existing knowledge. Norwich: Her Majesty’s
Stationery Office; 2009. (Phase 1 report).
[54] Geminiani FL, Smallwood JJ, Wyk JJ. The effectiveness of the occupational
health and safety (OH&S) inspectorate in South African construction [master's
thesis]. Port Elizabeth: Nelson Mandela Metropolitan University; 2008.

Figure 1: Respondents’ working experience
(Note: Sum of % is less than 100% due to non-response by some participant)
49.3
28.0
10.7 9.3
0
10
20
30
40
50
60
0-5 6-10 11-15 ˃15
Resp
on
den
ts
(%)
Years

Figure 2: Certification to Standard No. OHSAS 18001: 2007 by construction companies
(Note: Sum of % is less than 100% due to non-response by some participants)
18.7
76.0
0
10
20
30
40
50
60
70
80
certified companies non-certified companies
Co
mp
an
ies (
%)
Certification to Standard No. OHSAS 18001:2007

Table 1. Summary of key elements of safety and health management systems.
Safety and health management element
Description of element and example of practice
Safety and health management system
HSEa [33]
McDonald et al. [41]
ILO-OSHb
2001 [27]
Perezgonzalez et al. [35]
Standard No. OHSAS 18001:2007
[29]
HSE [42]
Plan
Policy Overall organisation safety and health guiding philosophy e.g., safety and health policy document.
Planning Establishment of implementation procedures e.g., safety and health objectives and project safety and health plans.
Do Risk assessment
Identification of potential risks and management measures e.g., preparing risk assessment for work package.
Organising Organisation of activities to deliver safety and health plans e.g., providing financial and human resources.
Implementation Operationalisation of safety and health programme e.g., providing safety and health inductions and training.
Check
Measuring performance
Assessing whether goals are being achieved e.g., incident investigation.
Act
Auditing and lessons learnt
Assessing the effectiveness of safety and health management system for continuous improvement e.g., internal or external audits.
Note: aHSE = Health and Safety Executive; bILO-OSH = International Labour Organisation-Occupational Safety and Health.

Table 2. Response rate.
Survey characteristics Number Percentage
Distributed questionnaires 320 100.0 of sample size
Returns 75 23.4 of distributed questionnaires
Used for analysis 75 100.0 of returns

Table 3. Respondents' professional roles.
Professional role Frequency Percentage
Company director/manager 32 42.7
Site manager 2 2.7
Occupational safety and health manager/supervisor
3 4.0
Site agent 3 4.0
Project manager 5 6.7
Site engineer 5 6.7
Procurement and administrative officer 1 1.3
Cost estimator/quantity surveyor 24 32.0

Table 4. Profile of the companies.
Respondents’ company profile Frequencya, b Percentagec
Size of company
Micro firm: ≤10 employees 38 50.7
Small firm: 11-50 employees 16 21.3
Medium firm: 51-150 employees 14 18.7
Large firm: ˃150 employees 5 6.7
Age of company (in years)
≤10 34 45.3
11-15 19 25.3
˃15 21 28.0
Sectors of work undertaken by company
Public sector works 35 46.7
Private sector works 31 41.3
Works undertaken by company
Building 50 66.7
Civil engineering 46 61.3
Electrical and mechanical 9 12.0
Business class of registration (in MWKd)
2.5-30 million 9 12
50-75 million 7 9.3
100-200 million 21 28.0
500 million to ˃ one billion 36 48.0
2015/16 annual turnover (in MWK)
0-10 million 10 13.3
11-75 million 14 18.7
76-200 million 12 16.0
˃201 million 36 48.0
Note: asum of frequency could be less than 75 due non-responses by some participants; bsum of contractors in the category of registration is greater than 75 as some contractors are registered in both building and civil engineering categories; cSum of % could be less than 100% due to non-response by some participants; dMWK = Malawi Kwacha, EUR 100 = MWK 84,916.4, USD 100 = MWK 71,892.1, the exchange rate used is the average August 2017 interbank exchange rate obtained from https://www.oanda.com/currency/average.

Table 5. The extent of implementation of safety and health management practices.
Safety and health management element
Safety and health management practice
Frequencyb Percentagec Extent of
implementation Practice
codea Description of practice
Policy Pol1
A formal company safety and health policy statement
33
44.0
Low
Pol2
A company director with overall responsibility for safety and health
31 41.3
Low
Organising Org1
Providing safety and health supervisors on sites
39
52.0
Moderate
Org2
Communicating safety and health information to workers through newsletters, leaflets, posters, etc.
24
32.0
Low
Org3 Engaging with workers on health and safety issues e.g., health and safety meetings and suggestion schemes
53 70.7 High
Org4 Networking with other companies’ / institutions’ (insurance companies, government offices) about health and safety issues
19 25.3 Low
Org5
Propagating safety and health practices to external stakeholders e.g., clients
14
18.7 Low
Org6 A designated safety and health department 12 16.0 Low
Org7 Assessing the competence of workers and subcontractors
19 25.3 Low
Org8 A company designated health and safety budget
26 34.7 Low
Org9
Display of regulatory health and safety posters on construction sites
42 56.0 Moderate
Org10
Display of company safety and health policy on construction sites, company website, and head/branch offices
17 22.7
Low
Org11
Provision of safety and health annual reports
11
14.7 Low
Org12 A designated safety and health manager 21 29.0 Low
Org13
Providing safety and health training for site safety supervisors and site managers
33 44.0
Low
Org14
Providing training programmes for safety manager(s)
18
24.0
Low
Risk assessment
Risk1
Undertaking overall project risk assessments before projects start
44 58.7
Moderate
Risk2 Designing site rules and measures to mitigate assessed risks
42 56.0 Moderate
Risk3 Undertaking risk assessments for work packages/operations before they start
25 33.3 Low
Risk4
Reviewing and updating risk assessments during construction
31
41.3
Low
Risk5
Informing employees about hazards on sites before work starts
60
80.0
High

Table 5. continued.
Safety and health management element
Safety and health management practice
Frequencyb Percentagec Extent of
implementation Practice codea
Description of practice
Implementing Impl1
Implementing site safety and health rules and measures
48
640
Moderate
Impl2
Amending and correcting safety and health plans during construction
27
36.0
Low
Impl3 Rewarding workers for safe work behaviour 13 17.3 Low
Impl4 Site inductions for workers 31 41.3 Low Impl5 Training programmes for site workers 44 58.7 Moderate
Impl6 Carrying out site health and safety inspections regularly
44 58.7 Moderate
Impl7
Provision of sanitation and welfare facilities on sites (e.g., toilets, canteens, drinking water)
60
80.0
High
Impl8 Provision of personal protective equipment 69 92.0 High
Impl9 Provision of first aid equipment on sites 67 89.3 High Impl10 Disciplining workers for unsafe work
behaviour 33 44.0 Low
Impl11
Assigning safety and health supervisor(s) on site
33 44.0
Low
Impl12
Conducting regular health checks for employees
28
37.3
Low
Measuring and reviewing performance
Meas&rev1
Measuring safety and health performance against set targets
24
32.0
Low
Meas&rev2
Reviewing and updating safety and health plans after projects completion
25
33.3
Low
Meas&Rev3 Keeping incident records on every project 53 70.7 High
Meas&rev4 Investigating the causes of incidents, accidents and near-misses
46
61.3
Moderate
Meas&rev5 Publishing or sharing lessons learnt from incident investigations across the company or on projects
20 26.7 Low
Auditing Aud1 Undertaking periodic safety management auditing
25
33.3 Low
Aud2 Use of external consultant for undertaking safety management auditing
9 12.0 Low
Aud3 Use of in-house personnel for undertaking safety management auditing
33 44.0 Low
Note: aAud1 to Aud3, Impl1 to Impl12, Org1 to Org14, Meas&rev1 to Meas&rev5, Pln1 to Pln5, Pol1 to Pol2, and Risk1 to Risk 5 are codes representing their corresponding safety and health management practices; bsum of frequency could be less than 75 due non-responses by some participants; csum of % could be less than 100% due to non-response by some participants.

Table 6. Association between certification to Standard No. OHSAS 18001: 2007 and implementation of safety and health practices.
Safety and health management practicea
Implementation of practiceb
Standard No. OHSAS 18001: 2007[29] non-certified
Standard No. OHSAS 18001: 2007[29] certified
Pearson's 2 Cramer's c
Count Expected
Count % within practice
Count Expected
Count % within practice
Value df p (2-
sided) Value p
Pol1 0 36c 32.1 90.0 4c 7.9 10.0 5.466 1 0.033 0.277 0.033
1 21d 24.9 67.7 10d 6.1 32.3
Org1 0 31c 26.5 93.9 2c 6.5 6.1 7.265 1 0.008 0.320 0.008
1 26d 30.5 68.4 12d 7.5 31.6
Org2 0 43c 39.3 87.8 6c 9.7 12.2 5.224e 1 0.050 0.280 0.026
1 14d 17.7 63.6 8d 4.3 36.4
Org4 0 45c 41.6 86.5 7c 10.4 13.5 4.912e 1 0.037 0.278 0.037
1 11d 14.4 61.1 7d 3.6 38.9
Org6 0 52c 47.4 88.1 7c 11.6 11.9 11.221e 1 0.001 0.438 0.001
1 5d 9.6 41.7 7d 2.4 58.3
Org11 0 53c 49.0 86.9 8c 12.0 13.1 9.634e 1 0.003 0.410 0.003
1 4d 8.0 40.0 6d 2.0 60.0
Pln1 0 27c 23.3 93.1 2c 5.7 6.9 5.091 1 0.033 0.268 0.033
1 30d 33.7 71.4 12d 8.3 28.6
Pln4 0 37c 32.9 90.2 4c 8.1 9.8 6.083 1 0.018 0.293 0.018
1 20d 24.1 66.7 10d 5.9 33.3
Imp11 0 36c 31.3 92.3 3c 7.7 7.7 7.905 1 0.007 0.334 0.007
1 21d 25.7 65.6 11d 6.3 34.4
Note: aImpl11, Org1, Org2, Org4, Org6, Org11, Pln1, Plan4 and Pol1 represent safety and health management practices as indicated in Table 5; b0 = non-implementation of practice, 1 = implementation of practice; c,deach superscript letter denotes a subset of safety and health management practice categories whose column proportions do not differ significantly from each other at the 0.05 level; esome expected frequencies are less than 5, hence the Likelihood Ratio has been
used in place of Pearson's 2.

Table 7. Association between the company age and implementation of safety and health practices.
Safety and health management practicea
Implementation of practiceb
≤10 years 11-50 years >50 years Pearson's 2 Cramer's c
Count Expected
Count % within practice
Count Expected
Count % within practice
Count Expected
Count % within practice
Value df p (2-sided)
Value p
Pol2 0 25c 19.8 58.1 10c 11.0 23.3 8c 12.2 18.6 7.011 2 0.034 0.308 0.034
1 9d 14.2 29.0 9c 8.0 29.0 13d 8.8 41.9
Org1 0 22c 16.1 62.9 9c 9.0 25.7 4c 9.9 11.4 10.857 2 0.004 0.383 0.004
1 12d 17.9 30.8 10c 10.0 25.6 17d 11.1 43.6
Org3 0 16c 10.1 72.7 5c 5.6 22.7 1c 6.2 4.5 11.260 2 0.003 0.390 0.003
1 18d 23.9 34.6 14c 13.4 26.9 20d 14.8 38.5
Org7 0 28c 25.3 50.9 16c 14.1 29.1 11c 15.6 20.0 7.420 2 0.025 0.317 0.025
1 6c 8.7 31.6 3c 4.9 15.8 10d 5.4 52.6
Org8 0 26c 22.1 54.2 15c 12.3 31.3 7c 13.6 14.6 12.824 2 0.001 0.416 0.001
1 8c 11.9 30.8 4c 6.7 15.4 14d 7.4 53.8
Org13 0 21c 19.3 50.0 14c 10.8 33.3 7c 11.9 16.7 7.260 2 0.028 0.313 0.028
1 13c 14.7 40.6 5c 8.2 15.6 14d 9.1 43.8
Risk2 0 17c 15.2 51.5 12c 8.5 36.4 4c 9.4 12.1 8.599 2 0.015 0.341 0.015
1 17c 18.8 41.5 7c 10.5 17.1 17d 11.6 41.5
Pln1 0 15c 13.8 50.0 11c 7.7 36.7 4c 8.5 13.3 6.579 2 0.037 0.298 0.037
1 19c 20.2 43.2 8c 11.3 18.2 17d 12.5 38.6
Impl11 0 24c 18.4 60.0 11c 10.3 27.5 5c 11.4 12.5 11.988 2 0.003 0.396 0.003
1 10d 15.6 29.4 8c 8.7 23.5 16d 9.6 47.1
Aud1 0 27c 22.5 55.1 13c 12.6 26.5 9c 13.9 18.4 7.810 2 0.018 0.325 0.018
1 7d 11.5 28.0 6c 6.4 24.0 12d 7.1 48.0
Note: aAud1, Org1, Org3, Org7, Org8, Org13, Pln1, Pol2, Impl11, and Risk2 represent safety and health management practices as indicated in Table 5; b0 = non-implementation of practice, 1 = implementation of practice; c,deach superscript letter denotes a subset of safety and health management practice categories whose column proportions do not differ significantly from each other at the 0.05 level.
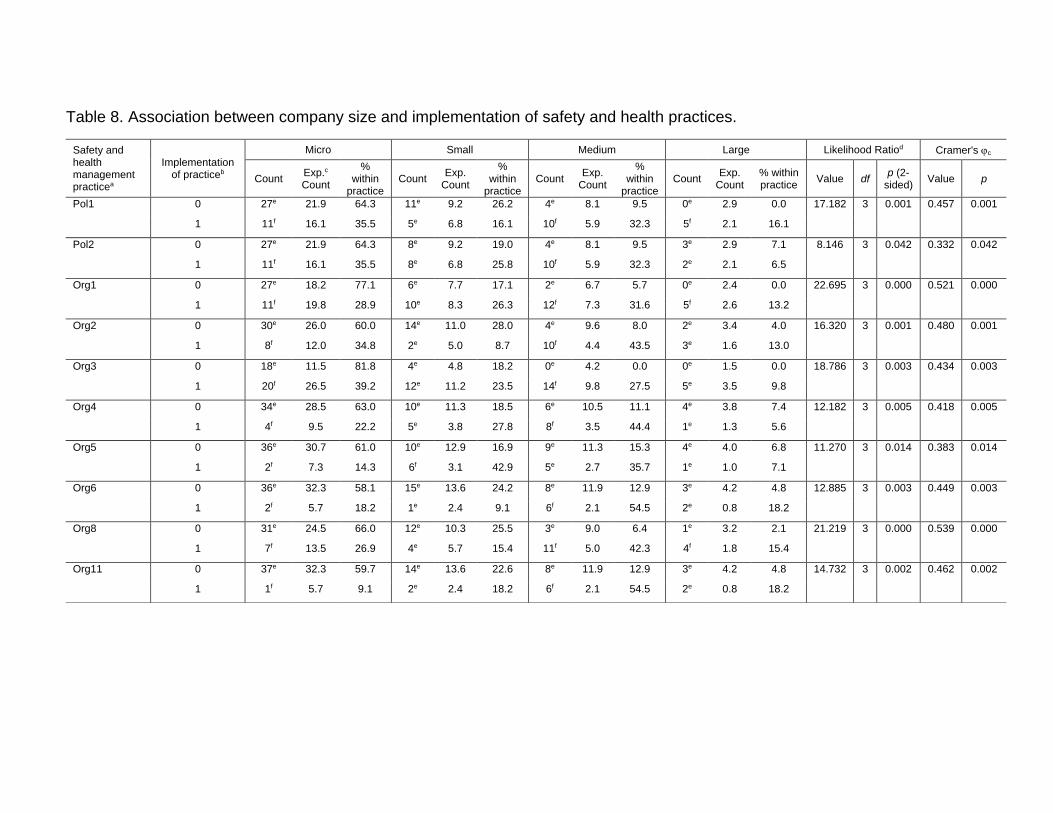
Table 8. Association between company size and implementation of safety and health practices.
Safety and health management practicea
Implementation of practiceb
Micro Small Medium Large Likelihood Ratiod Cramer's c
Count Exp.c
Count
% within
practice Count
Exp. Count
% within
practice Count
Exp. Count
% within
practice Count
Exp. Count
% within practice
Value df p (2-
sided) Value p
Pol1 0 27e 21.9 64.3 11e 9.2 26.2 4e 8.1 9.5 0e 2.9 0.0 17.182 3 0.001 0.457 0.001
1 11f 16.1 35.5 5e 6.8 16.1 10f 5.9 32.3 5f 2.1 16.1
Pol2 0 27e 21.9 64.3 8e 9.2 19.0 4e 8.1 9.5 3e 2.9 7.1 8.146 3 0.042 0.332 0.042
1 11f 16.1 35.5 8e 6.8 25.8 10f 5.9 32.3 2e 2.1 6.5
Org1 0 27e 18.2 77.1 6e 7.7 17.1 2e 6.7 5.7 0e 2.4 0.0 22.695 3 0.000 0.521 0.000
1 11f 19.8 28.9 10e 8.3 26.3 12f 7.3 31.6 5f 2.6 13.2
Org2 0 30e 26.0 60.0 14e 11.0 28.0 4e 9.6 8.0 2e 3.4 4.0 16.320 3 0.001 0.480 0.001
1 8f 12.0 34.8 2e 5.0 8.7 10f 4.4 43.5 3e 1.6 13.0
Org3 0 18e 11.5 81.8 4e 4.8 18.2 0e 4.2 0.0 0e 1.5 0.0 18.786 3 0.003 0.434 0.003
1 20f 26.5 39.2 12e 11.2 23.5 14f 9.8 27.5 5e 3.5 9.8
Org4 0 34e 28.5 63.0 10e 11.3 18.5 6e 10.5 11.1 4e 3.8 7.4 12.182 3 0.005 0.418 0.005
1 4f 9.5 22.2 5e 3.8 27.8 8f 3.5 44.4 1e 1.3 5.6
Org5 0 36e 30.7 61.0 10e 12.9 16.9 9e 11.3 15.3 4e 4.0 6.8 11.270 3 0.014 0.383 0.014
1 2f 7.3 14.3 6f 3.1 42.9 5e 2.7 35.7 1e 1.0 7.1
Org6 0 36e 32.3 58.1 15e 13.6 24.2 8e 11.9 12.9 3e 4.2 4.8 12.885 3 0.003 0.449 0.003
1 2f 5.7 18.2 1e 2.4 9.1 6f 2.1 54.5 2e 0.8 18.2
Org8 0 31e 24.5 66.0 12e 10.3 25.5 3e 9.0 6.4 1e 3.2 2.1 21.219 3 0.000 0.539 0.000
1 7f 13.5 26.9 4e 5.7 15.4 11f 5.0 42.3 4f 1.8 15.4
Org11 0 37e 32.3 59.7 14e 13.6 22.6 8e 11.9 12.9 3e 4.2 4.8 14.732 3 0.002 0.462 0.002
1 1f 5.7 9.1 2e 2.4 18.2 6f 2.1 54.5 2e 0.8 18.2

Table 8. continued.
Safety and health management practicea
Implementation of practiceb
Micro Small Medium Large Likelihood Ratiod Cramer's c
Count Exp.c Count
% within
practice Count
Exp. Count
% within
practice Count
Exp. Count
% within
practice Count
Exp. Count
% within practice
Value df p (2-
sided) Value p
Org12 0 31e 27.1 59.6 13e 11.4 25.0 5e 10.0 9.6 3e 3.6 5.8 10.879 3 0.008 0.400 0.008
1 7f 10.9 33.3 3e 4.6 14.3 9f 4.0 42.9 2e 1.4 9.5
Org13 0 28e 21.3 68.3 9e 9.0 22.0 3e 7.9 7.3 1e 2.8 2.4 14.803 3 0.002 0.442 0.002
1 10f 16.7 31.3 7e 7.0 21.9 11f 6.1 34.4 4e 2.2 12.5
Org14 0 31e 28.6 56.4 14e 12.1 25.5 6e 10.5 10.9 4e 3.8 7.3 9.058 3 0.017 0.372 0.017
1 7e 9.4 38.9 2e 3.9 11.1 8f 3.5 44.4 1e 1.2 5.6
Pln1 0 21e 15.6 70.0 6e 6.6 20.0 3e 5.8 10.0 0e 2.1 0.0 10.896 3 0.027 0.350 0.027
1 17f 22.4 39.5 10e 9.4 23.3 11e 8.2 25.6 5e 2.9 11.6
Pln4 0 28e 22.4 65.1 9e 9.4 20.9 5e 8.2 11.6 1e 2.9 2.3 9.887 3 0.018 0.365 0.018
1 10f 15.6 33.3 7e 6.6 23.3 9f 5.8 30.0 4e 2.1 13.3
Pln5 0 32e 27.1 61.5 11e 11.4 21.2 6e 10.0 11.5 3e 3.6 5.8 8.733 3 0.026 0.351 0.026
1 6f 10.9 28.6 5e 4.6 23.8 8f 4.0 38.1 2e 1.4 9.5
Impl1 0 20e 14.1 74.1 4e 5.9 14.8 3e 5.2 11.1 0e 1.8 0.0 11.080 3 0.023 0.358 0.023
1 18f 23.9 39.1 12e 10.1 26.1 11e 8.8 23.9 5e 3.2 10.9
Impl11 0 28e 20.8 70.0 10e 8.8 25.0 2e 7.7 5.0 0e 2.7 0.0 24.073 3 0.000 0.539 0.000
1 10f 17.2 30.3 6e 7.2 18.2 12f 6.3 36.4 5f 2.3 15.2
Impl12 0 29e 23.9 63.0 9e 10.1 19.6 4e 8.8 8.7 4e 3.2 8.7 10.908 3 0.010 0.387 0.010
1 9f 14.1 33.3 7e 5.9 25.9 10f 5.2 37.0 1e 1.8 3.7
Audit1 0 30e 25.0 62.5 11e 10.5 22.9 4e 9.2 8.3 3e 3.3 6.3 11.358 3 0.007 0.400 0.007
1 8f 13.0 32.0 5e 5.5 20.0 10f 4.8 40.0 2e 1.7 8.0
Note: aAud1, Org1, Org2, Org3, Org4, Org5, Org6 Org8, Org11, Org12, Org13, Org14, Pln1, Pln4, Pln5, Pol1, Pol2, Impl1, Impl11, and Impl12 represent safety and health management practices as indicated in Table 5; b0 = non-implementation of practice, 1 = implementation of practice; cExp.= Expected; dsome expected frequencies are less than 5, hence the Likelihood Ratio
has been used in place of Pearson's 2; e,feach superscript letter denotes a subset of safety and health management practice categories whose column proportions do not differ significantly from each other at the 0.05 level.

Table 9. Summary of the of implementation level of safety and health management practices.
Safety and health management element
Extent of implementation of safety and health management practices
Low Moderate High Total Low implementation (%)
Policy 2 0 0 2 100.0
Organising 11 2 1 14 78.6
Risk assessment 2 2 1 5 40.0
Planning 2 2 1 5 40.0
Implementation 6 3 3 12 50.0
Measurement and reviewing 3 1 1 5 60.0
Auditing 3 0 0 3 100.0
Total 29 10 7 46 63.0