Embed Size (px)
Citation preview

www.fugro.com© Fugro 2013
Obtaining and Use of Soil ParametersFor Deepwater Pipeline Design
Mark FrancisFugro GeoConsulting (Wallingford)
Jean-Christophe Ballard Fugro GeoConsulting (Belgium)
Date 12th June 2014

www.fugro.comDate
Contents Menu
Introduction Geotechnical input to pipeline design Main soil design parameters Geotechnical models
Site investigation methods Characteristics of deepwater sediments Sampling techniques Field tests Laboratory tests
In-situ measurement of pipe-soil interaction Fugro Smartpipe description Some observations and design implications

www.fugro.com
Background
Deepwater pipelines are generally operated under high internal temperature and pressure: end expansion, axial walking and lateral buckling
Pipe/soil interaction forces are key
Soil conditions are challenging and difficult to characterize in top 0,5m: very soft, sensitive soil fabric/structure, low stress level
Considerable cost savings can be made by optimizing pipe-soil interaction forces:– Reduced requirement for stabilisation and anchoring– Reduced need to tolerate end expansion

www.fugro.com
Geotechnical input to pipeline design
Vertical, axial and lateral pipe-soil resistances

www.fugro.com
Main design soil parameters
Pipeline embedment:– Undrained soil response– Undisturbed and remoulded undrained shear strength profiles Su and Sur
– Submerged unit weight ’
Lateral resistance:– Undrained response– Undisturbed and remoulded undrained shear strength profiles Su and Sur
– Submerged unit weight ’
Axial resistance:– Drained or undrained response– Interface strength (residual):
• Drained ’, ’• Undrained Su, Su,int
• Pipeline coating roughness• Coefficient of consolidation cv
Date

www.fugro.com
Main design soil parameters
Accurate undrained shear strength profile at shallow depth is key !

www.fugro.com
Pipeline Embedment
Pipeline embedment is a key design parameter
Pipeline embedment is a combination of:– Static penetration due to pipe submerged weight– Installation effects
• Static effects• Dynamic effects
Difficult to predict accurately:work with a range of parameters or statistical distributions
Date
z
White & Cathie (2010)

www.fugro.com
Pipeline Embedment
Static penetration resistance
• Randolph & White (2008)
z: Pipe embedmentD: Pipe outside diametersu,inv: Undrained shear strength at pipe invertV: Effective pipe weight
– Expression fitting theoretical solution– Effects of heave and buoyancy can be included
25.0
,
6
Dz
DsV
invu
0
0.1
0.2
0.3
0.4
0.5
0.6
0.7
0.8
0.9
1
0 2 4 6 8 10 12 14 16
Pipe
invert embe
dmen
t z/D
[‐]
Pipeline contact stress V/D [kPa]
Verley & Sotberg (1992)Zhang et al (2002)Randolph et al (2008)
D = 0.8 mSu,inv = 2 kPa
www.fugro.com
Pipeline Embedment
Static installation effects– Increased embedment due over-stress at touch-down point– Degree of « over-stress » depends on
• Pipeline bending rigidity• Water depth• Seabed stiffness• Lay tension
– Degree of « over-stress » typically between 1 and 3
Randolph & White (2008)

www.fugro.com
Pipeline Embedment
Dynamic installation effects
– Increased penetration due to cyclic pipe movements during pipe-lay
– Typically 2 to 10 times the static embedment
– Depends on• Laying technique• Laying speed• Sea state• Seabed sensitivity
– Use of the remoulded undrained shear strength gives a reasonableestimate of embedment for average lay conditions
Westgate et al (2010)

www.fugro.com
Axial Resistance
Simple problem? Depends on sliding velocity, contact stresses , coating roughness and
embedment
White et al (2012)

www.fugro.com
Axial Resistance
Effect of axial velocity: drained or undrained response– Typical range of pipe axial velocities: 0 – 100 mm/min– Velocity at which transitions occur depends on soil coefficient of
consolidation cv
White and Cathie (2010)
UndrainedDrained Partially drained
Friction factor

www.fugro.com
Axial Resistance
Effect of contact stresses– Typical range of contact stresses: 0 – 10 kPa
Randolph et al (2010)

www.fugro.com
Axial Resistance
Effect of pipeline coating roughness
Hill et al (2012)

www.fugro.com
Lateral Resistance
Stages of lateral response– First load breakout resistance– First load residual resistance– Cyclic resistance in operation with formation of soil berms

www.fugro.com
Lateral Resistance
Breakout lateral resistance– Empirical formula (Bruton et al, 2006; Dendani and Jaeck, 2008) – Theoretical VH yield surfaces (undrained failure)
• Vertical and horizontal resistances are coupled
White & Cathie (2010)

www.fugro.comDate
Contents Menu
Introduction Geotechnical input to pipeline design Main soil design parameters Geotechnical models
Site investigation methods Characteristics of deepwater sediments Sampling techniques Field tests Laboratory tests
In-situ measurement of pipe-soil interaction Fugro Smartpipe description Some observations and design implications

www.fugro.com
Key Issues
Vertical depth control – determining mudline Vertical depth control – sample recovery Sample quality – further laboratory testing
Normally consolidated clay High plasticity Extremely low strength (su) 1kPa to 5kPa Soil water content >200% and submerged unit weights (’) ~3kN/m3

www.fugro.com
In-situ testing and Sampling Techniques
Soil Sampling– Box core
• Area ratio = 0.5m x 0.5m x 0.5m, 3mm• Index testing on the front face of the box core
– Piston core • Large (20m to 25m recovery), 105 mm ID, 160mm OD• Smaller piston core (3m to 6m recovery), 75mm ID, 90mm OD
In-situ Testing– Skirted seabed frame with CPT, T-bar or Ball
• Size of skirt, shape of skirt• Seabed frame settlement gauge
– Box core - Mini Tbar, Mini Ball and cyclic testing– SMARTPIPE®

www.fugro.com
Sampling - Box Corer

www.fugro.com
Sampling - Piston Core

www.fugro.com
0,00
0,20
0,40
0,60
0,80
1,00
1,20
1,40
1,60
1,80
2,00
0,00 0,02 0,04 0,06 0,08 0,10
Dep
th b
elow
Sea
floor
[m]
Sample quality, e / e0
Piston
Boxcore
Sampling - Sample Quality
Inc Oed and CRS Oed data from extremely low strength to low strength clay samples from deep water sites west Africa
Sample quality very good to excellent (<0.03) for both piston core and box corer in the top 2 m BSF.
Very Good to Excellent
Fair to Good
Poor

www.fugro.com
Sampling - Vertical Depth Accuracy
Best Estimatex Box core x Piston core
Borehole log of box core data (blue) and piston core data (green) Unit weight (, kN/m3) and undrained shear strength (su, kPa) Piston core may not recover all soil from mudline Box core data (complete representative sample of seafloor) can be
used as a guide.
In this example, piston core recovery missing soil from top 0.25m– Implications for depths of laboratory tests

www.fugro.com
In-situ testing - Seabed Frame

www.fugro.com
In-situ testing - Seabed Frame
T-Bar, CPT or Ball
Skirt
LARS(Launch and
Recovery System)
Frame settlement gauge

www.fugro.com
In-situ testing - Box Corer (Mini T-bar)
Mini Tbar testing (D=12mm, L=75mm)– su profile in top 0.5m– Sensitivity– Strength degradation

www.fugro.com
In-situ testing - Vertical Depth Accuracy
Mini T-barCPTT-bar Best Estimate DL
Borehole log of box core data – Submerged unit weight (’)– Index testing - undrained shear strength (su) – Mini T-bar - undrained shear strength (su)
Comparison of the su derived from mini T-bar against su derived from CPT and T-bar
su data from the CPT may need to be offset using the settlement gauge

www.fugro.com
In-situ testing - Mini T-bar
0.60
0.55
0.50
0.45
0.40
0.35
0.30
0.25
0.20
0.15
0.10
0.05
0.00-0.04 -0.03 -0.02 -0.01 0.00 0.01 0.02 0.03 0.04
T-Bar Bearing Resistance [MPa]
Dep
th B
elow
Mud
line
[m]
0
0,1
0,2
0,3
0,4
0,5
0,6
0,7
0,8
0,9
1
0 2 4 6 8 10 12 14 16 18
Deg
rada
tion
fact
or -
Cycle number
At 0.3m BSF
Undrained shear strength (su) profile Degradation of su with cycling Remoulded su

www.fugro.com
SMARTSURF™ System Description
Penetrometer Piston sampler
Folding skirt
Max. water depth 3500m Folding skirt to control settlement Real-time imaging and video
recorders Frame settlement gauge In-situ soil sampling
– 2m piston core In-situ testing
– 3m CPT or T-bar– 1m Mini T-bar
Can be used with SmartPipe®– Direct in-situ measurements
of Pipe soil interaction parameters using a prototype pipe section

www.fugro.com
Laboratory Testing
Classification (%) Index strength tests (su, kPa) Thermal conductivity (k, W/mK)
Low-stress consolidation tests– Differential pore water
pressure measurement –Allowing higher precision at lower stresses
– Improved resolution of compression curve, coefficient of consolidation, cv data in low stress range1 kPa to 10 kPa

www.fugro.com
Laboratory Testing
Interface testing (friction factor)– Roughness (rough/smooth)– Fast (undrained), ~0.1mm/s– Slow (drained), ~0.0001mm/s– Residual (large displacements)
Low Stress (<50kPa)– Tilt table– CAMshear– Under development, CAMtor

www.fugro.com
Tilt table and CAMshear Test
Tilt table– low stress, drained
strength (’, ’)– Soon available in Fugro
Wallingford Laboratory
Cambridge University CAMshear device allows the simulation of axial pipe-soil interaction behaviour by dragging a small sample of extremely low strength clay (0.5 kPa to 5 kPa) over a flat sheet of pipeline coating
Variable rates of shear Variable roughness Limited displacement
www.fugro.com
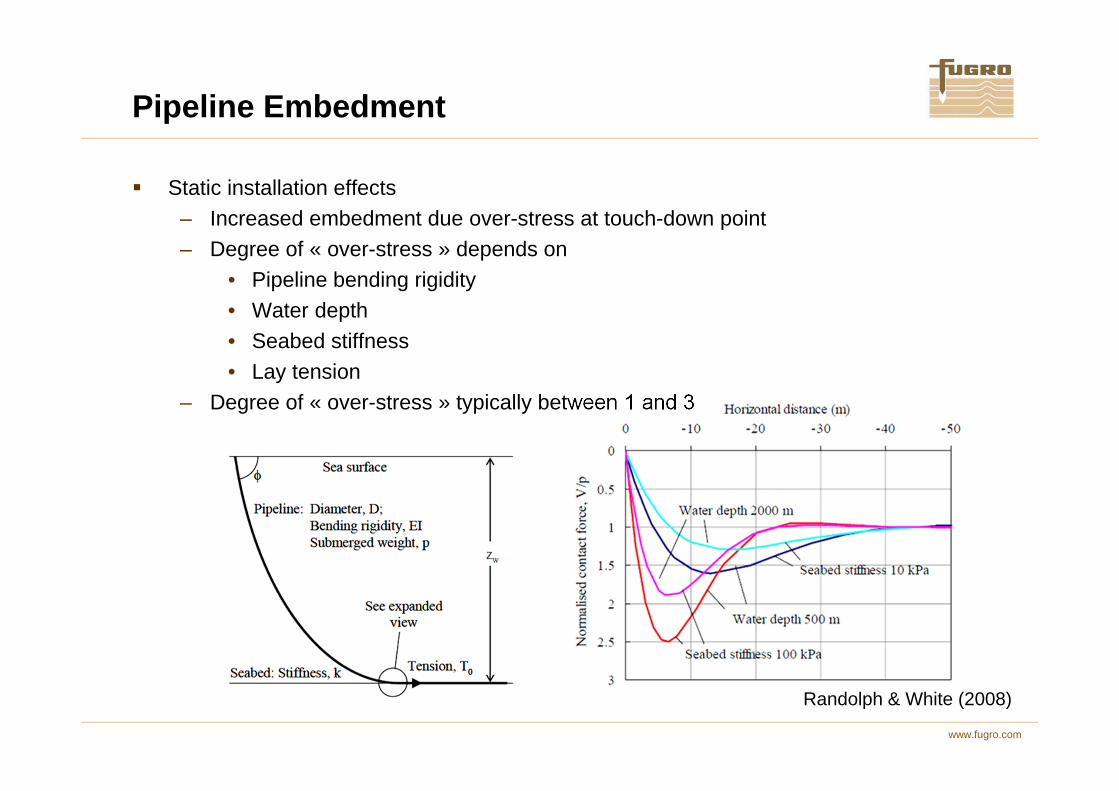
Tests under development - CAMtor
Currently under development with Cambridge University
Torsional interface shear test Simple specimen
arrangement Low normal stress range Pore pressure measurement Variable rates of shear can be
applied
So, r = K0*n
n
Zero radial strain
r=0r=0

www.fugro.comDate
Contents Menu
Introduction Geotechnical input to pipeline design Main soil design parameters Geotechnical models
Site investigation methods Characteristics of deepwater sediments Sampling techniques Field tests Laboratory tests
In-situ measurement of pipe-soil interaction Fugro Smartpipe description Some observations and design implications

www.fugro.com
Description of Smartpipe
Principle: instrumented section of polypropylene-coated steel pipe that measures forces (and pore pressures) while penetrating into the soil and moving laterally and axially
INSTRUMENTED PIPE SECTION
DEPLOYABLE MUDMATS AND DETACHABLE SKIRTS
SETTLEMENT PLATE

www.fugro.com
Description of Smartpipe
Instrumented pipe section– Diameter = 225mm (8”)– Overall length = 1200mm (47”)– Instrumented length = 776mm (30”)– Dummy ends to negate end effects– Nine pore pressure transducers– Two tri-ax loadcells– One temperature sensor
Instrumented Pipe Section

www.fugro.com
Merits of Smartpipe
Tests performed at the seabed, in undisturbed soil conditions
Tests performed at nearly full scale
Direct pipe/soil resistance measurements accounting for:– Installation effects: strength regain and consolidation effects– Sliding velocity and in-situ drainage properties– Low contact stresses– Coating roughness– Increased confinement due to embedment
Large-scale test (Bruton, 2009)
Direct shear test (White et al, 2011)
Tilt table test
Centrifuge test (Bruton, 2009)

www.fugro.com
Some in-situ observations and design implications
A critical design concern is low axial resistance– Extreme end expansion– Excessive axial walking– Hampers reliable buckle formation
Considerable savings can be made by small increases of axial friction factor
Smartpipe® measurements can demonstrate / justify in the field higher axial friction factors for pipeline design

www.fugro.com
Some in-situ observations and design implications
Back-analysis of dissipation of excess pore pressures induced by pipe penetration
Cv ~ 100 m²/year

www.fugro.com
Some in-situ observations and design implications
Design implications:– Partial drainage for typical pipeline axial velocities– Soil consolidation during hydrotest– Higher axial friction factor

www.fugro.com
Some in-situ observations and design implications
Tested range:– Axial velocity: 0,006 to 0,35 mm/s– Embedment: 0,35 to 0,75 D – Contact stresses: 1 to 4 kPa
0,00
0,10
0,20
0,30
0,40
0,50
0,60
0,70
0,80
0,90
1,00
0,00 1,00 2,00 3,00 4,00 5,00
Fric
tion
fact
or
= F/V
[-]
Mean normal stress n [kPa]
PeakResidualAxial velocity = 0,006 mm/sAxial velocity = 0,045 mm/sAxial velocity = 0,35 mm/s

www.fugro.com
Some in-situ observations and design implications
Effect of pipe unloading on axial friction factor (e.g. light gas pipe after hydrotest)
0,00
0,10
0,20
0,30
0,40
0,50
0,60
0,70
0,80
0,90
1,00
1,00 1,50 2,00 2,50 3,00
Fric
tion
fact
or
= F/V
[-]
Pipe unloading ratio Vconsol*/V [-]
PeakResidualAxial velocity = 0,006 mm/sAxial velocity = 0,045 mm/sAxial velocity = 0,35 mm/s
Evidence of strain rate effects in fast tests
Peak friction factor
Residucal friction factor

www.fugro.com
Some in-situ observations and design implications
Residual friction factor: evidence of cyclic hardening

www.fugro.com© Fugro 2013
Thank YouQuestions?