Embed Size (px)
DESCRIPTION
The Article explains the technological aspects as well as the commercial points associated with oil exploration under deepwater conditions.
Citation preview
DEEPWATER EXPLORATIONTechno-Commercial Aspects
Preface
This report is based on technical and commercial aspects of deep water exploration. Deep water is the next buzz for oil and gas industry. With the discoveries of new oil reserves thousands of feet beneath the ocean bed the hope of recovering hydrocarbons is still alive for a considerable period of time.
"The deep water has been, and really truly is, potentially the next wave of hydrocarbons into the global energy market. It's hugely important," says Stephen Thurston, Chevron's vice president of deepwater exploration and projects. Looking at the current scenario where more than 100 development projects are under development in deep and ultra deep water this seems to be very true.
In our report, we have tried to capture the technology involved with deep water exploration. First of all, we have made an attempt to understand how sub sea oil is formed. In that we have described the structure of earth, types of rocks which are helpful in the hydrocarbon formation, geological settings, oil traps, geological and physical characteristics of oil reservoirs etc. After that we have described the next stages of exploration which are acquisition, interpretation, processing, drilling a wildcat, appraisal and development. Supporting figures and charts have been used for better understanding of the different processes. In the development phase different platforms which are used for deep water drilling have been explained. After that, we have tried to understand the cost structure associated with deep water exploration and production. We have tried to explain the overall costs by taking a sample deep water project in Gulf of Guinea.
Finally, we have tried to capture some quick facts about deep water expenditure. We have been able to cover almost all the technology part and some of the commercial part as the commercial aspects are so vast that it needs to be done separately as an independent project and if possible we will cover that in our next term.
2

Contents
1.Basics of subsea oil
1.1 Structure of the Earth
1.2 Underwater topography
1.3 Sedimentary rocks –introduction
1.4 Geological time scale
1.5 Turbidites
1.6 Salt domes
1.7 formation stages and settings
1.8 Geological oil Traps
1.8.1 Anticlinal Traps
1.8.2 Fault Traps
1.8.3 Salt dome traps
1.8.4 Stratigraphic unconformity
1.8.5 Facies change
2. Geological and physical characteristics of oil reservoirs
2.1 Natural oil collectors- properties
2.2 Rock porosity
2.3 Grain size distribution in rocks
2.4 Permeability of rocks
2.5 Mechanical properties of rocks
3
3. Seismic Investigations
3.1 Acquisition
3.2 Processing
3.3 Display
3.4 Interpretation
4. Wildcat
5. Appraisal
6. Development System choices
6.1 Fixed to the sea floor
6.2 Floating Systems
6.3 Tension Leg platform
6.4 Monocolumn TLP
6.5 Floating platform, storage and offloading
6.6 FDPSO
6.6 FSO
6.7 FPS
6.8 Spars
7. Commercial aspects of deep water exploration
7.1 Types of costs
7.1.1 Exploration costs
7.1.1.1 Data acquisition costs
7.1.1.2 Data processing costs
7.1.1.3 Exploration drilling
4
7.1.2 Development Costs
7.1.2.1 Development drilling
7.1.2.2 Production and transport installations
7.2 Example of cost break down
7.3 Example of estimation of costs of a prospect in the Gulf of Guinea
7.4 Some quick facts
8. Bibliography
5
1. BASICS OF SUBSEA OIL
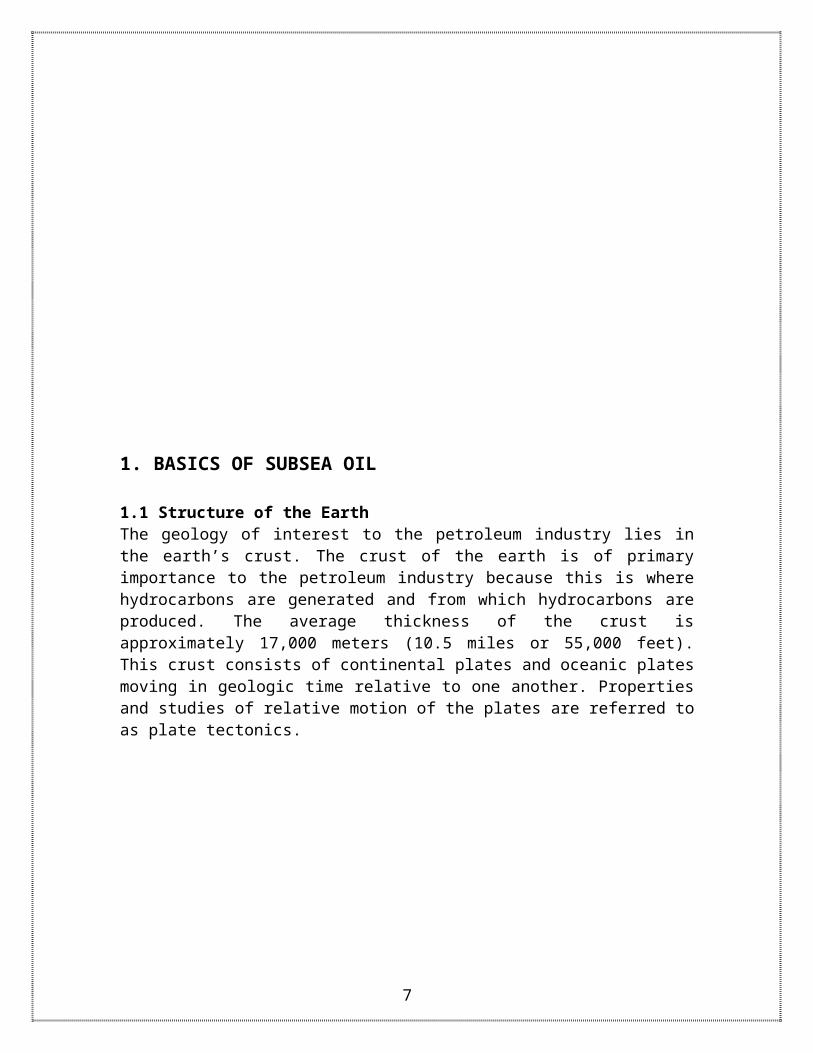
1.1 Structure of the EarthThe geology of interest to the petroleum industry lies in the earth’s crust. The crust of the earth is of primary importance to the petroleum industry because this is where hydrocarbons are generated and from which hydrocarbons are produced. The average thickness of the crust is approximately 17,000 meters (10.5 miles or 55,000 feet). This crust consists of continental plates and oceanic plates moving in geologic time relative to one another. Properties and studies of relative motion of the plates are referred to as plate tectonics.
Figure 1 : Structure of the Earth
6
1.2 UNDERWATER TOPOGRAPHYOil reserves formed under sub-surface conditions are a characteristic of the area that they are found in. Let us view the offshore extensions of the coastal areas to a certain extent.
Figure 1 : Sectional Profiling
Figure 2 : Graphic Representation of the Earth’s Surface
7
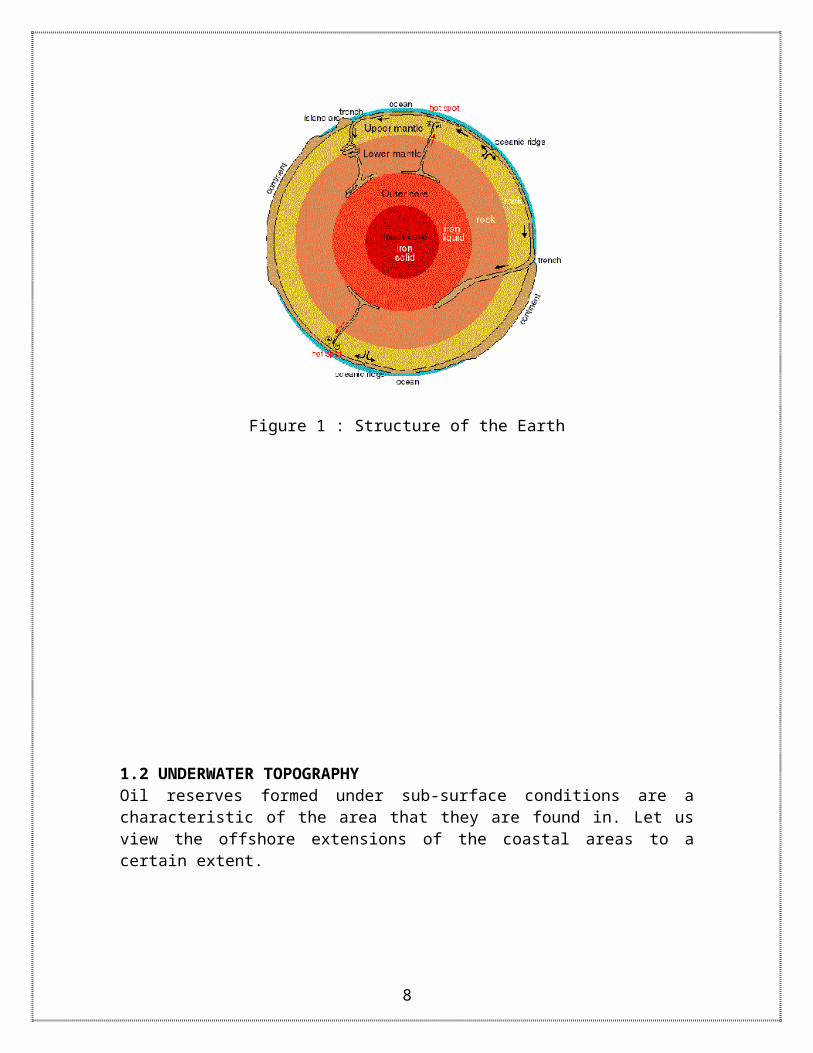
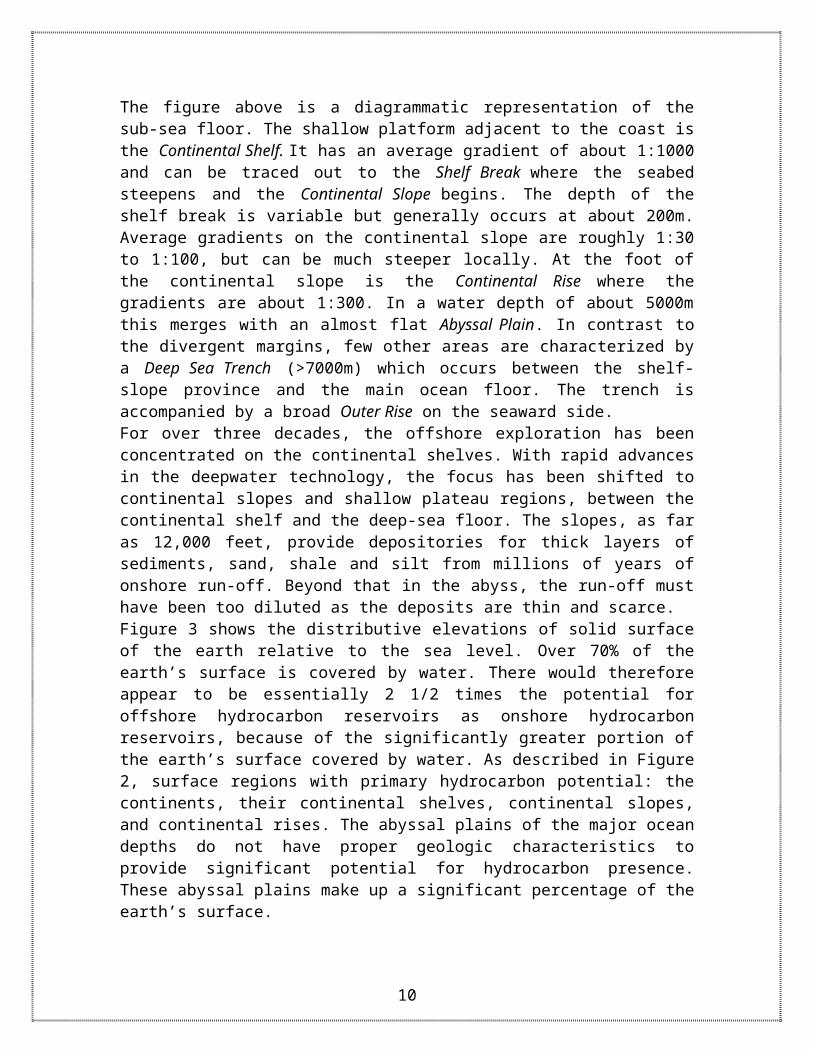
The figure above is a diagrammatic representation of the sub-sea floor. The shallow platform adjacent to the coast is the Continental Shelf. It has an average gradient of about 1:1000 and can be traced out to the Shelf Break where the seabed steepens and the Continental Slope begins. The depth of the shelf break is variable but generally occurs at about 200m. Average gradients on the continental slope are roughly 1:30 to 1:100, but can be much steeper locally. At the foot of the continental slope is the Continental Rise where the gradients are about 1:300. In a water depth of about 5000m this merges with an almost flat Abyssal Plain. In contrast to the divergent margins, few other areas are characterized by a Deep Sea Trench (>7000m) which occurs between the shelf-slope province and the main ocean floor. The trench is accompanied by a broad Outer Rise on the seaward side. For over three decades, the offshore exploration has been concentrated on the continental shelves. With rapid advances in the deepwater technology, the focus has been shifted to continental slopes and shallow plateau regions, between the continental shelf and the deep-sea floor. The slopes, as far as 12,000 feet, provide depositories for thick layers of sediments, sand, shale and silt from millions of years of onshore run-off. Beyond that in the abyss, the run-off must have been too diluted as the deposits are thin and scarce. Figure 3 shows the distributive elevations of solid surface of the earth relative to the sea level. Over 70% of the earth’s surface is covered by water. There would therefore appear to be essentially 2 1/2 times the potential for offshore hydrocarbon reservoirs as onshore hydrocarbon reservoirs, because of the significantly greater portion of the earth’s surface covered by water. As described in Figure 2, surface regions with primary hydrocarbon potential: the continents, their continental shelves, continental slopes, and continental rises. The abyssal plains of the major ocean depths do not have proper geologic characteristics to provide significant potential for hydrocarbon presence. These abyssal plains make up a significant percentage of the earth’s surface.
8
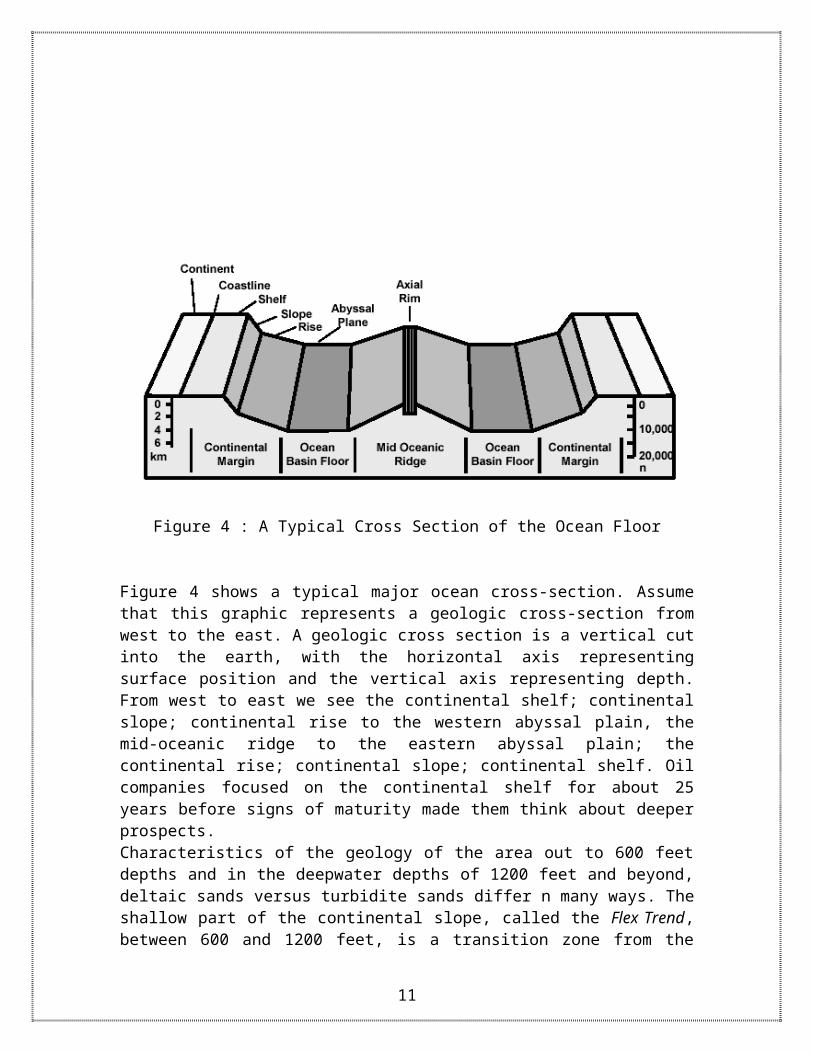
Figure 4 : A Typical Cross Section of the Ocean Floor
Figure 4 shows a typical major ocean cross-section. Assume that this graphic represents a geologic cross-section from west to the east. A geologic cross section is a vertical cut into the earth, with the horizontal axis representing surface position and the vertical axis representing depth. From west to east we see the continental shelf; continental slope; continental rise to the western abyssal plain, the mid-oceanic ridge to the eastern abyssal plain; the continental rise; continental slope; continental shelf. Oil companies focused on the continental shelf for about 25 years before signs of maturity made them think about deeper prospects. Characteristics of the geology of the area out to 600 feet depths and in the deepwater depths of 1200 feet and beyond, deltaic sands versus turbidite sands differ n many ways. The shallow part of the continental slope, called the Flex Trend, between 600 and 1200 feet, is a transition zone from the deltaic to turbidite geology. Turbidites are a crucial part of the deepwater petroleum deposits and are dealt with in the later part of the report.
9
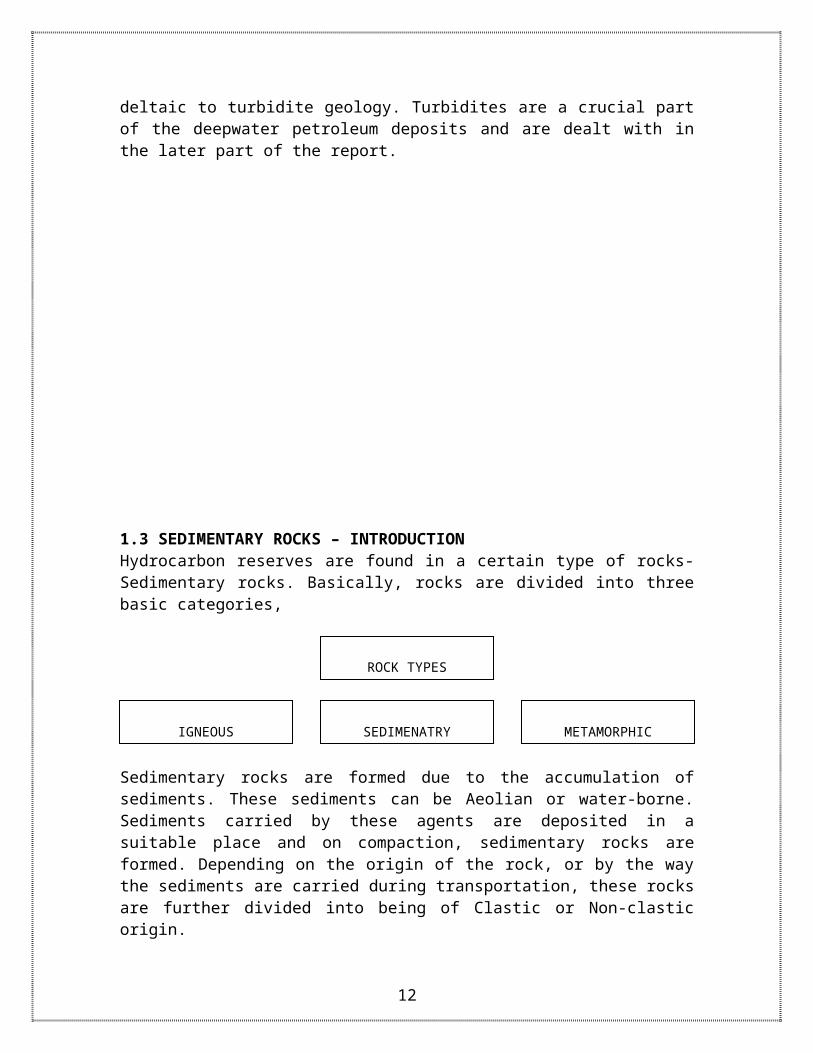
1.3 SEDIMENTARY ROCKS – INTRODUCTIONHydrocarbon reserves are found in a certain type of rocks- Sedimentary rocks. Basically, rocks are divided into three basic categories,
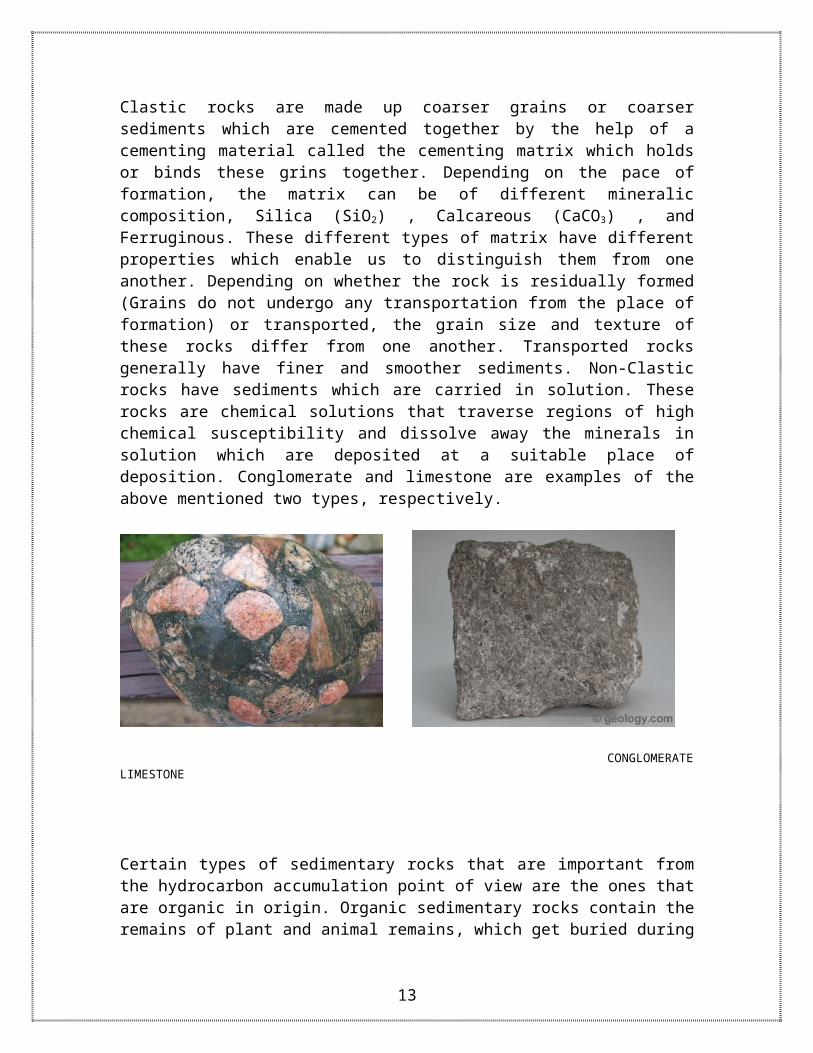
Sedimentary rocks are formed due to the accumulation of sediments. These sediments can be Aeolian or water-borne. Sediments carried by these agents are deposited in a suitable place and on compaction, sedimentary rocks are formed. Depending on the origin of the rock, or by the way the sediments are carried during transportation, these rocks are further divided into being of Clastic or Non-clastic origin. Clastic rocks are made up coarser grains or coarser sediments which are cemented together by the help of a cementing material called the cementing matrix which holds or binds these grins together. Depending on the pace of formation, the matrix can be of different mineralic composition, Silica (SiO2) , Calcareous (CaCO3) , and Ferruginous. These different types of matrix have different properties which enable us to distinguish them from one another. Depending on whether the rock is residually formed (Grains do not undergo any transportation from the place of formation) or transported, the grain size and texture of these rocks differ from one another. Transported rocks generally have finer and smoother sediments. Non-Clastic rocks have sediments which are carried in solution. These rocks are chemical solutions that traverse regions of high chemical susceptibility and dissolve away the minerals in solution which are deposited at a suitable place of deposition. Conglomerate and limestone are examples of the above mentioned two types, respectively.
CONGLOMERATE LIMESTONE
ROCK TYPES
IGNEOUS SEDIMENATRY METAMORPHIC
10
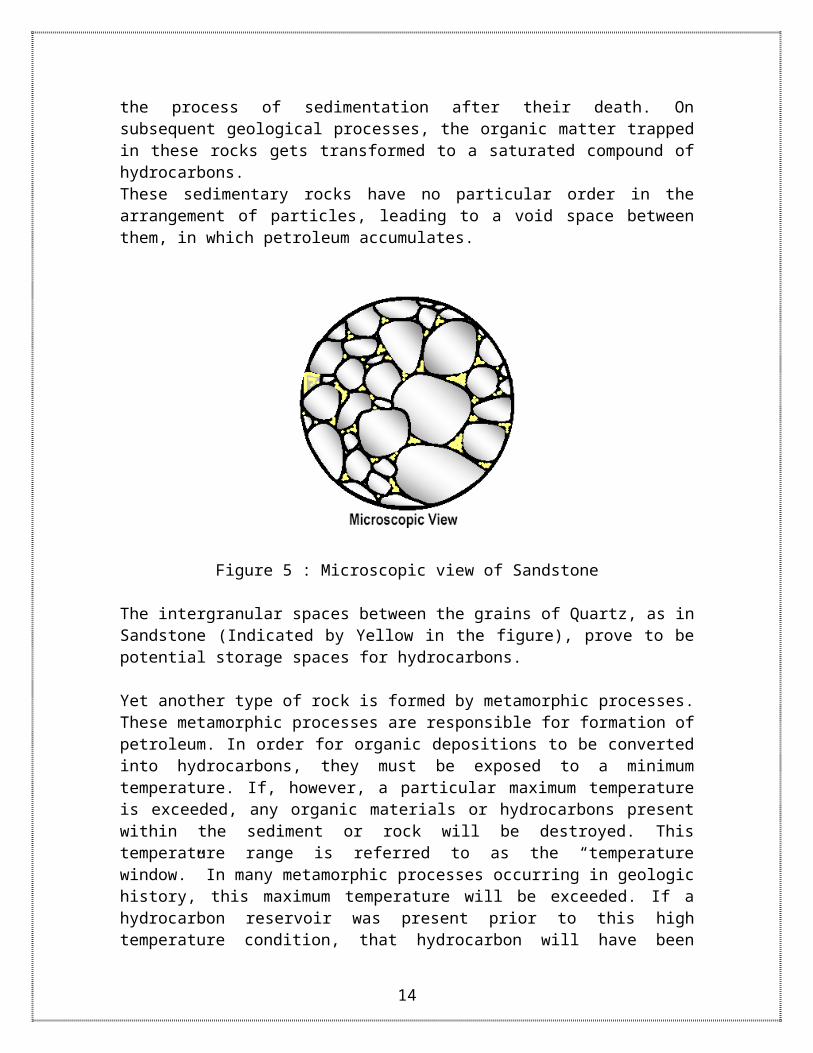
Certain types of sedimentary rocks that are important from the hydrocarbon accumulation point of view are the ones that are organic in origin. Organic sedimentary rocks contain the remains of plant and animal remains, which get buried during the process of sedimentation after their death. On subsequent geological processes, the organic matter trapped in these rocks gets transformed to a saturated compound of hydrocarbons. These sedimentary rocks have no particular order in the arrangement of particles, leading to a void space between them, in which petroleum accumulates.
Figure 5 : Microscopic view of Sandstone
The intergranular spaces between the grains of Quartz, as in Sandstone (Indicated by Yellow in the figure), prove to be potential storage spaces for hydrocarbons.
Yet another type of rock is formed by metamorphic processes. These metamorphic processes are responsible for formation of petroleum. In order for organic depositions to be converted into hydrocarbons, they must be exposed to a minimum temperature. If, however, a particular maximum temperature is exceeded, any organic materials or hydrocarbons present within the sediment or rock will be destroyed. This temperature range is referred to as the “temperature window.” In many metamorphic processes occurring in geologic history, this maximum temperature will be exceeded. If a hydrocarbon reservoir was present prior to this high temperature condition, that hydrocarbon will have been destroyed and will therefore not be available for production in today’s industry. Such extreme conditions of temperature and pressure exist in a natural setting as explained in the following examples.
11
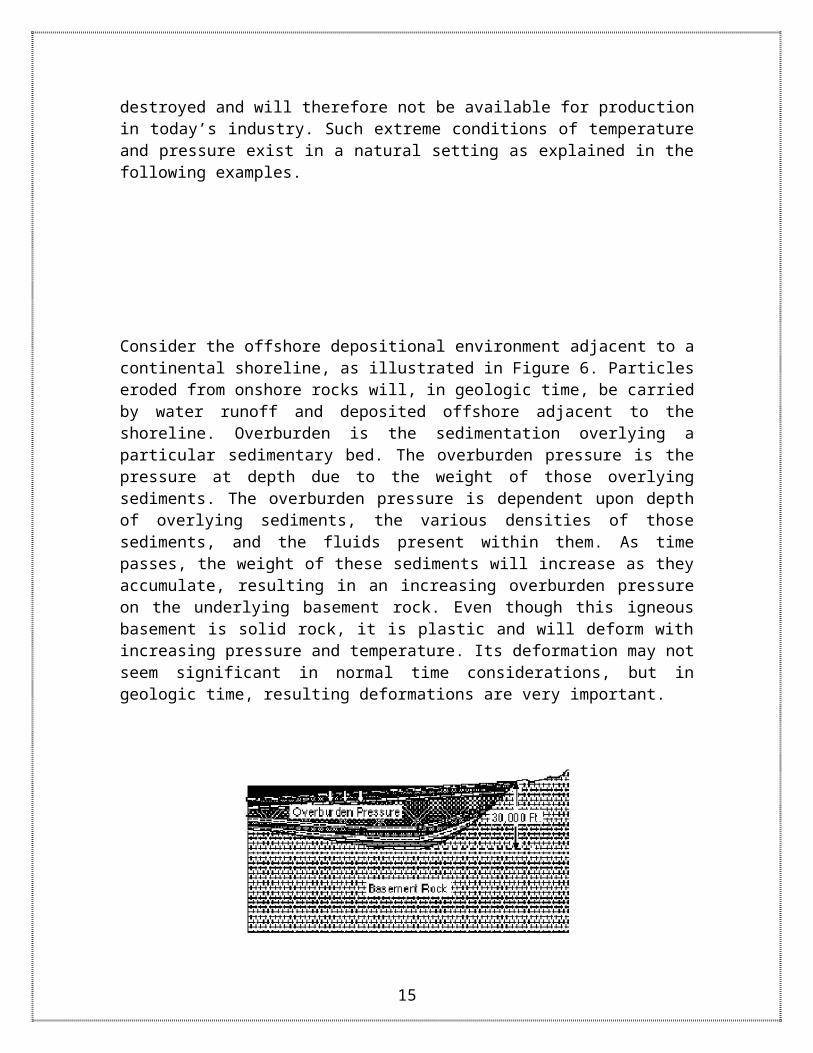
Consider the offshore depositional environment adjacent to a continental shoreline, as illustrated in Figure 6. Particles eroded from onshore rocks will, in geologic time, be carried by water runoff and deposited offshore adjacent to the shoreline. Overburden is the sedimentation overlying a particular sedimentary bed. The overburden pressure is the pressure at depth due to the weight of those overlying sediments. The overburden pressure is dependent upon depth of overlying sediments, the various densities of those sediments, and the fluids present within them. As time passes, the weight of these sediments will increase as they accumulate, resulting in an increasing overburden pressure on the underlying basement rock. Even though this igneous basement is solid rock, it is plastic and will deform with increasing pressure and temperature. Its deformation may not seem significant in normal time considerations, but in geologic time, resulting deformations are very important.
Figure 6 : Offshore Depositional Environment
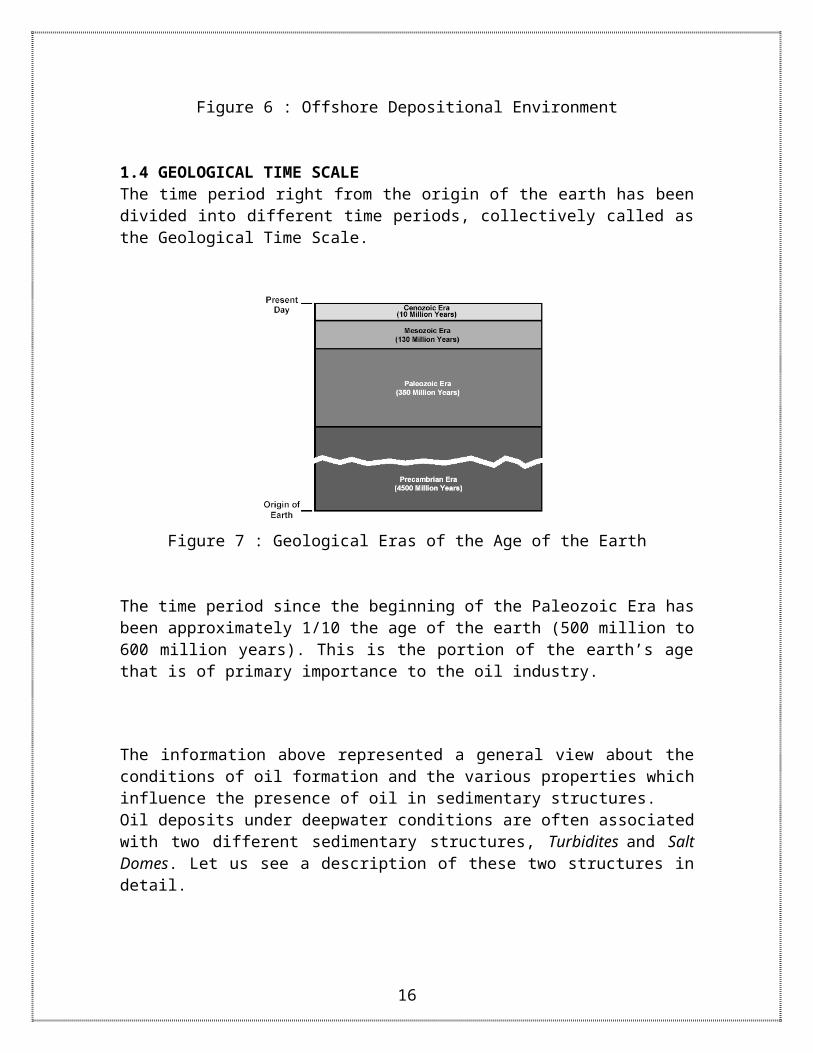
1.4 GEOLOGICAL TIME SCALEThe time period right from the origin of the earth has been divided into different time periods, collectively called as the Geological Time Scale.
Figure 7 : Geological Eras of the Age of the Earth
12
The time period since the beginning of the Paleozoic Era has been approximately 1/10 the age of the earth (500 million to 600 million years). This is the portion of the earth’s age that is of primary importance to the oil industry.
The information above represented a general view about the conditions of oil formation and the various properties which influence the presence of oil in sedimentary structures. Oil deposits under deepwater conditions are often associated with two different sedimentary structures, Turbidites and Salt Domes. Let us see a description of these two structures in detail.
1.5 TURBIDITESTurbidites are sea-bottom deposits formed by massive slope failures where rivers have deposited large deltas. These slopes fail in response to earthquake shaking or excessive sedimentation load. Turbidites could be described as an underwater landslide, causing the movement of huge sediment laden water flows. As per their relevance to oil field development, turbidites are sedimentary deposits formed by turbidity currents in deep water at the base of the continental slope and on the abyssal plain. Turbidites commonly show predictable changes in bedding from coarse layers at the bottom to finer laminations at the top, known as Bouma sequences, that result from different settling velocities of the particle sizes present. The high energy associated with turbidite deposition can result in destruction of earlier deposited layers by subsequent turbidity currents.
The Bouma Sequence
13
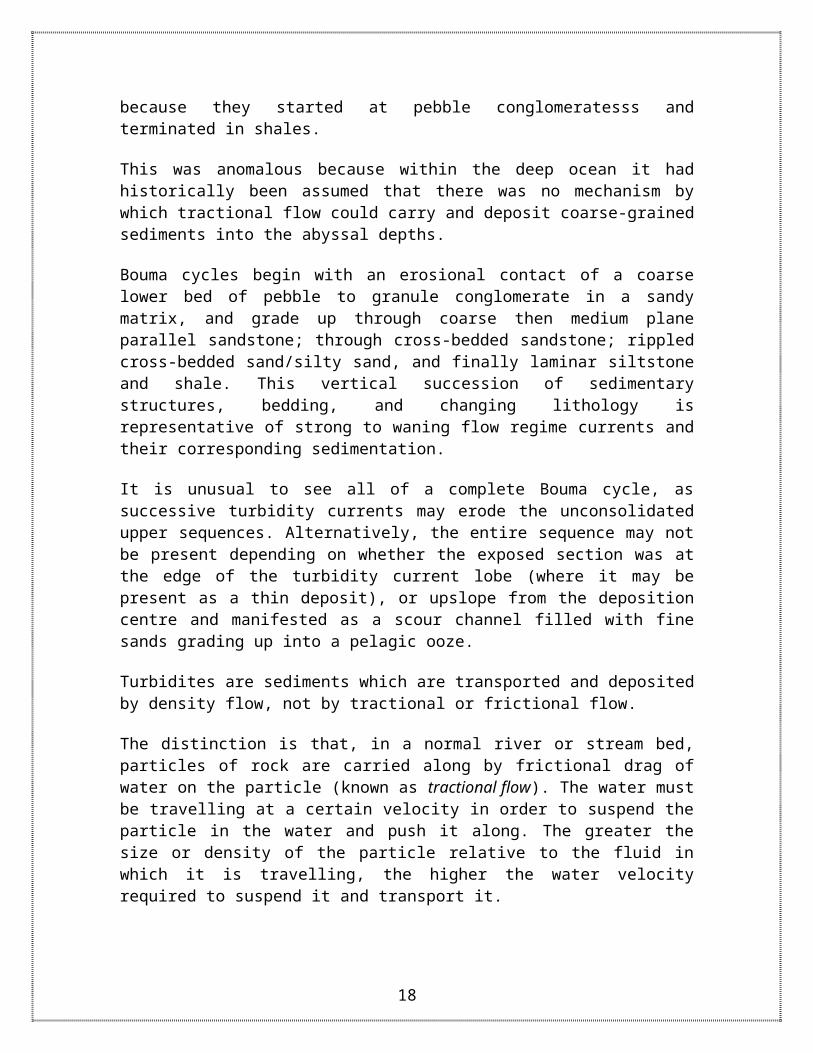
Turbidite geological sediments disseminates vast amount of clastic sediments in the deep ocean. Turbidites were first properly described by Bouma (1962), who studied deepwater sediments and recognized particular fining up intervals within deep water, fine grained shales, which were anomalous because they started at pebble conglomeratesss and terminated in shales.
This was anomalous because within the deep ocean it had historically been assumed that there was no mechanism by which tractional flow could carry and deposit coarse-grained sediments into the abyssal depths.
Bouma cycles begin with an erosional contact of a coarse lower bed of pebble to granule conglomerate in a sandy matrix, and grade up through coarse then medium plane parallel sandstone; through cross-bedded sandstone; rippled cross-bedded sand/silty sand, and finally laminar siltstone and shale. This vertical succession of sedimentary structures, bedding, and changing lithology is representative of strong to waning flow regime currents and their corresponding sedimentation.
It is unusual to see all of a complete Bouma cycle, as successive turbidity currents may erode the unconsolidated upper sequences. Alternatively, the entire sequence may not be present depending on whether the exposed section was at the edge of the turbidity current lobe (where it may be present as a thin deposit), or upslope from the deposition centre and manifested as a scour channel filled with fine sands grading up into a pelagic ooze.
Turbidites are sediments which are transported and deposited by density flow, not by tractional or frictional flow.
The distinction is that, in a normal river or stream bed, particles of rock are carried along by frictional drag of water on the particle (known as tractional flow). The water must be travelling at a certain velocity in order to suspend the particle in the water and push it along. The greater the size or density of the particle relative to the fluid in which it is travelling, the higher the water velocity required to suspend it and transport it.
Density based flow, however, occurs when liquefaction of sediment during transport causes a change to the density of the fluid. This is usually achieved by highly turbulent liquids which have a suspended load of fine grained particles forming a slurry. In this case, larger fragments of rock can be transported at water velocities too low to otherwise do so because of the lower density contrast.\
This condition occurs in many environments aside from simply the deep ocean, where turbidites are particularly well represented. Lahars on the side of volcanoes, mudslides and pyroclastic flows all create density based flow situations and, especially in the latter, can create sequences which are strikingly similar to turbidites.
14
turbidites in sediments can occur in carbonate as well as siliciclastic sequences. Classic, low density turbidites are characterized by graded bedding, current ripple marks, alternating sequences with pelagic sediments, distinct fauna changes between the turbidite and native pelagic sediments, sole markings, thick sediment sequences, regular bedding, and an absence of shallow-water features.Massive accumulations of turbidites and other deep water deposits may result in the formation of submarine fans. Sedimentary models of such fan systems typically are subdivided into upper, mid, and lower fan sequences each with distinct sand-body geometries, sediment distributions, and lithologic characteristics.
1.6 SALT DOMES
A mushroom-shaped or plug-shaped diapir made of salt, commonly having an overlying cap rock. Salt domes form as a consequence of the relative buoyancy of salt when buried beneath other types of sediment. The salt flows upward to form salt domes, sheets, pillars and other structures. Hydrocarbons are commonly found around salt domes because of the abundance and variety of traps created by salt movement and the association with evaporite minerals that can provide excellent sealing capabilities.
Salt, plain old sodium chloride, in massive accumulations provides distinctive similarities and differences between the shelf and the deepwater. Many geologists accept the view that during several interludes of marine recessions and transgressions over the last 150 million years, the probable areas have become landlocked and dried up, leaving volumes of salt as the water evaporated. The onshore runoff of the ancient rivers deposited sediments on top of the salt.
Subsequent to the deposition, salt began its unique contribution to offshore geology. Salt has a strange reaction to heat and pressure, the type that results from deep sediment layers above it. It has a propensity to move like the one in those psychedelic lava lamps. The salt accumulations slowly squirm upwards, breaking through and deforming the rocks, sand and silt above. As the salt pushes up and pierces the overlying rock layers, it can form anticlines, salt domes, faulted areas and other structures delightfully capable of trapping hydrocarbons. The proliferation of salt on the shelf and in the deepwater provides one of the four crucial requirements for the trapping mechanism.
The bad aspect about the movement of salt comes about by faulting. Breaking up the sediment layers into small compartments or traps limits both the production rate and the ultimate recovery through a single well. With a small reservoir, high production rates risk early breakthrough to the wellbore of the gas that sits above the oil or the water that sits below as the gas or water bypasses some of the more sluggish oil. In either case, the oil remains unrecoverable.
These structures are dealt with further in the chapter on Traps.
15
1.6 FORMATION - STAGES AND SETTINGSThe primary theory accepted for the generation of hydrocarbons is that it is formed by organic evolution. Plants and animals complete their life cycles and die, with their organic debris being deposited on the earth’s surface. The primary source of these organic depositions is microscopic plant and animal life and the smaller plants and animals within a water environment. Significant organic sedimentation occurs primarily in a water environment. As this organic debris is deposited, other materials are also deposited which, through lithification, will lead to the formation of sedimentary rocks such as shale and limestone. With continuing sedimentation and increasing overburden pressures due to increasing weight, sediments containing the organic debris move deeper into the earth.
With increasing depth, temperature increases, geologic time passes, and chemical action occurs, converting the organic debris into hydrocarbons. Note that the same four factors (pressure, temperature, time, and chemical action) which lead to lithification of the sediments forming solid rock are also converting organic materials into hydrocarbons. Source rock is defined as rock formed through lithification, from original sediments containing organic debris. In most geologic situations, the resultant hydrocarbons formed have been forced out of the sediments during lithification. For example, shale is one of the dominant source rocks for hydrocarbon, yet is seldom ever a rock from which hydrocarbon can be produced.
Once lithification has been completed to form the shale, any hydrocarbons remaining will be trapped within the sedimentary bed and cannot be produced.In order for hydrocarbons to be generated from organic deposition, temperatures must rise above 104ºF (40ºC) but not exceed 662ºF (350ºC). Higher temperatures than these will destroy any remaining organic materials or hydrocarbons already generated. This temperature range illustrated in Figure 12 is called the hydrocarbon temperature window. In order for hydrocarbons to be generated, a proper sequence of geologic events and conditions must occur. The theory that significant hydrocarbon volumes are generated by straight chemical reaction between carbon and hydrogen, without the necessity for organic materials being present, is not generally accepted within the industry.
16
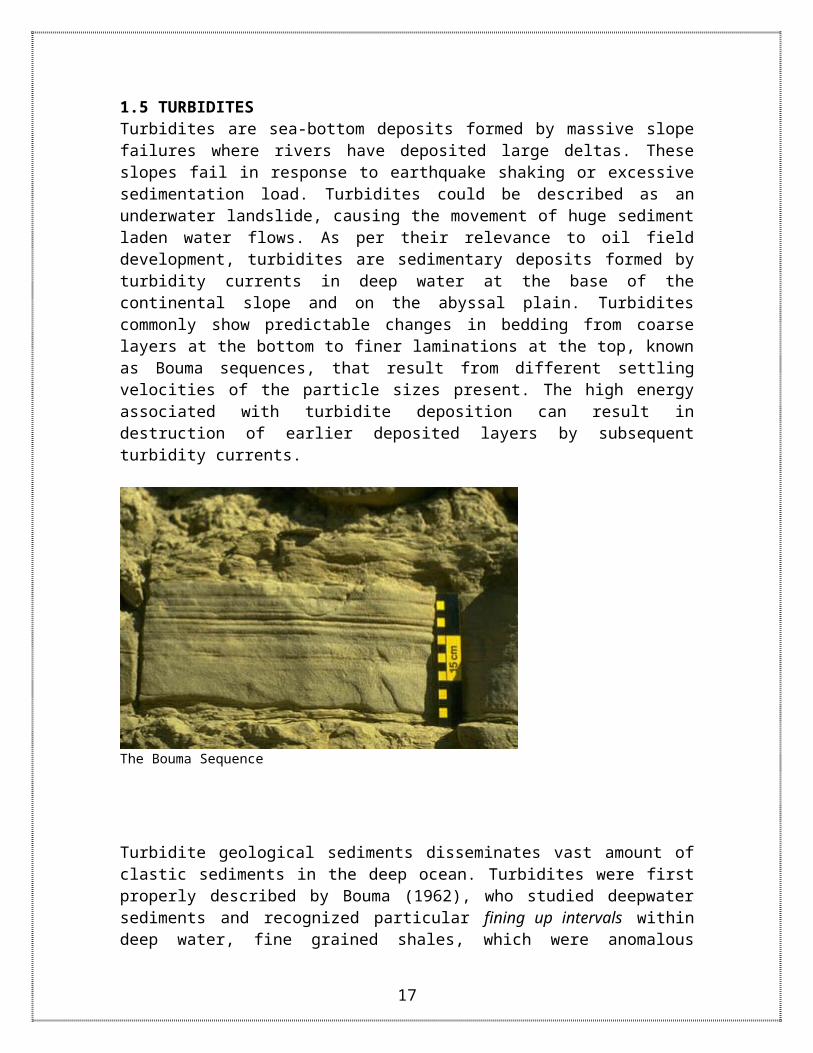
Figure 14 : Temperature Window for generating Hydrocarbons
Most major source rocks are shales and biogenic limestones. Coal may also be considered as a source rock, even though it is present in relatively small quantities within the earth when compared to shale’s and biogenic limestones. Essentially all shales and limestones result from water deposition.
The above processes described the precursory conditions for the formation of petroleum. Under deepwater conditions, the different geological settings come into play. The presence of different type of rocks controls the migration of oil to potential reserves, from where they are exploited.
The oil migrates upwards towards the surface, surpassing permeable and porous rocks. The oil migrates under the influence of gravity and thermal pressure of fluids. It migrates upwards till it is stopped by an impervious rock. This impervious rock forms a trap, as described as mentioned below.
17
1.8 GEOLOGICAL OIL TRAPS
In addition to the requirement that source rock exists for the generation of hydrocarbons, and that reservoir rock exists for the storage and production of the generated hydrocarbons, traps must also exist to trap, or seal, the hydrocarbon in place forming a hydrocarbon reservoir. The fluids of the subsurface migrate according to density. As previously discussed, the dominant fluids present or potentially present are hydrocarbon gas, hydrocarbon liquid, and salt water. Since the hydrocarbons are less dense than the salt water, they will tend to migrate upward to the surface, displacing the heavier water down elevation. These fluids will continue to migrate until they encounter impermeable rock, which will serve as a reservoir “seal” or “trap.” These impermeable rocks serving as reservoir seals, of which shale’s are among the most common, are referred to as confining beds or cap rocks. Traps exist because of variations in characteristics of rocks of the subsurface. If impermeable rock does not exist, the hydrocarbons will migrate to the surface and dissipate into the environment. In order for a hydrocarbon reservoir to exist, a proper sequence of events must have occurred in geologic time. Five types of hydrocarbon traps will be discussed. Most traps encountered by a petroleum geologist will be a combination or variation of these five types :
1. Anticlinal Traps2. Anticlinal Fault Traps3. Salt Dome Traps4. Stratigraphic Unconformity5. Facies Change
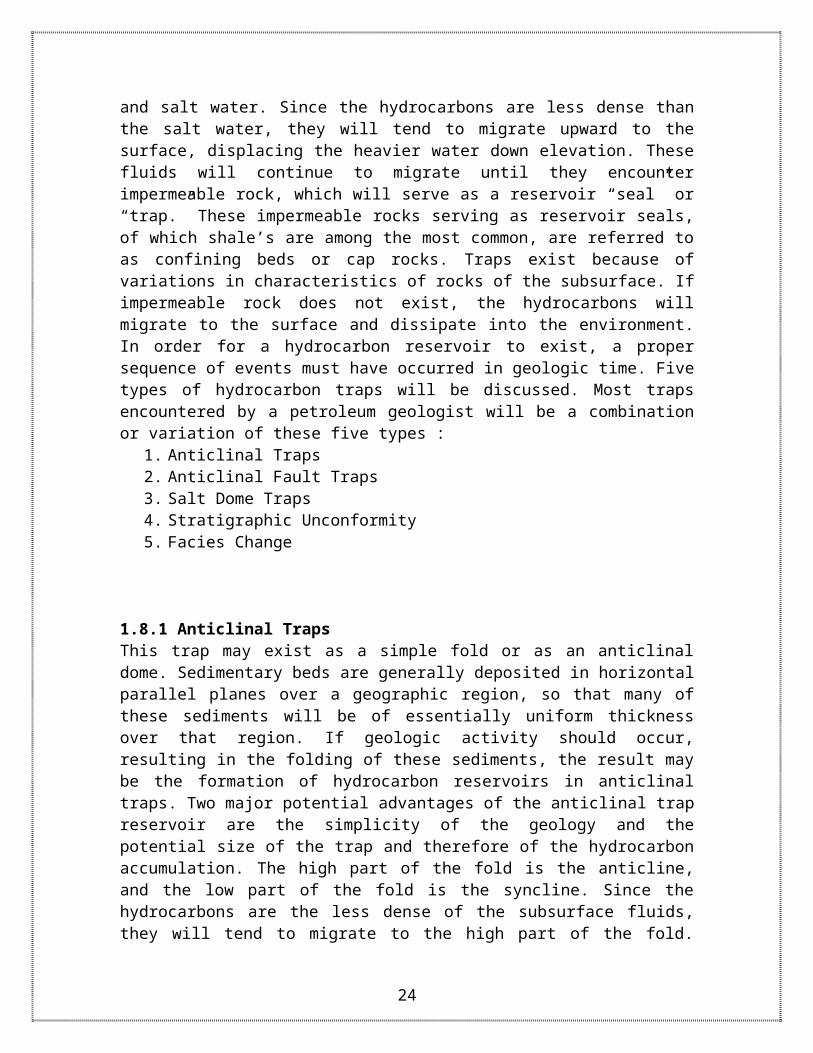
1.8.1 Anticlinal TrapsThis trap may exist as a simple fold or as an anticlinal dome. Sedimentary beds are generally deposited in horizontal parallel planes over a geographic region, so that many of these sediments will be of essentially uniform thickness over that region. If geologic activity should occur, resulting in the folding of these sediments, the result may be the formation of hydrocarbon reservoirs in anticlinal traps. Two major potential advantages of the anticlinal trap reservoir are the simplicity of the geology and the potential size of the trap and therefore of the hydrocarbon accumulation. The high part of the fold is the anticline, and the low part of the fold is the syncline. Since the hydrocarbons are the less dense of the subsurface fluids, they will tend to migrate to the high part of the fold. Consider the hydrocarbon reservoir illustrated in Figure 18. Hydrocarbon exists in an anticlinal trap within sandstone as its reservoir rock, where shale is the cap rock.
18
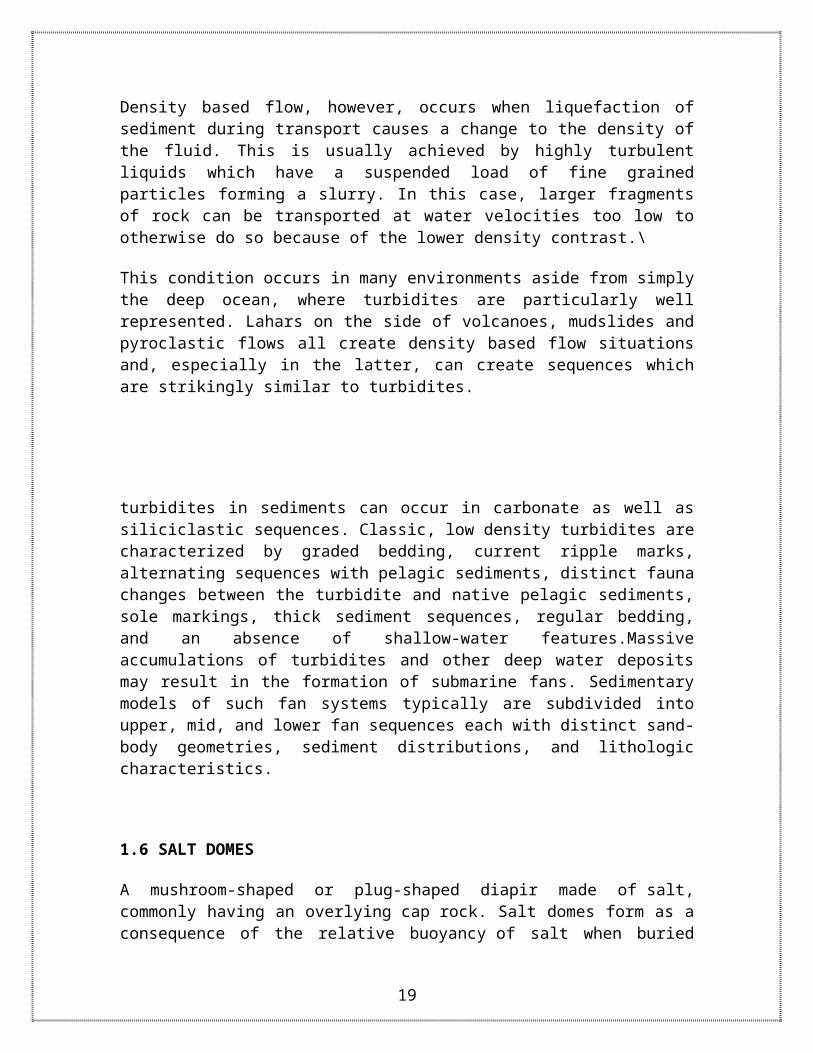
Figure 8 : Anticlinal Hydrocarbon Trap
Figure 9 :Anticlinal Dome Trap
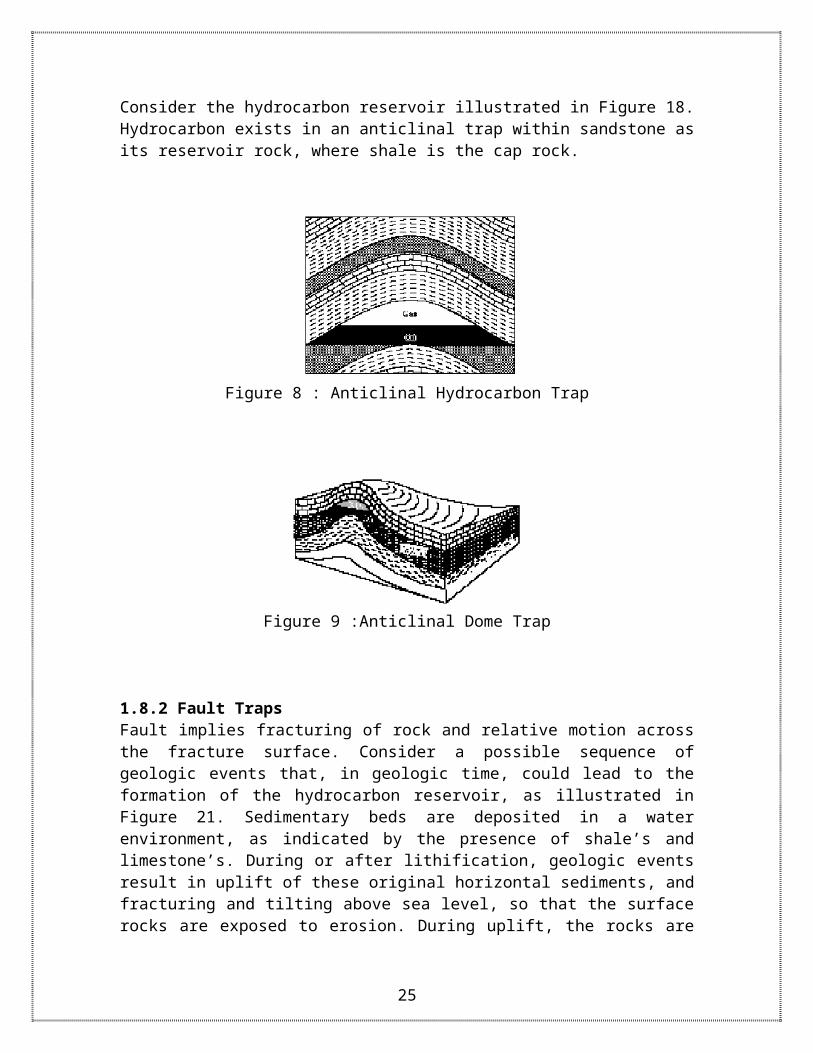
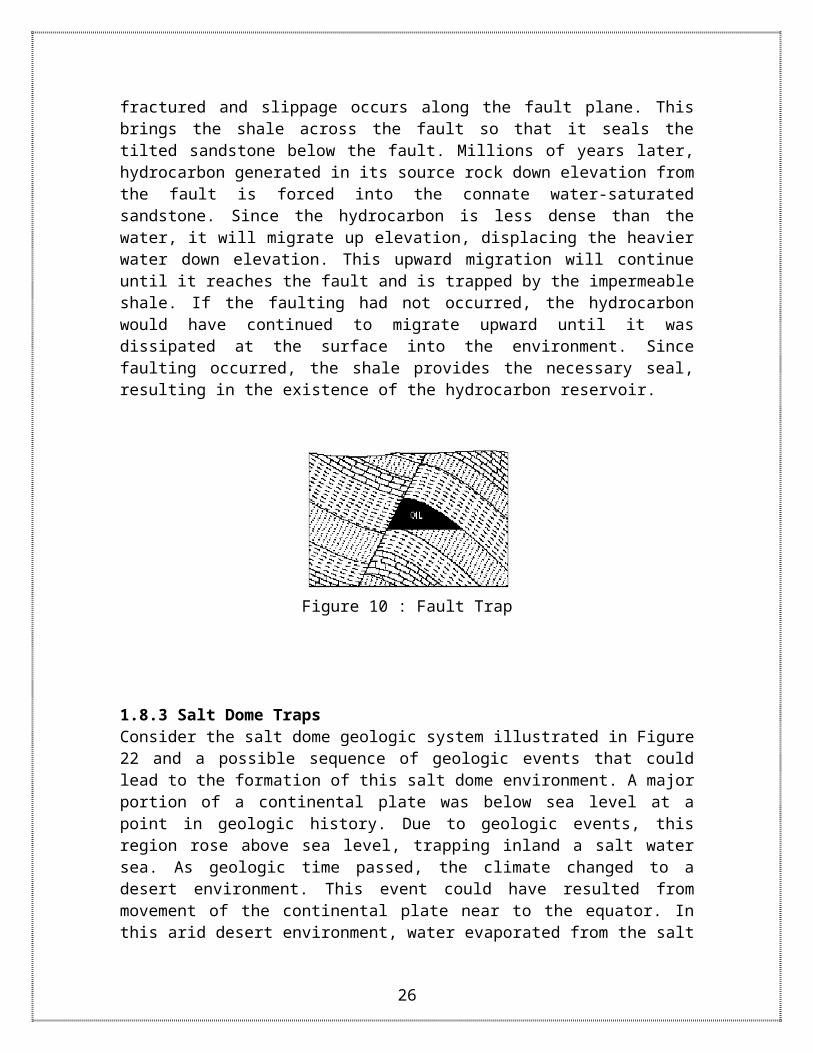
1.8.2 Fault TrapsFault implies fracturing of rock and relative motion across the fracture surface. Consider a possible sequence of geologic events that, in geologic time, could lead to the formation of the hydrocarbon reservoir, as illustrated in Figure 21. Sedimentary beds are deposited in a water environment, as indicated by the presence of shale’s and limestone’s. During or after lithification, geologic events result in uplift of these original horizontal sediments, and fracturing and tilting above sea level, so that the surface rocks are exposed to erosion. During uplift, the rocks are fractured and slippage occurs along the fault plane. This brings the shale across the fault so that it seals the tilted sandstone below the fault. Millions of years later, hydrocarbon generated in its source rock down elevation from the fault is forced into the connate water-saturated sandstone. Since the hydrocarbon is less dense than the water, it will migrate up elevation, displacing the heavier water down elevation. This upward migration will continue until it reaches the fault and is trapped by the impermeable shale. If the faulting had not occurred, the hydrocarbon would have continued to migrate upward until it was dissipated at the surface into the environment. Since faulting occurred, the shale provides the necessary seal, resulting in the existence of the hydrocarbon reservoir.
19
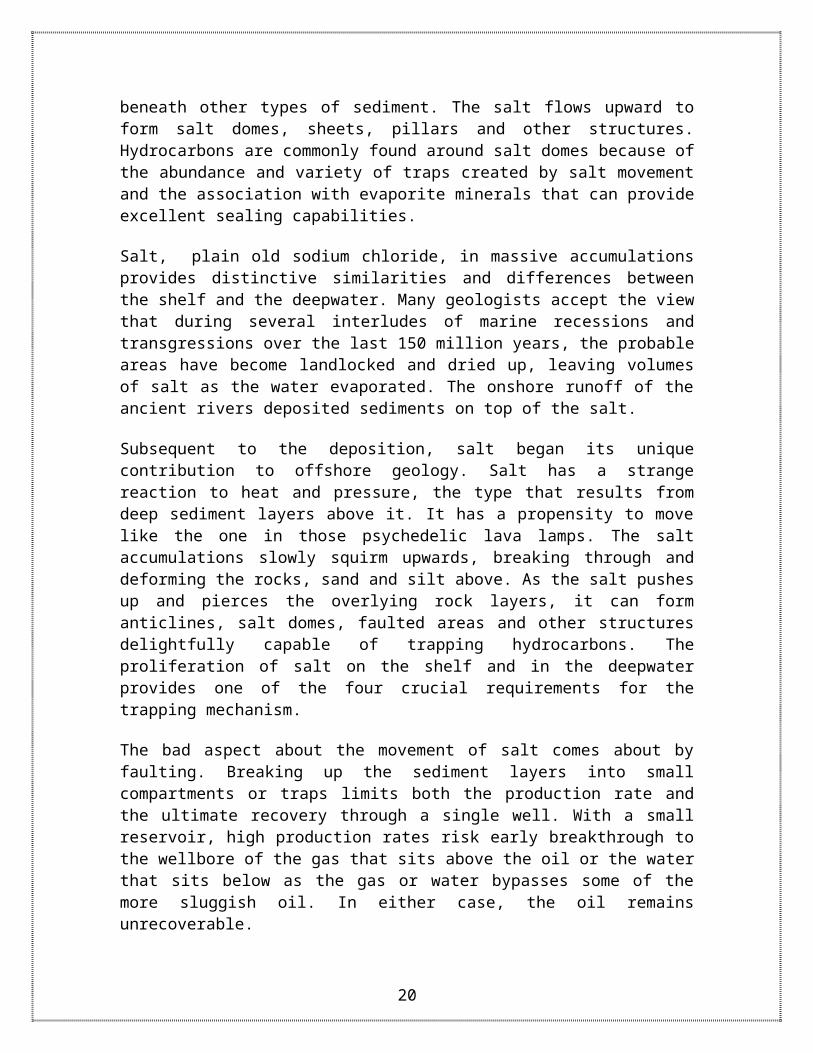
Figure 10 : Fault Trap
1.8.3 Salt Dome TrapsConsider the salt dome geologic system illustrated in Figure 22 and a possible sequence of geologic events that could lead to the formation of this salt dome environment. A major portion of a continental plate was below sea level at a point in geologic history. Due to geologic events, this region rose above sea level, trapping inland a salt water sea. As geologic time passed, the climate changed to a desert environment. This event could have resulted from movement of the continental plate near to the equator. In this arid desert environment, water evaporated from the salt water sea, leaving the salt residue on the dry sea bed. As millions of years passed in the desert environment, sand blew over the salt to cover and protect the salt sediment. Later geologic events resulted in the sinking of the region below sea level, followed by tens of millions of years of sedimentation in the resulting water environment. As time passed, lithification occurred. The desert sand became sandstone, and the salt became rock salt (sedimentary salt).After lithification, this salt bed was impermeable. It also had two properties significantly different from typical shale, sandstone or limestone:
It was less dense, with a measurably smaller specific weight. At subsurface overburden pressures and subsurface temperatures, the rock salt
was a plastic solid (it was highly deformable).
The combination of this lesser density and plasticity resulted in a buoyant effect if flow possibilities existed. Geologic events caused fracturing of overlying confining rocks. The salt, forced upward by the overburden pressures, began to flow plastically back to the surface, intruding into the overlying rock structures to lift, deform, and fracture them. The intruding salt was solid, yet geologically deformable. It might intrude at an average rate of only 1 inch per 100 years, yet on a geologic time basis, such deformation is highly significant. This rate would result in 10 inches in 1,000 years, or 10,000 inches (833 ft) in 1 million years. In a geologic time period of only 10 million years, this salt dome could intrude to a height of over 1.5 miles into the overlying structures. Obviously, a vertical subsurface structure 1.5 miles high is geologically significant.
20
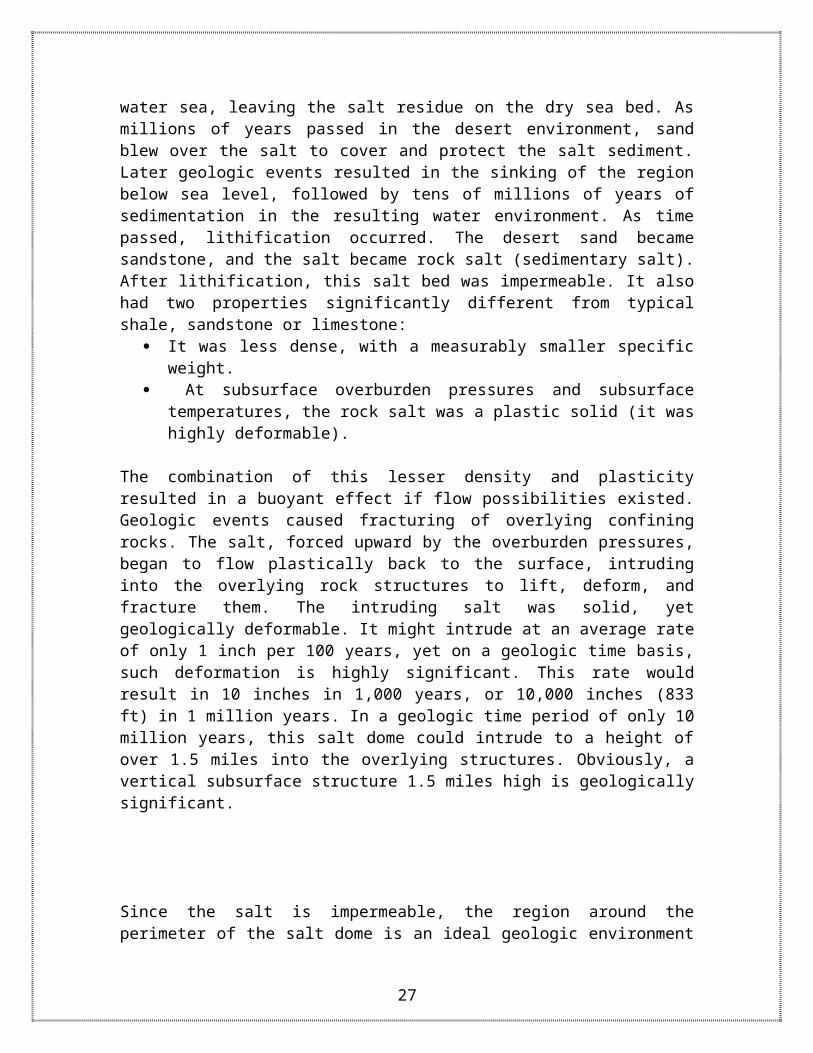
Since the salt is impermeable, the region around the perimeter of the salt dome is an ideal geologic environment for hydrocarbon traps. The tendency of the intruding salt to uplift the rocks as it intrudes enhances the separation of the less dense oil from the more dense salt water by reducing the area of the oil-water contact. The fracturing of surrounding rocks due to the intruding salt and the lifting of the rocks above the salt dome also provide an environment for the existence of fault traps and anticlinal traps in addition to the salt dome traps around the perimeter of the dome. A salt dome region, therefore, is an excellent geologic environment for all three types of traps discussed so far.
Figure 11 : Salt Dome Traps
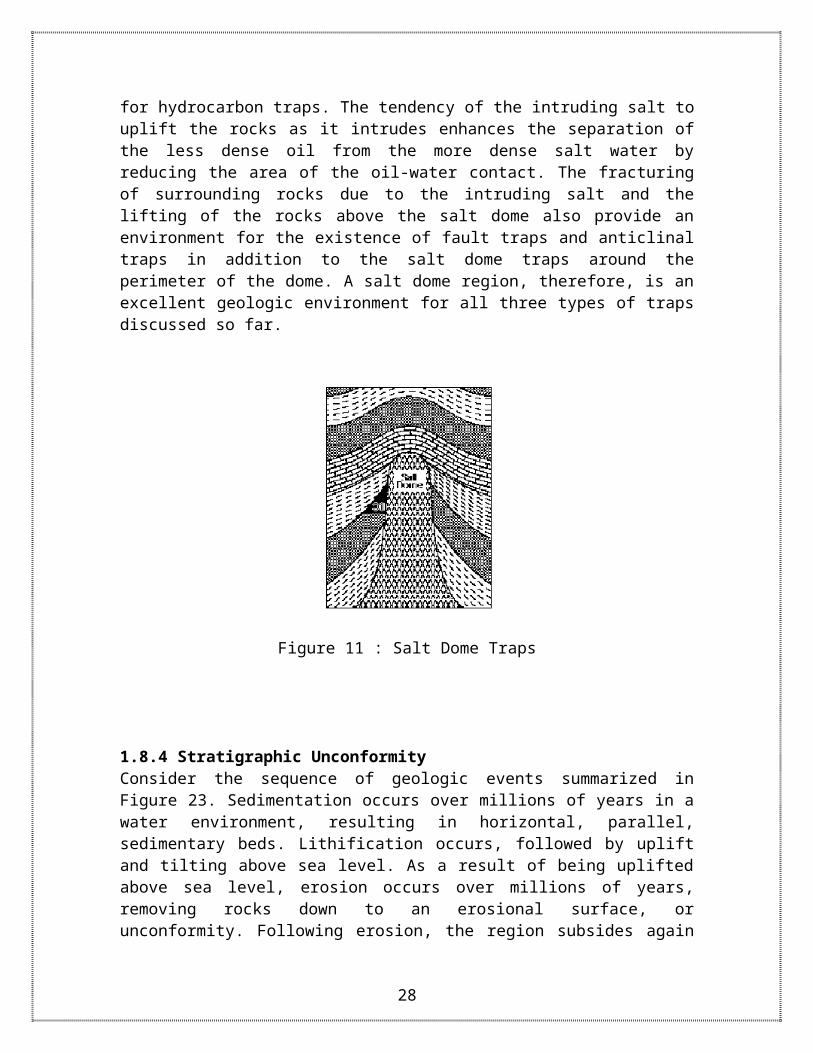
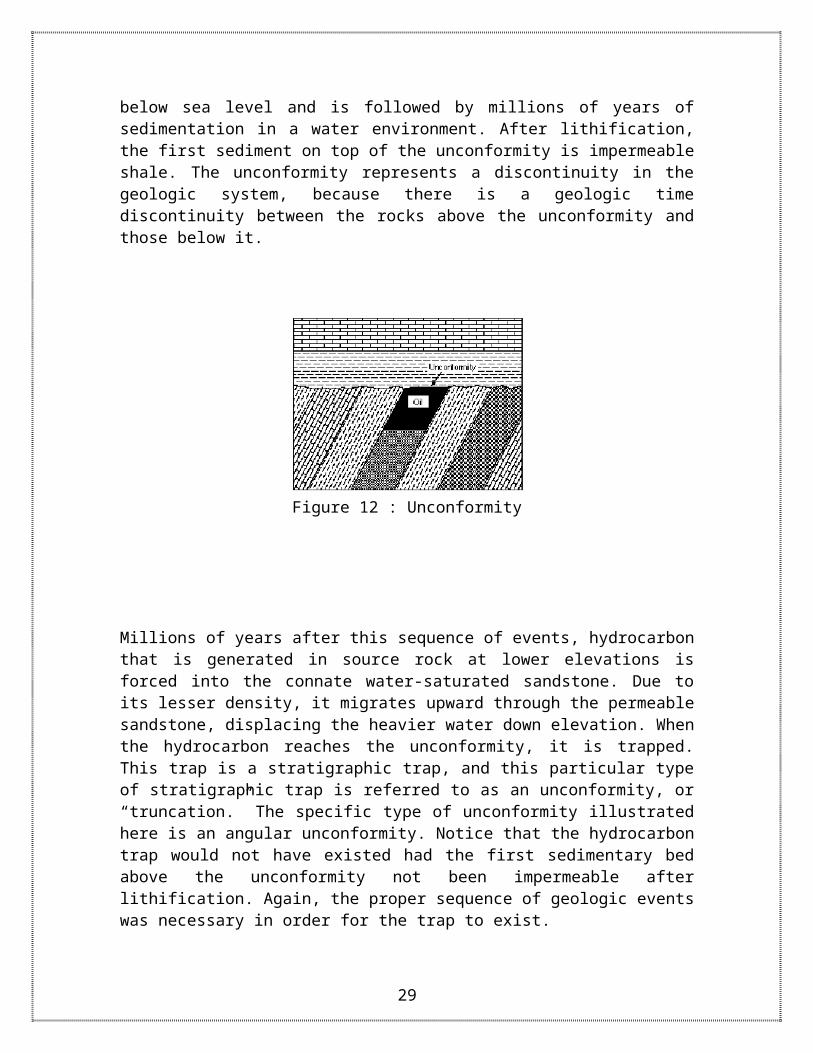
1.8.4 Stratigraphic UnconformityConsider the sequence of geologic events summarized in Figure 23. Sedimentation occurs over millions of years in a water environment, resulting in horizontal, parallel, sedimentary beds. Lithification occurs, followed by uplift and tilting above sea level. As a result of being uplifted above sea level, erosion occurs over millions of years, removing rocks down to an erosional surface, or unconformity. Following erosion, the region subsides again below sea level and is followed by millions of years of sedimentation in a water environment. After lithification, the first sediment on top of the unconformity is impermeable shale. The unconformity represents a discontinuity in the geologic system, because there is a geologic time discontinuity between the rocks above the unconformity and those below it.
21
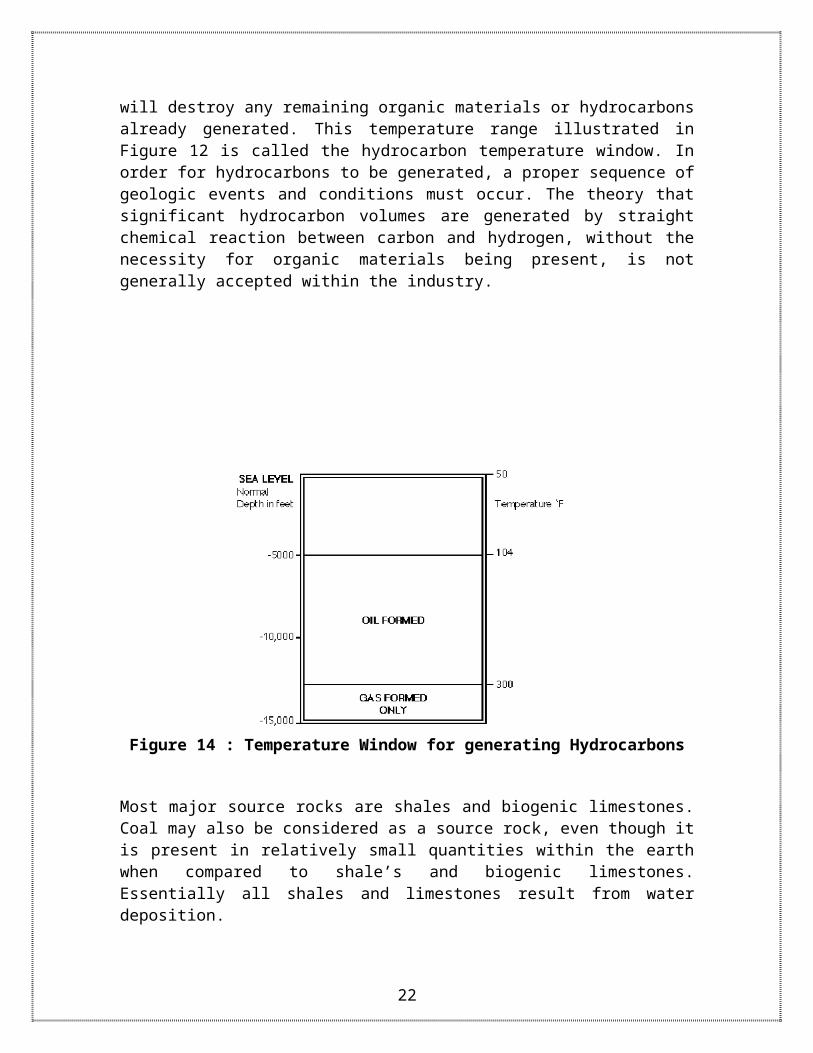
Figure 12 : Unconformity
Millions of years after this sequence of events, hydrocarbon that is generated in source rock at lower elevations is forced into the connate water-saturated sandstone. Due to its lesser density, it migrates upward through the permeable sandstone, displacing the heavier water down elevation. When the hydrocarbon reaches the unconformity, it is trapped. This trap is a stratigraphic trap, and this particular type of stratigraphic trap is referred to as an unconformity, or “truncation.” The specific type of unconformity illustrated here is an angular unconformity. Notice that the hydrocarbon trap would not have existed had the first sedimentary bed above the unconformity not been impermeable after lithification. Again, the proper sequence of geologic events was necessary in order for the trap to exist.
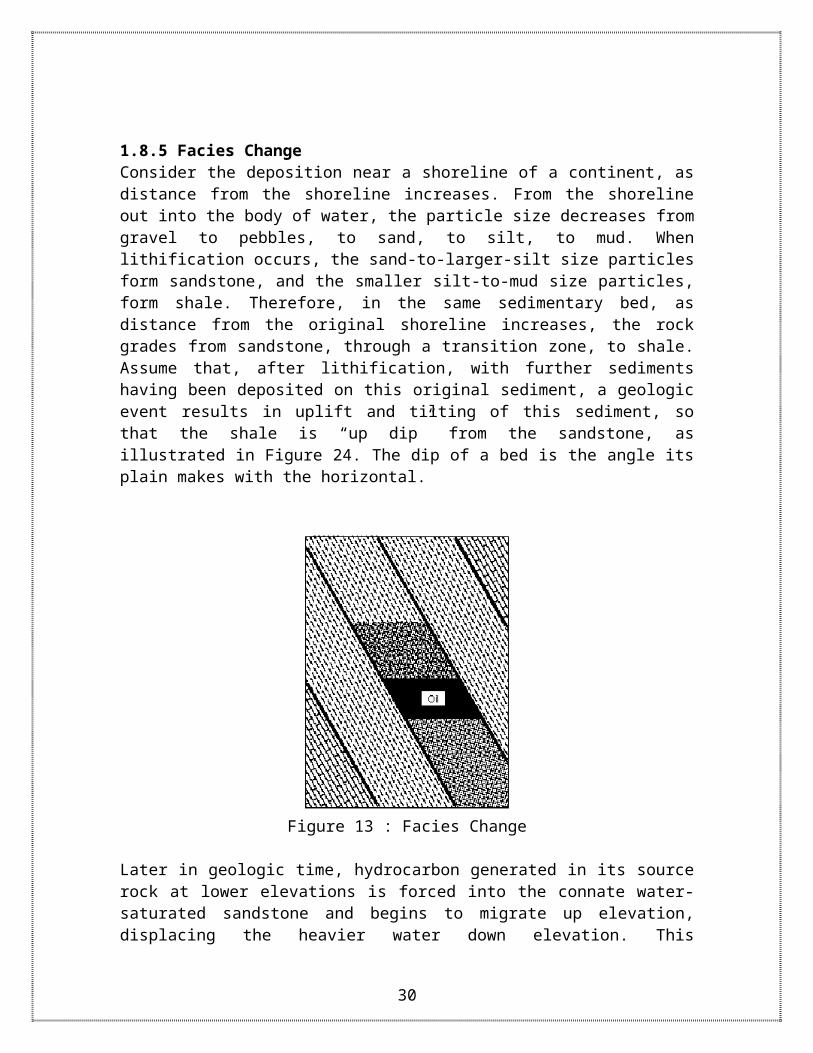
1.8.5 Facies ChangeConsider the deposition near a shoreline of a continent, as distance from the shoreline increases. From the shoreline out into the body of water, the particle size decreases from gravel to pebbles, to sand, to silt, to mud. When lithification occurs, the sand-to-larger-silt size particles form sandstone, and the smaller silt-to-mud size particles, form shale. Therefore, in the same sedimentary bed, as distance from the original shoreline increases, the rock grades from sandstone, through a transition zone, to shale. Assume that, after lithification, with further sediments having been deposited on this original sediment, a geologic event results in uplift and tilting of this sediment, so that the shale is “up dip” from the sandstone, as illustrated in Figure 24. The dip of a bed is the angle its plain makes with the horizontal.
22
Figure 13 : Facies Change
Later in geologic time, hydrocarbon generated in its source rock at lower elevations is forced into the connate water-saturated sandstone and begins to migrate up elevation, displacing the heavier water down elevation. This hydrocarbon will continue to migrate until it encounters the impermeable shale at the transition zone within the rock. It is trapped as a result of the change of permeability within the sedimentary bed, as the transition occurs from sandstone to shale or from permeability to no permeability. This transition of properties within the rock sediment is called a facies change. Through the transition zone, the transition occurs from sandstone to shaley sandstone, to sandy shale, to shale. As to the distinction between”shaley sand” and”sandy shale,” as long as the rock has sufficient porosity and permeability to be considered an acceptable reservoir rock, it is classified as sandstone. However, when either property has reduced sufficiently within the transition zone so that the rock can no longer be considered an acceptable reservoir rock, it is considered shale.
23
2. GEOLOGICAL AND PHYSICAL CHARACTERISICS OF OIL RESERVOIRS2.1 Natural Oil CollectorsOil occupies the interstices between the grains and fissures and cavities in the rocks that compose the oil-bearing formations. The great majority oil pools occur in those sedimentary rocks that are good oil collectors (sand, sandstone, conglomerates, fractured and cavernous limestones and dolomites). Sometimes oil is found in the fissures and pores of igneous rocks, but such pools are of a lesser commercial value. Because of their different properties, the oil-containing reservoirs play different parts. Some which have numerous pores of considerable size serve as reservoirs and also as carrier beds through which oil enters the wells. Other rocks like clay and shale are practically impervious as they have pores of smaller sections in which fluids lose their mobility under the action of molecular surface forces. These rocks provide natural cap rock for productive oil collection promoting their accumulation. The economic value of any oil field is determined by the physical properties of reservoir rocks, reservoir fluids and also by the type and amount of reservoir energy.The physical properties important from the standpoint of production are as follows :
1) Total and effective porosity2) Permeability3) Grain size distribution4) Specific surface5) Carbonaceousness6) Compressibility of reservoir rocks and fluids7) Saturation of rocks with oil, gas and water8) Physical and Physico-chemical properties of oil (viscosity, density, solubility of
gases in oil and in water, surface properties of oil)
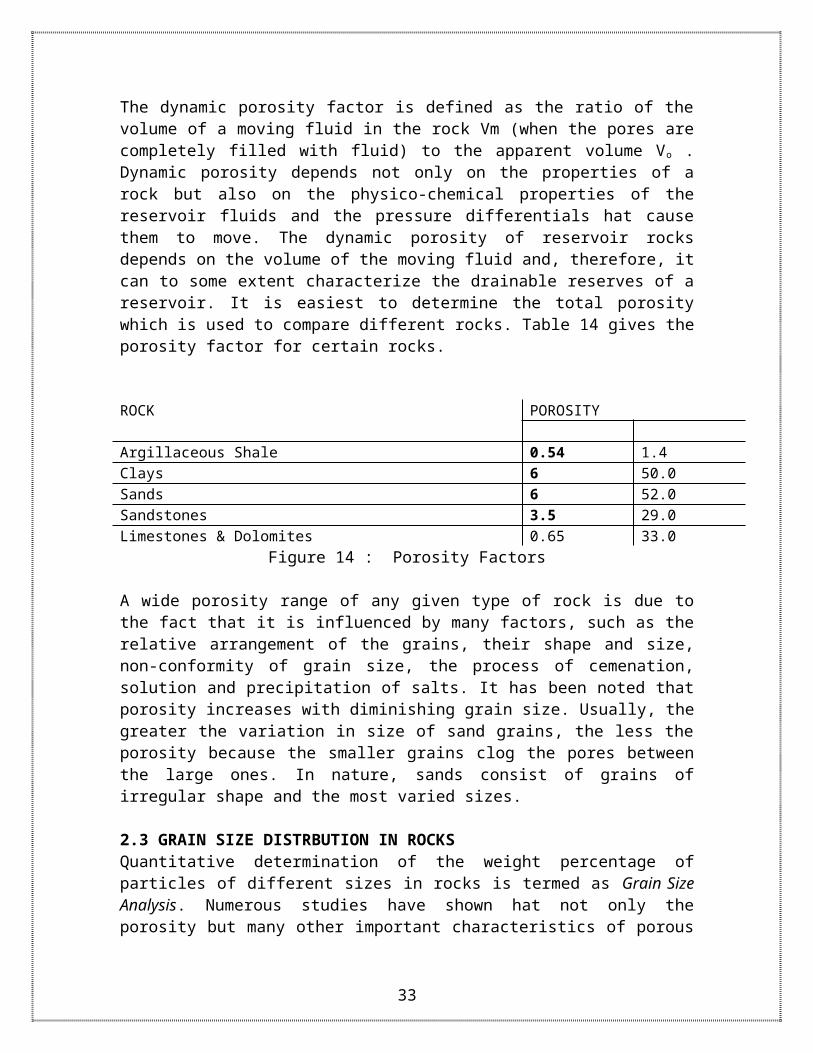
2.2 ROCK POROSITYPorosity of rocks is the presence of pores or openings not filled with solid substances. The terms Effective and Total porosity are important from the view of oil engineering. The total porosity ratio of rocks is used in estimating of absolute oil reserves, and also in comparing different strata or parts of one and the same stratum. In practical oil engineering, the concept of Dynamic Porosity is also used to characterize the porosity of oil bearing strata. The dynamic porosity factor is defined as the ratio of the volume of a moving fluid in the rock Vm (when the pores are completely filled with fluid) to the apparent volume V o . Dynamic porosity depends not only on the properties of a rock but also on the physico-chemical properties of the reservoir fluids and the pressure differentials hat cause them to move. The dynamic porosity of reservoir rocks depends on the volume of the moving fluid and, therefore, it can to some extent characterize the drainable reserves of a reservoir. It is easiest to determine the total porosity which is used to compare different rocks. Table 14 gives the porosity factor for certain rocks.
24
ROCK POROSITY
Argillaceous Shale 0.54 1.4Clays 6 50.0Sands 6 52.0Sandstones 3.5 29.0Limestones & Dolomites 0.65 33.0
Figure 14 : Porosity Factors
A wide porosity range of any given type of rock is due to the fact that it is influenced by many factors, such as the relative arrangement of the grains, their shape and size, non-conformity of grain size, the process of cemenation, solution and precipitation of salts. It has been noted that porosity increases with diminishing grain size. Usually, the greater the variation in size of sand grains, the less the porosity because the smaller grains clog the pores between the large ones. In nature, sands consist of grains of irregular shape and the most varied sizes.
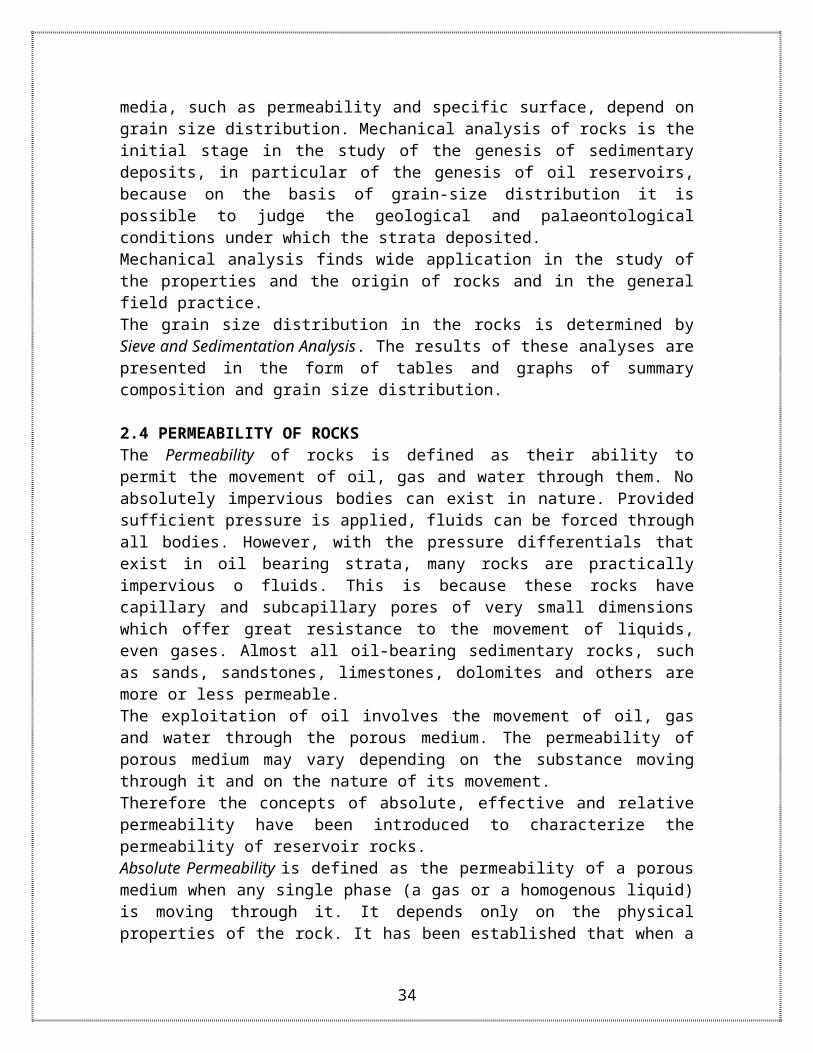
2.3 GRAIN SIZE DISTRBUTION IN ROCKSQuantitative determination of the weight percentage of particles of different sizes in rocks is termed as Grain Size Analysis. Numerous studies have shown hat not only the porosity but many other important characteristics of porous media, such as permeability and specific surface, depend on grain size distribution. Mechanical analysis of rocks is the initial stage in the study of the genesis of sedimentary deposits, in particular of the genesis of oil reservoirs, because on the basis of grain-size distribution it is possible to judge the geological and palaeontological conditions under which the strata deposited.Mechanical analysis finds wide application in the study of the properties and the origin of rocks and in the general field practice.The grain size distribution in the rocks is determined by Sieve and Sedimentation Analysis. The results of these analyses are presented in the form of tables and graphs of summary composition and grain size distribution.
2.4 PERMEABILITY OF ROCKSThe Permeability of rocks is defined as their ability to permit the movement of oil, gas and water through them. No absolutely impervious bodies can exist in nature. Provided sufficient pressure is applied, fluids can be forced through all bodies. However, with the pressure differentials that exist in oil bearing strata, many rocks are practically impervious o fluids. This is because these rocks have capillary and subcapillary pores of very small dimensions which offer great resistance to the movement of liquids, even gases. Almost all oil-bearing sedimentary rocks, such as sands, sandstones, limestones, dolomites and others are more or less permeable. The exploitation of oil involves the movement of oil, gas and water through the porous medium. The permeability of porous medium may vary depending on the substance moving through it and on the nature of its movement. Therefore the concepts of absolute, effective and relative permeability have been introduced to characterize the permeability of reservoir rocks. Absolute Permeability is defined as the permeability of a porous medium when any single phase (a gas or a homogenous liquid) is moving through it. It depends only on the
25
physical properties of the rock. It has been established that when a fluid moves through a porous medium, permeability depends on the physico-chemical properties of the fluid.Effective Permeability is defined as the permeability of a rock to a given fluid when multi-phase system is present or is moving through the pores. It depends not only on the physical properties of the rock but also on the extent of its saturation with oil, gas or water and on their physical and chemical properties.
Relative Permeability of a porous medium is the ratio between effective and absolute permeability. The permeability of natural petroleum collectors may vary over a very wide range even in one and the same stratum. A typical feature of the rocks of natural resources is that lateral permeability (along planes of parallel planes of bedding) is higher than vertical permeability at right angles to them. This is because rocks are more consolidated vertically rather than laterally. During the exploitation of oil reservoirs, the oil moves in a porous medium which contains water in its pores or else water, oil and gas move together as a multiphase system. Under these conditions, the permeability of the reservoir rock to some particular phase is always less than its absolute permeability. Therefore the effective phase permeability is closely related to the oil, gas and water saturation of the reservoir rock.
2.5 MECHANICAL PROPERTIES OF ROCKSThe most important mechanical properties which should be taken into account in oil exploitation are, elasticity, compressive and tensile strengths, the nature of residual deformation and plasticity. These properties influence a number of processes that take place in the oil stratum during the exploitation of a reserve. For instance, the elastic properties of the reservoir rock and formation fluids affect the redistribution of pressure in the formation. The elastic energy released when the pressure is relieved may serve as one of the main agents causing the oil to move to the wells. Plastic deformation of the rocks is one of the most interesting and important problems in oil engineering. In considering the deformations that occur without occur without interrupting the continuity of the rocks, such as folding, flexing, the problem arises in the possibility of such solid rocks changing their shape without developing visible cracks. It is assumed that the “plasticity” of rocks (sandstones, conglomerates and others) may often be explained by the presence of numerous micro fractures along which the rock can slip and subside. In his way there occur invisible step-like changes in the strata, which outwardly look like smooth flexures and deformations.
26
The initial prospecting of the area has been described as above, along with the process of formation of oil, with special emphasis on deepwater conditions. After going through the legal obligations, the concerned organization needs a scientific proof to supplement the estimation of oil recovery from that particular area. Various exploratory methods are carried out in the waters to identify the geological formations beneath the crust.
3. SEISMIC INVESTIGATIONSSeismic data, especially 3D, is one of the vital enablers that has made deepwater exploration rewarding. The seismic investigation involves 4 stages as stated below.
3.1 AcquisitionThe object of this phase is to collect seismic data that present a picture of the subsurface. Seismic vessels tow Streamers, plastic tubes that extend upto 30,000 feet in length behind the boat. The streamers float below the surface and have visible markers at the surface, placed intermittently to track the cables and to warn off vessels that might want to cross tracks and cut the cables.
The plastic tubes contain hydrophones (pressure change detectors) with thousands in each streamer. The vessel also tows air guns, the seismic energy source, a short distance behind the boat. These guns are filled with compressed air, and when they open abruptly, they release the air with a bang. The sound wave travels down through the water, more or less impeded. As it passes the sea floor into the subsurface, the sound wave reflects or echoes off the boundaries between layers of seabed, back to the surface where the hydrophones pick up the echo. Different hydrophones in a single streamer record the bounced seismic signal from different angels. The deeper the layer, the longer is the echo takes to reach a hydrophone. Various layers of the rock have different acoustical properties. The unique composition and density of each rock layer affects the velocity of the echo and the time it gets into the hydrophone. Multiple shots fire as the seismic vessel motors over a target area. Sometimes a vessel returns to a target and repeats the acquisition with a perpendicular pass. All in all, the number of recorded sounds can add upto millions of million.Since the hydrophones string out behind the streamer in a straight line, the record comes in a 2D format. The reflections come out from below but not from the side. To create 3D records, seismic vessels string 10-15 parallel streamers behind them. During the processing the parallel records are transformed into a continuous 3D block of data, often called a seismic cube. Modern seismic cables convert the reflected sound waves into digital format using special modules in the cable.
27
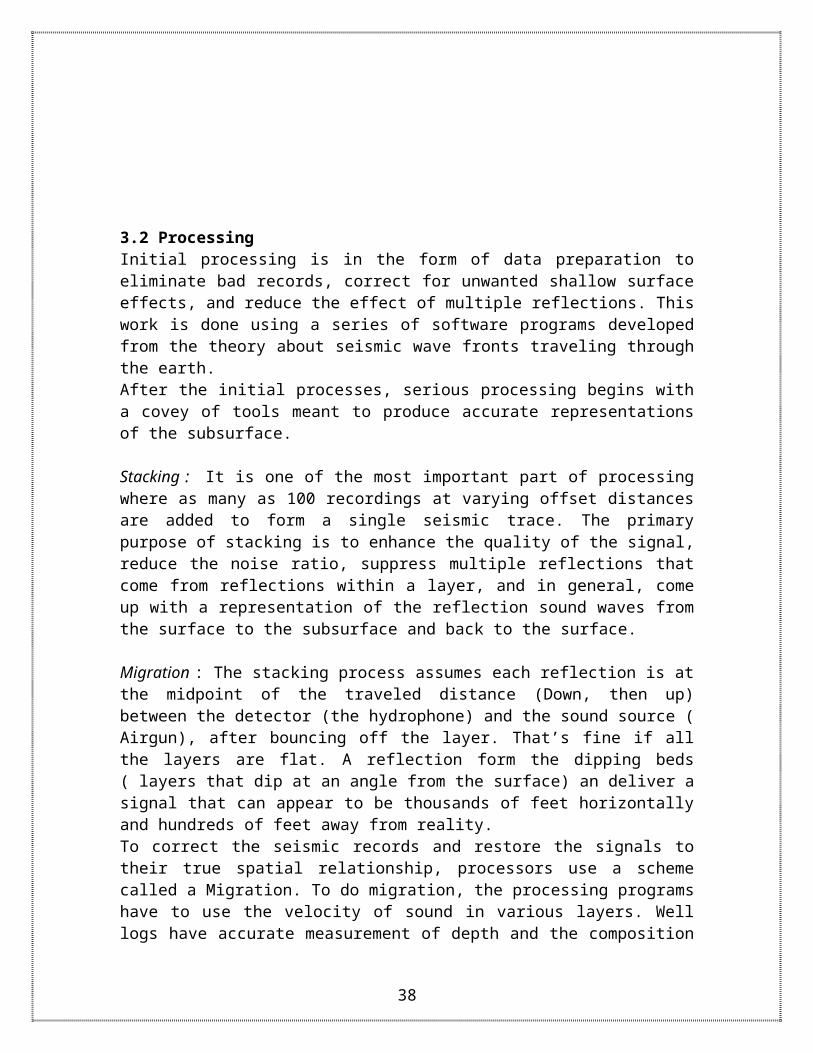
3.2 ProcessingInitial processing is in the form of data preparation to eliminate bad records, correct for unwanted shallow surface effects, and reduce the effect of multiple reflections. This work is done using a series of software programs developed from the theory about seismic wave fronts traveling through the earth.After the initial processes, serious processing begins with a covey of tools meant to produce accurate representations of the subsurface.
Stacking : It is one of the most important part of processing where as many as 100 recordings at varying offset distances are added to form a single seismic trace. The primary purpose of stacking is to enhance the quality of the signal, reduce the noise ratio, suppress multiple reflections that come from reflections within a layer, and in general, come up with a representation of the reflection sound waves from the surface to the subsurface and back to the surface.
Migration : The stacking process assumes each reflection is at the midpoint of the traveled distance (Down, then up) between the detector (the hydrophone) and the sound source ( Airgun), after bouncing off the layer. That’s fine if all the layers are flat. A reflection form the dipping beds ( layers that dip at an angle from the surface) an deliver a signal that can appear to be thousands of feet horizontally and hundreds of feet away from reality. To correct the seismic records and restore the signals to their true spatial relationship, processors use a scheme called a Migration. To do migration, the processing programs have to use the velocity of sound in various layers. Well logs have accurate measurement of depth and the composition of various geological layers. Using mathematical analysis, they can estimate the velocity of sound in each layer and approximate the depth/velocity relationship. In some deepwater areas, the conversion can be tricky.
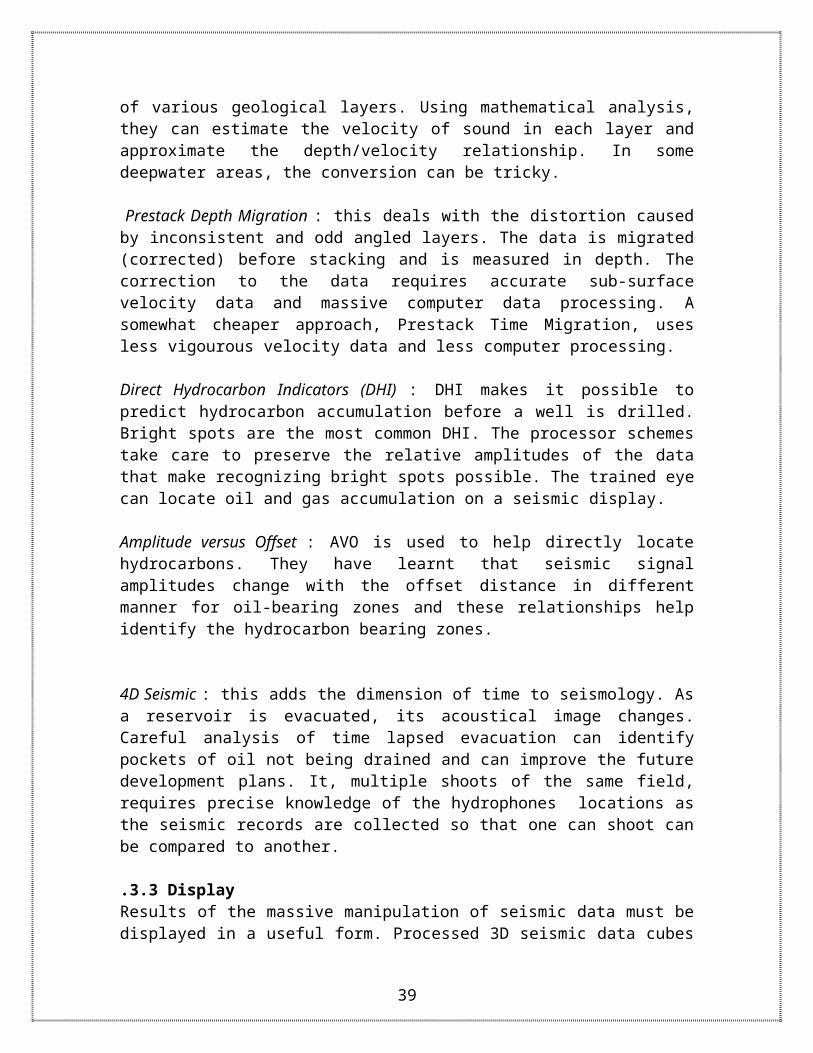
Prestack Depth Migration : this deals with the distortion caused by inconsistent and odd angled layers. The data is migrated (corrected) before stacking and is measured in depth. The correction to the data requires accurate sub-surface velocity data and massive computer data processing. A somewhat cheaper approach, Prestack Time Migration, uses less vigourous velocity data and less computer processing.
Direct Hydrocarbon Indicators (DHI) : DHI makes it possible to predict hydrocarbon accumulation before a well is drilled. Bright spots are the most common DHI. The processor schemes take care to preserve the relative amplitudes of the data that make recognizing bright spots possible. The trained eye can locate oil and gas accumulation on a seismic display.
Amplitude versus Offset : AVO is used to help directly locate hydrocarbons. They have learnt that seismic signal amplitudes change with the offset distance in different manner for oil-bearing zones and these relationships help identify the hydrocarbon bearing zones.
28
4D Seismic : this adds the dimension of time to seismology. As a reservoir is evacuated, its acoustical image changes. Careful analysis of time lapsed evacuation can identify pockets of oil not being drained and can improve the future development plans. It, multiple shoots of the same field, requires precise knowledge of the hydrophones locations as the seismic records are collected so that one can shoot can be compared to another.
.3.3 DisplayResults of the massive manipulation of seismic data must be displayed in a useful form. Processed 3D seismic data cubes are stored in the computer. Simple 2D vertical slices provides first look at the geology of the area being tested. Horizontal slices of the data cube, usually called time slices, can alsi be displayed on the computer screen. A 3D cube can be rotated to get different views of the seismic image of the subsurface. Certain data characteristics such as strong seismic reflections can be isolated and displayed as a separate data cube using Voxel technology. Images of the subsurface are shown on a large high fidelity screens and appear on one or more walls to create an illusion of he viewer being present in the subsurface looking at the data from different angles, sometimes using special 3D glasses.
3.4 InterpretationsThe data processed coupled with the geological knowledge of the area is finally used to interpret the data and take a decision regarding the implementation of the wildcat drilling.
29
4. WILDCAT
Suppose the geological gets past these hurdles and conveniences management to spend the money to dril a wild cat. The geologist and the geophysicst begin collaborating with the new set of scientist, engineers and field operating people to plan and execute the wildcat well.
The geologist and geophysicist bring the subsurface story to the table. They specify the depth, the geological objectives, i.e. what kind of formation they expect to drill through and the target depth they want to reach.
They consult petrophysical engineers about downhole well bore pressure, a program for core sampling, an electric log evaluation during the drilling sequence. That helps identify the presence of hydrocarbons and the quality of the target sands, i.e., the formation that might hold those hydrocarbons.
Sometimes, a paleontologist joins the team to identify the fossils and remnants of animals or plant life in the core samples. That helps identify the age of the rock strata being drilled through conforming or rejecting earlier assumptions or conclusions about ths geological history and composition of the play. To the paleontologist, a wild cat provides an opportunity to collect geological information for use on subsequent wells drilled in the area.
In contrast, the buck eventually gets passed to the field operating people who bring their knowledge of the drilling vessels, drilling rigs and techniques most suited for this prospect. In the end they have to drill the wildcat and reach the target.
30
5. APPRAISAL
The wildcat has been drilled. Hydrocarbons are present in the well test. The exploration geologist and geophysicists are thrilled with the success but excitement soon dissipates as management asks the critical question “how big is the accumulation?” Are their enough reserves to justify further investment?As part of the planning process, the team member who worked the subsurface model developed various scenarios. If the well proves to contain hydrocarbons, where they would drill the next well, and appraisal well? Would more seismic be useful? Superimposed on these ideas, the team considers and integrates the information from the various from the wildcat into their models.Based on these feedback and analysis, theteam recommends one of several options,
Plug and abandon the well because it has no further use in the appraisal process or in the development plans. Remarkably, this is very often the case with a wildcat well.
Plug back the lower portion of the well and use a upper portion to drill a side track to a new bottom hole location to help determine the size of the total accumulation.
Temporarily abandon the well until further analysis indicates how it can best be used in the appraisal or development process.
Complete the well. In some cases, if there is a high probability that field development will go forward, and if the well is situated in a good spot, the rig crew can leave the well prepared to be completed in the fashion.
31
6. DEVELOPMENT SYSTEM CHOICES
The options available to develop and produce oil and gas in a thousand feet or more deep fall into three broad groups, fixed to the sea floor, moored and tethered floating systems, and subsea systems, as shown below.
Fixed Systems1) Fixed platforms2) Compliant towers3) Gravity platforms
Floating Systems1) Tension leg platforms (TLPs)2) Spar platforms3) Floating production systems (FPS’s)4) Floating platform, storage ,and offloading (FPSOs)
Sub Sea Systems
6.1 Fixed to the sea floor
These structures physically sit on the bottom. They are held in place either by the sheer weight of the structure or by steel piles driven into the seabed and affixed to the structure. The group includes the following.
Fixed platforms: These consist of a jacket and a deck. The jacket is the tall, vertical section built from tubular steel members and is locked to the seabed by driven piles. The topsides or deck placed on top has production equipment, crew quarters, and drilling rigs.
Compliant towers: Like the fixed platform, these are made of tubular steel members and are fixed to bottom with piling, and support a deck. By design, complaint towers sustain more lateral deflection than the more massive and rigid fixed platforms.
Gravity platforms: These built from reinforced concrete. With their resulting weight, gravity platforms reply on gravity to hold them in place. Gravity platforms are used in up to 1000 feet of water, but the seabed has to be especially firm to ensure no creep over time.
32
6.2 Floating Systems
By their nature and training, explorers look for hydrocarbons wherever and often that can lead them to the most inhospitable places. Practical development and production schemes may not always be high on list of concerns. But drillers and production engineers continually rise to the occasion when explorers present opportunities that are continually deeper and otherwise less pleasant. Most often, they even encourage explorers to push on to the forbidding.Once offshore operations extended beyond practical fixed platform limits, the production engineers borrowed concepts devised by the drilling engineers. They in turn had responded to the needs of the explorers with semi submersibles and drill ships as they moved out of shallow water. Thus floating production systems now provide the viable options in deepwater.
FPS’s come in many sizes and shapes. Some provide more functions than others. In every case, they differ from fixed systems by what holds them up – the buoyancy of displayed water, not steel understructure.
Floating systems have four common elements:
Hull: The steel enclosure that provides water displacement. Floating system hulls come in ship shapes, pontoons and caissons, or a large tubular structure called a spar.
Topsides: the deck or decks have all the production equipment used to treat the incoming well streams plus and compressors needed to transfer the oil and gas to their next destinations. Some drilling and work over equipment for maintaining wells. Since almost all deepwater sites are somewhat remote, their topsides include living accommodations for crew. In the most cases, export lines connect at the deck also.
Mooring: the connection to the seabed that keeps the floating system in place. Some combine steel wire or synthetic rope with chain, some use steel tendons. In some cases, they make a huge footprint on the seabed floor.
Risers: steel tubes that rise from the sea floor to the hull. A riser transports the well production from the sea floor up to the deck. The line that moves oil and gas in the other direction, from the deck down to pipeline on the sea floor, uses the oxymoron export risers.
6.3 Tension Leg Platforms (TLP)
The semi submersible used for years only for drilling, begat TLPs. By similar design, the buoyancy of a TLP comes from combustion of pontoons and columns. Vertical tendons from each corner of the platform to the sea floor foundation piling hold the TLP down in the water. Vertical risers connected to the sub sea wellheads directly below the TLP bring oil and gas to dry trees on the deck.
33
The vertical tendons are steel tubes, typically with 24- to 32- in. diameters with wall thickness of 1-2 in. With these tendons under constant tension, there is very little vertical movement at the deck, even in heavy weather. However during a design storm, the worst wind and sea conditions the designers can imagine, the TLP deck moves laterally as much as 8% of the water depth – within a radius of 240 ft in 3000ft of water. Drill pipe can accommodate the lateral movement that comes from moderate winds or ocean current changes. In heavy seas that push the TLP towards its limit, no drilling takes place anyway.
6.4 Monocolumn TLP
In shallower water or for smaller deposits in deepwater, and where no more drilling is planned, some companies use a smaller variation of the TLP called a mini-TLP, a monocolumn TLP, or sometimes a Sea star. The names monocolumn and sea star (a proprietary label) come from the underwater configuration of the floatation tanks, a large central cylinder with three star-like arms extending from the bottom. The cylinder measures about 60 ft in diameter and 130 ft in height. The arms reach out another 18 ft.
As with other TLPs, tendons secure the substructure to the sea floor, in this case two from each arm. The mooring system, risers, and topsides are similar to any other TLP, except for the modest sizes. The absence of drilling equipment on board helps lower the weight of the topsides all allows this scaled- down version.
6.5 Floating Platform, Storage and Offloading
From 400 yards away, most FPSOs are indistinguishable from oil tankers. In fact, while many FPSOs are built from scratch, the rest are oil tankers converted to receive, process, and store production from sub sea wells. FPSOs do not provide a platform for drilling wells or maintaining them. They do not store natural gas, but if gas comes along with the oil, facilities onboard an FPSO separate it. If there are substantial volumes, they are sent back down a riser for reinjection in the producing reservoir or some other nearby home.
Shell installed the first FPSO, a tanker conversion, in 1977 to produce from the small Castellon field in the Mediterranean Sea. Since then, the industry has found scores of remote or hostile environments that call for the FPSO design:
- at sea where no pipeline infrastructure exists- Where weather is no friend, such as offshore Newfoundland or the
northern part of the North Sea.- Close to shore locations that have inadequate infrastructure, market
conditions, or local conditions that may occasionally not encourage intimate personal contact, such as some parts of West Africa.
34
As an FPSO sits on station, wind and sea changes can make the hull want to weathervane, turn into to the wind like ducks on a pond on a breezy day. As it does, the risers connected to the wellheads, plus the electrical and hydraulic conducts, could twist into a Gordian knot. Two approaches deal with this problem, the cheaper way and the better way.
In areas of consistent mild weather, the FPSO moors, fore and aft, into the predominant wind. On occasions, the vessel experiences quartering or broadside waves, sometimes causing the crew to shut down operations.
In harsher environments, the more expensive FPSOs have a mooring system that can accommodate weathervaning. Mooring lines attach to a revolving turret fitted to the hull of the FPSO. As the wind shifts and the wave action follows, the FPSO turns into them.The turret might be built into the hull or cantilevered off the bow or stern. Either way, the turret remains at a permanent compass setting as the FPSO rotates about it.
The turret also serves as the connecting point between the sub sea systems and the topsides production equipment. Everything between the seabed and the FPSO is attached to the turret- production, risers, export risers, gas reinjection risers, hydraulic, pneumatic, chemical, and electrical lines to the sub sea wells, as well as the mooring lines.
Turrets contain a swirvel stack, a series of fluid flow and electronic continuity paths that connect the seaside lines with the topsides. As the FPSO swings around the turret, the swivels redirect fluid flows to new paths, inbound or outbound. Other swivels in the stack handle pneumatics, hydraulics, and electrical signals to and from the subsea systems.
In some designs, FPSO can disengage from the seabed to deal with inordinately rough seas, or other circumstances that might worry the ship’s captain, like an approaching iceberg. A spider buoy, the disconnect able segment of the turret with the mooring, the riser, the other connections to the subsea apparatus, drops and submerges to a pre-designated depth as the vessel exists the scene.
The full turret aboard the Petro Canada’s FPSO Terra Nova weighs more than 4400 tons and is 230 ft high. The turret assembly includes a spider buoy, 65 ft in diameter and 1400 tons, with connections for 9 mooring lines and 19 risers. On disconnect, which takes only 15 minutes, the mooring lines, risers and conduits remain tethered to the spider buoy, until the FPSO returns and fishes it out of the water, reconnects, purges the lines, and restarts operations.
After the oil moves from the reservoir to the FPSO via the turret, it goes through the processing equipment and then to the storage compartments. The 14 storage tanks aboard the Terra Nova range from 50,000 to 78,000 barrels each, with total vessel capacity of 960,000 barrels. The largest measures 88 by 56 85 ft high. Like all new oil tanker construction, the Terra Nova has a double hull. The oil storage sits in the inner hull, separated by air space from the outer hull. That reduces the risk of an oil spill should an accident result in piercing the outer hull.
35
Shuttle tankers periodically must relieve the FPSO of its prowling cargo. Some FPSOs can store up to two million barrels on board, but that still calls for a shuttle tanker visit every week or so. Mating an FPSO to the shuttle tanker crude oil calls for one of several positions.
- The shuttle tanker can connect to the aft of the FPSO via a mooring hawser and offloading hose. The hawser, a few hundred feet of ordinary marine rope, ties the shuttle tanker to the stern of the FPSO, and the two vessels weathervane together about the turret.
- The shuttle tanker can moor at a buoy a few hundred yards off the FPSO. Flexible lines connect the FPSO through its turret to the shuttle buoy and then to the shuttle tanker.
- Some shuttle tankers have dynamic positioning, allowing them to sidle up to the FPSO and use their thrusters on the fore, aft, and sides to stay safely on station, eliminating the need for an elaborate buoy system. The shuttle tanker drags flexible loading lines from the FPSO for the transfer.
Oil then flows down a 20-in. offloading hose at about 50,000 barrels per hour, giving a turn around schedule for the shuttle tanker of about one day.
6.6 Floating Drilling Production Storage and Offloading (FDPSO)
Inevitably, the attributes of a FPSO plus a drillship or a semi submersible come together in the form of floating drilling production storage and offloading (FDPSO) to do it all in the deepwater. The crucial technologies for the union, still in the nascent stage, are motion and weathervane compensation systems for the drilling rig.
6.7 Floating, Storage Offloading (FSO)
This specialty vessel stores crude from a production platform, fixed or floating, where no viable alternative for pumping oil via pipeline exist. FSOs almost had a former life as an oil tanker and generally have little or no treating facilities onboard. As with the FPSO, shuttle tankers visit periodically to haul the produced oil to market.
6.8 Floating Production Systems (FPS)
In theory, an FPS can have a ship shape or look like a TLP, with pontoons and columns providing buoyancy. Almost all are the TLP type design. Either way, the FPS stays moored on station to receive and process oil and gas from sub sea wet trees, often from several fields. After processing, the oil and gas can move ashore via export risers, or the gas can go into reinjection and the oil to an FSO.
36
At a typical operation, the Shell-BP Na kika project in the Gulf of Mexico, the FPS is designed to handle six oil and gas fields, some several miles away. Production arrives at the FPS from sub sea completions through flexible and catenary risers and goes through treating and processing before it leaves via export risers towards shore. The FPS provides a home for the subsea well controls that are connected via electrical and hydraulic umbilicals.
Petrobras led the industry up the FPS learning curve in the 1990s. They developed most of their deepwater fields with subsea wellheads, using FPS’s as nodes as a gathering system, and subsequently pumping oil and gas onshore or the oil to a nearby FSO.
6.9 SPARS
Even though the name spar comes from the nautical term for booms, masts and other poles on a sailboat, spars exhibit the most graceless profile of the floating systems. An elongated cylindrical structure, up to 700 ft in length and 80 to 150 ft diameter, the spar floats like an iceberg 0 it has enough freeboard to allow a dry deck on top. The mooring system uses steel wire and adds no weight to the spar, eliminating having to build an even bigger cylinder, because of its large underwater profile, the huge mass provides a stable platform with a very little vertical underwater profile, and the huger mass provides a stable platform with very little motion. To ensure that the center of gravity remains well below the center of buoyancy, the bottom of the spar usually has ballast of some heavier- than – water material like magnetite iron ore.
Because of large underwater profile, spars are vulnerable not only to currents but also to the vortex eddies that can cause vibrations. The characteristic strakes, shed eddies from these ocean currents, although the strakes add even more profile that calls for additional mooring capacity.
Drilling rigs operate from the deck through the center of the cylinder. Wells connect to dry trees on the platform by risers, also coming through this core. Risers from subsea systems and export risers also pass through the center.
Spars have evolved through several generations of design. The original concept had a single 600 ft steel cylinder below the surface.
Not long after that, the truss spar arrived with three sections: a shortened “tin can” section; below that, a truss frame; and below that, a keel or ballast section filled with magnetite. The truss section has several large, horizontal, flat plates that provides the buoyancy for the structure and contains variable ballast compartments and sometimes tanks for methanol, antifreeze used to keep gas lines from plugging.
37
The third generation, the cell spar, is a scaled down version of the large truss spar and is suitable for smaller, economically challenged fields. The design takes advantage of the economies of mass production. It uses more easily fabricated pressure vessels, what refineries and gas plants call bullets that are used to handle volatile hydrocarbons. Each vessel is 60 to 70 ft in diameter and 400 to 500 ft long. A cell, a bundle of tubes that looks like six giant hot dogs clustered around a seventh, makes up the flotation section extending below the decks. Structural steel holds the package together, extends down to the ballast section, and can include heave plates.
Spars have also served solely as oil storage vessel, which of course made them FSOs. The most notorious, the Brent spar, had a useful life until the Brent platform in the North Sea gained full access to an oil export system. The Brent spar disposal saga beginning in 1995 became an epoch lesson in business/societal relations. The spar owners plan to sink it in the deep Atlantic was aborted when Greenpeace landed a boarding party of squatters. Ensuing international protests, which included firebombing gas stations in Germany, led to postponed disposal, lengthy negotiations, and shore side dismantling years later.
38
39
7. COMMERCIAL ASPECTS OF DEEP WATER EXPLORATION
This is a very topical theme, many companies are interested in exploration in water depths in excess of 1000m and even occasionally 2000 m. Advances in subsea technologies has made it feasible to produce hydro carbon discovered at such depths at a competitive cost.At more familiar water depths up to 300-400 meters technological progress has led to significant reduction in costs. The cost of reducing a barrel of oil (exploration, development and exploitation) at such depths had fallen from $13-$15 in the 1980s to $5-7 in 2000 and grew again over $13 in 2007.Extrapolating these results suggests that the development of off shore resources in deeper water should be economically feasible. There are many proven viability at modern depths which could realistically be assumed to constitute the starting point for evaluating deep and ultra deep off shore development projects.The petroleum industry is currently focusing its efforts on very deep water (>1500 m), with the objective of getting to 3000 m.
7.1 Types of Costs:
Economic evaluation of deep water petroleum projects include, in addition to assumptions about the value of hydrocarbons 3 types of data:-
Production Profiles , constructed by the reservoirs engineers from analysis of the drainage mechanisms
Capital and operation costs evaluated by cost estimates and managed by the project manager and the field manager respectively.
Contractual and fiscal conditions , which can have a decisive role (they can prevent an excellent project from ever seeing the light of day for example)
In the evaluation process these 3 types of data has to be analyzed independently of one another, but also subjected to an overall optimization cycle such as to maximize value added. This optimization process almost always leads to a choice being made between alternative development options in which the minimization of capital and operating costs is a fundamental and ongoing requirement. The company’s profitability and competitiveness depend on this.
40
Based on the above evaluation the costs of deep water exploration can be broadly categorized into:
Exploration Costs Development Costs
7.1.1 Exploration costs:
Exploration costs are generally less important than other items of expenditure .On the other hand they incur before the discovery of hydrocarbons and will therefore have a direct impact on the accounts of the company, the recovery of these costs being linked to the likelihood of success of the exploration program in general between 10 and 30 %. These costs could further be subdivided into:
7.1.1.1 Geophysics or the data acquisition cost:
Petroleum geophysics is dominated by seismic methods both in terms of volume of activity and the investment cost. We will therefore, confine ourselves in the present section to considering the costs of seismic methods. Since, only marginal amounts are invested in other methods (radar, potential methods etc). The costs are usually expressed in dollar per km square. 3-D off shore seismic exploration, costs more than $5000 per km sq in zones with difficult access. On the flat, marine seismic is the least by virtue of a technique known as 3-D multi flute, which permits the acquisition of strips 500 m wide in a single pass at a speed of about 10 km per hr. It is impossible to obtain this density of data economically, and the acquisition grid needs to be reduced.fig. It can be seen that in offshore there is not a great difference in cost between a 2-D seismic 500*500 grid and a 3_D program, so that the later is being used increasingly and frequently. A striking feature is the low cost of seismic for offshore exploration (deep offshore) compared with drilling exploration wells; the exploration costs for an area of 100 km sq would be around $0.5 m for 3-D seismic, whereas the cost of drilling an offshore exploration well can be over than $ 50 m. The cost of data acquisition offshore, are dominated by the cost of the equipment needed (modern 3-D seismic vessel costs around $ 100 m) .Service providers fleets are tending to move towards larger vessels capable of sophisticated, automated, maneuvering.
41

7.1.1.2 Data processing costs:
In the same way as data acquisition, the processing of the data is also sub contracted to sub companies, apart from the number of specialize process and studies which are still carried out by the large oil companies. The data processing costs are lower than the data acquisition cost being of the order of $550 per km sq for 3D seismic and $100 per km sq for 2D. These are the cost of producing the standard data (the 3D program for deep off shore will involve several terabytes of data). When data requires certain advanced and detailed processes, which are time consuming and labor intensive, the processing costs may be considerably higher. This applies, for example, to a depth migration before addition of 3D which allows 3 dimensional sub surface images as close as possible to reality to series from images over time created from these seismic records. This process can cost several thousand dollars per km sq.
7.1.1.3 Exploration Drilling: Most of the cost of an exploration program is accounted for their drilling. An offshore well typically cost between 10 $ and 50 $ m and takes 30-100 days to drill. The corresponding onshore costs are $2 and $5 m, the duration being of the same order. When the conditions are particularly difficult the cost may be much higher occasionally exceeding $ 100 m. The duration of drilling is difficult to predict due to geological uncertainties regarding the drill ability of the rock, in the interstitial pressure of the formation fluids, the depths etc. Difficulties and unanticipated setbacks such as mud log jamming of the drill bit, etc. Can cause delays of several days.Some 70-75% of the drilling costs are proportional to the duration of the drilling. ; Equipment higher cost paid to petroleum service companies and cost to supervising the work (operating company personnel or prime contractor). Only 25-30 % of the drilling cost can therefore be estimated with a reasonable degree of precision. This are the costs which depend on the depth drilled essentially the casing, the cost of the well head, etc. For this reason it is difficult exercise for the technicians to set a budget for an exploration well.
42
The hire of drilling alone can represent between 20 %( the above ex) and 30 % of the total drilling costs. The daily costs depend on its power, which in turn depends on the depth of its well and the water depth involved. It will also depend on the current availability of the drilling rigs in the market that is the relationship between the supply of the drilling rigs companies and the demand of the exploration companies.
43
Above are the rig cost structure and daily rates of different rigs used in deep water drilling at different depths.
7.1.2 Development costs
The development cost includes the costs of drilling the development wells, the cost of the production installations, and any systems required for the transport of the affluent. In fact the cost of constructing the chosen system has to be made at this stage.
7.1.2.1 Development Drilling:
Unlike exploration drilling, development drilling requires repeated operations, so that the lead times involved are easier to plan and the costs are often easier to control. The time required for actual drilling has to be increased to allow for the time needed for well completion which varies according to the complexity of the completion.In any particular environment the development wells are drilled more rapidly than the exploration wells. When a series of development wells need to be drilled in the same field, it is possible for the technological parameters to be optimized on the successive wells so that the drilling time.
44
The above fig illustrates the “leaning curve effect”. In a recent deep water development (at a water depth of 2700 m, with horizontal drains of 1000m at the bottom), the time taken to drill a development well was reduced from 26 from the first to 13 for the 7 th well. The fig above typically shows a breakdown of deep water costs.
7.1.2.2 Production and transport installations:
In an offshore deep water development the wellhead may be either on the platform or under the water. The production support which may be a fixed platform or floating vessel, houses the utilities needed for production (particularly power) and all the safety installations. For reasons of weight, installations costs and maintenance, the offshore processing equipment is often limited to that which is necessary to ensure that the effluents can be transferred to onshore. These are transported by pipelines and sometimes in case of oil stored for loading onto tankers. The remaining processing needed to ensure that the product comply with the delivery specifications are carried out on arrival. Accommodation for the personnel, the control room and offices, and the amenities needed for life on board, are situated on the production platform itself or accommodation platform.
45
No. of Wells
No of days
7.2 Example of cost break down:
a) Costing methodology: a possible development programme can be evaluated on the basis of two major categories of parameters, those which describe the reservoir itself and those which describe its geographical locations.
b) Parameters associated with the reservoir are usually obtained from a “speculative” seismic exploration survey and by interpreting local geological phenomena. These parameters allow the size of the target object to be estimated that is the reserve, reservoir productivity and the type of fluids.
The second category of parameter includes “physical” data (distance from the coast, water depth, depth of reservoir under the seabed) and data which describe the environment. These latter data relate to the oceanographic and meteorological conditions, the existing petroleum infrastructure and the extent to which it would be available, the market prospects for the production, local regulations, tax regime, etc. The values of these parameters will point the evaluator towards the most appropriate development plan. Below is the fig for cost break down of a deep water project in North Sea at a depth of 300 m.
46
7.3 Example of estimation of costs for a prospect in the gulf of guinea at the depth of 1500m:-
This prospect is situated in 1500 m of water in the Gulf of Guinea. The hydro carbon deposits of centered morphology, extended over an area of 90 km sq. They consist of multilayer reservoirs lying at depth of between 900 and 1700 m below the sea bed. The reserves are estimated to be 750 Mbbl of oil, and the field would have a life of about 20-25 years. The production will plateau at 200000 bbl/dBecause of the lack of a local petroleum infrastructure and the remoteness of the markets, the development is based on a FPSO acting as a gathering station for a subsea production network The FPSO, tethered in a fixed position by 16 mooring lines, will comprise a 300 m long and 60 m wide with the capacity to store 2 Mbbl of oil. The treatment plant and utilities will be situated in one or more independents module on the upper deck. Their net weight is estimated at 20000 Tithe production wells will be connected to production manifold which are joined to the gathering lines. Each production line is made up of two pipes thermally insulated by means of a layer of foam in a metallic case. The water injection wells are connected to the FPSO by three independent lines. The production lines, water and gas injection lines are connected to the FPSO by flexible, thermally insulated connections. A control and command umbilical is attached to each production line and water and gas injection line from the well and the manifolds. The oil is pumped into tankers and the loading buoy anchored at a distance of 2 km from the FPSO. The associated gas is re-injected into the top of reservoir. In order to determine the sensitivity of this development scheme to the size of the recoverable reserves per well, two cases are considered, in which there are 48 and 63 production and water and gas injection wells respectively.
47
The capital costs were estimated by reference to projects similar to the one in question in the gulf of guinea and Brazil.
Particulars Case 1, 48 wells Case -2,63 wellsProduction vessel 1700 1700Subsea equipment and control system
1000 1300
Gathering lines 1700 1900Company costs 600 700Provisions 500 600Drilling wells 2000 2600Total capital cost 7500 8800Capital cost($/boe) 9.9 11.7Water depth 1500 m, reserves 750 development costs in $ million
7.4 some quick facts:
The cost of developing a single deep water field can exceed $1 billion, with costs likely to increase as operations are conducted in even deeper waters. Compare this to the cost of a typical shallow Gulf development (100 feet of water, 10,000 foot wells) at $100 million, and we can appreciate the cost of addressing the challenges of deep water.
Deepwater components:
After the drilling and completion of subsea wells, an activity that is becoming
increasingly expensive in areas such as the Gulf of Mexico, it is floating platforms
that form the main component of deepwater development expenditure.
Over the next 5 years some $28 billion is likely to be spent on deepwater floating
production systems, $40 billion on drilling and completing subsea wells, and $14
billion on flow lines and control lines, while subsea hardware and surface
completed wells could account for a further $10 billion.
The deepwater shopping list for the forecast period includes more than 1,300
subsea trees, 283 templates and manifolds, 71 platforms, and some 8,073 miles
(13,000 km) of pipelines. Annual expenditure in the deepwater business is
expected to reach $20 billion by 2010, with the overall spend for the 2006 to 2010
period totaling $94 billion.
48
Drilling expenditures
Over the last 5 years it is estimated that $160 billion was spent on shallow water
drilling, representing 83% of all drilling expenditure. Meanwhile, $33 billion was
spent on deepwater drilling. Over the next 5 years, it is forecast that $197 billion
will be spent on shallow water drilling, while $65 billion will be spent on
deepwater drilling.
Within the deepwater sector 37% of expenditure is directed toward engineering
services, a quarter is earmarked for support and 5% goes towards geosciences.
But it is surprising to many that rigs only comprise 33% of total well costs, even
in deep waters.
Nevertheless, the increase in deep water relative to shallow water is substantial.
While shallow waters are seeing increased expenditure almost solely because of
rising prices and rising unit well costs, especially after 2007, deepwater
expenditures reflect a real increase in activity. This is of global importance to the
rig contractors and associated drilling services.
From a mere 2% of global expenditure in 1991, almost all located in Brazil, the
deepwater share had increased to 19% by 2001 and is forecast to reach nearly
30% by 2010.
The relative shallow water decline is driven by a global shortage of opportunities.
There is no reason why the international oil industry, beyond the limited
ambitions of national oil companies, would put capital into expensive,
technologically demanding deep water projects if cheaper, conventional shallow
water ones could offer the same profitability.
The North America region is expected to account for some 25% of deepwater development capex over the 2006-2010 periods.
The Golden Triangle of deepwater, namely the Africa, Gulf of Mexico and Brazilian areas, will still account for 85% of global deepwater expenditure over the forecast period.
Malaysia and India all have development prospects on screen for the 2006 to 2010 period, and the region should account for 10% of deepwater capex during this time.
49
BIBLIOGRAPHY• Deepwater Petroleum Exploration & Production by William L. Leffler, Richard
Pattrozzi and Gordon Sterling• An Introduction to Offshore Engineering• Research papers by G. Shanmugam • Development and Exploration Of Oil And Gas Fields by I. Muravyov, R.
Anderiasov, SH. Gimatudinov, G. Govorova, V. Polozkov• Oil And Gas Exploration And Production by Dennis Babu Siaux• Oil and Gas journal• www.rigzone.com • www.deepwater.com • www.shell.com • www.shevron.com
50
51