Embed Size (px)
Citation preview
Journal of Voice Vol. 5, No. 3, pp. 203-216 © 1991 Raven Press, Ltd., New York
Objective Acoustic Voice-Quality Parameters in the Computer Phonetogram
J. Peter H. Pabon
Department of Otolaryngology, Free University Hospital, Amsterdam, the Netherlands
Summary: A phonetogram is a plot of the dynamic range of the voice as a function of fundamental frequency. Traditionally, the phonetogram only records the sound-pressure level (SPL) of the threshold of phonation and the upper limit in SPL the voice can reach with sustained phonation as a function of the fundamental frequency (Fo). In this study, the phonetogram is extended by including acoustic voice-quality parameters. Three additional parameters are tested: jitter, shimmer, and crest factor. For each individual voice, the variation in the three parameters is evaluated over the entire phonetogram area. By averaging individual phonetograms, standard or norm phonetograms are obtained revealing general patterns in voice-quality variation. These pat- terns reflect the complex relations between F o, SPL, and the acoustic voice- quality parameters just mentioned. Jitter and shimmer distributions over the phonetogram show that large variations in perturbation values can be expected when production conditions are altered. Highest perturbation values are found for the low Fo and low SPL phonations. For all voices, a gradual decrease of the crest factor is found with increasing Fo, reflecting the degrading of spectral complexity with F o. The crest-factor parameter can also be used to mark those areas in the phonetogram where the fundamental dominates the waveform and where flow control is the main SPL regulating mechanism in voice production. The strong quality variations within the phonetogram stress the need for ac- curate control of F o and SPL in objective voice-quality measurement. Key Words: Phonetogram--Phonetograph--Voice-quality recording--Ji t ter-- Shimmer--Crest factor--Spectral slope--Register.
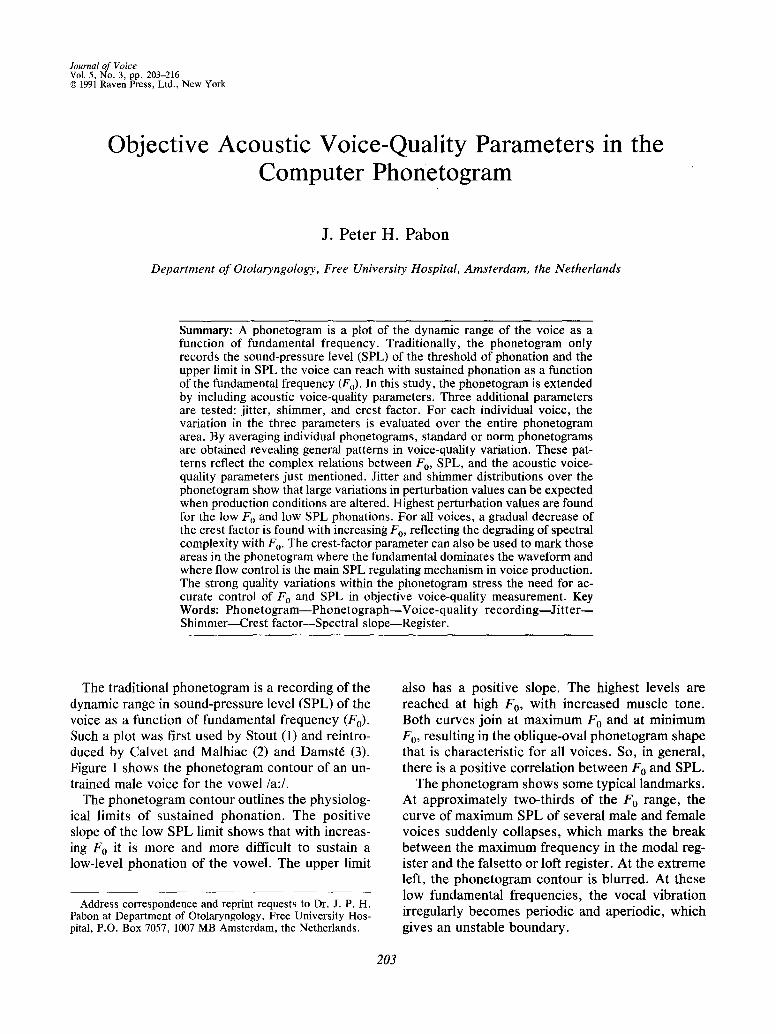
The traditional phonetogram is a recording of the dynamic range in sound-pressure level (SPL) of the voice as a function of fundamental f requency (F0). Such a plot was first used by Stout (1) and reintro- duced by Calvet and Malhiac (2) and Damst6 (3). Figure 1 shows the phonetogram contour of an un- trained male voice for the vowel /a : / .
The phonetogram contour outlines the physiolog- ical limits of sustained phonat ion. The posi t ive slope of the low SPL limit shows that with increas- ing F0 it is more and more difficult to sustain a low-level phonation of the vowel. The upper limit
Address correspondence and reprint requests to Dr. J. P. H. Pabon at Department of Otolaryngology, Free University Hos- pital, P.O. Box 7057, 1007 MB Amsterdam, the Netherlands.
also has a positive slope. The highest levels are reached at high F 0, with increased muscle tone. Both curves join at maximum F 0 and at minimum F0, resulting in the oblique-oval phonetogram shape that is characteristic for all voices. So, in general, there is a positive correlation between F 0 and SPL.
The phonetogram shows some typical landmarks. At approximately two-thirds of the F 0 range, the curve of maximum SPL of several male and female voices suddenly collapses, which marks the break between the maximum frequency in the modal reg- ister and the falsetto or loft register. At the ext reme left, the phonetogram contour is blurred. At these low fundamental frequencies, the vocal vibration irregularly becomes periodic and aperiodic, which gives an unstable boundary.
203
204 J. P. H . P A B O N
40-
0 30
1 1 0 -
100- @ -~ 90-
80-
~ 70-
]60-
50.
25 50 x6o " ~bo . . . . 5 6 o . . . . . . . i 6 o 0 . . . . . . ~ Fundamental frequency in Hz
FIG. 1. Phonetogram contour of an untrained male voice. The plot shows the range of sound-pressure levels that can be covered as a function of funda- mental f requency using sustained phonation at a distance of 30 cm (12 in.) from the mouth. The piano keyboard on top gives, in European notation, the pitch in semitones (C1 at the left equals the American CI and the upper c 4 equals the American C7.)
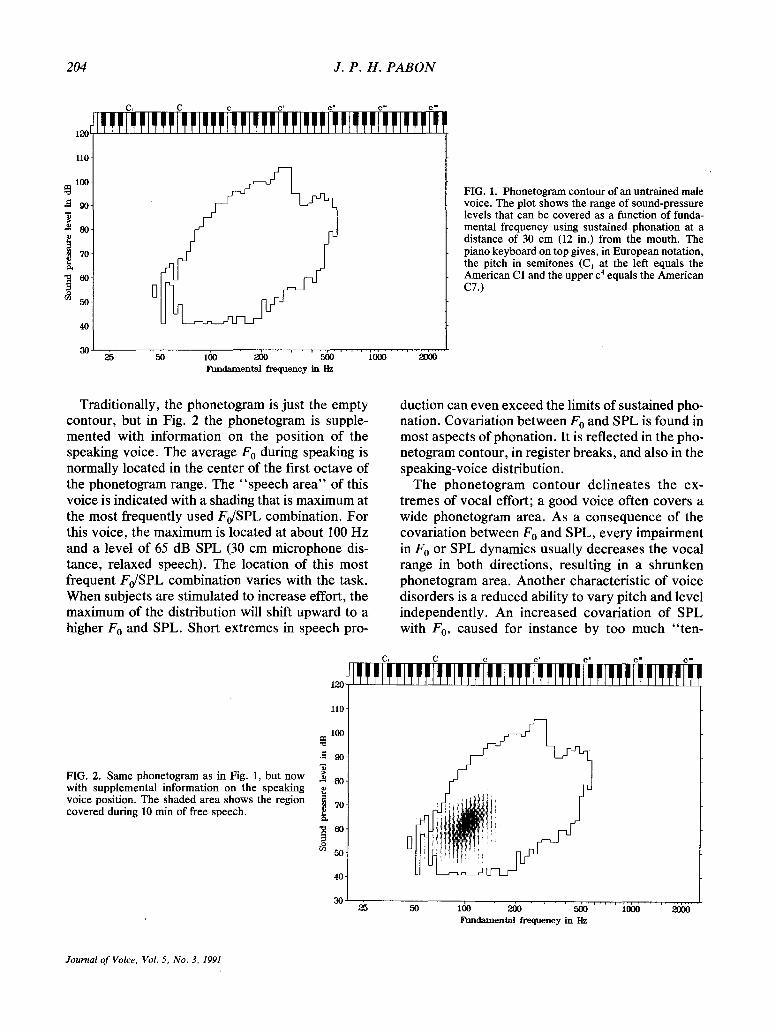
Traditionally, the phonetogram is just the empty contour, but in Fig. 2 the phonetogram is supple- mented with information on the position of the speaking voice. The average F 0 during speaking is normally located in the center of the first octave of the phonetogram range. The "speech area" of this voice is indicated with a shading that is maximum at the most frequently used Fo/SPL combination. For this voice, the maximum is located at about 100 Hz and a level of 65 dB SPL (30 cm microphone dis- tance, relaxed speech). The location of this most frequent Fo/SPL combination varies with the task. When subjects are stimulated to increase effort, the maximum of the distribution will shift upward to a higher Fo and SPL. Short extremes in speech pro-
FIG. 2. Same phonetogram as in Fig. 1, but now with supplemental information on the speaking voice position. The shaded area shows the region covered during 10 min of free speech.
~a) r
110
150- @ • ~ 90-
80-
70- e~
60-
50-
40
30
duction can even exceed the limits of sustained pho- nation. Covariation between F 0 and SPL is found in most aspects of phonation. It is reflected in the pho- netogram contour, in register breaks, and also in the speaking-voice distribution.
The phonetogram contour delineates the ex- tremes of vocal effort; a good voice often covers a wide phonetogram area. As a consequence of the covariation between Fo and SPL, every impairment in Fo or SPL dynamics usually decreases the vocal range in both directions, resulting in a shrunken phonetogram area. Another characteristic of voice disorders is a reduced ability to vary pitch and level independently. An increased covariation of SPL with F o, caused for instance by too much "ten-
25 50 100 " ~ 0 . . . . ~ . . . . . . . iO00 . . . . . . ~()00 Fundamental frequency in Hz
Journal of Voice, Vol. 5, No. 3, 1991
COMPUTER PHONETOGRAM 205
sion," can flatten the oval while preserving the total F 0 and SPL range, thus making the phonetogram more slender.
Figures 1 and 2 show a phonetogram in a tradi- tional display: only the contour or profile is re- corded. This contour was determined automatically using a computerized recording technique and plot- ted with a resolution of 12 tones per octave. Pho- netogram recording is widely used in many voice clinics, research institutes, and music schools, es- pecially in Europe. By research and routine, the method is thoroughly standardized and improved (4-6). Usually, the phonetogram is recorded manu- ally by presenting a tone of known frequency and asking the subject to produce, as softly and loudly as possible, the vowel /a : /wi th the same pitch. By measuring maximum and minimum levels for a se- ries of frequencies, the total voice range is found. In manual recording, a lower resolution of the contour down to about 3 tones per octave is used. The com- puterized method has many advantages; one of them is that objective voice-quality parameters also can be included in the phonetogram.
Voice quality in the phonetogram In the present study, we have studied the varia-
tion of voice quality over the phonetogram; the tra- ditional study of phonation limits was of secondary interest.
As this research was especially directed towards clinical application, we focused on parameters that reveal pathological voice quality or incorrect voice production. In addition to F0 and SPL, two pertur- bation parameters (jitter and shimmer) and one im- pulse parameters (the waveform-crest factor) were studied. To scan the complete vocal area, the data acquisition was performed with an automatic pho- netograph with on-line measuring and visual feed- back of F0 and SPL (5).
METHODS
The phonetogram is recorded in a silent booth with a microphone and a video screen for visual feedback. The subject, standing in front of the video screen, is instructed to sustain the vowel/a: /while keeping a fixed distance to the microphone. During phonation, F0 and SPL are automatically measured and used to control the cursor position on the video screen. All voice maneuvers are translated to cur- sor movements that show up as traces on the dis- played phonetogram. The covered area remains vis-
ible on the screen. By systematically changing Fo and SPL from maximum to minimum, the total pho- netogram area is explored. The procedure is very easy and needs no training. The visual feedback particularly helps those subjects who have difficul- ties in controlling their voice. Color is used to dis- play the voice-quality variation as a third dimension in the phonetogram. Usually, a green-yellow-red quality-to-color translation is used to indicate for each quality parameter the transition from normal to the extreme.
Although the procedure is easy, the hardware is not. A special pitch/level/voice-quali ty meter, called a phonetograph, is needed to make the re- cordings. It has to cope with all combinations of loudness, pitch, and quality that the voice can pro- duce. A phonetograph, based on a TMS 32010 audio signal processor (ASP), was specially designed for this study. All processing from the microphone sig- nal to the parameter calculation is done in real time by the ASP. A second computer, an IBM AT- compatible personal computer (PC), is used to store and display the results. The phonetograph (in fact, the ASP program) processes the signal (sampled at a 25-kHz rate) in frames with a fixed length. Per frame, the acoustic parameters are calculated and sent to the PC. A 50-ms frame length, giving 20 new parameter sets per second, has proved to give the best results (5). To follow the fast articulatory changes in continuous discourse, a smaller frame size, giving a faster parameter update, is preferable. It is not recommended to use small integration times for sustained vowels as this destabilizes the integrity of the calculated parameters.
Parameter extraction by the ASP First, the root-mean-square (rms) level per frame
is calculated. Comparison with the level of a prere- corded calibration signal gives the SPL in dB. Next, the fundamental frequency F 0 is derived by averag- ing the durations of all periods in the frame. Al- though the processing goes frame by frame, the pitch follower of the phonetograph tracks individual pitch periods, thereby hopping over the frame boundaries. The period detector uses a level- dependent weighting of peak amplitude and peak rise time to locate the most powerful peak from which peak amplitude and period duration are cal- culated. The result of the tracking process is a se- ries of successive durations and peak levels. Trends and slow modulations in both series are reduced by using five-point averagers. The differences in these
Journal of Voice, Vol. 5, No. 3, 1991
206 J. P. H. P A B O N
series from period to period are used to calculate jitter and shimmer. Absolute duration differences are averaged to yield a mean jitter value and abso- lute peak-level differences are averaged to give a mean shimmer value. The mean jitter is divided by the period duration, giving a jitter parameter (QP1) independent of Fo. In analogy, the mean shimmer is divided by the average peak level, giving a level- independent shimmer parameter (QP2). The num- ber of periods used in the jitter and shimmer calcu- lation is variable and depends on the number of periods completed per frame. With low F 0, preced- ing periods already outside the frame are allowed to contribute to the perturbation value as there are at least five periods included in the calculation. The average peak level is also used to calculate the third quality parameter called "crest factor" (QP3), de- fined as the difference in dB between the peak level and rms level.
Parameter processing by the PC The phonetogram forms a two-dimensional graph
in which voice-quality parameters are mapped. In the implementation, each voice-quality parameter is stored in a two-dimensional array parallel to the frame of the phonetogram. The array size depends on the quantization of fundamental frequency and level. A relative dense grid of one semitone by one decibel is used.
For each 50-ms frame, a new set of parameters (F 0, SPL, QP1, QP2, and QP3) becomes available from the ASP. F o and SPL determine the plot posi- tion for real-time feedback, as well as the array lo- cation to store the voice-quality parameters. Addi- tional to the three parameter layers, a fourth array is used to store the number of times a grid point is passed. This feature, called '°phonation density," has several applications: (a) recording o f the most densely covered area within the phonetogram, for instance when using speech (see Fig. 2); (b) as a weighting factor in the averaging of new data (dur- ing recording or within the process of averaging phonetograms to create a norm value); (c) to indi- cate the reliability of unexpected or extreme mea- surement results (for instance in contour detection); and (d) to calculate the total analysis time. So, in total, four layers of parameters (QP1, QP2, QP3, and density) are available. During recording, only one parameter at the time can be visualized.
When starting the recording, the range of quality variation is unknown. Proper display of this varia-
tion is only possible when the complete data set over the entire phonetogram is collected. After completion of the recording, a histogram of the total distribution is made for each parameter in the pho- netogram. The shape of this histogram informs us on the behavior of the quality parameter. For in- stance, sharp peaks in the distribution can indicate a strong preference for a particular quality value. Furthermore, a normal distribution indicates that statistical methods to test the correlation between parameters are allowed. The histogram itself may also be used as a tool to scale the quality-to-color translation or to demarcate specific phonetogram areas on the base of their quality values.
CREST FACTOR RATIONALE
Unlike the two perturbation parameters, i.e., jit- ter and shimmer (5), the crest factor is relatively unknown and needs some extra clarification. The crest factor measures the level difference between the period-peak level and the rms level in dB. For periodical signals with a clear periodical phase co- herence, like vocal signals, this parameter can be applied as a spectral-slope indicator defined in the time domain: the crest factor is 3 dB for a sinusoidal wave and increases with the number of strong har- monics in a cosine phase relation. Since the crest factor is mainly determined by those spectral com- ponents that are within a range of - 2 0 dB below the strongest partial, it is a rather coarse spectral slope measure.
In characterizing such a complex entity as spec- tral envelope decay in one "slope parameter," we should be aware that this does not necessarily imply that we also characterize a single physiological or perceptual phenomenon. In general, there are four major production factors that substantially affect the crest factor and spectral slope: (I) the maximum closure speed of the glottis, (II) damping of the vo- cal tract (bandwidth), (III) open time of the glottis, and (IV) Fo-F 1 distance.
(I) The maximum closure speed is highly respon- sible for the transient property of the source pulse and controls the excitation level of the tract. Since the maximum closure speed determines the maxi- mum differential flow variation, this factor also con- trois SPL. The steeper the flow variation, the more transient and peaked the excitation, the higher the crest factor and the flatter the spectral slope will be.
(II) What remains of level, width, and transient
Journal of Voice, Vol. 5, No. 3, 1991
COMPUTER PHONETOGRAM 207
character of the source pulse is highly determined by the damping/resonance properties of the vocal tract. Resonance means temporal conservation of acoustic energy and tempered release of this energy according to the damping. The glottal pulse often represents an asymmetric distribution of energy over the voice period. The vocal tract, in its tran- sient behavior, has the effect of smearing out this concentrated energy over the period. In general, this will equalize the difference between peak and mean level of the original source pulse. Thus, the more pulse-like the excitation, the more resonance will control the crest factor and spectral slope of the acoustic signal.
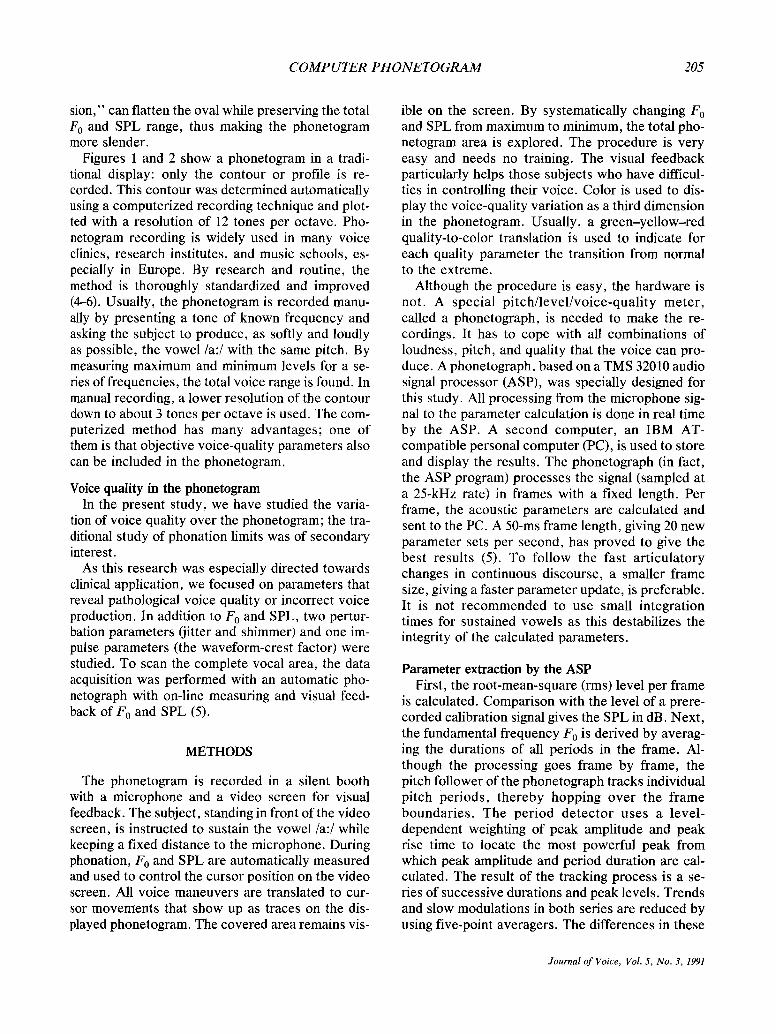
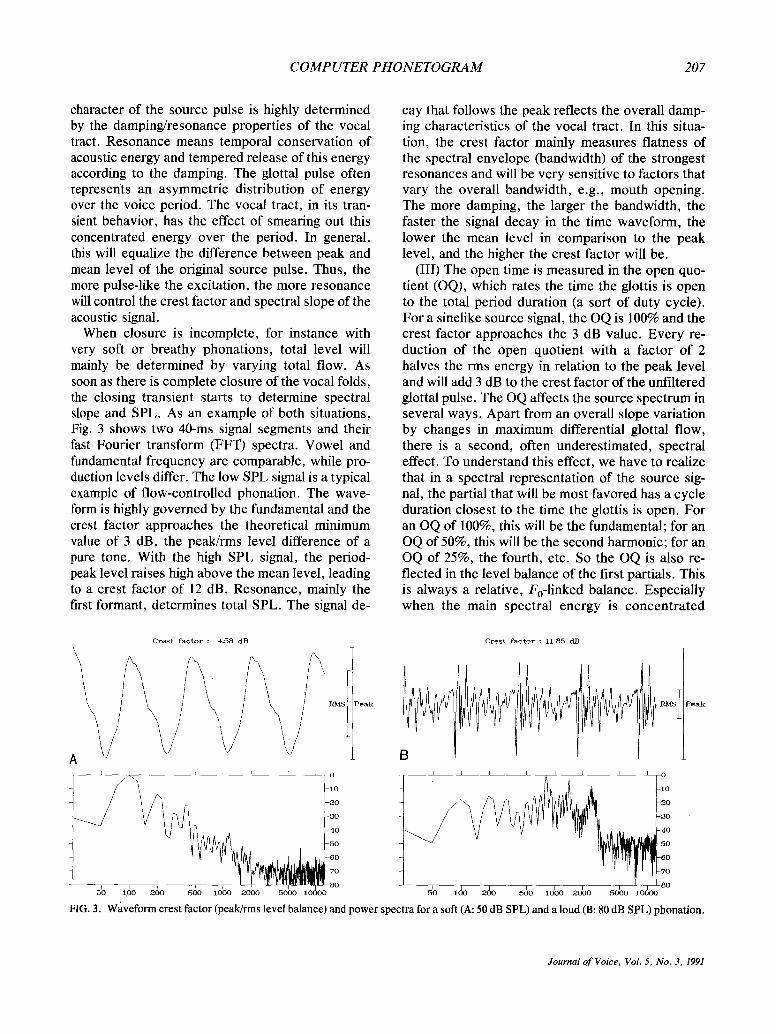
When closure is incomplete, for instance with very soft or breathy phonations, total level will mainly be determined by varying total flow. As soon as there is complete closure of the vocal folds, the closing transient starts to determine spectral slope and SPL. As an example of both situations, Fig. 3 shows two 40-ms signal segments and their fast Fourier transform (FFT) spectra. Vowel and fundamental frequency are comparable, while pro- duction levels differ. The low SPL signal is a typical example of flow-controlled phonation. The wave- form is highly governed by the fundamental and the crest factor approaches the theoretical minimum value of 3 dB, the peak/rms level difference of a pure tone. With the high SPL signal, the period- peak level raises high above the mean level, leading to a crest factor of 12 dB. Resonance, mainly the first formant, determines total SPL. The signal de-
cay that follows the peak reflects the overall damp- ing characteristics of the vocal tract. In this situa- tion, the crest factor mainly measures flatness of the spectral envelope (bandwidth) of the strongest resonances and will be very sensitive to factors that vary the overall bandwidth, e.g., mouth opening. The more damping, the larger the bandwidth, the faster the signal decay in the time waveform, the lower the mean level in comparison to the peak level, and the higher the crest factor will be.
(III) The open time is measured in the open quo- tient (OQ), which rates the time the glottis is open to the total period duration (a sort of duty cycle). For a sinelike source signal, the OQ is 100% and the crest factor approaches the 3 dB value. Every re- duction of the open quotient with a factor of 2 halves the rms energy in relation to the peak level and will add 3 dB to the crest factor of the unfiltered glottal pulse. The OQ affects the source spectrum in several ways. Apart from an overall slope variation by changes in maximum differential glottal flow, there is a second, often underestimated, spectral effect. To understand this effect, we have to realize that in a spectral representation of the source sig- nal, the partial that will be most favored has a cycle duration closest to the time the glottis is open. For an OQ of 100%, this will be the fundamental; for an OQ of 50%, this will be the second harmonic; for an OQ of 25%, the fourth, etc. So the OQ is also re- flected in the level balance of the first partials. This is always a relative, F0-1inked balance. Especially when the main spectral energy is concentrated
C r e s t f a c t o r : 4 , 5 8 d B
I I I _ P r J 0
- 2 0
~ 3 0
- 4 0
- 5 0
6 O
7 O
3 O
Peak
I I 5b 160 200 500 lOOO 2000 5obo 10000 5b 160 260 ~o 2obo 5obo lO60o . 1 0 0 0
C r e s t f a c t o r : 1 1 . 8 5 d B
I o
- 1 0
- 2 0
- ~ 0
- 4 0
5 0
- 6 0
- 7 0
8 0
~ e a k
FIG. 3. Waveform crest factor (peak/rms level balance) and power spectra for a soft (A: 50 dB SPL) and a loud (B: 80 dB SPL) phonation.
Journal of Voice, Vol. 5, No. 3, 1991
208 J. P. H. PABON
around the fundamental, the influence of OQ vari- ation on the crest factor can become significant. Under these conditions, decreasing of the open time by too much adduction or pressing of the larynx will heavily influence the crest factor.
(IV) When the frequency distance between F0 and F 1 is high (low F o, vowels/a:/and/~e:/), and the glottal excitation is impulselike (high SPL), the con- tribution of the low-partial region of the spectrum may be very small in comparison to the strong res- onance in the first formant. Under these circum- stances, when F o is more than 20 dB below F1, changes in OQ will barely affect the crest factor. Increasing F 0, or decreasing F1, will lead to more interaction between source (closure speed, open time) and vocal tract resonance (bandwidth) in the control of the crest factor and SPL. When F 1
matches F 0, a special situation arises. In that case, there will be a limit to the decay of the spectral envelope over the first partials, often generalized as the bandwidth of the first formant. In the time do- main, either the symmetry of the source pulse, or the damping, guarantees a bottom to the decay in signal level within the fundamental period. Thus, in other words, when the F o E 1 frequency distance gets small (vowels/i:/and/u:/), it is more difficult to sustain an asymmetric (peaked) energy distribution over the period. In general, this will invoke a lower crest factor for the more closed vowels.
When phonetogram contours are evaluated for different vowels, we will generally find the maxi- mum SPL limit in chest voice (low F0) to be lower with the vowels /u:/ and /i:/ in comparison to the vowels/a:/and/~e/. This finding could also be seen in the light of a limitation to crest the vocal period due to a reduced Fo-F1 frequency distance. Be- cause we restrict ourselves in this study to the vowel/a: / , the effect of the Fo-F 1 frequency dis- tance will represent a constant factor. However, we should be aware that vowel changes will vary both crest factor and SPL.
In conclusion, the extent to which each of the four individual factors affects the crest factor largely depends on F0 and SPL. This means that the crest factor reflects different production features within different areas in the phonetogram.
SUBJECTS
Over 150 phonetogram recordings were made: about one-third of pathological voices, one-third of normal voices, and one-third of trained voices and singers. All subjects were requested to fill com- pletely their phonetogram. In general, routine pho-
Journal of Voice, Vol. 5, No. 3, 1991
netogram recording takes 20 min. On average, one- half of the time the subject is actually phonating, and the rest of the time is needed for breathing and instruction. Since the aim of this report is to dem- onstrate some general properties of voice-quality parameters in the phonetogram and since a large portion of the recorded phonetograms are still being analyzed, we present here the group "trained fe- male voices," which forms the most complete sub- set in our data base.
RESULTS AND DISCUSSION
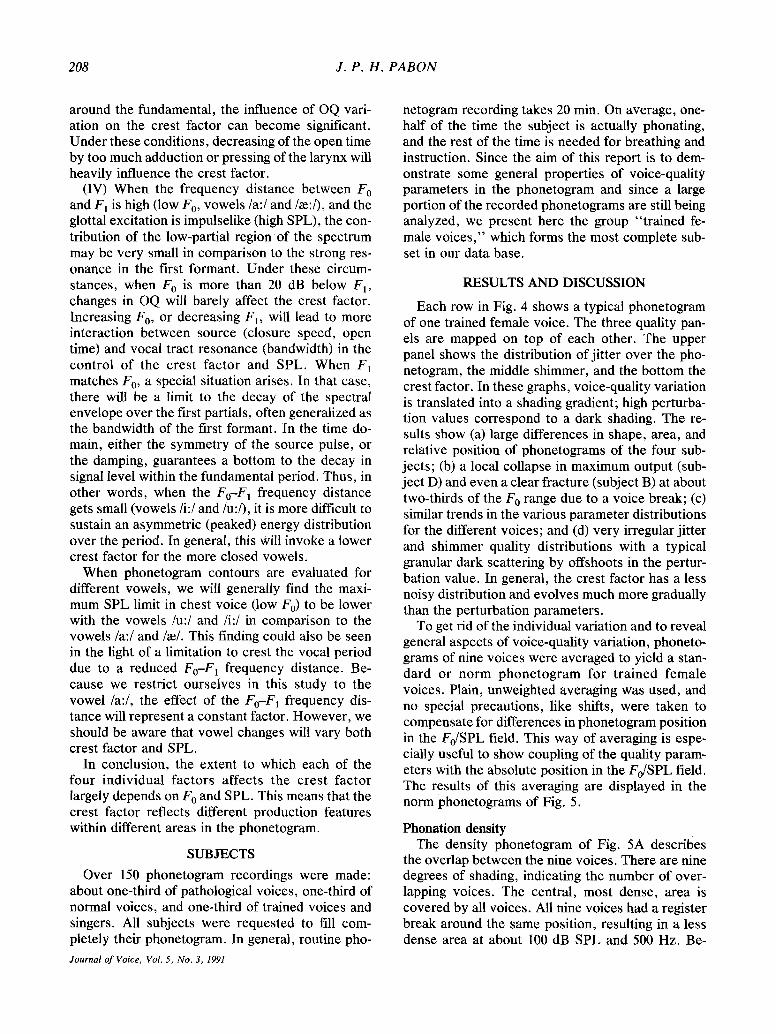
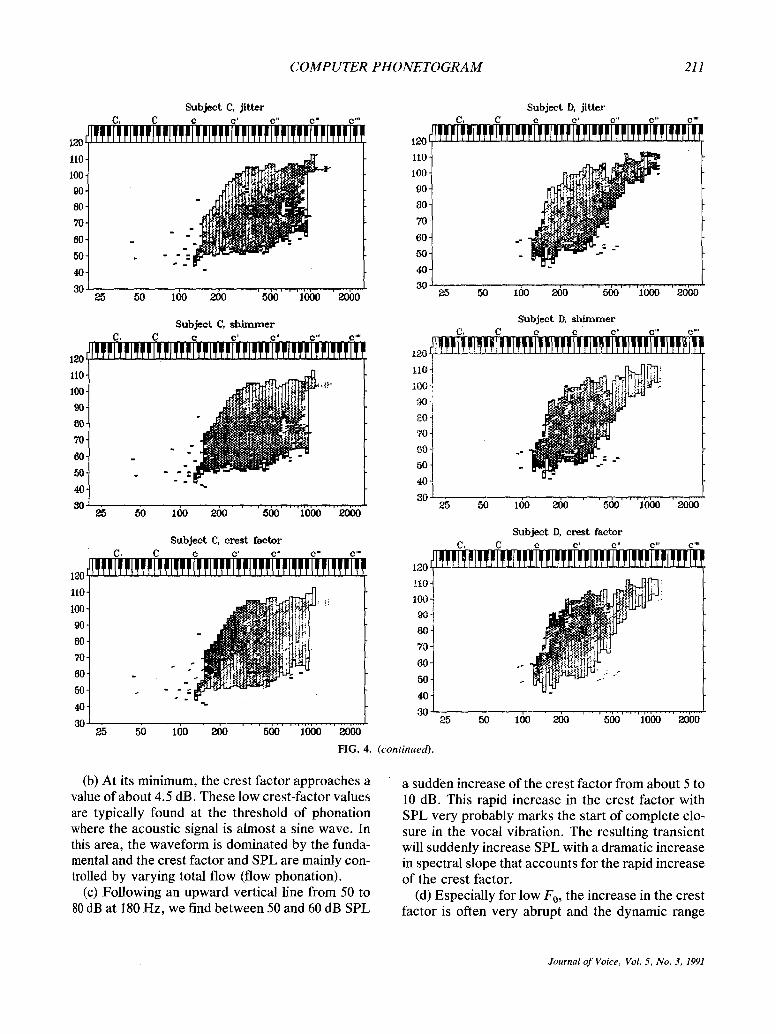
Each row in Fig. 4 shows a typical phonetogram of one trained female voice. The three quality pan- els are mapped on top of each other. The upper panel shows the distribution of jitter over the pho- netogram, the middle shimmer, and the bottom the crest factor. In these graphs, voice-quality variation is translated into a shading gradient; high perturba- tion values correspond to a dark shading. The re- suits show (a) large differences in shape, area, and relative position of phonetograms of the four sub- jects; (b) a local collapse in maximum output (sub- ject D) and even a clear fracture (subject B) at about two-thirds of the F0 range due to a voice break; (c) similar trends in the various parameter distributions for the different voices; and (d) very irregular jitter and shimmer quality distributions with a typical granular dark scattering by offshoots in the pertur- bation value. In general, the crest factor has a less noisy distribution and evolves much more gradually than the perturbation parameters.
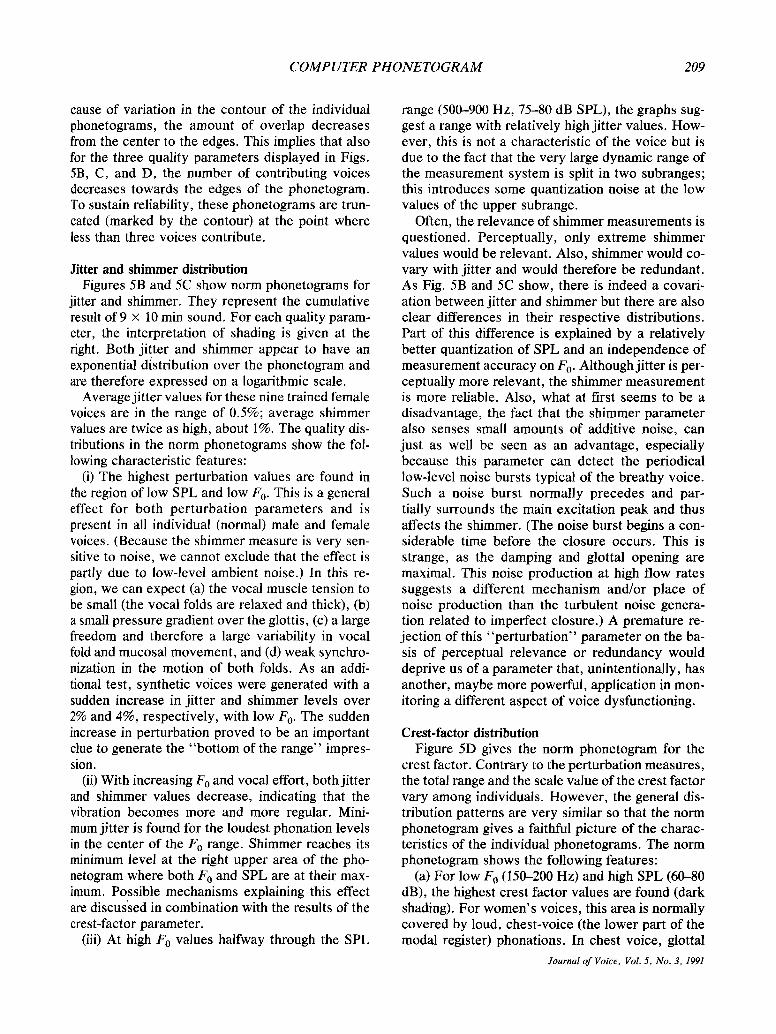
To get rid of the individual variation and to reveal general aspects of voice-quality variation, phoneto- grams of nine voices were averaged to yield a stan- dard or norm phonetogram for trained female voices. Plain, unweighted averaging was used, and no special precautions, like shifts, were taken to compensate for differences in phonetogram position in the Fo/SPL field. This way of averaging is espe- cially useful to show coupling of the quality param- eters with the absolute position in the Fo/SPL field. The results of this averaging are displayed in the norm phonetograms of Fig. 5.
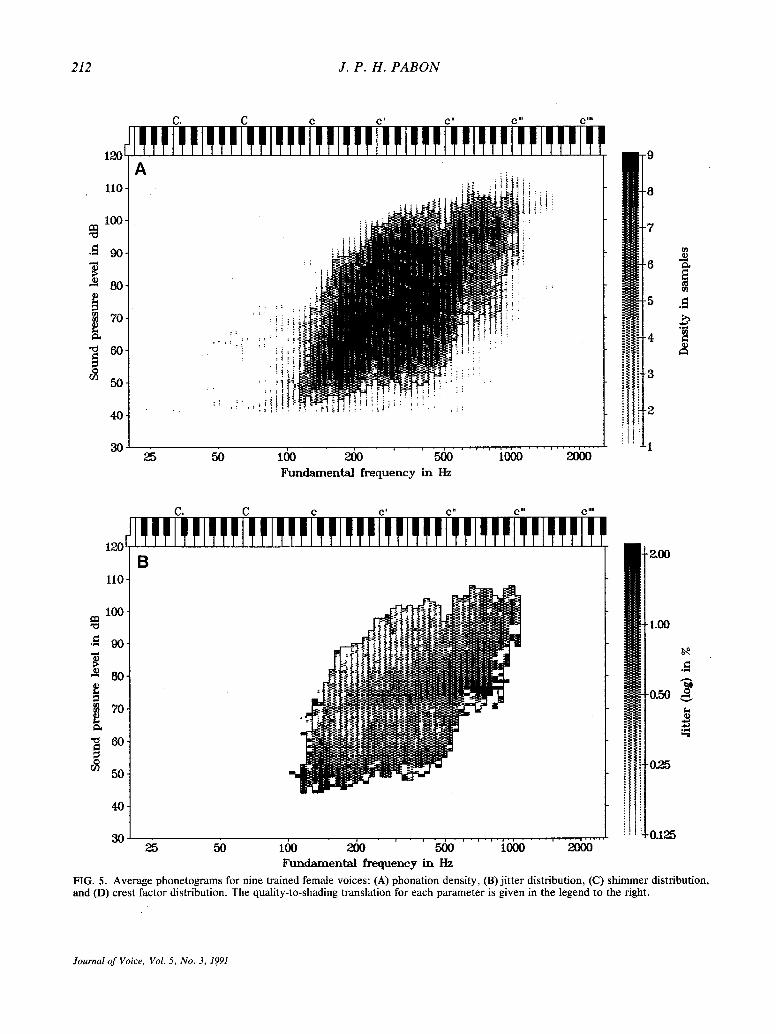
Phonation density The density phonetogram of Fig. 5A describes
the overlap between the nine voices. There are nine degrees of shading, indicating the number of over- lapping voices. The central, most dense, area is covered by all voices. All nine voices had a register break around the same position, resulting in a less dense area at about 100 dB SPL and 500 Hz. Be-
COMPUTER PHONETOGRAM 209
cause of variation in the contour of the individual phonetograms, the amount of overlap decreases from the center to the edges. This implies that also for the three quality parameters displayed in Figs. 5B, C, and D, the number of contributing voices decreases towards the edges of the phonetogram. To sustain reliability, these phonetograms are trun- cated (marked by the contour) at the point where less than three voices contribute.
Jitter and shimmer distribution Figures 5B and 5C show norm phonetograms for
jitter and shimmer. They represent the cumulative result of 9 x 10 min sound. For each quality param- eter, the interpretation of shading is given at the right. Both jitter and shimmer appear to have an exponential distribution over the phonetogram and are therefore expressed on a logarithmic scale.
Average jitter values for these nine trained female voices are in the range of 0.5%; average shimmer values are twice as high, about 1%. The quality dis- tributions in the norm phonetograms show the fol- lowing characteristic features:
(i) The highest perturbation values are found in the region of low SPL and low F 0. This is a general effect for both perturbation parameters and is present in all individual (normal) male and female voices. (Because the shimmer measure is very sen- sitive to noise, we cannot exclude that the effect is partly due to low-level ambient noise.) In this re- g/on, we can expect (a) the vocal muscle tension to be small (the vocal folds are relaxed and thick), (b) a small pressure gradient over the glottis, (c) a large freedom and therefore a large variability in vocal fold and mucosal movement, and (d) weak synchro- nization in the motion of both folds. As an addi- tional test, synthetic voices were generated with a sudden increase in jitter and shimmer levels over 2% and 4%, respectively, with low F0. The sudden increase in perturbation proved to be an important clue to generate the "bottom of the range" impres- sion.
(ii) With increasing F 0 and vocal effort, both jitter and shimmer values decrease, indicating that the vibration becomes more and more regular. Mini- mum jitter is found for the loudest phonation levels in the center of the F o range. Shimmer reaches its minimum level at the right upper area of the pho- netogram where both F0 and SPL are at their max- imum. Possible mechanisms explaining this effect are discussed in combination with the results of the crest-factor parameter.
(iii) At high F o values halfway through the SPL
range (500-900 Hz, 75-80 dB SPL), the graphs sug- gest a range with relatively high jitter values. How- ever, this is not a characteristic of the voice but is due to the fact that the very large dynamic range of the measurement system is split in two subranges; this introduces some quantization noise at the low values of the upper subrange.
Often, the relevance of shimmer measurements is questioned. Perceptually, only extreme shimmer values would be relevant. Also, shimmer would co- vary with jitter and would therefore be redundant. As Fig. 5B and 5C show, there is indeed a covari- ation between jitter and shimmer but there are also clear differences in their respective distributions. Part of this difference is explained by a relatively better quantization of SPL and an independence of measurement accuracy on F 0. Although jitter is per- ceptually more relevant, the shimmer measurement is more reliable. Also, what at first seems to be a disadvantage, the fact that the shimmer parameter also senses small amounts of additive noise, can just as well be seen as an advantage, especially because this parameter can detect the periodical low-level noise bursts typical of the breathy voice. Such a noise burst normally precedes and par- tially surrounds the main excitation peak and thus affects the shimmer. (The noise burst begins a con- siderable time before the closure occurs. This is strange, as the damping and glottal opening are maximal. This noise production at high flow rates suggests a different mechanism and/or place of noise production than the turbulent noise genera- tion related to imperfect closure.) A premature re- jection of this "perturbation" parameter on the ba- sis of perceptual relevance or redundancy would deprive us of a parameter that, unintentionally, has another, maybe more powerful, application in mon- itoring a different aspect of voice dysfunctioning.
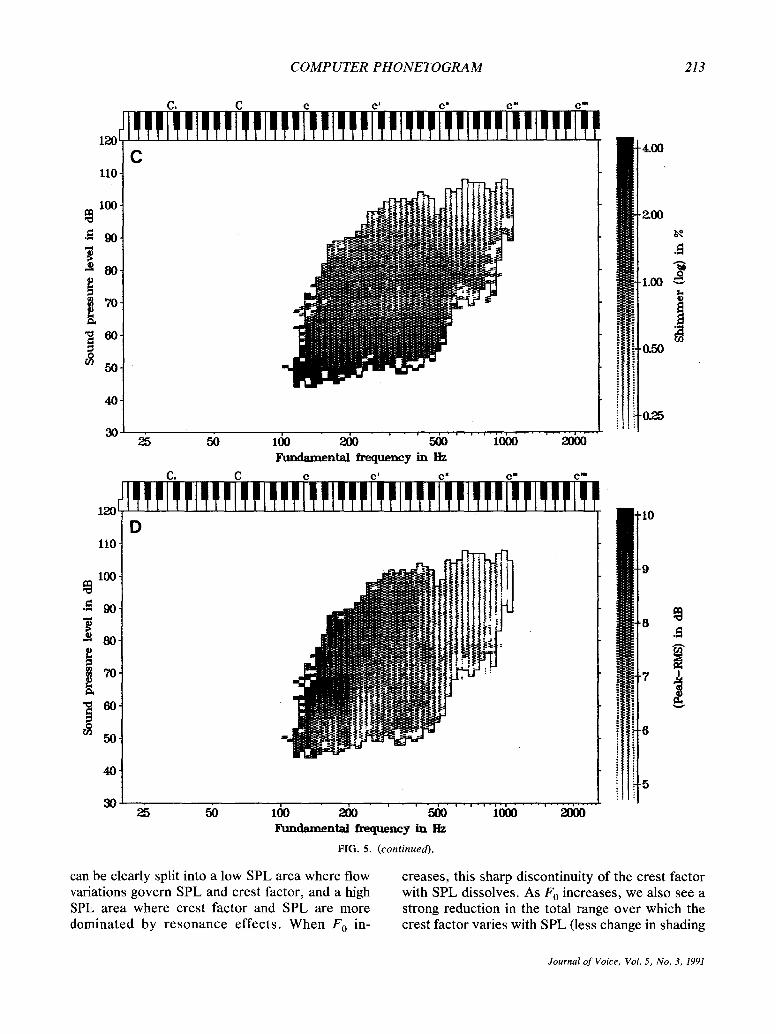
Crest-factor distribution Figure 5D gives the norm phonetogram for the
crest factor. Contrary to the perturbation measures, the total range and the scale value of the crest factor vary among individuals. However, the general dis- tribution patterns are very similar so that the norm phonetogram gives a faithful picture of the charac- teristics of the individual phonetograms. The norm phonetogram shows the following features:
(a) For low F 0 (150-200 Hz) and high SPL (60--80 dB), the highest crest factor values are found (dark shading). For women's voices, this area is normally covered by loud, chest-voice (the lower part of the modal register) phonations. In chest voice, glottal
Journal of Voice, Vol. 5, No. 3, 1991
210 J. P. H. P A B O N
120 ~
110.
100.
90.
80.
70-
60.
50.
Subject, A, j i t ter C, C e c' e" e" c"'
25 50 1IX) " 260 . . . . 500 . . . . . l'O00 . . . . . 20Oh"
l eO [
uo~ 100
90
8O
7O
e0-
5O
40
3O
Subject BI j i t ter C, C e e' e" .c" e "
• "'== "~
25 5o 16o ado .... 5dO .... i'ooo .... 20bo
120 I
110"
100"
90-
80-
70"
60-
50"
40-
30
Subject & ~himmer C, C (2 c' C" C" O''
as 5o IOO ado .... SdO ..... ibb0 .... 20bb
120 [
110-
100-
90-
80-
70-
60-
50-
40-
30
Subject B, shimmer C, C c c' e" e" e"
~ ~o lOO " ado . . . . ~ .... 1'ON .... aNii
120 f
110-
I00-
90-
80
70
60
50
40
80
Subject/~ crest factor C, C c c' c" e" c'"
2s so 16o " ado . . . . 560 . . . . . ibb0 ' ~
120 I
110-
100-
90-
80-
70-
60-
50.
40.
30
Subject B, c res t factor C, C c c' e" c" c "
as r,o 16o " ado . . . . 560 . . . . . i*obo . . . . . 20bo
FIG. 4. F rom the 12 phone tograms displayed, each co lumn shows another trained female voice, and each row another parameter . The first row shows jitter, the middle row sh immer , and the bot tom row the crest factor as supplementa l parameter . The shading represents the pa ramete r distribution. Legends describing the quali ty-to-shading translat ion for each parameter are supplied with the norm pho- ne tograms of Fig. 5.
closure is normally abrupt and powerful and period durations are relatively long. The main period peak in the acoustical signal rises high above the average (rms) signal level, resulting in crest-factor values around 10 dB. Under these conditions, the crest factor is primarily controlled by vocal tract reso- nances. The excitation pulse is fully damped before
the next excitation takes place. Stretching the pe- riod duration, and thus the averaging time while the peak level and time response are constant, will re- duce the total rms energy and thus increase the crest factor. Due to this principle, extreme crest- factor values of -15 dB can be obtained for the lowest Fo values.
Journal of Voice, Vol. 5, No. 3, 1991
COMPUTER PHO NETOGRAM 211
120 I
llO-
i00-
90.
80.
70 .
80-
50-
40-
30
Subjec t C, j i t ter C, C C C' C" c'" C"
e5 so ~do z6o . . . . ~ . . . . . ibbO . . . . . Zobo
120 I
110'
100'
90'
80,
70"
60'
50'
40
30
Subject C, shimmer C, C c c' c" o" c"
- "2."
~5 s o ~do " zdo .... ~dO ..... iOixi ....
I2OrlITFIT
110-
100 i 90-
80-
70-
60-
50-
40-
Subject D, j i t ter C, C o o' c" ,c" o"'
~0 ~do z o o ' '560'"'ibb0 . . . . . 26b0
Subject D, shimmer C, C c c' c" c " o"'
I00 -:
90-
[30-
70-
~30- ..
,50-
40-
30
Subjec t C, c res t factor
120 110
90
8 0
70
60 .
5 0 ~ - .
,t0 ~
a0 e5 sO ~do e6o . . . . 560 ..... ibb0 ..... e0bo
FIG. 4. (continued).
z5 sO 160 e6o ' ' 560 . . . . . 1bbo . . . . e0bo
Subject D, c res t factor C, C c c' c" c', c'"!
100 i 90-
70-
60-
5 0
40.
30 z5 so 160 z60 ' '560 ..... i~b0 .... e006
(b) At its minimum, the crest factor approaches a value of about 4.5 dB. These low crest-factor values are typically found at the threshold of phonation where the acoustic signal is almost a sine wave. In this area, the waveform is dominated by the funda- mental and the crest factor and SPL are mainly con- trolled by varying total flow (flow phonation).
(c) Following an upward vertical line from 50 to 80 dB at 180 Hz, we find between 50 and 60 dB SPL
a sudden increase of the crest factor f rom about 5 to 10 dB. This rapid increase in the crest factor with SPL very probably marks the start of complete clo- sure in the vocal vibration. The resulting transient will suddenly increase SPL with a dramatic increase in spectral slope that accounts for the rapid increase of the crest factor.
(d) Especially for low Fo, the increase in the crest factor is often very abrupt and the dynamic range
Journal of Voice, Vol. 5, No. 3, 1991
212 J. P. H. P A B O N
C, C c c' c" c " c" '
120 9
/ ~ J L i ~ i l i B m a a H I L l i: i
I :: :: :,!,r ~I!: I 5 (0 : i i ~ ! i ;
/ " :: : l i i ~ ~ /
3 0 " 2 5 5 0 I 0 0 2 0 0 5 0 0 I 0 0 0 2 0 0 0 "
F u n d a m e n t a l f r e q u e n c y in Hz
C, C c c ' c" c ~ c "
i2o[ B -zoo
l l 0 -
ioo- - l . 0 0
• -~ 9 0 -
- , " 4
50 - o 2 5
4 0 .
-0 .125 30 25 50 16o 26o ' r ~ o . . . . . . . i 0 ix i . . . . . . ~
Fundamenta l frequency in I-Iz
FIG. 5. Average phonetograms for nine trained female voices: (A) phonation density, (B) jitter distribution, (C) shimmer distribution, and (D) crest factor distribution. The quality-to-shading translation for each parameter is given in the legend to the right.
Journal of Voice, Vol. 5, No. 3, 19,91
COMPUTER PHONETOGRAM 213
• ~ 90-
50,
C, C (~ c ' c " c " c 'm
C II0,
I00
5O
411
3() 25
C,
50
C
16o 26o . . . . ~ o . . . . . . . i 06o " ' ' z 0 i X i
Fundamental frequency in Hz C C' C" C = C 'm
12o[ "I0 D
110-
100. ! 1 -9
i , 6
40- 5
3o ~ 50 16o 260 ' " ' r ~ o . . . . . . . i 0 b 0 . . . . . . a 0 ~ 0
Fundamental frequency in Hz
FIG. 5. (continued).
v
t . .
can be clearly split into a low SPL area where flow variations govern SPL and crest factor, and a high SPL area where crest factor and SPL are more dominated by resonance effects. When F o in-
creases, this sharp discontinuity of the crest factor with SPL dissolves. As F 0 increases, we also see a strong reduction in the total range over which the crest factor varies with SPL (less change in shading
Journal of Voice, Vol. 5, No. 3, 1991
214 J. P. H. P A B O N
over the vertical dimension in the phonetogram). Every change in SPL not accompanied by a crest- factor change and not induced by changes in the resonance characteristics of the vocal tract (no spectral change) is most likely produced by varia- tions in the total flow (flow phonation). Thus, flow regulation gains in importance when/70 increases.
What we observe has the following physiological and aerodynamical explanation: Because there is a limit to the variation in mass, length, and tension of the vocal chords, there will also be an upper limit to the absolute closing speed of the glottis. Both ab- solute opening and closing speeds in the glottal cy- cle go up with Fo. The more Fo increases, the more the vibration mode of the vocal folds becomes stringlike. Horizontal and vertical phase differences in the movement of vocal-fold tissue disappear and the folds tend to vibrate as a whole. Thus, for high F 0, it is more difficult to realize a difference be- tween opening and closing time of the vocal folds. This means that for high F o, the possible variation in maximum closing speed (transient character) will be small. Thus, the range and speed by which the spec- tral slope and crest factor can vary with SPL de- crease when F 0 increases. The glottal resistance be- comes more constant, leaving flow regulation as the main mechanism for SPL control.
The area where F 0 is the main spectral compo- nent begins as a small zone along the lower bound- ary of the phonetogram, but soon builds up with increasing F o until it covers the entire SPL range. This means that for high F 0, the acoustic signal re- mains sine-shaped even up to the highest vocal ef- fort. We should realize, however, that for high Fo, even for a crest factor as low as 5 dB, the higher harmonics can be rather strong. The waveform may be sinelike, but what we consider a steep spectral slope is very relative..Consider a tone sung at 800 Hz at a level of 100 dB SPL with a crest factor of 4.5 dB. For instance, a 10th harmonic that is 30 dB down relative to the fundamental still represents considerable energy at 8 kHz. The same harmonic 30 dB down for an Fo of 150 Hz will probably not be part of what is often referred to as a "r ich" spec- trum.
So, phonations in the so-called falsetto or loft reg- ister may show a sinelike waveform but can still be very powerful and penetrating up to high frequen- cies. Also, with respect to the F o range, the dy- namic range, and the extreme levels normally reached, the opinion that this register is weak and
small and therefore inept as a singing voice can be questioned.
Following the horizontal 90-dB SPL line from low to high Fo values, we see how the crest factor smoothly declines from a maximum of 9 dB to a 4.5 dB minimum. This reflects the common known ten- dency that the detail in spectral envelope variation diminishes when F 0 increases. We should be aware that this effect is not solely due to a reduced fre- quency sampling of the formant structure; also, the variability of the source spectrum downgrades with Fo.
Often, the lowest SPL in the phonetogram, real- ized with sustained phonation, also forms the bot- tom of the speech range (the first octave). Starting from an area where the vocal vibration is already favorable at very low levels, the voice exploits the largest flexibility in changing its spectrotemporal characteristics. The evaluation of spectral-slope variation with SPL in this area is one of the most important indicators on vocal (dys)functioning.
Relations between the jitter and crest factor The phonetograms of Fig. 5B show an area with
increased jitter due to an increased quantization er- ror. This artifact can be reduced by interpolation, increasing sampling rates, better adjustment of sig- nal levels with conversion levels, and by using high- precision (e.g., 16-bit) converters. Independently from this effect, there are limitations in measure- ment accuracy that cannot be altered because they are dictated by the temporal and spectral distribu- tion of vocal signal and noise. Following the general approach, vocal perturbation is measured by calcu- lating peak-to-peak period duration differences. Us- ing this scheme, we often forget what we are actu- ally doing; we are in fact downsampling a signal with a sampling interval equal to the period dura- tion, without any antialiasing filtering. So, high- frequency (HF) noise is also seen as low-frequency (LF) perturbation. The level at which this HF noise interferes with the jitter measurement depends on the spectral slope of the "periodic" part of the sig- nal. The Sharp peaks and steep zero-crossings (a signal with fiat spectral slope) will be less blurred by HF noise than round and slow rising sinelike period peaks (a signal with steep spectral slope). Using interpolation (or upsampling) in locating the feature may bring high numerical precision but with a bad signal-to-noise ratio the effort will be useless as the method also amplifies the noise. The effect that HF
Journal of Voice, Vol. 5, No. 3, 1991
COMPUTER PHONETOGRAM 215
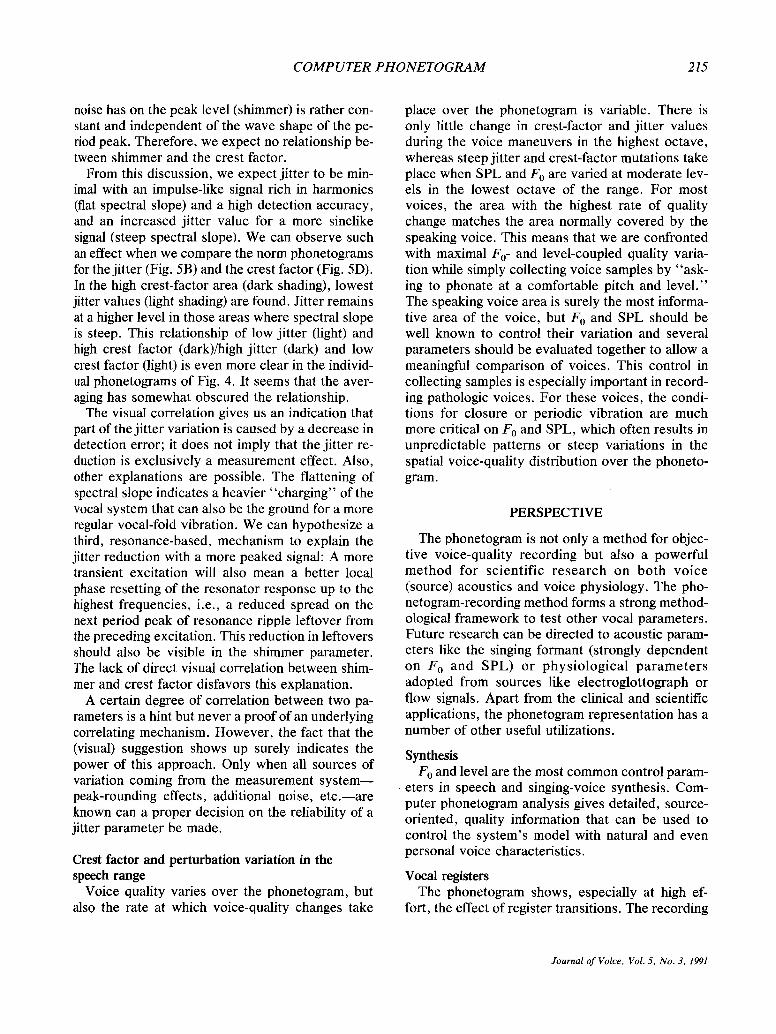
noise has on the peak level (shimmer) is rather con- stant and independent of the wave shape of the pe- riod peak. Therefore, we expect no relationship be- tween shimmer and the crest factor.
From this discussion, we expect jitter to be min- imal with an impulse-like signal rich in harmonics (fiat spectral slope) and a high detection accuracy, and an increased jitter value for a more sinelike signal (steep spectral slope). We can observe such an effect when we compare the norm phonetograms for the jitter (Fig. 5B) and the crest factor (Fig. 5D). In the high crest-factor area (dark shading), lowest jitter values (light shading) are found. Jitter remains at a higher level in those areas where spectral slope is steep. This relationship of low jitter (light) and high crest factor (dark)/high jitter (dark) and low crest factor (light) is even more clear in the individ- ual phonetograms of Fig. 4. It seems that the aver- aging has somewhat obscured the relationship,
The visual correlation gives us an indication that part of the jitter variation is caused by a decrease in detection error; it does not imply that the jitter re- duction is exclusively a measurement effect. Also, other explanations are possible. The flattening of spectral slope indicates a heavier "charging" of the vocal system that can also be the ground for a more regular vocal-fold vibration. We can hypothesize a third, resonance-based, mechanism to explain the jitter reduction with a more peaked signal: A more transient excitation will also mean a better local phase resetting of the resonator response up to the highest frequencies, i.e., a reduced spread on the next period peak of resonance ripple leftover from the preceding excitation. This reduction in leftovers should also be visible in the shimmer parameter. The lack of direct visual correlation between shim- mer and crest factor disfavors this explanation.
A certain degree of correlation between two pa- rameters is a hint but never a proof of an underlying correlating mechanism. However, the fact that the (visual) suggestion shows up surely indicates the power of this approach. Only when all sources of variation coming from the measurement system-- peak-rounding effects, additional noise, etc.--are known can a proper decision on the reliability of a jitter parameter be made.
Crest factor and perturbation variation in the speech range
Voice quality varies over the phonetogram, but also the rate at which voice-quality changes take
place over the phonetogram is variable. There is only little change in crest-factor and jitter values during the voice maneuvers in the highest octave, whereas steep jitter and crest-factor mutations take place when SPL and F o are varied at moderate lev- els in the lowest octave of the range. For most voices, the area with the highest rate of quality change matches the area normally covered by the speaking voice. This means that we are confronted with maximal F 0- and level-coupled quality varia- tion while simply collecting voice samples by "ask- ing to phonate at a comfortable pitch and level." The speaking voice area is surely the most informa- tive area of the voice, but F 0 and SPL should be well known to control their variation and several parameters should be evaluated together to allow a meaningful comparison of voices. This control in collecting samples is especially important in record- ing pathologic voices. For these voices, the condi- tions for closure or periodic vibration are much more critical on F0 and SPL, which often results in unpredictable patterns or steep variations in the spatial voice-quality distribution over the phoneto- gram.
PERSPECTIVE
The phonetogram is not only a method for objec- tive voice-quality recording but also a powerful method for scientific research on both voice (source) acoustics and voice physiology. The pho- netogram-recording method forms a strong method- ological framework to test other vocal parameters. Future research can be directed to acoustic param- eters like the singing formant (strongly dependent on F o and SPL) or physiological parameters adopted from sources like electroglottograph or flow signals. Apart from the clinical and scientific applications, the phonetogram representation has a number of other useful utilizations.
Synthesis Fo and level are the most common control param-
eters in speech and singing-voice synthesis. Com- puter phonetogram analysis gives detailed, source- oriented, quality information that can be used to control the system's model with natural and even personal voice characteristics.
Vocal registers The phonetogram shows, especially at high ef-
fort, the effect of register transitions. The recording
Journal of Voice, Vol. 5, No. 3, 1991
216 J. P. H. P A B O N
method is not only valuable for voice classification but also for training. By instructing the subjects to restrain to one single phonation mode, the record- ing technique can be used to make isolated record- ings of one register only. By comparing these sep- arate recordings and their quality parameters, we have a tool to study acoustic characteristics of vo- cal registers. For the singer, the "breaking of the voice" itself can be studied in practice and potential "dangerous areas" can be explored. By direct feed- back, we can trace the courses leading to a break, the point of breaking, and also the size and direction of the jump.
Voice training and real-time quality feedback All parameters described above are measured in
real time. Their general quality variation is summa- rized in the norm phonetogram. In our system, we built in the possibility of making direct comparisons between individual voice quality and normal quality during phonation. The deviation from the normal is displayed using direct visual feedback on the pho- netogram screen. This makes this technique very powerful for voice training. The gross acoustic pa- rameter variation is already accounted for by the phonetogram positioning. In this way, very detailed quality differences can be revealed. As voice prob- lems often occur during specific types of phonations in restricted parts of the range, these problems can be pointed out by their location in the phonetogram. The direct feedback can be used to lead a patient to, or to focus a patient on, these "local" abnormalities in his/her voice production.
CONCLUSIONS
We have shown that our computer phonetogram method can map important aspects of voice quality over the entire F0 SPL range. Three voice-quality parameters (jitter, shimmer, and crest factor) stan- dardly showed a characteristic quality variation that was highly dependent on F0 and SPL. Jitter and
shimmer distributions over the phonetogram indi- cate that (a) highest perturbation levels are nor- mally found for the lowest F o and low SPL phona- tions, (b) lowest jitter values are found for the loud,. chest-voice phonations, (c) lowest shimmer values are found for the loudest phonations in falsetto, and (d) there is a large variation in measurement accu- racy of the jitter parameter over the phonetogram. The large dependence of both perturbation param- eters on production and measurement conditions in- dicate the great interest of accurate control of F 0, SPL, and quantization accuracy in perturbation measurement.
The crest factor parameter could be applied (a) to indicate the sudden appearance of closure in the glottal vibration in the speech range, (b) to highlight those phonations for which closure is relatively ex- treme, (c) to view the range and expanding of flow- type phonation with F 0, and (d) to mark the areas with highest measurement accuracy for the jitter measurement. Computer phonetogram recording also has some new applications in voice synthesis, register research, and voice training.
Acknowledgment: This research was funded by the Dutch "Praeventiefonds."
REFERENCES
1. Stout B. The harmonic structure of vowels in singing in re- lation to pitch and intensity. J Acoust Soc Am 1938;10:137- 46.
2. Calvet J, Malhiac G. Courbes vocales et mue de la voix. J Franc Otorhinolaryngol 1952; 1:115-24.
3. Damst6 PH. The phonetogram. Pract Otorhinolaryngol 1970;32:185-7.
4. GrammingP. The phonetogram, an experimental and clinical study. Doctoral dissertation, Dept. of Otolaryngology, Uni- versity of Lund, Malm6 General Hospital, Maim6, Sweden, June 1988.
5. Pabon JPH, Plomp R. Automatic phonetogram recording supplemented with acoustical voice-quality parameters. J Speech Hearing Res 1988;31:710-22.
6. Schutte HK, Seidner W. Recommendation by the Union of European Phoniatricians (UEP): standardizing voice area measurement/phonetography. Folia Phoniatr (Basel) 1983; 35:286--8.
Journal of Voice, Vol. 5, No. 3, 1991


![Measuring room acoustic parameters using a head and torso ... · Table 1: Acoustic parameter values measured on position R1, according to ISO 3382-1 Room acoustic Octave band [Hz]](https://img.pdfslide.us/doc/110x75/5c6614a609d3f20f218bbe3c/measuring-room-acoustic-parameters-using-a-head-and-torso-table-1-acoustic.jpg)