Embed Size (px)
Citation preview
DOI: http:/dx.doi.org/10.18180/tecciencia.2014.17.5
How to cite: Herrera Martinez, M. et al., Speech pattern recognition for forensic acoustic purposes, TECCIENCIA, Vol. 9 No. 17., 37-44, 2014, DOI: http:/dx.doi.org/10.18180/tecciencia.2014.17.5
37
Speech pattern recognition for forensic acoustic purposes
Reconocimiento de patrones de voz para fines acústicos forenses
Marcelo Herrera Martínez1, Andrea Lorena Aldana Blanco2 Ana María Guzmán Palacios3
1Universidad de San Buenaventura, Bogotá, Colombia, [email protected] 2Universidad de San Buenaventura, Bogotá, Colombia.
3Universidad del Cauca, Popayán, Colombia.
Received: 10/Aug/2014 Accepted: 12/Sep/2014 Published: 30/Dec/2014
Abstract
The present paper describes the development of a software for analysis of acoustic voice parameters (APAVOIX), which can
be used for forensic acoustic purposes, based on the speaker recognition and identification. This software enables to observe
in a clear manner, the parameters which are sufficient and necessary when performing a comparison between two voice
signals, the suspicious and the original one. These parameters are used according to the classic method, generally used by
state entities when performing voice comparisons
Keywords: Acoustic parameters Software, Digital Signal Processing, Speaker Identification, Voice.
Resumen
El presente artículo describe el desarrollo de un software para el análisis de los parámetros acústicos de la voz (APAVOIX),
que puede ser usado para los propósitos acústicos forenses, basado en el reconocimiento y la identificación del hablante. Este
software permite observar de una manera clara, los parámetros que son suficientes y necesarios cuando se realiza una
comparación entre dos señales de voz, el sospechoso y la original. Estos parámetros se utilizan de acuerdo con el método
clásico, utilizado generalmente por las entidades estatales cuando se realizan comparaciones de voz
Palabras clave: parámetros acústicos de software, procesamiento de señales digitales, la identificación del hablante, de voz.
1. Introduction
Forensic acoustics is an unknown branch the field of Sound
Engineering, nevertheless it is a necessary branch, widely
used for performing comparisons between two or more
voice signals, with the aim to prove guilty or innocence of a
suspect involved in a justice process. For the development
of this work, the responsible person judges, require a tool,
which enables them to make a correct comparison of certain
parameters, which enable to give an specific
characterization to the voice of any speaker, in the same
manner that a fingerprint would do it; that means that two
voices cannot be equal, due to physiological characteristics
of each speaker. Each of these comparisons are performed
through the classic combined method, which is the result of
years of research in the field of forensic acoustics, in order
to have an exact reference of the elements to analyze and the
results obtained in voice comparison.
This method is analyzed in a qualitative manner, without
quantitative values, which enable to give more weight to the
voice recordings. Nevertheless, it is possible to give a value
to some of these variables, in order to be more accurate in a
judgment, but the judges of this process do not have such a
wide and specific knowledge in Digital Signal Processing,
and other parameters. Therefore it is necessary to rely on a
professional person with this type of knowledge, in order to
have more processes with justice, and that involved persons
could prove their guilty or innocence in a more exact and
reliable manner.
The main goal of the present work is to implement an
algorithm which enables to analyze the sufficient and
38
necessary acoustic characteristics of the human voice used
in speaker identification.
Therefore, there is the need to identify the fundamental
frequency and the intensity, the energy spectrum, LPC
(Linear Predicting Code), the formants, signal-to-noise ratio
(S/N), the signal spectrogram, time percentage of the
presence of the voice inside the recording and the gender,
required in the analysis of the behavior of the voice, which
give the proper characteristics of each speaker.
Afterwards, the software is developed, in order to analyze
the characteristic parameters of the voice in junction with the
graphic interface.
Tests are performed in order to prove the adequate
performance of the software, through a professional
software that would be developed for voice analysis.
Finally, the influence of external agents in the signal capture
or processing, such as background noise, the space in which
capture is made, sampling frequency and the compression
format, are also analyzed.
2. Theoretical background
In order to develop a software for the analysis of voice
acoustic parameters, it is necessary to know about the
phenomena in speech generation, as well as the parameters
that may be used for the performance of voice comparison
in the field of forensic acoustics.
2.1. Voice General Concepts
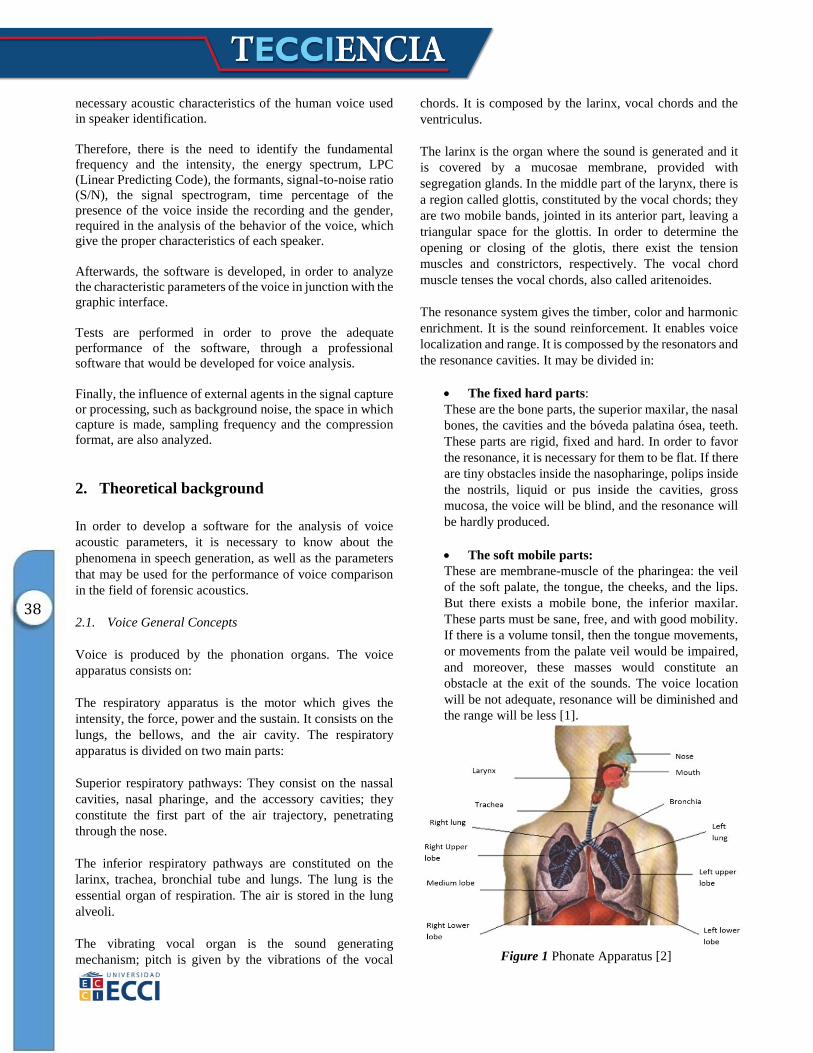
Voice is produced by the phonation organs. The voice
apparatus consists on:
The respiratory apparatus is the motor which gives the
intensity, the force, power and the sustain. It consists on the
lungs, the bellows, and the air cavity. The respiratory
apparatus is divided on two main parts:
Superior respiratory pathways: They consist on the nassal
cavities, nasal pharinge, and the accessory cavities; they
constitute the first part of the air trajectory, penetrating
through the nose.
The inferior respiratory pathways are constituted on the
larinx, trachea, bronchial tube and lungs. The lung is the
essential organ of respiration. The air is stored in the lung
alveoli.
The vibrating vocal organ is the sound generating
mechanism; pitch is given by the vibrations of the vocal
chords. It is composed by the larinx, vocal chords and the
ventriculus.
The larinx is the organ where the sound is generated and it
is covered by a mucosae membrane, provided with
segregation glands. In the middle part of the larynx, there is
a region called glottis, constituted by the vocal chords; they
are two mobile bands, jointed in its anterior part, leaving a
triangular space for the glottis. In order to determine the
opening or closing of the glotis, there exist the tension
muscles and constrictors, respectively. The vocal chord
muscle tenses the vocal chords, also called aritenoides.
The resonance system gives the timber, color and harmonic
enrichment. It is the sound reinforcement. It enables voice
localization and range. It is compossed by the resonators and
the resonance cavities. It may be divided in:
The fixed hard parts:
These are the bone parts, the superior maxilar, the nasal
bones, the cavities and the bóveda palatina ósea, teeth.
These parts are rigid, fixed and hard. In order to favor
the resonance, it is necessary for them to be flat. If there
are tiny obstacles inside the nasopharinge, polips inside
the nostrils, liquid or pus inside the cavities, gross
mucosa, the voice will be blind, and the resonance will
be hardly produced.
The soft mobile parts:
These are membrane-muscle of the pharingea: the veil
of the soft palate, the tongue, the cheeks, and the lips.
But there exists a mobile bone, the inferior maxilar.
These parts must be sane, free, and with good mobility.
If there is a volume tonsil, then the tongue movements,
or movements from the palate veil would be impaired,
and moreover, these masses would constitute an
obstacle at the exit of the sounds. The voice location
will be not adequate, resonance will be diminished and
the range will be less [1].
Figure 1 Phonate Apparatus [2]
39
2.2. Formants and Spectrogram
Due to the fact that the vocal tract evolves in time in order
to produce different sounds, spectral characterization of the
voice signal will be also variant in time. This temporal
evolution may be represented with a voice signal
spectrogram or a sonogram. This is a bi-dimensional
representation that shows the temporal evolution of the
spectral characterization.
The formants appear as horizontal frames; instead of that,
amplitude values in function of frequency are represented in
a gray-scale in vertical sense. There exist two types of
sonograms: wideband, and narrow-band.
In the case of the wideband spectrograms, a good temporal
resolution will be obtained. Instead of that, in the case of
narrowband spectrograms, a good frequency resolution will
be obtained, because the filter enables to obtain more precise
spectral estimations [1].
2.3. Localized Analysis in The Frequency Domain
A conventional analysis in the frequency domain for voice
signal gives little information, due to the special
characteristics that this signal has. In the voice-signal
spectrum, two convolutions components appear.
One comes from the fundamental frequency and its
harmonics, and the other from the formants of the vocal
tract. Therefore, the only information that may be achieved
is a visual one, through the spectrogram. Depending on the
type of the spectrogram (wideband, narrowband), one of the
two components may be achieved (formants or the refined
structure).
2.3.1. The Fast Fourier Transform
The Fast Fourier Transform (FFT) is based on the
reorganization of the signal. In the same way as the TDF, in
the FFT, the transformed signal into the frequency domain,
must be decomposed on a series of sines and cosines,
represented by complex numbers. A 16-point signal must be
decomposed in 4, then in 2, and in this way successfully,
until the signal is in point-to-point way. This operation is a
reorganization in order to diminish the number of operations
and to improve its velocity. After finding the spectrum
frequency, these may be reordered in order to find the
operation in the time-domain [3]
2.4. Analysis in the Cepstral Domain
The spectrum or cepstral coefficient c (τ), sis defined as the
inverse Fourier Transform of the logarithm of the spectral
module ǀ X (ω) ǀ
𝑐(𝜏) = 𝐼𝐷𝐹𝑇[𝐿𝑜𝑔|𝑋(𝜔)|] (1)
The term "cepstrum” is derived from the english Word
“spectrum”, the independent variable in the spectral domain
is “quefrency”.
Due to the fact that the cepstrum represents the inverse
transform of the frequency domain, the “frecuency” is a
variable on a pseudotemporal domain.
The essential characteristic of the cepstrum is that it enables
to separate the two contributions of the production
mechanism: fine structure and spectral envelope [4].
2.5. Analysis by LPC (Linear Time Prediction)
Linear prediction is a good tool for the analysis of voice
signals. Linear prediction models the human vocal tract as
an Infinite Impulse Response IIR system, which produces
the voice signal. For vocal sounds and other voice regions,
which have a resonant structure and a high grade of
similarity through temporal changes, this model predicts an
efficient representation of the sound.
In order to use LPC, one must get into account:
Vocals are easier to recognize, using LPC.
Error may be calculated, as a^T Ra, where R is the matrix
of autocovariance or autocorrelation of a segment and
“a” is the prediction coefficient vector of a standard
segment.
A pre-emphasis filter, before LPC, may improve the
performance.
Tone period is different in men and women.
For voice segments, (r_ss [T])/(r_ss [0] )≃0.25 where T
is the tone period [5].
2.6. Pitch
The prosodic information, that is, the tonation velocity, is
strongly influenced by the fundamental frequency of the
vibration of the vocal chords f0, which inverse is known as
the fundamental period T0. In a general way, periodicity is
given in intervals of infinite analysis; nevertheless, its
estimation is realized over finite intervals, in such a way that
many pitch periods are covered or by the difference between
two consecutive time instants of the glotic closure [6].
2.7. Signal-to-Noise Ratio
S/N relationship gives a quality measure of a signal on a
determined system, and it depends, on the received signal as
40
well as on the total noise; that is the sum of the noise that
comes from external sources and the inherent noise of the
system. In system design, it is desired that signal-to-noise
ratio to have a high value. Nevertheless, depending on the
application context, this value may change, because, high
S/n values leads to huge costs. An adequate value of this
relationship is that when the received signal may be
considered without defects or with minimal defects [7].
3. Software design and implementation
For the SW design, it was necessary to perform a previous
exploration of the necessary parameters in speaker
identification, with emphasis in forensic acoustics.
For this purpose, software Computerized Speech
LabCSL4500de Kaypentax® was taken as a reference, with
the proper characteristics fpr the userin order to develop an
original SW APAVOIX (Análisis de Parámetros Acústicos
de la Voz).
At the development stage of this software, the graphic
interface was also realized, using the GUI (Graphic unit
Interface) in Matlab®.
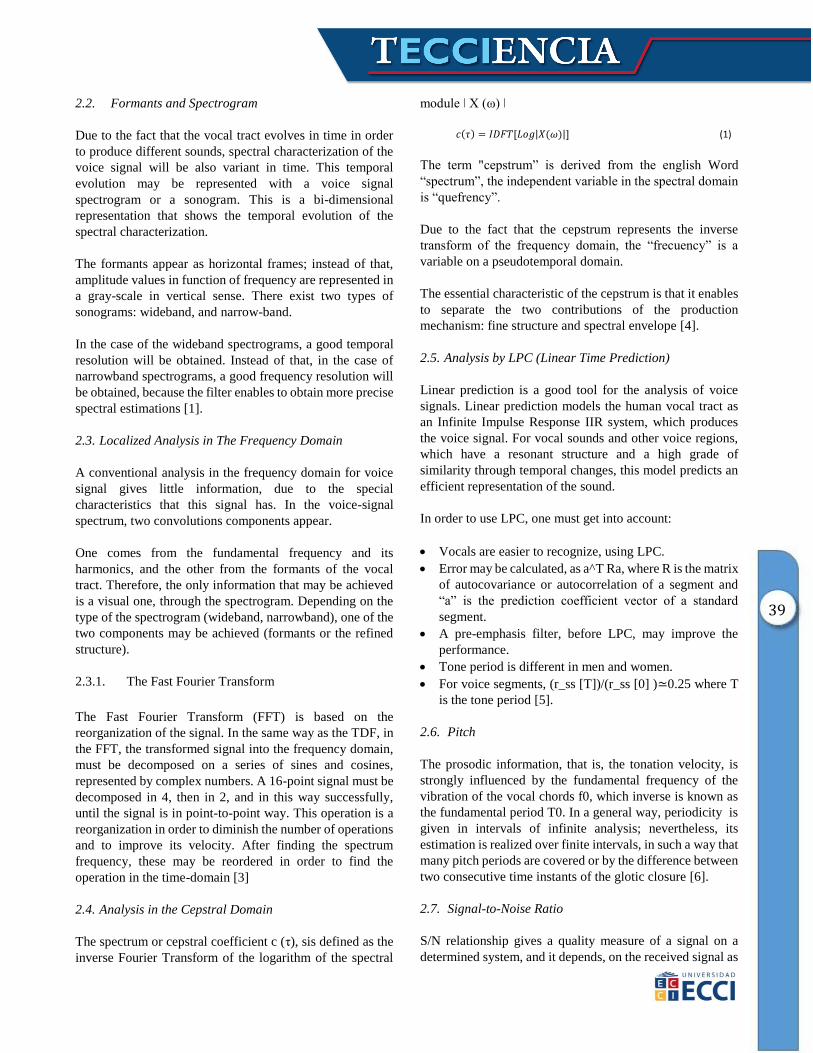
For the spectrogram design, “VOICEBOX” [8] Matlab
toolbox was used, which contains many features for voice
parameter evaluation. Function spgrambw, from this
toolbox, enables to plot a spectrogram in MATLAB, using a
more precise algorithm, than using specgram from
MATLAB.
In order to use this tool, the program requires the audio for
the analysis, which in this case, it is a selected fragment by
the cursors, the sampling frequency, 11025 Hz, because for
voice-signal-processing, it is not necessary to use a high
sampling frequency. Besides this, the function enables to
modify the spectrogram colors, in order to clear the
visualtion, to modify the scale of visualization (Hertz,
Logaritmo, Erb, Mel, or Bark).
Figure 2. Spectrogram
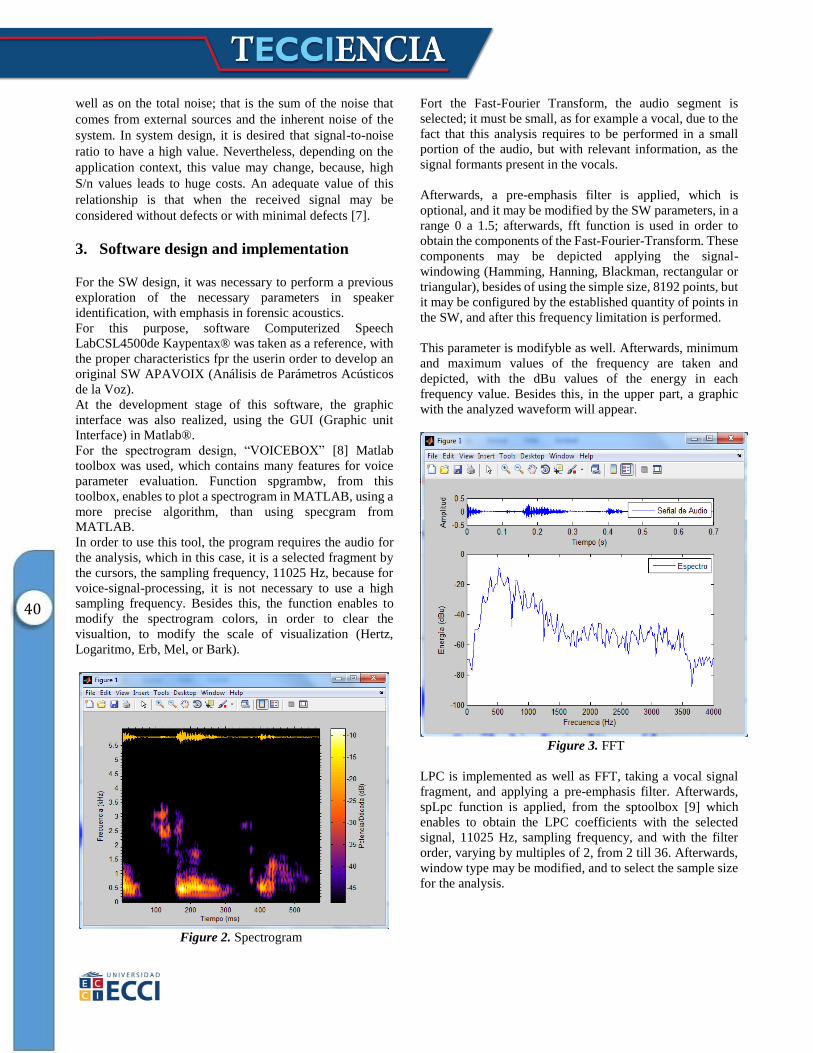
Fort the Fast-Fourier Transform, the audio segment is
selected; it must be small, as for example a vocal, due to the
fact that this analysis requires to be performed in a small
portion of the audio, but with relevant information, as the
signal formants present in the vocals.
Afterwards, a pre-emphasis filter is applied, which is
optional, and it may be modified by the SW parameters, in a
range 0 a 1.5; afterwards, fft function is used in order to
obtain the components of the Fast-Fourier-Transform. These
components may be depicted applying the signal-
windowing (Hamming, Hanning, Blackman, rectangular or
triangular), besides of using the simple size, 8192 points, but
it may be configured by the established quantity of points in
the SW, and after this frequency limitation is performed.
This parameter is modifyble as well. Afterwards, minimum
and maximum values of the frequency are taken and
depicted, with the dBu values of the energy in each
frequency value. Besides this, in the upper part, a graphic
with the analyzed waveform will appear.
Figure 3. FFT
LPC is implemented as well as FFT, taking a vocal signal
fragment, and applying a pre-emphasis filter. Afterwards,
spLpc function is applied, from the sptoolbox [9] which
enables to obtain the LPC coefficients with the selected
signal, 11025 Hz, sampling frequency, and with the filter
order, varying by multiples of 2, from 2 till 36. Afterwards,
window type may be modified, and to select the sample size
for the analysis.
41
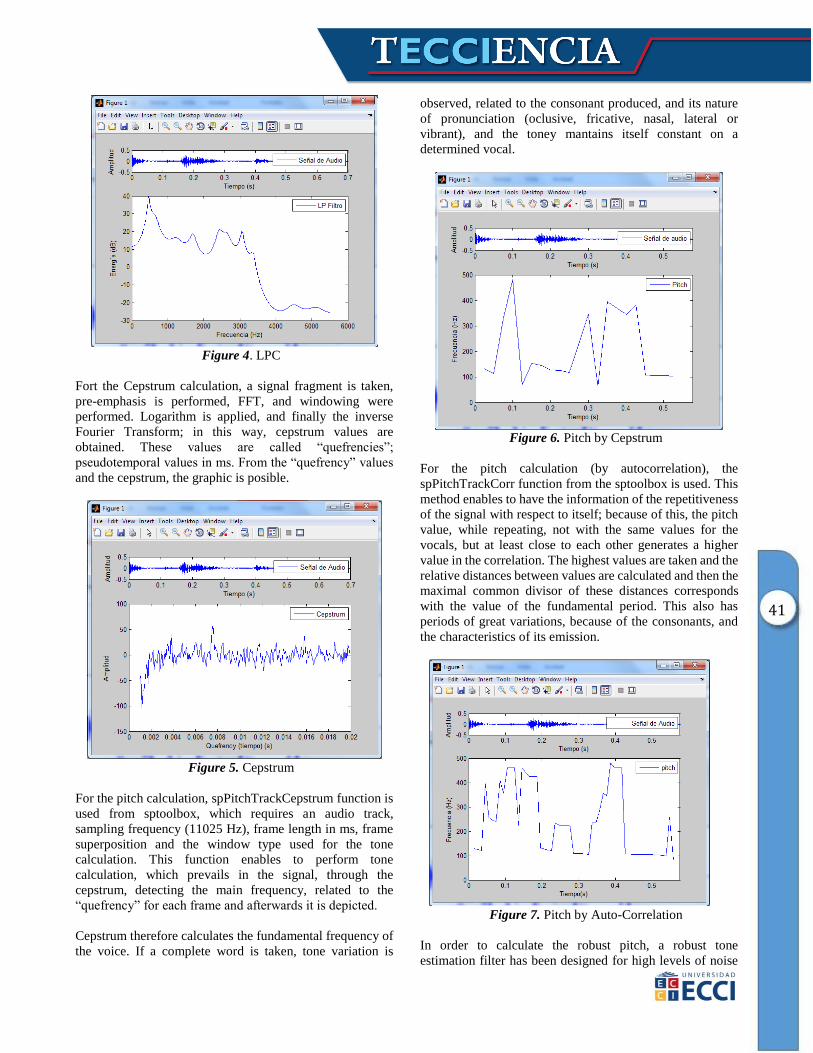
Figure 4. LPC
Fort the Cepstrum calculation, a signal fragment is taken,
pre-emphasis is performed, FFT, and windowing were
performed. Logarithm is applied, and finally the inverse
Fourier Transform; in this way, cepstrum values are
obtained. These values are called “quefrencies”;
pseudotemporal values in ms. From the “quefrency” values
and the cepstrum, the graphic is posible.
Figure 5. Cepstrum
For the pitch calculation, spPitchTrackCepstrum function is
used from sptoolbox, which requires an audio track,
sampling frequency (11025 Hz), frame length in ms, frame
superposition and the window type used for the tone
calculation. This function enables to perform tone
calculation, which prevails in the signal, through the
cepstrum, detecting the main frequency, related to the
“quefrency” for each frame and afterwards it is depicted.
Cepstrum therefore calculates the fundamental frequency of
the voice. If a complete word is taken, tone variation is
observed, related to the consonant produced, and its nature
of pronunciation (oclusive, fricative, nasal, lateral or
vibrant), and the toney mantains itself constant on a
determined vocal.
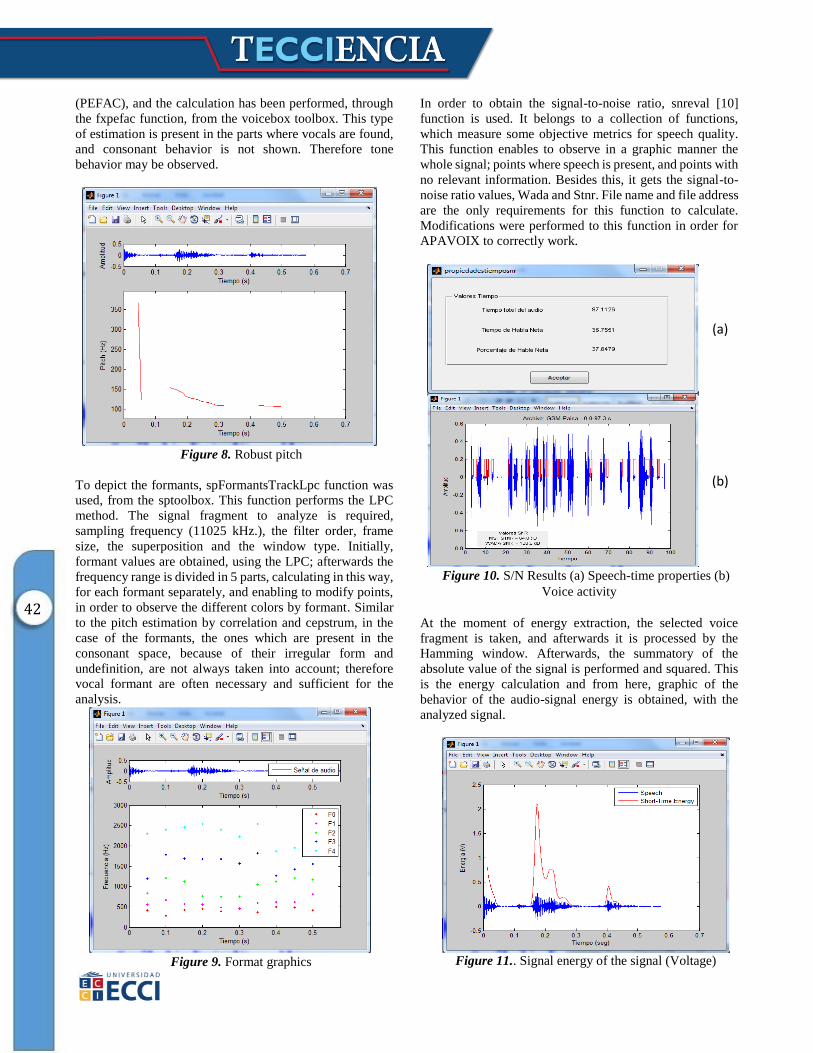
Figure 6. Pitch by Cepstrum
For the pitch calculation (by autocorrelation), the
spPitchTrackCorr function from the sptoolbox is used. This
method enables to have the information of the repetitiveness
of the signal with respect to itself; because of this, the pitch
value, while repeating, not with the same values for the
vocals, but at least close to each other generates a higher
value in the correlation. The highest values are taken and the
relative distances between values are calculated and then the
maximal common divisor of these distances corresponds
with the value of the fundamental period. This also has
periods of great variations, because of the consonants, and
the characteristics of its emission.
Figure 7. Pitch by Auto-Correlation
In order to calculate the robust pitch, a robust tone
estimation filter has been designed for high levels of noise
42
(PEFAC), and the calculation has been performed, through
the fxpefac function, from the voicebox toolbox. This type
of estimation is present in the parts where vocals are found,
and consonant behavior is not shown. Therefore tone
behavior may be observed.
Figure 8. Robust pitch
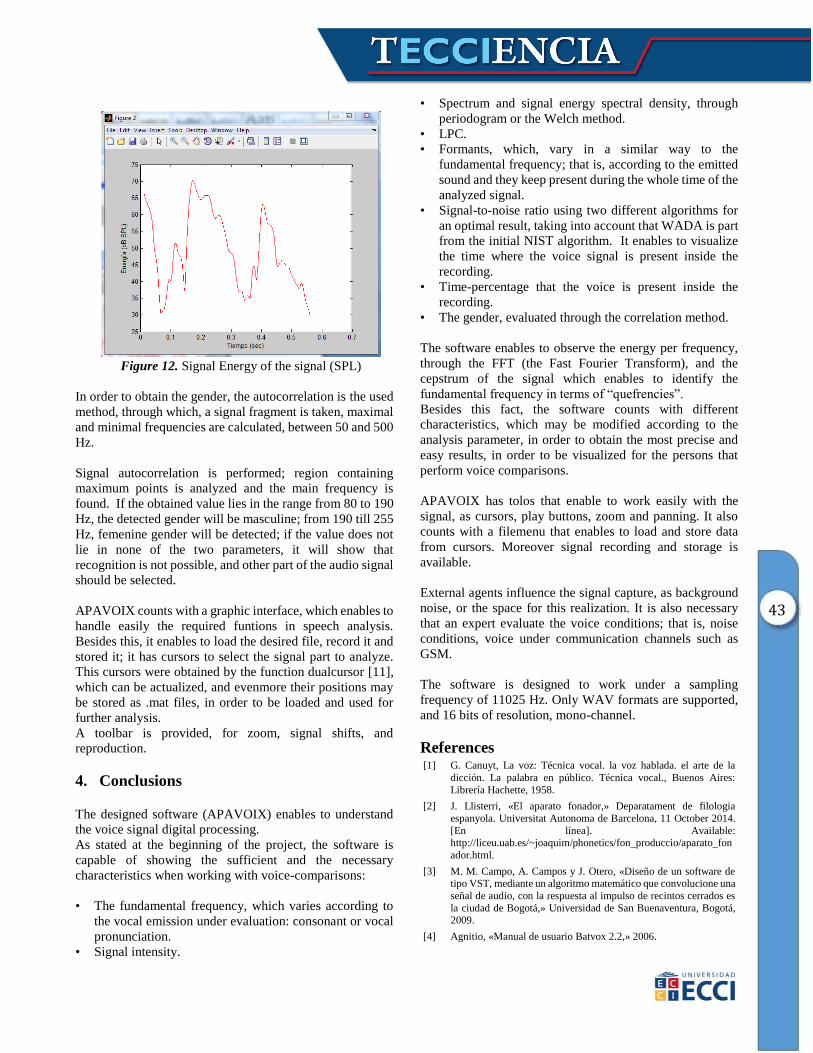
To depict the formants, spFormantsTrackLpc function was
used, from the sptoolbox. This function performs the LPC
method. The signal fragment to analyze is required,
sampling frequency (11025 kHz.), the filter order, frame
size, the superposition and the window type. Initially,
formant values are obtained, using the LPC; afterwards the
frequency range is divided in 5 parts, calculating in this way,
for each formant separately, and enabling to modify points,
in order to observe the different colors by formant. Similar
to the pitch estimation by correlation and cepstrum, in the
case of the formants, the ones which are present in the
consonant space, because of their irregular form and
undefinition, are not always taken into account; therefore
vocal formant are often necessary and sufficient for the
analysis.
Figure 9. Format graphics
In order to obtain the signal-to-noise ratio, snreval [10]
function is used. It belongs to a collection of functions,
which measure some objective metrics for speech quality.
This function enables to observe in a graphic manner the
whole signal; points where speech is present, and points with
no relevant information. Besides this, it gets the signal-to-
noise ratio values, Wada and Stnr. File name and file address
are the only requirements for this function to calculate.
Modifications were performed to this function in order for
APAVOIX to correctly work.
(a)
(b)
Figure 10. S/N Results (a) Speech-time properties (b)
Voice activity
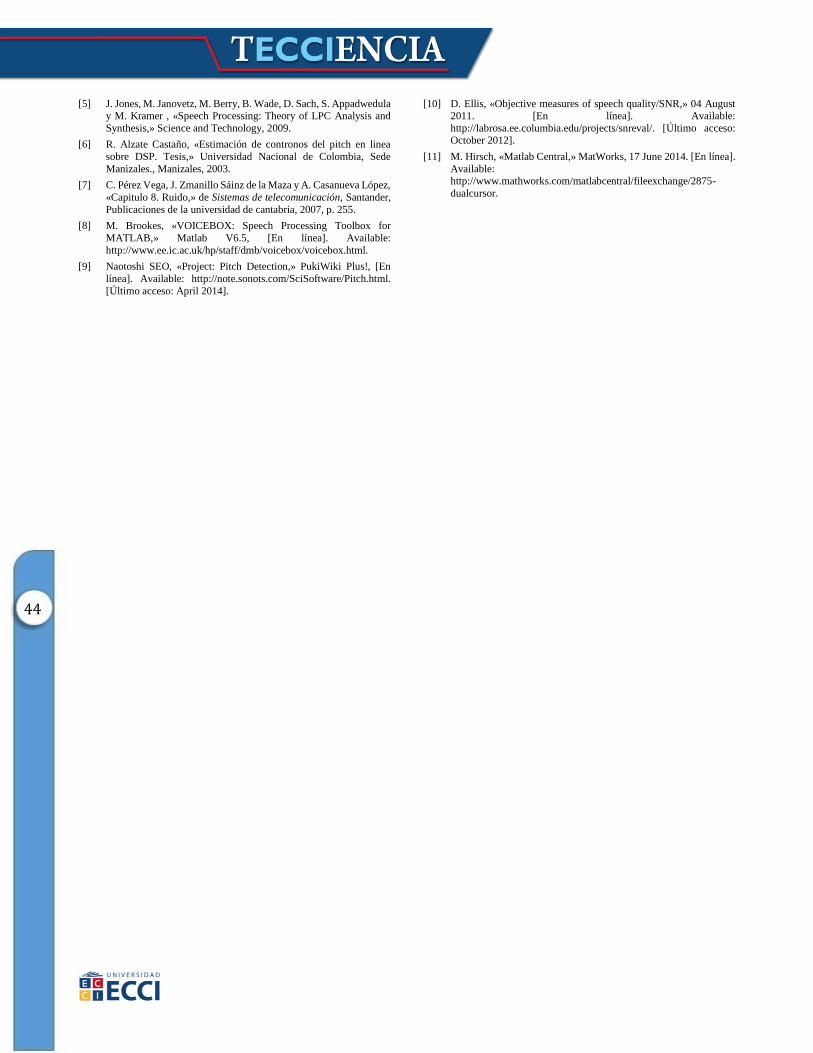
At the moment of energy extraction, the selected voice
fragment is taken, and afterwards it is processed by the
Hamming window. Afterwards, the summatory of the
absolute value of the signal is performed and squared. This
is the energy calculation and from here, graphic of the
behavior of the audio-signal energy is obtained, with the
analyzed signal.
Figure 11.. Signal energy of the signal (Voltage)
43
Figure 12. Signal Energy of the signal (SPL)
In order to obtain the gender, the autocorrelation is the used
method, through which, a signal fragment is taken, maximal
and minimal frequencies are calculated, between 50 and 500
Hz.
Signal autocorrelation is performed; region containing
maximum points is analyzed and the main frequency is
found. If the obtained value lies in the range from 80 to 190
Hz, the detected gender will be masculine; from 190 till 255
Hz, femenine gender will be detected; if the value does not
lie in none of the two parameters, it will show that
recognition is not possible, and other part of the audio signal
should be selected.
APAVOIX counts with a graphic interface, which enables to
handle easily the required funtions in speech analysis.
Besides this, it enables to load the desired file, record it and
stored it; it has cursors to select the signal part to analyze.
This cursors were obtained by the function dualcursor [11],
which can be actualized, and evenmore their positions may
be stored as .mat files, in order to be loaded and used for
further analysis.
A toolbar is provided, for zoom, signal shifts, and
reproduction.
4. Conclusions The designed software (APAVOIX) enables to understand
the voice signal digital processing.
As stated at the beginning of the project, the software is
capable of showing the sufficient and the necessary
characteristics when working with voice-comparisons:
• The fundamental frequency, which varies according to
the vocal emission under evaluation: consonant or vocal
pronunciation.
• Signal intensity.
• Spectrum and signal energy spectral density, through
periodogram or the Welch method.
• LPC.
• Formants, which, vary in a similar way to the
fundamental frequency; that is, according to the emitted
sound and they keep present during the whole time of the
analyzed signal.
• Signal-to-noise ratio using two different algorithms for
an optimal result, taking into account that WADA is part
from the initial NIST algorithm. It enables to visualize
the time where the voice signal is present inside the
recording.
• Time-percentage that the voice is present inside the
recording.
• The gender, evaluated through the correlation method.
The software enables to observe the energy per frequency,
through the FFT (the Fast Fourier Transform), and the
cepstrum of the signal which enables to identify the
fundamental frequency in terms of “quefrencies”.
Besides this fact, the software counts with different
characteristics, which may be modified according to the
analysis parameter, in order to obtain the most precise and
easy results, in order to be visualized for the persons that
perform voice comparisons.
APAVOIX has tolos that enable to work easily with the
signal, as cursors, play buttons, zoom and panning. It also
counts with a filemenu that enables to load and store data
from cursors. Moreover signal recording and storage is
available.
External agents influence the signal capture, as background
noise, or the space for this realization. It is also necessary
that an expert evaluate the voice conditions; that is, noise
conditions, voice under communication channels such as
GSM.
The software is designed to work under a sampling
frequency of 11025 Hz. Only WAV formats are supported,
and 16 bits of resolution, mono-channel.
References
[1] G. Canuyt, La voz: Técnica vocal. la voz hablada. el arte de la
dicción. La palabra en público. Técnica vocal., Buenos Aires:
Librería Hachette, 1958.
[2] J. Llisterri, «El aparato fonador,» Deparatament de filologia
espanyola. Universitat Autonoma de Barcelona, 11 October 2014.
[En línea]. Available: http://liceu.uab.es/~joaquim/phonetics/fon_produccio/aparato_fon
ador.html.
[3] M. M. Campo, A. Campos y J. Otero, «Diseño de un software de tipo VST, mediante un algoritmo matemático que convolucione una
señal de audio, con la respuesta al impulso de recintos cerrados es
la ciudad de Bogotá,» Universidad de San Buenaventura, Bogotá, 2009.
[4] Agnitio, «Manual de usuario Batvox 2.2,» 2006.
44
[5] J. Jones, M. Janovetz, M. Berry, B. Wade, D. Sach, S. Appadwedula y M. Kramer , «Speech Processing: Theory of LPC Analysis and
Synthesis,» Science and Technology, 2009.
[6] R. Alzate Castaño, «Estimación de contronos del pitch en linea
sobre DSP. Tesis,» Universidad Nacional de Colombia, Sede
Manizales., Manizales, 2003.
[7] C. Pérez Vega, J. Zmanillo Sáinz de la Maza y A. Casanueva López,
«Capitulo 8. Ruido,» de Sistemas de telecomunicación, Santander,
Publicaciones de la universidad de cantabria, 2007, p. 255.
[8] M. Brookes, «VOICEBOX: Speech Processing Toolbox for
MATLAB,» Matlab V6.5, [En línea]. Available:
http://www.ee.ic.ac.uk/hp/staff/dmb/voicebox/voicebox.html.
[9] Naotoshi SEO, «Project: Pitch Detection,» PukiWiki Plus!, [En
línea]. Available: http://note.sonots.com/SciSoftware/Pitch.html.
[Último acceso: April 2014].
[10] D. Ellis, «Objective measures of speech quality/SNR,» 04 August 2011. [En línea]. Available:
http://labrosa.ee.columbia.edu/projects/snreval/. [Último acceso: October 2012].
[11] M. Hirsch, «Matlab Central,» MatWorks, 17 June 2014. [En línea].
Available: http://www.mathworks.com/matlabcentral/fileexchange/2875-
dualcursor.