Embed Size (px)
Citation preview
Gingras et al. BMC Evolutionary Biology 2013, 13:134http://www.biomedcentral.com/1471-2148/13/134
RESEARCH ARTICLE Open Access
Phylogenetic signal in the acoustic parameters ofthe advertisement calls of four clades of anuransBruno Gingras1*, Elmira Mohandesan2, Drasko Boko1 and W Tecumseh Fitch1
Abstract
Background: Anuran vocalizations, especially their advertisement calls, are largely species-specific and can be usedto identify taxonomic affiliations. Because anurans are not vocal learners, their vocalizations are generally assumedto have a strong genetic component. This suggests that the degree of similarity between advertisement calls maybe related to large-scale phylogenetic relationships. To test this hypothesis, advertisement calls from 90 speciesbelonging to four large clades (Bufo, Hylinae, Leptodactylus, and Rana) were analyzed. Phylogenetic distances wereestimated based on the DNA sequences of the 12S mitochondrial ribosomal RNA gene, and, for a subset of 49species, on the rhodopsin gene. Mean values for five acoustic parameters (coefficient of variation of root-mean-square amplitude, dominant frequency, spectral flux, spectral irregularity, and spectral flatness) were computed foreach species. We then tested for phylogenetic signal on the body-size-corrected residuals of these five parameters,using three statistical tests (Moran’s I, Mantel, and Blomberg’s K) and three models of genetic distance (pairwisedistances, Abouheif’s proximities, and the variance-covariance matrix derived from the phylogenetic tree).
Results: A significant phylogenetic signal was detected for most acoustic parameters on the 12S dataset, acrossstatistical tests and genetic distance models, both for the entire sample of 90 species and within clades in severalcases. A further analysis on a subset of 49 species using genetic distances derived from rhodopsin and from 12Sbroadly confirmed the results obtained on the larger sample, indicating that the phylogenetic signals observed inthese acoustic parameters can be detected using a variety of genetic distance models derived either from avariable mitochondrial sequence or from a conserved nuclear gene.
Conclusions: We found a robust relationship, in a large number of species, between anuran phylogeneticrelatedness and acoustic similarity in the advertisement calls in a taxon with no evidence for vocal learning, evenafter correcting for the effect of body size. This finding, covering a broad sample of species whose vocalizations arefairly diverse, indicates that the intense selection on certain call characteristics observed in many anurans does noteliminate all acoustic indicators of relatedness. Our approach could potentially be applied to other vocal taxa.
Keywords: Anurans, Molecular phylogeny, Phylogenetic signal, Acoustics, Advertisement calls, Mitochondrial DNA,12 S, Rhodopsin, Bufo, Hylinae, Leptodactylus, Rana
BackgroundAlthough rich and varied, the vocalizations of anurans(frogs and toads) are relatively fixed and show no evidenceof vocal learning [1,2], and are thus presumably mostlygenetically determined. Some basal level of general auditorystimulation may be necessary for the neural developmentof species-typical advertisement calls [3], but call structureitself appears to be highly stereotyped within a species.
* Correspondence: [email protected] of Cognitive Biology, Faculty of Life Sciences, University ofVienna, Althanstrasse 14, Vienna A-1090, AustriaFull list of author information is available at the end of the article
© 2013 Gingras et al.; licensee BioMed CentraCommons Attribution License (http://creativecreproduction in any medium, provided the or
Moreover, anuran vocalizations, especially their advertise-ment calls, differ considerably across species and can oftenbe used reliably to determine species [4,5]. This leadsstraightforwardly to the hypothesis, inspired by Blair [6],that the degree of similarity between advertisement calls inanurans should be related to large-scale phylogeneticrelationships, and that species that are evolutionarily distantwould be expected, on average, to display vocalizations thatare more dissimilar than species that are more closelyrelated. However, a recent study by Tobias et al. [7] foundonly a weak phylogenetic signal in vocalizations ofAfrican clawed frogs, concluding that rapid evolution
l Ltd. This is an Open Access article distributed under the terms of the Creativeommons.org/licenses/by/2.0), which permits unrestricted use, distribution, andiginal work is properly cited.
Gingras et al. BMC Evolutionary Biology 2013, 13:134 Page 2 of 12http://www.biomedcentral.com/1471-2148/13/134
and frequent homoplasy can quickly erase acousticindicators of phylogeny.Detailed comparisons between differences in calling
behavior and phylogenetic distances in vertebrates,involving up to 15 anuran species [8-10], 6 species ofcrested gibbons [11], and 11 deer species [12] can befound in the literature. However, these studies generallyinvolved a small number of closely related species, withfew exceptions such as a broader comparison involving21 species of Bufonidae and Hylidae [13]. There are, toour knowledge, no large-scale studies investigating the linkbetween the acoustic similarity among advertisement callsand the phylogenetic distance on a large number of speciesrepresentative of the broad geographic and taxonomicdistribution of anurans. Moreover, previous studies typicallyrelied upon specific acoustic features that were customizedto the vocalizations of a particular clade, thereby restrictingtheir applicability to a limited range of species.The current study aimed to fill these lacunae, by
comparing acoustic similarity and genetic distance for90 species of anurans belonging to four clades with a widegeographic distribution: Bufo, Hylinae, Leptodactylus, andRana. More precisely, we sought to find a set of low-levelacoustic parameters applicable to distant clades that displaya broad range of vocalization types (the expression“low-level acoustic parameters” refers to parametersthat can be reliably extracted algorithmically in a variety ofacoustic signals, such as spectral flux or dominantfrequency). We then assessed the degree of autocorrelationbetween these acoustic parameters and phylogeneticdissimilarities to estimate the extent to which differencesbetween call acoustics are linked to genetic divergenceamong clades.This investigation is relevant to larger issues relating
to the relative influence of various selective pressures onvocalization characteristics. If, in a taxon of non-vocallearners such as anurans, similarities in certain acousticparameters were consistently related to phylogeneticdistances, it would suggest that phylogenetic constraintsare an important factor in determining those characteristics.On the other hand, when sexual selection is the mainevolutionary force shaping vocalization parameters inanurans, the affected parameters might be expected toexhibit rapid, runaway-style selection, and the link betweenphylogenetic relatedness and acoustic similarity should betenuous, except for closely-related species [14]. Hence, ourcentral aim is to understand whether some call parameterschange slowly enough to retain a reliable signal ofphylogeny across a broad range of clades and species.To estimate phylogenetic distances, we chose the 12S
rRNA region of the mitochondrial DNA (mtDNA), aregion for which complete (or nearly complete) sequencesare available for a large number of anurans and which hasalready been used to analyze relationships among hyloid
frogs [15] and Malagasy reed frogs [8]. Although someauthors have questioned the suitability of mitochondrialDNA for phylogenetic inferences [16,17], the extensiveuse of 12S in anuran phylogenetic studies [18,19] meansthat sequences are available for numerous species, andsuggests that it is appropriate for our purposes. However,a potential issue with using 12S mtDNA is that this geneis prone to rapidly accumulate mutations, thus possiblyleading to saturation in nucleotide substitutions, whichwould potentially decrease the phylogenetic informationcontained in the dataset [20]. Because genetic divergencesin shallower relationships (such as intra-clade comparisons)could be expected to outweigh more distant relationships(such as inter-clade comparisons) in the case of a saturatedgene, this could theoretically bias our analysis towardsshort-range relationships. We addressed this issue in twoways. First, we conducted a saturation test on the 12SmtDNA sequences to assess the degree of saturationpresent in our dataset. Second, we compared the resultsobtained using 12S mtDNA sequences to those obtainedwith the first exon of the rhodopsin gene, a nuclear gene,for a subset of 49 species for which both sequences wereavailable. Nuclear protein-coding single-copy genes such asthe rhodopsin gene have been shown to outperformmitochondrial sequences when analyzing deeper geneticdivergences [21,22]. Note that we do not expect 12S,rhodopsin, or other genes traditionally selected forphylogenetic analysis, to play any direct causal role invocal production: these genes simply serve as proxies foroverall phylogenetic distance. At present, the direct geneticdeterminants of acoustic dissimilarities in the vocalizationsof any vertebrate species remain to be identified.The acoustic properties of advertisement calls were
quantified using mean values computed from a series oflow-level acoustic parameters following the procedurepreviously developed for anurans in [23]. The fiveparameters that this previous study showed to be mostindependent and informative were used: coefficient ofvariation of root-mean-square amplitude (CVA), dominantfrequency (DF), spectral flux (SF), spectral irregularity (SI),and spectral flatness or tonality (TON). CVA refers to thestandard deviation of the root mean square of theamplitude, divided by the true mean (note that, as acoefficient of variation, CVA is a unit-free measureand is thus independent of the absolute intensity ofthe sound or of the distance from the microphone),whereas DF (in Hz) represents the single frequency ofmaximal amplitude in the spectrum. SI is defined asthe sum of the square of the differences in amplitudebetween adjoining partials [24]. SF is a time-varyingdescriptor that corresponds to the Euclidean distancebetween two spectra. Lastly, TON is computed as the ratiobetween the geometric mean and the arithmetic mean ofthe power spectrum [25], with lower values representing

Gingras et al. BMC Evolutionary Biology 2013, 13:134 Page 3 of 12http://www.biomedcentral.com/1471-2148/13/134
more ‘spiky’ spectra, indicating the presence of strongpartials (but not necessarily integer-multiple harmonics).Crucially, these parameters can be measured from a
very wide variety of sounds, unlike some traditionalmeasures such as trill rate that may not be applicable toall species or vocalizations. Moreover, these parametersrefer to well-characterized acoustic properties of thevocalizations that can be directly and automaticallyderived from recordings. These parameters correspondfor the most part to spectral features, and globaltemporal patterning features are not considered in ouranalysis. However, CVA and SF capture local aspects oftemporal variability, and are thus best characterized asspectro-temporal quantities.The acoustic database for this study is derived entirely
from published, commercially-available digital collectionson CDs (listed in Additional file 1). The species in oursample were originally assigned to one of four genera onthe basis of their identification by the recordists: Bufo, Hyla,Leptodactylus, and Rana. Several of the recordingsoriginally assigned to Hyla species on these recordings havesubsequently been reclassified to other genera, but remainwithin the Hylinae subfamily, a monophyletic clade. Here,we follow the nomenclature used by Pyron and Wiens [19],which is more conservative than Frost’s Amphibian Speciesof the World website [26], especially regarding Bufo andRana which mostly retain the composition that they hadprior to Frost et al. [18]. However, given that the genericcontent of several anuran families remains in flux, we avoidreferring specifically to “genera” or “subfamilies”, and willuse the generic term “clades” to refer to our four taxonomicgroupings for the remainder of the article. In anycase, our analysis techniques use genetic distance as aproxy for phylogeny, and are thus robust to changesin systematic nomenclature.Because body size imposes severe constraints on vocal
signals, it is often closely related with the acoustical featuresof animal vocalizations. Indeed, an inverse relationshipbetween body size and call frequency has been documentedin numerous species of anurans (reviewed in [1,27,28]). Inthe case of the parameters selected for our analysis, bothDF and TON were shown in a previous study to beinversely correlated with snout-vent length (SVL, a proxyfor body size) in a sample of 136 species belonging to thefour clades analyzed in the present study [29]. Furthermore,body size is generally strongly autocorrelated with geneticdistance (e.g., [30,31]). It is thus necessary to partial out therelationship between body size and acoustic parametersprior to conducting a phylogenetic signal analysis. Here, wecorrected for the effect of body size by first regressing theacoustic parameters on SVL using phylogenetic generalizedleast squares regression (PGLS) [32,33], and then evaluatingthe autocorrelation between the regressed residuals and thegenetic distances. PGLS regression was used instead of
ordinary least squares regression because ignoringphylogeny in the size-correction procedure can leadto spurious results in the subsequent phylogeneticsignal analysis [34,35], and the PGLS method hasbeen shown to be relatively robust to phylogenetictree misspecification [36].We tested for the presence of a phylogenetic signal in
the size-corrected residuals of the acoustic parametersby applying three different statistical methods: Moran’s Itest [37], Blomberg’s K [31], and the Mantel test [38].Both Moran’s and Mantel tests are general proceduresfor testing for spatial or genetic autocorrelation [39],whereas Blomberg’s K is a descriptive statistic based ona Brownian (random walk) model of trait evolution(BM), with a value of 1 corresponding to the degree oftrait similarity expected under BM. A K of 0 indicatesphylogenetic independence, whereas a K > 1 implies traitsimilarity greater than expected under BM [31]. Incontrast to Moran’s I and Blomberg’s K, which are suitablefor univariate phenotypic traits, the Mantel test can beused to test for a correlation between a multivariate trait(corresponding for instance to a subset of the acousticparameters examined here) and a distance matrix, andits power to detect a phylogenetic signal increasessubstantially with the number of traits [40]. Here, traitdistances were obtained by computing Euclidean distanceson the standardized size-corrected residuals, and the best-fitting multivariate trait distance model was determinedby a stepwise forward procedure (details given in theMethods section).Although Moran’s I, Blomberg’s K, and the Mantel
tests are closely related mathematically [41,42], theirperformance depends heavily on the choice of geneticdistance model [42]. For this reason, we used threedifferent models of genetic distance. The first model,based on the pairwise genetic distance between sequences,does not take into account phylogenetic relationships andcan thus be seen as ‘phylogenetically naïve’. Distancematrices based on this model were used with bothMoran’s and Mantel tests. The second model was basedon Abouheif ’s matrix of phylogenetic proximities [43,44],which has been shown to be a powerful alternative toBlomberg’s K [45], especially for unresolved trees or whenbranch lengths are not accurate [42]. Distances matricesbased on this model were also tested with both Moran’sand Mantel tests. Finally, the genetic distance model usedin Blomberg’s K is a variance-covariance matrix derivedfrom the phylogenetic tree, where the covariance corre-sponds to the branch length from the root to the mostrecent common ancestor. Unlike the previous distancematrices that are not based on an explicit evolutionarymodel [45], the variance-covariance matrix is based on theBM model. All tests were conducted both on the entiresample of 90 species, and on each individual clade.
Gingras et al. BMC Evolutionary Biology 2013, 13:134 Page 4 of 12http://www.biomedcentral.com/1471-2148/13/134
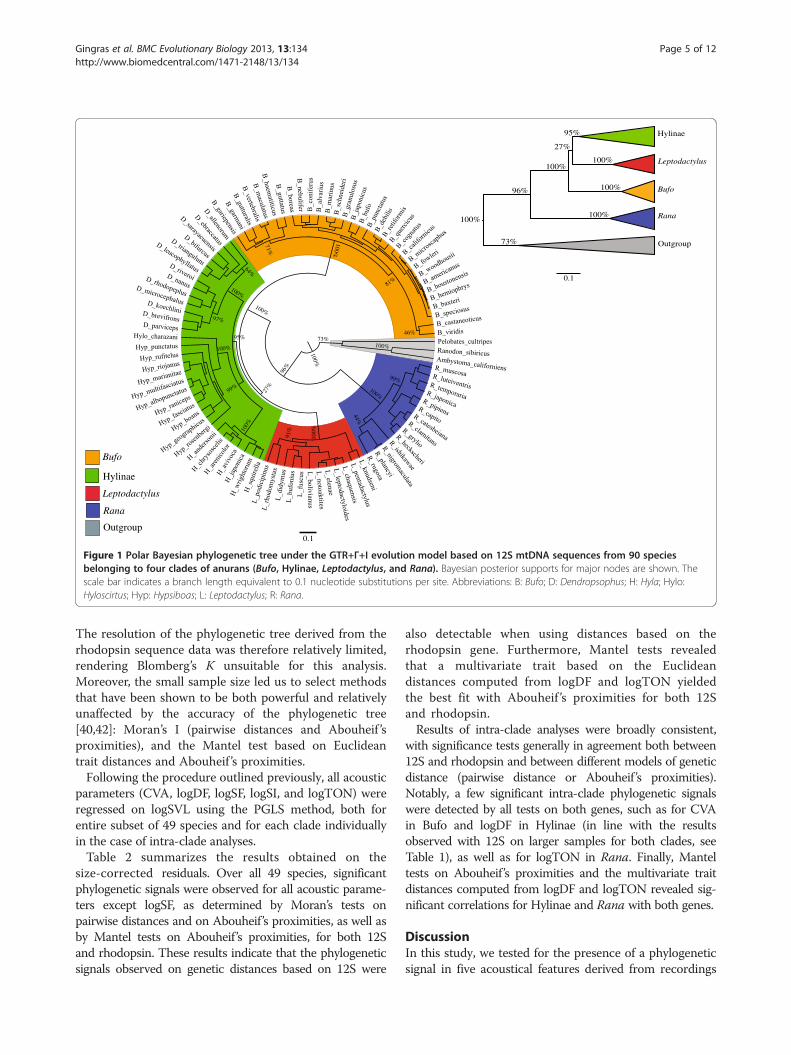
ResultsTesting for saturation in nucleotide substitutions in 12SmtDNA sequencesSubstitution saturation could potentially decrease thephylogenetic information contained in our 12S mtDNAdataset. In order to assess the degree of substitutionsaturation in our dataset, we used a substitution saturationtest implemented in DAMBE (Data Analysis in MolecularBiology and Evolution) [46,47]. This test computes asaturation index, which is compared to a critical valuedetermined for symmetrical and extremely asymmetricaltree topologies. The saturation index was significantlylower than the critical value when performing the analysison fully resolved sites (P < 0.001 for both topologies)and on all sites for a symmetrical topology (P < 0.001),indicating little or no saturation. However, the saturationindex did not significantly differ from the critical valuewhen performing the analysis on all sites for an extremelyasymmetrical tree topology (P = 0.281), meaning that wecannot exclude the possibility of saturation for such atopology, which remains an unlikely one in any event [47].Given that the phylogenetic tree derived from the 12SmtDNA dataset clearly does not correspond to anextremely asymmetrical topology (Figure 1), we concluded,on the basis of these results, that saturation was likely to beminimal in our dataset (detailed results of the saturationtest are provided in Additional file 2).
Testing for phylogenetic signal in acoustic parametersbased on 12S mtDNAFour acoustic parameters (DF, SF, SI, and TON), as wellas SVL, were log-transformed to achieve normality(the values of the acoustic parameters computed foreach recording, as well as the SVL values obtainedfrom the literature, are listed in Additional file 3). All sub-sequent analyses were conducted on the log-transformedvariables. All acoustic parameters (CVA, logDF, logSF,logSI, and logTON) were then phylogenetically regressedon logSVL using the PGLS method, to partial out theeffect of body size [34]. Separate regressions wereconducted for each clade in the case of intra-cladeanalyses to account for the fact that the allometricrelationship between body size and acoustic parametersmay vary across clades [29].Table 1 summarizes the results obtained for all tests
on the size-corrected residuals of the acoustic parameters.Across the entire sample of 90 species, significant values,indicating the presence of a phylogenetic signal, wereobserved for all 5 acoustic parameters using Moran’s teston either the pairwise genetic distances or on Abouheif ’sproximities, and with all parameters except for logSI inthe case of Blomberg’s K. In contrast, the Mantel testrevealed a significant correlation with pairwise distancesonly for logDF and logSI, and no multivariate trait exhibited
a higher correlation than logDF. The discrepancy betweenthe results obtained with Moran’s I and the Mantel test onthe pairwise distances is presumably due to the fact thatMoran’s I tends to be affected by extreme values [48],whereas the Mantel test, which is nearly equivalent toGeary’s C (another measure of spatial autocorrelation, see[49]) in the case of Euclidean distances computed fromunivariate data (see [39], Appendix 1), tends to be moresensitive to local autocorrelation (Geary’s C also reachedsignificance only for logDF and logSI on the pairwisedistances). However, Mantel tests on Abouheif ’s proximitiesyielded significant correlations for all 5 acoustic parameters,in line with Moran’s test, and a multivariate trait based onthe Euclidean distances computed from CVA, logDF, andlogSF provided the best fit. It has been shown that thepower of the Mantel test to detect a phylogeneticsignal is increased by using Euclidean trait distances andAbouheif ’s proximities [40], which may explain why theresults obtained for Moran’s and Mantel tests were morecongruent when using Abouheif ’s proximities. Thus, onthe entire sample, we detected a robust phylogenetic signalin a variety of acoustic parameters, even after removing theconfounding effect of body size.The intra-clade analyses were not as consistent across
statistical methods, which may be due to the reducedpower associated with smaller sample sizes [31,42] and tothe larger influence exerted by local discrepancies betweendifferent models of genetic distance. Nevertheless, weobtained several reliable results that did not depend on aparticular statistical test or genetic distance model, suchas the significant phylogenetic signals observed for CVAand logSF in Bufo, for CVA and logDF in Hylinae, and forlogDF in Rana (the latter was detected by all methodsexcept the Mantel test on pairwise distances). Importantly,Mantel tests on Abouheif ’s proximities and the multi-variate trait distances computed from CVA, logDF,and logSF yielded significant correlations for all fourclades, indicating that a phylogenetic signal associatedwith this multivariate trait was detected on intra-cladegenetic distances in all cases (note that the magnitude ofthe Mantel coefficient is often comparatively small evenwhen statistically significant [50]).
Comparison between 12S mtDNA and rhodopsinIn order to assess the robustness of the phylogeneticsignal detected in our acoustic parameters for these fourclades and to validate our findings by comparing theresults obtained on two genes displaying widely differentmutation rates, we repeated our analysis on a subset of49 species for which genetic data was available for both12S mtDNA and rhodopsin (exon 1). Only three cladeswere represented: Bufo, Hylinae, and Rana. Given thatrhodopsin is a very conserved gene, a number of closelyrelated species harbored identical sequences for exon 1.
Bufo
Hylinae
Leptodactylus
Rana
Outgroup
100%
73%100%
99%
100%
44%
100%
91%100%
99%
100%
95%
97%
100%
64%
100%
71%
100%
81%
46%
27%
96%
0.1
0.1
Hylinae
Leptodactylus
Bufo
Rana
Outgroup
95%
100%
100%
100%
27%
96%
100%100%
73%
Figure 1 Polar Bayesian phylogenetic tree under the GTR+Γ+I evolution model based on 12S mtDNA sequences from 90 speciesbelonging to four clades of anurans (Bufo, Hylinae, Leptodactylus, and Rana). Bayesian posterior supports for major nodes are shown. Thescale bar indicates a branch length equivalent to 0.1 nucleotide substitutions per site. Abbreviations: B: Bufo; D: Dendropsophus; H: Hyla; Hylo:Hyloscirtus; Hyp: Hypsiboas; L: Leptodactylus; R: Rana.
Gingras et al. BMC Evolutionary Biology 2013, 13:134 Page 5 of 12http://www.biomedcentral.com/1471-2148/13/134
The resolution of the phylogenetic tree derived from therhodopsin sequence data was therefore relatively limited,rendering Blomberg’s K unsuitable for this analysis.Moreover, the small sample size led us to select methodsthat have been shown to be both powerful and relativelyunaffected by the accuracy of the phylogenetic tree[40,42]: Moran’s I (pairwise distances and Abouheif ’sproximities), and the Mantel test based on Euclideantrait distances and Abouheif ’s proximities.Following the procedure outlined previously, all acoustic
parameters (CVA, logDF, logSF, logSI, and logTON) wereregressed on logSVL using the PGLS method, both forentire subset of 49 species and for each clade individuallyin the case of intra-clade analyses.Table 2 summarizes the results obtained on the
size-corrected residuals. Over all 49 species, significantphylogenetic signals were observed for all acoustic parame-ters except logSF, as determined by Moran’s tests onpairwise distances and on Abouheif ’s proximities, as well asby Mantel tests on Abouheif ’s proximities, for both 12Sand rhodopsin. These results indicate that the phylogeneticsignals observed on genetic distances based on 12S were
also detectable when using distances based on therhodopsin gene. Furthermore, Mantel tests revealedthat a multivariate trait based on the Euclideandistances computed from logDF and logTON yieldedthe best fit with Abouheif ’s proximities for both 12Sand rhodopsin.Results of intra-clade analyses were broadly consistent,
with significance tests generally in agreement both between12S and rhodopsin and between different models of geneticdistance (pairwise distance or Abouheif ’s proximities).Notably, a few significant intra-clade phylogenetic signalswere detected by all tests on both genes, such as for CVAin Bufo and logDF in Hylinae (in line with the resultsobserved with 12S on larger samples for both clades, seeTable 1), as well as for logTON in Rana. Finally, Manteltests on Abouheif ’s proximities and the multivariate traitdistances computed from logDF and logTON revealed sig-nificant correlations for Hylinae and Rana with both genes.
DiscussionIn this study, we tested for the presence of a phylogeneticsignal in five acoustical features derived from recordings

Table 1 Phylogenetic signal analysis (12S mtDNA) on size-corrected residuals
All species Bufo Hylinae Leptodactylus Rana
(90) (32) (32) (12) (14)
Moran’s I, pairwise distances
CVA 18.01*** 4.60** 2.89* −0.21 1.11
logDF 16.89*** 1.87 4.47** 1.07 3.09*
logSF 4.29** 2.73* 1.71 0.91 −0.04
logSI 8.59*** 0.71 5.92*** 0.35 0.06
logTON 14.61*** 2.82* 2.87* 0.11 1.32
Moran’s I, Abouheif’s proximities
CVA 8.35*** 3.51*** 2.45** 0.93 1.12
logDF 7.62*** 1.30 3.13** 0.99 2.84**
logSF 5.78*** 1.91* 0.97 2.18* 0.19
logSI 4.66*** −0.21 3.04** 0.05 0.26
logTON 5.82*** −0.16 1.60 1.78* 1.08
Blomberg’s K, variance-covariance matrix under BM
CVA 0.346*** 0.545** 0.595** 0.507 0.504
logDF 0.362*** 0.442** 0.551* 0.930* 0.697*
logSF 0.222*** 0.420* 0.382 0.700 0.321
logSI 0.063 0.110 0.497 0.480 0.490
logTON 0.250*** 0.405* 0.425 0.824 0.848*
Mantel r, pairwise distances
logDF 0.335*** 0.017 0.131* 0.288 0.096
Mantel r, Abouheif’s proximities
CVA, logDF, logSF 0.171*** 0.164*** 0.111*** 0.238* 0.223*
Note: All analyses were conducted on the phylogenetically corrected and size-corrected residuals of the acoustic parameters [34]. One-tailed tests were conductedfor all analyses, under the assumption that species that are genetically more related show more similar values for the acoustic parameters. Significance wasestimated using a Monte-Carlo procedure, with 10,000 permutations. For Moran’s I, the values given are the standard deviates of Moran’s I statistic. Mantel rvalues correspond to the best-fitting model (which can be a multivariate trait distance) obtained using a stepwise forward procedure on the entire sample of 90species. * P < 0.05, ** P < 0.01, *** P < 0.001.
Gingras et al. BMC Evolutionary Biology 2013, 13:134 Page 6 of 12http://www.biomedcentral.com/1471-2148/13/134
of anuran vocalizations. These acoustical parameterswere size-regressed using the PGLS method to accountfor phylogeny [34]. We first examined 90 species fromfour clades, using three different models of geneticdistance based on 12S mtDNA sequences, after confirmingthat these sequences displayed little or no substitutionsaturation. A robust phylogenetic signal was detected in atleast four acoustical parameters (CVA, logDF, logSF, andlogTON) when considering all species. Intra-clade analyseswere less consistent but nevertheless yielded multiplereliable results, such as a significant phylogenetic signal inCVA for Bufo and Hylinae, in logDF for Hylinae andRana, and in logSF for Bufo. Notably, a multivariatetrait computed from CVA, logDF, and logSF was signifi-cantly correlated with Abouheif ’s matrix of phylogeneticproximities in all four clades.We then investigated a subset of 49 species from three
of these clades for which sequences were available forboth rhodopsin and 12S mtDNA. Significant phylogeneticsignals were observed over the entire subset for CVA,
logDF, logSI, and logTON, for both 12S and rhodopsin.Significance tests on intra-clade analyses were generally inagreement between 12S and rhodopsin and betweengenetic distance models, and a reliable phylogenetic signalwas found with both genes in CVA for Bufo, logDF forHylinae and logTON for Rana.Because the acoustic parameters used in this study
were chosen on the basis of their ability to classify calls intoone of the four clades studied here [23], the divergencesbetween these parameters computed from advertisementcalls of anurans belonging to different clades were expectedto be greater than those computed from calls of anuransfrom the same clade. Indeed, among these five acousticparameters, CVA, DF, and SF were previously found to beoptimal in discriminating between the vocalizations of theseclades [23], in line with the best-fitting multivariate traitdistance obtained here. However, phylogenetic signals insome of these acoustic parameters were also observedat the intra-clade level in several cases, notably forCVA (Bufo and Hylinae) and logDF (Hylinae and Rana).

Table 2 Comparison between 12S mtDNA and Rhodopsinon size-corrected residuals
All species Bufo Hylinae Rana
(49) (15) (24) (10)
Moran’s I, pairwise distances
CVA 5.07*** 1.97* 1.54 −0.25
3.98** 2.09* 1.29 −0.79
logDF 11.94*** −1.20 7.46*** 2.22*
11.28*** 0.17 6.97*** 2.58*
logSF 0.76 1.28 1.26 1.40
1.21 −0.13 1.81 1.68
logSI 8.02*** 0.58 1.43 −0.06
6.29*** 0.06 1.08 −0.91
logTON 5.56*** 0.52 0.03 3.10**
6.84*** −0.56 0.44 3.59**
Moran’s I, Abouheif’s proximities
CVA 2.75** 2.17* 1.39 −0.33
3.70*** 3.61** 1.40 0.00
logDF 5.80*** −0.83 4.09*** 2.04*
5.09*** −0.63 3.99*** 1.16
logSF 1.11 −0.20 1.00 0.50
1.24 0.46 1.09 1.08
logSI 2.39* −0.99 1.14 0.20
2.79** 1.35 −0.14 −1.89
logTON 2.50** −1.22 0.18 2.20*
3.46*** −1.89 1.50 2.37**
Mantel r, Abouheif’s proximities
logDF, logTON 0.147*** −0.013 0.153** 0.388**
0.137*** −0.111 0.228*** 0.288*
Note: All analyses were conducted on the phylogenetically corrected and size-corrected residuals of the acoustic parameters [34]. Values obtained forgenetic distances models derived from 12S mtDNA sequences are indicated inregular font, whereas values obtained for distance models derived fromrhodopsin sequences are indicated in italics. One-tailed tests were conductedfor all analyses, under the assumption that species that are genetically morerelated show more similar values for the acoustic parameters. Significance wasestimated using a Monte-Carlo procedure, with 10,000 permutations. ForMoran’s I, the values given are the standard deviates of Moran’s I statistic.Mantel r values correspond to the best-fitting model (which can be amultivariate trait distance) obtained using a stepwise forward procedure onthe entire sample of 49 species. * P < 0.05, ** P < 0.01, *** P < 0.001.
Gingras et al. BMC Evolutionary Biology 2013, 13:134 Page 7 of 12http://www.biomedcentral.com/1471-2148/13/134
These results do not follow automatically from ourprevious acoustic classification model, which onlyoperated between clades, did not take into accountbody size and furthermore was generated without apriori knowledge of genetic distances [23]. Thus, thesignificant intra-clade phylogenetic signals we foundstrongly suggest that phylogenetic proximity is, at least inthese clades and for these acoustic features, a powerfuland reliable predictor of the degree of acoustic similaritybetween advertisement calls of anurans.
A possible limitation of the approach followed in thepresent study is that it is based on only one or tworecordings per species. Thus, the values for the acousticparameters computed from the recordings represent alimited sample from a potentially broad range of valuesassociated with our species. However, this is unlikely tosignificantly impact the general conclusions of our study,given that it is based on a large database and that it isconcerned with detecting phylogenetic signals at theclade level. Additionally, the Mantel test on Abouheif ’sproximities, in particular, has been shown to be relativelyrobust to sparse sampling and phenotypic variation withinspecies [40]. Nevertheless, follow-up studies may addressthis issue by sampling several recordings per species.Polyploidy is fairly common in anurans, which can
be problematic for phylogenetic analyses becausepolyploid taxa do not arise by ordinary cladogenesis [51].Furthermore, in the case of allopolyploidy, mitochondrialsequences, being inherited only from the maternal side,may not accurately reflect overall genetic distance.Because genetic distances were estimated from 12S mito-chondrial DNA sequences in the present study, this couldaffect our analysis. However, only two species from oursample, Bufo viridis and Hyla chrysoscelis, are knownpolyploids (see [51], Additional file 1), suggesting thatpolyploidy had, at most, a limited impact on our findings.Ryan [5] observed that characters regulated by behavior
and physiology, such as call rate or amplitude modulation,are less conservative than characters that would requiremodifications of vocal morphology, such as some spectralcharacters. Supporting Ryan’s observation, and in line withour previous study [29], we found that the only parametersthat correlated significantly with body size in our samplewere DF and TON, spectral features that are likely to belargely determined by vocal morphology [52]. However,after controlling for body size, we found that both spectralfeatures and spectro-temporal features such as amplitudemodulation (CVA in our analysis) and spectral fluxexhibited reliable phylogenetic signals, suggesting thatthere is also a tendency toward phylogenetic conservationfor acoustic characters whose link to morphology remainsunclear (although Martin [52] related patterns of amplitudemodulation in Bufo to the presence or absence of well-developed arytenoid valves). Furthermore, while body sizemay impose an indirect evolutionary constraint on acousticparameters, and especially on spectral features such as DF[2,5,53], our results show that the trait similarity observedfor these spectral features is not solely explained by bodysize similarity in related species. In that respect, Ryan [53]suggested that the evolution of call features such as DFmight also be constrained by signaler-receiver interaction.For instance, modifications in the signal may be more likelyto evolve in accordance with preexisting biases in theauditory system of the receiver [54]. Thus, constraints
Gingras et al. BMC Evolutionary Biology 2013, 13:134 Page 8 of 12http://www.biomedcentral.com/1471-2148/13/134
at both production and perceptual levels may beoperative. Finally, the values of Blomberg’s K were lowerthan 1 for all acoustic parameters and in all clades (seeTable 1). Blomberg et al. [31] observed that behavioraltraits were generally more labile (i.e., characterized by Kvalues below 1) than morphological or physiological traits(typically associated with higher K values). Our resultsthus indicate that the strength of the phylogenetic signaldetected in our acoustic parameters is closer to thatobserved for behavioral traits than for morphological traitsin Blomberg et al.’s study [31].Given the central role played by advertisement calls in
mate recognition and sexual selection in anurans, it isnot surprising that bioacoustic features of these callshave been shown to be reliable taxonomical cues at thelocal species level. However, the rate at which thesefeatures evolve can vary between groups [13,53,55] andcall evolution is not always closely related to phylogeneticdistance. A recent study on African clawed frogs in factreported very low phylogenetic signal in the underwatercalls of this highly-derived clade [7]. Our results here,studying airborne calls, clearly document the generaltendency for more closely related species to exhibit moresimilar acoustic features, supporting the hypothesis thatadvertisement call acoustics are at least partly shaped byphylogenetic constraints. Of course, traditional researchtopics such as the potential influence of ecologicalconstraints (e.g. the calling environment or the presence ofsympatric species) [56-58], and other selective pressures,including especially sexual selection [14,59,60], on theevolution of anurans’ vocalizations should not be neglected.Nonetheless, our results suggest that phylogenetic con-straints establish important and persistent ground rules,shaping the landscape within which adaptive calls evolu-tion occurs. The clear phylogenetic signal uncovered inthe present study, across a wide range of anurans with abroad geographical distribution, is consistent with this“phylogenetic constraint” hypothesis.Because the analyses presented here were conducted
using only a few basic parameters that are easily andautomatically measured, and are applicable to a verywide range of sounds, the method described here mayhave broad biological relevance, applicable to manyother clades. Our results indicate an robust relationshipbetween acoustic similarity and genetic relatedness, evenafter partialling out the effect of body size, in a group ofnon-vocal learners whose vocalizations are fairly diverse,from the quasi-mechanical trills typical of many Bufospecies to the whistle-like calls of Leptodactylus [23]. Itremains a topic for further research whether the acousticparameters used to characterize advertisement calls inthe present study would correlate with genetic distancesfor other anuran clades. Nevertheless, our resultshighlight the considerable potential of an approach
based on versatile, low-level acoustic parameters,rather than handpicked, clade-specific characteristics.One key advantage of our approach is that it tends tobe more resistant to over-fitting and does not requireextensive parameterization or manual measurement ofthe acoustic properties of each vocalization, makingthese methods potentially useful for a wide range ofvocalizations and animal species.
ConclusionsWe found robust evidence for the presence of phylogeneticsignals in several acoustic parameters derived fromadvertisement calls in a sample of 90 species representingfour clades of anurans with a wide diversity of call acoustics.Moreover, these phylogenetic signals were detected bothacross the entire sample and, in several cases, withinindividual clades, using several measures of genetic distance.These results were generally validated on a subset of 49species using genetic distances derived from both a highlyvariable mitochondrial region (12S mtDNA) and froma conserved protein-coding nuclear gene (rhodopsin).Because our methodology is based on general acousticfeatures found in most animal vocalizations, we suggestthat the approach implemented here could fruitfully beapplied to other vocal taxa.
MethodsRecordings and acoustic analysisRecordings of anuran vocalizations were digitallycopied as WAV files from commercially available CDs(see Additional file 1) comprising calls from North,South, and Central America, Europe, South Africa, Japanand Korea. Only advertisement calls representing singlemales were used. For each CD track, the longest continuoussequence containing only advertisement calls of a singlemale was extracted using the Praat software, version 5.1.44[61]. Two separate non-identical recordings (obtained fromdifferent CDs and thus presumably different individuals)were used for 41 species. Only one high-quality recordingwas available for the remaining 49 species.The acoustic analysis was conducted using the MIR
Toolbox 1.3.2 in MATLAB [62]. Acoustic parameterswere analyzed using a window of 40 ms with hop-size of20 ms, according to the method described in [23].Mean values for each recording were computed over
all 40-ms frames for the following acoustic parameters:dominant frequency (DF), coefficient of variation of root-mean-square amplitude (CVA), spectral flux (SF), spectralflatness or tonality (TON), and spectral irregularity(SI). These five parameters were found to exhibit lowmulticollinearity in a set of 194 recordings that includedthe 131 recordings used in the current study [23]. For the41 species for which two recordings were available,the mean values were averaged over both recordings;

Gingras et al. BMC Evolutionary Biology 2013, 13:134 Page 9 of 12http://www.biomedcentral.com/1471-2148/13/134
the mean values computed from a single recordingwere used for the remaining 49 species. Detailedvalues for each recording, as well as the mean valuesfor species for which two recordings were available,are given in Additional file 3.Temperature data were available for some of the
recordings and are provided in Additional file 3. Thesedata were sparse and were not analyzed in the presentstudy. In any case, temperature-induced effects on theacoustical properties of calls are presumably relatively smallin comparison to taxonomical or ecological influences [63].Moreover, DF has rarely been shown to be affected bytemperature [28].
Phylogenetic analysisNucleotide sequence alignmentOur genetic dataset consisted of nucleotide sequences ofapproximately 930 bp from the 12S rRNA region ofthe mitochondrial genome (mtDNA) from 90 speciesbelonging to four clades of anurans (Bufo, Hylinae,Leptodactylus, and Rana). As out-group, the same regionof the mtDNA in the Siberian Salamander (Ranodonsibiricus, Family: Hynobiidae), California Tiger Salamander(Ambystoma californiens, Family: Ambystomatidae) andWestern Spadefoot Toad (Pelobates cultripes, Family:Pelobatidae) was used.In addition to the 12S mtDNA sequences, we analyzed
a second dataset consisting of nucleotide sequences of 312bp from exon 1 of the rhodopsin gene from 49 speciesbelonging to three clades (Bufo, Hylinae and Rana).P. cultripes was used as out-group.All 12S and rhodopsin sequences were obtained from
GenBank, using search and extraction tools developed inBiopython [64], and the validity of obtained DNAsequences was checked using BlastSearch (National Centerfor Biotechnology Information). The nucleotide sequenceswere aligned in BioEdit software version 7.0 [65].The Muscle (implemented in the software MEGA) [66],
ClustalW2 [67], and Guidance methods [68] were all testedto obtain a reliable multiple sequence alignment. TheClustalW2 method was eventually used for the multiplesequence alignment on the 12S dataset with the followingparameters: gap open penalties (GOP) = 10, gap extensionpenalties (GEP) = 0.2, gap distance = 5, and the UPGMAclustering method in BioEdit software version 7.0 [65]. Inthe case of the rhodopsin gene, we used the Muscle Codonoption, with GOP= −2.9, GEP = 0 and hydrophobicitymultiplier = 1.2. Some sites were manually edited tomaximize positional homology.
Phylogenetic tree reconstructionThe program jMODELTEST [69,70] was used to identifythe evolutionary models and other parameters. Based onthe Akaike Information Criterion (AICc), the GTR+Γ+I
model (general time-reversible) [71] with a proportion ofinvariant sites (28.6% invariant sites) [72] and rates at othersites varying according to a gamma distribution (gammashape = 0.53, number of discrete gamma categories = 4)best described the 12S sequence data [73,74]. However, theHKY model (Hasegawa-Kishino-Yano) [75] with gammasite heterogeneity model with 4 rate categories for thediscrete approximation of the Gamma distribution ratesamong sites (HKY +Γ) (gamma shape = 0.31) best describedthe rhodopsin data.The phylogenetic relationship among various anuran
clades was reconstructed using the Monte-Carlo MarkovChain (MCMC) model implemented in BEAST version1.6.2 [76]. We used a Yule tree prior that assumes aconstant (unknown) lineage birth rate for each branch inthe tree. This model is suitable for trees describing thephylogenetic relationship among individuals from many dif-ferent species. Wide uniform prior distributions were usedas defaults. A relaxed clock model [77] with uncorrelatedlognormal distribution was used to reconstruct the geneticphylogenies. The MCMC model was run for 30,000,000generations (10,000,000 generations for rhodopsin)with the initial 1,000,000 steps discarded as burn-in.Trees and model parameters were sampled every1000 steps thereafter. Effective Sample Sizes (ESS) formean evolutionary rate, population size and posteriorlikelihood were found to be > 200 for all the modelsused. Subsequently, a single target tree with maximumclade credibility (MCC) and median node heights from asample of trees produced by BEAST were constructedusing TreeAnnotator v1.6.2 [78]. The initial 1000 treeswere discarded as burn-in. Abouheif proximities werecomputed from the phylogenetic trees using the function‘proxTips’ in the package ‘adephylo’ in R [79].
Estimating pairwise genetic distances using maximumlikelihoodPairwise genetic distances for the 12S and rhodopsinnucleotide sequences were computed using the softwareMEGA [66]. Both transition and transversion nucleotidesubstitutions were included in calculating the geneticdistance. Gaps and missing data were treated with thepartial deletion option, and the bootstrap method with500 replications was employed.
Nucleotide substitution saturation testThe nucleotide substitution saturation test was conductedon the 12S mtDNA dataset using DAMBE [46,47].Because the test can only run on 32 taxonomic unitsand our sample included 90 species, 10,000 replicationswith random resampling of subsets of 4, 8, 16, and 32species were conducted, following the methodologydescribed in [47].
Gingras et al. BMC Evolutionary Biology 2013, 13:134 Page 10 of 12http://www.biomedcentral.com/1471-2148/13/134
Snout-vent lengthSVL values in mm for males, taken from the literature,were used as an estimate of male body size [29].Additional file 3 provides the median male SVL values forall 90 species included in this study, and Additional file 1lists the sources used to obtain these data.
Statistical analysisThe phylogenetically corrected residuals of the acousticparameters were computed using the ‘phyl_resid.R’function in R [34]. Following the methodology described in[34], the ‘phyl_resid.R’ function used a variance-covariancematrix representing phylogenetic relatedness under theBrownian trait evolution model, which was computed fromthe phylogenetic tree using the function ‘vcv.phylo’ in thepackage ‘ape’ in R [80]. Multivariate trait Euclidean dis-tances were computed on the standardized size-correctedresiduals of the acoustic parameters using the ‘dist’ functionfrom the package ‘stats’ in R (standardization was appliedto give equal weight to all parameters).The standard deviate of Moran’s autocorrelation
coefficient [37] was computed using the ‘moran.test’function from package ‘spdep’ in R [81]. Statisticalsignificance was assessed by Monte-Carlo simulationsusing the ‘moran.mc’ function from the package ‘spdep’.10,000 permutations were conducted in each case. Geary’sC was computed in the same way using the functions‘geary.test’ and ‘geary.mc’, respectively, from the package‘spdep’. To confirm our analyses on Abouheif ’s proximitiesconducted with the function ‘moran.test’, we used thefunction ‘abouheif.moran’ from the package ‘adephylo’in R [79], and obtained nearly identical results (withinrounding error).Blomberg’s K was computed using the function
‘phylosig’ from the package ‘phytools’ in R [82]. 10,000permutations were conducted for significance tests.Mantel tests were conducted using the ‘mantel’ function
from the package ‘ecodist’ in R [83]. 10,000 permutationswere conducted for significance tests. To determine thebest fit for multivariate trait Euclidean distances, a forwardstepwise procedure was conducted in which an acousticparameter was added to the multivariate trait distancemodel only if the Mantel correlation coefficient obtainedon this distance model was significantly higher than theMantel correlation coefficient obtained on a trait distancemodel that did not include this parameter. Because thereis no formal test of significance to compare two Mantelcorrelation coefficients, we used confidence intervals asestimated by bootstrapping (the confidence intervals werealso estimated with the ‘mantel’ function from the package‘ecodist’). A given Mantel coefficient ‘A’ was considered assignificantly higher than a coefficient ‘B’ when thevalue of ‘A’ was higher than 95% of the values of ‘B’obtained on 10,000 bootstrapping iterations. Note
that, to avoid over-fitting, the forward stepwise procedurewas only conducted on the entire sample (90 species forthe data presented in Table 1, and 49 species for the datapresented in Table 2) and not on individual clades.
Additional files
Additional file 1: List of commercially available CDs providingrecordings for the acoustic analysis, and references from which thesnout-vent length values were obtained.
Additional file 2: Details of the test of saturation in nucleotidesubstitutions.
Additional file 3: Mean values for each acoustic parameter(including values computed from each recording) and male snout-ventlength values for the 90 species included in the analysis. Temperaturedata provided when available.
Competing interestsThe authors declare that they have no competing interests.
Authors’ contributionsBG collected and analyzed acoustic samples, conducted statistical analyses,and co-wrote the paper, EM collected and analyzed genetic sequences andco-wrote the paper, DB collected genetic sequences, TF designed the studyand co-wrote the paper. All authors approved the final version of themanuscript.
AcknowledgementsThis research was supported by ERC Advanced Grant SOMACCA No. 230604and a University of Vienna startup grant to W.T.F. We thank Walter Hödl, CarlGerhardt, and four anonymous reviewers for very useful comments andsuggestions, Jinook Oh for help with the Korean and Japanese frog CDnotes, and Paolo Vatta for help with Biopython.
Author details1Department of Cognitive Biology, Faculty of Life Sciences, University ofVienna, Althanstrasse 14, Vienna A-1090, Austria. 2Institute of PopulationGenetics, University of Veterinary Medicine of Vienna, Veterinärplatz 1, ViennaA-1210, Austria.
Received: 18 December 2012 Accepted: 12 June 2013Published: 1 July 2013
References1. Duellman W, Trueb L: Biology of amphibians. Baltimore: Johns Hopkins
University Press; 1994.2. Gerhardt HC: The evolution of vocalization in frogs and toads. Annu Rev
Ecol Syst 1994, 25:293–324.3. Dawson B, Ryan MJ: Early experience leads to changes in the advertisement
calls of male Physalaemus pustulosus. Copeia 2009, 2009:221–226.4. Littlejohn MJ: Call differentiation in a complex of seven species of Crinia
(Anura, Leptodactylidae). Evolution 1959, 13:452–268.5. Ryan MJ: Constraints and patterns in the evolution of anuran acoustic
communication. In The evolution of the amphibian auditory system. Editedby Fritzch B, Ryan MJ, Wilczynski W, Hetherington TE, Walkowiak W. NewYork: Wiley; 1988:637–677.
6. Blair WF: Mating call in the speciation of anuran amphibians. Am Nat1958, 92:27–51.
7. Tobias ML, Evans BJ, Kelley DB: Evolution of advertisement calls in Africanclawed frogs. Behaviour 2011, 148:519–549.
8. Wollenberg KC, Glaw F, Meyer A, Vences M: Molecular phylogeny ofMalagasy reed frogs, Heterixalus, and the relative performance ofbioacoustics and color-patterns for resolving their systematics.Mol Phylogenet Evol 2007, 45:14–22.
9. Lehtinen RM, Wojtowicz EA, Hailey A: Male vocalizations, femalediscrimination and molecular phylogeny: multiple perspectives on thetaxonomic status of a critically endangered Caribbean frog. J Zool 2011,283:117–125.
Gingras et al. BMC Evolutionary Biology 2013, 13:134 Page 11 of 12http://www.biomedcentral.com/1471-2148/13/134
10. Goicoechea N, De La Riva I, Padial JM: Recovering phylogenetic signalfrom frog mating calls. Zool Scr 2010, 39:141–154.
11. Thinh V, Hallam C, Roos C, Hammerschmidt K: Concordance betweenvocal and genetic diversity in crested gibbons. BMC Evol Biol 2011, 11:36.
12. Cap H, Deleporte P, Joachim J, Reby D: Male vocal behavior andphylogeny in deer. Cladistics 2008, 24:917–931.
13. Cocroft RB, Ryan MJ: Patterns of advertisement call evolution in toadsand chorus frogs. Anim Behav 1995, 49:283–303.
14. Ryan MJ: Sexual selection and communication in frogs. Trends Ecol Evol1991, 6:351–355.
15. Darst CR, Cannatella DC: Novel relationships among hyloid frogs inferredfrom 12S and 16S mitochondrial DNA sequences. Mol Phylogenet Evol2004, 31:462–475.
16. Shaw KL: Conflict between nuclear and mitochondrial DNA phylogeniesof a recent species radiation: What mtDNA reveals and conceals aboutmodes of speciation in Hawaiian crickets. Proc Natl Acad Sci USA 2002,99:16122–16127.
17. Hurst GD, Jiggins FM: Problems with mitochondrial DNA as a marker inpopulation, phylogeographic and phylogenetic studies: the effects ofinherited symbionts. Proc Biol Sci 2005, 272:1525–1534.
18. Frost DR, Grant T, Faivovich J, Bain RH, Haas A, Haddad CFB, de Sá RO,Channing A, Wilkinson M, Donnellan SC, Raxworthy CJ, Campbell JA, BlottoBL, Moler P, Drewes RC, Nussbaum RA, Lynch JD, Green DM, Wheeler WC:The amphibian tree of life. Bull Am Mus Nat Hist 2006, 297:1–370.
19. Pyron RA, Wiens JJ: A large-scale phylogeny of Amphibia including over2800 species, and a revised classification of extant frogs, salamanders,and caecilians. Mol Phylogenet Evol 2011, 61:543–583.
20. Hertwig S, De Sá RO, Haas A: Phylogenetic signal and the utility of 12Sand 16S mtDNA in frog phylogeny. J Zoolog Syst Evol Res 2008, 42:2–18.
21. Springer MS, DeBry RW, Douady C, Amrine HM, Madsen O, de Jong WW,Stanhope MJ: Mitochondrial versus nuclear gene sequences in deep-levelmammalian phylogeny reconstruction. Mol Biol Evol 2001, 18:132–143.
22. Hoegg S, Vences M, Brinkmann H, Meyer A: Phylogeny and comparativesubstitution rates of frogs inferred from sequences of three nucleargenes. Mol Biol Evol 2004, 21:1188–1200.
23. Gingras B, Fitch WT: A three-parameter model for classifying anurans intofour genera based on advertisement calls. J Acoust Soc Am 2013,133:547–559.
24. Jensen K, Andersen TH: Real-time beat estimation using featureextraction. In Computer Music Modeling and Retrieval, Volume 2771. Editedby Wiil UK. Berlin, Heidelberg: Springer Berlin Heidelberg; 2004:13–22.
25. Dubnov S: Generalization of spectral flatness measure for non-Gaussianlinear processes. IEEE Signal Process Lett 2004, 11:698–701.
26. Amphibian species of the world: an online reference. Version 5.5. http://research.amnh.org/vz/herpetology/amphibia/.
27. Fitch WT, Hauser MD: Unpacking “honesty”: vertebrate vocal productionand the evolution of acoustic signals. In Acoustic Communication. Editedby Simmons AM, Fay RF, Popper AN. New York: Springer; 2002:65–137.
28. Gerhardt HC, Huber F: Acoustic Communication in Insects and Anurans:Common Problems and Diverse Solutions. Chicago: University of ChicagoPress; 2002.
29. Gingras B, Boeckle M, Herbst CT, Fitch WT: Call acoustics reflect body sizeacross four clades of anurans. J Zool 2013, 289:143–150.
30. Freckleton RP, Jetz W: Space versus phylogeny: disentanglingphylogenetic and spatial signals in comparative data. Proc Biol Sci 2009,276:21–30.
31. Blomberg SP, Garland T Jr, Ives AR: Testing for phylogenetic signal incomparative data: behavioral traits are more labile. Evolution 2003,57:717–745.
32. Felsenstein J: Phylogenies and the comparative method. Am Nat 1985,125:1–15.
33. Grafen A: The phylogenetic regression. Phil Trans R Soc B 1989,326:119–157.
34. Revell LJ: Size-correction and principal components for interspecificcomparative studies. Evolution 2009, 63:3258–3268.
35. Rohlf FJ: A comment on phylogenetic correction. Evolution 2006,60:1509–1515.
36. Stone EA: Why the phylogenetic regression appears robust to treemisspecification. Syst Biol 2011, 60:245–260.
37. Moran PAP: Notes on continuous stochastic phenomena. Biometrika 1950,37:17–23.
38. Mantel N: The detection of disease clustering and a generalizedregression approach. Cancer Res 1967, 27:209–220.
39. Borcard D, Legendre P: Is the Mantel correlogram powerful enough to beuseful in ecological analysis? A simulation study. Ecology 2012,93:1473–1481.
40. Hardy OJ, Pavoine S: Assessing phylogenetic signal with measurementerror: A comparison of Mantel tests, Blomberg et al.’s K, andphylogenetic distograms. Evolution 2012, 66:2614–2621.
41. Diniz-Filho JAF, Santos T, Rangel TF, Bini LM: A comparison of metrics forestimating phylogenetic signal under alternative evolutionary models.Genet Mol Biol 2012, 35:673–679.
42. Pavoine S, Ricotta C: Testing for phylogenetic signal in biological traits:The ubiquity of cross-product statistics. Evolution 2013, 67:828–840.
43. Abouheif E: A method for testing the assumption of phylogeneticindependence in comparative data. Evol Ecol Res 1999, 1:895–909.
44. Pavoine S, Ollier S, Pontier D, Chessel D: Testing for phylogenetic signal inphenotypic traits: new matrices of phylogenetic proximities. Theor PopulBiol 2008, 73:79–91.
45. Münkemüller T, Lavergne S, Bzeznik B, Dray S, Jombart T, Schiffers K, ThuillerW: How to measure and test phylogenetic signal. Methods Ecol Evol 2012,3:743–756.
46. Xia X, Xie Z, Salemi M, Chen L, Wang Y: An index of substitutionsaturation and its application. Mol Phylogenet Evol 2003, 26:1–7.
47. Xia X, Lemey P: Assessing substitution saturation with DAMBE. In ThePhylogenetic Handbook: A Practical Approach to DNA and Protein Phylogeny.2nd edition. Edited by Lemey P, Salemi M, Vandamme A-M. Cambridge:Cambridge University Press; 2009:615–630.
48. Legendre P, Fortin MJ: Spatial pattern and ecological analysis. Plant Ecol1989, 80:107–138.
49. Geary RC: The contiguity ratio and statistical mapping. Inc Stat 1954,5:115–127.
50. Dutilleul P, Stockwell JD, Frigon D, Legendre P: The Mantel test versusPearson’s correlation analysis: Assessment of the differences for biologicaland environmental studies. J Agric Biol Environ Stat 2000, 5:131–150.
51. Mable BK, Alexandrou MA, Taylor MI: Genome duplication in amphibiansand fish: an extended synthesis. J Zool 2011, 284:151–182.
52. Martin WF: Evolution of vocalizations in the genus Bufo. In Evolution in theGenus Bufo. Edited by Blair WF. Austin, Texas: University of Texas; 1972:279–309.
53. Ryan MJ: Factors influencing the evolution of acoustic communication:biological constraints. Brain Behav Evol 1986, 28:70–82.
54. Ryan MJ, Fox JH, Wilczynski W, Rand AS: Sexual selection for sensoryexploitation in the frog Physalaemus pustulosus. Nature 1990, 343:66–67.
55. Richards CL: Has the evolution of complexity in the amphibian papillainfluenced anuran speciation rates? J Evol Biol 2006, 19:1222–1230.
56. Zimmerman BL: A comparison of structural features of calls of open andforest habitat frog species in the Central Amazon. Herpetologica 1983,39:235–246.
57. Kime NM, Turner WR, Ryan MJ: The transmission of advertisement calls inCentral American frogs. Behav Ecol 2000, 11:71–83.
58. Amezquita A, Flechas SV, Lima AP, Gasser H, Hodl W: Acoustic interferenceand recognition space within a complex assemblage of dendrobatidfrogs. Proc Natl Acad Sci USA 2011, 108:17058–17063.
59. Bee MA, Perrill SA, Owen PC: Male green frogs lower the pitch of acousticsignals in defense of territories: a possible dishonest signal of size?Behav Ecol 2000, 11:169–177.
60. Wagner WE: Deceptive or honest signalling of fighting ability? A test ofalternative hypotheses for the function of changes in call dominantfrequency by male cricket frogs. Anim Behav 1992, 44:449–462.
61. Boersma P, Weenink D: Praat. doing phonetics by computer (Version 5.1.44).[Computer program]. [http://www.praat.org/].
62. Lartillot O, Toiviainen P, Eerola T: A Matlab toolbox for music informationretrieval. In Data Analysis, Machine Learning and Applications. Edited byPreisach C, Burkhardt H, Schmidt-Thieme L, Decker R. Berlin, Heidelberg:Springer Berlin Heidelberg; 2008:261–268.
63. Hoskin CJ, James S, Grigg GC: Ecology and taxonomy-driven deviations inthe frog call-body size relationship across the diverse Australian frogfauna. J Zool 2009, 278:36–41.
64. Cock PJA, Antao T, Chang JT, Chapman BA, Cox CJ, Dalke A, Friedberg I,Hamelryck T, Kauff F, Wilczynski B, de Hoon MJL: Biopython: freelyavailable Python tools for computational molecular biology andbioinformatics. Bioinformatics 2009, 25:1422–1423.

Gingras et al. BMC Evolutionary Biology 2013, 13:134 Page 12 of 12http://www.biomedcentral.com/1471-2148/13/134
65. Hall TA: BioEdit: a user-friendly biological sequence alignment editor forWindows 95/98/NT. Nucleic Acids Symp Ser 1999, 41:95–98.
66. Tamura K, Peterson D, Peterson N, Stecher G, Nei M, Kumar S: MEGA5:molecular evolutionary genetics analysis using maximum likelihood,evolutionary distance, and maximum parsimony methods. Mol Biol Evol2011, 28:2731–2739.
67. Thompson JD, Higgins DG, Gibson TJ: CLUSTAL W: Improving thesensitivity of progressive multiple sequence alignment throughsequence weighting, position-specific gap penalties and weight matrixchoice. Nucleic Acids Res 1994, 22:4673–4680.
68. Penn O, Privman E, Ashkenazy H, Landan G, Graur D, Pupko T: GUIDANCE:A web server for assessing alignment confidence scores. Nucleic Acids Res2010, 38:W23–W28.
69. Guindon S, Gascuel O: A simple, fast, and accurate algorithm to estimatelarge phylogenies by maximum likelihood. Syst Biol 2003, 52:696–704.
70. Posada D: jModelTest: phylogenetic model averaging. Mol Biol Evol 2008,25:1253–1256.
71. Rodríguez F, Oliver JL, Marín A, Medina JR: The general stochastic modelof nucleotide substitution. J Theor Biol 1990, 142:485–501.
72. Gu X, Fu YX, Li WH: Maximum likelihood estimation of the heterogeneityof substitution rate among nucleotide sites. Mol Biol Evol 1995,12:546–557.
73. Yang Z: Maximum-likelihood estimation of phylogeny from DNAsequences when substitution rates differ over sites. Mol Biol Evol 1993,10:1396–1401.
74. Yang Z: Maximum likelihood phylogenetic estimation from DNAsequences with variable rates over sites: approximate methods. J MolEvol 1994, 39:306–314.
75. Hasegawa M, Kishino H, Yano T: Dating of the human-ape splitting by amolecular clock of mitochondrial DNA. J Mol Evol 1985, 22:160–174.
76. Drummond AJ, Rambaut A: BEAST: Bayesian evolutionary analysis bysampling trees. BMC Evol Biol 2007, 7:214.
77. Drummond AJ, Ho SYW, Phillips MJ, Rambaut A: Relaxed phylogeneticsand dating with confidence. PLoS Biol 2006, 4:e88.
78. Drummond AJ, Ho SYW, Rawlence N, Rambaut A: A rough guide to BEAST1.4. University of Auckland: Auckland, New Zealand; 2007.
79. Jombart T, Balloux F, Dray S: adephylo: new tools for investigating thephylogenetic signal in biological traits. Bioinformatics 2010, 26:1907–1909.
80. Paradis E, Claude J, Strimmer K: APE: Analyses of Phylogenetics andEvolution in R language. Bioinformatics 2004, 20:289–290.
81. Bivand R: Implementing spatial data analysis software tools in R.Geogr Anal 2006, 38:23–40.
82. Revell LJ: phytools: an R package for phylogenetic comparative biology(and other things). Methods Ecol Evol 2012, 3:217–223.
83. Goslee SC, Urban DL: The ecodist package for dissimilarity-based analysisof ecological data. J Stat Softw 2007, 22:1–19.
doi:10.1186/1471-2148-13-134Cite this article as: Gingras et al.: Phylogenetic signal in the acousticparameters of the advertisement calls of four clades of anurans. BMCEvolutionary Biology 2013 13:134.
Submit your next manuscript to BioMed Centraland take full advantage of:
• Convenient online submission
• Thorough peer review
• No space constraints or color figure charges
• Immediate publication on acceptance
• Inclusion in PubMed, CAS, Scopus and Google Scholar
• Research which is freely available for redistribution
Submit your manuscript at www.biomedcentral.com/submit


![Measuring room acoustic parameters using a head and torso ... · Table 1: Acoustic parameter values measured on position R1, according to ISO 3382-1 Room acoustic Octave band [Hz]](https://img.pdfslide.us/doc/110x75/5c6614a609d3f20f218bbe3c/measuring-room-acoustic-parameters-using-a-head-and-torso-table-1-acoustic.jpg)