Embed Size (px)
Citation preview
LETTER Earth Planets Space, 60, 133–138, 2008
Numerical simulation of the tsunami generated by the 2007 Noto HantoEarthquake and implications for unusual tidal surges
observed in Toyama Bay
Ikuo Abe1, Kazuhisa Goto1, Fumihiko Imamura1, and Katsuyoshi Shimizu2
1Disaster Control Research Center, Graduate School of Engineering, Tohoku University, Aoba 06-6-11-1106, Aramaki, Sendai 980-8579, Japan2Marine Information Division, Port and Airport Research Institute, 3-1-1 Nagase, Yokosuka 239-0826, Japan
(Received June 30, 2007; Revised September 18, 2007; Accepted October 4, 2007; Online published February 19, 2008)
We conducted a numerical analysis of the tsunami generated by the 2007 Noto Hanto Earthquake (Mj = 6.9)that occurred on 25 March 2007 near the Noto Peninsula on the northwest coast of Honshu Island, Japan. Ournumerical simulation reproduced well the behaviors of the tsunami as recorded at the Wajima tidal observatoryand showed that the computed tsunami arrived in Toyama Bay more than 1 h after the earthquake. However,a crew of a small boat in the bay felt the shock and, despite calm weather conditions, their boat capsized just3 min after the earthquake. Although abnormal tidal surges were recorded at several locations around ToyamaBay, the timing of these is inconsistent with the surges being a direct result of the tsunami generated at the sourcearea of the earthquake. We used “backward wave propagation analysis” to estimate the likely source area of theabnormal tidal surges in the bay and carried out the a simulation of landslide-induced tsunami. Our conclusion isthat these abnormal tidal surges were likely caused by a submarine landslide on the steep sea floor on the westernside of Toyama Bay.Key words: The 2007 Noto Hanto Earthquake, tsunami, Toyama Bay, abnormal wave.
1. IntroductionAt 9:42 a.m. (Japan Standard Time) on 25 March 2007,
an earthquake occurred near the Noto Peninsula (37.19◦,136.55◦), Japan. The Japan Meteorological Agency (JMA)estimated the earthquake was of magnitude 6.9. A tsunamiwas generated by the earthquake and arrived at Wajima(Fig. 1(a)) at about 10:04 a.m. The maximum height of thewave was 8 cm (Fig. 1(b)).
Sharp tidal surges were also recorded at three tidal obser-vatories (Fig. 1(a)) within Toyama bay just 5 min after theearthquake (Fig. 2). The short interval between the earth-quake and the tidal surge suggests, however, that the surgemay not have been a tsunami generated directly by faultmovement at the seismic source off the Noto Peninsula.The tsunami from the earthquake would have required atleast several tens of minutes to an hour to propagate aroundthe Noto Peninsula over a distance of more than 200 kmto reach Toyama Bay (Fig. 1(a)). However, it is notewor-thy that a small boat capsized in Toyama Bay immediatelyafter the earthquake (Prime Minister of Japan and His Cab-inet, 2007). According to the boat crew, the weather wasfine with no strong waves or swell before the boat sud-denly capsized shortly after the crew heard a radio reportof the earthquake at around 9:45 a.m. Therefore, it is diffi-cult to attribute the boat’s capsize to the tsunami generatedby fault movement at the seismic source. On the basis of
Copyright c© The Society of Geomagnetism and Earth, Planetary and Space Sci-ences (SGEPSS); The Seismological Society of Japan; The Volcanological Societyof Japan; The Geodetic Society of Japan; The Japanese Society for Planetary Sci-ences; TERRAPUB.
these observations, we speculate that unusual phenomenamay have occurred locally in Toyama Bay immediately fol-lowing the earthquake. In the study reported here, we un-dertook a numerical analysis of the tsunami generated bythe 2007 Noto Hanto Earthquake with the aim of modelingthe generation and propagation of the tsunami and estimat-ing its arrival time in Toyama Bay. We also investigated thepossible cause of the unusual tidal surge in Toyama Bay byusing back-propagation analysis to determine the source ofthe observed wave.
2. Numerical Calculation of the Tsunami Gener-ated by the 2007 Noto Hanto Earthquake
2.1 Method for the numerical calculationWe calculated a propagation model of the tsunami using
the fault model proposed by the Geographical Survey Insti-tute (GSI) (2007). This is a fault that is 21.2 km long and13.9 km wide. The upper depth of the fault is 1.2 km, andit has a strike of 55◦, a dip at 63◦, with a slip angle of 137◦,and a dislocation of 1.65 m. The water-level distributionimmediately after movement on the fault plane (Fig. 1(a))was calculated using fault parameters from Mansinha andSmylie (1971). We applied a model for tsunami propagationand inundation that uses non-linear shallow-water equa-tions, including a bottom-friction term (Imamura, 1995).This model uses a finite-difference method, which is knownas the staggered leap-frog method. We used bathymetricdata with a 150- and 450-m grid-cell size. The calculationtime was 3 h and the time-step interval was 0.1 s.
133
134 I. ABE et al.: NUMERICAL SIMULATION OF THE TSUNAMI GENERATED BY THE 2007 NOTO HANTO EARTHQUAKE
(b)
observed
calculated
9:00 10:00 11:00 12:00 13:00 JST
8cm
8cm
0
0
Wajima
earthquake generation
earthquake generation
(b)
observed
calculated
9:00 0:00 11:00 12:00 13:00 JST
8cm
8cm
0
0
Wajima
earthquake generation
earthquake generation
N
-0.1 m
+0.1 m+0.2 m
Tsunami source
FushikiToyama
Boat capsize
Himi CityUozu City
Shinminato
Noto Peninsula
Wajima
Toyama Bay Nanao
10km
(a)
137
37
NN
-0.1 m
+0.1 m+0.2 m
Tsunami source
FushikiToyama
Boat capsize
Himi CityUozu City
Shinminato
Noto Peninsula
Wajima
Toyama Bay Nanao
10km10km
(a)
Fig. 1. (a) Map of the study area showing the tsunami source area,locations of tidal observatories (gray circles), and cities from whichweather records were obtained (gray triangles). The contours at tsunamisource show the vertical disturbance of water by the 2007 Noto HantoEarthquake (0.1-m interval). (b) Comparison of computed and observedtidal data at Wajima. Observed tidal data was provided by the Port andAirport Research Institute.
2.2 Results and discussionAccording to the record at the Wajima tidal observatory
on the northern coast of the Noto Peninsula, a tsunamigenerated by the earthquake arrived at Wajima at about10:04 a.m. Its maximum wave height was 8 cm (Fig. 1(b)).The modeled arrival time of the first tsunami was approx-imately 10:03 a.m. and its wave height was estimated as7 cm (Fig. 1(b)). These modeled results are consistent withthe observations.
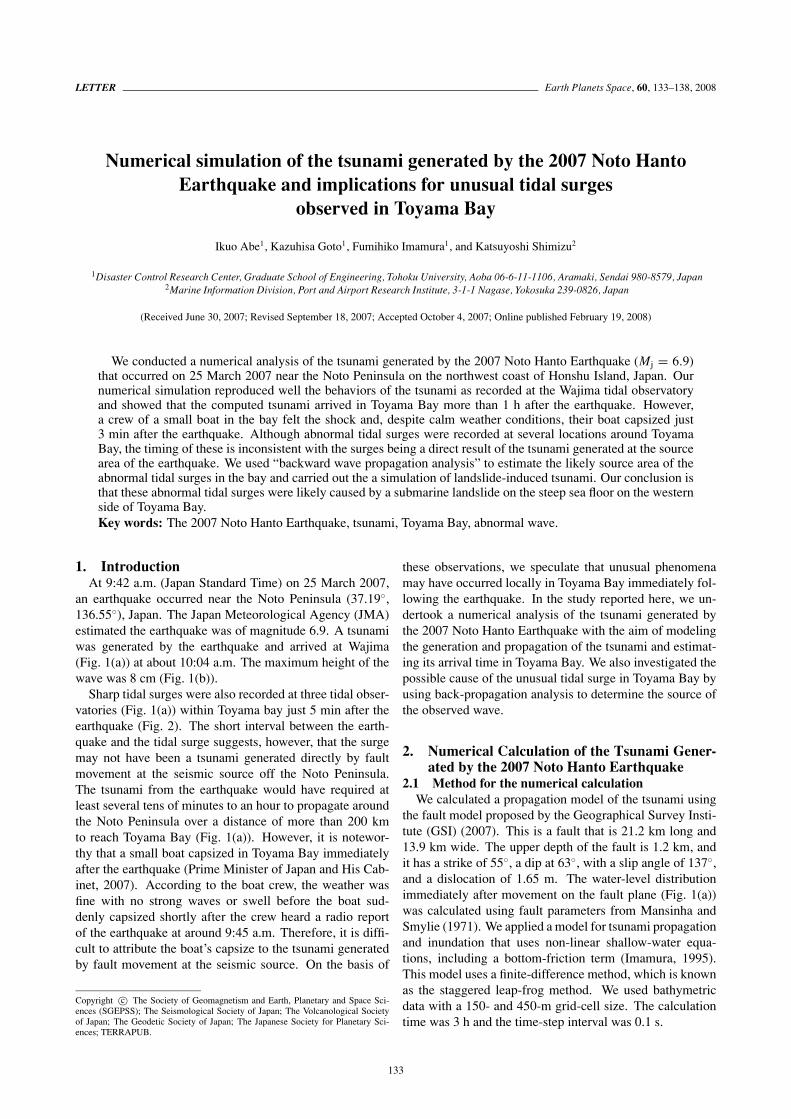
Tidal surges were also recorded at observatories inToyama Bay (Fig. 2). At the Toyama observatory, a suddensea level rise started at 9:45 a.m. and peaked at 9:47 a.m.(Fig. 2(a)). At the Fushiki observatory, the sea level startedto drop suddenly at 9:46 a.m., reaching its lowest level at9:49 a.m. (Fig. 2(b)). Similarly, at the Shinminato observa-tory, a sudden drop of sea level started at 9:49 a.m., reachingits minimum level at 9:51 a.m. (Fig. 2(c)). No tidal changewas recorded at the Nanao observatory immediately afterthe earthquake (Fig. 2(d)).
Figure 3 shows wave front lines of our modeled tsunamipropagation at every 10 min after the earthquake genera-tion. The modeled tsunami arrived at Toyama Bay 75 min(10:57 a.m.) after the earthquake generation (Fig. 3). This
observed
calculated
4cm
4cm
0
0
9:00 10:00 11:00 12:00 13:00 JST
Toyama
earthquake generation
earthquake generation
9:47
tsunami arrival
(a)
observed
calculated
4cm
4cm
0
0
9:00 10:00 11:00 12:00 13:00 JST
Toyama
earthquake generation
earthquake generation
9:47
tsunami arrivaltsunami arrival
(a)
observed
calculated
4cm
4cm
9:00 10:00 11:00 12:00 13:00 JST
Fushiki
earthquake generation
earthquake generation
0
0
tsunami arrival
9:49
(b)
observed
calculated
4cm
4cm
9:00 10:00 11:00 12:00 13:00 JST
Fushiki
earthquake generation
earthquake generation
0
0
tsunami arrivaltsunami arrival
9:49
(b)
observed
calculated
4cm
4cm
9:00 10:00 11:00 12:00 13:00 JST
Shinminato
earthquake generation
earthquake generation
0
0
tsunami arrival
9:51
(c)
observed
calculated
4cm
4cm
9:00 10:00 11:00 12:00 13:00 JST
Shinminato
earthquake generation
earthquake generation
0
0
tsunami arrivaltsunami arrival
9:51
(c)
observed
calculated
4cm
4cm
9:00 10:00 11:00 12:00 13:00 JST
Nanao
earthquake generation
earthquake generation
0
0
tsunami arrival
(d)
observed
calculated
4cm
4cm
9:00 10:00 11:00 12:00 13:00 JST
Nanao
earthquake generation
earthquake generation
0
0
tsunami arrivaltsunami arrival
(d)
Fig. 2. Time-series variations of observed and calculated tidal levels at (a)Toyama, (b) Fushiki, (c) Shinminato, and (d) Nanao tidal observatories.Observed tidal data were provided by the Port and Airport ResearchInstitute.
result strongly suggests that the tidal surges recorded inToyama Bay during the hour immediately following theearthquake cannot be explained by the tsunami generatedat the seismic source.
3. Description of the Capsize of the BoatA small boat (6.3 m long according to the Asahi news-
paper, 2007) capsized near the southern shore of ToyamaBay shortly after the earthquake (Fig. 1(a)). According tothe boat crew, who informed the Japan Coast Guard, theboat started to vibrate and was suddenly uplifted while atanchor and facing west. Two or three minutes later, atabout 9:45 a.m., the boat crew heard the radio announce-ment about the earthquake, and the boat was again stronglyuplifted. Shortly after the second uplift, the boat overturnedtoward the port side.
No unnatural waves, such as a bow wave or ship’s wake,were observed by the boat crew both before and afterthe capsize. Moreover, weather conditions on southernToyama Bay at that time were calm, with the wind veloc-

I. ABE et al.: NUMERICAL SIMULATION OF THE TSUNAMI GENERATED BY THE 2007 NOTO HANTO EARTHQUAKE 135
Noto Peninsula
Toyama Bay
75min(10:57)
80min(11:02)
70min
60min(10:42)
50min(10:32)40min
(10:22)30min(10:12)
20min(10:02)
10min(9:52)
Initial source
(10:52)
10km
Noto Peninsula
Toyama Bay
75min(10:57)
80min(11:02)
70min
60min(10:42)
50min(10:32)40min
(10:22)30min(10:12)
20min(10:02)
10min(9:52)
Initial source
(10:52)
10km
Fig. 3. The map showing wave fronts of the calculated tsunami wave(10-min interval), which suggests that the earthquake-induced tsunamiarrived at Toyama bay 70–80 min after generation.
ity around 2 m s−1 (JMA, 2007). According to weatherdata recorded at 10-min intervals at Uozu and Himi on theshore of Toyama Bay (Fig. 1(a)), there was a westerly windwith a wind velocity of 1 to 2 m s−1 at that time (JMA,2007). Therefore, neither waves from boat activity norwind-generated waves can explain the capsizing of the boat.
According to the crew, the boat was overturned towardthe port side while anchored with the bow facing west.Therefore, it is possible to speculate that an extraordinarywave (or waves) traveling from north to south (landward)might have struck the starboard side of the boat and causedit to capsize.
4. Possible Cause of the Unusual Tidal Surges inToyama Bay
Our numerical analysis revealed that the arrival time ofthe tsunami at Toyama Bay was about 11:00 a.m. There-fore, it is very difficult to explain how the capsize of theboat might have been induced by the tsunami generatedby fault movement at the seismic source off Noto Penin-sula. The seaquake may have been generated by the 2007Noto Hanto Earthquake. Seaquakes are sometimes gener-ated by large earthquakes and are a major cause of boatsand ships capsizing immediately following an earthquake(e.g., Okamoto and Sakuta, 1995). Considering the arrivaltime of the seaquake, the first vibration felt by the crewimmediately after the earthquake might have been causedby the seaquake, although the boat did not capsize as a re-sult of this first vibration. On the other hand, unusual tidalsurges were observed at some tidal observatories (Toyama,Fushiki, and Shinminato) in Toyama Bay. The onset of thetidal surge was almost consistent with the time that the boatcapsized. Therefore, we prefer the hypothesis that not theseaquake but the tidal surge in Toyama Bay caused the boatto capsize.
If so, what caused the tidal surge, which was observedonly within Toyama Bay? Because of the steep bathymetryin Toyama Bay and the surrounding area (Fig. 4(a)), sub-marine landslides are common. They have been attributedto floods or failures on fan delta frontal slopes as well as
to seismic activity (Nakajima et al., 1998). Based on analy-ses of drill cores from the Toyama deep-sea channel system,turbidites have been regularly deposited there at intervals ofapproximately 70 years (Nakajima et al., 1998; Nakajima,2006). Therefore, it is possible that a submarine landslidewas triggered near the southern margin of Toyama Bay bythe 2007 Noto Hanto Earthquake. Interestingly, a fisher-man who was on a boat offshore of Himi city (Fig. 1(a)),mentioned that the seawater became muddy after he heard alarge sound immediately following the earthquake (from asurvey by the Fisheries Agency, personal communication),probably due to the suspension of the sea bottom sediments.Based on these observations, we suggest that the likely ex-planation is that a local submarine landslide, triggered bythe 2007 Noto Hanto Earthquake, caused the tidal surge inToyama Bay.
Because the tidal surge was observed at several observa-tories in Toyama Bay, we can estimate the source area ofthe submarine landslide using a back-propagation method.
5. Estimation of the Possible Source of the Sub-marine Landslide
The onset of the sharp tidal surge at Toyama observatoryarrived 3 min after the earthquake (9:45 a.m.), and the peaklevel arrived 5 min after the earthquake (9:47 a.m.). If weassume that the tidal surge was generated within ToyamaBay immediately after the earthquake (9:42 a.m.), we canconsider a virtual source of the wave at the Toyama ob-servatory and back-calculate the propagation time of thewave from the observatory. Figure 4(a) shows the loci ofpoints from which the onset and the peak of the wave thatarrived at the Toyama observatory may have come. Sim-ilarly, we back calculated propagation times for the onsetof the sharp drop of tidal level observed at the Fushiki ob-servatory (4 min after the earthquake, 9:46 a.m.) and thelowest level (7 min after the earthquake, 9:49 a.m.). In thecase of the Shinminato observatory, the onset of the sharpdrop in tidal level occurred at 5.5 min after the earthquake(9:46 a.m.) and the lowest level at 8 min after the earth-quake (9:50 a.m.). The loci of the possible origin of theonset and peak of this wave are also shown on Fig. 4(a). Toreproduce the peak of the tidal surge at the Toyama, Fushikiand Shinminato observatories, the wave source must lie be-tween the lines defining the 3- and 5-min propagation timesfor Toyama, between those defining the 4- and 7-min prop-agation times for Fushiki and also between those definingthe 5.5- and 8-min propagation times for Shinminato.
The proper analysis of wave generation and propagationdue to a possible submarine landslide requires a numericalcalculation using a landslide-generated wave model (e.g.Imamura and Imteaz, 1995; Matsui et al., 2002). How-ever, the precise scale of the initial movement of sedimentsis very important in the calculation of landslide-generatedwaves. Because we do not have any information about apossible submarine landslide in Toyama Bay at the presenttime, we cannot model wave generation and propagationusing such a model. A depth-sounding survey and core-drilling program are required to determine whether therewas a landslide, where it occurred, and its scale. Thus,in this study, we did not use the landslide-generated wave
136 I. ABE et al.: NUMERICAL SIMULATION OF THE TSUNAMI GENERATED BY THE 2007 NOTO HANTO EARTHQUAKE
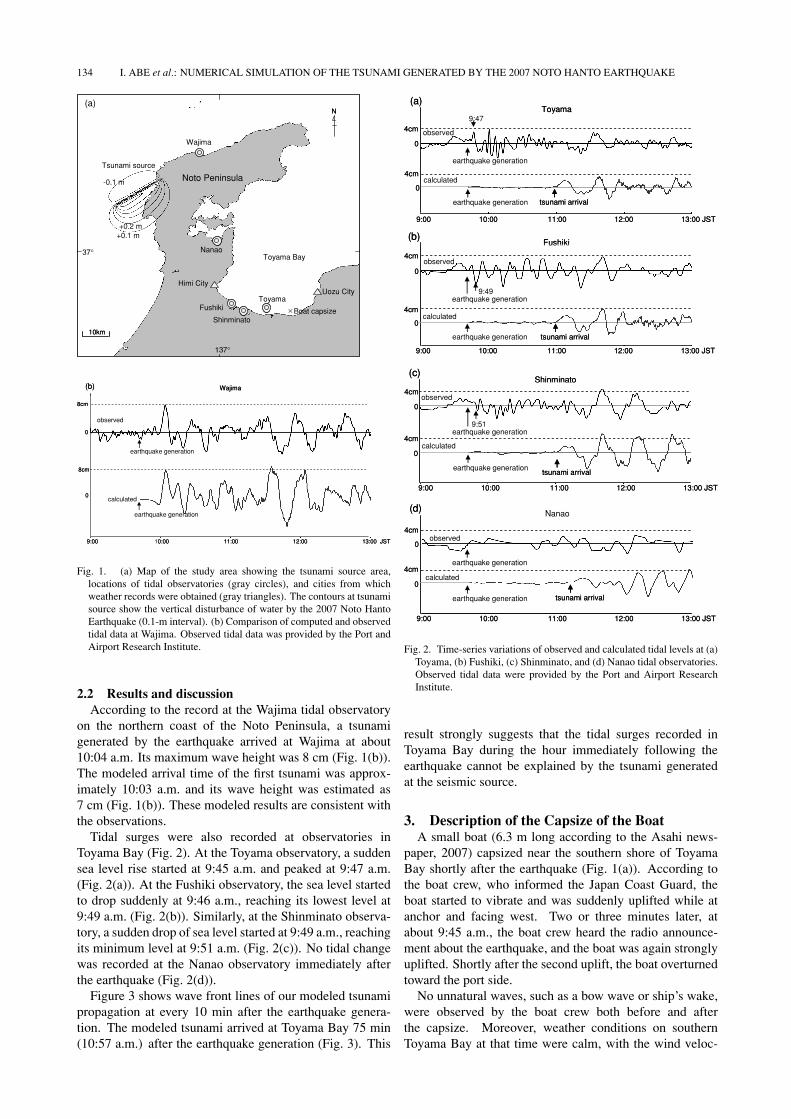
Fig. 4. (a) Map showing the loci of the possible origins of the onset and peak of the tidal surges recorded at Toyama, Shinminato and Fushikiobservatories, which are estimated by backward wave propagation analysis. (b) Proposed source area of the tidal surge, flow direction of thelandslide, and vertical displacement. (c) Cross section showing the ideal geometry of the landslide, and the wave it generated, and our model. (d)Map showing the place that metals such as Pb and Zn are exceptionally high (based on Imai et al., 1997).
model. As a preliminary interpretation, taking into accountthe sea-floor physiography of the bay, we considered a vir-tual vertical sea displacement either along the slope or atthe bottom of a valley in Toyama Bay (Fig. 4(b)) as pos-sible source areas of the submarine landslide. This in turnindicates that we did not consider the sea floor displacementin this calculation but just set the vertical sea displacementat the possible landslide area. These locations and sizes ofthe area were set to satisfy the range of arrival times that weestimated from back propagation times.
To imitate the motion of the sea water during the land-slide flow process, we assumed negative vertical displace-ment when we set the wave source on the slope (Fig. 4(c)).On the other hand, we assumed positive vertical sea dis-placement when we set the wave source on the flat floor.We found that the onsets of the tidal surge at Toyama and
Fushiki can be successfully explained (Fig. 5) only when weset an initial source of the wave on the slope of the westernpart of the Toyama Bay (Fig. 4(b)). Therefore, the landslidewas likely generated in the western part of the Toyama Bayin the area offshore of Fushiki.
It is important to note that the onset of the tidal surgeobserved at the Toyama observatory was a wave of posi-tive amplitude, whereas negative amplitudes were observedat the Fushiki and Shinminato observatories (Fig. 2). Thisdifference is probably related to the flow direction of thesubmarine landslide. For example, if the submarine land-slide ran along the channel from south to north in the bay,the first tidal level change would be negative at all observa-tories because they are located in the upper channel southof the source area of the landslide (Fig. 4(c)). Conversely,if we assume that the initial movement of the landslide was

I. ABE et al.: NUMERICAL SIMULATION OF THE TSUNAMI GENERATED BY THE 2007 NOTO HANTO EARTHQUAKE 137
4cm
4cm
0
0
4min(9:46)
4min(9:46)
observed
calculated
Toyama
9:42 10:12 10:42 JST(Earthquake generation)
(a)
4cm
4cm
0
0
4min(9:46)
4min(9:46)
observed
calculated
Toyama
9:42 10:12 10:42 JST(Earthquake generation)
(a)
4cm
4cm
0
0
5min(9:47)
5min(9:47)
observed
calculated
Fushiki(b)
9:42 10:12 10:42 JST(Earthquake generation)
4cm
4cm
0
0
5min(9:47)
5min(9:47)
observed
calculated
Fushiki(b)
9:42 10:12 10:42 JST(Earthquake generation)
4cm
4cm
0
0
7min(9:49)
7min(9:49)
observed
calculated
Shinminato(c)
9:42 10:12 10:42 JST(Earthquake generation)
4cm
4cm
0
0
7min(9:49)
7min(9:49)
observed
calculated
Shinminato(c)
9:42 10:12 10:42 JST(Earthquake generation)
Fig. 5. Comparison of time-series variations of the observed and calcu-lated tidal levels at the Toyama, Fushiki, and Shinminato tidal obser-vatories. The calculations are obtained by the simulation of submarinelandslide-induced tsunami, shown in Fig. 4. Although the calculatedtidal levels could be same as the observed ones overall, the former in-clude the shortened wave period component movement.
eastward at the source area, which is consistent with theslope direction, a positive wave would propagate toward theToyama observatory, and a negative wave would propagatetoward the Fushiki observatory. This suggests that the land-slide might have initially flowed down the eastward dippingslope (Fig. 4(b)).
We also tested several initial displacements of sedimentto reproduce the height of the initial wave at each observa-tory. We found that a sharp rise at the Toyama observatory(Fig. 5(a)) and drops at Fushiki and Shinminato observato-ries (Fig. 5(b) and (c)) are well explained if we set the initialdisplacements at +0.1 m in the eastern part of the sourcearea and −0.1 m in the western part (Fig. 4(b)), althoughthe wave periods at each observatory are very different fromthe observed data. We also used this model to calculate theamplitude of the tidal surge at the location where the smallboat capsized. Our calculations show that the tidal levelwould have drastically increased by more than 10 cm at thislocation at about 9:47 a.m. (Fig. 6), which is consistent withthe time at which the boat capsized.
10cm
0
5min (9:47)
Boat capsize point
9:42 10:12 10:42 JST
calculated
-10cm
(Earthquake generation)
10cm
0
5min (9:47)
Boat capsize point
9:42 10:12 10:42 JST
calculated
-10cm
(Earthquake generation)
Fig. 6. Time-series variation of tidal level calculated at the location wherethe boat capsized.
6. Implications for Future WorkOn the basis of these preliminary results, we suggest
that a submarine landslide, which likely occurred on thewestern slope of Toyama Bay, may have been the sourceof the unusual tidal surges (Fig. 4(b)). This tidal surge mayhave caused the boat to capsize in Toyama Bay, althoughit is still uncertain whether the 10-cm height of the wavewould have been capable of inducing the capsize of theboat. Further careful research is required to clarify thephysical process of the capsize of the boat based on thedetails of the boat (e.g., size, weight, and structure) as wellas the flow characteristics of the unusual tidal surges.
As previously stated, to confirm that the submarine land-slide did occur, we require a sounding survey and core-drilling program in the channels of Toyama Bay. Sedimen-tary analysis of the deposits in and around the channelsand an investigation of their heavy metal concentrationswould provide useful data for investigating the distributionof the sediments involved in the possible submarine land-slide. Geochemical analysis by Imai et al. (1997) showsthat concentrations of heavy metals such as Pb and Zn areexceptionally high around the southern landward margin ofToyama Bay (Fig. 4(d)), the likely source area of the sub-marine landslide that may have occurred as a result of the2007 Noto Hanto Earthquake.
Although our landslide model broadly reproduced theobserved tidal records, with the exception of those at theToyama observatory, the wave periods we calculated at eachobservatory were considerably shorter than those of the ob-served records (Fig. 5). These results were to be expected,because the period of the wave generated by a submarinelandslide is closely related to the scale, density, and initialvelocity of the landslide (e.g., Matsui et al., 2002). How-ever, our preliminary model has not been included these ef-fects. Thus, these data must be investigated by using geo-logical methods to allow further, more detailed numericalimplementation of a landslide-generated wave model.
Acknowledgments. We especially thank K. Akiyama and K.Ootsuka who provided us useful information about the damage inToyama Bay. We also thank Y. Tanioka, T. Iidaka, and an anony-mous reviewer for their valuable suggestions and comments.
ReferencesAsahi Newspaper, Damages due to the 2007 Noto Hanto Earthquake

138 I. ABE et al.: NUMERICAL SIMULATION OF THE TSUNAMI GENERATED BY THE 2007 NOTO HANTO EARTHQUAKE
at Toyama and Niigata prefectures, http://www.asahi.com/special/070325/TKY200703250271.html, 2007 (in Japanese).
Geographical Survey Institute, Diastrophism due to the 2007 NotoHanto Earthquake, http://www.gsi.go.jp/WNEW/PRESS-RELEASE/2007/0328/05.pdf, 2007 (in Japanese).
Imai, N., S. Terashima, H. Katayama, T. Nakajima, K. Ikehara, and M.Taniguchi, Geochemical behavior of heavy metals in coastal marinesediments from the eastern margin of the Japan Sea, Bull. Geol. Surv.Jpn., 48, 511–529, 1997 (in Japanese with English abstract).
Imamura, F., Review of tsunami simulation with a finite difference method,in Long-Wave Runup Models, edited by H. Yeh, P. Liu, and C. Synolakis,pp. 25–42, World Scientific Publishing Co., 1995.
Imamura, F. and M. M. A. Imteaz, Long waves in two-layers, Governingequations and numerical model, Sci. Tsunami Haz., 13(1), 3–24, 1995.
JMA (Japan Meteorological Agency), Statistical information of pastweather data, http://www. jma.go.jp, 2007 (in Japanese).
Manshiha, L. and D. E. Smylie, The Displacement Fields of InclinedFaults, Bull. Seismol. Soc. Am., 61, 1433–1440, 1971.
Matsui, T., F. Imamura, E. Tajika, Y. Nakano, and Y. Fujisawa, Generationand propagation of a tsunami from the Cretaceous/Tertiary impact event,
in Catastrophic Events and Mass Extinctions: Impact and Beyond, C.Koeberl and G. Macleod (Eds), Geol. Soc. Am. Special Paper, 356, 69–77, 2002.
Nakajima, K., Hyperpycnites deposited 700 km away from river mouthsin the central Japan Sea, J. Sediment. Res., 76, 60–73, DOI: 10.2110/jsr.2006.13, 2006.
Nakajima, K., M. Satoh, and Y. Okamura, Channel-levee complexes, ter-minal deep-sea fan and sediment wave fields associated with the ToyamaDeep-Sea Channel system in the Japan Sea, Mar. Geol., 147, 25–41,1998.
Okamoto, K. and M. Sakuta, Numerical Simulation Technique for Time-History Pressure of Floating Structure in Seaquakes, Proceedings ofOcean Cites, 308–311, 1995.
Prime Minister of Japan and His Cabinet, Details of the 2007 NotoHanto Earthquake, http://www.kantei.go.jp/jp/kikikanri/jisin/isikawa/isikawa1530.html, 2007 (in Japanese).
I. Abe (e-mail: [email protected]), K. Goto, F. Ima-mura, and K. Shimizu