Embed Size (px)
Citation preview
A Numerical Simulation of Tsunami Propagation
in the Middle Area of Japan Sea
Masatoshi YUHI1, Naruki ABE2, and Masashi AOKI3
1Professor, Faculty of Environmental Design, Kanazawa University
(Kakuma-machi, Kanazawa City, Ishikawa 920-1192, Japan) E-mail:[email protected]
2Division of Natural Science and Technology, Graduate School of Kanazawa University (Kakuma-machi, Kanazawa City, Ishikawa 920-1192, Japan)
3School of Environmental Design, Kanazawa University (Kakuma-machi, Kanazawa City, Ishikawa 920-1192, Japan)
Historically, tsunami disasters have been repeated in the Japan Sea area. Among them, this study focuses on tsunamis that have caused various damages to the coast of Ishikawa Prefecture, which is located on the middle north of Japan. Historical tsunami disasters in the Japan Sea area are first described on the basis of the synthetic assessment of available literatures. Then a series of numerical simulation has been conducted on the basis of the Nonlinear Shallow Water Equations in order to clarify the typical characteristics of tsunami propagations around Ishikawa Prefecture. The numerical results for the 1833 Tenpo Yamaga-ta-Oki earthquake tsunami show the occurrence of strong refraction off the Noto Peninsula in the pre-fecture, which can cause significant concentration of tsunami energy.
Key Words : tsunami, Japan Sea, Noto Peninsula, refraction, regional characteristic of tsunami
1. INTRODUCTION
The propagation and deformation of tsunamis could be significantly affected by the local bathymetries and topographies. For example, it is well known that tsunamis could be significantly amplified at the inner part of a V-shaped bay observed on Ria type coasts. The convex shape of the underwater bathymetry also tends to amplify tsunami heights due to the so-called lens effect by refraction. Physical understanding on the localized change in tsunami run-up height in complicated topography is therefore essential in order to improve the preparedness against tsunamis. For this purpose, information on not only the historical but also the regional characteristics of tsunami behaviors is crucially important.
Historically, tsunami disasters have been repeated in the Japan Sea area, although the tsunami magnitude is not as high as that in the Pacific Ocean and the frequency of tsunami occurrence is lower. Hatori (1995)1) estimated that the total tsunamigenic energy in the Japan Sea comprises 24% of that due to tsunamis in the whole Japan during the period between 1600 and 1994. Hatori and Katayama (1977) 2) discussed the tsunami behavior and source areas of historical tsunamis in the Japan Sea. It was shown that the source of destructive tsunami were concentrated along the eastern margin of the Japan Sea. Hatori (1986) 3) examined the charac-teristics of reflection waves from the continental coast. It was shown that the duration time of the tsunamis in the Japan Sea is longer than the ones in the Pacific Ocean, because the Japan Sea is nearly closed; the multiple tsunami reflection between the continental and Japanese coast could be repeated for a couple of days. Tsuji and Konishi (1985) 4) conducted a numerical calculation for three historical tsunamis in the Japan Sea. They pointed out that the large tsunami height was recognized not only at the coasts close to the epicenters, but also on the coasts relatively far from them: there are several specific coasts where tsunami run-up height becomes higher than the neighboring coasts for tsunamis propagating from the eastern margin of the Japan Sea. Hatori (1999) 5) indicated that the tsunami heights at Wajima, which is located at the north of Noto Peninsula, tsunami heights are more than 2 to 3.5 times larger than the ones expected from the corresponding tsunami magnitude.
-103-
Using the refraction diagram and Green s formula, Hatori (1999)5) clarified the importance of shoal-ing-refraction effects around the Noto Peninsula, when considering tsunamis originated along the eastern margin of the Japan Sea. Hatori (1986) 3) also pointed out that the reflected tsunami from the continental coast is likely to concentrate at northern Noto Peninsula.
In this study, accordingly, we investigate the characteristics of tsunamis that have caused various damages to the coast of Ishikawa Prefecture, which is located on the middle north of Japan. Historical tsunami disasters in the Japan Sea area are first described on the basis of the synthetic assessment of available literatures. Then a series of numerical simulation has been conducted on the basis of the Nonlinear Shallow Water Equations in order to clarify the typical characteristics of tsunami propagations around Ishikawa Prefecture. Among the various historical tsunamis, the 1833 Tenpo Yamagata-Oki earthquake tsunami that caused the greatest damage to this target site is selected as a representative historical tsunami. Model capabilities are confirmed through comparison with historical records. The localized change in tsunami height induced by the lens effects of the bathymetry off the Noto Peninsula is examined in detail. 2. HISTORICAL TSUNAMIS IN THE JAPAN SEA
The oldest tsunami record in the Japan Sea is the 701 Wakasa Bay tsunami. Unfortunately detailed in-formation is not available for this tsunami at this moment. Since there is no historical record of tsunamis in the Japan Sea area before the 7th century, it is impossible to discuss the recurrence of tsunamis in the Japan Sea on the order of 103 years. Until the 17th century, it is often difficult to accurately estimate the tsunami magnitude and source area due to the paucity of available records. Accordingly, tsunamis that occurred after 18th century are treated in the following, since the reliability of historical records are considered to be relatively high.
Hatori and Katayama (1977) 2) investigated 22 historical tsunamis in the Japan Sea. They summarized the inundation heights along the coast and their source areas on the basis of the historical records over the last 400 years (1600-1976). During the 18th and 19th centuries, 5 and 6 destructive tsunamis were observed, respectively. In the 20th century, 8 large tsunamis occurred, including the 1983 Central Japan Sea earthquake tsunami and 1993 Southwest Hokkaido earthquake tsunami. The sources of the destructive historical tsunamis are con-centrated on the eastern margin of the Japan Sea from the west side of Hokkaido to the west side of Niigata Prefecture (Fig.1). This area corresponds to the tectonic plate boundary between the North American plate and the Eurasian plate. However, it is estimated that a mature plate boundary plane has not been formed along the eastern margin of the Japan Sea considering that earthquakes with two opposing dip directions have occurred in the area6). On the contrary there were few earthquakes on the San-in area which is located at the west part of Japan Sea. The largest tsunami in the Japan Sea is the 1993 Southwest Hokkaido earthquake (M=7.8) tsunami. The second largest one is the 1983 Central Japan Sea earthquake (M=7.7) tsunami. Before the 20th century the 1741 West Hokkaido Oshima tsunami is considered to be the largest.
Among the destructive earthquakes and tsunamis in the Japan Sea, representative ones related to Ishikawa Prefecture are summarized in Table 1 (reproduced from Hatori (1999) 5)). In these historical records, the 1833 Tenpo Yamagata-Oki earthquake tsunami recorded the highest tsunami height in Ishikawa Prefecture. The inundation height is estimated to be 5.7 m at Wajima City7). In this event 47 people lost their lives in Wajima, and 318 houses were completely destroyed or washed away8). At the 1741 West Hokkaido Oshima tsunami, Monzen district in Wajima City located on the northwest of the Noto Peninsula was damaged: the estimated inundation height is around 3 to 4 m9). It is reported that the 1799 Kansei Kaga earthquake tsunami attacked the Kanaiwa district in Kanazawa City; hundreds of houses were washed away and many people were drowned. The wave height is estimated to be around 3 to 4 m2), however, the inundation area and the tsunami source is unknown. More recently, 1964 Niigata-Oki earthquake tsunami induced inundation damage around the Anamizu Bay; 4 houses were flooded above the floor level; 131 houses suffered from inundation below the floor level; and some farmland were also inundated. The 1983 Central Japan Sea earthquake tsunami injured 8 people and destroyed 2 houses in Ishikawa Prefecture. In addition, 3 and 3 houses were flooded above and below the floor level, respectively10). The inundation height along the coastline in Ishikawa Prefecture was as follows: 2.5m at the Noroshi Fishing Port in Suzu City, 1.5m at the Wajima Port in Wajima City, 1.8m at the Fukuura Fishing Port in Shika Town11). At the 1993 Southwest Hokkaido earthquake tsunami, 24 fishing boats were damaged in Ishikawa Prefecture. The corresponding run-up height was 1.9m at Kinoura in Suzu City, 2.0 m at the Wajima Port in Wajima City, 3.5 m at the Unyuu Port in Wajima City, and 1.98 m at the Fukuura Fishing Port in Shika town12).
-104-
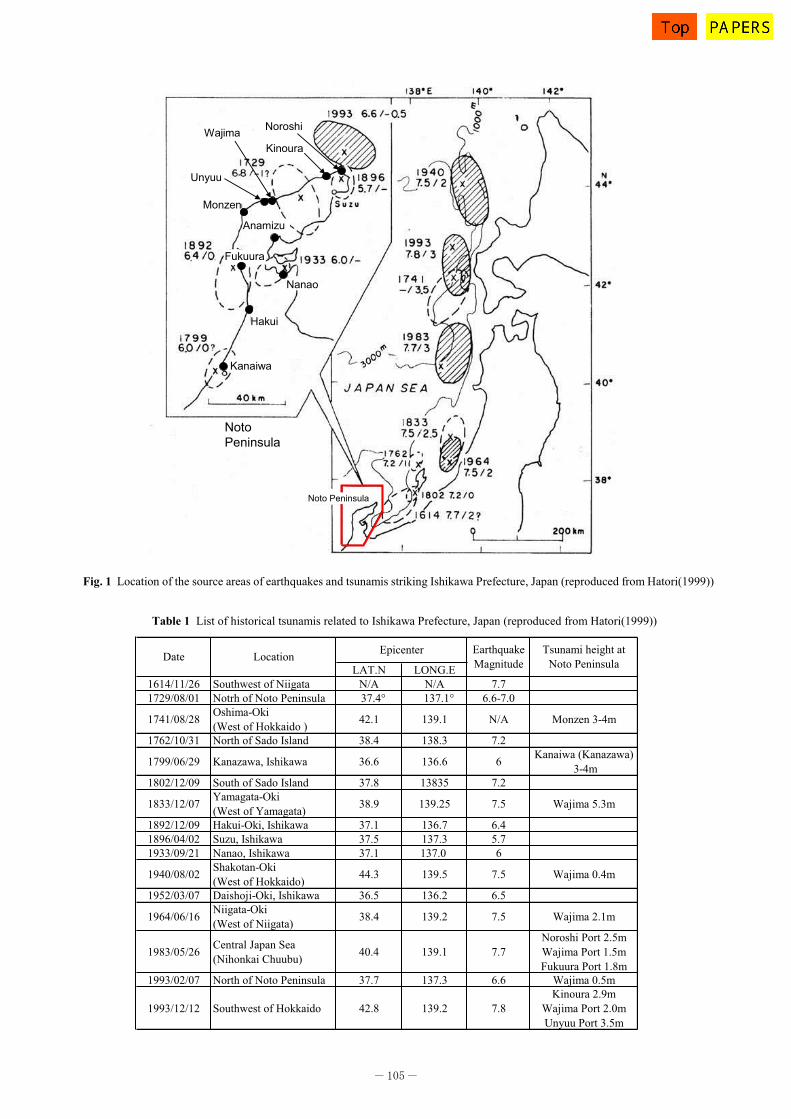
Table 1 List of historical tsunamis related to Ishikawa Prefecture, Japan (reproduced from Hatori(1999))
Fig. 1 Location of the source areas of earthquakes and tsunamis striking Ishikawa Prefecture, Japan (reproduced from Hatori(1999))
Noroshi
Kanaiwa
Hakui
Nanao
Wajima
Monzen
Fukuura
Anamizu
Kinoura
Unyuu
NotoPeninsula
Noto Peninsula
Noroshi
Kanaiwa
Hakui
Nanao
Wajima
Monzen
Fukuura
Anamizu
Kinoura
Unyuu
NotoPeninsula
Noto Peninsula
LAT.N LONG.E1614/11/26 Southwest of Niigata N/A N/A 7.71729/08/01 Notrh of Noto Peninsula 37.4° 137.1° 6.6-7.0
1741/08/28 Oshima-Oki(West of Hokkaido ) 42.1 139.1 N/A Monzen 3-4m
1762/10/31 North of Sado Island 38.4 138.3 7.2
1799/06/29 Kanazawa, Ishikawa 36.6 136.6 6 Kanaiwa (Kanazawa) 3-4m
1802/12/09 South of Sado Island 37.8 13835 7.2
1833/12/07 Yamagata-Oki(West of Yamagata) 38.9 139.25 7.5 Wajima 5.3m
1892/12/09 Hakui-Oki, Ishikawa 37.1 136.7 6.41896/04/02 Suzu, Ishikawa 37.5 137.3 5.71933/09/21 Nanao, Ishikawa 37.1 137.0 6
1940/08/02 Shakotan-Oki(West of Hokkaido) 44.3 139.5 7.5 Wajima 0.4m
1952/03/07 Daishoji-Oki, Ishikawa 36.5 136.2 6.5
1964/06/16 Niigata-Oki(West of Niigata) 38.4 139.2 7.5 Wajima 2.1m
1983/05/26 Central Japan Sea(Nihonkai Chuubu) 40.4 139.1 7.7
Noroshi Port 2.5mWajima Port 1.5mFukuura Port 1.8m
1993/02/07 North of Noto Peninsula 37.7 137.3 6.6 Wajima 0.5m
1993/12/12 Southwest of Hokkaido 42.8 139.2 7.8Kinoura 2.9m
Wajima Port 2.0mUnyuu Port 3.5m
Date Location EarthquakeMagnitude
Tsunami height atNoto Peninsula
Epicenter
-105-
3. NUMERICAL MODEL (1) Governing equations
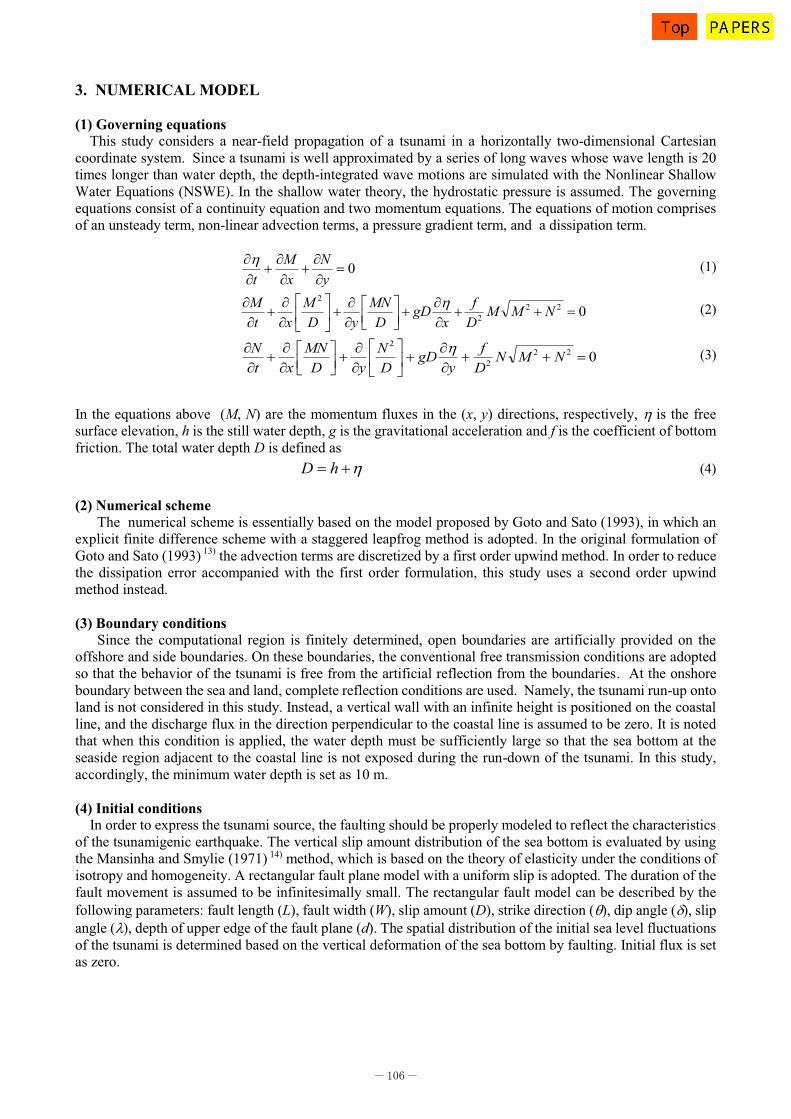
This study considers a near-field propagation of a tsunami in a horizontally two-dimensional Cartesian coordinate system. Since a tsunami is well approximated by a series of long waves whose wave length is 20 times longer than water depth, the depth-integrated wave motions are simulated with the Nonlinear Shallow Water Equations (NSWE). In the shallow water theory, the hydrostatic pressure is assumed. The governing equations consist of a continuity equation and two momentum equations. The equations of motion comprises of an unsteady term, non-linear advection terms, a pressure gradient term, and a dissipation term.
0yN
xM
t (1)
0222
2
NMMDf
xgD
DMN
yDM
xtM (2)
0222
2
NMNDf
ygD
DN
yDMN
xtN (3)
In the equations above (M, N) are the momentum fluxes in the (x, y) directions, respectively, is the free surface elevation, h is the still water depth, g is the gravitational acceleration and f is the coefficient of bottom friction. The total water depth D is defined as
hD (4) (2) Numerical scheme
The numerical scheme is essentially based on the model proposed by Goto and Sato (1993), in which an explicit finite difference scheme with a staggered leapfrog method is adopted. In the original formulation of Goto and Sato (1993) 13) the advection terms are discretized by a first order upwind method. In order to reduce the dissipation error accompanied with the first order formulation, this study uses a second order upwind method instead.
(3) Boundary conditions
Since the computational region is finitely determined, open boundaries are artificially provided on the offshore and side boundaries. On these boundaries, the conventional free transmission conditions are adopted so that the behavior of the tsunami is free from the artificial reflection from the boundaries. At the onshore boundary between the sea and land, complete reflection conditions are used. Namely, the tsunami run-up onto land is not considered in this study. Instead, a vertical wall with an infinite height is positioned on the coastal line, and the discharge flux in the direction perpendicular to the coastal line is assumed to be zero. It is noted that when this condition is applied, the water depth must be sufficiently large so that the sea bottom at the seaside region adjacent to the coastal line is not exposed during the run-down of the tsunami. In this study, accordingly, the minimum water depth is set as 10 m. (4) Initial conditions
In order to express the tsunami source, the faulting should be properly modeled to reflect the characteristics of the tsunamigenic earthquake. The vertical slip amount distribution of the sea bottom is evaluated by using the Mansinha and Smylie (1971) 14) method, which is based on the theory of elasticity under the conditions of isotropy and homogeneity. A rectangular fault plane model with a uniform slip is adopted. The duration of the fault movement is assumed to be infinitesimally small. The rectangular fault model can be described by the following parameters: fault length (L), fault width (W), slip amount (D), strike direction ( ), dip angle ( ), slip angle ( ), depth of upper edge of the fault plane (d). The spatial distribution of the initial sea level fluctuations of the tsunami is determined based on the vertical deformation of the sea bottom by faulting. Initial flux is set as zero.
-106-
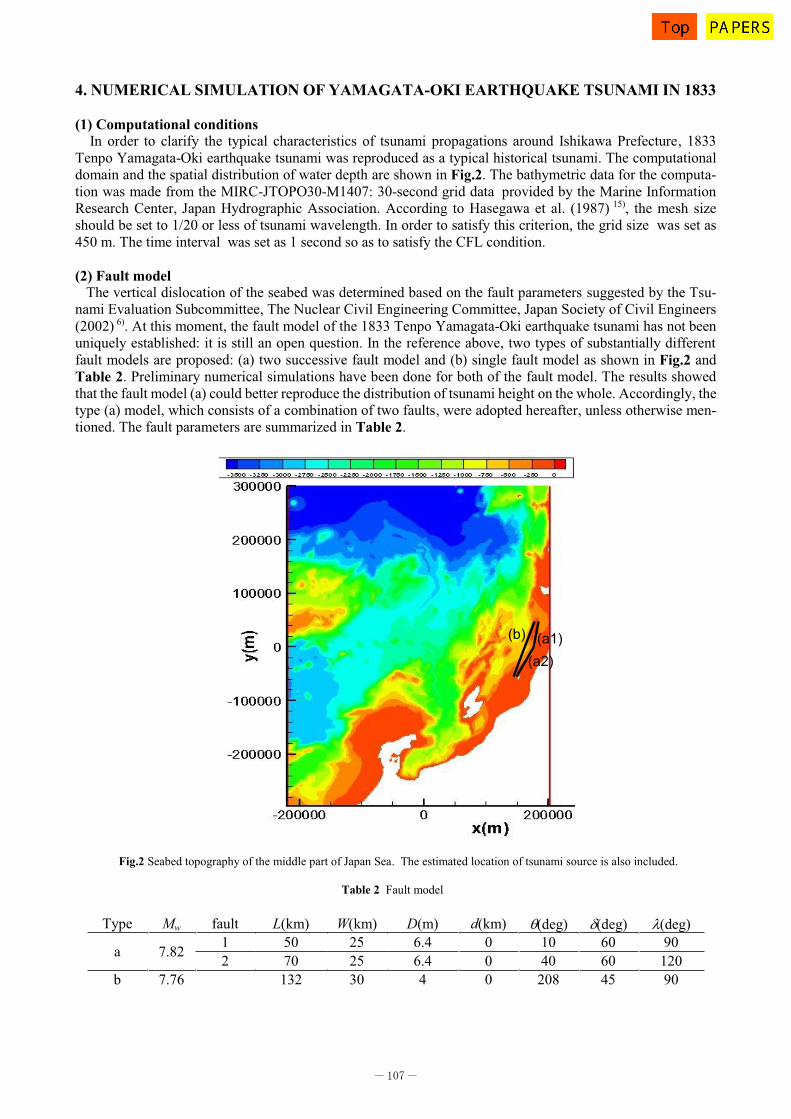
4. NUMERICAL SIMULATION OF YAMAGATA-OKI EARTHQUAKE TSUNAMI IN 1833 (1) Computational conditions
In order to clarify the typical characteristics of tsunami propagations around Ishikawa Prefecture, 1833 Tenpo Yamagata-Oki earthquake tsunami was reproduced as a typical historical tsunami. The computational domain and the spatial distribution of water depth are shown in Fig.2. The bathymetric data for the computa-tion was made from the MIRC-JTOPO30-M1407: 30-second grid data provided by the Marine Information Research Center, Japan Hydrographic Association. According to Hasegawa et al. (1987) 15), the mesh size should be set to 1/20 or less of tsunami wavelength. In order to satisfy this criterion, the grid size was set as 450 m. The time interval was set as 1 second so as to satisfy the CFL condition. (2) Fault model The vertical dislocation of the seabed was determined based on the fault parameters suggested by the Tsu-nami Evaluation Subcommittee, The Nuclear Civil Engineering Committee, Japan Society of Civil Engineers (2002) 6). At this moment, the fault model of the 1833 Tenpo Yamagata-Oki earthquake tsunami has not been uniquely established: it is still an open question. In the reference above, two types of substantially different fault models are proposed: (a) two successive fault model and (b) single fault model as shown in Fig.2 and Table 2. Preliminary numerical simulations have been done for both of the fault model. The results showed that the fault model (a) could better reproduce the distribution of tsunami height on the whole. Accordingly, the type (a) model, which consists of a combination of two faults, were adopted hereafter, unless otherwise men-tioned. The fault parameters are summarized in Table 2.
Type Mw fault L(km) W(km) D(m) d(km) (deg) (deg) (deg)
a 7.82 1 50 25 6.4 0 10 60 90 2 70 25 6.4 0 40 60 120
b 7.76 132 30 4 0 208 45 90
Table 2 Fault model
Fig.2 Seabed topography of the middle part of Japan Sea. The estimated location of tsunami source is also included.
(b) (a1)(a2)
(b) (a1)(a2)
-107-
(3) Validity examination of tsunami run-up heights The uncertainties and errors listed below are included in the numerical simulation of a tsunami: uncertainties
of the tsunami source model, error in numerical calculation, and errors in the submarine topography. In order to examine the applicability of the computational results, the tsunami simulation system was validated through comparison with records in historical documents. The indices proposed by Aida (1978) 16), namely, the ge-ometric average parameter K and associating geometric standard deviation , have been applied as indices of fitness in space between the recorded and computed tsunami heights. Aida s indices defined below represent the comparison results of the historical and calculated tsunami run-up heights.
i
n
iK
nK
1log1log (5)
21
1
22 loglog1logn
ii KK
n (6)
i
ii H
RK (7)
in which n is the number of data for evaluation and Ki is the ratio of recorded tsunami height at i-th location (Ri) and calculated tsunami height (Hi) at the same location. If a calculation reproduces the recorded historical tsunami heights well on average, K =1.0. The following rule of thumb is widely used to evaluate the applica-bility of the tsunami simulation system.
0.95 < K < 1.05 and < 1.45 (8)
If the numerical results satisfies this condition, the model is considered to be reliable. The numerical results were compared with historical records summarized in Watanabe (1998) 7) and
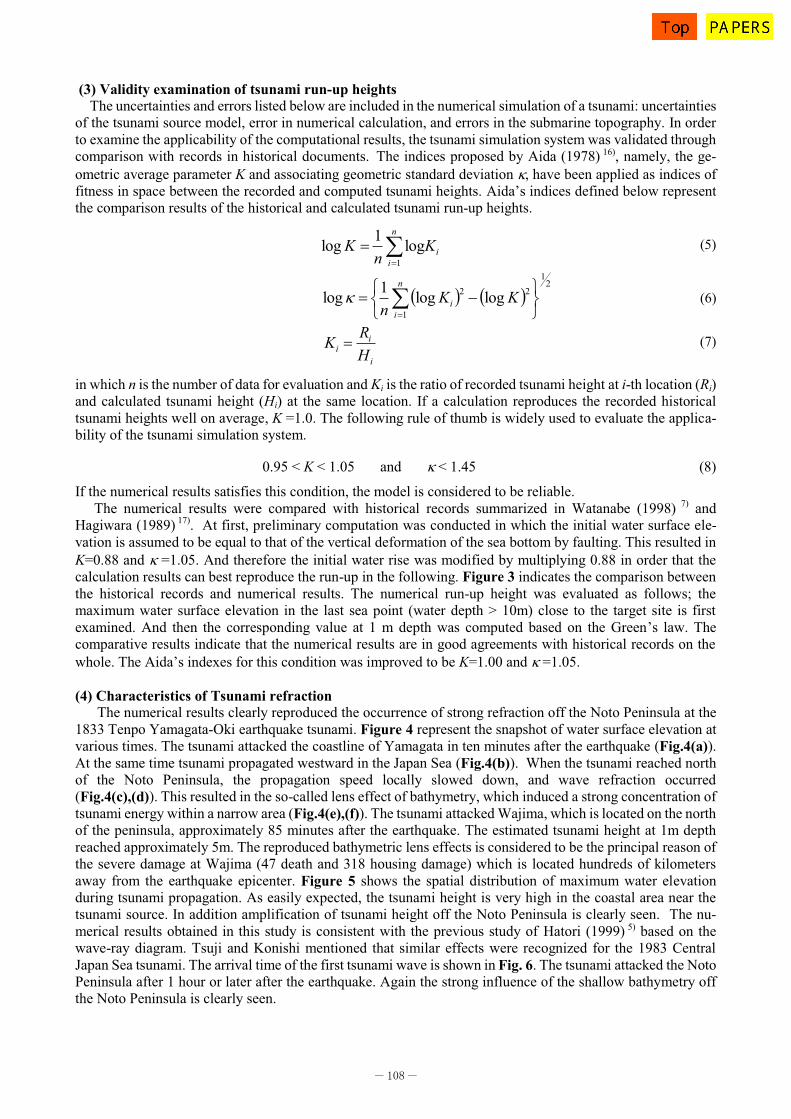
Hagiwara (1989) 17). At first, preliminary computation was conducted in which the initial water surface ele-vation is assumed to be equal to that of the vertical deformation of the sea bottom by faulting. This resulted in K=0.88 and =1.05. And therefore the initial water rise was modified by multiplying 0.88 in order that the calculation results can best reproduce the run-up in the following. Figure 3 indicates the comparison between the historical records and numerical results. The numerical run-up height was evaluated as follows; the maximum water surface elevation in the last sea point (water depth > 10m) close to the target site is first examined. And then the corresponding value at 1 m depth was computed based on the Green s law. The comparative results indicate that the numerical results are in good agreements with historical records on the whole. The Aida s indexes for this condition was improved to be K=1.00 and =1.05. (4) Characteristics of Tsunami refraction
The numerical results clearly reproduced the occurrence of strong refraction off the Noto Peninsula at the 1833 Tenpo Yamagata-Oki earthquake tsunami. Figure 4 represent the snapshot of water surface elevation at various times. The tsunami attacked the coastline of Yamagata in ten minutes after the earthquake (Fig.4(a)). At the same time tsunami propagated westward in the Japan Sea (Fig.4(b)). When the tsunami reached north of the Noto Peninsula, the propagation speed locally slowed down, and wave refraction occurred (Fig.4(c),(d)). This resulted in the so-called lens effect of bathymetry, which induced a strong concentration of tsunami energy within a narrow area (Fig.4(e),(f)). The tsunami attacked Wajima, which is located on the north of the peninsula, approximately 85 minutes after the earthquake. The estimated tsunami height at 1m depth reached approximately 5m. The reproduced bathymetric lens effects is considered to be the principal reason of the severe damage at Wajima (47 death and 318 housing damage) which is located hundreds of kilometers away from the earthquake epicenter. Figure 5 shows the spatial distribution of maximum water elevation during tsunami propagation. As easily expected, the tsunami height is very high in the coastal area near the tsunami source. In addition amplification of tsunami height off the Noto Peninsula is clearly seen. The nu-merical results obtained in this study is consistent with the previous study of Hatori (1999) 5) based on the wave-ray diagram. Tsuji and Konishi mentioned that similar effects were recognized for the 1983 Central Japan Sea tsunami. The arrival time of the first tsunami wave is shown in Fig. 6. The tsunami attacked the Noto Peninsula after 1 hour or later after the earthquake. Again the strong influence of the shallow bathymetry off the Noto Peninsula is clearly seen.
-108-
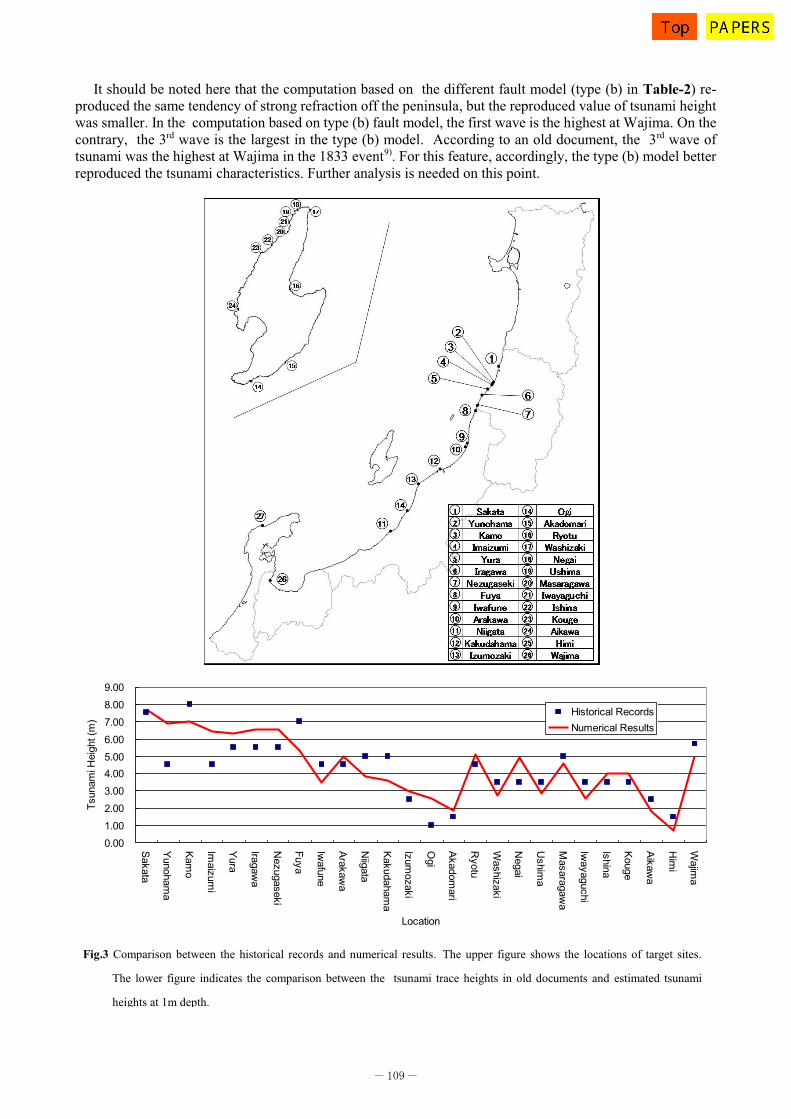
It should be noted here that the computation based on the different fault model (type (b) in Table-2) re-produced the same tendency of strong refraction off the peninsula, but the reproduced value of tsunami height was smaller. In the computation based on type (b) fault model, the first wave is the highest at Wajima. On the contrary, the 3rd wave is the largest in the type (b) model. According to an old document, the 3rd wave of tsunami was the highest at Wajima in the 1833 event9). For this feature, accordingly, the type (b) model better reproduced the tsunami characteristics. Further analysis is needed on this point.
Fig.3 Comparison between the historical records and numerical results. The upper figure shows the locations of target sites.
The lower figure indicates the comparison between the tsunami trace heights in old documents and estimated tsunami
heights at 1m depth.
0.00
1.00
2.00
3.00
4.005.00
6.00
7.00
8.00
9.00
Sakata
Yunoham
a
Kam
o
Imaizum
i
Yura
Iragawa
Nezugaseki
Fuya
Iwafune
Arakaw
a
Niigata
Kakudaham
a
Izumozaki
Ogi
Akadom
ari
Ryotu
Washizaki
Negai
Ushim
a
Masaragaw
a
Iwayaguchi
Ishina
Kouge
Aikaw
a
Him
i
Wajim
a
Location
Tsun
ami H
eigh
t (m
)
Historical RecordsNumerical Results
-109-
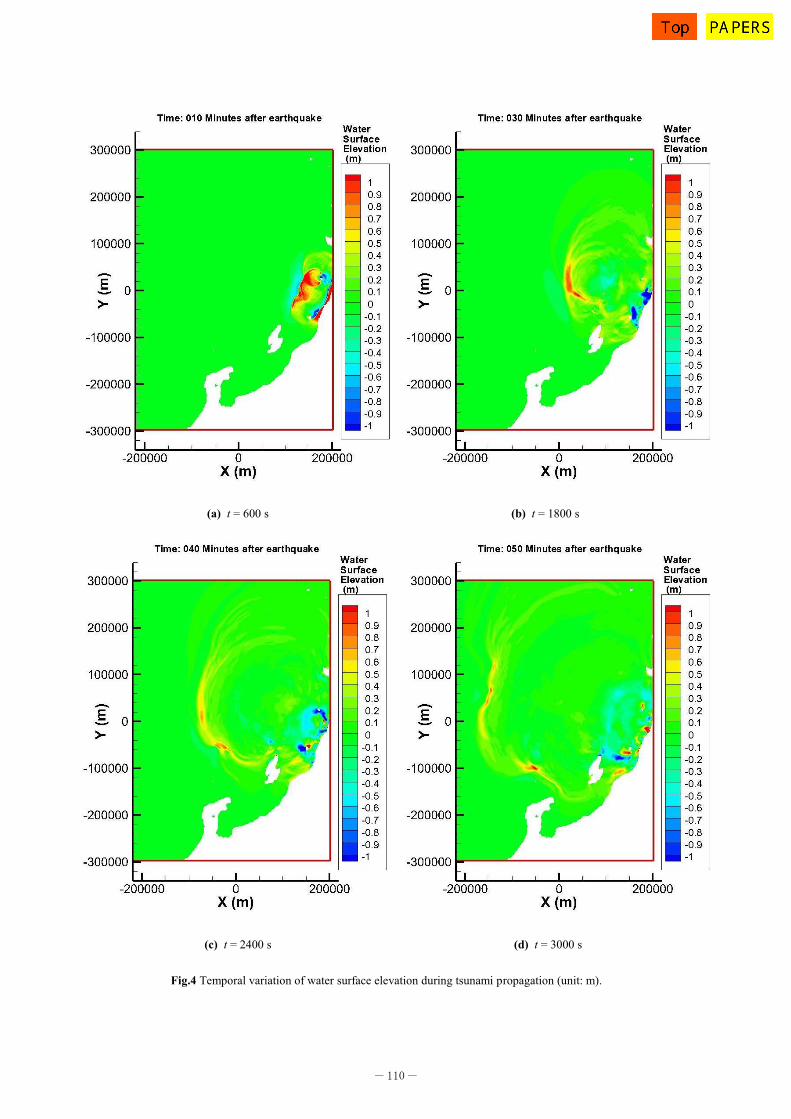
Fig.4 Temporal variation of water surface elevation during tsunami propagation (unit: m).
(a) t = 600 s (b) t = 1800 s
(c) t = 2400 s (d) t = 3000 s
-110-
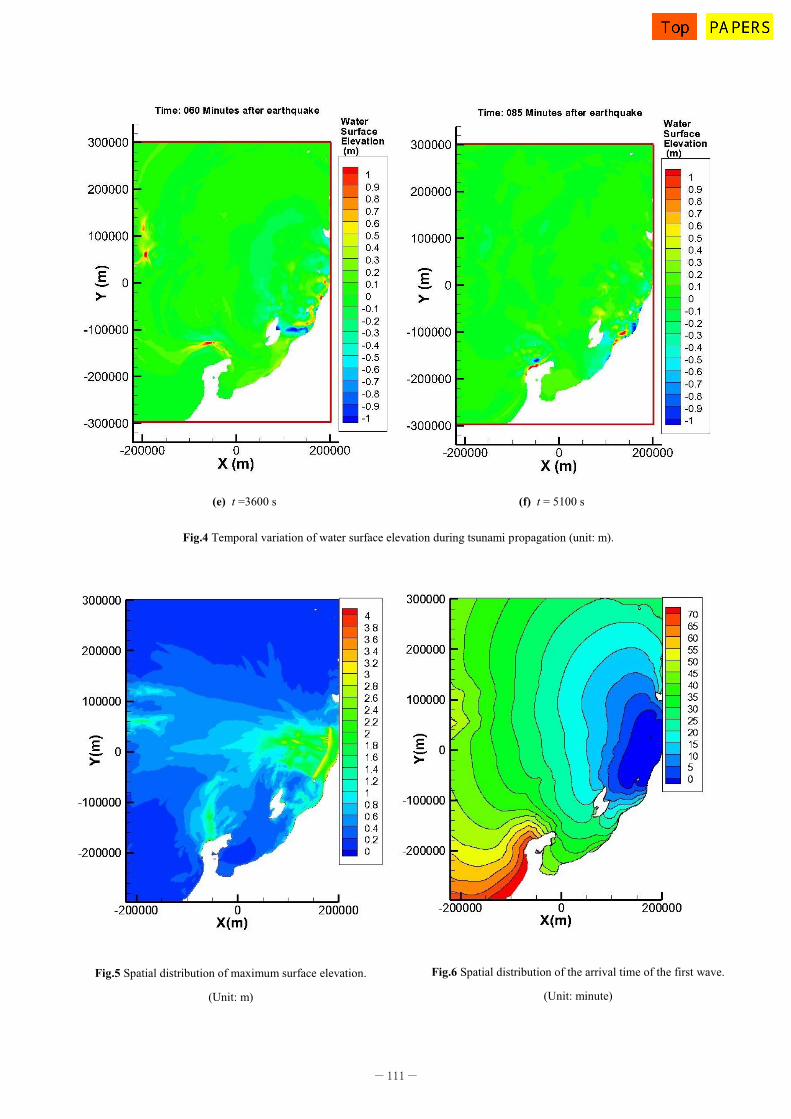
Fig.4 Temporal variation of water surface elevation during tsunami propagation (unit: m).
Fig.5 Spatial distribution of maximum surface elevation.
(Unit: m)
Fig.6 Spatial distribution of the arrival time of the first wave.
(Unit: minute)
(e) t =3600 s (f) t = 5100 s
-111-
5. SUMMARY REMARKS
This study investigated the characteristics of tsunamis that have caused various damages to the coast of Ishikawa Prefecture in the past. Historical tsunami disasters in the Japan Sea area were first summarized on the basis of the synthetic assessment of available literatures. Then a series of numerical simulation has been conducted on the basis of the Nonlinear Shallow Water Equations. In order to clarify the typical characteristics of tsunami propagations around Ishikawa Prefecture, 1833 Tenpo Yamagata-Oki earthquake tsunami was simulated as a typical historical tsunami. The comparison between historical records and numerical repro-duction on run-up values showed good agreement. The change in tsunami direction induced by the refraction effects of the shallow bathymetry off the Noto Peninsula was examined in detail. It was shown that strong lens effects resulted in the concentration of tsunami energy along the north coast of the peninsula.
In order to better understand the characteristics of tsunami behaviors around Ishikawa Prefecture, continual efforts are needed. A more comprehensive study is required to further quantify the localized variation of tsunami run-up for other different source areas. The hindcasting for other historical tsunamis has been at-tempted for this purpose, and the preliminary results are promising. In addition, it is also valuable to conduct parametric studies on the scenario tsunamis. The results of more detailed analysis will be discussed at another opportunity in the near future. ACKNOWLEDGMENT: The authors are grateful to Dr. Tomohiro Yasuda and Prof. Hajime Mase of Kyoto University for their supports in the initial stage of this study. Helpful comments from Prof. Fumihiko Yamada of Kumamoto University are most appreciated. REFERENCES 1) Hatori, T. : Distribution of tsunami energy along the Japan Sea coast, Journal of Seismological Society of Japan, Second Series,
Vol.48, pp.229-233, 1995 (in Japanese). 2) Hatori, T. and Katayama, M. : Tsunami behavior and source areas of historical tsunamis in the Japan Sea, Bulletin of the earthquake
research institute, University of Tokyo, Vol.52, pp.49-70, 1977 (in Japanese). 3) Hatori, T. : Reflection waves from the continental coast for the 1983 Japan Sea Tsunami, Bulletin of the earthquake research
institute, University of Tokyo, Vol.61, pp.329-338, 1986 (in Japanese). 4) Tsuji, Y. and Konishi, K. : Tsunamis in the Japan Sea with numerical calculation, Report of the national research institute for earth
science and disaster prevention, Japan, Vol.35, pp.277-297, 1985. 5) Hatori, T. : Refraction effects of tsunamis around the Noto Peninsula, the Japan Sea, Journal of Seismological Society of Japan,
Second Series, Vol.52, pp.43-50, 1999 (in Japanese). 6) Tsunami Evaluation Subcommittee, the Nuclear Civil Engineering Committee, Japan Society of Civil Engineers : Tsunami As-
sessment Method for Nuclear Power Plants in Japan, JSCE, 73p, 2002. 7) Watanabe, H. : Comprehensive list of tsunamis to hit the Japanese islands (2nd edition), University of Tokyo Press, 238p, 1998 (in
Japanese). 8) Earthquake research institute, University of Tokyo (eds.) : Comprehensive material on earthquakes in Japan, The Japan Electric
Association Vol.4, 870p, 1984 (in Japanese) 9) Hatori, T. : Historical tsunamis in the Japan Sea Kaiyo monthly Vol.16, pp.538-545, 1984 (in Japanese) 10) Disaster prevention committee of Ishikawa Prefecture : Disaster prevention plan in Ishikawa Prefecture, Chapter 1, pp.1-61, 2010
(in Japanese). 11) Laboratory of Tsunami Disaster Prevention, Tohoku University : Field reports on the 1983 Central Japan Sea tsunami, Report of
the laboratory of tsunami disaster prevention, Tohoku University, Vol.1, 267p, 1984 (in Japanese). 12) Shuto, N., Akita, S., Tsuji, Y. and Matsutomi, H. : Field report on the damage induced by the 1993 southwest Hokkaido earthquake,
Chapter 4, Tsunami, Japan Society of Civil Engineers, pp.76-106, 1997 (in Japanese) 13) Goto, C. and Sato, K. (1993): Development of Tsunami Numerical Simulation System for Sanriku Coast in Japan, Report of the
Port and Harbor Research Institute, Vol. 32, No. 2, pp.3 44 (in Japanese). 14) Manshinha, L. and D. E. Smylie (1971): The Displacement Field of Inclined Faults, Bulletin of the Seismological Society of
America, Vol. 61, No.5, pp.1433 1440 15) Hasegawa, K., Suzuki, T., Inagaki, K., and Shuto, N. : A study on the mesh size and time increment in the numerical simulation of
tsunamis, Proceedings of Japan Society of Civil Engineers, No.381/II-7, pp.111-120, 1987 (in Japanese). 16) Aida, I.: Reliability of a tsunami source model derived from fault parameters, Journal of Physics of Earth, Vol.26, pp. 57 73, 1978. 17) Hagiwara, T. (eds) : Historical Earthquakes No.2 -Real and Virtual Image-, University of Tokyo Press, 434p, 1989 (in Japanese).
-112-