Embed Size (px)
Citation preview
ACC
EPTE
D M
ANU
SCR
IPT
ACCEPTED MANUSCRIPT
Source of the tsunami generated by the 1650 AD eruption of Kolumbo
submarine volcano (Aegean Sea, Greece).
Martina Ulvrova a, R. Paris
b,*, P. Nomikou
c, K. Kelfoun
b, S. Leibrandt
b, D.R. Tappin
d,
F.W. McCoy e
a University of Lyon 1, ENS, CNRS LGL-TPE, F-69342, Lyon, France
b Laboratoire Magmas et Volcans, Université Blaise Pascal - CNRS - IRD, OPGC, 5 rue Kessler, F-63038
Clermont Ferrand, France
c University of Athens, Faculty of Geology and Geoenvironment, Panepistimioupoli Zografou, 15784 Athens,
Greece
d British Geological Survey, Environmental Science Centre, Nicker Hill, Keyworth NG12 5GG, United
Kingdom
e University of Hawaii – WCC, Kaneohe 96744, Hawaii, USA
* Corresponding author at: Laboratoire Magmas & Volcans, Université Blaise Pascal - CNRS - IRD, OPGC, 5
rue Kessler, 63038 Clermont Ferrand, France. Tel. : +33 473346717. E-mail address: [email protected]
bpclermont.fr (Raphaël Paris).
ACC
EPTE
D M
ANU
SCR
IPT
ACCEPTED MANUSCRIPT
Abstract: The 1650 AD explosive eruption of Kolumbo submarine volcano (Aegean Sea, Greece) generated a
destructive tsunami. In this paper we propose a source mechanism of this poorly documented tsunami using both
geological investigations and numerical simulations. Sedimentary evidence of the 1650 AD tsunami was found
along the coast of Santorini Island at maximum altitudes ranging between 3.5 m a.s.l. (Perissa, southern coast)
and 20 m a.s.l. (Monolithos, eastern coast), corresponding to a minimum inundation of 360 and 630 m
respectively. Tsunami deposits consist of an irregular 5 to 30 cm thick layer of dark grey sand that overlies
pumiceous deposits erupted during the Minoan eruption and are found at depths of 30-50 cm below the surface.
Composition of the tsunami sand is similar to the composition of the present-day beach sand but differs from the
pumiceous gravelly deposits on which it rests. The spatial distribution of the tsunami deposits was compared to
available historical records and to the results of numerical simulations of tsunami inundation. Different source
mechanisms were tested: earthquakes, underwater explosions, caldera collapse, and pyroclastic flows. The most
probable source of the 1650 AD Kolumbo tsunami is a 250 m high water surface displacement generated by
underwater explosion with an energy of ~2 × 10¹⁶
J at water depths between 20 and 150 m. The tsunamigenic
explosion(s) occurred on September 29, 1650 during the transition between submarine and subaerial phases of
the eruption. Caldera subsidence is not an efficient tsunami source mechanism as short (and probably unrealistic)
collapse durations (< 5 minutes) are needed. Pyroclastic flows cannot be discarded, but the required flux (106 to
107 m³.s
-1) is exceptionally high compared to the magnitude of the eruption.
Keywords: tsunami, submarine volcanism, underwater explosion, caldera collapse, pyroclastic flow, Kolumbo
volcano, Santorini, Aegean Sea.

ACC
EPTE
D M
ANU
SCR
IPT
ACCEPTED MANUSCRIPT
1. Introduction
Determining the source of tsunamis generated during shallow-water and near-shore explosive
eruptions is often problematic (e.g. 1883 Krakatau, 3.6 ka Santorini), because several
processes might be potentially at the origin of tsunamis: pyroclastic flows, underwater
explosions, earthquakes, caldera subsidence, and flank instabilities (e.g. Nomanbhoy &
Satake, 1995; Maeno & Imamura, 2011; Novikova et al., 2011; Paris et al., 2014a). The 1650
eruption of Kolumbo submarine volcano, 7 km north-east of Santorini (Fig. 1), generated a
destructive tsunami in the Aegean Sea (Fouqué, 1879). The source of the tsunami(s) is not
clarified and its magnitude has been discussed (Dominey-Howes et al., 2000; Nomikou et al.,
2014).
With a basal diameter of 3 km, Kolumbo is the largest of a SW-NE alignment of submarine
volcanic cones. Kolumbo volcanic complex mostly consists of vertically stacked
volcaniclastic units with a summed volume of 13-22 km³ (Hübscher et al., 2015).
Volcaniclastic deposits associated with the 1650 AD eruption cover an area of 446 km²
around the crater (Fuller, 2015), thus representing a minimum volume of ~5 km³, i.e. 2 km³
dense rock equivalent (Nomikou et al., 2012; Hübscher et al., 2015). Remotely operated
vehicle (ROV) exploration of the volcano revealed thick and rapidly accumulated pyroclastic
deposits on the northern and southwest walls of the crater (Nomikou et al., 2012, 2014).
Pumice sampled by ROV is fresh, highly vesiculated, crystal-poor, and interstitial glass has a
rhyolitic composition (Cantner et al., 2014). The bedded structure of the proximal pyroclastic
deposits suggests multiple explosions and collapses that led to the formation of a 1700 m
large, 500 m deep crater (Nomikou et al., 2012, 2014; Cantner et al., 2014). Distal deposits
are cross-bedded and preferentially accumulated in the basins at distances up to 19 km from
the crater (Fuller, 2015). These deposits were emplaced by sediment gravity flows generated
by submarine eruption column collapse, with a significant fine ash fraction issued from surges
over the sea surface and vertical gravity currents driven by Rayleigh-Taylor instabilities
(Fuller, 2015).
Dominey-Howes et al. (2000) did not identify field evidence of the 1650 AD tsunami along
the shores of Santorini, and thus considered problems related to the poor preservation and
discontinuity of onshore high-energy deposits, and a possible overestimation of the magnitude
of the tsunami. The aim of this paper is to re-investigate sedimentary evidence for the 1650
ACC
EPTE
D M
ANU
SCR
IPT
ACCEPTED MANUSCRIPT
Kolumbo tsunami along the coast of Santorini and test different source mechanisms
(earthquakes, underwater explosions, caldera collapse, and pyroclastic flows) through
numerical simulations. Note that the high-resolution bathymetry of the studied area (Nomikou
et al., 2012; 2013) did not reveal any evidence of hummocky or irregular topography that
could be interpreted as a debris-avalanche deposit which would suggest flank instability that
could be associated to the 1650 AD eruption. Thus, we decided not to consider a submarine
slope failure of the edifice as a possible tsunami source.
2. Historical observations of the eruption
The aftermath of the 1650 AD eruption of Kolumbo volcano was described mostly by priests
and travellers, and these testimonies were later summarized by Stefanou (1878), Fouqué
(1879) and Mindrinos (2001). Precursory earthquakes were felt on Santorini Island in 1649
and in March 1650, and persisted during the eruption that started in September 1650. Cantner
et al. (2014) proposed a three phase eruptive sequence. The first phase consisted of degassing-
driven submarine activity manifested by subterranean roarings and discolored water
(September 1650). Eruption columns breached the sea surface on September 27, when the
emergence of a white ledge was accompanied by intermittent jets of gas and ash. A small islet
was then observed rising from the water surface and phreatomagmatic activity became
dominant. The sea was progressively covered with pumice, thus confirming fragmentation of
a volatile-rich silicic magma. The morphology of the particles observed with a SEM can be
attributed to fragmentation by both primary volatile degassing and phreatomagmatic activity
(Fuller, 2015).
The paroxysmal subaerial phase started on September 29. Cantner et al. (2014) estimated that
this second phase was still driven by volatile exsolution, but with significant phreatomagmatic
fragmentation. Explosions were heard as far away as 400 km in the Dardanelles (between the
Aegean and Marmara seas), fine ash was deposited in western Turkey, and earthquakes were
felt in Crete (Fig. 1). Eyewitness accounts mentioned that one of the quakes was particularly
long, violent and destructive. Acidic gas released by the eruption affected the inhabitants and
animals of Santorini. At least seventy people staying offshore or along the north-eastern coast
of Santorini died from asphyxiation. Men approaching the eruption site by boat on October 2

ACC
EPTE
D M
ANU
SCR
IPT
ACCEPTED MANUSCRIPT
were found burnt, but there is no clear evidence of pyroclastic surges flowing over water to
reach the coast of Santorini, as occurred during the 1883 eruption of Krakatau (Carey et al.,
1996; Paris et al., 2014b).
During the September 29 paroxysm, a tsunami was observed on the coast of Santorini, where
it eroded 2 km² of land, revealed Hellenistic and Byzantine ruins (Kamari, Perissa), uprooted
many trees, and destroyed five churches. Texts collected by the monks of Mount Athos
mentioned that the leading wave was negative (trough) and associated with sea retreat,
followed by inundation up to 3 km inland (Mindrinos, 2001). However, this information does
not appear in the other reports. Tsunami also impacted neighbouring islands, especially Ios
and Sikinos, located more than 20 km northwest of the volcano (Fig. 1). In Ios, a wave runup
of 20 m a.s.l. associated with pumice deposition was observed on a rocky shore. In Sikinos,
the tsunami penetrated 240 m inland (Fouqué, 1879: ―350 pas‖, erroneously translated as feet
in many publications). Sea agitation and damage to ships were mentioned at Kea Island (150
km Northwest of Kolumbo) and Crete (island of Dia and town of Chania, respectively 120
and 165 km to the South). Available testimonies mention nothing about the timing and
number of tsunamis observed on September 29. It is thus difficult to associate tsunami
generation with one particular process or substage of volcanic activity.
Paroxysmal activity continued throughout September 30, and then decreased during the
following days. Sporadic explosions and gas release persisted until November (waning
phase), and the eruption ended in December 1650. The islet was eroded within four months
after the eruption (Fouqué, 1879). The top of the volcano is now at a depth of 18 m (truncated
cone on the southwestern flank) and the rim of the crater range between 150 and 200 m deep
(Nomikou et al., 2012). There were no eruptions observed since 1650, but there is converging
evidence for an active magma reservoir (Bohnhoff et al., 2006; Dimitriadis et al., 2009, 2010),
and accumulation of acidic water and intense CO2 degassing in the crater ( Carey et al., 2013;
Kilias et al., 2013).
3. Methods
3.1 Field and laboratory investigations on tsunami deposits
ACC
EPTE
D M
ANU
SCR
IPT
ACCEPTED MANUSCRIPT
About fifty trenches were excavated in different areas of Santorini Island, especially in
Perissa, Kamari, Monolithos and Cape Kolumbos (Fig. 1), in order to identify sedimentary
evidence of the 1650 tsunami. Sediments were retrieved manually and analysed for
composition, grain size and morphometry, using an apochromatic corrected stereomicroscope
and a particle analyser (Malvern Morphologi G3: Leibrandt and Le Pennec, 2015). The G3
analyser first separates particles using an integrated disperser, captures images of individual
particles down to 0.5 microns, and measures a range of size (diameter, perimeter, width,
length, area) and shape parameters (e.g. aspect ratio, circularity, solidity, convexity, and
elongation). Analysis of shape parameters were focused on fine-to-medium sands (160-400
µm) for two reasons: (1) these fractions are well represented in the three types of sediments
analysed (tsunami, soil, and beach deposits); (2) shape characteristics and evolution of fine
fractions (< 100 µm) in coastal environments are poorly documented.
3.2 Numerical simulations
Numerical simulations were performed with COMCOT (Cornell multi-grid coupled tsunami
model: Liu et al., 1995a; Liu et al., 1998) and VolcFlow (Kelfoun & Druitt, 2005; Kelfoun et
al., 2010) solving for the non-linear shallow water equations. Four source mechanisms were
tested: earthquake, underwater explosion, caldera collapse, and pyroclastic flow produced by
collapse of an eruptive column. Different scenarios were then examined to infer the influence
of input parameters, such as energy of explosion, duration and geometry of caldera collapse,
volume flux and density of pyroclastic flows.
We used COMCOT to simulate tsunamis generated by an earthquake, an underwater
explosion and a caldera collapse. The COMCOT tsunami package has been extensively tested
and compared with laboratory experiments for solitary waves climbing a circular island (Liu
et al., 1995b). Different applications for various tsunamis events have been published
including the 2004 Indian Ocean tsunami (Wang and Liu, 2006) and the 1960 Chilean
tsunami recorded at Hilo, Hawaii (Liu et al., 1995a). Using an explicit leap-frog numerical
scheme (Cho, 1995) for nonlinear conservation equations of mass and momentum in spherical
geometry on a staggered grid allows finding a solution for the water surface elevation and

ACC
EPTE
D M
ANU
SCR
IPT
ACCEPTED MANUSCRIPT
velocities in the horizontal domain. Nonlinear convection terms are approximated using the
upwind scheme. A numerical algorithm is employed together with the leap-frog method to
find the limit between the dry and wet cells tracking the shoreline movements in time and
space (Liu et al., 1995b). Numerical sponge layer at the limit of the computational domain is
prescribed where the amplitude of incoming waves is dampened. This avoids reflections from
the end-walls.
Water surface perturbation and velocity of waves generated by pyroclastic flows entering
seawater are simulated using the Volcflow numerical package, which is able to dynamically
model any kind of mass flow and related tsunami (e.g. Kelfoun et al., 2010; Giachetti et al.,
2011, 2012; Paris et al., 2011). Solving for the shallow water equations on a regular Cartesian
grid is employed using an Eulerian explicit upwind numerical scheme (Kelfoun & Druitt,
2005). Open boundaries are prescribed at the limits of the computational domain. Interaction
of water and bathymetry/topography is allowed and flooding on dry land is also computed. In
both numerical models we neglect the second order processes that would alter the solution,
especially wave breaking near the shore and physical dispersion (which is negligible here,
since we limit our analysis to the proximal field). The grid has a resolution of 50 m (1258 x
1253 nodes), covering a 4000 m² area between Santorini, Anafi, Amorgos and Ios islands
(Fig. 1). Typical water depths of the interisland basins range between 400 and 500 m.
3.3 Definition of tsunami source mechanisms
Earthquake
During the September 29, 1650 volcanic paroxysm, one of the earthquakes had a particularly
long duration and was violent and destructive (Fouqué, 1879). Precise origin and magnitude
of the earthquake are unknown. The NE-SW to ENE-WSW trending tectonic features of the
Central Aegean such as the Amorgos fault zone, the Santorini-Amorgos Ridge, the Anafi fault
zone and the related sedimentary Anhydros, Amorgos and Anafi basins, were developed
during a Plio-Quaternary phase of extension (Kilias et al., 2013). The Amorgos fault zone
marks a major structural boundary in a dextral transtensional regime incorporating subparallel
fault zones with kinematic characteristics of both normal and strike slip faulting, and genetic
relation to the Kolumbo volcanic chain (Nomikou et al., 2012; Hübscher et al., 2015). The 9th

ACC
EPTE
D M
ANU
SCR
IPT
ACCEPTED MANUSCRIPT
July 1956 Mw 7.8 earthquake south of Amorgos Island was the largest to affect Greece in the
20th century (Papadopoulos et al., 1992). The rupture was on the eastern termination of the
Santorini-Amorgos Ridge. The earthquake generated a tsunami with wave runups up to 3 m
on the coasts of Santorini (Okal et al., 2009).
In order to test an earthquake origin for the 1650 AD tsunami, we simulate different scenarios
of earthquakes located along the SW-NE Santorini – Kolumbo line, with an epicentre located
8 km northeast of Kolumbo volcano. The tectonic earthquakes simulated have a strike-slip
mechanism (slip angle = 260°, strike angle = 45°) along a 75 × 40 km fault (area equivalent to
the 1956 event), with a focal depth ranging from 6 to 15 km, and a slip dislocation from 2 to
15 m. We also tested earthquakes with similar parameters but smaller rupture scale (down to
10 × 3 km). The moment magnitudes of the earthquakes thus range between Mw = 6.1 and Mw
= 8.1 (a magnitude that is highly improbable in the study area).
Underwater explosion
Generation of waves by underwater explosions is well documented (Le Méhauté, 1971;
Duffy, 1992; Le Méhauté & Wang, 1996; Egorov, 2007). Immediately following the
explosion, a water crater is formed at certain conditions depending on the water depth and the
energy of explosion. Subsequent (1) expansion of the crater rim, (2) and rise and gravitational
collapse of a water dome create two successive bores followed by a number of smaller
undulations propagating radially from the source. Following the work of Torsvik et al. (2010)
and Ulvrova et al. (2014), we adopt a semi-analytical approach where the dynamics of the
underwater explosion is neglected by simply imposing an initial water disturbance whose
propagation is modelled numerically. Initial surface displacement can be estimated as a
function of explosion energy at a given depth, using the empirical formula of Le Méhaute &
Wang (1996):
ƞ 0 = c E0.24
(Eq. 1)
where ƞ 0 is the vertical initial surface displacement in meters, E the energy of explosion in
joules and c a constant. According to the explosion yield and water depth, two cases are
distinguished (Le Méhaute & Wang, 1996): (1) c = 0.014 for smaller explosions for which
holds 0.076 < d/W1/3
< 2.286 (d: the depth of explosion in meters; W: the explosion yield in
ACC
EPTE
D M
ANU
SCR
IPT
ACCEPTED MANUSCRIPT
pounds of TNT); (2) c = 0.029 for larger explosions where 0 < d/W1/3
< 0.076. A shallower
explosion thus causes a deeper water crater for the same yield.
The wave field is satisfactorily reproduced at a far distance from the source by approximating
the source with a parabolic crater that has a steep vertical rim. This approach has been applied
by Torsvik et al. (2010) and Ulvrova et al. (2014) to simulate tsunami generated by sub-
lacustrine volcanic explosions at Karymskoye Lake (Kamchatka, Russia) in 1996. Ulvrova et
al. (2014) also tested different scenarios of underwater explosions at Kolumbo as a tsunami
hazard for the coasts of Santorini Island. It is difficult to accurately estimate the depth of
explosions during the 1650 AD, so we decided testing a wide range of initial surface
displacements (from 50 to 300 m), corresponding to explosion energies of ~3×10¹⁴
J to
5.4×10¹⁶
J at water depths between 20 and 150 m.
Caldera collapse
Assuming that the present-day caldera was formed during the 1650 AD eruption, we
reconstructed the pre-1650 bathymetry by filling up the caldera. The initial condition is a
collapse of the central part of the edifice generating a subsidence of the water surface and
propagation of a leading trough. This source mechanism has been already tested for several
case studies (Nomanbhoy and Satake, 1995; Maeno et al., 2006; Maeno and Imamura, 2011).
The initial subsidence of the water surface depends on the geometry and duration of the
collapse. At each time-step changes of the bathymetry are followed by changes of the water
surface so that water depth remains constant through time. Three different geometries were
tested: (1) model 1 is a full-volume collapse with a final geometry corresponding to the
present-day caldera; (2) model 2 simulates a collapse of the upper half of the caldera; (3)
model 3 is a deepening of model 2 by collapsing the lower half of the caldera (thus assuming
a pre-existing caldera or a 2-step collapse). We also tested different values of collapse
duration, from 1 minute to 2 hours. Indeed, the duration of a caldera collapse is poorly
constrained (from minutes to hours), and field and experimental studies suggest various
geometries and collapse mechanisms (Roche et al., 2000; Stix & Kobayashi, 2008). Maeno
and Imamura (2011) found that the water elevation above the caldera was the largest for a
dimensionless collapse speed Vc* = 0.01 (with Vc*=Vc/√gh).
ACC
EPTE
D M
ANU
SCR
IPT
ACCEPTED MANUSCRIPT
Pyroclastic flow
Here the assumption is that the source of the tsunami is a pyroclastic flow resulting from the
gravitational collapse of an eruptive column. Watts and Waythomas (2003) demonstrated that
the most energetic and coherent water waves are produced by the dense, basal debris flow
component of the pyroclastic flow. Other phenomena such as steam explosion, flow pressure
and shear, and pressure impulse theoretically generate smaller waves (Watts and Waythomas,
2003; Tinti et al., 2003). The important parameters controlling the interactions between
pyroclastic flows and water bodies are the bulk density of the flow and its preservation or
disaggregation underwater, the discharge rate, the angle of incidence, and the transport
distance from the vent (e.g. Cas and Wright, 1991). Freundt (2003) showed that flows with a
bulk density near that of water generate waves, whatever their temperature.
In our model, a pyroclastic flow is generated in the subaerial field and penetrates water with a
given rheology, density, volume and volume flux. The bathymetry used for these simulations
is modified in the inner parts of the crater so that there is an artificial positive topography
(islet). The flowing mass is initiated just right above the water surface and spreads radially.
VolcFlow model dynamically reproduces the coupling between the flowing mass and the
water at each time step level, but we neglect 3D interactions between water and particles as
well as any mixing between the two phases and syn-depositional changes of flow dynamics.
Input parameters range between 1100 to 1500 kg.m-³ for the density of the pyroclastic flow,
from 5 × 10⁶ to 100 × 10
6 m³ for its volume, from 5 to 30 m.s
-1 for the flow velocity at the
shoreline, and from 104 to 10
7 m³.s
-1 for the volume flux. A constant retarding stress of 5 kPa
is applied, as recommended by Kelfoun (2011) for pyroclastic flows. The maximum volume
of pyroclastic flow simulated (0.1 km³) is small compared to the total erupted volume (~2 km³
DRE), but the structure of the deposits both in the proximal and distal fields suggests multiple
flows and there is no massive subunit dominating the sedimentary record (Nomikou et al.,
2012; Fuller, 2015).
4. Results
4.1. Sedimentary evidences of the 1650 AD Kolumbo tsunami
ACC
EPTE
D M
ANU
SCR
IPT
ACCEPTED MANUSCRIPT
Cape Kolumbos (Northeast Santorini)
The north-eastern coast of Santorini island is dominated by cliffs carved in the Minoan
ignimbrite, a setting that does not favour the preservation of tsunami deposits. Coarse sand-to-
pebble beaches are developed at the base of the cliffs. The surface of the ignimbrite is
reworked by pedogenesis and slope processes and pyroclastic deposits associated with the
1650 eruption have not been found preserved on Santorini Island. Possible evidence of a
tsunami was found near the southern flank of the tuff cone of Cape Kolumbos (Fig. 1). At
depths below the surface of 30-50 cm, the Minoan ash is overlain by a 5-10 cm thick layer of
dark grey sand, with pebbles and boulders at the base of the deposit. The lower contact is
clearly erosional. The sandy layer is discontinuous, sometimes absent or reworked, but could
be traced up to 14 m a.s.l. (at 190 m from the present-day shoreline). It is poorly sorted, with
clasts ranging from fine sand to fine gravel. The composition of the sand reflects the mixing
between two sediment sources: coastal sediments (beach, near shore) and the Minoan
ignimbrite (pumiceous ash). The present-day beach is composed of dark minerals (30%
pyroxenes, magnetite and other heavy minerals), fragments of basaltic to andesitic lavas (20-
25%), feldspars (30%), altered lavas with a reddish colour (10%) and pumice with veins of
obsidian (5%). The sandy layer is a plausible candidate for a post-Minoan tsunami because it
has a composition almost similar to the beach, except that it is enriched in pumice shards (20-
30%) and relatively depleted in dark minerals (15%). There are no marine macrofauna (e.g.
fragments of shells), both in the modern beach sand and in the dark sand layer in the Cape
Kolumbos area.
Monolithos (East Santorini)
Another possible evidence of tsunami was found in the Monolithos area, where slopes are
gentle and cliffs poorly developed, thus favouring the preservation of tsunami deposits. The
dark beach-like sand, as observed in the Kolumbos area, is typically about 30 cm below the
surface, and is overlain by soil and rests uncomformably on reworked Minoan deposits (pre-
tsunami soil on fig. 2). The soil overlying the dark grey sand contains abundant pumice lapilli,
few of them (< 10%) displaying biotite, a mineral that is absent in Santorini but present in the
eruptive products of Kolumbo volcano (2 % in the mineral assemblage of the 1650 pumice:
ACC
EPTE
D M
ANU
SCR
IPT
ACCEPTED MANUSCRIPT
Cantner et al., 2014). The dark sandy layer is particularly well defined in vineyards 150-200
m from the shore, and discontinuous lenses of sand are present up to 630 m inland (about 20
m a.s.l.). The thickness of the dark grey sand ranges between 5 and 10 cm and the layer
occasionally turns to lenticular bodies affected by convolute bedding. Sorting is poor and
there is no apparent size grading. Compared to the beach sand, the dark sand has less dark
minerals (10-15%), and the proportion of feldspars and pumice increases upslope (from 15%
at 160 m to 25 % at 630 m from the shore). The composition is dominated by fragments of
mafic lavas (40 to 60 %, decreasing upslope). Note that these abundances are estimated on
sand-size fractions observed under a binocular microscope. Finer fractions mostly consist of
pumiceous ash. Morphometric analysis on the 160-400 µm fraction of modern beach sand,
soil (below dark sand) and dark sand confirms similarities between beach sand and dark sand
in terms of shape parameters, in particular solidity, convexity and circularity (Fig. 3).
Kamari (East Santorini)
At Kamari (6 m a.s.l.), archaeological excavations revealed Byzantine foundations buried by
more than 50 cm of reworked Minoan tephra (from ash to lapilli size). Pebbles and rounded
pumice lapilli on top of the sequence represent the only possible evidence of tsunami, but the
layer is poorly preserved.
Perissa (South Santorini)
The stratigraphic sequence in the lowland area of Perissa (Fig. 1) is similar to the succession
observed in the vineyards of Monolithos. The light brown soil is overlaid by dark grey sand at
40 cm deep. The sand layer is 10-30 cm thick and could be traced up to 360 m inland (3.5 m
a.s.l.). The best exposure of the dark grey sand is located in the parking lot at the Hotel Porto
Perissa (Fig 4). There is no apparent vertical grading. Dominant grain sizes are medium to
fine sands with a composition similar to the modern beach (as in Monolithos): dominant
population is feldspar (45-50 %, with 10% showing evidence of marine abrasion), followed
by fragments of mafic lavas (20-30 %), dark minerals (15-20 %), altered rocks (5 %), pumices
(3 %) and rare bioclasts (2 % fragments of bivalve shells and marine gastropods). There are
many cobbles and pebbles of mafic lavas at the base of the dark grey sand layer. As in

ACC
EPTE
D M
ANU
SCR
IPT
ACCEPTED MANUSCRIPT
Monolithos, there are abundant pumice lapilli in the soil overlying the dark grey sand, but we
could not find any pumice with biotite (i.e. from Kolumbo volcano).
Sikinos and Ios islands
Rounded pumice lapilli with biotite (i.e. from Kolumbo volcano) were found along the
southern and western coasts of Ios Island. At Kalamos, more than 40% of the rounded pumice
lapilli covering the soil display biotite crystals, but they are not clearly associated with any
sedimentological unit. On the southeastern coast of Sikinos, patches of gravel deposits with
pebbles and rounded pumice lapilli (30% of them with biotite) are preserved as terraces at
altitudes lower than 3 m a.s.l. on the rocky platform (Fig. 5).
4.2. Numerical simulations of tsunami
Earthquakes
A 1956-like rupture generates waves lower than 3 m along the coasts of Santorini and Anafi
(since our model does not include coastal effects such as wave breaking, these wave
amplitudes are estimated at artificial tide gages located ~200 m from the shoreline), and up to
4 m on the coasts of Ios. Due to wave refraction, the northern headlands of Santorini are more
impacted than the others coasts (wave amplitude lower than 1.5 m). Increasing the vertical
dislocation to a value of 15 m (corresponding to a Mw ~8.1 earthquake) yields wave
amplitudes up to 5 m on the coasts of Santorini and Anafi, and up to 9 m at Ios. However, this
worst-case scenario is improbable, since it cannot be justified on the basis of the local tectonic
setting and earthquake history (e.g. Papadopoulos & Pavlides, 1992). Smaller ruptures
corresponding to Mw < 7.0 earthquakes generate wave amplitudes lower than 2 m in the
entire domain. The distribution of simulated wave heights is influenced by the SW-NE
orientation of the simulated rupture, corresponding to the Christiana-Santorini-Kolumbo
volcano-tectonic line (Nomikou et al., 2012). In all simulations, the island of Ios is thus more
impacted than Santorini and Anafi.

ACC
EPTE
D M
ANU
SCR
IPT
ACCEPTED MANUSCRIPT
Underwater explosions
Profiles of the wave trains generated by underwater explosions reflect the successive (1)
expansion and radial propagation of the (water) crater rim, followed by (2) the rise and
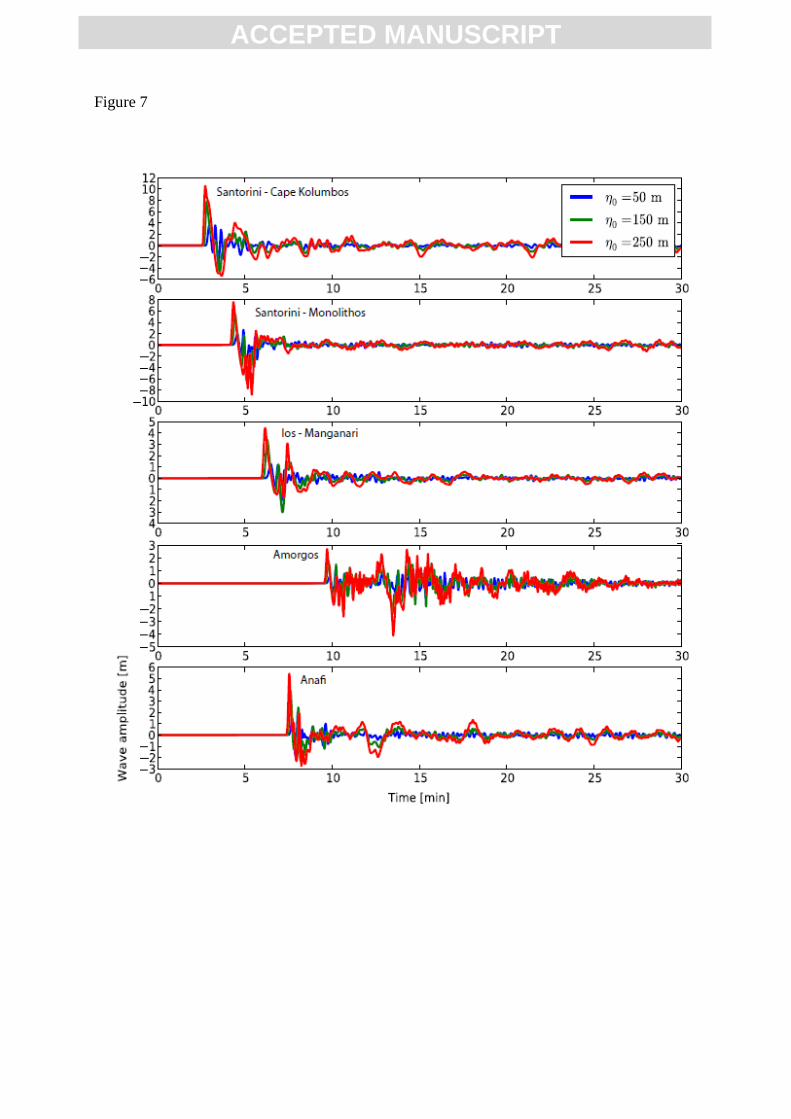
collapse of a water dome (Fig. 6). The wave train approaching the coast of Santorini is thus
characterised by two main waves: a leading positive wave (with the highest amplitude),
followed by a deep trough, a second lower wave, and smaller undulations during more than 30
minutes (Fig. 7). Due to the proximity of the source, all scenarios tested give similar results in
terms of arrival time: waves reach the north-eastern coast of Santorini 3-4 minutes after the
explosion, and Ios, Anafi and the southern coast of Santorini are impacted 5-6 minutes later
(Fig. 7). Wave periods near the coasts of Santorini range between 15 seconds (for ƞ 0 = 50 m)
and 1 minute (for ƞ 0 = 300 m), corresponding to wave lengths between 500 m and 1200 m.
Note that for small explosions (ƞ 0 ≤ 50 m), the non-linear shallow water equations are no
longer valid for water depths lower than 20-30 m.
Highest wave amplitudes are recorded on the northern and north-eastern coasts of Santorini
(e.g. around Cape Kolumbos), which are located 7 km from Kolumbo volcano. As the
distance from the source increase, maximum waves amplitudes decrease by a factor of 2 (e.g.
eastern coast of Santorini) to 4 (e.g. southern coast of Amorgos). For an initial surface
displacement ƞ 0 = 50 m corresponding to an explosion energy E = 3×10¹⁴
J, wave amplitudes
are lower than 4 m. The worst-case simulation (ƞ 0 = 300 m) gives wave amplitudes up to 12
m at Cape Kolumbos (north-eastern coast of Santorini), 8 m at Monolithos (eastern coast), 4
m at Perissa (southern coast), and 5 m on the coasts of Ios island (Fig. 8).
Caldera collapse
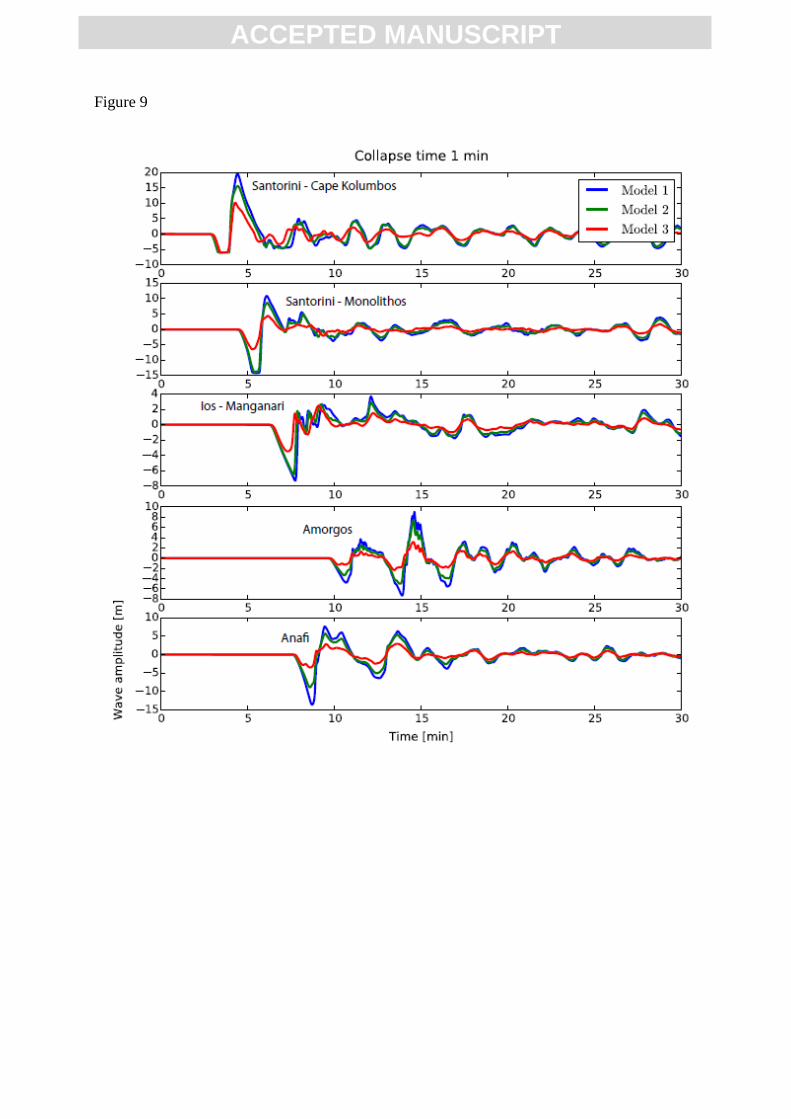
Wave profiles of caldera collapse models are characterised by a leading trough (negative
wave) followed by a succession of troughs and peaks (Fig. 9). For a collapse duration of 1
minute, the largest wave is the first one for the three models of collapse geometry (except at
Amorgos). Increasing the collapse duration results in more complex wave profiles due to
prolonged interactions between the waves and the coastal bathymetry. Wave periods typically
range between 90 and 120 seconds near the shore. Modifying the geometry of the collapse
does not affect the overall geometry of the wave profile nor the wave period, but directly
influences the wave amplitudes. For instance, a full-volume collapse yields wave amplitudes

ACC
EPTE
D M
ANU
SCR
IPT
ACCEPTED MANUSCRIPT
1.2 to 1.5 higher than a collapse of the upper half of the caldera, whatever the duration (Fig.
9). Deepening the caldera to its lower half generates waves 1.5 to 2.5 times lower than a
collapse of the upper half (waves recorded near the coasts).
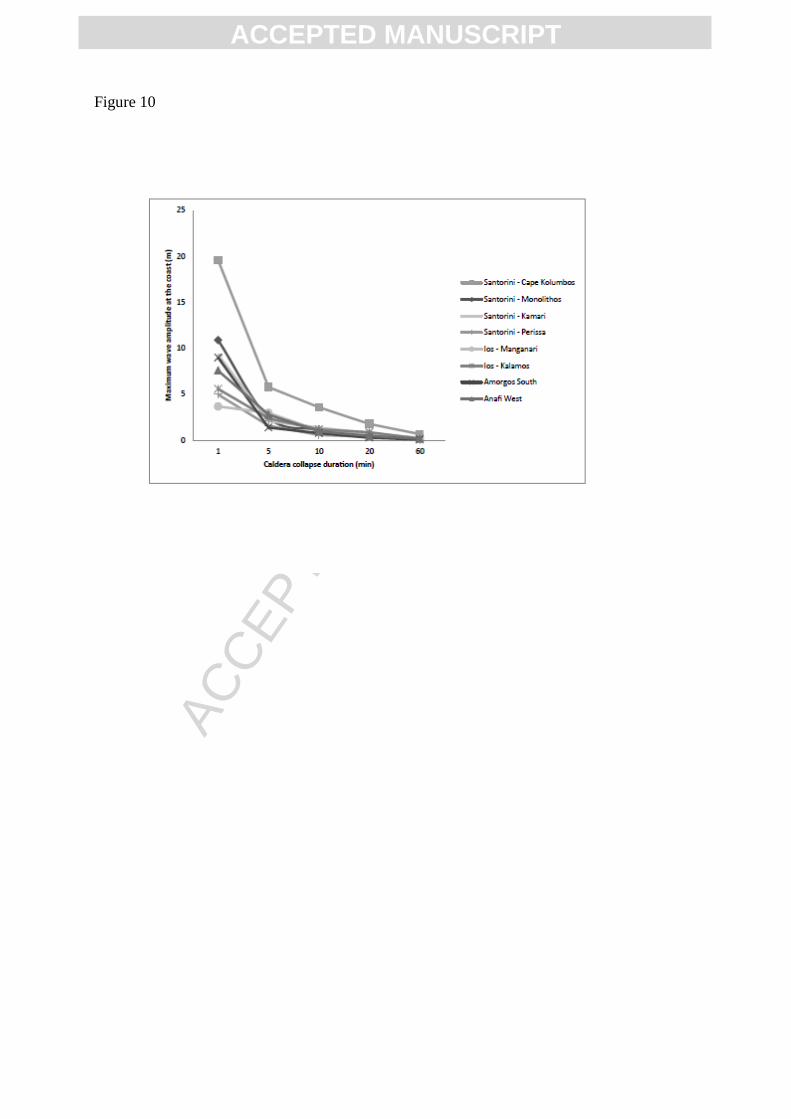
The initial amplitude of the water subsidence and subsequent waves depends on the duration
of the collapse: a full-volume collapse lasting more than 20 minutes generates waves lower
than 2 m on all the coasts (Fig. 10). Wave amplitudes are still lower than 3 m for a 5 minutes
long collapse, except at Cape Kolumbos (6 m). A fast and massive collapse (1 minute, full-
volume) produces a large tsunami over the entire grid, with wave amplitudes up to 20 m at
Cape Kolumbos, 6 m at Ios and 8 m at Anafi. However, the physical feasibility of such a
scenario is questionable (see discussion).
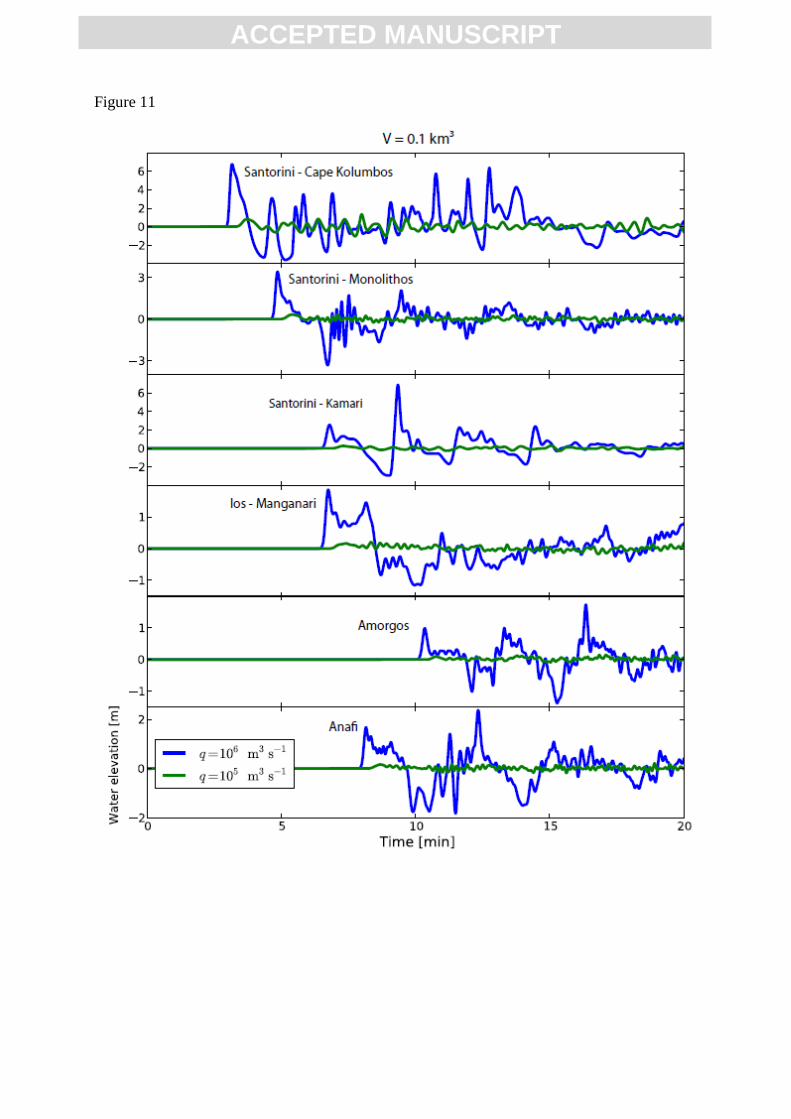
Pyroclastic flows
The discharge of pyroclastic flows into the sea generates complex wave profiles (Fig. 11) due
to the coupling between the flowing mass and the wave field. As for the explosion scenarios,
the leading wave arrives at the north-eastern coast of Santorini 3 minutes after the entrance of
the pyroclastic flow into the sea. The southern coast of Santorini and the islands of Ios and
Anafi are impacted 4-5 minutes later. Wave periods increase with increasing volume and
volume flux of pyroclastic flow. The water depth vs. wave lengths ratio falls in the range of
applicability of the shallow-water equations.
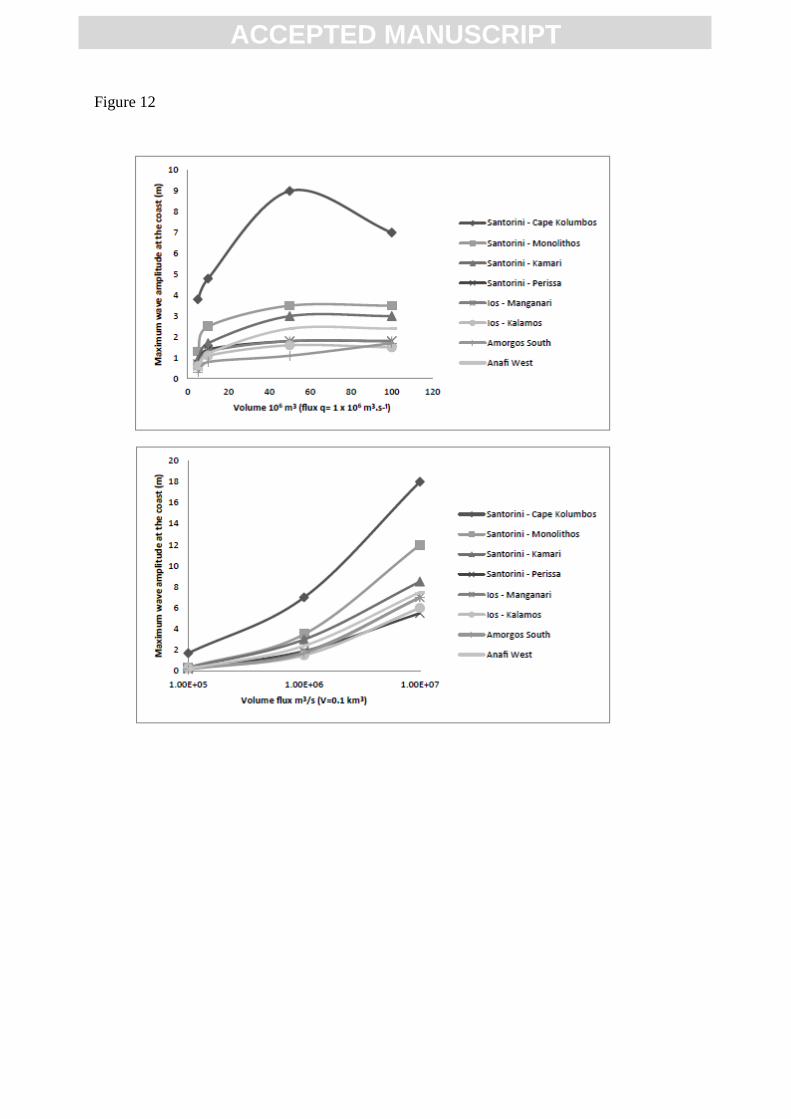
For a given volume and flux, increasing the density of the flow from 1100 to 1500 kg.m-³
induces a slight increase of wave amplitudes. For a given volume flux q = 106 m³.s
-1, wave
amplitude increases with increasing volume until a critical value of ~50 × 106 m³ is reached
(Fig. 12a). Finally, the main parameter controlling the wave patterns is the volume flux (Fig.
12b). Three orders of magnitude are compared. For a volume V = 0.1 km³ and a volume flux
q = 105 m³.s
-1, wave amplitudes are lower than 2 m at Perissa (south Santorini), Ios and
Amorgos, with a peak amplitude of 7 m at Cape Kolumbos (north Santorini). A similar
volume discharged at a flux q = 106 m³.s
-1 yields amplitudes 2.5 to 4 times larger (6-18 m).
5. Discussion: source of the 1650 AD tsunami
ACC
EPTE
D M
ANU
SCR
IPT
ACCEPTED MANUSCRIPT
Dominey-Howes et al. (2000) claimed that the 1650 tsunami was not preserved on the coasts
of Santorini or was overestimated in terms of magnitude. However, our work clearly shows
that sedimentary evidence is locally preserved. The identification of a distinct layer of beach-
like dark grey sand mixed with reworked products of the Minoan ignimbrite at several
locations is evidence of post-Minoan high-energy marine flooding (including marine
macrofauna at Perissa). The nature and especially the low organic content of the sediments
and low abundances of bioclasts prevented 14
C dating. The thickness of soil developed over
the dark grey sand is consistent with an age of 250-500 years (e.g. Sauer, 2010). The
maximum altitudes of the dark grey sand, 14 m and 20 m a.s.l. at Cape Kolumbos and
Monolithos respectively, exclude a storm origin, because maximum significant wave heights
are lower than 4 m on the coasts of Santorini (e.g. Mazarakis et al., 2012). In the tsunami
history of the Aegean Sea, there is no event that could explain these values of wave runup,
except the 1650 AD tsunami (Papadopoulos & Fokaefs, 2005). The tsunami waves generated
by the 1956 Amorgos earthquake did not exceed 3 m around Santorini (Perissa: Okal et al.,
2009).
The absence or low abundance of marine bioclasts in the dark grey sand could be used as
criteria for eliminating a tsunami origin. Tests of ostracods, molluscs, diatoms, foraminifera
and nannoliths are often mentioned in tsunami deposits, but recent events such as the 2011
Tohoku-oki tsunami demonstrated that in some cases tsunamis may not transfer large volume
of marine sediments inland (e.g. Szczuciński et al., 2012). The steep submarine slopes around
Santorini and the relatively short wave length of the 1650 tsunami might have limited the
mobilisation of marine sediments, the main source of sediments being the coastal and
nearshore zones. Note that the present-day beach sediments also have very low abundances of
bioclasts.
Rounded pumice lapilli with more than 30 % of biotite-bearing pumice found at Ios and
Sikinos islands are other possible deposits of the 1650 AD event. Coastal deposits of rounded
pumice lapilli are usually interpreted as tephra originally deposited on the sea surface, thus
forming pumice rafts which are then reworked by tsunami and eventually left inland (e.g.
1883 Krakatau tsunami: Carey et al., 2000 ; Paris et al., 2014b). This interpretation could
explain the biotite-bearing pumice deposited in the Monolithos area, which is located 12 km
from Kolumbo volcano. Pumice rafts might have formed during the submarine phase of the
eruption. The rafts were then transported towards the northern and western coasts of Santorini
by currents and finally pushed more inland by tsunami waves. Coastal cliffs locally prevented
ACC
EPTE
D M
ANU
SCR
IPT
ACCEPTED MANUSCRIPT
deposition of pumice rafts inland (e.g. Cape Kolumbos). However, this hypothesis does not
work for biotite-bearing pumice found at Ios and Sikinos, because the distance from the
volcano is too far for the pumice rafts to reach these coasts before tsunami arrive. Another
explanation is that these pumice rafts were deposited on the coasts a few days or weeks after
the eruption and later reworked by storms or the 1956 tsunami.
Eyewitness accounts and spatial distribution of tsunami deposits can now be compared with
the results of numerical simulations. The landward limit of tsunami deposits differs from the
limit of inundation and thus represents a minimal value (55-95 % of the inundation distance,
depending on the topography and characteristics of the sediments available: Sugawara et al.,
2011; Abe et al., 2012; Chagué-Goff et al., 2012).
None of the earthquake scenarios tested can reproduce the minimum tsunami heights
associated with the 1650 AD tsunami deposits along the coasts of Santorini and other islands
in the area. Considering the important discrepancy between field observations of tsunami
deposits and the results of our simulations, an earthquake origin for the 1650 AD tsunami can
be discarded.
Underwater explosions producing water surface displacement lower than 100 m (ƞ 0 = 100 m)
generate wave amplitudes lower than 4 m on the coasts of Santorini (Fig. 8). Run up estimates
inland are lower than 8 m at Monolithos and 3 m at Perissa (Fig. 13). These scenarios cannot
explain the landward limit of tsunami deposits (up to 20 m a.s.l. at Monolithos). Higher
surface displacements at the source are required, corresponding to explosion energies E ≥ 1015
J. The energy of explosion can be estimated using an empirical relationship proposed by Sato
and Taniguchi (1997):
(Eq. 2)
with R being the radius of the crater (m). The size of the crater reflects the cumulated energy
of multiple explosions (e.g. Valentine et al., 2012), thus representing a maximum estimation
of explosive energy. Applying this relationship to Kolumbos crater (R = 850 m) suggests a
maximum energy of 2.2 × 10¹⁶
J. The associated water surface displacement ƞ 0 would reach
240 m for explosions initiated at water depths between 20 and 150 m. The results of our
simulation for ƞ 0 = 250 m fit with the landward limit of tsunami deposits, both on the north-
eastern and southern coasts of Santorini (Fig. 13).

ACC
EPTE
D M
ANU
SCR
IPT
ACCEPTED MANUSCRIPT
It is worth noting that many volcanic eruptions starting below the water surface are not
tsunamigenic, including Surtseyan-type phreatomagmatic eruptions. Compared to other
sources of underwater explosions (e.g. nuclear explosions), magma-water interactions are
complex and their physics is controlled by water depth, geometry of the vent and magma-
water interface, transfer of thermal energy, processes of intermingling and mixing between
magma and water, metastability of superheated water, and quantity of gas in the ascending
magma (Kokelaar, 1986; Wohletz, 1986; Morrissey et al., 2010). Violent steam explosions of
eruptions forming maars and tuff rings (1965 eruption of Taal, Philippines: Kokelaar, 1986)
are potentially more tsunamigenic than Surtseyan and other types of emergent volcanic
activity.
The caldera collapse scenario is the only one that could explain the negative leading wave
mentioned by some old texts (Mindrinos, 2001). A caldera collapse lasting for less than 5
minutes is theoretically tsunamigenic but probably unrealistic. Our worst-case scenario of
collapse (1 minute, full-volume) generates wave amplitudes up to 20 m at Cape Kolumbos, 11
m at Monolithos and 5 m at Perissa. Simulated runups agree with the distribution of tsunami
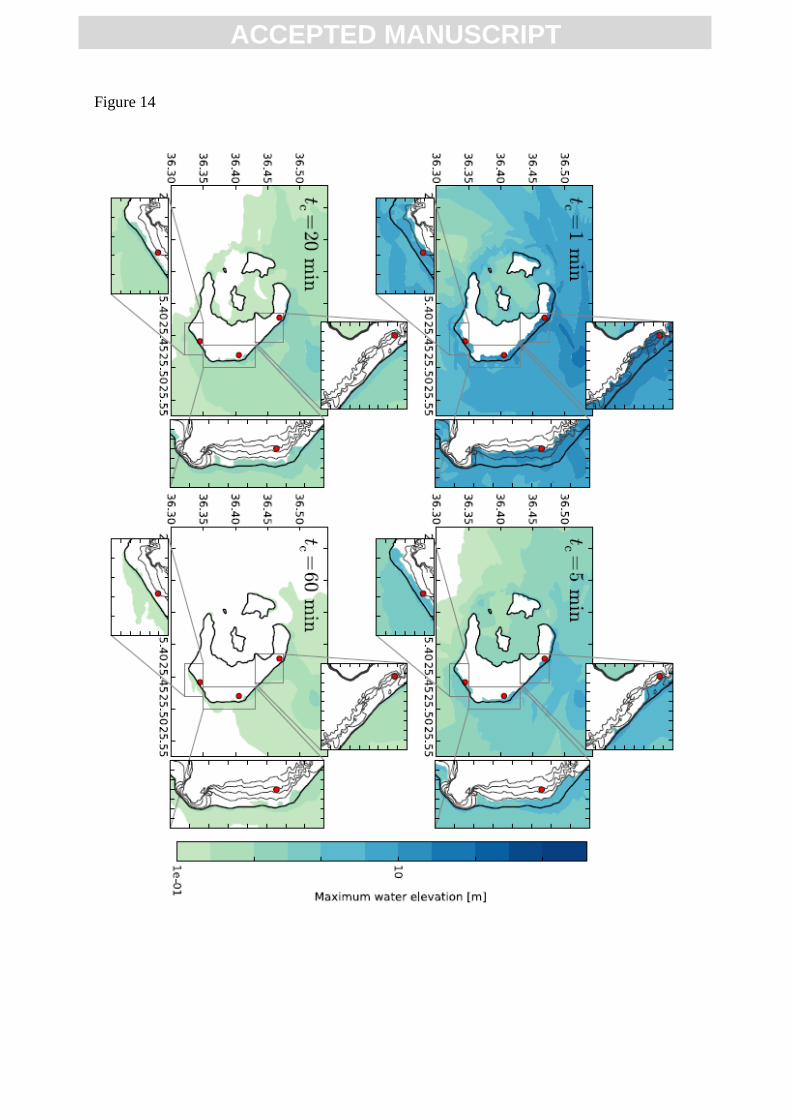
deposits inland (Fig. 14). However, the physical feasibility of such a scenario is questionable.
For instance, the incremental collapse of Fernandina basaltic volcano, Galapagos, consisted of
a series of discrete drops over a period of 12 days (Simkin & Howard, 1970). Calderas formed
during explosive eruptions of silicic magmas, as for Kolumbo volcano, are more rapid and en
masse. For instance, the bulk volume of the 1991 caldera collapse at Pinatubo, Philippines,
might have been subsided in 34 minutes (Scott et al., 1996). Considering that a full-volume
collapse lasting more than 20 minutes generates waves lower than 2 m on all the coasts, a
caldera-subsidence origin for the 1650 tsunami is excluded.
The emplacement of multiple pyroclastic flows around Kolumbo volcano during the 1650
eruption is evidenced by the structure of deposits observed along the walls of the crater (e.g.
wedge-shaped bedforms) and seismic records collected on the flanks (Nomikou et al., 2012).
The upper sequence of acoustically transparent or mostly chaotic deposits is interpreted as a
fan of pyroclastic gravity flow deposits. It is impossible to estimate the volume of individual
flow subunits. Whatever their flux, pyroclastic flows with a volume lower than 0.1 km³
generates small wave amplitudes (< 4 m at Monolithos and Perissa) and runups that do not fit
with the distribution of tsunami deposits (Fig. 15). A large-volume (V = 0.1 km³) but low-
discharge (q = 105 m³.s
-1) pyroclastic flow also generates very small waves. Our simulations
suggest that a pyroclastic flow with a volume V = 0.1 km³ and a flux q > 106 m³/s could
ACC
EPTE
D M
ANU
SCR
IPT
ACCEPTED MANUSCRIPT
explain the tsunami. The scenario q = 107 m³.s
-1 gives wave amplitudes of 18 m at Cape
Kolumbos, 12 m at Monolithos and 5.5 m at Perissa (Fig. 12), and the limit of inundation
slightly exceeds the limit of tsunami deposition (Fig. 15).
Maeno and Imamura (2011) found that the tsunami heights generated by a pyroclastic flow
with a volume V > 5 km³ and a flux q = 107 m³.s
-1 are consistent with historical records of the
1883 Krakatau tsunami in Sunda Strait. They concluded that the rapid discharge of a
pyroclastic flow is the most likely source mechanism for the largest tsunami observed in
Sunda Strait. It is difficult to compare these values of volume flux or discharge rate of
pyroclastic flows resulting from column collapse with estimations of total magma discharge
rates of large eruptions such as Pinatubo 1991 (Scott et al., 1996) or Tambora 1815 (Self et
al., 1984). With a DRE volume of ~2 km³, the 1650 AD eruption of Kolumbo volcano is one
order of magnitude smaller than the 1883 eruption of Krakatau (~10 km³ DRE, VEI 6: Self &
Rampino, 1981; Carey et al., 1996). It is improbable that pyroclastic flows generated by
column collapse at Kolumbo would have a similar flux (106 to 10
7 m³.s
-1) with a relatively
small volume (0.1 km³) compared to Krakatau, yielding an exceptionally (unrealistic) fast
emplacement.
Conclusion
Determining the source of tsunamis generated during shallow-water large eruptions (VEI ≥ 5)
is problematic because different tsunami source mechanisms might be involved: the caldera
collapse itself, but also subaerial pyroclastic flows, submarine sediment gravity flows,
underwater explosions, earthquakes, slope instabilities, and shock waves (Paris et al., 2014a).
Uncertainties over the source of the 1883 Krakatau, Late Bronze Age Santorini, and 1650 AD
Kolumbo tsunamis illustrate this complexity. When coupled with numerical simulations, the
identification of tsunami deposits onshore is a powerful tool for proposing scenarios of
tsunami source mechanisms and subsequent inundation. In the case of the 1650 AD Kolumbo
tsunami, the source mechanism that best matches with the spatial distribution of tsunami
deposits in Santorini is a 2 × 10¹⁶
J underwater explosion initiated at water depths <150 m.
The tsunamigenic explosion(s) occurred on September 29 at the transition between the
submarine and subaerial phases. Our results demonstrate that caldera subsidence is not an
efficient source of tsunami, as short (and probably unrealistic) collapse durations are needed.
Pyroclastic flows cannot be discarded, but a very high flux is required (106 to 10
7 m³.s
-1) to

ACC
EPTE
D M
ANU
SCR
IPT
ACCEPTED MANUSCRIPT
explain the landward limit of tsunami deposition. Additionally, this study provides scenarios
for tsunamis generated by future eruptions of Kolumbo volcano (Fytikas et al., 1990;
Vougioukalakis & Fytikas, 2005).
Acknowledgements
This research is funded by Laboratory of Excellence ClerVolc and ASTARTE collaborative
project FP7-ENV2013 6.4-3. The authors are grateful to all participants of the field surveys,
colleagues and two anonymous reviewers who helped in revising the paper. D.R. Tappin
published with the approval of the Executive Director of the British Geological Survey,
NERC. F.W. McCoy was supported through INSTAP funding. This is Laboratory of
Excellence ClerVolc contribution n° xx.

ACC
EPTE
D M
ANU
SCR
IPT
ACCEPTED MANUSCRIPT
References
Abe, T., Goto, K., Sugawara, D., 2012. Relationship between the maximum extent of tsunami
sand and the inundation limit of the 2011 Tohoku-oki tsunami on the Sendai Plain,
Japan. Sedimentary Geology 282, 142-150.
Bohnhoff, M., Rische, M., Meier, T., Becker, D., Stavrakakis, G., Harjes, H.-P., 2006.
Microseismic activity in the Hellenic Volcanic Arc, Greece, with emphasis on the
seismotectonic setting of the Santorini Amorgos zone. Tectonophysics 423, 17–33.
Cantner, K., Carey, S., Nomikou, P., 2014. Integrated volcanologic and petrologic analysis of
the 1650 AD eruption of Kolumbo submarine volcano, Greece. Journal of Volcanology
and Geothermal Research 269, 28-43.
Carey, S., Sigurdsson, H., Mandeville, C., Bronto, S., 1996. Pyroclastic flows and surges over
water: an example from the 1883 Krakatau eruption. Bulletin of Volcanology 57, 493-
511.
Carey, S., Morelli, D., Sigurdsson, H., Bronto, S., 2001. Tsunami deposits from major
explosive eruptions: An example from the 1883 eruption of Krakatau. Geology 29 (4),
347-350.
Carey, S., Nomikou, P., Bell, K. C., Lilley, M., Lupton, J., Roman, C., Stathopoulou, E.,
Bejelou, K., Ballard, R., 2013. CO2 degassing from hydrothermal vents at Kolumbo
submarine volcano, Greece, and the accumulation of acidic crater water. Geology 41,
1035–1038.
Cas, R.A.F., Wright, J.V., 1991. Subaqueous pyroclastic flows and ignimbrites: an
assessment. Bulletin of Volcanology 53, 357-380.
Chagué-Goff, C., Andrew, A., Szczuciński, W., Goff, J., Nishimura, Y., 2012. Geochemical
signatures up to the maximum inundation of the 2011 Tohoku-oki tsunami –
implications for the 869 AD Jogan and other palaeotsunamis. Sedimentary Geology
282, 65-77.
Cho, Y.S., 1995. Numerical simulations of tsunami and runup. PhD thesis, Cornell
University.
ACC
EPTE
D M
ANU
SCR
IPT
ACCEPTED MANUSCRIPT
Dimitriadis, I., Karagianni, E., Panagiotopoulos, D., Papazachos, C., Hatzidimitriou, P.,
Bohnhoff, M., Rische, M., Meier, T., 2009. Seismicity and active tectonics at Coloumbo
Reef (Aegean Sea, Greece): monitoring an active volcano at Santorini Volcanic Center
using a temporary seismic network. Tectonophysics 465, 136–149.
Dimitriadis, I., Papazachos, C., Panagiotopoulos, D., Hatzidimitriou, P., Bohnhoff, M.,
Rische, M., Meier, T., 2010. P and S velocity structures of the Santorini–Coloumbo
volcanic system (Aegean Sea, Greece) obtained by non-linear inversion of travel times
and its tectonic implications. Journal of Volcanology and Geothermal Research 195,
13–30.
Dominey-Howes, D., Papadopoulos, G., Dawson, A., 2000. Geological and historical
investigation of the 1650 Mt. Columbo (Thera Island) eruption and tsunami, Aegean
Sea, Greece, Natural Hazards 21, 83–96.
Duffy, D.G., 1992. On the generation of oceanic surface waves by underwater volcanic
explosions. Journal of Volcanology and Geothermal Research 50, 323-344.
Egorov, Y., 2007. Tsunami wave generation by the eruption of underwater volcano. Natural
Hazards and Earth System Sciences 7, 65-69.
Fouqué, F., 1879. Santorin et ses éruptions. Masson.
Freundt, A., 2003. Entrance of hot pyroclastic flows into the sea: experimental observations.
Bulletin of Volcanology 65, 144-164.
Fuller, S., 2015. Distribution of tephra from the 1650 AD submarine eruption of Kolumbo
volcano, Greece. Master Thesis, Oceanography, University of Rhodes Island.
Fytikas, M., Kolios, N., Vougioukalakis, G., 1990. Post-Minoan volcanic activity of the
Santorini volcano. Volcanic hazard and risk. Forecasting possibilities. In: Hardy, D. A.,
Keller, J., Galanopoulos, V. P., Flemming, N. C., Druitt, T. H. (Eds.), Thera and the
Aegean World III, vol. 2, Proceedings of the third international congress, Santorini,
Greece 3–9 September 1989, The Thera Foundation, 183–198.
Giachetti, T., Paris, R., Kelfoun, K., Pérez Torrado, F.J., 2011. Numerical modelling of the
tsunami triggered by the Güìmar debris avalanche, Tenerife (Canary Islands):
comparison with field-based data. Marine Geology 284, 189-202.
ACC
EPTE
D M
ANU
SCR
IPT
ACCEPTED MANUSCRIPT
Giachetti, T., Paris, R., Kelfoun, K., Ontowirjo, B., 2012. Tsunami hazard related to a flank
collapse of Anak Krakatau volcano, Sunda Strait, Indonesia. Geological Society,
London, Special Publication 361, 79-89.
Hübscher C., Ruhnau M., Nomikou P., 2015. Volcano-tectonic evolution of the polygenetic
Kolumbo submarine volcano/Santorini (Aegean Sea). Journal of Volcanology and
Geothermal Research 291, 101–111.
Kelfoun, K., 2011. Suitability of simple rheological laws for the numerical simulation of
dense pyroclastic flows and long-runout volcanic avalanches. Journal of Geophysical
Research – Solid Earth B007622.
Kelfoun, K., Druitt, T.H., 2005. Numerical modelling of the emplacement of the 7500 BP
Socompa rock avalanche, Chile. Journal of Geophysical Research 110, B12202.
Kelfoun, K., Giachetti, T. & Labazuy, P. 2010. Landslide-generated tsunamis at Reunion
Island. Journal of Geophysical Research 115, F04012.
Kilias, S. P., Nomikou, P., Papanikolaou, D., Polymenakou, P. N., Godelitsas, A., Argyraki,
A., Carey, S., Gamaletsos, P., Mertzimekis, T. J., Stathopoulou, E., Goettlicher, J.,
Steininger, R., Betzelou, K., Livanos, I., Christakis, C., Croff Bell, C., Scoullos, M.,
2013. New insights into hydrothermal vent processes in the unique shallow-submarine
arc-volcano, Kolumbo (Santorini), Greece. Scientific Reports 3, 2421.
Kokelaar, P., 1986. Magma-water interactions in subaqueous and emergent basaltic
volcanism. Bulletin of Volcanology 48, 275-289.
Le Méhauté, B.L., 1971. Theory of explosion-generated water waves. In: Chow VT (Ed.)
Advances in Hydroscience 7, Academic Press, New York, London, 1-79.
Le Méhauté, B.L., Wang, S., 1996. Water waves generated by underwater explosion. Adv.
Ser. Ocean Eng., World Sci., New Jersey.
Leibrandt, S., Le Pennec, J.L., 2015. Towards fast and routine analyses of volcanic ash
morphometry for eruption surveillance applications. Journal of Volcanology and
Geothermal Research 297, 11-27.
Liu, P. L.-F., Cho, Y., Yoon, S., and Seo, S., 1995a. Numerical simulations of the 1960
Chilean tsunami propagation and inundation at Hilo, Hawaii. In: Tsuchiya, Y. and
ACC
EPTE
D M
ANU
SCR
IPT
ACCEPTED MANUSCRIPT
Shuto, N. (Eds.), Tsunami: Progress in Prediction, Disaster Prevention and Warning.
Advances in Natural and Technological Hazards Research 4, 99–115.
Liu, P. L.-F., Cho, Y.-S., Briggs, M. J., Kanoglu, U., and Synolakis, C. E., 1995b. Runup of
solitary waves on a circular island. Journal of Fluid Mechanics 302, 259–285.
Liu, P. L.F., Woo, S.B., and Cho, Y.S., 1998. Computer Programs for Tsunami Propagation
and Inundation. Tech. Report, Cornell University.
Maeno, F., Imamura, F., Taniguchi, H., 2006. Numerical simulations of tsunamis generated
by caldera collapse during the 7.3 ka Kikai eruption, Kyushu, Japan. Earth Planets
Space 58, 1013-1024.
Maeno, F., Imamura, F., 2011. Tsunami generation by a rapid entrance of pyroclastic flow
into the sea during the 1883 Krakatau eruption, Indonesia. Journal of Geophysical
Research 116, B09205.
Mazarakis, N., Kotroni, V., Lagouvardos, K., Bertotti, L., 2012. High-resolution wave model
validation over the Greek maritime areas. Natural Hazards and Earth System Sciences
12, 3433-3340.
Mindrinos, M., 2001. Santorini and Mount Athos. Yearbook of Cycladic Studies, vol. IZ, Ed.
Company of Cycladic Studies, 364-395.
Morrissey, M., Gisler, G., Weaver, R., Gittings, M., 2010. Numerical model of crater lake
eruptions. Bulletin of Volcanology 72, 1169-1178.
Nomanbhoy, N., Satake, K., 1995. Generation mechanism of tsunamis from the 1883
Krakatau eruption. Geophysical Research Letters 22 (4), 509-512.
Nomikou, P., Carey, S., Papanikolaou, D., Croff Bell, K., Sakellariou, D., Alexandri, M.,
Bejelou, K., 2012. Submarine volcanoes of the Kolumbo volcanic zone NE of Santorini
Caldera, Greece. Global and Planetary Change 90, 135–151.
Nomikou, P., Carey, S., Croff Bell, K., Papanikolaou, D., Bejelou, K., Alexandri, M., Cantner
K., Martin, J.F., 2013. Morphological slope analysis in the Kolumbo submarine
volcanic zone NE of Santorini Island. Zeitschrift für Geomorphologie 57, Suppl. Band
3, 37-47.
ACC
EPTE
D M
ANU
SCR
IPT
ACCEPTED MANUSCRIPT
Nomikou, P., Carey, S., Bell, K., Papanikolaou, D., Bejelou, K., Cantner, K., Sakellariou, D.,
Perros, I., 2014. Tsunami hazard risk of a future volcanic eruption of Kolumbo
submarine volcano, NE of Santorini Caldera, Greece. Natural Hazards 72, 1375-1390.
Novikova, T., Papadopoulos, G.A., McCoy, F.W., 2011. Modelling of tsunami generated by
the giant Late Bronze Age eruption of Thera, South Aegean, Greece. Geophysical
Journal International 186, 665-680.
Okal, E.A., Synolakis, C.E., Uslu, B., Kalligeris, N., Voukouvalas, E., 2009. The 1956
earthquake and tsunami in Amorgos, Greece. Geophysical Journal International 178,
1533-1554.
Papadopoulos, G.A., Pavlides, S.B., 1992. The large 1956 earthquake in the South Aegean:
macroseismic field configuration, faulting, and neotectonics of Amorgos Island. Earth
and Planetary Science Letters 113, 383-396.
Papadopoulos, G.A., Fokaefs, A., 2005. Strong tsunamis in the Mediterranean Sea: a re-
evaluation. ISET Journal of Earthquake Technology 463 (42), 159-170.
Paris, R., Giachetti, T., Chevalier, J., Guillou, H., Frank, N., 2011. Tsunami deposits in
Santiago Island (Cape Verde archipelago) as possible evidence of a massive flank
failure of Fogo volcano. Sedimentary Geology 239, 129-145.
Paris, R., Switzer, A.D., Belousova, M., Belousov, A., Ontowirjo, B., Whelley, P.L., Ulvrová,
M., 2014a. Volcanic tsunami: a review of source mechanisms, past events and hazards
in Southeast Asia (Indonesia, Philippines, Papua New Guinea). Natural Hazards 70 (1),
447-470.
Paris, R., Wassmer, P., Lavigne, F., Belousov, A., Belousova, M., Iskandarsyah, Y.,
Benbakkar, M., Ontowirjo, B., Mazzoni, N., 2014b. Coupling eruption and tsunami
records: the Krakatau 1883 case-study, Indonesia. Bulletin of Volcanology 76, 814.
Roche, O., Druitt, T.H., Merle, O., 2000. Experimental study of caldera formation. Journal of
Geophysical Research 105, 395-416.
Sauer, D., 2010. Approaches to quantify progressive soil development with time in
Mediterranean climate—I. Use of field criteria. Journal of Plant Nutrition and Soil
Science 173, 822-842.
ACC
EPTE
D M
ANU
SCR
IPT
ACCEPTED MANUSCRIPT
Sato, H., Taniguchi, H., 1997. Relationship between crater size and ejecta volume of recent
magmatic and phreato-magmatic eruptions: implications for energy partitioning.
Geophysical Research Letters 24, 205-208.
Scott, W.E., Hoblitt R.P., Torres R.C., Self S., Martinez M.L., Nillos T.J., 1996. Pyroclastic
flows of the June 15, 1991, climatic eruption of Mount Pinatubo. In: Newhall, C.G.,
Punongbayan, S., (Eds.), Fire and Mud: Eruptions of Mount Pinatubo, Philippines.
Philipp. Inst. Volcanol. and Seismol., Quezon City, 545–570.
Self, S., Rampino, M.R., 1981. The 1883 eruption of Krakatau. Nature 294, 699-704.
Self, S., Rampino M.R., Newton M.S., Wolf J.A., 1984. Volcanological study of the great
Tambora eruption of 1815. Geology 12, 659–663.
Simkin, T., Howard K.A., 1970. Caldera collapse in the Galápagos Islands, 1968. Science
169, 429– 437.
Stefanou, K., 1878. The eruption of 1650 in Thera. Athinaion 7, 66–74 (in Greek).
Stix, J., Kobayashi, T., 2008. Magma dynamics and collapse mechanisms during four historic
caldera-forming events. Journal of Geophysical Research 113, B09205.
Sugawara, D., Imamura, F., Matsumoto, H., Goto, K., Minoura, K., 2011. Reconstruction of
the AD 869 Jōgan earthquake induced tsunami by using the geological data. Journal of
Japanese Society of Natural Disaster Science 29, 501–516 (in Japanese, with English
Abstr.).
Szczuciński, W., Kokociński, M., Rzeszewski, M., Chagué-Goff, C., Cachão, M., Goto, K.,
Sugawara, D., 2012. Sediment sources and sedimentation processes of 2011 Tohoku-oki
tsunami deposits on the Sendai Plain, Japan — Insights from diatoms, nannoliths and
grain size distribution. Sedimentary Geology 282, 40-56.
Tinti, S., Pagnoni, G., Piatanesi, A., 2003. Simulations of tsunamis induced by volcanic
activity in the Gulf of Naples (Italy). Natural Hazards and Earth System Sciences 3,
311-320.

ACC
EPTE
D M
ANU
SCR
IPT
ACCEPTED MANUSCRIPT
Torsvik, T., Paris, R., Didenkulova, I., Pelinovsky, E., Belousov, A., Belousova, M., 2010.
Numerical simulation of explosive tsunami wave generation and propagation in
Karymskoye Lake, Russia. Natural Hazards and Earth System Sciences 10 (11), 2359-
2369.
Ulvrová, M., Paris, R., Kelfoun, K., Nomikou, P., 2014. Numerical simulations of tsunami
generated by underwater volcanic explosions at Karymskoye Lake (Kamchatka, Russia)
and Kolumbo volcano (Aegean Sea, Greece). Natural Hazards and Earth System
Sciences 14, 401-412.
Valentine, G. A., White, J. D. L., Ross, P. S., Amin, J., Taddeucci, J., Sonder, I., Johnson, P.
J., 2012. Experimental craters formed by single and multiple buried explosions and
implications for volcanic craters with emphasis on maars. Geophysical Research Letters
39, L20301.
Vougioukalakis, G., Fytikas, M., 2005. Volcanic hazards in the Aegean area, relative risk
evaluation, monitoring and present state of the active volcanic centers. In: Fytikas, M.
and Vougioukalakis, G. E. (Eds.), The South Aegean Active Volcanic Arc, Present
Knowledge and Future Perspectives. Milos Conferences, Developments in Volcanology
7, 161–183.
Wang, X., Liu, P.L.F., 2006. An analysis of 2004 Sumatra earthquake fault plane mechanisms
and Indian Ocean tsunami. Journal of Hydraulic Research 44, 147–154.
Watts, P., Waythomas, C.F., 2003. Theoretical analysis of tsunami generation by pyroclastic
flows. Journal of Geophysical Research 108B112, 2563.
Wohletz, K.H., 1986. Explosive magma-water interactions: thermodynamics, explosion
mechanisms, and field studies. Bulletin of Volcanology 48, 245-2654.
ACC
EPTE
D M
ANU
SCR
IPT
ACCEPTED MANUSCRIPT
Figures captions
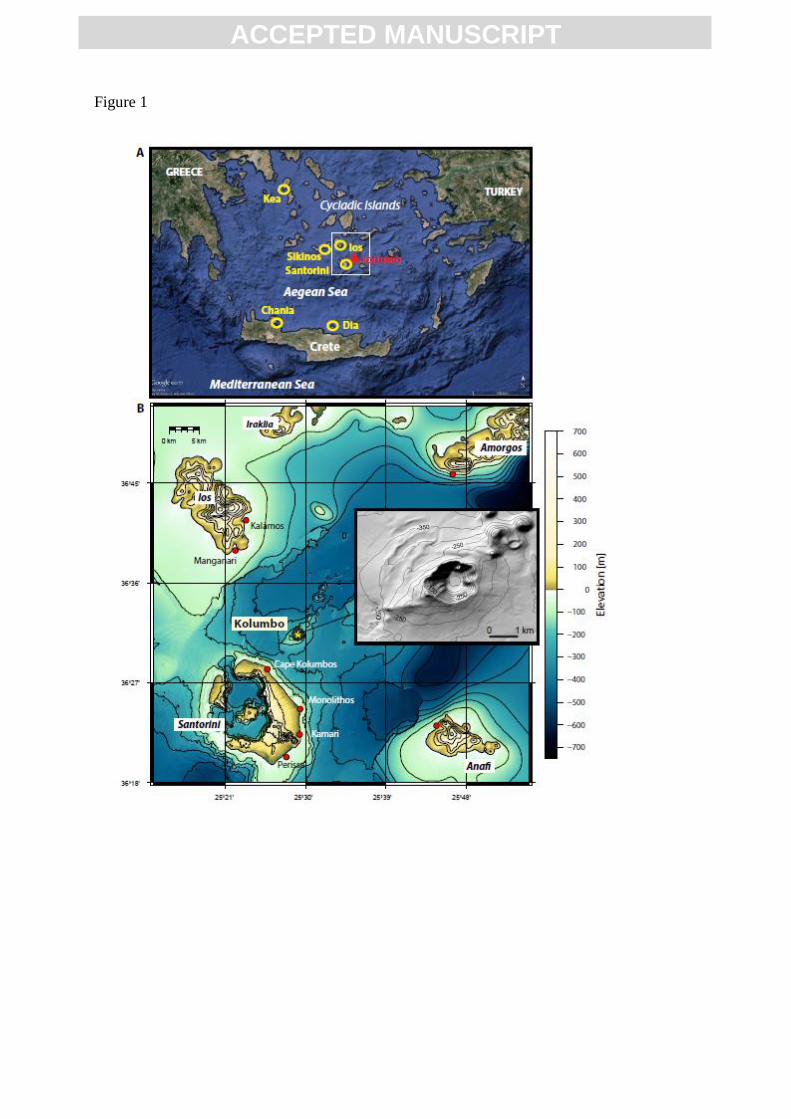
Fig. 1 – Location map of Kolumbo submarine volcano (Aegean Sea, Greece). Yellow circles
on map A indicate locations where the 1650 tsunami was observed. Shaded relief view depicts
the edifice with its central crater and peripheral cones to the northeast.
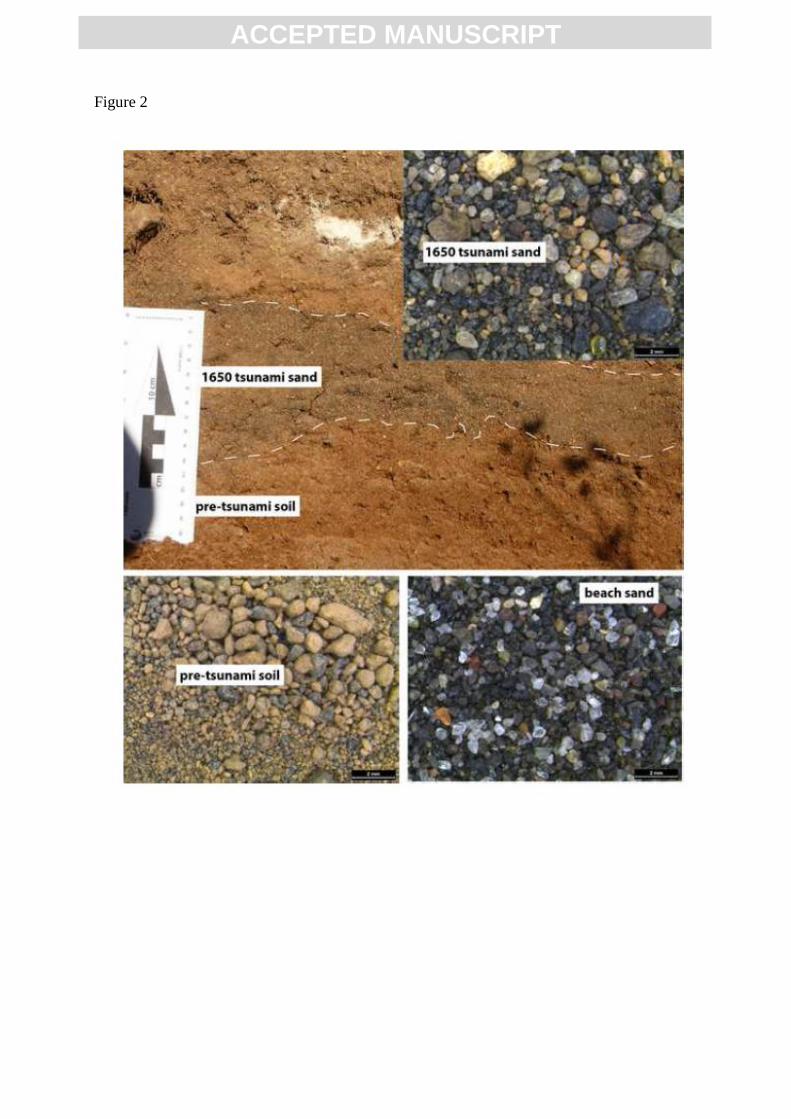
Fig. 2 – Sedimentary evidence of the tsunami generated by the 1650 AD eruption of Kolumbo
volcano. Section is located in the Monolithos area, eastern coast of Santorini island. The 1650
tsunami sand has a composition which is almost similar to the modern beach sand, but
enriched in pumices from the soil.
Fig. 3 – Shape parameters of the 160-400 µm grain-size fraction of modern beach sand, pre-
tsunami soil, and tsunami dark greyish sand (1650 Kolumbo tsunami).
Fig. 4 – 1650 tsunami deposits intercalated in soil at Perissa, south-eastern coast of Santorini.
Note the presence of marine gastropods in the tsunami layer.
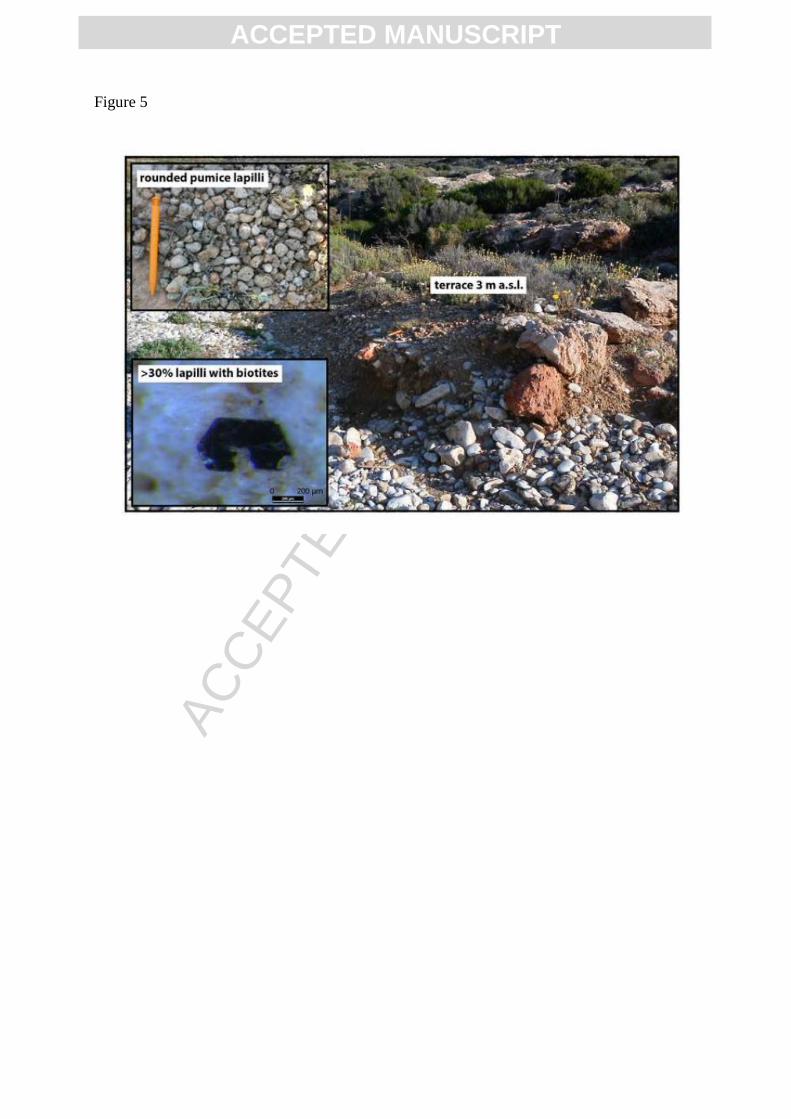
Fig. 5 – Pebble-to-cobble terrace at 3 m a.s.l. on the south-eastern coast of Sikinos island
(located 34 km northwest of Kolumbo). Surface of the terrace is particularly rich in rounded
pumice lapilli, more than 30% of them with crystals of biotite (a mineral that is absent from
Santorini pumices, but typical of the 1650 AD Kolumbo pumice). Note trowel for scale.
Fig. 6 – Time sequence of wave heights generated by 2 × 10¹⁶
J underwater explosion
(corresponding to an initial water surface displacement ƞ 0 = 240 m at t = 0 s) at Kolumbo
volcano along a NE-SW profile (the coast of Santorini is on the left side of the profile).
Fig. 7 –Tide-gauge records of tsunamis generated by underwater explosions. Three different
values of initial water surface displacement (ƞ 0) are represented, corresponding to different
energies of explosion.
Fig. 8 – Maximum tsunami wave amplitudes recorded at the coasts vs. energy of underwater
explosion (expressed here as the initial water surface displacement).
Fig. 9 –Tide-gauge records of tsunamis generated by a very fast (1 minute long) caldera
collapse. Model 1 corresponds to a full-volume collapse, model 2 to a collapse of the upper-
half of the crater, and model 3 to a deepening of the lower-half of the crater. Note that this
scenario is physically unrealistic (see discussion).
ACC
EPTE
D M
ANU
SCR
IPT
ACCEPTED MANUSCRIPT
Fig. 10 – Maximum tsunami wave amplitudes recorded at the coasts vs. duration of the
caldera collapse. Note that for collapse durations longer than 5 min, the maximum amplitude
registered does not exceed 2 m for all locations except at Cape Kolumbos (NE Santorini).
Fig. 11 –Tide-gauge records of tsunamis generated by a pyroclastic flow with a volume V =
0.1 km³. Two values of volume flux are represented here (q = 105 and 10
6 m³.s
-1).
Fig. 12 – Maximum tsunami wave amplitudes recorded at the coasts vs. volume and volume
flux of pyroclastic flows.
Fig. 13 – Maximum water elevation inland of tsunamis generated by underwater explosions at
Kolumbo volcano on the coasts of Santorini. Four scenarios are compared, corresponding to
different values of initial water surface displacement at the source (depending on the energy
of explosion). Red points represent locations where 1650 AD Kolumbo tsunami evidence was
found.
Fig. 14 – Maximum water elevation inland of tsunamis generated by caldera subsidence of
Kolumbo volcano on the coasts of Santorini. Four scenarios are compared, corresponding to
different durations of caldera collapse. Red points represent locations where 1650 AD
Kolumbo tsunami evidence was found.
Fig. 15 – Maximum water elevation inland of tsunamis generated by pyroclastic flows
explosions from Kolumbo volcano on the coasts of Santorini. Four scenarios are compared,
corresponding to different values of volume and volume flux. Red points represent locations
where 1650 AD Kolumbo tsunami evidence was found.
ACC
EPTE
D M
ANU
SCR
IPT
ACCEPTED MANUSCRIPT
Figure 1
ACC
EPTE
D M
ANU
SCR
IPT
ACCEPTED MANUSCRIPT
Figure 2

ACC
EPTE
D M
ANU
SCR
IPT
ACCEPTED MANUSCRIPT
Figure 3

ACC
EPTE
D M
ANU
SCR
IPT
ACCEPTED MANUSCRIPT
Figure 4
ACC
EPTE
D M
ANU
SCR
IPT
ACCEPTED MANUSCRIPT
Figure 5

ACC
EPTE
D M
ANU
SCR
IPT
ACCEPTED MANUSCRIPT
Figure 6
ACC
EPTE
D M
ANU
SCR
IPT
ACCEPTED MANUSCRIPT
Figure 7

ACC
EPTE
D M
ANU
SCR
IPT
ACCEPTED MANUSCRIPT
Figure 8
ACC
EPTE
D M
ANU
SCR
IPT
ACCEPTED MANUSCRIPT
Figure 9
ACC
EPTE
D M
ANU
SCR
IPT
ACCEPTED MANUSCRIPT
Figure 10
ACC
EPTE
D M
ANU
SCR
IPT
ACCEPTED MANUSCRIPT
Figure 11
ACC
EPTE
D M
ANU
SCR
IPT
ACCEPTED MANUSCRIPT
Figure 12

ACC
EPTE
D M
ANU
SCR
IPT
ACCEPTED MANUSCRIPT
Figure 13
ACC
EPTE
D M
ANU
SCR
IPT
ACCEPTED MANUSCRIPT
Figure 14

ACC
EPTE
D M
ANU
SCR
IPT
ACCEPTED MANUSCRIPT
Figure 15
ACC
EPTE
D M
ANU
SCR
IPT
ACCEPTED MANUSCRIPT
Highlights
The 1650 AD Plinian eruption of Kolumbo submarine volcano (Aegean Sea, Greece)
generated a destructive tsunami. In this paper we propose a source mechanism of this poorly
documented tsunami using both geological investigations and numerical simulations. The
most probable source is a 250 m high water surface displacement generated by underwater
explosion with an energy of ~2 × 10¹⁶
J at water depths between 20 and 150 m. Caldera
subsidence is not an efficient tsunami source mechanism as short (and probably unrealistic)
collapse durations (< 5 minutes) are needed. Pyroclastic flows cannot be discarded, but the
required flux (106 to 10
7 m³.s
-1) is exceptionally high compared to the magnitude of the
eruption (VEI 5). This study also provides scenarios for tsunamis generated by future
eruptions of Kolumbo volcano.