Embed Size (px)
Citation preview

Ocean Modelling 69 (2013) 146–165
Contents lists available at SciVerse ScienceDirect
Ocean Modelling
journal homepage: www.elsevier .com/locate /ocemod
Numerical simulation of tsunami waves generated by deformablesubmarine landslides
1463-5003/$ - see front matter Published by Elsevier Ltd.http://dx.doi.org/10.1016/j.ocemod.2013.07.001
⇑ Corresponding author. Tel.: +1 757 683 4732.E-mail address: [email protected] (G. Ma).
Gangfeng Ma a,⇑, James T. Kirby b, Fengyan Shi b
a Department of Civil and Environmental Engineering, Old Dominion University, Norfolk, VA, USAb Center for Applied Coastal Research, University of Delaware, Newark, DE 19716, USA
a r t i c l e i n f o a b s t r a c t
Article history:Received 12 December 2012Received in revised form 1 July 2013Accepted 4 July 2013Available online 15 July 2013
Keywords:Submarine landslideNonhydrostatic wave modelTsunami waveNumerical modeling
This paper presents a new submarine landslide model based on the non-hydrostatic wave modelNHWAVE of Ma et al. (2012). The landslide is modeled as a water–sediment mixture. The dense plumeis driven by baroclinic pressure forcing introduced by spatial density variations. The model is validatedusing laboratory measurements of turbidity currents and of water wave generation by a granular land-slide. The model is then utilized to study the dependence of landslide motion and associated tsunamiwave generation on parameters including sediment settling velocity, initial depth of the landslide andslide density. Model results show that the slide motion and water waves which it generates are both sen-sitive to these parameters. The relative tsunamigenic response to rigid and deformable landslides of equalinitial geometry and density is also examined. It is found that the wave energy is mostly concentrated ona narrow band of the dominant slide direction for the waves generated by rigid landslides, while direc-tional spreading is more significant for waves generated by deformable landslides. The deformable land-slide has larger speed and acceleration at the early stage of landslide, resulting in larger surface waves.The numerical results indicate that the model is capable of reasonably simulating tsunami wave gener-ation by submarine landslides.
Published by Elsevier Ltd.
1. Introduction
Landslides, or submarine mass failures (SMFs), are presentlythought to be one of the major mechanisms for tsunami generationin coastal areas (Masson et al., 2006). Owing to the large volumeinvolved, landslides can generate very large and energetic surfacewaves (Abadie et al., 2012), producing high wave run-up alongthe coast. For example, submarine mass failure is considered asone of the major sources for the 1998 Papua New Guinea tsunamithat caused great loss in human life (Synolakis et al., 2002; Tappinet al., 2001, 2002). Compared to seismogenic tsunami, landslide in-duced tsunami waves feature relatively shorter wavelengths, andhence frequency dispersion effects can be significant or even dom-inant in the wave evolution process. Interactions between thelandslide and the associated waves are strong and will affect thecharacteristics of both (Jiang and Leblond, 1992; Assier-Rzadkie-wicz et al., 1997). Numerical simulation of landslide tsunamishas to take these factors into consideration.
Tremendous effort has been devoted to simulating landslidetsunami generation in the last several decades. Various computa-tional models have been employed using different levels of
simplification; for example, shallow water theory (Harbitz, 1992),fully nonlinear potential flow (Grilli and Watts, 1999, 2005; Grilliet al., 2002), Boussinesq equations (Lynett and Liu, 2003; Wattset al., 2003; Fuhrman and Madsen, 2009; Zhou and Teng, 2010),non-hydrostatic wave equations (Ma et al., 2012) and Navier–Stokes equations (Heinrich, 1992; Liu et al., 2005; Yuk et al.,2006;Ataie-Ashtiani and Shobeyri, 2008; Abadie et al., 2010;Montagna et al., 2011; Horrilo Horrillo et al. (2013)). Most of thesemodels treat the landslide as a rigid solid with prescribed slideshape and behavior. The slide motion, which is generally ac-counted for through a moving boundary condition, is specifiedbased on a dynamic force balance on the sliding mass involvingweight, buoyancy, friction, hydrodynamic drag and inertia forces(Enet Grilli and Watts, 2005). An exception is the model of Abadieet al. (2010), in which the coupling between the rigid slide andwater is implicitly computed, rather than specifying known slidekinematics. All of these models are able to accurately reproducewater waves generated by rigid sliding objects as observed in thelaboratory environment. As summarized by Abadie et al. (2010,2012), however, the methodology employed in these models hassevere limitations in application to real cases, where landslidesare always deformable. Due to its time-varying 3D geometry, rhe-ology as well as slide–water interactions, the deformable landslideis much more complex than a rigid slide. It is impossible toprescribe slide kinematics a priori. In this sense, more advanced

G. Ma et al. / Ocean Modelling 69 (2013) 146–165 147
models are needed, which allow the slide to deform and are capa-ble of describing the two-way coupling between the slide and sur-rounding water (Jiang and Leblond, 1992, 1993; Abadie et al.,2012).
Attempts have been made to develop more sophisticatednumerical models for deformable landslides. Most of the existingdeformable models were based on long-wave approximation. Thelandslides were modeled as either rheological materials or granu-lar flow. For example, Jiang and Leblond (1992, 1993) developeda model to study the coupling between a deformable submarinelandslide and associated tsunami waves based on the assumptionthat the slide material is not diluted while flowing downslope.The long-wave approximation was adopted for both water wavesand the landslide. The slide flow was assumed to be laminar witha parabolic distribution of the horizontal velocity. They applied themodel to study the wave characteristics and the parameters dom-inating the slide-wave interactions. Their model is able to capturethe slide motion and tsunami wave generation. Imran et al. (2001)proposed a 1D two-layer numerical model (BING1D) describing thedownslope development of submarine debris flows. Their modelincorporates three rheological models as user defined alternatives.Similar to Jiang and Leblond (1993), the long wave approximationis adopted and the flow is assumed to remain laminar throughoutthe computation. Watts and Grilli (2003) employed the BING mod-el to study the underwater landslide shape, motion and deforma-tion at early times. Recently, Kelfoun and Druitt (2005), Kelfounet al. (2010) and Giachetti et al. (2011) developed a depth-aver-aged granular flow model, which was coupled with a shallowwater flow model to simulate tsunamis generated by large debrisavalanches. The long-wave approximation has intrinsic limitationswhich prevent these models from being applied to most submarinelandslides where vertical accelerations and frequency dispersionare not negligible. To avoid the long-wave assumption, Navier–Stokes solvers with advanced free surface capturing schemes suchas the Volume-of-Fluid (VOF) method and smoothed particlehydrodynamics (SPH) approach have been proposed to simulatetsunami wave generation by deformable landslides. Assier-Rzad-kiewicz et al. (1997) proposed a 2D sediment–water mixture mod-el for submarine landslides based on Navier–Stokes equations. Intheir model, the free surface motion was captured by a volumeof fluid (VOF) approach. The dense part was considered as a Bing-ham fluid, and the dispersed part was modeled as an ideal fluid.The model was applied to simulate a laboratory landslide. The re-sults showed that the model could reproduce the water waves gen-erated by the landslide in reasonable accuracy. Ataie-Ashtiani andShobeyri (2008) developed a similar model using meshlesssmoothed particle hydrodynamics (SPH) method. Their modelcould also predict landslide-induced wave generation by adjustingthe rheology of the mud. These models have not been applied tosimulate marine landslides at large scales, which are different fromthe landslides at laboratory scales. Abadie et al. (2012) employed a3D multi-fluid Navier–Stokes model THETIS to simulate tsunamiwaves generated by the potential collapse of the west flank ofthe Cumbre Vieja Volcano (CVV), Canary Island, Spain. The free sur-face and slide–water interface were captured by the VOF algo-rithm. The deformable landslide was considered as an inviscidfluid with a constant density. The model was successfully appliedto study CVV tsunami generation. Horrillo et al. (2013) developeda simplified 3D Navier–Stokes model for full scale landslide sce-nario in the Gulf of Mexico, the East-Breaks underwater landslide.Their model used a simplified and relatively diffusive free surfacecapturing scheme to speed up the simulations.
During submarine landslides, strong free surface deformation,large vertical acceleration and non-hydrostatic pressure may oc-cur. As discussed by Abadie et al. (2012), these phenomena maysignificantly affect energy transfer between slide and surrounding
water, and can only be modeled by 3D Navier–Stokes models. TheNavier–Stokes solvers discussed above use either VOF algorithm orSPH method to simulate free surface, which are computationallyexpensive. This paper describes a new submarine landslide modelbased on a Non-Hydrostatic WAVE model (NHWAVE). The slide isconsidered as water–sediment mixture, which can be diffused anddiluted during its movement. The dense plume is driven by thebaroclinic pressure forcing, which is introduced by the spatial den-sity variation. The current model is anticipated to be able to betterrepresent the deformable landslide than that of Abadie et al.(2012), in which the submarine landslide was modeled as invisciddense fluid.
The present landslide model is still a simplified one as the par-ticle–particle interactions are not considered. The inter-particulatestresses may slow down the slide motion. These processes will beimplemented in the future. Comparing with the existing landslidemodels based on VOF or SPH approaches, another major advantageof the current model is the computational efficiency because (1)less vertical layers are required to capture the landslide motionand (2) free surface is directly solved. Therefore, the current modelis practically feasible for modeling 3D large-scale submarine massfailure in the ocean.
The paper is organized as follows. Section 2 introduces themodel formulations and numerical scheme. Section 3 presentsthe model validation using laboratory measurements on turbiditycurrents. Section 4 applies the model to study tsunami waves gen-erated by landslides at both laboratory and large scales. Section 5gives the conclusions of the paper.
2. Formulation
The model we employed in this study is the Non-HydrostaticWAVE model NHWAVE, which was recently developed by Maet al. (2012) to study the propagation of fully dispersive, fully non-linear surface waves in complex 3D coastal environments as wellas tsunami wave generation by a prescribed bottom motion.NHWAVE solves the incompressible Navier–Stokes equations inwell-balanced conservative form, formulated in time-dependent,surface and terrain-following r coordinates. The governing equa-tions are discretized by a combined finite volume/finite differenceapproach with a Godunov-type shock-capturing scheme. The mod-el is wave-resolving and can provide instantaneous descriptions ofsurface displacement and wave orbital velocities. In this section,we discuss recent extensions to the model to enable the study oftsunami wave generation by deformable landslides.
2.1. Governing equations
Submarine landslides are commonly induced by the liquefac-tion of sediment, which may generate highly turbid currents nearthe bottom. The sediment concentration in the turbidity currentsis so high that it is necessary to simulate sediment transport andwater flow in a coupled way. From the macroscopic point of view,the presence of sediment in the water column not only changes thedensity of the mixture, but also affects the turbulent velocity fluc-tuations. In this study, the sediment-sediment interactions are ne-glected for simplicity. The turbidity flow is considered as a mixtureof water and sediment, with the mixture density qm defined as
qm ¼ ð1� CÞq0 þ Cqs ð1Þ
where C is the sediment volume concentration, q0 ¼ 1000 kg/m3 isthe density of water, and qs ¼ 2650 kg/m3 is the density ofsediment.
A surface and terrain-following r coordinate is adopted totransform the governing equations, given by
148 G. Ma et al. / Ocean Modelling 69 (2013) 146–165
t ¼ t�; x ¼ x�; y ¼ y�; r ¼ z� þ hD
ð2Þ
where ðx�; y�; z�Þ is the Cartesian coordinate system. D ¼ hþ g is thetotal water depth, h is the still water depth, and g is the surfacedisplacement.
With the sediment effects, the continuity and momentum equa-tions in well-balanced conservative form (Fuhrman and Madsen,2009; Fuhrman and Madsen, 2009;Lai et al., 2010) are written as
@D@tþ @Du
@xþ @Dv
@yþ @x@r¼ 0 ð3Þ
@U@tþ @F@xþ @G@yþ @H@r¼ Sh þ Sp þ Sq þ Ss ð4Þ
in which U ¼ ðDu;Dv;DwÞT , ðu; v;wÞ are velocities in Cartesiancoordinates. x is the vertical velocity in r coordinates, defined by
x ¼ D@r@t�þ u
@r@x�þ v @r
@y�þw
@r@z�
� �ð5Þ
with
@r@t�¼ �r
D@D@t
@r@x�¼ 1
D@h@x� r
D@D@x
@r@y�¼ 1
D@h@y� r
D@D@y
@r@z�¼ 1
D
ð6Þ
The fluxes in Eq. (4) are given by
F¼Duuþ1
2gg2þghgDuvDuw
0B@
1CA; G¼
DuvDvvþ1
2gg2þghgDvw
0B@
1CA; H¼
uxvxwx
0B@
1CA
The source terms Sh, Sp, Ss are related to hydrostatic pressure, non-hydrostatic pressure and turbulent diffusion, respectively,
Sh ¼gg @h
@x
gg @h@y
0
0B@
1CA; Sp ¼
� Dq ð
@p@x þ
@p@r
@r@x�Þ
� Dq ð
@p@y þ
@p@r
@r@y�Þ
� 1q@p@r
0BB@
1CCA; Ss ¼
DSsx
DSsy
DSsz
0B@
1CA
where DSsx , DSsy , DSsz are diffusion terms, p is the dynamic pressure.Another source term Sq is induced by horizontal density gradi-
ent, known as the baroclinic pressure forcing. The mixture densityqm can be expressed as q0 þ q, where q0 is the constant referencedensity taken as the water density in this study, and the residualq ¼ qm � q0 ¼ Cðqs � q0Þ. The hydrostatic pressure is thus definedby
@ph
@z¼ �ðq0 þ qÞg ð7Þ
The horizontal hydrostatic pressure gradient is then given by
1q0rph ¼ grgþ grr ð8Þ
where r is the baroclinic pressure head.
r ¼ 1q0
Z g
zqdz ð9Þ
Thus, the baroclinic source term is given by Sq ¼ �gDrr in zcoordinate.
2.2. Sediment transport model
The suspended sediment concentration can be computed fromthe convection–diffusion equation for suspended sediment load,which is given as follows in r coordinate.
@DC@tþ @DuC
@xþ @DvC
@yþ @ðx�wsÞC
@r
¼ @
@xD mþ mt
rh
� �@C@x
� �þ @
@yD mþ mt
rh
� �@C@y
� �
þ 1D
@
@rmþ mt
rv
� �@C@r
� �ð10Þ
where C is the concentration of suspended sediment and ws is sed-iment settling velocity. In the following, we will vary the sedimentsettling velocity to study its effects on landslide motion and associ-ated tsunami waves. rh and rv are horizontal and vertical Schmidtnumbers for sediment, respectively.
To solve the above equation, boundary conditions are needed tobe specified at all the physical boundaries. Specifically, at the freesurface, the vertical sediment flux is zero. At the bed-fluid inter-face, there is mass exchange of suspended sediment, whichaccounts for sediment erosion and deposition. However, in the fol-lowing studies of submarine landslide, we assume that thesubmarine landslide is a self-sustained system. Thus, no mass ex-change occurs at the bed. Therefore, a zero vertical flux boundarycondition is imposed at both free surface and bottom.
mþ mt
rv
� �1D@C@rþwsC ¼ 0 ð11Þ
2.3. Turbulence model
We have implemented a nonlinear k—� model (Lin and Liu,1998a,b; Ma et al., 2011) into NHWAVE to simulate turbulent flow.The turbulent eddy viscosity is calculated by
mt ¼ Clk2
�ð12Þ
With sediment induced stratification effects, the k—� equations inconservative form are given by
@Dk@tþr � ðDukÞ ¼ r � D mþ mt
rk
� �rk
� �þ D Ps þ Pb � �ð Þ ð13Þ
@D�@tþr � ðDu�Þ ¼ r � D mþ mt
r�
� �r�
� �
þ �k
D C1�ðPs þ C3�PbÞ � C2��ð Þ ð14Þ
where rk, r�, C1�, C2�, Cl are empirical coefficients (Rodi, 1987)given by
rk ¼ 1:0; r� ¼ 1:3; C1� ¼ 1:44;C2� ¼ 1:92; Cl ¼ 0:09 ð15Þ
Ps and Pb are shear and buoyancy production, which are describedas
Ps ¼ �u0iu0j
@ui
@x�jð16Þ
and
Pb ¼gq0
mt
D@qm
@rð17Þ
where the Reynolds stress u0iu0j is calculated by a nonlinear model
proposed by Lin and Liu (1998a,b), which is given by

G. Ma et al. / Ocean Modelling 69 (2013) 146–165 149
u0iu0j ¼� Cd
k2
�@ui
@x�jþ @uj
@x�i
!þ 2
3kdij
� C1k3
�2
@ui
@x�l
@ul
@x�jþ @uj
@x�l
@ul
@x�i� 2
3@ul
@x�k
@uk
@x�ldij
!
� C2k3
�2
@ui
@x�k
@uj
@x�k� 1
3@ul
@x�k
@ul
@x�kdij
� �
� C3k3
�2
@uk
@x�i
@uk
@x�j� 1
3@ul
@x�k
@ul
@x�kdij
!ð18Þ
where Cd, C1, C2 and C3 are empirical coefficients as given by Lin andLiu (1998a,b)
Cd ¼23
17:4þ 2Smax
� �; C1 ¼
1185:2þ 3D2
max
C2 ¼ �1
58:5þ 2D2max
; C3 ¼1
370:4þ 3D2max
ð19Þ
where
Smax ¼k�
max@ui
@x�i
��������
� �ðindices not summedÞ
Dmax ¼k�
max@ui
@x�j
����������
( ) ð20Þ
The above coefficients may ensure the non-negativity of turbulentvelocities and bounded Reynolds stress. They have been success-fully applied to simulate breaking waves on plane beaches (Linand Liu, 1998a,b). Previous studies (Torres-Freyermuth and Hsu,2010; Snyder and Hsu, 2011) have shown that sediment induceddensity stratification plays a critical role in damping the flow turbu-lence, and numerical results are very sensitive to the value of C3�.They found that the value for stable stratification (C3� ¼ 0:0) givesthe best comparison with laboratory measurements. Therefore,we use C3� ¼ 0:0 in the following studies.
t
x0
UL UR
UR* UL
*
SR SL
S*
Fig. 1. Configuration for the HLLC approximate Riemann solver.
2.4. Numerical scheme
A combined finite-volume and finite-difference scheme with aGodunov-type method is applied to discretize Eqs. (3) and (4)(Ma et al., 2012). In order to apply Godunov-type scheme, all thevariables are defined at the cell centers except that dynamic pres-sure p is defined at the vertically-facing cell faces. The momentumequations are solved by a second-order Godunov-type finite vol-ume method. The HLL approximate Riemann solver (Harten et al.,1983) is used to estimate fluxes at the cell faces, which has widelybeen proved to be robust and efficient (Shi et al., 2012; Ma et al.,2012). For the sediment transport equation and k—� equations,the convective fluxes are determined using the hybrid linear/para-bolic approximation (HLPA) scheme (Zhu, 1991), which hasapproximately second-order accuracy in space. To obtain second-order temporal accuracy, the two-stage second-order nonlinearStrong Stability-Preserving (SSP) Runge–Kutta scheme (Gottliebet al., 2001) was adopted for adaptive time stepping. Uniform grid-ding is used in the horizontal direction while gridding in the verti-cal direction is generalized to be non-uniform in order to capturethe bottom and surface boundary layers when desired. The Poissonequation for the pressure field, described in Ma et al. (2012), is dis-cretized by the finite-difference method, resulting in an asymmet-ric coefficient matrix with a total of 15 diagonal lines. The linearsystem is solved using the high performance preconditioner HYPREsoftware library. The model is fully parallelized using MessagePassing Interface (MPI) with non-blocking communication. Furtherdetails of the numerical method may be found in Ma et al. (2012).
To reduce the numerical diffusion of the model, a modificationof HLL scheme called HLLC approximate Riemann solver proposedby Toro et al. (1994) has been implemented recently. The configu-ration of HLLC scheme is demonstrated in Fig. 1. The wave speedsare given by
SL ¼minðuL �ffiffiffiffiffiffiffiffigDL
p;u� �
ffiffiffiffiffiffiffiffigD�
pÞ
S� ¼ u�
SR ¼maxðuR þffiffiffiffiffiffiffiffigDR
p;u� þ
ffiffiffiffiffiffiffiffigD�
pÞ
ð21Þ
where u� andffiffiffiffiffiffiffiffigD�
pare estimated by
u� ¼12ðuL þ uRÞ þ
ffiffiffiffiffiffiffiffigDL
p�
ffiffiffiffiffiffiffiffigDR
pffiffiffiffiffiffiffiffigD�
p¼
ffiffiffiffiffiffiffiffigDL
pþ
ffiffiffiffiffiffiffiffigDR
p2
þ uL � uR
4
ð22Þ
The HLLC flux can be written as
Fhllc ¼
FL if SL P 0FL þ SLðU�L � ULÞ if SL < 0 < S�FR þ SRðU�R � URÞ if S� < 0 < SR
FR if SR 6 0
8>>><>>>:
ð23Þ
3. Model validations
3.1. Lock-exchange problem
The model was first tested against an exchange flow using theparameters of direct numerical simulations (Härtel et al., 2000)and several nonhydrostatic studies (Fringer et al., 2006; Lai et al.,2010). The computational domain is two-dimensional with lengthL ¼ 0:8 m and depth D ¼ 0:1 m, which is discretized by 800� 100grid cells with Dx ¼ Dy ¼ 0:001 m. The horizontal and verticalmolecular viscosities are mh ¼ mv ¼ 10�6 m2/s. The eddy viscositiesare zero. The sediment settling velocity is assumed to be zero. Allthe boundaries except the free surface are free-slip. In the simula-tion, the density of the fluid is correlated with sediment concentra-tion, which is adjusted to generate the initial density of the lightfluid as q1 ¼ 999:972 kg/m3 and that of the heavy fluid asq2 ¼ 1000:991 kg/m3, following Lai et al. (2010). Thus, the densitydifference of the light and heavy fluids gives a reduced gravity of
g0 ¼ gDqm=q0 ¼ 0:01 m=s2 ð24Þ
Both HLLC and HLL schemes are employed in the simulation. Fig. 2shows the comparison of the resulting density distributions usingdifferent numerical schemes after 15.0 s. As we can see, the lock ex-change flow and the generation of Kelvin–Helmholtz billows arebetter captured by HLLC scheme. Less billows are developed with

z(m
)0.1 0.2 0.3 0.4 0.5 0.6 0.7
−0.08
−0.06
−0.04
−0.02
z(m
)
x(m)0.1 0.2 0.3 0.4 0.5 0.6 0.7
−0.08
−0.06
−0.04
−0.02
Fig. 2. Comparison of the resulting density distributions using HLLC (upper panel) and HLL scheme (lower panel) for lock exchange problem after 15:0 s.
150 G. Ma et al. / Ocean Modelling 69 (2013) 146–165
HLL scheme because of the high numerical diffusion. Fig. 3 presentsthe time series of overflow and underflow velocities using differentschemes. With HLLC scheme, the maximum overflow and under-flow velocities before hitting the wall are 1.83 cm/s and 1.70 cm/s,which are very close to the theoretical value of 1.59 cm/s (Fig. 3).The HLL scheme is less accurate than HLLC scheme. Although itsnumerical diffusion is high, HLL scheme can also predict the over-flow and underflow in reasonable accuracy.
3.2. Turbidity currents
In this section, the model’s capability for simulating turbiditycurrents is evaluated. Specifically, the model is employed to simu-late the laboratory experiments reported by García (1993), whoconducted measurements on both sediment and saline driven cur-rents. The present paper is only focused on the sediment drivencases. The laboratory experiments were conducted in a 30 cmwide, 78 cm deep and about 12 m long flume. The experiment con-figuration involved a bed slope transition. Dense turbid water wasintroduced through an inlet onto an inclined bed with a slope of
0 2 4 6 8 10
0.5
1
1.5
2
2.5
3
|u| (
cm/s
)
0 2 4 6 8 10
0.5
1
1.5
2
2.5
3
|u| (
cm/s
)
tim
Fig. 3. Time series of surface (dashed line) and bottom (solid line) horizontal velocities mHLL scheme (lower panel). Heavy solid line indicates the velocity derived from the ener
0.08, which was connected with a 6.6 m long horizontal bed. Inmany cases, the turbidity currents experienced a hydraulic jumpat the slope transition. A set of experimental runs were carriedout by varying sediment size, sediment concentration and inletvelocity. For model validation, two series of experiments (NOVA7and DAPER) are presented. These cases have also been applied tovalidate a two-phase sediment transport model by Snyder andHsu (2011).
Similar to Snyder and Hsu (2011), two series of 2DV simulationsare conducted. The domain is chosen to be 10 m long. The waterdepth of upstream boundary is 0.4 m, and that of downstream partis 0.8 m. The grid size in the streamwise direction is 0.02 m. 100vertical layers are employed in the simulations. The inlet is locatedat the left boundary with height of 3 cm, which is roughly resolvedby 8 vertical layers. For case NOVA7, the turbidity current at the in-let has a velocity of U0 ¼ 11 cm/s with the volumetric concentra-tion /0 ¼ 0:0073. Fig. 4 shows the snapshots of simulatedturbidity currents at t ¼ 100 s and t ¼ 150 s, which are visualizedthrough the distributions of sediment concentrations. The massconcentration C is correlated with the volumetric concentration
0 12 14 16 18 20
0 12 14 16 18 20e (s)
easured at the midpoint of the computational domain with HLLC (upper panel) andgy balance theory (Turner, 1973).

0 2 4 6 8 10−1
−0.8
−0.6
−0.4
−0.2
0
0.2
x (m)
z (m
)
5
10
15
0 2 4 6 8 10−1
−0.8
−0.6
−0.4
−0.2
0
0.2
x (m)
z (m
)
5
10
15
Fig. 4. Sediment concentration distributions for case NOVA7 of García (1993) at t = 100 s and 150 s. The inlet is located at the left boundary with height of 3 cm. The inlet flowvelocity is 11 cm/s, and sediment concentration is 19.345 kg/m3.
G. Ma et al. / Ocean Modelling 69 (2013) 146–165 151
via C ¼ qs/. The flow structures observed in the experiment arewell reproduced by the present model. The internal hydraulicjump, where the turbidity current changes from upstream super-critical to downstream subcritical condition, is clearly seen at theslope transition.
Model-data comparisons of velocity profiles at both supercriti-cal (x ¼ 3 m) and subcritical (x ¼ 8 m) regions for case NOVA7 arepresented in Fig. 5. The velocities and vertical coordinate arerespectively normalized by the layer-averaged velocity < u > andlayer thickness hs, which are defined as
< u >¼R g�h u2dzR g�h udz
ð25Þ
and
0 0.5 1 1.5 20
0.5
1
1.5
2
u/<u>
z/h s
Fig. 5. Comparisons of simulated (solid lines) and measured (circles) current velocities oare located at 300 and 800 mm downstream from the inlet. The measurement data wevelocity < u >.The vertical coordinate is normalized by the layer thickness hs .
hs ¼R g�h udz
�2R g�h u2dz
ð26Þ
It is clearly shown that the simulations agree well with the mea-surements at both locations, indicating that the model is capableof capturing the internal hydraulic jump at the slope transition. Inthe upstream supercritical region, the boundary layer extendingto the maximum velocity point covers a small portion of the currentthickness, while 80% of the flow is unbounded. The thickness ofboundary layer is greatly increased in the case of subcritical flow,which covers about 50% of the current layer.
We also carried out model-data comparisons of DAPER series(DAPER1, DAPER2 and DAPER6). All the DAPER series have the inletvelocity of U0 ¼ 8:3 cm/s. The inlet sediment concentrations of
0 0.5 1 1.5 20
0.5
1
1.5
2
u/<u>
z/h s
f case NOVA7 at supercritical (left panel) and subcritical (right panel) regions, whichre reported by García (1993). The velocities are normalized by the layer-averaged

152 G. Ma et al. / Ocean Modelling 69 (2013) 146–165
these three runs are /0 ¼ 0:00143, 0.00183 and 0.00372, respec-tively. Again, the results are normalized by the layer-averagedvalues. The layer-averaged sediment concentration < C > iscalculated by
< C >¼R g�h uCdzR g�h udz
ð27Þ
Fig. 6 shows the comparisons of gravity current velocities andvertical sediment concentration distributions at both supercriticaland subcritical regions. Results demonstrate that the model pre-dicts the flow velocities as well as sediment concentration profilesfairly well at both locations. These comparisons prove that themodel is capable of simulating flow-sediment interactions, andcan be applied to study gravity current induced flow problems.
4. Tsunami waves generated by landslides
4.1. Waves generated by a small-scale landslide
In this section, we present a numerical simulation of waterwaves generated by a laboratory landslide. The experiments weredescribed in Assier-Rzadkiewicz et al. (1997). A series of experi-ments were conducted by allowing a mass of sand to slide freelydown an inclined plane with varying slope and sediment diameter.We have chosen to simulate the case of a volume of 63,000 cm3 ofcoarse gravel sliding down a 45� slope. The model setup is thesame as that of Assier-Rzadkiewicz et al. (1997), shown in Fig. 7.The computational domain is 4 m (�1 m 6 x 6 3 m) long, whichis discretized by 400 grids with Dx ¼ 0:01 m. The water depth is1.60 m and the top of the slide is initially 10 cm below the watersurface. The dimensions of the slide is 0:65 m� 0:65 m. The meanapparent density is 1950 kg/m3, resulting in the volumetric sedi-
0 0.5 1 1.5 20
0.5
1
1.5
2
u/<u>
z/h s
0 0.5 1 1.5 20
0.5
1
1.5
2
u/<u>
z/h s
Fig. 6. Comparisons of simulated and measured current velocities (left panels) and sedregions, which are located at 300 and 800 mm downstream from the inlet. The measuremare normalized by layer-averaged velocity < u > and concentration < c >, respectively.lines: DAPER1; Dashed lines: DAPER2; Dash-dotted lines: DAPER6.
ment concentration of 0.58. 25 vertical layers are used in thesimulation.
Fig. 8 shows the comparisons of simulated and measured sur-face elevations at t ¼ 0:4 s and t ¼ 0:8 s. In the simulation, thewater–sediment mixture is modeled as turbulent fluid withoutrheology. The turbulent viscosity and diffusivity are calculated bythe k—� model. We can see that the model over-predicts the sur-face waves generated by the underwater landslide. The discrepan-cies are introduced by the simplified treatment of the landslide, inwhich intergranular stresses which could retard the initial failureof the sliding mass are neglected. In the experiment, the majorityof the sand remains close to the initial position at t ¼ 0:4 s. Inthe simulation, however, mass failure of the entire slide occurs inthe first instant. As demonstrated in Fig. 9, the simulated slidemass is mainly concentrated at the slide front, which is not thecase in the experiment (Assier-Rzadkiewicz et al., 1997). Moreaccurate simulation of the laboratory underwater landslide wouldrequire a more thorough consideration of the rheological behaviorof the granular material, which is left for future studies. In Fig. 8,we also present the numerical results of Assier-Rzadkiewicz et al.(1997) using NASA-VOF2D, which considers the mudslide as aBingham material. At the early stage of the landslide (t 6 0:4 s),the surface waves generated by these two models are similar. After0.4 s the slide movement predicted by the present model is slightlyfaster, which results in larger surface waves. Generally, these twomodels predict comparable results. However, the present modelutilizes a much coarser vertical grid resolution and is thus ex-pected to be more computationally efficient.
4.2. Waves generated by a large-scale landslide
In this section, we replicate an example landslide described inJiang and Leblond (1992) and investigate the effects of different
0 0.5 1 1.5 2 2.50
0.5
1
1.5
2
c/<c>
z/h s
0 0.5 1 1.5 2 2.50
0.5
1
1.5
2
c/<c>
z/h s
iment concentrations (right panels) of case DAPER at supercritical and subcriticalent data were reported by García (1993). The velocities and sediment concentrationsThe vertical coordinate is normalized by the layer thickness hs . Circles: data; Solid

−1 −0.5 0 0.5 1 1.5 2 2.5 3−1.5
−1
−0.5
0
x (m)
z (m
)
h
Fig. 7. The computational domain and model setup for water wave generation by a laboratory landslide. The water depth is h = 1.60 m. The slope of the inclined plane is 45�.The shadow region shows the initial location of landslide. The mean apparent density of the landslide is 1950 kg/m3.
−0.5 0 0.5 1 1.5 2 2.5−0.2
−0.1
0
0.1
0.2
x (m)
−0.5 0 0.5 1 1.5 2 2.5−0.2
−0.1
0
0.1
0.2
x (m)
η(m
)η
(m)
Fig. 8. Comparisons of simulated and measured surface elevation at t ¼ 0:4 s (upper panel) and t ¼ 0:8 s (lower panel). Circles: measurements; Solid lines: current model;Dashed lines: Assier-Rzadiewicz Assier-Rzadkiewicz et al. (1997).
G. Ma et al. / Ocean Modelling 69 (2013) 146–165 153
parameters on the surface tsunami waves as well as slide motion.We shall focus on the two-dimensional problem first. Fig. 10presents the computational domain and model setup. The compu-tational domain has a minimum water depth of 12 m and a maxi-mum water depth of 400 m. The landslide is located at a gentleuniform slope with inclination h ¼ 4�. The slide is initially at restand has a parabolic surface given by
H ¼ Tð1� ½2ðx� xÞ=L�2Þ ð28Þ
where T ¼ 24 m is the initial maximum landslide height, L ¼ 686 mis the initial length of the slide, H is the slide height at coordinatex; x is the initial coordinate of the centroid.
In the numerical simulations, the landslide is modeled as awater–sediment mixture without rheology. The domain is discret-ized by 2000 horizontal grids and 40 vertical layers in order to bet-ter capture the slide movement. Eleven model runs are conductedby varying slide density qslide, settling velocity of sediment ws andinitial location of the slide hslide. The details of the model parame-ters are shown in Table 1. The simulation time is 120 s. All the sim-ulations were carried out in the the high performance computing
(HPC) community cluster mills.hpc.udel.edu at University of Dela-ware using 8 processors. The typical time required for each simu-lation is about 17 h.
Fig. 11 illustrates the evolution of surface waves generated bythe underwater landslide for run 2d. The landslide is initially lo-cated at 120 m water depth. The slide density is 2000 kg/m3. Thesettling velocity of the sediment is chosen as 0.1 m/s. At the begin-ning of the landslide, a single wave with nearly symmetric crestand trough is generated. As the mud slides further downwardalong the slope, three wave trains are produced. The first wavetrain is led by a large wave crest, which propagates into the deeperwater with speed faster than the slide motion. The second wavetrain follows the first one as a forced wave train propagating withthe speed of the slide. This wave train consists of relatively shorterdispersive waves. The wave height of the leading wave can be lar-ger than the wave crest in the first wave train. The third wave trainis a small trough propagating shoreward. The three wave trainsgenerated by the underwater landslide were also found by Jiangand Leblond (1992). However, shallow-water equations weresolved in their studies, which were not able to capture the disper-sive waves.

z (m
)
0.5 1 1.5 2 2.5 3 3.5−1.5
−1
−0.5
0
x (m)
z (m
)
0.5 1 1.5 2 2.5 3 3.5−1.5
−1
−0.5
0
1000
1100
1200
1300
1400
1500
1600
1700
1800
1900
Fig. 9. Snapshots of simulated density distributions at t ¼ 0:4 s (upper panel) and t ¼ 0:8 s (lower panel).
0 1000 2000 3000 4000 5000 6000 7000 8000 9000 10000−400
−300
−200
−100
0
h (m
)
x (m)
−500 −400 −300 −200 −100 0 100 200 300 400 5000
10
20
30
40
50
TH
LH = T(1−[2*x/L]2)
Fig. 10. Sketch of the initial landslide, which is described by H ¼ Tð1� ½2ðx� xÞ=L�2Þ, where T is the initial maximum landslide height, L is the initial length of the slide, H isthe slide height at coordinate x. The computational domain has a minimum water depth of 12 m and a maximum water depth of 400 m. The landslide is located at a gentleuniform slope with inclination h.
154 G. Ma et al. / Ocean Modelling 69 (2013) 146–165
In Fig. 11, we also present the mesh dependence of the simu-lated tsunami waves. Two meshes are tested. One is using 2000horizontal grids and 40 vertical layers with dx ¼ 5 m. The otheris using 1000 horizontal grids and 40 vertical layers withdx ¼ 10 m. We can clearly see the convergence of the numerical re-sults with mesh refinement, although there is minor difference inthe wave train that is tied to the landslide motion (second wavetrain). This wave train consists of relatively short waves, whichare more sensitive to the grid resolution.
A wave energy analysis is conducted as well to investigate howthe deformable landslide transfers energy to the surface waves. Tosee how wave energy is distributed over the three wave trains, weparticularly take a look at the wave energy at t ¼ 100 s, when thethree wave trains can be easily separated. For a crude estimation,we divided the domain into three regions. Region 1 is from x ¼ 0to 3000 m, containing the onshore moving wave train. Region 2is from 3000 m to 5000 m, where the wave train tied to the land-slide is located. Region 3 includes the area with x > 5000 m, where

Table 1Parameters for different model runs, Section 4.2.
Case qslide (kg/m3) ws (m/s) hslide (m)
1a 1200 0.1 1201b 1400 0.1 1201c 1600 0.1 1201d 1800 0.1 1202a 2000 0.1 602b 2000 0.1 802c 2000 0.1 1002d 2000 0.1 1203a 2000 0.01 1203b 2000 0.001 1203c 2000 0.0 120
G. Ma et al. / Ocean Modelling 69 (2013) 146–165 155
the offshore moving wave train is located. The energy (potentialenergy and kinetic energy) contained in these three regions are2:79� 108 J, 3:88� 1010 J, 2:72� 109 J, respectively. These resultsindicate that the landslide transfers most of its energy to the wavetrain concomitant with the landslide motion, which accounts forabout 93% of the total energy.
Fig. 12 demonstrates the evolution of the underwater landslidefor run 2d. Sediment suspension is not significant during the slidemotion. At the beginning of the landslide, the slide moves as a thinfluid sheet with most of sediment constrained close to the bottom.As the mud slides downward, more and more sediment is accumu-lated in the front, producing a bulbous front where a strong vortexis developed. The slide front is always concomitant with the largewave trough in the second wave train.
4.2.1. Effect of sediment settling velocityThe sediment settling velocity or sediment size is always con-
sidered as one of the most important parameters affecting sedi-ment transport and associated physical processes. It directlydetermines sediment suspension and deposition in a sediment-
0 1000 2000 3000 4000 50−5
0
5
0 1000 2000 3000 4000 50−20
0
20
η(m
)η
(m)
η(m
)
0 1000 2000 3000 4000 50−20
0
20
x (
Fig. 11. Tsunami waves generated by the landslide at (a) t ¼ 10 s; (b) t ¼ 50 s and (c) t ¼density of the landslide is 2000 kg/m3. The settling velocity of sediment is 0.1 m/s. Solid
laden turbulent flow. Its effects on landslide motion and the sur-face waves which it generates are examined in this section.
Fig. 13 shows the surface waves generated by the underwaterlandslide with different sediment settling velocity ws. Four settlingvelocities are examined in this study. It is noticed that the effects ofsediment settling velocity on the first and third wave trains areminor. Considering that the sediment settling velocity primarily af-fects the slide deformation, this result is consistent with earlierstudies by Grilli and Watts (2005), who found that the slide initialacceleration governs the generation of the offshore and onshoremoving wave trains, while the slide deformation does not have sig-nificant effects on these two wave trains. The effect of sedimentsettling velocity on the second wave train is significant. This wavetrain is possibly governed by the slide deformation. Larger settlingvelocity would result in larger leading waves and faster wavespeed, indicating that the mud slides faster with larger settlingvelocity (or sediment size) as shown in Fig. 14. For settling velocityws ¼ 0:1 m/s, more sediment is concentrated on the slide front(Fig. 14a), which produces significant baroclinic pressure gradient.Consequently, the turbidity current driving mud transport is stron-ger. From Fig. 13, we also notice that the surface waves are not sen-sitive to the sediment setting velocity when its value becomes lessthan 0.01 m/s.
Fig. 15 presents the effects of ws on the evolution of frontalspeed of the mud V slide (the maximum landslide velocity), localFroude number Fr ¼ V slide=
ffiffiffiffiffiffiffiffiffiffiffiffiffighlocal
pas well as the maximum wave
amplitude jgjmax. The local water depth hlocal is defined as the waterdepth at which the maximum landslide velocity is found. Clearly,two stages of slide motion can be discerned. The first stage is theacceleration stage, during which the frontal speed of the slide be-comes increasingly larger. The frontal speed approaches its maxi-mum value approximately at t ¼ 50 s. During this stage, theeffects of settling velocity ws on jgjmax are negligible. jgjmax is foundat the offshore moving wave train (first wave train). However, itdoes affect the slide motion. Larger settling velocity would resultin slightly faster landslide motion. The second stage corresponds
00 6000 7000 8000 9000 10000
00 6000 7000 8000 9000 10000
00 6000 7000 8000 9000 10000m)
100 s for run 2d with two meshes. The initial water depth of the slide is 120 m. Theline: mesh 1 (2000� 50); dashed line: mesh 2 (1000� 50).

z(m
)(a)
2000 2500 3000 3500 4000 4500 5000−300
−200
−100
0
z(m
)
(b)
2000 2500 3000 3500 4000 4500 5000−300
−200
−100
0
z(m
)
x(m)
(c)
2000 2500 3000 3500 4000 4500 5000−300
−200
−100
0
1000
1020
1040
1060
1080
1100
1120
1140
1160
1180
1200
Fig. 12. The motion of the landslide illustrated as the distributions of sediment concentration at (a) t ¼ 10 s; (b) t ¼ 50 s and (c) t ¼ 100 s for run 2d. The initial water depth ofthe slide is 120 m. The density of the landslide is 2000 kg/m3. The settling velocity of sediment is 0.1 m/s.
0 1000 2000 3000 4000 5000 6000 7000 8000 9000 10000−20
−10
0
10
20
x(m)
η(m
)
4000 4500 5000 5500−20
−10
0
10
20
x(m)
η(m
)
Fig. 13. Effects of the sediment settling velocity ws on tsunami wave generation at t ¼ 100 s. The lower panel is a blow-up view of the waves tied to the landslide. The initialwater depth of the slide is 120 m. The density of the landslide is 2000 kg/m3. Solid line: ws ¼ 0:1 m/s; dashed line: ws ¼ 0:01 m/s; dash-dotted line: ws ¼ 0:001 m/s; dottedline: ws ¼ 0:0 m/s.
156 G. Ma et al. / Ocean Modelling 69 (2013) 146–165
to constant frontal speed. During this stage, the effects of sedimentsettling velocity on jgjmax are noticeable if its value is greater than0.01 m/s. The evolution of the Froude number is similar to that ofthe frontal speed. The mudflow is subcritical with Froude number
less than 1.0. There is a clear decay of the wave height after reach-ing its peak value. Again, the temporal variation of maximum waveamplitude is not significantly affected by the sediment settlingvelocity with values less than 0.01 m/s.

z(m
)(a)
3000 3500 4000 4500 5000 5500 6000−300
−200
−100
0
z(m
)
(b)
3000 3500 4000 4500 5000 5500 6000−300
−200
−100
0
z(m
)
x(m)
(c)
3000 3500 4000 4500 5000 5500 6000−300
−200
−100
0
1000
1020
1040
1060
1080
1100
1120
1140
1160
1180
1200
Fig. 14. Effects of the sediment settling velocity ws on landslide motion at t ¼ 100 s. The initial water depth of the slide is 120 m. Other conditions are referred to Table 1. (a)ws ¼ 0:1 m/s; (b) ws ¼ 0:01 m/s and (c) ws ¼ 0:001 m/s.
0 10 20 30 40 50 60 70 80 90 1000
20
40
V slid
e(m/s
)
0 10 20 30 40 50 60 70 80 90 1000
0.5
1
Fr
0 10 20 30 40 50 60 70 80 90 1000
10
20
time (s)
|η| m
ax (m
)
Fig. 15. Effects of the sediment settling velocity ws on the frontal speed of the landslide V slide , local Froude number Fr ¼ V slide=ffiffiffiffiffiffiffiffiffiffiffiffiffighlocal
pas well as surface wave amplitude
jgjmax. Solid line: ws ¼ 0:1 m/s; Dashed line ws ¼ 0:01 m/s; Dash-dotted line: ws ¼ 0:001 m/s and Dotted line: ws ¼ 0:0 m/s.
G. Ma et al. / Ocean Modelling 69 (2013) 146–165 157
4.2.2. Effect of initial depth of the landslideThe effect of initial water depth of the landslide on the surface
tsunami waves was previously investigated by Jiang and Leblond(1992). They found that, for larger initial depth of the landslide,the interactions between the landslide and surrounding waterare weaker, and surface waves generated by the landslide are smal-
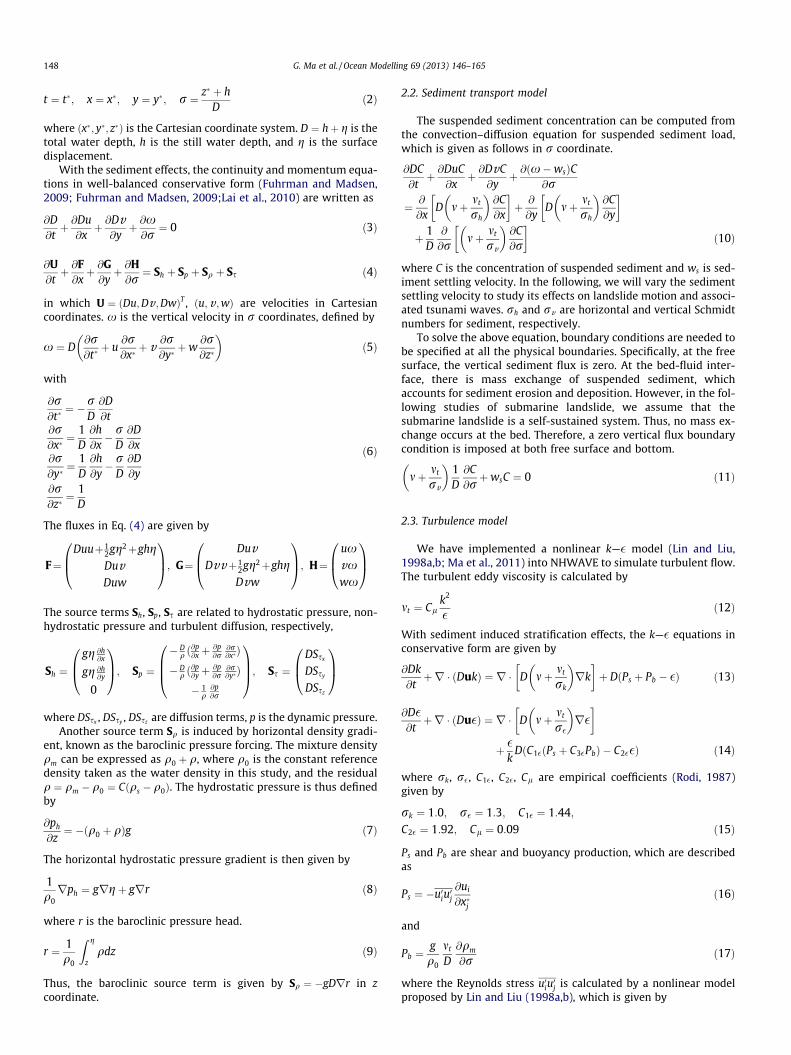
ler. This is further confirmed in the current study, in which simu-lations with four initial depths of the landslide are conducted.Fig. 16 shows the surface waves generated by the landslides ini-tially located at d ¼ 60, 80, 100 and 120 m at t ¼ 100 s. In orderto better compare waveforms, we plot the figures with x� xini asx-axis, where xini is the initial location of the landside. Clearly,
−3000 −2000 −1000 0 1000 2000 3000 4000 5000 6000 7000−30
−20
−10
0
10
20
x−xini(m)
η(m
)
500 1000 1500 2000 2500 3000−30
−20
−10
0
10
20
x−xini(m)
η(m
)
Fig. 16. Effects of initial water depth of the slide on tsunami wave generation at t ¼ 100 s. The lower panel is a blow-up view of the waves tied to the landslide. xini is theinitial location of the landslide. Other conditions are referred to Table 1. Solid line: d ¼ 120 m; dashed line: d ¼ 100 m; dash-dotted line: d ¼ 80 m; dotted line: d ¼ 60 m.
158 G. Ma et al. / Ocean Modelling 69 (2013) 146–165
the landslide located at the shallower water depth can generatelarger surface waves, which can be observed in all three wavetrains. This indicates that the slide–water interactions are moresignificant for shallower landslides. It is interesting to see thatthe offshore and onshore wave trains generated by deeper land-slide propagate faster, while the wave train tied to the landslidetravels faster with a shallower landslide. It seems that deeper land-slide can generate longer onshore and offshore moving waves.
The effects of initial water depth on the frontal speed, the Fro-ude number as well as the maximum surface wave amplitude arepresented in Fig. 17. It can be seen that the landslide frontal speedis seldom affected by the initial water depth. Thus, the Froudenumber is larger for shallower landslide, which tends to producelarger surface waves. Similar to the findings of Abadie et al.(2012), the wave generation process is more efficient if the Froudenumber Fr is larger. The distributions of mixture density and land-slide motion are presented in Fig. 18 for d ¼ 60 m, 100 m, 120 m,from which we can also see more significant interaction betweensurface waves and shallower landslide.
4.2.3. Effect of slide densityThe density of the landslide is one of the dominant parameters
controlling slide movement as well as surface waves which it gen-erates. Higher density of the landslide produces larger baroclinicpressure gradient, subsequently generating faster frontal speedand larger surface waves. This is demonstrated in Fig. 19, whichcompares the surface waves generated by four landslides withqslide ¼ 1400 kg/m3, 1600 kg/m3, 1800 kg/m3, 2000 kg/m3, respec-tively. All the landslides are initially located at 120 m water depthwith sediment settling velocity ws ¼ 0:1 m/s. We can see that thesurface waves including all three wave trains are significantly af-fected by the mud density. The surface wave heights are largerwith higher mud density. For the mud density qslide ¼ 1400 kg/m3, the wave trains seem to be non-dispersive. The effects ofmud density on landslide motion are demonstrated in Fig. 20.
Clearly, with larger mud density, the sediment concentration atthe slide front is higher, and the landslide moves faster. The inter-actions between the landslide and surrounding water are strongeras well.
Fig. 21 displays the temporal variations of the frontal speed ofthe landslide V slide, the Froude number Fr as well as the maximumwave amplitude jgjmax with different mud densities. The slide den-sity has much more significant effects on surface waves as well aslandslide motion than the settling velocity and initial slide depth.With larger mud density, the frontal speed is consistently faster.The Froude number of the landslide and the maximum waveamplitude are also larger. As the slide density is increased from1400 kg/m3 to 2000 kg/m3, the frontal speed of the landslide canbe twice faster. The maximum wave amplitude can be more thanfour times larger.
4.3. 3D simulation of underwater landslide
A three dimensional simulation is also conducted to show themodel’s capability of modeling 3D landslide. The model setup issimilar to that of the 2D simulation, except that the initial landslideis defined using truncated hyperbolic secant function (Enet andGrilli, 2007).
f ¼ T1� � ½sech ðkbxÞsech ðkwyÞ � �� ð29Þ
where kb ¼ 2C=b, kw ¼ 2C=w and C ¼ acoshð1=�Þ. The landslide haslength b ¼ 686 m, width w ¼ 343 m and thickness T ¼ 24 m. Thetruncation parameter is � ¼ 0:717. The landslide is initially locatedat 60 m water depth. The slide density is 2000 kg/m3.
Fig. 22 shows the temporal variation of surface waves generatedby the 3D deformable landslide. We can see that the water wavesare very dispersive. The directional spreading of the waves is sig-nificant, which is partly due to the spreading of the mud acrossthe inclined plane. The wave height is much smaller than that fromthe 2D simulation. The surface elevations at a vertical transect with

0 10 20 30 40 50 60 70 80 90 1000
20
40
V slid
e(m/s
)
0 10 20 30 40 50 60 70 80 90 1000
0.5
1
Fr
0 10 20 30 40 50 60 70 80 90 1000
10
20
30
time (s)
|η| m
ax(m
)
Fig. 17. Effects of initial slide depth on the frontal speed of the landslide V slide , local Froude number Fr ¼ V slide=ffiffiffiffiffiffiffiffiffiffiffiffiffighlocal
pas well as surface wave amplitude jgjmax. Solid line:
d ¼ 60 m; Dashed line: d ¼ 80 m; Dash-dotted line: d ¼ 100 m; Dotted line: d ¼ 120 m.
z(m
)
x(m)
(c)
2500 3000 3500 4000 4500 5000−300
−200
−100
0
z(m
)
(b)
2500 3000 3500 4000 4500 5000−300
−200
−100
0
z(m
)
(a)
2500 3000 3500 4000 4500 5000−300
−200
−100
0
1000
1020
1040
1060
1080
1100
1120
1140
1160
1180
1200
Fig. 18. Effects of initial water depth of the slide on landslide motion at t ¼ 100 s. Other conditions are referred to Table 1. (a) d ¼ 60 m; (b) d ¼ 100 m and (c) d ¼ 120 m.
G. Ma et al. / Ocean Modelling 69 (2013) 146–165 159
y ¼ 0 m are shown in Fig. 23. The pattern of surface waves is sim-ilar to that generated by 2D landslide. Three wave trains are gener-ated by the landslide. The first one starts with a large wave crest,which propagates faster than the landslide motion. The secondwave train starts with a large wave trough, which is tied to thelandslide motion. The third wave train is also a wave trough, whichpropagates shoreward. The wave height approaches its peak value
rapidly after the release of the landslide, then decays as the wavedisperses and the sediment spreads. The non-hydrostatic pressureeffects on the surface wave trains are also examined. Fig. 24 showsthe free surface elevations similar to those of Fig. 23. It’s not sur-prising that the pattern of three wave trains can also be producedby the hydrostatic simulation, which has been proven by Jiang andLeblond (1992) using a 1D shallow-water equation. However, the

0 1000 2000 3000 4000 5000 6000 7000 8000 9000 10000−30
−20
−10
0
10
20
x (m)
3500 4000 4500 5000 5500 6000−30
−20
−10
0
10
20
x (m)
η(m
)η
(m)
Fig. 19. Effects of slide density qslide on tsunami wave generation at t ¼ 100 s. The lower panel is a blow-up view of the waves tied to the landslide. Solid line: qslide ¼ 1400 kg/m3; dashed line: qslide ¼ 1600 kg/m3; dash-dotted line: qslide ¼ 1800 kg/m3; dotted line: qslide ¼ 2000 kg/m3.
z(m
)
(a)
3000 3500 4000 4500 5000 5500 6000−300
−200
−100
0
z(m
)
(b)
3000 3500 4000 4500 5000 5500 6000−300
−200
−100
0
z(m
)
x(m)
(c)
3000 3500 4000 4500 5000 5500 6000−300
−200
−100
0
1000
1020
1040
1060
1080
1100
1120
1140
1160
1180
1200
Fig. 20. Effects of slide density qslide on landslide motion at t ¼ 100 s. (a) qslide ¼ 1400 kg/m3; (b) qslide ¼ 1600 kg/m3; (c) qslide ¼ 1800 kg/m3.
160 G. Ma et al. / Ocean Modelling 69 (2013) 146–165
wave dispersion cannot be captured by the hydrostatic simulationas clearly seen from the free surface elevation at t ¼ 100 s. As a re-sult, the wave train propagating into the deep ocean travels fasterthan the wave train with non-hydrostatic pressure effects.
To see the effects of deformability of the landslide on the tsu-nami waves, we conducted a simulation with a 3D rigid landslide.
The geometry of the rigid landslide is the same as that of thedeformable one. The slide motion is prescribed based on the dy-namic force balance, which is given by Enet and Grilli (2007).The displacement of the rigid landslide is described as
sðtÞ ¼ s0 ln coshtt0
� �ð30Þ

0 10 20 30 40 50 60 70 80 90 1000
20
40
V slid
e(m/s
)
0 10 20 30 40 50 60 70 80 90 1000
0.5
1Fr
0 10 20 30 40 50 60 70 80 90 1000
10
20
30
time(s)
|η| m
ax (m
)
Fig. 21. Effects of slide density qslide on the frontal speed of the landslide V slide , Froude number Fr ¼ V slide=ffiffiffiffiffiffiffiffiffiffiffiffiffighlocal
pand the maximum wave amplitude jgjmax. Solid line:
qslide ¼ 1400 kg/m3; dashed line: qslide ¼ 1600 kg/m3; dash-dotted line: qslide ¼ 1800 kg/m3; dotted line: qslide ¼ 2000 kg/m3.
Fig. 22. Snapshots of Tsunami waves generated by a 3D landslide at (a) t ¼ 10 s; (b) t ¼ 30 s; (c) t ¼ 50 s and (d) t ¼ 80 s. The color scales are in meters.
G. Ma et al. / Ocean Modelling 69 (2013) 146–165 161
with the characteristic length and time of landslide motion definedas
s0 ¼u2
t
a0and t0 ¼
ut
a0ð31Þ
where the initial acceleration a0 is
a0 ¼ g sin h 1� tan /tan h
� �c� 1cþ Cm
� �ð32Þ
and the landslide terminal velocity ut is
ut ¼ffiffiffiffiffiffigd
p ffiffiffiffiffiffiffiffiffiffiffiffiffiffiffiffiffiffiffiffiffiffiffiffiffiffiffiffiffiffiffiffiffiffiffiffiffiffiffiffiffiffiffiffiffiffiffiffiffiffiffiffiffiffiffiffiffiffiffiffiffiffiffiffiffiffiffiffiffiffiffiffiffiffib sin h
d1� tan /
tan h
� �c� 1
Cd
2ðf 2 � �Þf � �
sð33Þ
In the above equations, h is the inclination angle of the slope whichis 4� in this case. The Coulomb friction is negligible as compared toinertia, gravity and hydrodynamic forces (Enet and Grilli, 2007,such that /� h. c ¼ qs=qw is taken as 2.0. The virtual masscoefficient Cm and drag coefficient Cd are taken as 0.5 and 1.0,respectively. With these parameters, we can obtain the initialacceleration a0 ¼ 0:27 m2/s, and the terminal velocity

0 1000 2000 3000 4000 5000 6000 7000 8000−2.5
−2
−1.5
−1
−0.5
0
0.5
1
x (m)
η(m
)
Fig. 23. Free surface elevations in a vertical plane with y ¼ 0 m at t ¼ 10 s (solidline); t ¼ 30 s (dashed line); t ¼ 50 s (dash-dotted line) and t ¼ 100 s (dotted line).
0 1000 2000 3000 4000 5000 6000 7000 8000−2
−1.5
−1
−0.5
0
0.5
1
1.5
x(m)
η(m
)
Fig. 24. Free surface elevations in a vertical plane from a hydrostatic simulationwith y ¼ 0 m at t ¼ 10 s (solid line); t ¼ 30 s (dashed line); t ¼ 50 s (dash-dottedline) and t ¼ 100 s (dotted line).
162 G. Ma et al. / Ocean Modelling 69 (2013) 146–165
ut ¼ 21:09 m/s. The characteristic time of the landslide motion ist0 ¼ 78:1 s. The simulation is conducted using NHWAVE with spe-cific boundary condition for rigid landslide, as described in Maet al. (2012).
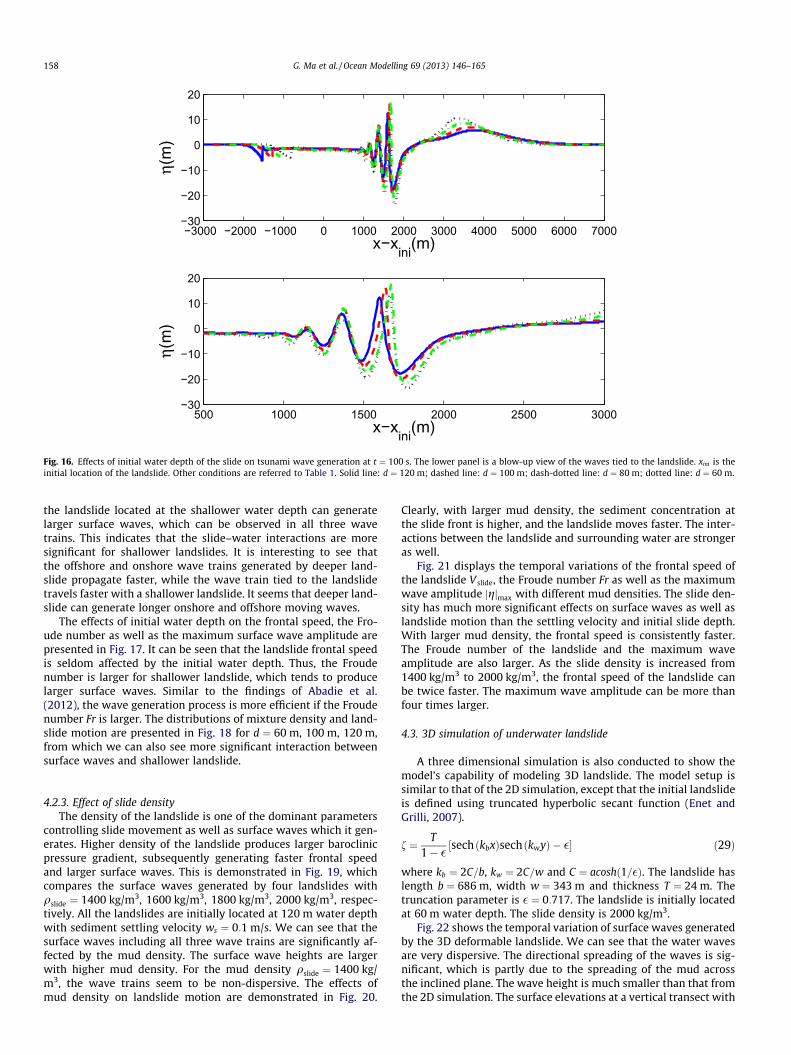
Fig. 25 presents the temporal variations of surface waves gener-ated by the 3D rigid landslide. The wave forms generated bydeformable (Fig. 22) and and rigid landslides are very different.For the case of rigid landslide, wave energy is mainly concentratedon a narrow band from the dominant landslide direction. Thedirectional spreading of waves generated by the deformable land-slide is much more significant. In addition, the waves induced bythe deformable landslide reach their maximum heights shortlyafter the release of the sliding mass, and then decay as the sedi-ment spreads and diffuses. While the surface waves which the rigidlandslide generates develop slowly. This is more clearly observedby comparing Figs. 23 and 26, which demonstrates the temporalvariations of the surface elevation at the centerline transect gener-ated by the rigid landslide. At the early stage of the landslide, thedeformable landslide has larger speed and acceleration, resulting
in larger surface waves. However, as the rigid landslide continu-ously accelerates, it can generate larger waves eventually.
The differences of the surface wave features are partly causedby the different kinematics of the rigid and deformable landslides,which are displayed in Fig. 27. The displacement of the rigid land-slide is described as Eq. (30), while the along-slope displacement ofthe deformable landslide is calculated by
ss ¼R
V sCdVRV CdV
ð34Þ
where ss is the along-slope distance from the initial centroid of thelandslide, C is the sediment volume concentration, V is the volumeof the landslide, which is identified as the sliding mass with sedi-ment mass concentration greater than 0.01 kg/m3, dV is the cellvolume.
In Fig. 27, the displacements of the centroid (solid line) andleading edge (dash-dotted line) of the deformable landslide areboth presented. Due to the spreading of the landslide, these twodisplacements are different. Apparently, the sliding speed at theleading edge is faster than that at the centroid. It is noticed that,at the early stage of landslide (approximately < 40 s), the speed ofthe deformable landslide estimated by the gradient of the dash-dotted curve is faster than that of rigid landslide, which leadsto larger surface waves. After that, the deformable landslideseems having a constant slide speed. The along-slope displace-ment is nearly a linear function of time. However, the rigid land-slide is still in the acceleration stage till around the characteristictime t0 ¼ 78:1 s, when the landslide reaches its terminal velocity.In order to assess the spreading of the deformable landslide, wedefine the along-slope and cross-slope spreading distances xl
and yl as
xl ¼R
V js� scjCdVRV CdV
ð35Þ
yl ¼R
V jy� ycjCdVRV CdV
ð36Þ
where ðsc; ycÞ is the centroid of the landslide. The temporal varia-tions of ðxl; ylÞ are presented in the middle panel of Fig. 27, wherethe solid line denotes the varying xl, and dashed line representsyl. As the landslide moves downslope, xl and yl both increase, indi-cating that the landslide is spreading while sliding. The lateral(cross-slope) spreading is much more significant than the along-slope spreading. This can also be found by looking at the temporalvariations of the length L and width W of the deformable landslide,which are shown in the third panel of Fig. 27. To determine L and W,the landslide is identified as the sliding mass with sediment con-centration greater than 0.01 kg/m3. The length L is initially twotimes bigger than the width W. The cross-slope spreading rate isgreater so that the length L and the width W are nearly equal att ¼ 100 s. The different spreading rates in the along-slope andcross-slope directions lead to the change of the slide shape, asshown in Fig. 28, which displays the temporal variations of sedi-ment concentration distributions at the bottom layer. The landslideinitially has an elliptical shape. However, it becomes more and morecircular while moving downslope. The high-concentration landslideis diluted and diffused simultaneously.
5. Conclusions
This paper presents a new submarine landslide model base onthe Non-Hydrostatic WAVE model (NHWAVE) (Ma et al., 2012).The model solves free surface elevation directly, which makes itmore efficient than VOF and SPH models. The landslide is simu-lated as water–sediment mixture, which can be diffused and
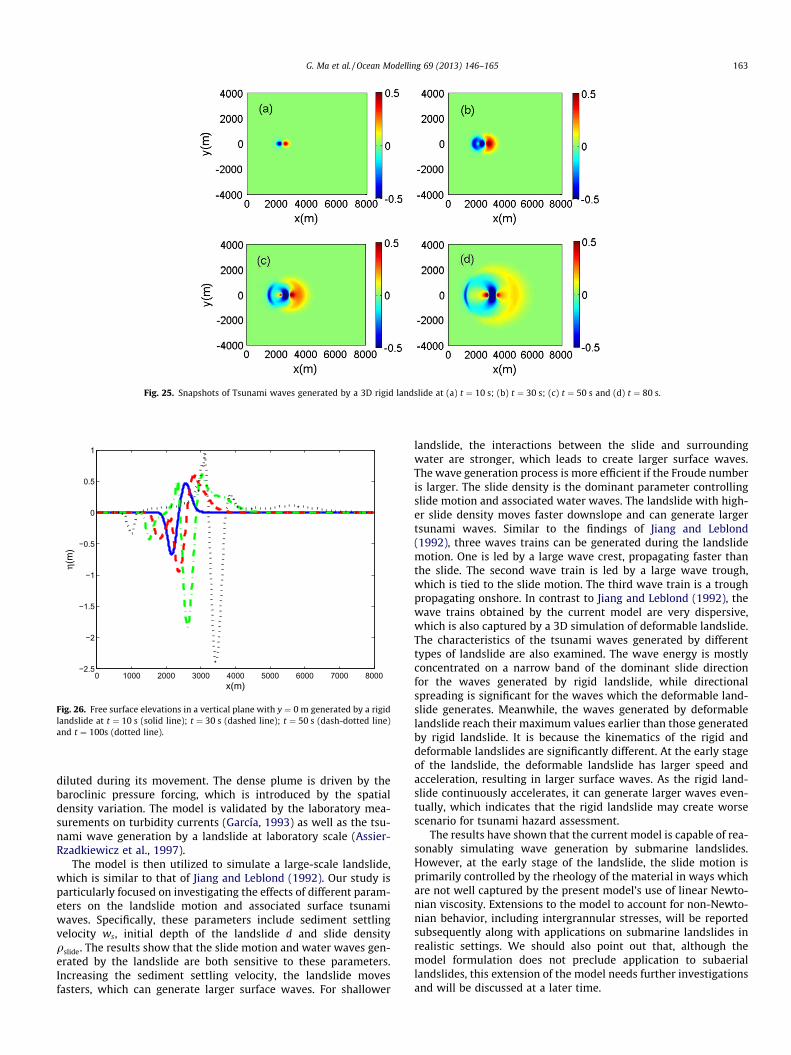
Fig. 25. Snapshots of Tsunami waves generated by a 3D rigid landslide at (a) t ¼ 10 s; (b) t ¼ 30 s; (c) t ¼ 50 s and (d) t ¼ 80 s.
0 1000 2000 3000 4000 5000 6000 7000 8000−2.5
−2
−1.5
−1
−0.5
0
0.5
1
x(m)
η(m
)
Fig. 26. Free surface elevations in a vertical plane with y ¼ 0 m generated by a rigidlandslide at t ¼ 10 s (solid line); t ¼ 30 s (dashed line); t ¼ 50 s (dash-dotted line)and t ¼ 100s (dotted line).
G. Ma et al. / Ocean Modelling 69 (2013) 146–165 163
diluted during its movement. The dense plume is driven by thebaroclinic pressure forcing, which is introduced by the spatialdensity variation. The model is validated by the laboratory mea-surements on turbidity currents (García, 1993) as well as the tsu-nami wave generation by a landslide at laboratory scale (Assier-Rzadkiewicz et al., 1997).
The model is then utilized to simulate a large-scale landslide,which is similar to that of Jiang and Leblond (1992). Our study isparticularly focused on investigating the effects of different param-eters on the landslide motion and associated surface tsunamiwaves. Specifically, these parameters include sediment settlingvelocity ws, initial depth of the landslide d and slide densityqslide. The results show that the slide motion and water waves gen-erated by the landslide are both sensitive to these parameters.Increasing the sediment settling velocity, the landslide movesfasters, which can generate larger surface waves. For shallower
landslide, the interactions between the slide and surroundingwater are stronger, which leads to create larger surface waves.The wave generation process is more efficient if the Froude numberis larger. The slide density is the dominant parameter controllingslide motion and associated water waves. The landslide with high-er slide density moves faster downslope and can generate largertsunami waves. Similar to the findings of Jiang and Leblond(1992), three waves trains can be generated during the landslidemotion. One is led by a large wave crest, propagating faster thanthe slide. The second wave train is led by a large wave trough,which is tied to the slide motion. The third wave train is a troughpropagating onshore. In contrast to Jiang and Leblond (1992), thewave trains obtained by the current model are very dispersive,which is also captured by a 3D simulation of deformable landslide.The characteristics of the tsunami waves generated by differenttypes of landslide are also examined. The wave energy is mostlyconcentrated on a narrow band of the dominant slide directionfor the waves generated by rigid landslide, while directionalspreading is significant for the waves which the deformable land-slide generates. Meanwhile, the waves generated by deformablelandslide reach their maximum values earlier than those generatedby rigid landslide. It is because the kinematics of the rigid anddeformable landslides are significantly different. At the early stageof the landslide, the deformable landslide has larger speed andacceleration, resulting in larger surface waves. As the rigid land-slide continuously accelerates, it can generate larger waves even-tually, which indicates that the rigid landslide may create worsescenario for tsunami hazard assessment.
The results have shown that the current model is capable of rea-sonably simulating wave generation by submarine landslides.However, at the early stage of the landslide, the slide motion isprimarily controlled by the rheology of the material in ways whichare not well captured by the present model’s use of linear Newto-nian viscosity. Extensions to the model to account for non-Newto-nian behavior, including intergrannular stresses, will be reportedsubsequently along with applications on submarine landslides inrealistic settings. We should also point out that, although themodel formulation does not preclude application to subaeriallandslides, this extension of the model needs further investigationsand will be discussed at a later time.

0 10 20 30 40 50 60 70 80 90 1000
500
1000
1500
s s (m)
0 10 20 30 40 50 60 70 80 90 1000
100
200
300
x l/yl (m
)
0 10 20 30 40 50 60 70 80 90 100
500
1000
1500
time (s)
L/W
(m)
Fig. 27. The along-slope displacement ss of the deformable (solid line) and rigid (dashed line) landslide (upper panel), the temporal variations of along-slope and cross-slopespreading distances ðxl; ylÞ (middle panel) as well as the length L (solid line) and width W (dashed line) of the deformable landslide (lower panel). The displacement of therigid landslide is described by Eq. (30). The dash-dotted line in the upper panel shows the displacement of the leading edge of the deformable landslide. The landslide isidentified as the sliding mass with sediment concentration greater than 0.01 kg/m3.
(a)
0 500 1000 1500 20000
500
1000
1500
2000
(b)
0 500 1000 1500 20000
500
1000
1500
2000
cros
s−sl
ope
y (m
)
(c)
0 500 1000 1500 20000
500
1000
1500
2000
along−slope s (m)
(d)
0 500 1000 1500 20000
500
1000
1500
2000
0.01
0.02
0.03
0.04
0.05
0.06
0.07
0.08
0.09
0.1
Fig. 28. The movement and spreading of the deformable landslide, which is identified as the sliding mass with sediment concentration greater than 0.01 kg/m3. (a) t ¼ 10 s;(b) t ¼ 30 s; (c) t ¼ 50 s and (d) t ¼ 100 s. The distributions of sediment concentration at the bottom layer are demonstrated.
164 G. Ma et al. / Ocean Modelling 69 (2013) 146–165

G. Ma et al. / Ocean Modelling 69 (2013) 146–165 165
Acknowledgments
G. Ma acknowledges the support from the Old Dominion Uni-versity research foundation, Project 993092. J.T. Kirby and F. Shiacknowledge the support of the National Tsunami Hazard Mitiga-tion Program (NOAA), Grant NA10NWS4670010. The authors areindebted to four anonymous reviewers for constructive commentsand thorough reviews of the paper.
References
Abadie, S., Morichon, D., Grilli, S.T., Glockner, S., 2010. Numerical simulation ofwaves generated by landslides using a multiple-fluid Navier–Stokes model.Coast. Eng. 57, 779–794.
Abadie, S., Harris, J.C., Grilli, S.T., Fabre, R., 2012. Numerical modeling of tsunamiwaves generated by the flank collapse of the Cumbre Vieja Volcano (La Palma,Canary Islands): Tsunami source and near field effects. J. Geophys. Res. 117,C05030. http://dx.doi.org/10.1029/2011JC007646.
Assier-Rzadkiewicz, S., Mariotti, C., Heinrich, P., 1997. Numerical simulation ofsubmarine landslides and their hydraulic effects, J. Waterway, Port, Coastal, andOcean Engineering 123, 149–157.
Ataie-Ashtiani, B., Shobeyri, G., 2008. Numerical simulation of landslide impulsivewaves by incompressible smoothed particle hydrodynamics. Int. J. Numer.Meth. Fluids 56, 209–232.
Enet, F., Grilli, S.T., 2007. Experimental study of tsunami generation by three-dimensional rigid underwater landslide, J. Waterway, Port, Coastal, Ocean Eng.133, 442–454.
Fringer, O.B., Gerritsen, M., Street, R.L., 2006. An unstructured-grid, finite-volume,nonhydrostatic, parallel coastal ocean simulator. Ocean Model. 14, 139–173.
Fuhrman, D.R., Madsen, P.A., 2009. Tsunami generation, propagation, and run-upwith a high-order Boussinesq model. Coast. Eng. 56, 747–758.
García, M.H., 1993. Hydraulic jumps in sediment-driven bottom currents, J. Hydraul.Eng. 119, 1094–1117.
Giachetti, T., Paris, R., Kelfoun, K., Perez-Torrado, F.J., 2011. Numerical modelling ofthe tsunami triggered by the Guimar debris avalanche, Tenerife (CanaryIslands): Comparison with field-based data. Mar. Geol. 284 (1–4), 189–202.
Gottlieb, S., Shu, C.-W., Tadmor, E., 2001. Strong stability-preserving high-ordertime discretization methods. SIAM Rev. 43, 89–112.
Grilli, S.T., Watts, P., 1999. Modeling of waves generated by a moving submergedbody: Applications to underwater landslides. Eng. Anal. Boundary Elem. 23,645–656.
Grilli, S.T., Watts, P., 2005. Tsunami generation by submarine mass failure: 1.Modeling, experimental validation, and sensitivity analysis. J. Waterw. PortCoastal Ocean Eng. 131 (6), 283–297.
Grilli, S.T., Vogelmann, S., Watts, P., 2002. Development of a 3D numerical wavetank for modeling tsunami generation by underwater landslides. Eng. Anal.Boundary Elem. 26 (4), 301–313.
Harbitz, C.B., 1992. Model simulations of tsunamis generated by the Storegga slides.Marine Geol. 105, 1–21.
Härtel, C., Meiburg, E., Necker, F., 2000. Analysis and direct numerical simulation ofthe flow at a gravity-current head. Part 1. Flow topology and front speed for slipand no-slip boundaries. J. Fluid Mech. 418, 189–212.
Harten, A., Lax, P., van Leer, B., 1983. On upstream differencing and Godunov-typeschemes for hyperbolic conservation laws. SIAM Rev. 25, 35.
Heinrich, P., 1992. Nonlinear water waves generated by submarine and aeriallandslides. J. Waterw. Port Coast. Ocean Eng. 118, 249–266.
Horrillo, J., Wood, A., Kim, G.-B., Parambath, A., 2013. A simplified 3-D Navier–Stokes numerical model for landslide-tsunami: Application to the Gulf ofMexico. J. Geophys. Res. Personal communication.
Imran, J., Harff, P., Park, G., 2001. A numerical model of submarine debris flow withgraphical user interface. Comput. Geosci. 27, 717–729.
Jiang, L., Leblond, P.H., 1992. The coupling of a submarine slide and the surfacewaves which it generates. J. Geophys. Res. 97, 12731–12744.
Jiang, L., Leblond, P.H., 1993. Numerical modeling of an underwater Bingham plasticmudslide and the waves which it generates. J. Geophys. Res. 98, 10303–10317.
Kelfoun, K., Druitt, T.H., 2005. Numerical modelling of the emplacement of Socomparock avalanche, Chile. J. Geophys. Res. 110, B12202. http://dx.doi.org/10.1029/2005JB003758.
Kelfoun, K., Giachetti, T., Labazuy, P., 2010. Landslide-generated tsunamis atReunion Island. J. Geophys. Res. 115, F04012. http://dx.doi.org/10.1029/2009JF001381.
Lai, Z., Chen, C., Cowles, G.W., Beardsley, R.C., 2010. A nonhydrostatic version ofFVCOM: 1. Validation experiments. J. Geophys. Res. 115, C11010. http://dx.doi.org/10.1029/2009JC005525.
Lin, P., Liu, P.L.-F., 1998a. A numerical study of breaking waves in the surf zone. J.Fluid Mech. 359, 239–264.
Lin, P., Liu, P.L.-F., 1998b. Turbulence transport, vorticity dynamics, and solutemixing under plunging breaking waves in the surf zone. J. Geophys. Res. 103,15677–15694.
Liu, P.L.-F., Wu, T.-R., Raichlen, F., Synolakis, C.E., Borrero, J.C., 2005. Runup andrundown generated by three-dimensional masses. J. Fluid Mech. 536, 107–144.
Lynett, P., Liu, P.L.-F., 2003. A numerical study of submarine landslide-generatedwaves and runup. Proc. R. Soc. A 458, 2885–2910.
Ma, G., Shi, F., Kirby, J.T., 2011. A polydisperse two-fluid model for surf zone bubblesimulation. J. Geophys. Res. 116, C05010. http://dx.doi.org/10.1029/2010JC006667.
Ma, G., Shi, F., Kirby, J.T., 2012. Shock-capturing non-hydrostatic model for fullydispersive surface wave processes. Ocean Modell. 43–44, 22–35.
Masson, D.G., Harbitz, C.B., Wynn, R.B., Pedersen, G., Lovholt, F., 2006. Submarinelandslides: processes, triggers and hazard prediction. Phil. Trans. Roy. Soc. A364, 2009–2039.
Montagna, F., Bellotti, G., Di Risio, M., 2011. 3D numerical modeling of landslide-generated tsunamis around a conical island. Nat. Hazards 58, 591–608.
Rodi, W., 1987. Examples of calculation methods for flow and mixing in stratifiedflows. J. Geophys. Res. 92 (5), 5305–5328.
Shi, F., Kirby, J.T., Harris, J.C., Geiman, J.D., Grilli, S.T., 2012. A high-order adaptivetime-stepping TVD solver for Boussinesq modeling of breaking waves andcoastal inundation. Ocean Model. 43–44, 36–51.
Snyder, P.J., Hsu, T.-J., 2011. A numerical investigation of convective sedimentation.J. Geophys. Res. 116, C09024. http://dx.doi.org/10.1029/2010JC006792.
Synolakis, C.E., Bardet, J.-P., Borrero, J.C., Davies, H.L., Okal, E.A., Silver, E.A., Sweet, S.,Tappin, D.R., 2002. The slump origin of the 1998 Papua New Guinea Tsunami.Proc. R. Soc. Lond. Ser. A 458, 763–790.
Tappin, D.R., Watts, P., McMurtry, G.M., Lafoy, Y., Matsumoto, T., 2001. The Sissano,Papua New Guinea tsunami of July 1998 – Offshore evidence on the sourcemechanism. Mar. Geol. 175, 1–23.
Tappin, D.R., Watts, P., McMurtry, G.M., Lafoy, Y., Matsumoto, T., 2002. Prediction ofslump generated tsunamis: The July 17th 1998 Papua New Guinea event. Sci.Tsunami Hazards 20 (4), 222–238.
Toro, E.F., Spruce, M., Speares, W., 1994. Restoration of the contact surface in theHLL-Riemann solver. Shock Waves 4, 25–34.
Torres-Freyermuth, A., Hsu, T.-J., 2010. On the dynamics of wave-mud interaction: Anumerical study. J. Geophys. Res. 115, C07014. http://dx.doi.org/10.1029/2009JC005552.
Turner, J.S., 1973. Buoyancy Effects in Fluids. Cambridge University Press, p. 367.Watts, P., Grilli, S.T., 2003. Underwater landslide shape, motion, deformation, and
tsunami generation. In: Proceedings of 13th International Offshore and PolarEngineering Conference, Honolulu, Hawaii, May 25–30.
Watts, P., Grilli, S.T., Kirby, J.T., Fryer, G.J., Tappin, D.R., 2003. Landslide tsunami casestudies using a Boussinesq model and a fully nonlinear tsunami generationmodel. Nat. Hazards Earth Syst. Sci. 3, 391–402.
Yuk, D., Yim, S.C., Liu, P.L.-F., 2006. Numerical modeling of submarine mass-movement generated waves using RANS model. Comput. Geosci. 32 (7), 927–935.
Zhou, H., Teng, M.H., 2010. Extended fourth-order depth-integrated model for waterwaves and currents generated by submarine landslides. J. Eng. Mech. 136 (4),506–516.
Zhu, J., 1991. A low-diffusive and oscillation-free convection scheme. Commun.Appl. Numer. Meth. 7, 225–232.


![Physical modeling of tsunamis generated by three ......[2] Tsunamis are water waves generated by impulsive disturbances such as submarine earthquakes and landslides, volcanic eruptions](https://img.pdfslide.us/doc/110x75/605705a83642e512411472aa/physical-modeling-of-tsunamis-generated-by-three-2-tsunamis-are-water.jpg)