Embed Size (px)
Citation preview
NUEVAS METODOLOGÍAS EN
ANÁLISIS DE ALIMENTOS CON EL
USO DE NANOPARTÍCULAS
NEW METHODOLOGIES IN FOOD
ANALYSIS USING NANOPARTICLES
Tesis Doctoral
Juan Godoy Navajas
Marzo 2014

TITULO: Nuevas metodologías en análisis de alimentos con el uso denanopartículas. New metodologies in food analysis using nanoparticles
AUTOR: Juan Godoy Navajas
© Edita: Servicio de Publicaciones de la Universidad de Córdoba. 2014 Campus de RabanalesCtra. Nacional IV, Km. 396 A14071 Córdoba
www.uco.es/[email protected]


Mediante la defensa de esta Memoria se pretende optar a
la obtención de la Mención “Doctorado Internacional” habida
cuenta de que el doctorando reúne los requisitos exigidos para tal
mención:
1. Cuenta con los informes favorables de dos doctores
pertenecientes a Instituciones de Enseñanza Superior de
países europeos distintos a España.
2. Uno de los miembros del tribunal que ha de evaluar la
Tesis pertenece a un centro de enseñanza superior de otro
país europeo.
3. Parte de la defensa de la Memoria se realizará en la lengua
oficial de otro país europeo.
4. El doctorando ha realizado una estancia en el
Departamento of Biotecnología de la Universidad de
Turku, Finlandia, de tres meses de duración, que ha
contribuido a su formación y permitido desarrollar parte
del trabajo experimental de esta Memoria.

Quisiera mostrar mi más sincero agradecimiento a mis directoras
de Tesis Doctoral, Tina y Mari Paz.
Gracias Tina por darme la oportunidad de trabajar contigo durante
estos años y por ver en mi algo que nadie había visto anteriormente.
Mari Paz, gracias por volcar todos tus conocimientos conmigo, por
sacar lo mejor de mí y por enseñarme lo fascinante que puede llegar a ser el
mundo de la investigación.
A ambas os estaré eternamente agradecido.
A Juan Manuel Fernández Romero que siempre ha estado ahí
cuando lo he necesitado.
Gracias a mis compañeras de laboratorio. Todas habéis conseguido
que mi día a día sea mucho más ameno. Siempre es mucho más fácil
trabajar rodeado de sonrisas y alegría.
A mis compañeros y amigos del departamento de Química
Analítica (Paco, María, Isa Montesinos, María José, Jose, Noelia Luque,
Noelia Caballero, Antoñito, Carmen, Ana Ballesteros, Laura Soriano,
Guille, Lola, Nani, Isa Márquez…) pero especialmente a mi grandísimo
amigo JuanMa Jiménez. A veces la vida pone en mitad de tu camino
pruebas muy difíciles de superar. Pero en otras ocasiones, coloca a gente
maravillosa que te ayuda a superar estas pruebas. Muchas gracias por todo
y nunca os olvidaré.
No puedo olvidarme de vosotros, de mis compañeros de piso y de
carrera. Este camino lo comenzamos juntos hace ya más de una década y lo
estamos finalizando juntos. Muchas gracias de todo corazón a Jesús,
Alejandro, Pepe, Puri, Kaquisco, Jose, Trócoli, Carlos, Cristel, porque
gracias a vosotros tengo la gran suerte de recordar todos estos años con
una sonrisa en los labios.
Gracias a mi familia, especialmente a mis hermanos: Puri, Carmen
y Jose. Fui el pequeño de una familia numerosa pero, sobre todo, me sentí
siempre el más querido. Hemos vivido muchos momentos buenos y
algunos muy malos, pero siempre hemos estado todos unidos. Muchísimas
gracias por todo vuestro apoyo incondicional.
He dejado para el final a las personas más importantes en mi vida.
Mis padres. Vosotros habéis sido los pilares de mi vida, de mi educación y
formación. Gracias a vosotros, hoy soy lo que soy. Vosotros habéis luchado
durante toda vuestra vida para que pudiésemos llegar a lo más. No hay
palabras para agradecer todo lo que habéis hecho por mí y por mis
hermanos. Esta Tesis Doctoral es vuestra.

I would like to thank Prof. Tero Soukka for offering me the
opportunity to work with him in the Department of
Biotechnology of the University of Turku (Finland).
Special thanks should be given to PhD. Terhi Riuttamäki
for her support and unconditional help in both academic and
personal fields, and for the time devoted to me.
I also thank to other colleagues (Timo, Sami, Ari and
Rikka) for their valuable help and kindness during my stay in
Finland.

Agradezco a la Consejería de Economía, Innovación, Ciencia y
Empleo de la Junta de Andalucía la concesión de una beca pre‐doctoral
adscrita al Proyecto de Excelencia P09‐FQM4933 que me ha permitido
dedicar estos últimos 4 años al desarrollo de esta Tesis.


INDICE

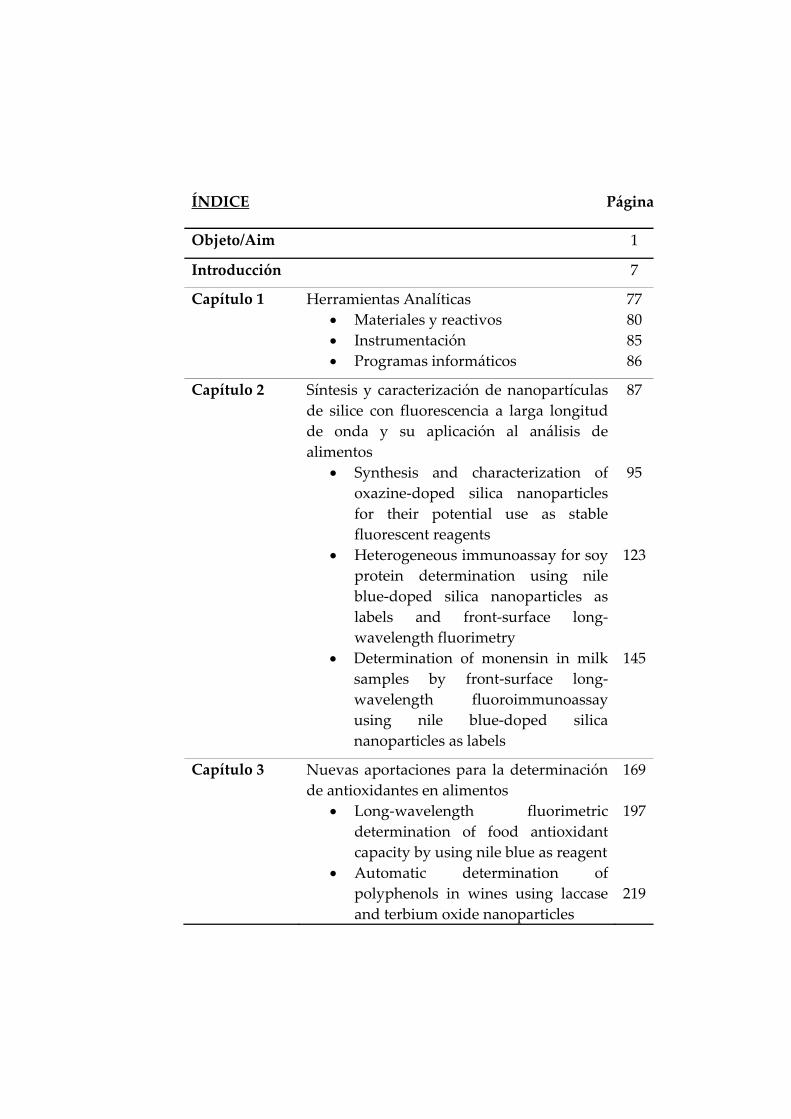
ÍNDICE Página
Objeto/Aim 1
Introducción 7
Capítulo 1 Herramientas Analíticas
Materiales y reactivos
Instrumentación
Programas informáticos
77
80
85
86
Capítulo 2 Síntesis y caracterización de nanopartículas
de silice con fluorescencia a larga longitud
de onda y su aplicación al análisis de
alimentos
Synthesis and characterization of
oxazine‐doped silica nanoparticles
for their potential use as stable
fluorescent reagents
Heterogeneous immunoassay for soy
protein determination using nile
blue‐doped silica nanoparticles as
labels and front‐surface long‐
wavelength fluorimetry
Determination of monensin in milk
samples by front‐surface long‐
wavelength fluoroimmunoassay
using nile blue‐doped silica
nanoparticles as labels
87
95
123
145
Capítulo 3 Nuevas aportaciones para la determinación
de antioxidantes en alimentos
Long‐wavelength fluorimetric
determination of food antioxidant
capacity by using nile blue as reagent
Automatic determination of
polyphenols in wines using laccase
and terbium oxide nanoparticles
169
197
219
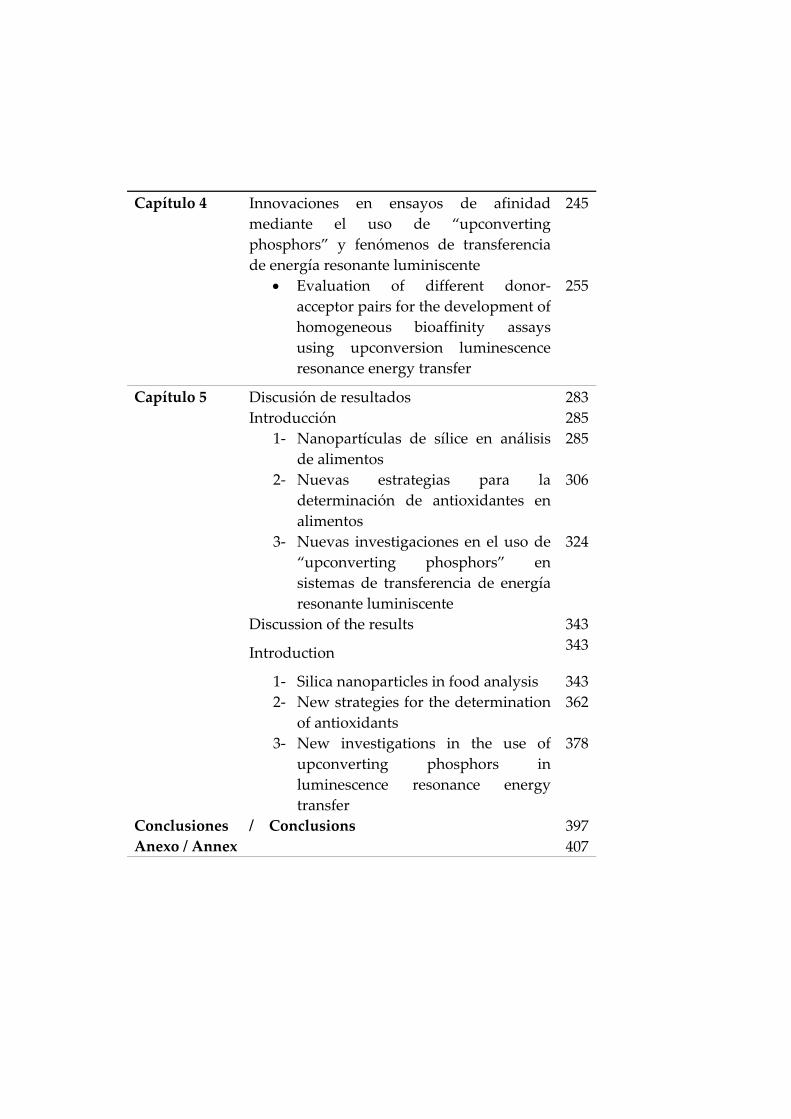
Capítulo 4 Innovaciones en ensayos de afinidad
mediante el uso de “upconverting
phosphors” y fenómenos de transferencia
de energía resonante luminiscente
Evaluation of different donor‐
acceptor pairs for the development of
homogeneous bioaffinity assays
using upconversion luminescence
resonance energy transfer
245
255
Capítulo 5 Discusión de resultados
Introducción
283
285
1‐ Nanopartículas de sílice en análisis
de alimentos
2‐ Nuevas estrategias para la
determinación de antioxidantes en
alimentos
3‐ Nuevas investigaciones en el uso de
“upconverting phosphors” en
sistemas de transferencia de energía
resonante luminiscente
285
306
324
Discussion of the results
Introduction
343
343
1‐ Silica nanoparticles in food analysis 2‐ New strategies for the determination
of antioxidants
3‐ New investigations in the use of
upconverting phosphors in
luminescence resonance energy
transfer
343
362
378
Conclusiones / Conclusions 397
Anexo / Annex 407
OBJETO
AIM

Objeto
‐ 3 ‐
El objetivo genérico de las investigaciones que constituyen esta
Memoria ha sido el desarrollo de métodos rápidos para el análisis de
alimentos utilizando, básicamente, las especiales propiedades que
presentan distintos nanomateriales. Los estudios realizados han
pretendido expandir la aplicabilidad analítica de la Nanotecnología para
abrir nuevas vías, alternativas a las ya establecidas, que mejoren el control
de la calidad alimentaria. Para alcanzar este objetivo se han realizado las
siguientes investigaciones:
‐ Síntesis y caracterización de nanopartículas de sílice dopadas con
los fluoróforos de larga longitud de onda azul nilo y violeta de
cresilo y su utilización para formar marcadores aplicables a la
determinación de macromoléculas y moléculas pequeñas en
alimentos mediante inmunoensayo heterogéneo.
‐ Desarrollo de nuevas metodologías analíticas para la
determinación de parámetros globales en alimentos, tales como la
capacidad antioxidante y contenido de polifenoles, utilizando
fluorimetría de larga longitud de onda y nanopartículas de óxido
de terbio, respectivamente.
‐ Estudio sistemático de la utilidad del fenómeno de transferencia de
energía de resonancia luminiscente (LRET) entre nanocristales de
iones lantánidos, que presentan luminiscencia anti‐Stokes
(upconverting phosphors), y fluoróforos orgánicos para la
determinación de biotina mediante ensayos de afinidad en medio
homogéneo.

Aim
‐ 5 ‐
The general aim of the investigations included in this Dissertation
has been the development of fast methods for food analysis mainly using
the especial properties of nanomaterials. The studies performed have tried
to expand the application field of Nanotechnology and open new
possibilities by developing analytical methods alternative to those already
established in order to improve food quality control processes. The
investigations performed to achieve this goal are described below:
‐ Synthesis and characterization of silica nanoparticles doped with
the long‐wavelength fluorophores cresyl violet and nile blue and
their further use to obtain tracers to be applied to the determination
of either macromolecules or haptens in foods by heterogeneous
immunoassay.
‐ Development of new analytical methodologies to estimate global
parameters in foods, such as the antioxidant capacity and total
polyphenol content, using long wavelength fluorometry and
terbium oxide nanoparticles, respectively.
‐ Study of the potential usefulness of luminescent resonance energy
transfer (LRET) between nanocrystals of lanthanide ions that show
anti‐Stokes luminescence (upconverting phosphors) and organic
fluorophores to develop homogeneous affinity assays for biotin.


INTRODUCCIÓN

Introducción
‐ 9 ‐
Las investigaciones que se presentan en esta Memoria han dado
lugar a diversos métodos determinativos orientados principalmente a
ampliar el campo de aplicación de la Nanotecnología en análisis de
alimentos. Como preámbulo a estas investigaciones se describen a
continuación algunos aspectos relacionados con las metodologías
desarrolladas, incidiendo en los tres tipos de nanomateriales utilizados en
esta Memoria, en los fluoróforos de larga longitud de onda y en el
inmunoensayo. Al inicio de cada capítulo se describirán aspectos más
concretos relacionados con su contenido. Esta introducción general se ha
dividido en cuatro apartados: 1) nanopartículas de sílice, 2) nanomateriales
basados en lantánidos, principalmente “upconverting phosphors” y óxidos
de lantánidos, 3) fluoróforos de larga longitud de onda, y 4) técnicas de
inmunoensayo y su uso en análisis de alimentos.
1. Nanopartículas de sílice
Las numerosas investigaciones que se están desarrollando en el
campo de la Nanotecnología, y los procesos involucrados en la síntesis,
manipulación y desarrollo de nanomateriales, están dando lugar a nuevas
herramientas metodológicas e instrumentales con aplicaciones en distintas
áreas analíticas [1]. Entre la variedad de los nanomateriales actualmente
disponibles, el uso de nanopartículas de sílice (SiO2NPs) constituye una
opción muy útil como se describe a continuación.
El interés que presenta la utilización de SiO2NPs con fines
analíticos es atribuible a sus especiales características. No solo muestran
Introducción
‐ 10 ‐
ausencia de toxicidad, elevada solubilidad en agua y estabilidad,
principalmente en medio acuoso, sino también otras características tales
como su fácil funcionalización y enlace a biomóleculas, la posibilidad de
controlar su porosidad, su transparencia a la radiación, su bajo coste y su
capacidad para utilizarlas como portadores de una amplia variedad de
reactivos [2]. Estas propiedades hacen de las SiO2NPs un material muy
adecuado para su uso en bioensayos.
Los fluoróforos convencionalmente utilizados como marcadores
moleculares están siendo sustituidos por SiO2NPs dopadas con dichos
fluoróforos ya que éstas poseen propiedades ópticas superiores, una mayor
estabilidad química y una menor fotodescomposición. Además, se han
desarrollado NPs dopadas con especies electroquimioluminiscentes con
fines bioanalíticos por su gran estabilidad y mayor señal luminiscente,
siendo fácilmente aplicables en sistemas miniaturizados [3]. También se
han sintetizado otros tipos de SiO2NPs usando materiales
semiconductores, metálicos, magnéticos e incluso orgánicos. Además, la
elevada concentración de grupos silanoles que existe en la superficie de las
SiO2NPs facilita una gran variedad de reacciones de funcionalización y
unión a biomoléculas como son anticuerpos y otras proteínas, ADN u otras
moléculas para ensayos de bioafinidad, como son los sistemas biotina‐
avidina y biotina‐estreptavidina.
1.1 Síntesis de nanopartículas de sílice
Existen dos métodos principales para la síntesis de SiO2NPs: el
método Stöber y el método de microemulsión de micelas inversas.
Introducción
‐ 11 ‐
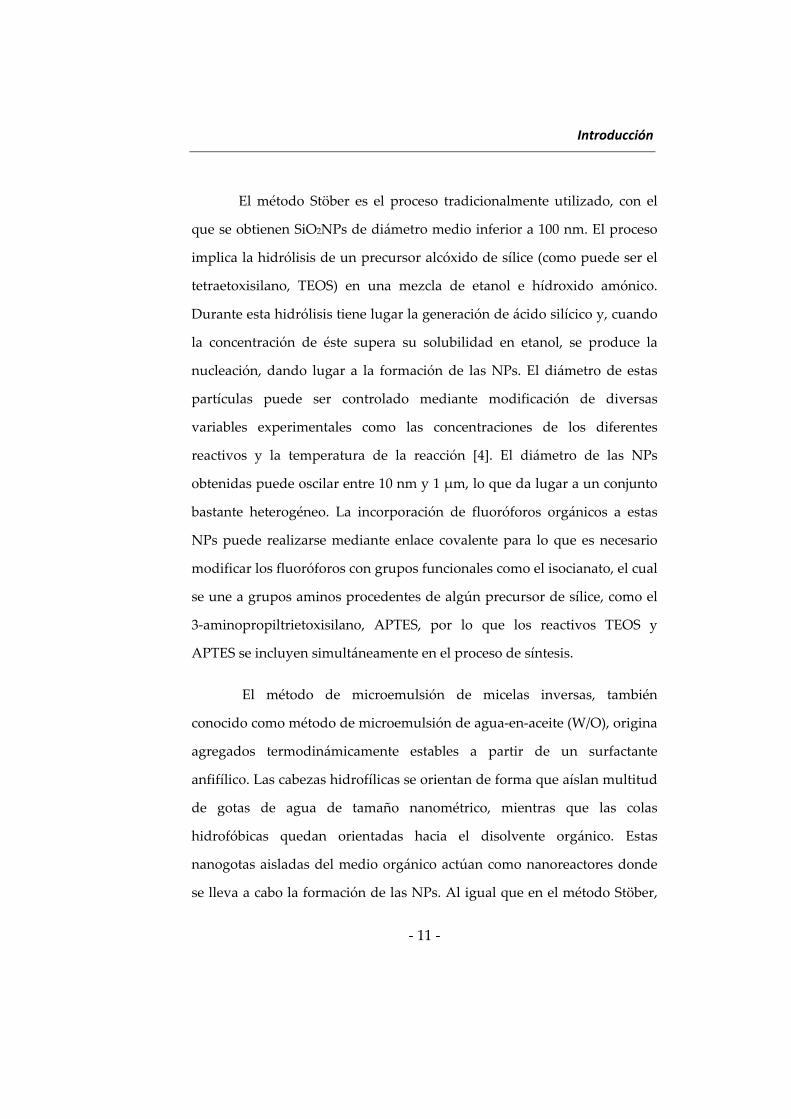
El método Stöber es el proceso tradicionalmente utilizado, con el
que se obtienen SiO2NPs de diámetro medio inferior a 100 nm. El proceso
implica la hidrólisis de un precursor alcóxido de sílice (como puede ser el
tetraetoxisilano, TEOS) en una mezcla de etanol e hídroxido amónico.
Durante esta hidrólisis tiene lugar la generación de ácido silícico y, cuando
la concentración de éste supera su solubilidad en etanol, se produce la
nucleación, dando lugar a la formación de las NPs. El diámetro de estas
partículas puede ser controlado mediante modificación de diversas
variables experimentales como las concentraciones de los diferentes
reactivos y la temperatura de la reacción [4]. El diámetro de las NPs
obtenidas puede oscilar entre 10 nm y 1 μm, lo que da lugar a un conjunto
bastante heterogéneo. La incorporación de fluoróforos orgánicos a estas
NPs puede realizarse mediante enlace covalente para lo que es necesario
modificar los fluoróforos con grupos funcionales como el isocianato, el cual
se une a grupos aminos procedentes de algún precursor de sílice, como el
3‐aminopropiltrietoxisilano, APTES, por lo que los reactivos TEOS y
APTES se incluyen simultáneamente en el proceso de síntesis.
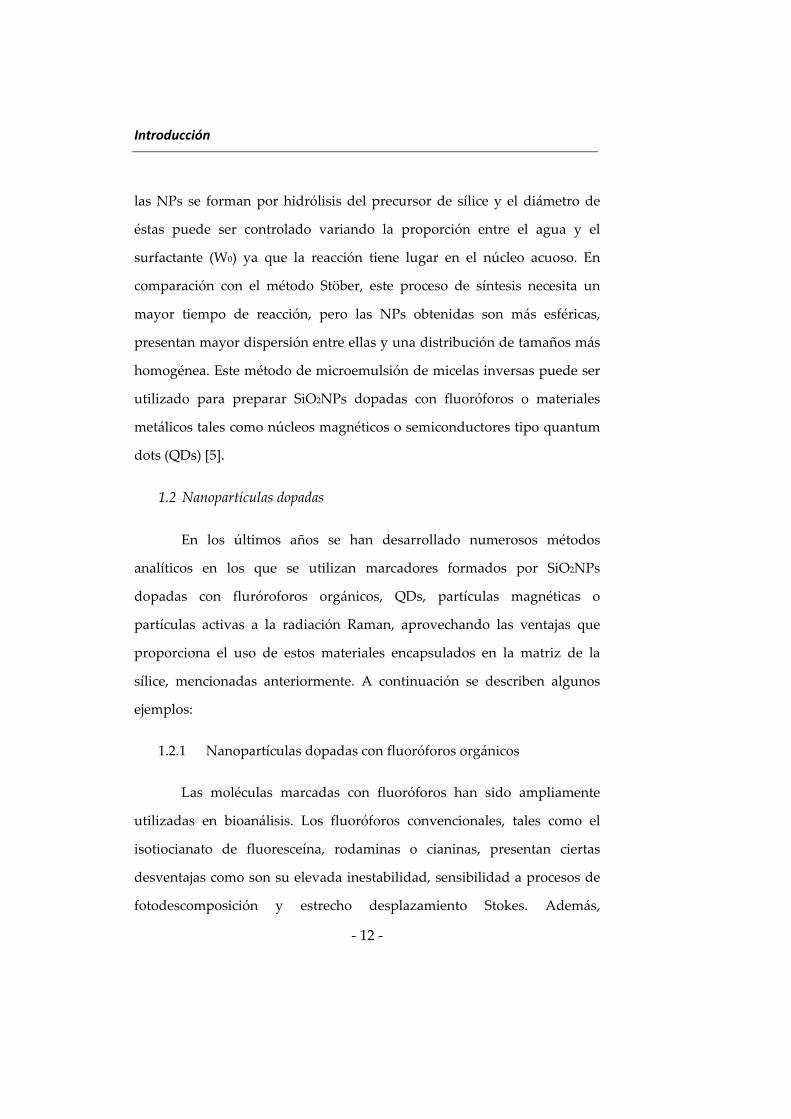
El método de microemulsión de micelas inversas, también
conocido como método de microemulsión de agua‐en‐aceite (W/O), origina
agregados termodinámicamente estables a partir de un surfactante
anfifílico. Las cabezas hidrofílicas se orientan de forma que aíslan multitud
de gotas de agua de tamaño nanométrico, mientras que las colas
hidrofóbicas quedan orientadas hacia el disolvente orgánico. Estas
nanogotas aisladas del medio orgánico actúan como nanoreactores donde
se lleva a cabo la formación de las NPs. Al igual que en el método Stöber,
Introducción
‐ 12 ‐
las NPs se forman por hidrólisis del precursor de sílice y el diámetro de
éstas puede ser controlado variando la proporción entre el agua y el
surfactante (W0) ya que la reacción tiene lugar en el núcleo acuoso. En
comparación con el método Stöber, este proceso de síntesis necesita un
mayor tiempo de reacción, pero las NPs obtenidas son más esféricas,
presentan mayor dispersión entre ellas y una distribución de tamaños más
homogénea. Este método de microemulsión de micelas inversas puede ser
utilizado para preparar SiO2NPs dopadas con fluoróforos o materiales
metálicos tales como núcleos magnéticos o semiconductores tipo quantum
dots (QDs) [5].
1.2 Nanopartículas dopadas
En los últimos años se han desarrollado numerosos métodos
analíticos en los que se utilizan marcadores formados por SiO2NPs
dopadas con fluróroforos orgánicos, QDs, partículas magnéticas o
partículas activas a la radiación Raman, aprovechando las ventajas que
proporciona el uso de estos materiales encapsulados en la matriz de la
sílice, mencionadas anteriormente. A continuación se describen algunos
ejemplos:
1.2.1 Nanopartículas dopadas con fluoróforos orgánicos
Las moléculas marcadas con fluoróforos han sido ampliamente
utilizadas en bioanálisis. Los fluoróforos convencionales, tales como el
isotiocianato de fluoresceína, rodaminas o cianinas, presentan ciertas
desventajas como son su elevada inestabilidad, sensibilidad a procesos de
fotodescomposición y estrecho desplazamiento Stokes. Además,
Introducción
‐ 13 ‐
normalmente, sólo un número limitado de fluoróforos puede unirse a las
biomoléculas debido a problemas de impedimento estérico y a enlaces
inespecíficos con potenciales interferentes.
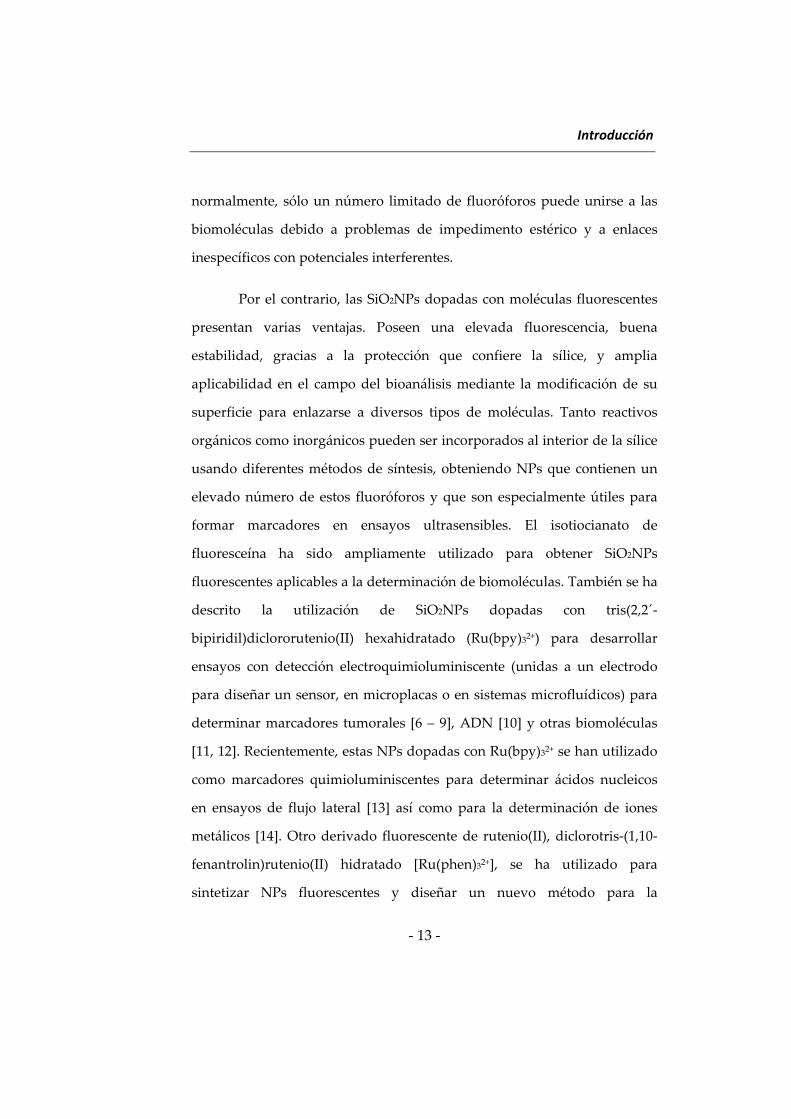
Por el contrario, las SiO2NPs dopadas con moléculas fluorescentes
presentan varias ventajas. Poseen una elevada fluorescencia, buena
estabilidad, gracias a la protección que confiere la sílice, y amplia
aplicabilidad en el campo del bioanálisis mediante la modificación de su
superficie para enlazarse a diversos tipos de moléculas. Tanto reactivos
orgánicos como inorgánicos pueden ser incorporados al interior de la sílice
usando diferentes métodos de síntesis, obteniendo NPs que contienen un
elevado número de estos fluoróforos y que son especialmente útiles para
formar marcadores en ensayos ultrasensibles. El isotiocianato de
fluoresceína ha sido ampliamente utilizado para obtener SiO2NPs
fluorescentes aplicables a la determinación de biomoléculas. También se ha
descrito la utilización de SiO2NPs dopadas con tris(2,2´‐
bipiridil)diclororutenio(II) hexahidratado (Ru(bpy)32+) para desarrollar
ensayos con detección electroquimioluminiscente (unidas a un electrodo
para diseñar un sensor, en microplacas o en sistemas microfluídicos) para
determinar marcadores tumorales [6 – 9], ADN [10] y otras biomoléculas
[11, 12]. Recientemente, estas NPs dopadas con Ru(bpy)32+ se han utilizado
como marcadores quimioluminiscentes para determinar ácidos nucleicos
en ensayos de flujo lateral [13] así como para la determinación de iones
metálicos [14]. Otro derivado fluorescente de rutenio(II), diclorotris‐(1,10‐
fenantrolin)rutenio(II) hidratado [Ru(phen)32+], se ha utilizado para
sintetizar NPs fluorescentes y diseñar un nuevo método para la
Introducción
‐ 14 ‐
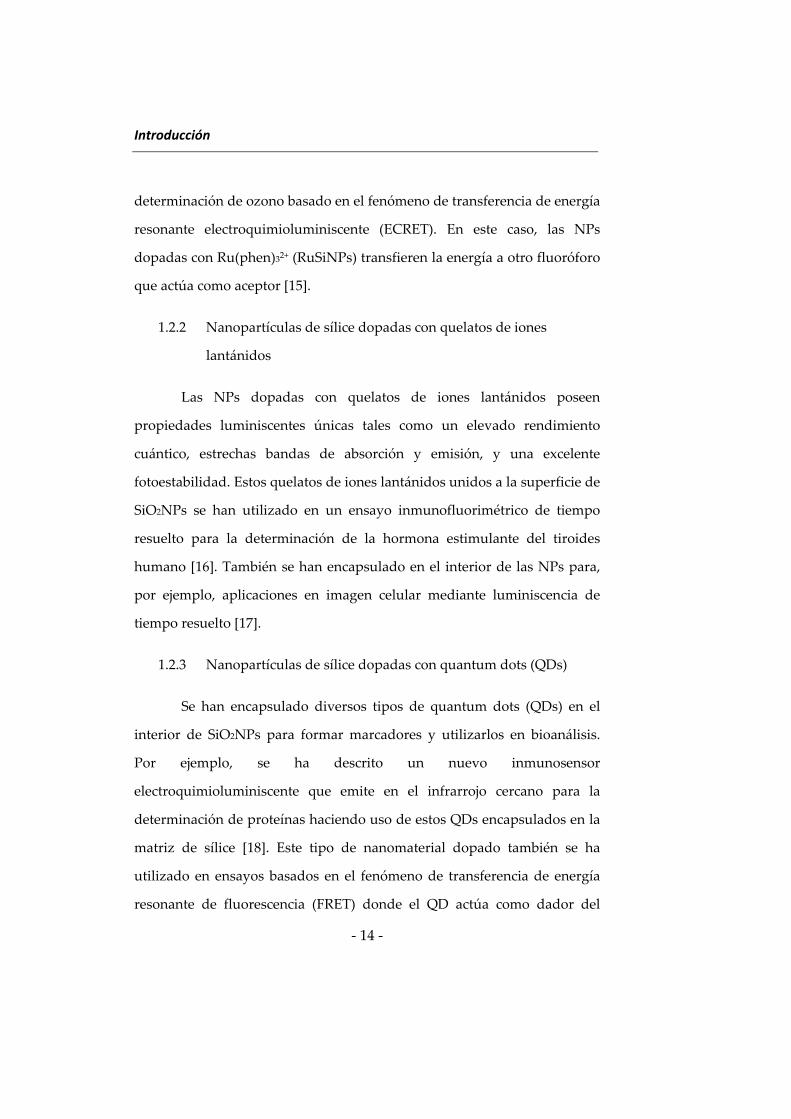
determinación de ozono basado en el fenómeno de transferencia de energía
resonante electroquimioluminiscente (ECRET). En este caso, las NPs
dopadas con Ru(phen)32+ (RuSiNPs) transfieren la energía a otro fluoróforo
que actúa como aceptor [15].
1.2.2 Nanopartículas de sílice dopadas con quelatos de iones
lantánidos
Las NPs dopadas con quelatos de iones lantánidos poseen
propiedades luminiscentes únicas tales como un elevado rendimiento
cuántico, estrechas bandas de absorción y emisión, y una excelente
fotoestabilidad. Estos quelatos de iones lantánidos unidos a la superficie de
SiO2NPs se han utilizado en un ensayo inmunofluorimétrico de tiempo
resuelto para la determinación de la hormona estimulante del tiroides
humano [16]. También se han encapsulado en el interior de las NPs para,
por ejemplo, aplicaciones en imagen celular mediante luminiscencia de
tiempo resuelto [17].
1.2.3 Nanopartículas de sílice dopadas con quantum dots (QDs)
Se han encapsulado diversos tipos de quantum dots (QDs) en el
interior de SiO2NPs para formar marcadores y utilizarlos en bioanálisis.
Por ejemplo, se ha descrito un nuevo inmunosensor
electroquimioluminiscente que emite en el infrarrojo cercano para la
determinación de proteínas haciendo uso de estos QDs encapsulados en la
matriz de sílice [18]. Este tipo de nanomaterial dopado también se ha
utilizado en ensayos basados en el fenómeno de transferencia de energía
resonante de fluorescencia (FRET) donde el QD actúa como dador del
Introducción
‐ 15 ‐
sistema para la determinación de iones mercurio [19] o de melamina [20].
Otra combinación de los QDs con las SiO2NPs ha sido la unión de estos
nanocristales a la superficie de la sílice mediante enlaces covalentes para
ser utilizados en la determinación de células y marcadores tumorales [21 –
23], anticuerpos y otras proteínas [24, 25], así como moléculas de menor
tamaño como el trinitrotolueno [26].
1.2.4 Nanopartículas de sílice activas a la radiación Raman
Las señales generadas mediante dispersión Raman contienen una
elevada información aunque suelen ser poco sensibles. Esta limitación
puede evitarse en parte inmovilizando la molécula de interés sobre una
superficie metálica (especialmente sobre metales nobles tales como plata u
oro). Esta primera etapa da lugar a un incremento en la intensidad de señal
de varios órdenes de magnitud. Para conseguir metodologías Raman más
robustas, estos metales pueden ser combinados con SiO2NPs. Por ejemplo,
se ha desarrollado un método simple para preparar marcadores Raman con
nanopartículas de plata (AgNPs), enlazadas a ácido 4‐mercaptobenzoico y
encapsuladas en el interior de SiO2NPs [27]. Para la síntesis se ha utilizado
tanto el método de microemulsión de micelas inversas [28] como el método
Stöber [29]. También se ha descrito un método para sintetizar
nanopartículas híbridas de plata y sílice utilizando un polímero orgánico,
como el etilenglicol, el cual actúa como soporte entre las AgNPs y la
superficie de sílice para, combinarlas posteriormente con óxido de grafeno.
Utilizando este procedimiento se ha descrito un nuevo biosensor para la
determinación de glucosa en muestras de orina y suero [30].
Introducción
‐ 16 ‐
Las NPs de oro (AuNPs), al igual que las AgNPs, pueden
incorporarse en el interior de las SiO2NPs durante el proceso de síntesis o
bien unirse a la superficie. Por ejemplo, se han utilizado AuNPs@SiO2NPs
para diseñar un biosensor basado en la dispersión Raman superficial
donde las NPs actúan como marcador mediante su enlace a un aptámero
para la determinación de adenosina trifosfato [31] o a anticuerpos para
determinar la bacteria del cólera utilizando un inmunoensayo [32]. Otra
opción es la combinación de las AuNPs y las SiO2NPs con otros materiales
para conseguir una amplificación de la señal. Por ejemplo, utilizando
óxidos metálicos, como el ZrO2, se ha desarrollado un inmunosensor para
la determinación del virus de la hepatitis C [33] y, utilizando óxido de
grafeno reducido y AuNPs retenidas en una matriz de SiO2/quitosán, se ha
descrito un biosensor electroquímico para la determinación de dopamina y
ácido úrico [34]. También se han combinado SiO2NPs dopadas con oro y
enzimas y se han utilizado para catalizar una reacción quimioluminiscente
para la determinación de residuos de estreptomicina [35]. Otra aplicación
descrita para estas NPs ha sido su combinación con nanotubos de carbono
(CNTs) y óxido de grafeno para el diseño de un inmunosensor
electróquimico para la determinación de gonadotropina coriónica humana
(hCG) [36], así como la utilización de AuNPs y acetilcolinesterasa en una
matriz sol‐gel y CNTs de pared múltiple (MWCNTs) para modificar un
electrodo de platino y aplicarlo a la determinación de acetilcolina [37].
1.2.5 Nanopartículas magnéticas
Las nanopartículas magnéticas (MNPs) tienen un gran atractivo en
el ámbito científico debido a su elevado potencial en diversos campos,
Introducción
‐ 17 ‐
como es el suministro y liberación controlados de fármacos, diagnóstico
por imagen en resonancia magnética (MRI), terapia tumoral mediante
hipertermia magnética, biomarcadores y bioseparación. Estas aplicaciones
normalmente requieren estabilidad química y fácil dispersión en medio
líquido, por lo que las SiO2NPs con núcleo magnético son una buena
opción debido a la estabilidad que presenta la sílice en medio acuoso, su
biocompatibilidad y fácil funcionalización que permite su unión a especies
biológicamente activas. En Química Analítica, las MNPs han sido
utilizadas con diferentes fines. Por ejemplo, las SiO2NPs dopadas con
materiales magnéticos se han usado como medio de separación en la
determinación simultánea de dos marcadores tumorales (α‐fetoproteína y
antígeno carcinoembriónico) mediante una reacción electroquimio‐
luminiscente [38]. En otra aplicación, se han combinado con AuNPs para la
determinación de trazas de proteína C reactiva mediante un
immunosensor piezoeléctrico utilizando un anticuerpo y peroxidasa de
rábano inmovilizados en las AuNPs [39].
1.3 Métodos para modificar la superficie de las nanopartículas de sílice
El uso de SiO2NPs en aplicaciones analíticas se ha extendido
gracias a la relativa facilidad para modificar su superficie. Existen
precursores de sílice que permiten introducir grupos funcionales como
aminas, carboxilos, y tioles, creando así puntos de unión a biomoléculas.
Por ejemplo, los oligonucleótidos pueden ser inmovilizados en la superficie
de las SiO2NPs usando la reacción de acoplamiento del disulfuro, donde
las SiO2NPs se funcionalizan con 3‐mercaptopropiltrimetoxisilano. Una
reacción de intercambio tiol‐disulfuro permite la conjugación de las
Introducción
‐ 18 ‐
SiO2NPs modificadas con grupos tioles con los oligonucleótidos
modificados con grupos disulfuro sin ningún tipo de reacción adicional.
Un protocolo comúnmente utilizado para la unión de enzimas y
anticuerpos es la unión vía glutaraldehido. Para ello, se funcionalizan las
NPs utilizando el 3‐aminopropiltrietoxisilano o el N‐[3‐(trimetoxisilil)‐
propil]dietilentriamino y los grupos amino de la superficie funcionalizada
se unen a los grupos amino de estas biomoléculas mediante
entrecruzamiento con glutaraldehido o disuccinidimidil glutarato. Por otro
lado, las SiO2NPs pueden modificarse también con carbonato sódico o con
grupos –OCN mediante reacción con bromuro de cianógeno en acetonitrilo
[3].
Como se ha indicado anteriormente, las SiO2NPs son un soporte
adecuado debido a su superficie químicamente inerte y su fácil
modificación con grupos funcionales. Cuando estas NPs son utilizadas
como medios de transporte deben presentar una buena dispersión y una
morfología superficial homogénea para conseguir una concentración de
especies similar entre las diferentes nanoesferas, requisito necesario para
conseguir buena sensibilidad, reproducibilidad y otras propiedades
analíticas deseables. Diferentes moléculas fluorescentes pueden ser
inmovilizadas en la superficie de las NPs. El fluoróforo Ru(bpy)32+ se ha
utilizado para el diseño de un sensor para la determinación de
inmunoglobulina G mediante la combinación de estas NPs con CNTs
proporcionando una señal quimioluminiscente [40]. En otros casos, la
superficie de las NPs se ha modificado con materiales electroactivos, como
Introducción
‐ 19 ‐
el ácido fosfónico, para la determinación de glucosa en muestras reales en
presencia de glucosa oxidasa, midiéndose la corriente eléctrica [41].
Las biomoléculas más utilizadas para inmovilizarlas en la
superficie de las SiO2NPs son las enzimas y los anticuerpos, debido a su
elevada selectividad, pero es imprescindible la generación de algún tipo de
señal que pueda medirse y relacionarse con la concentración de analito. Por
ejemplo, se han utilizado enzimas unidas a la superficie de SiO2NPs que
pueden catalizar reacciones quimioluminiscentes. Se ha descrito el uso de
SiO2NPs marcadas con anticuerpos anti‐staphylococcal enterotoxin B y
peroxidasa de rábano (HRP) para obtener una señal luminiscente en
presencia de peróxido de hidrógeno y luminol [42]. También se han
utilizado especies magnéticas como método de separación. Por ejemplo, en
una separación basada en una inmunoreacción tipo sándwich para
microcistina‐LR, se ha marcado uno de los anticuerpos con NPs
ferromagnéticas, mientras que el segundo anticuerpo se ha enlazado a
SiO2NPs sobre las que se ha inmovilizado previamente la HRP. En
presencia del analito, ambos conjugados quedan unidos y se separan del
resto de la matriz de la muestra utilizando un imán, debido a las
propiedades magnéticas de uno de los conjugados. A continuación, se
adiciona un precursor quimioluminiscente que actúa como sustrato de la
enzima y se registra la señal quimioluminiscente [43].
La confinación física de biomoléculas en la superficie de las
SiO2NPs, por ejemplo, mediante atrapamiento en una matriz porosa de este
material, puede ser una alternativa útil en ciertas técnicas biomédicas,
biotecnológicas y bioanalíticas. Utilizando las características de la matriz
Introducción
‐ 20 ‐
de sílice se ha desarrollado un sensor combinando MWCNTs y SiO2NPs
para la determinación de epinefrina [44]. Una tecnología similar se ha
usado para desarrollar varios tipos de biosensores para la determinación
indirecta de dibutilftalato utilizando materiales de reconocimiento
molecular y SiO2NPs, donde se lleva a cabo la polimerización [45], o para el
reconomiento de tert‐butilhidroquinona utilizando un sensor
electroquímico de impresión molecular [46].
1.4. Uso de nanopartículas de sílice en análisis de alimentos
En lo que respecta al análisis de alimentos haciendo uso de las
SiO2NPs, se han descrito diversas aplicaciones interesantes, aunque su uso
no está generalizado. Estos nanomateriales se han utilizado como nuevos
soportes sólidos en métodos de extracción y separación del analito de la
muestra, previos a la etapa de determinación. Una opción descrita en la
que se utilizan SiO2NPs para la separación ha consistido en su dopaje con
un núcleo magnético y su posterior funcionalización con un anticuerpo.
Utilizando estas NPs como medio de extracción, se ha determinado
Salmonella en muestras de zumo de limón y leche pasteurizada vía PCR
[47].
Como se ha descrito anteriormente, las SiO2NPs se han utilizado
para formar marcadores y desarrollar nuevas metodologías aplicables al
análisis de alimentos. Por ejemplo, se han aplicado a la determinación de
enterotoxina B en leche [42] y tert‐butilhidroquinona en aceites [46].
Los métodos de “screening” o tests de respuesta rápida
desempeñan una función destacable en análisis de alimentos,
Introducción
‐ 21 ‐
concretamente en el control de sustancias prohibidas, gracias a la
posibilidad de realizar dichos ensayos in situ sin necesidad de
instrumentación costosa y sofisticada. Las SiO2NPs se han utilizado en
estos métodos de “screening” dopándolas con algún fluoróforo y
funcionalizándolas con un anticuerpo. Estas NPs se han usado como
marcadores en el desarrollo de inmunocromatografías utilizando tiras
reactivas para la determinación rápida de enrofloxacina en muestras de
carne de pollo [48] o residuos de β‐agonistas en orina de cerdo [49].
En resumen, aunque la aplicación de las SiO2NPs al análisis de
alimentos ha sido relativamente limitada, sus especiales características
ofrecen nuevas posibilidades de utilidad en este área analítica.
2. Nanomateriales basados en lantánidos
Esta sección se centrará en la descripción de las principales
características y aplicaciones de los nanomateriales basados en lantánidos
utilizados en las investigaciones incluidas en esta Memoria, tales como los
“upconverting phosphors” y las nanopartículas de óxidos de lantánidos.
Aunque existen otros materiales utilizados con fines analíticos, tales como
las NPs de sílice dopadas con quelatos de iones lantánidos, su descripción
se realizó en el apartado anterior de esta Introducción por lo que no se
incluye en esta sección.
Introducción
‐ 22 ‐
2.1 “Upconverting phosphors”
Debido a que en el Capítulo IV de esta Memoria se describen las
investigaciones realizadas con un tipo especial de nanomateriales como
son los “upconverting phosphors”, se dedica una parte de esta
Introducción a la descripción de sus características y de algunas
aplicaciones analíticas.
El fenómeno de “upconversion” es un proceso en el cual se genera
una intensa emisión de energía a partir de una radiación menos energética.
Este incremento de energía se debe a la absorción de varios fotones,
normalmente dos o tres, por cada fotón emitido. La transición del estado
electrónico excitado superior al estado electrónico más bajo, o a otros
niveles menos energéticos, da lugar a una emisión luminiscente a
longitudes de onda más cortas que la longitud de onda de excitación. Este
proceso óptico no lineal, también conocido como fotoluminiscencia anti‐
Stokes, implica estados de energía intermedios, imprescindibles para llevar
a cabo el salto electrónico y la emisión de energía [50].
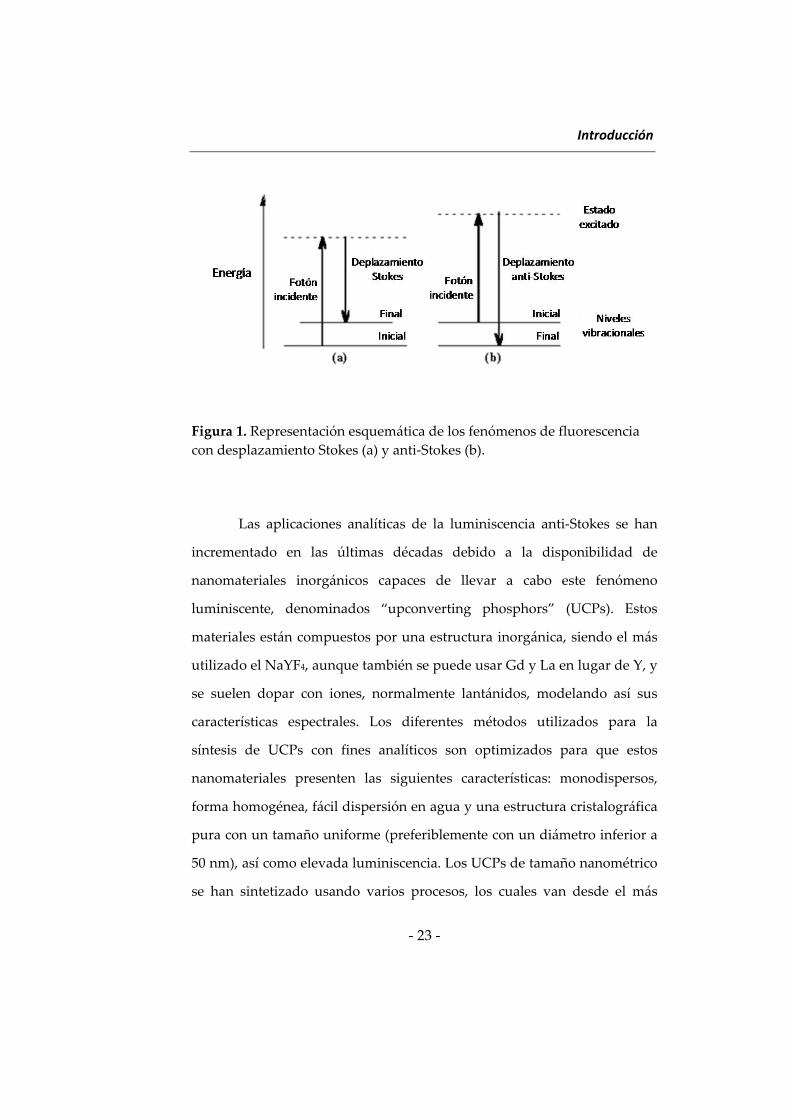
A diferencia de los fenómenos de fluorescencia basados en
desplazamiento Stokes, donde se lleva a cabo la excitación a longitudes de
onda más cortas y la emisión tiene lugar a una longitud de onda mayor, el
fenómeno de “upconversion” requiere una menor energía de excitación
que los fenómenos Stokes (Figura 1). Por lo tanto, este proceso permite
irradiar la muestra sin el riesgo de descomposición fotoquímica de la
misma. Además, se minimizan las interferencias espectrales procedentes
de dicha matriz, como se comentará posteriormente.
Introducción
‐ 23 ‐
Figura 1. Representación esquemática de los fenómenos de fluorescencia
con desplazamiento Stokes (a) y anti‐Stokes (b).
Las aplicaciones analíticas de la luminiscencia anti‐Stokes se han
incrementado en las últimas décadas debido a la disponibilidad de
nanomateriales inorgánicos capaces de llevar a cabo este fenómeno
luminiscente, denominados “upconverting phosphors” (UCPs). Estos
materiales están compuestos por una estructura inorgánica, siendo el más
utilizado el NaYF4, aunque también se puede usar Gd y La en lugar de Y, y
se suelen dopar con iones, normalmente lantánidos, modelando así sus
características espectrales. Los diferentes métodos utilizados para la
síntesis de UCPs con fines analíticos son optimizados para que estos
nanomateriales presenten las siguientes características: monodispersos,
forma homogénea, fácil dispersión en agua y una estructura cristalográfica
pura con un tamaño uniforme (preferiblemente con un diámetro inferior a
50 nm), así como elevada luminiscencia. Los UCPs de tamaño nanométrico
se han sintetizado usando varios procesos, los cuales van desde el más
Introducción
‐ 24 ‐
comúnmente utilizado proceso de co‐precipitación, descomposición
térmica y cristalización en disolvente orgánico por encima del punto de
ebullición hasta los métodos de síntesis hidro‐ y solvotermal [51].
Los iones dopantes desempeñan una función crucial en lo que
respecta a la absorción y emisión de fotones. Estos iones determinan, por
ejemplo, la longitud de onda de la radiación emitida. Algunos lantánidos
trivalentes poseen estados electrónicos intermedios metaestables muy
útiles para la generación de la emisión anti‐Stokes. Las propiedades
fotoluminiscentes vienen definidas por sus electrones 4f, los cuales están
bien protegidos por los electrones de menor energía 5s y 5p, localizados en
orbitales más externos [52]. Los saltos energéticos de los niveles
electrónicos de los iones Er(III), Tm(III) y Ho(III), son muy apropiados para
utilizarlos como iones dopantes en materiales cuya finalidad es la
producción del fenómeno anti‐Stokes, mientras que los iones Pr(III),
Nd(III) y Dy(III), presentan niveles energéticos menos adecuados.
Con el fin de aumentar la eficiencia del proceso de emisión de
fluorescencia con desplazamiento anti‐Stokes, estos UCPs son
normalmente co‐dopados con el ion Yb(III), el cual presenta una elevada
capacidad de absorción [53]. Además, los iones Yb(III) son menos
susceptibles que otros lantánidos al fenómeno de inhibición por
concentración, es decir, a la pérdida de fluorescencia cuando se utilizan
concentraciones elevadas. Por lo tanto, se pueden usar elevadas
concentraciones de Yb(III) para aumentar la probabilidad de excitación de
los iones dopantes [54]. Además, los niveles electrónicos del Yb(III) y de
los iones dopantes Er(III), Ho(III) y Tm(III) responsables de la transferencia
Introducción
‐ 25 ‐
electrónica y del fenómeno de fluorescencia, son energéticamente muy
similares, lo que facilita el salto de los electrones de unos iones a otros,
obteniéndose así emisiones fotoluminiscentes anti‐Stokes muy intensas.
Los UCPs son cristales inorgánicos hidrofóbicos que,
originalmente, no disponen de grupos funcionales. Por lo tanto, la
modificación de su superficie es un aspecto fundamental para transformar
estas partículas en un material más hidrofílico y con grupos funcionales en
su superficie para utilizarlos con fines analíticos. Con este fin, estos se
recubren con sílice y, posteriormente, se funcionalizan mediante los
métodos descritos anteriormente [4, 5].
Los UCPs están emergiendo en el campo de la Química Analítica
como una alternativa a los biomarcadores fluorescentes tradicionales, los
cuales se basan en la emisión de fluorescencia con desplazamiento Stokes.
Su uso para preparar marcadores presenta una serie de ventajas. Muestran
un alto rendimiento cuántico, estrechas bandas de emisión, gran
desplazamiento anti‐Stokes, baja toxicidad y buena estabilidad
fotoquímica. Además, la excitación de los UCPs se lleva a cabo a una
longitud de onda situada en el infrarrojo cercano, por lo que la relación
señal‐ruido es mayor que a longitudes de onda más bajas, mejorando así la
sensibilidad gracias a la disminución del fenómeno de autofluorescencia.
Las excelentes características de los UCPs los hacen muy útiles para su uso
en bioanálisis gracias a la disminución de la señal de fondo, obteniéndose
límites de detección más bajos.
Introducción
‐ 26 ‐
La combinación de los UCPs con biomoléculas selectivas, como son
las implicadas en las interacciones antígeno‐anticuerpo o biotina‐
estreptavidina, constituyen una excelente alternativa para su uso en
aplicaciones bioanalíticas. Tanto la biomolécula como el UCP, deben
presentar grupos funcionales adecuados para poder unirse mediante
enlaces covalentes. La adsorción física de las biomoléculas sobre la
superficie de los UCPs ha sido estudiada aunque la inestabilidad que
presentan las hace inapropiadas para los bioensayos [55].
Se han desarrollado varias aplicaciones bioanalíticas utilizando los
UCPs como marcadores en ensayos homogéneos [56 ‐ 59] y heterogéneos
[60 ‐ 62], en ensayos de flujo lateral [63 ‐ 66] y como sensores [67, 68]
basándose algunas de estas aplicaciones, especialmente los ensayos
homogéneos, en sistemas basados en transferencia de energía resonante
luminiscente (LRET). En el capítulo IV correspondiente a las
investigaciones realizadas con el uso de “upconverting phosphors” se
abordará con más profundidad la utilidad de estos nanocristales en el
desarrollo de sistemas LRET.
2.2. Nanopartículas de óxidos lantánidos
Las nanopartículas de óxidos lantánidos, y más específicamente las
nanopartículas de óxido de terbio y de europio, a pesar de haberse
utilizado en numerosas aplicaciones industriales, tales como en el
desarrollo de dispositivos de iluminación en estado sólido, han presentado
hasta la fecha escasas aplicaciones analíticas. Se ha descrito recientemente
el uso de las nanopartículas de Eu2O3 para la determinación del antibiótico
Introducción
‐ 27 ‐
tetraciclina en muestras de orina animal y miel [69]. El método está basado
en la interacción directa de dicho antibiótico con las Eu2O3NPs, para
producir una intensa luminiscencia sensibilizada. Esta emisión
luminiscente presenta características similares a la luminiscencia observada
con quelatos de iones europio, tales como estrechas bandas de emisión, un
amplio desplazamiento Stokes y una larga duración de la luminiscencia
[70]. Esta última característica posibilita la realización de medidas en el
modo de tiempo resuelto, que permite eliminar la interferencia de señales
fluorescentes de más corta duración. Las nanopartículas de Eu2O3 se han
utilizado también para el desarrollo de inmunoensayos en fase sólida [71,
72]. Estas NPs no tienen grupos funcionales en su superficie, por lo que
ésta ha de modificarse para poder ser utilizadas como marcador, lo que
puede conducir a la inhibición de su luminiscencia por la acción de los
reactivos requeridos para la activación y conjugación. Para evitar esto, se
recurre a su encapsulamiento en matrices de sílice o alúmina, como se ha
descrito para un inmunoensayo para la determinación de atrazina, en el
que las Eu2O3 NPs se han recubierto de sílice para formar el marcador [72].
La luminiscencia sensibilizada de las nanopartículas de óxido de
terbio(III,IV), también denominado terbia (Tb4O7), por salicilato y lasalocid
se ha estudiado de forma sistemática, desarrollándose finalmente un
método para la determinación de lasalocid en muestras de agua, de pienso
y de huevos [73]. La selectividad del método propuesto ha permitido la
determinación de dicho antibiótico con un tratamiento sencillo de las
muestras. En las investigaciones incluidas en esta Memoria no se abordará
el uso de la luminiscencia sensibilizada de estas nanopartículas, sino que se
Introducción
‐ 28 ‐
describirá una nueva propiedad como activador de la enzima laccasa para
la determinación de polifenoles en vinos.
3. Fluoróforos de larga longitud de onda
El uso de fluoróforos de larga longitud de onda (LWFs) en Química
Analítica es una alternativa útil para mejorar la selectividad espectral de
las medidas fluorescentes frente a los fluoróforos tradicionales. La emisión
de fluorescencia a larga longitud de onda tiene lugar en una zona del
espectro electromagnético (>600 nm) donde prácticamente no se produce la
absorción o emisión de posibles interferentes presentes en la matriz de la
muestra. Además, debido a la baja energía utilizada para excitar el
fluoróforo, el riesgo de degradación de la muestra es bajo mientras que las
interferencias que originan señales Raman también se reducen
considerablemente [74]. Por otro lado, la posibilidad de sufrir fenómenos
de inhibición es muy reducida ya que los LWFs muestran un tiempo de
vida corto. La utilidad de este tipo de fluoróforos se ha demostrado
ampliamente, especialmente en análisis biológico, donde la señal
procedente de la matriz de la muestra puede ser una fuente de
interferencias muy importante.
La versatilidad de estos compuestos se ha puesto de manifiesto en
el desarrollo de nuevos sustratos enzimáticos, actuando como marcadores
en inmunoensayos, en secuenciación de ácidos nucleicos y como reactivos
derivatizantes en electroforesis capilar (CE) y cromatografía de líquidos
(LC). Además, estos fluoróforos se han utilizado para el desarrollo de
Introducción
‐ 29 ‐
metodologías basadas en sistemas FRET y de nuevos sensores, así como en
metodologías cinéticas [75].
3.1 Tipos y propiedades de los fluoróforos de larga longitud de onda
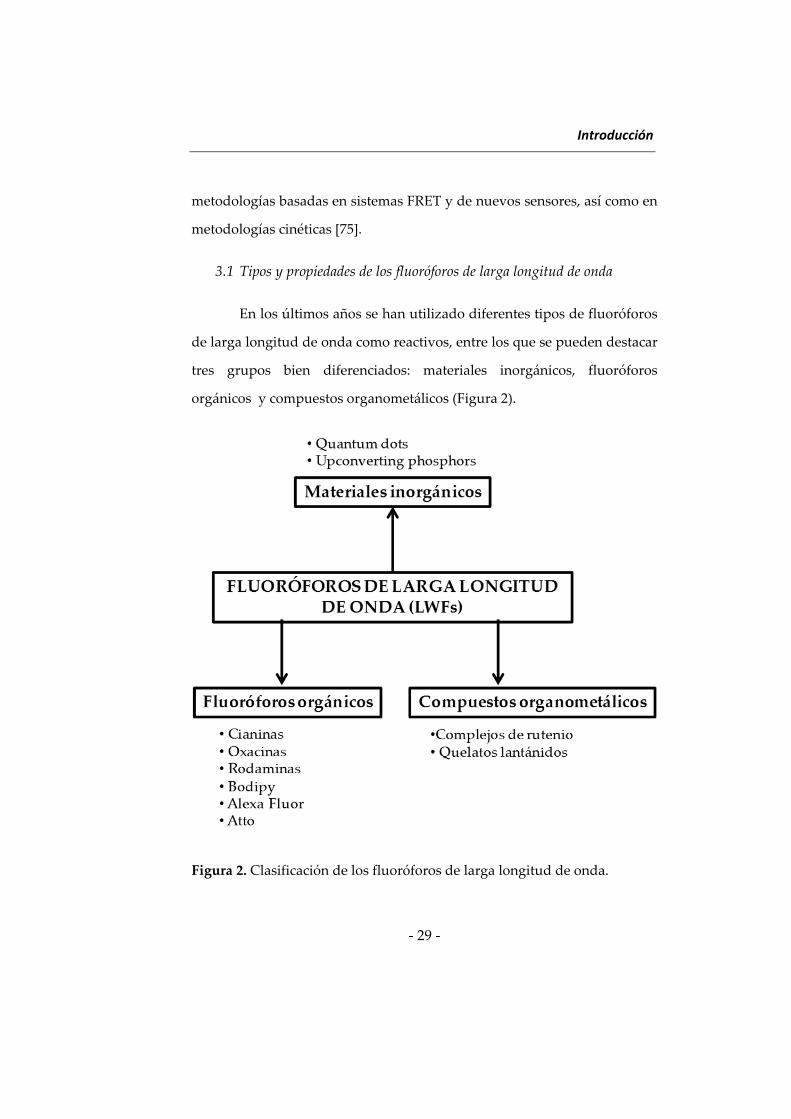
En los últimos años se han utilizado diferentes tipos de fluoróforos
de larga longitud de onda como reactivos, entre los que se pueden destacar
tres grupos bien diferenciados: materiales inorgánicos, fluoróforos
orgánicos y compuestos organometálicos (Figura 2).
Figura 2. Clasificación de los fluoróforos de larga longitud de onda.
Introducción
‐ 30 ‐
Dentro de los materiales inorgánicos, se pueden destacar dos tipos,
los quantum dots (QDs) [76] y los upconverting phosphors (UCPs) [77],
estos últimos descritos en el apartado anterior. Los QDs suelen estar
formados por una estructura sintetizada a partir de materiales
semiconductores como CdSe, CdTe, PbS, o materiales similares, y cuya
composición y tamaño inciden en las longitudes de onda máximas de
excitación y emisión que presentan estos materiales.
Aunque el número de fluoróforos orgánicos de larga longitud de
onda es menor que el de los fluoróforos convencionales, se ha sintetizado
una gran variedad de compuestos de este tipo en los últimos años, los
cuales se han utilizado en muchos casos en el diseño de láseres de
colorantes. Un LWF debe presentar una estructura rígida con enlaces
conjugados o anillos aromáticos condensados. Este sistema de conjugación
puede favorecer la inestabilidad del reactivo así como procesos de foto‐
descomposición cuando es excitado. También pueden mostrar otros
inconvenientes tales como estrechos desplazamientos Stokes, baja
solubilidad, y procesos de foto‐oxidación. Sin embargo, las ventajas
anteriormente indicadas justifican su aplicación en Química Analítica [78,
79], describiéndose a continuación algunas características de los LWFs más
utilizados.
Los fluoróforos de la familia de las cianinas constituyen uno de los
principales grupos de LWFs. Su estructura presenta dos anillos aromáticos
y heterocíclicos unidos mediante una cadena de polimetina con dobles
enlaces carbono‐carbono conjugados (Figura 3). Estos fluoróforos tienen
máximos de excitación en el intervalo 600‐900 nm, obteniéndose amplios
Introducción
‐ 31 ‐
desplazamientos espectrales batocrómicos con la adición de grupos vinilo a
la cadena de polimetina. Las cianinas presentan algunas limitaciones: no
tienen grupos reactivos para unirlos a los analitos, su vida media en el
estado excitado es muy corta, bajo rendimiento cuántico y tienden a
agregarse en disolución, lo que origina un rápido descenso de la intensidad
de fluorescencia [80]. Sin embargo, la fotofísica de estos compuestos puede
mejorarse añadiendo macromoléculas o disolventes orgánicos al medio. La
adición de grupos sulfonato a la estructura del fluoróforo puede mejorar su
solubilidad en agua, el rendimiento cuántico y su estabilidad fotoquímica.
Además, la adición de grupos funcionales, como el isotiocianato, permite
su uso como marcador ya que puede unirse a otras moléculas. Los
derivados indolio de estos colorantes muestran una buena estabilidad
fotoquímica, la cual puede incluso mejorarse incluyendo una estructura
anular a la cadena de polimetina [81].
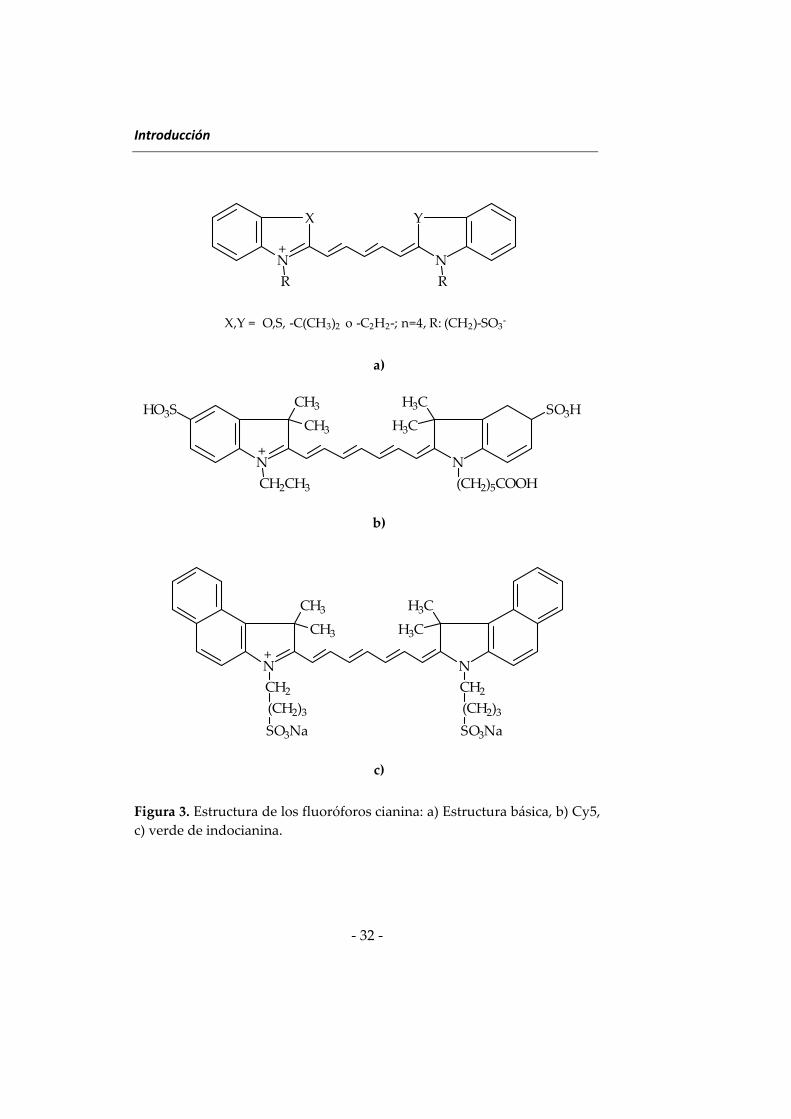
Dos fluoróforos cianina ampliamente utilizados con fines analíticos
son Cy5 y verde de indocianina (ICG), denominado también IR125 (Figura
3). Se han descrito numerosas aplicaciones analíticas para Cy5,
principalmente en CE [82] y sensores [83]. El ICG es un fluoróforo cargado
negativamente, soluble en agua, que se utilizó inicialmente para técnicas de
diagnóstico médico ya que no es tóxico para el organismo humano [84].
Aunque el ICG por sí solo presenta una baja intensidad de fluorescencia en
disolución acuosa, ésta aumenta después de su unión a algunos
compuestos, tales como proteínas [85].
Introducción
‐ 32 ‐
a)
b)
c)
Figura 3. Estructura de los fluoróforos cianina: a) Estructura básica, b) Cy5,
c) verde de indocianina.
+
X
N
R
Y
N
R
X,Y = O,S, ‐C(CH3)2 o ‐C2H2‐; n=4, R: (CH2)‐SO3‐
+N
CH2CH3
CH3
CH3
HO3S
N
(CH2)5COOH
H3C
H3CSO3H
N
CH2
(CH2)3
SO3Na
CH3
CH3
+N
CH2
(CH2)3
SO3Na
H3C
H3C
Introducción
‐ 33 ‐
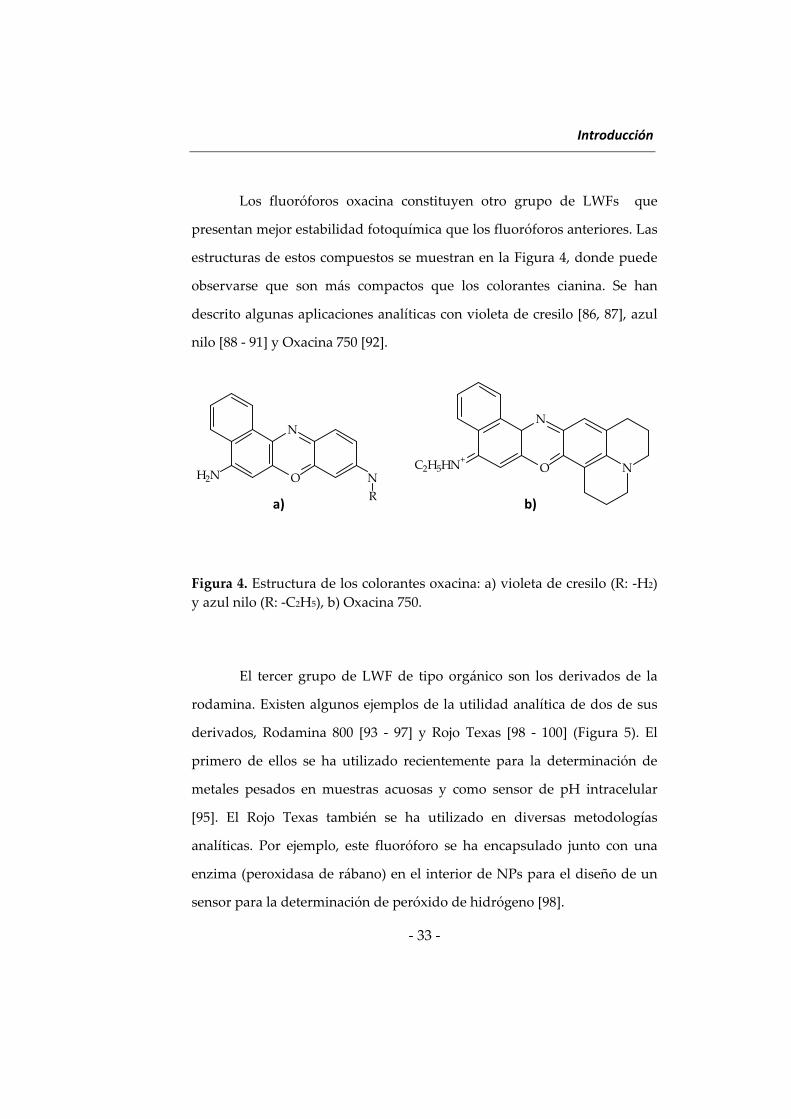
Los fluoróforos oxacina constituyen otro grupo de LWFs que
presentan mejor estabilidad fotoquímica que los fluoróforos anteriores. Las
estructuras de estos compuestos se muestran en la Figura 4, donde puede
observarse que son más compactos que los colorantes cianina. Se han
descrito algunas aplicaciones analíticas con violeta de cresilo [86, 87], azul
nilo [88 ‐ 91] y Oxacina 750 [92].
Figura 4. Estructura de los colorantes oxacina: a) violeta de cresilo (R: ‐H2)
y azul nilo (R: ‐C2H5), b) Oxacina 750.
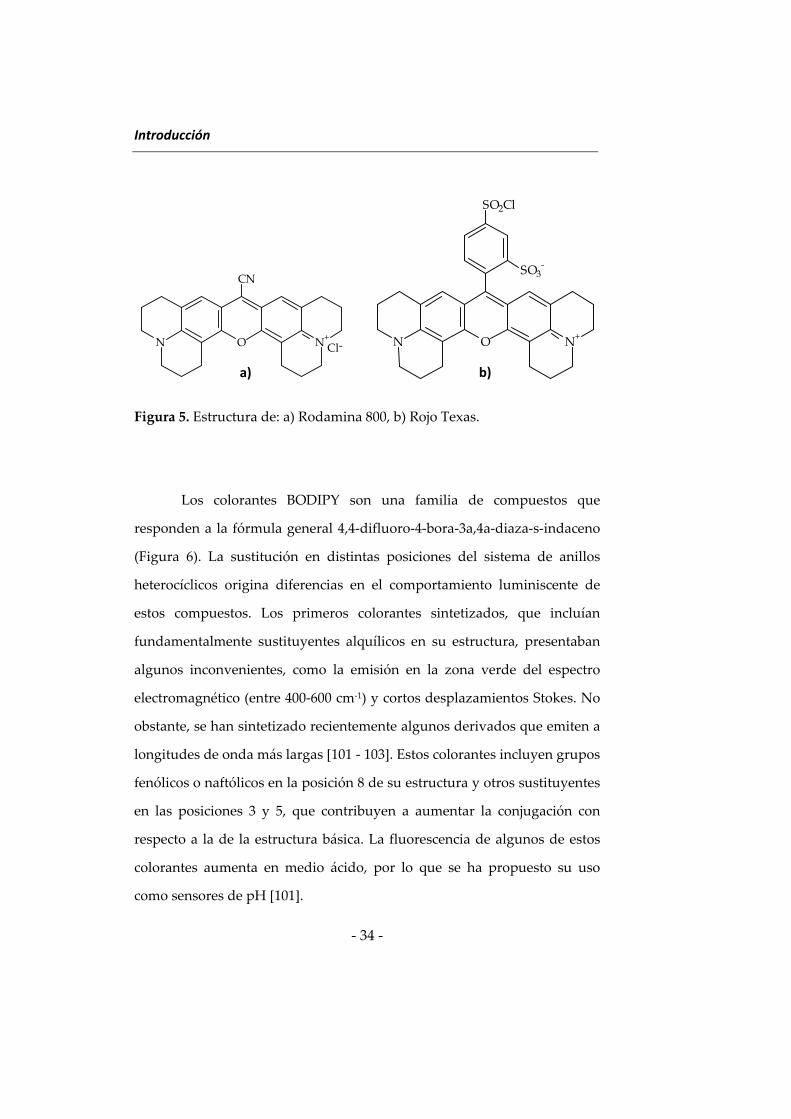
El tercer grupo de LWF de tipo orgánico son los derivados de la
rodamina. Existen algunos ejemplos de la utilidad analítica de dos de sus
derivados, Rodamina 800 [93 ‐ 97] y Rojo Texas [98 ‐ 100] (Figura 5). El
primero de ellos se ha utilizado recientemente para la determinación de
metales pesados en muestras acuosas y como sensor de pH intracelular
[95]. El Rojo Texas también se ha utilizado en diversas metodologías
analíticas. Por ejemplo, este fluoróforo se ha encapsulado junto con una
enzima (peroxidasa de rábano) en el interior de NPs para el diseño de un
sensor para la determinación de peróxido de hidrógeno [98].
O
N
H2N N
R
O
N
C2H5HN+
N
a) b)
Introducción
‐ 34 ‐
Figura 5. Estructura de: a) Rodamina 800, b) Rojo Texas.
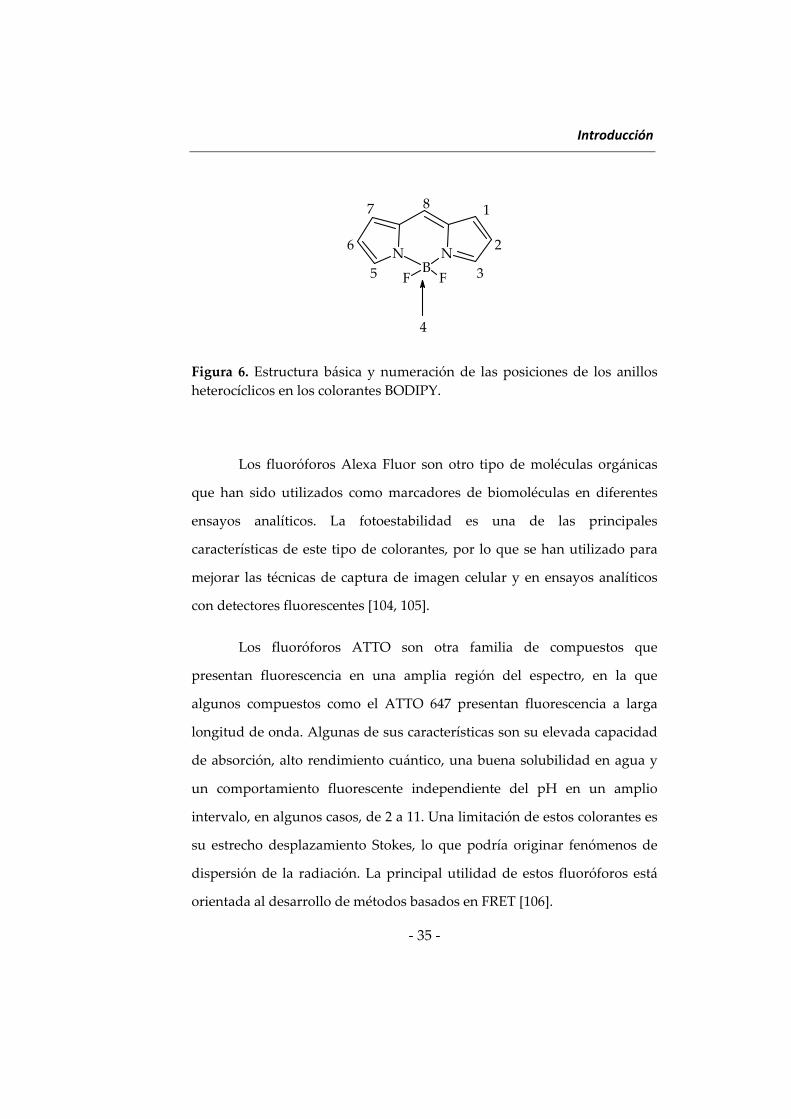
Los colorantes BODIPY son una familia de compuestos que
responden a la fórmula general 4,4‐difluoro‐4‐bora‐3a,4a‐diaza‐s‐indaceno
(Figura 6). La sustitución en distintas posiciones del sistema de anillos
heterocíclicos origina diferencias en el comportamiento luminiscente de
estos compuestos. Los primeros colorantes sintetizados, que incluían
fundamentalmente sustituyentes alquílicos en su estructura, presentaban
algunos inconvenientes, como la emisión en la zona verde del espectro
electromagnético (entre 400‐600 cm‐1) y cortos desplazamientos Stokes. No
obstante, se han sintetizado recientemente algunos derivados que emiten a
longitudes de onda más largas [101 ‐ 103]. Estos colorantes incluyen grupos
fenólicos o naftólicos en la posición 8 de su estructura y otros sustituyentes
en las posiciones 3 y 5, que contribuyen a aumentar la conjugación con
respecto a la de la estructura básica. La fluorescencia de algunos de estos
colorantes aumenta en medio ácido, por lo que se ha propuesto su uso
como sensores de pH [101].
N O N+
CN
Cl‐ N O N+
SO2Cl
SO3‐
a) b)
Introducción
‐ 35 ‐
Figura 6. Estructura básica y numeración de las posiciones de los anillos
heterocíclicos en los colorantes BODIPY.
Los fluoróforos Alexa Fluor son otro tipo de moléculas orgánicas
que han sido utilizados como marcadores de biomoléculas en diferentes
ensayos analíticos. La fotoestabilidad es una de las principales
características de este tipo de colorantes, por lo que se han utilizado para
mejorar las técnicas de captura de imagen celular y en ensayos analíticos
con detectores fluorescentes [104, 105].
Los fluoróforos ATTO son otra familia de compuestos que
presentan fluorescencia en una amplia región del espectro, en la que
algunos compuestos como el ATTO 647 presentan fluorescencia a larga
longitud de onda. Algunas de sus características son su elevada capacidad
de absorción, alto rendimiento cuántico, una buena solubilidad en agua y
un comportamiento fluorescente independiente del pH en un amplio
intervalo, en algunos casos, de 2 a 11. Una limitación de estos colorantes es
su estrecho desplazamiento Stokes, lo que podría originar fenómenos de
dispersión de la radiación. La principal utilidad de estos fluoróforos está
orientada al desarrollo de métodos basados en FRET [106].
NB
N
F F
1
2
3
4
5
6
7 8
Introducción
‐ 36 ‐
Por último, cabe destacar otro grupo de LWFs muy utilizados en
Química Analítica, como son los complejos de rutenio, los cuales muestran
una luminiscencia con un tiempo de vida similar a los fluoróforos
orgánicos. La principal ventaja que presentan es la posibilidad de usar
diferentes ligandos que permiten modificar las propiedades químicas y
espectroscópicas de estos complejos, mostrando máximos de emisión entre
610 y 650 nm. El uso analítico de estos compuestos se ha orientado
principalmente para el desarrollo de nuevos sensores [107 ‐ 109].
En los últimos años, los LWFs han sido bastante utilizados en
análisis de alimentos con matrices complejas debido, principalmente, a la
selectividad espectral que presentan. Por ejemplo, se han empleado como
reactivos derivatizantes para la determinación de moléculas endógenas de
los alimentos, como son los flavonoides, mediante cromatografía [110], o
bien para la determinación de proteínas de soja en bebidas mediante
inmunoextracción [111]. También se ha descrito el uso combinado de
AuNPs, la enzima laccasa y verde de indocianina para la determinación de
compuestos polifenólicos en muestras de zumo y té mediante la técnica de
mezcla de flujo detenido [112].
Además de los fluoróforos de larga longitud de onda indicados, se
han descrito nuevos polímeros capaces de emitir en la zona del infrarrojo
cercano, característica que ha sido fundamental para el desarrollo de
nuevos sensores, como es el caso de un sensor para la determinación de
Cu(II) y cuya aplicabilidad se ha demostrado mediante el análisis de té
[113]. También se han propuesto nanomateriales que emiten a longitudes
de onda relativamente largas para utilizarlos en análisis de alimentos. Por
Introducción
‐ 37 ‐
ejemplo, los QDs descritos anteriormente se han utilizado para la
determinación de vitamina B1 en suplementos alimenticios [114].
4. Técnicas de inmunoensayo y su uso en análisis de alimentos
Los inmunoensayos son técnicas analíticas basadas en la elevada
selectividad que presentan las reacciones antígeno‐anticuerpo, siendo
ampliamente utilizados en análisis clínico, ambiental y agroalimentario.
Desde un punto de vista general, los inmunoensayos pueden dividirse en
dos grandes grupos, directos e indirectos o con reactivos marcados.
Los inmunoensayos directos se basan en la medida de una
propiedad físico‐química del medio que se modifica al reaccionar el analito
con el inmunoreactivo. Dentro de los inmunoensayos directos, los más
utilizados han sido la inmunoturbidimetría y la inmunonefelometría [115,
116], basadas en la medida de la dispersión de la radiación al formarse el
inmunocomplejo. Estas técnicas se utilizan para la determinación de
macromoléculas, principalmente proteínas. Su principal limitación es la
posible señal de fondo debida a la capacidad dispersante de componentes
de la muestra, como pueden ser lipoproteínas y agregados de proteínas,
dando lugar a límites de detección relativamente altos.
Los inmunoensayos indirectos ofrecen mayor versatilidad que los
anteriores y se basan en el uso de un reactivo adicional, denominado
marcador o trazador. Este reactivo es un antígeno o un anticuerpo, según el
tipo de inmunoensayo, unido a una sustancia, denominada “label” (L) en
la terminología inglesa, que presenta una propiedad como radioactividad,
Introducción
‐ 38 ‐
fluorescencia o actividad enzimática, entre otras, cuya medida se relaciona
con la concentración del analito. Estos inmunoensayos se clasifican en dos
grandes grupos en función del formato que utilicen, homogéneos y
heterogéneos [117].
En el inmunoensayo homogéneo, la unión del antígeno y el
anticuerpo da lugar a un cambio en la propiedad del marcador que se
relaciona con la concentración de analito. En este caso no es necesario
eliminar la matriz de la muestra para realizar la medida, por lo que el
ensayo es muy rápido, pero la presencia de la señal de la matriz de la
muestra da lugar a límites de detección mayores que el inmunoensayo
heterogéneo.
En el inmunoensayo heterogéneo el marcador no modifica su
propiedad al intervenir en la inmunoreacción, por lo que es necesario
inmovilizar algún reactante en un soporte sólido para conseguir la
separación de las fracciones enlazada y libre del marcador. Este
inmunoensayo es más versátil que el homogéneo, obteniéndose además,
como se ha indicado, mejores límites de detección. Sin embargo, se
requiere un mayor número de etapas por lo que los ensayos son más
lentos. A continuación se describen sucintamente algunos de los distintos
tipos incluidos en cada formato.
4.1 Inmunoensayo homogéneo
Normalmente es competitivo, es decir, se considera que el
anticuerpo no distingue entre el analito y el marcador y ambos compiten
Introducción
‐ 39 ‐
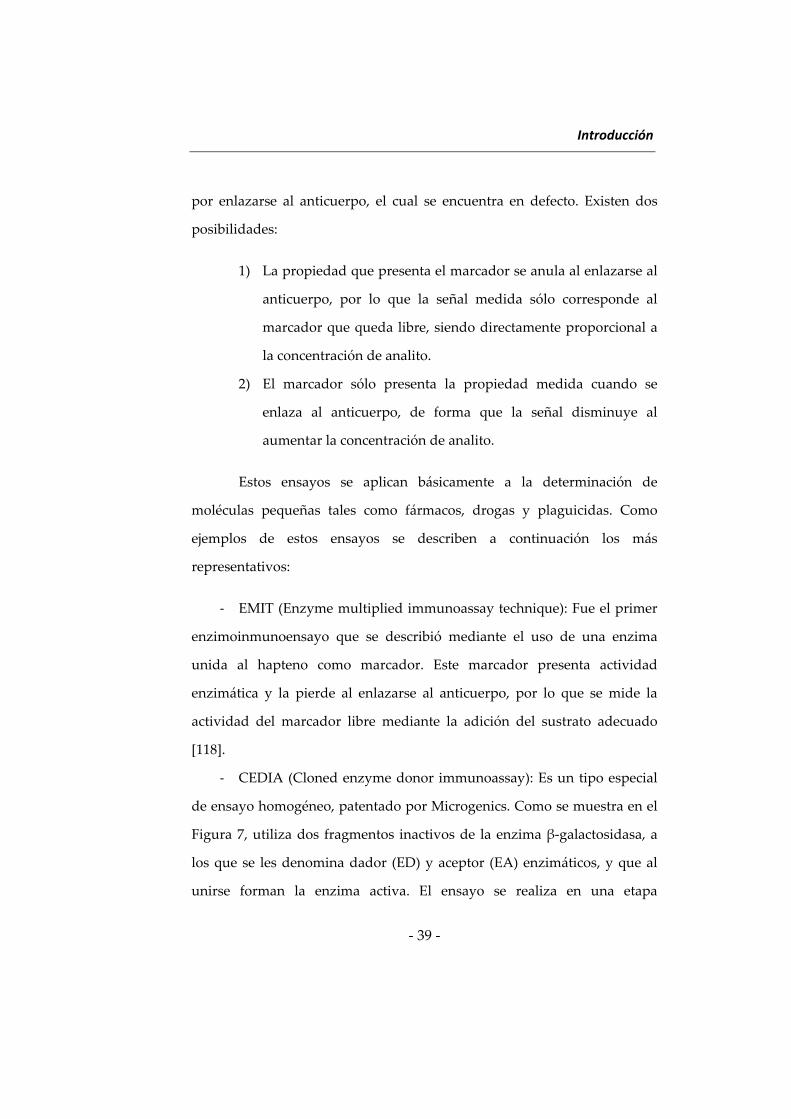
por enlazarse al anticuerpo, el cual se encuentra en defecto. Existen dos
posibilidades:
1) La propiedad que presenta el marcador se anula al enlazarse al
anticuerpo, por lo que la señal medida sólo corresponde al
marcador que queda libre, siendo directamente proporcional a
la concentración de analito.
2) El marcador sólo presenta la propiedad medida cuando se
enlaza al anticuerpo, de forma que la señal disminuye al
aumentar la concentración de analito.
Estos ensayos se aplican básicamente a la determinación de
moléculas pequeñas tales como fármacos, drogas y plaguicidas. Como
ejemplos de estos ensayos se describen a continuación los más
representativos:
‐ EMIT (Enzyme multiplied immunoassay technique): Fue el primer
enzimoinmunoensayo que se describió mediante el uso de una enzima
unida al hapteno como marcador. Este marcador presenta actividad
enzimática y la pierde al enlazarse al anticuerpo, por lo que se mide la
actividad del marcador libre mediante la adición del sustrato adecuado
[118].
‐ CEDIA (Cloned enzyme donor immunoassay): Es un tipo especial
de ensayo homogéneo, patentado por Microgenics. Como se muestra en el
Figura 7, utiliza dos fragmentos inactivos de la enzima β‐galactosidasa, a
los que se les denomina dador (ED) y aceptor (EA) enzimáticos, y que al
unirse forman la enzima activa. El ensayo se realiza en una etapa
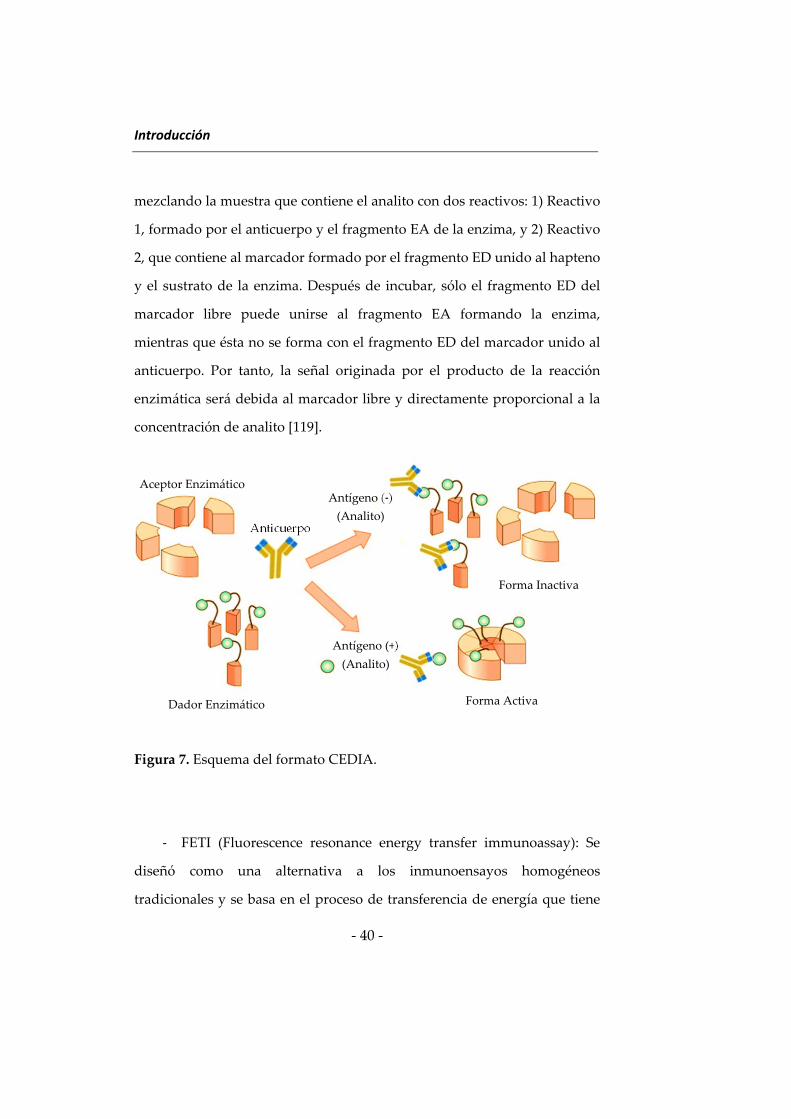
Introducción
‐ 40 ‐
mezclando la muestra que contiene el analito con dos reactivos: 1) Reactivo
1, formado por el anticuerpo y el fragmento EA de la enzima, y 2) Reactivo
2, que contiene al marcador formado por el fragmento ED unido al hapteno
y el sustrato de la enzima. Después de incubar, sólo el fragmento ED del
marcador libre puede unirse al fragmento EA formando la enzima,
mientras que ésta no se forma con el fragmento ED del marcador unido al
anticuerpo. Por tanto, la señal originada por el producto de la reacción
enzimática será debida al marcador libre y directamente proporcional a la
concentración de analito [119].
Figura 7. Esquema del formato CEDIA.
‐ FETI (Fluorescence resonance energy transfer immunoassay): Se
diseñó como una alternativa a los inmunoensayos homogéneos
tradicionales y se basa en el proceso de transferencia de energía que tiene
Aceptor Enzimático
Anticuerpo
Antígeno (‐) (Analito)
Antígeno (+)
(Analito)
Dador Enzimático Forma Activa
Forma Inactiva
Introducción
‐ 41 ‐
lugar al unirse el antígeno y el anticuerpo, ambos marcados con las
moléculas implicadas en este proceso. Puede dar lugar a una emisión por
parte del inmunocomplejo a una longitud de onda diferente a la de
excitación, o bien, a una inhibición de fluorescencia al producirse la
reacción inmunoquímica. Aunque este tipo de inmunoensayo homogéneo
aún se utiliza, la tendencia actual es el uso de nanomateriales mediante los
formatos homogéneo o heterogéneo [120].
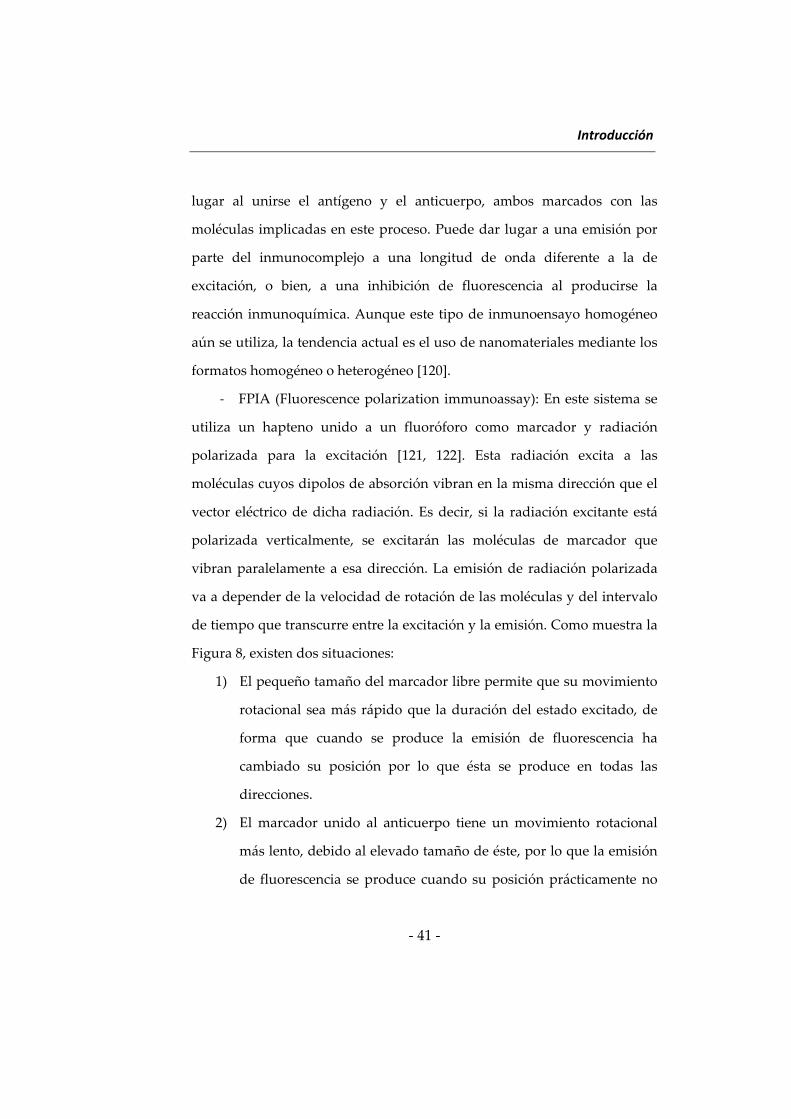
‐ FPIA (Fluorescence polarization immunoassay): En este sistema se
utiliza un hapteno unido a un fluoróforo como marcador y radiación
polarizada para la excitación [121, 122]. Esta radiación excita a las
moléculas cuyos dipolos de absorción vibran en la misma dirección que el
vector eléctrico de dicha radiación. Es decir, si la radiación excitante está
polarizada verticalmente, se excitarán las moléculas de marcador que
vibran paralelamente a esa dirección. La emisión de radiación polarizada
va a depender de la velocidad de rotación de las moléculas y del intervalo
de tiempo que transcurre entre la excitación y la emisión. Como muestra la
Figura 8, existen dos situaciones:
1) El pequeño tamaño del marcador libre permite que su movimiento
rotacional sea más rápido que la duración del estado excitado, de
forma que cuando se produce la emisión de fluorescencia ha
cambiado su posición por lo que ésta se produce en todas las
direcciones.
2) El marcador unido al anticuerpo tiene un movimiento rotacional
más lento, debido al elevado tamaño de éste, por lo que la emisión
de fluorescencia se produce cuando su posición prácticamente no
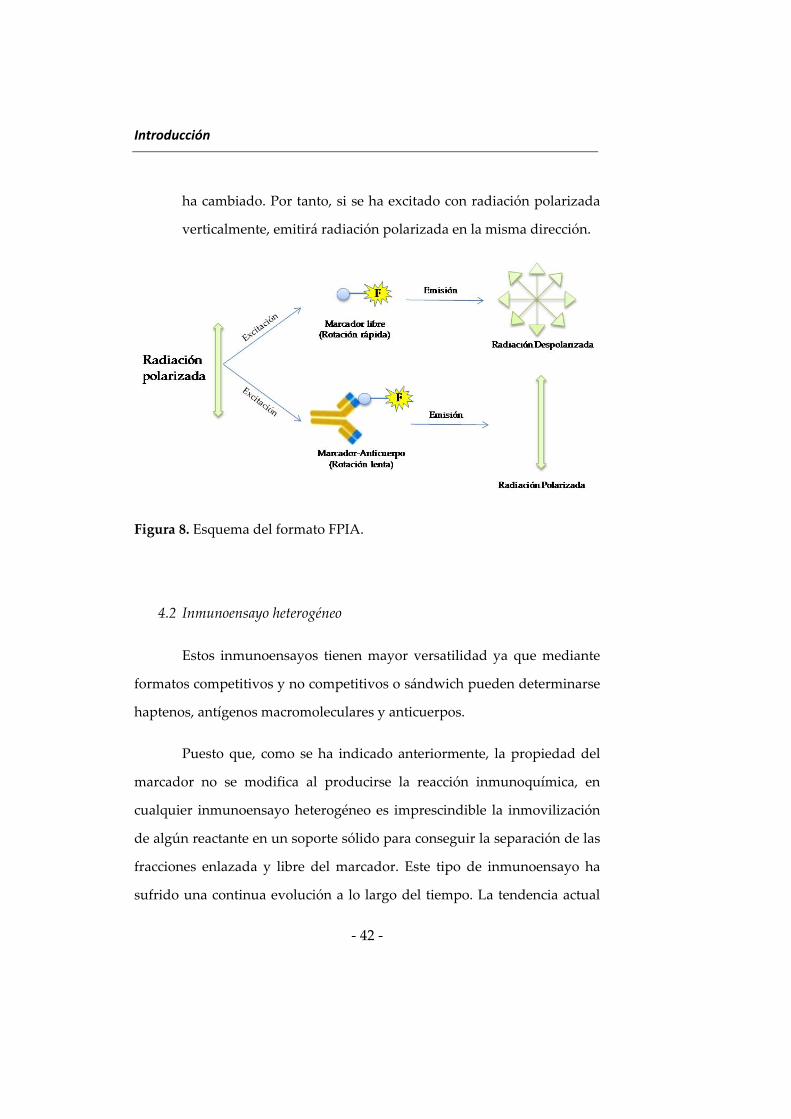
Introducción
‐ 42 ‐
ha cambiado. Por tanto, si se ha excitado con radiación polarizada
verticalmente, emitirá radiación polarizada en la misma dirección.
Figura 8. Esquema del formato FPIA.
4.2 Inmunoensayo heterogéneo
Estos inmunoensayos tienen mayor versatilidad ya que mediante
formatos competitivos y no competitivos o sándwich pueden determinarse
haptenos, antígenos macromoleculares y anticuerpos.
Puesto que, como se ha indicado anteriormente, la propiedad del
marcador no se modifica al producirse la reacción inmunoquímica, en
cualquier inmunoensayo heterogéneo es imprescindible la inmovilización
de algún reactante en un soporte sólido para conseguir la separación de las
fracciones enlazada y libre del marcador. Este tipo de inmunoensayo ha
sufrido una continua evolución a lo largo del tiempo. La tendencia actual
Introducción
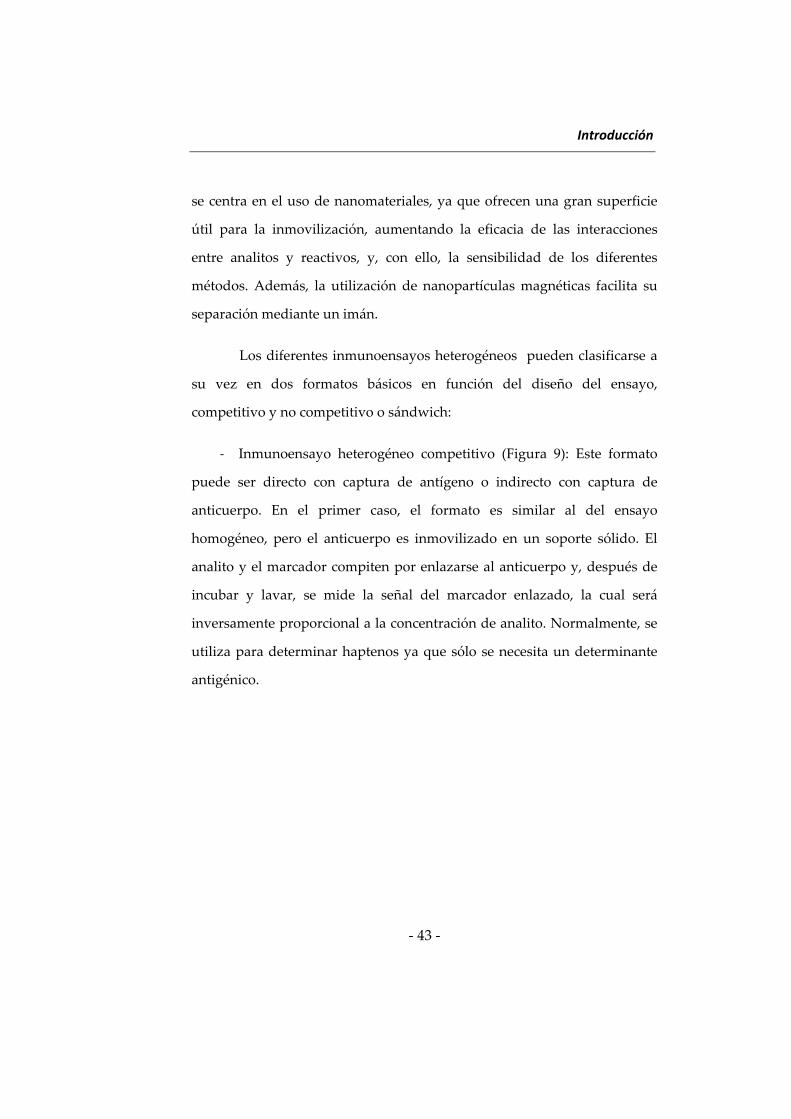
‐ 43 ‐
se centra en el uso de nanomateriales, ya que ofrecen una gran superficie
útil para la inmovilización, aumentando la eficacia de las interacciones
entre analitos y reactivos, y, con ello, la sensibilidad de los diferentes
métodos. Además, la utilización de nanopartículas magnéticas facilita su
separación mediante un imán.
Los diferentes inmunoensayos heterogéneos pueden clasificarse a
su vez en dos formatos básicos en función del diseño del ensayo,
competitivo y no competitivo o sándwich:
‐ Inmunoensayo heterogéneo competitivo (Figura 9): Este formato
puede ser directo con captura de antígeno o indirecto con captura de
anticuerpo. En el primer caso, el formato es similar al del ensayo
homogéneo, pero el anticuerpo es inmovilizado en un soporte sólido. El
analito y el marcador compiten por enlazarse al anticuerpo y, después de
incubar y lavar, se mide la señal del marcador enlazado, la cual será
inversamente proporcional a la concentración de analito. Normalmente, se
utiliza para determinar haptenos ya que sólo se necesita un determinante
antigénico.
Introducción
‐ 44 ‐
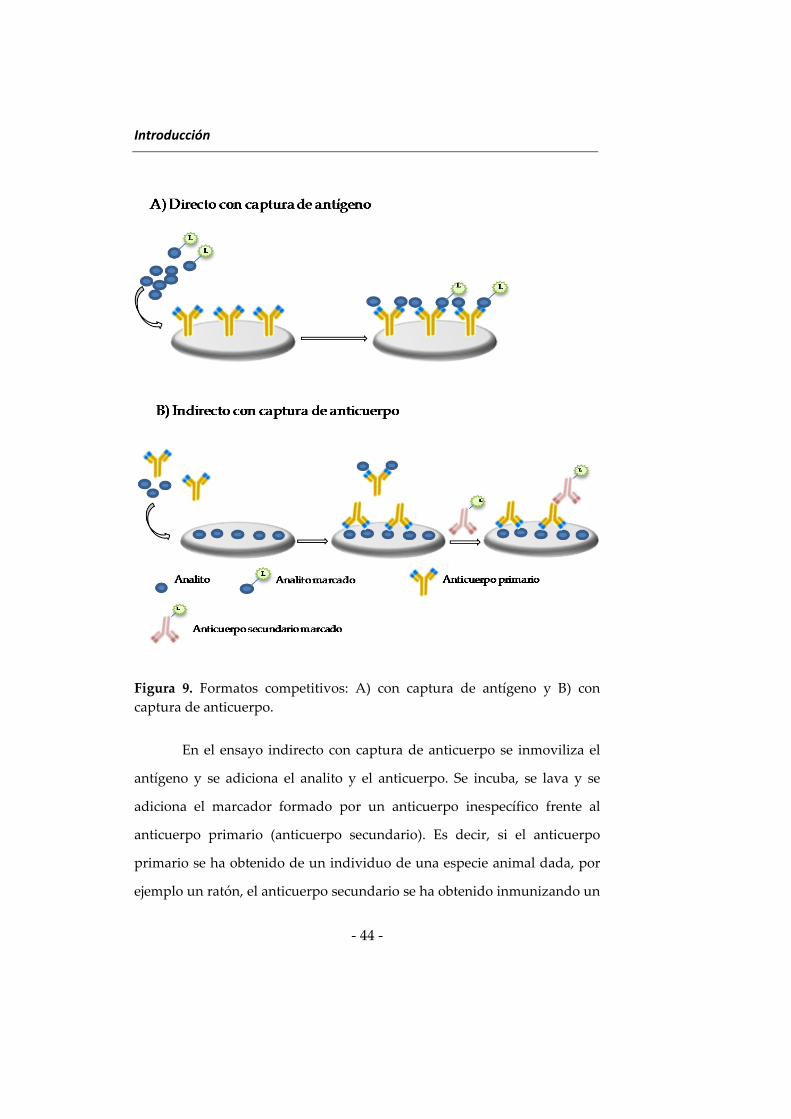
Figura 9. Formatos competitivos: A) con captura de antígeno y B) con
captura de anticuerpo.
En el ensayo indirecto con captura de anticuerpo se inmoviliza el
antígeno y se adiciona el analito y el anticuerpo. Se incuba, se lava y se
adiciona el marcador formado por un anticuerpo inespecífico frente al
anticuerpo primario (anticuerpo secundario). Es decir, si el anticuerpo
primario se ha obtenido de un individuo de una especie animal dada, por
ejemplo un ratón, el anticuerpo secundario se ha obtenido inmunizando un
Introducción
‐ 45 ‐
individuo de otra especie animal, por ejemplo una oveja, con suero de
ratón. Este marcador puede utilizarse como reactivo general para
determinar distintos analitos siempre que los correspondientes anticuerpos
primarios procedan de la misma especie animal. Como alternativa a este
marcador, podría usarse directamente el anticuerpo del analito marcado,
reduciendo así el número de etapas del ensayo, pero se necesitaría un
marcador distinto para cada determinación, aumentado su coste. Este
formato se aplica preferentemente a analitos macromoleculares, ya que
deben disponer de grupos adecuados para enlazarse al soporte y al
anticuerpo.
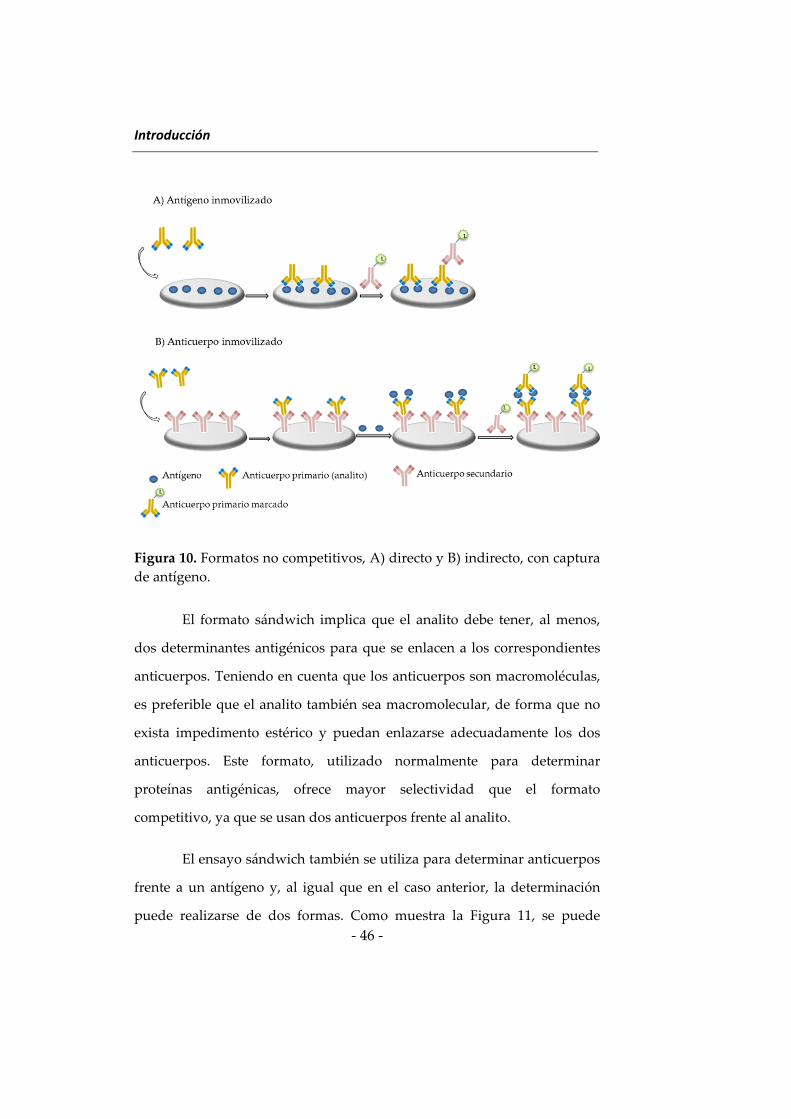
‐ Inmunoensayo heterogéneo no competitivo: Estos ensayos,
denominados también sándwich, son más adecuados para determinar
especies macromoleculares, ya sean antígenos o anticuerpos. La
determinación de antígenos, esquematizada en la Figura 10, implica la
inmovilización del anticuerpo, denominado primario, el cual se encuentra
en cantidad suficiente para que reaccione todo el analito. Después de
incubar y lavar, existen dos posibilidades según se utilice el formato
directo o el indirecto. En el primer caso, se adiciona el marcador formado
por un anticuerpo, denominado secundario, frente al analito. En el formato
indirecto, se adiciona el anticuerpo secundario y el marcador formado por
un anticuerpo inespecífico frente a este anticuerpo secundario, al igual que
se ha descrito anteriormente.
Introducción
‐ 46 ‐
Figura 10. Formatos no competitivos, A) directo y B) indirecto, con captura
de antígeno.
El formato sándwich implica que el analito debe tener, al menos,
dos determinantes antigénicos para que se enlacen a los correspondientes
anticuerpos. Teniendo en cuenta que los anticuerpos son macromoléculas,
es preferible que el analito también sea macromolecular, de forma que no
exista impedimento estérico y puedan enlazarse adecuadamente los dos
anticuerpos. Este formato, utilizado normalmente para determinar
proteínas antigénicas, ofrece mayor selectividad que el formato
competitivo, ya que se usan dos anticuerpos frente al analito.
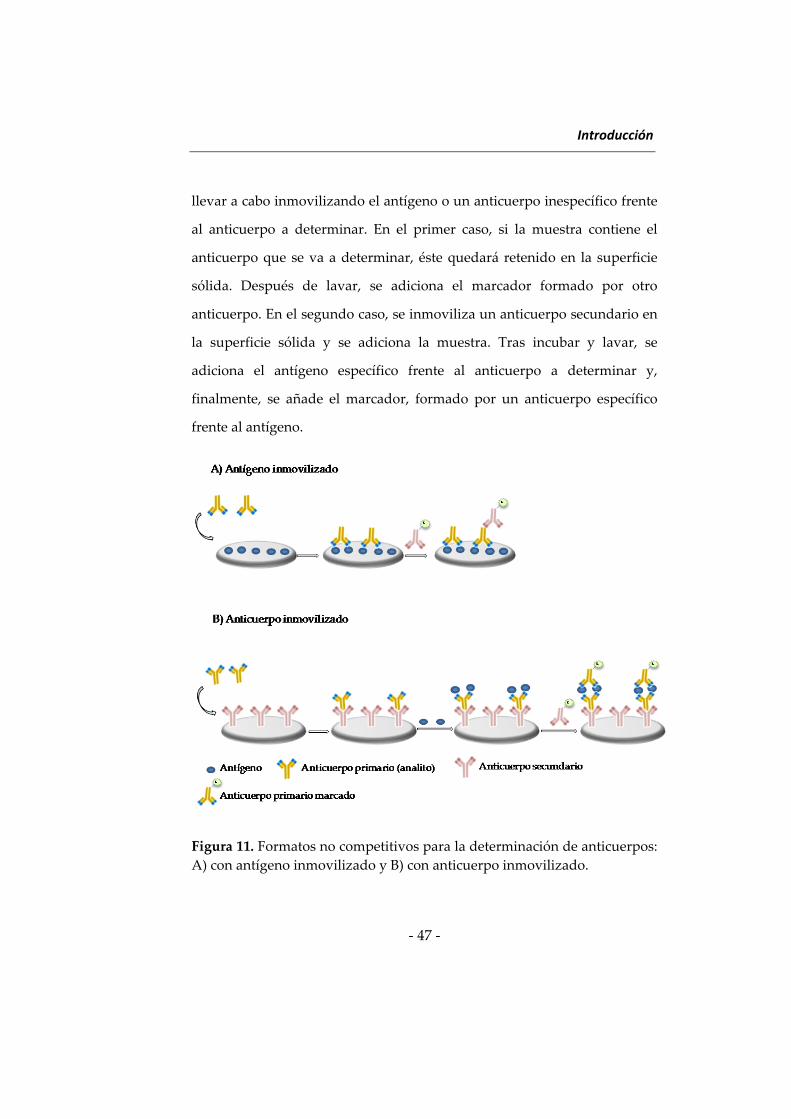
El ensayo sándwich también se utiliza para determinar anticuerpos
frente a un antígeno y, al igual que en el caso anterior, la determinación
puede realizarse de dos formas. Como muestra la Figura 11, se puede
Introducción
‐ 47 ‐
llevar a cabo inmovilizando el antígeno o un anticuerpo inespecífico frente
al anticuerpo a determinar. En el primer caso, si la muestra contiene el
anticuerpo que se va a determinar, éste quedará retenido en la superficie
sólida. Después de lavar, se adiciona el marcador formado por otro
anticuerpo. En el segundo caso, se inmoviliza un anticuerpo secundario en
la superficie sólida y se adiciona la muestra. Tras incubar y lavar, se
adiciona el antígeno específico frente al anticuerpo a determinar y,
finalmente, se añade el marcador, formado por un anticuerpo específico
frente al antígeno.
Figura 11. Formatos no competitivos para la determinación de anticuerpos:
A) con antígeno inmovilizado y B) con anticuerpo inmovilizado.
Introducción
‐ 48 ‐
Los diferentes inmunoensayos heterogéneos también pueden ser
clasificados en función de la propiedad que se mide del marcador. Entre
ellos, cabe citar:
‐ RIA (Radioimmunoassay): Fue el primero en desarrollarse
mediante el uso de isótopos radiactivos unidos a biomoléculas para formar
el marcador. Este ensayo presenta gran versatilidad, bajos límites de
detección, elevada precisión y ausencia de interferencias bien ambientales,
tales como las debidas al pH, temperatura o fuerza iónica, o bien debidas a
la matriz de la muestra. Sin embargo, también presenta limitaciones,
siendo el principal inconveniente el uso de materiales radioactivos con sus
posibles riesgos para la salud, necesidad de permisos y recintos
exclusivamente preparados para ello, así como la gestión especial de los
residuos, lo que encarece el ensayo y limita su uso a laboratorios de
referencia [123 ‐ 125].
‐ FIA (Fluoroimmunoassay): Es una alternativa al uso de material
radiactivo en los inmunoensayos heterogéneos. El procedimiento es muy
similar al utilizado en RIA pero se utilizan moléculas fluorescentes para
formar el marcador. Dentro de estos fluoroinmunoensayos (FIA) cabe citar
el sistema DELFIA (Dissociation‐Enhanced Lanthanide Fluorescent
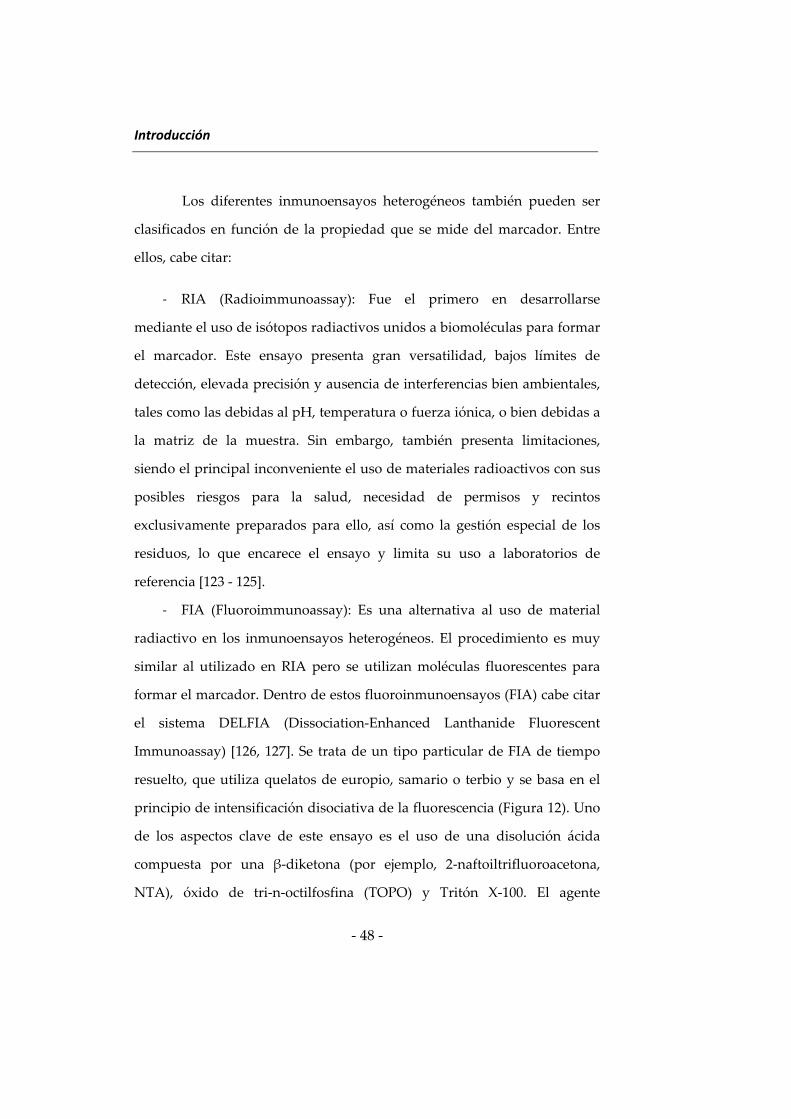
Immunoassay) [126, 127]. Se trata de un tipo particular de FIA de tiempo
resuelto, que utiliza quelatos de europio, samario o terbio y se basa en el
principio de intensificación disociativa de la fluorescencia (Figura 12). Uno
de los aspectos clave de este ensayo es el uso de una disolución ácida
compuesta por una β‐diketona (por ejemplo, 2‐naftoiltrifluoroacetona,
NTA), óxido de tri‐n‐octilfosfina (TOPO) y Tritón X‐100. El agente
Introducción
‐ 49 ‐
quelatante (NTA) forma un complejo muy fluorescente con el ion
lantánido, el TOPO elimina las moléculas de agua de la esfera de
coordinación mientras que el Tritón X‐100 crea un medio micelar que
protege al complejo. Este tipo de ensayos presentan límites de detección
similares al RIA sin el inconveniente del uso de material radiactivo.
Figura 12. Esquema del sistema DELFIA.
‐ ELISA (Enzyme linked immunosorbent assay): Puede considerarse
el inmunoensayo heterogéneo más utilizado en análisis clínico, ambiental y
agroalimentario. En este caso, el marcador es sintetizado a partir de una
enzima que, en presencia del sustrato correspondiente, cataliza una
reacción, dando lugar a cambios medibles normalmente mediante
fotometría o fluorimetría. Las enzimas más utilizadas para formar el
marcador son β‐galactosidasa, fosfatasa alcalina y peroxidasa de rábano,
las cuales necesitan su correspondiente sustrato para llevar a cabo la
detección [128 ‐ 131].
Introducción
‐ 50 ‐
‐ Inmunosensores: Constituyen un tipo de sensores muy selectivos
basados en la inmovilización de un antígeno o un anticuerpo en la zona de
reconomiento del sensor. Hasta hace unos años, estos inmunosensores
presentaban problemas de sensibilidad, ya que los cambios de señal apenas
podían ser recogidos por el transductor. En cambio, la utilización de los
nanomateriales ha provocado una revolución en estos dispositivos. La
inmovilización de NPs sobre la superficie del sensor proporciona un
aumento de la superficie específica del mismo y, en consecuencia, de la
cantidad de reactivo inmovilizado, consiguiendo mayores cambios de
señal y una mejora de la sensibilidad del método.
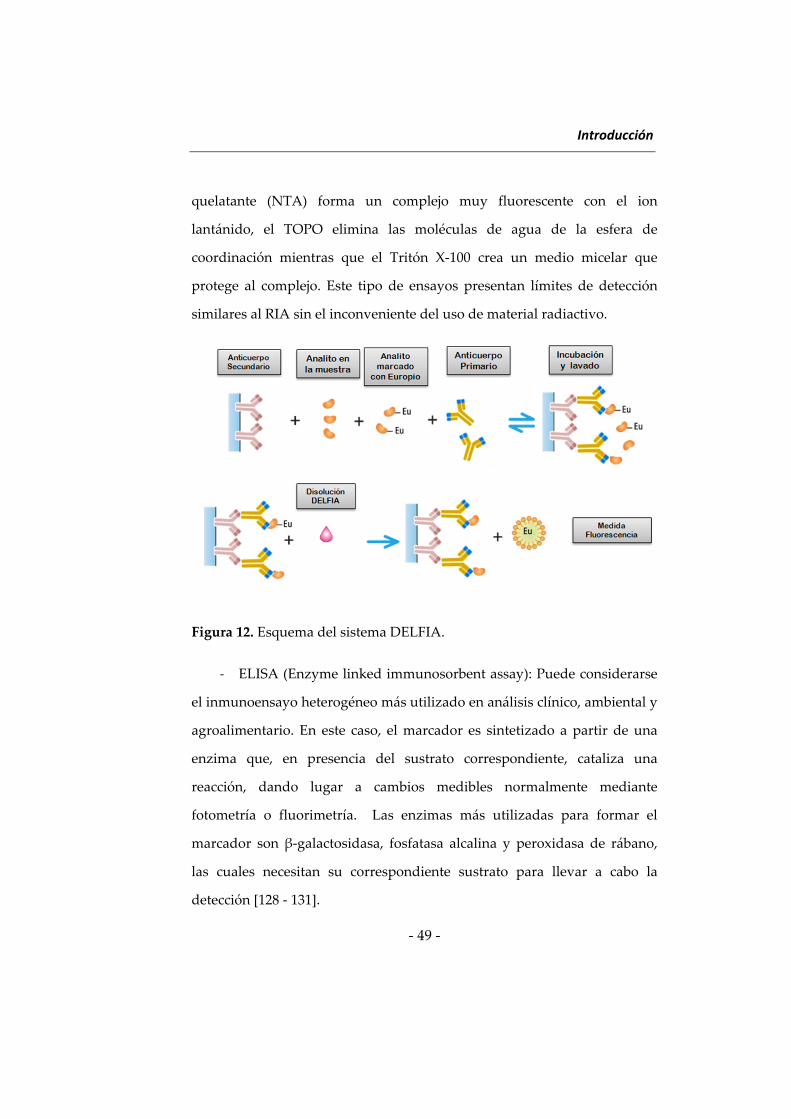
Los inmunosensores pueden ser clasificados en diferentes grupos
en función de la señal originada al unirse el analito a la superficie del
sensor (Figura 13).
Figura 13. Clasificación de los inmunosensores.
INMUNOSENSORES
ELECTROQUÍMICOS
• Potenciométricos
•Amperométricos
• Impedimétricos
• Conductimétricos
• Capacitivos
PIEZOELÉCTRICOS
ÓPTICOS
• Quimioluminiscentes
• Electroquimioluminiscentes
• Resonancia del plasmón superficial
Introducción
‐ 51 ‐
A continuación, se describen sucintamente los distintos tipos:
Los inmunosensores electroquímicos se caracterizan por presentar
buena sensibilidad (desde la inclusión de los nanomateriales), bajo coste y
fácil automatización. Como se muestra en la clasificación, los
inmunosensores electroquímicos están divididos en varios subgrupos, en
función del tipo de señal que se origina. Así, los potenciométricos registran
el cambio de potencial en la superficie del sensor, los amperométricos
recogen la corriente eléctrica generada, los conductimétricos miden los
cambios en la conductividad, los sensores de impedancia miden la
resistencia al paso de corriente eléctrica y los sensores de capacitancia se
basan en los cambios de la constante dieléctrica del sensor al unirse el
analito a su superficie [132 ‐ 146].
Los inmunosensores ópticos se basan en la medida de la absorción
o emisión producida tras llevarse a cabo la inmunoreacción en la superficie
del sensor. Estos inmunosensores son muy utilizados en bioanálisis gracias
a las ventajas que presentan: modo de trabajo no destructivo y rápida
generación de la señal. Al igual que ocurre con los inmunosensores
electroquímicos, los inmunosensores ópticos han experimentado una
revolución gracias al uso de nanopartículas. Los nanomateriales utilizados
van desde SiO2NPs dopadas con fluoróforos, AuNPs, QDs, CNTs, hasta los
recientemente utilizados UCPs. Estos inmunosensores ópticos, como
muestra el esquema anterior, se pueden dividir en sensores
quimioluminiscentes (se recoge la intensidad luminiscente generada por
una reacción química), electroquimioluminiscentes (implican la formación
de especies que, tras una transferencia electrónica, emiten radiación
Introducción
‐ 52 ‐
luminiscente) e inmunosensores de resonancia de plasmón superficial
(fenómeno producido al interaccionar la radiación con los electrones
superficiales de finas películas metálicas) [147 – 153].
Otro tipo de inmunosensores son los inmunosensores
piezoeléctricos, basados en el uso de la microbalanza de cristal de cuarzo
(QCM) que registra cambios en la frecuencia de resonancia de un
osciloscopio acoplado al sistema, la cual es directamente proporcional a la
masa que se une a la superficie. Aunque esta técnica presenta una buena
sensibilidad, su utilización es más restringida debido a problemas de
selectividad, ya que cualquier molécula que se una a la superficie de forma
no específica, originará una respuesta en el detector [154, 155].
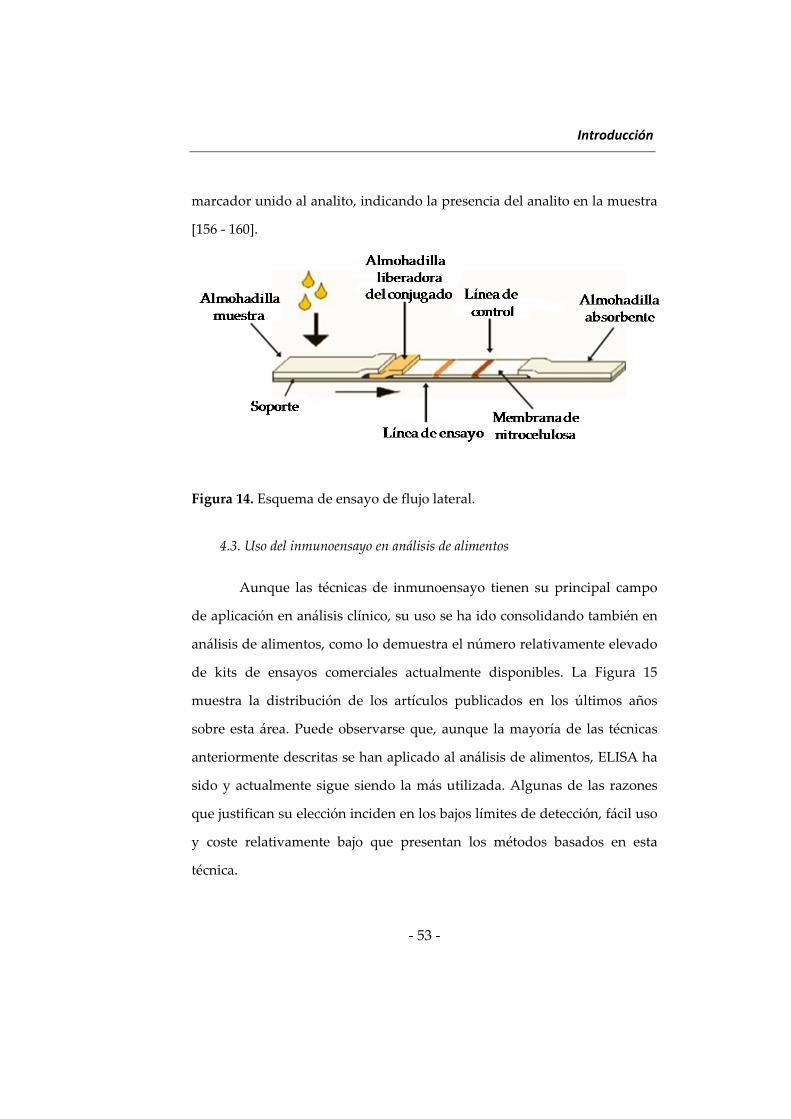
Un tipo especial de inmunosensores lo constituyen los basados en
ensayos de flujo lateral o inmunocromatografía. Esta técnica utiliza un
dispositivo muy simple, portátil y no requiere un sistema de detección
costoso ya que en ciertos casos, es visual (cualitativo) y, en otros, solo se
necesita un refractómetro o un fluorímetro (cuantitativo). El ejemplo típico
de este sistema es el test de embarazo comercialmente asequible. Este
dispositivo está fabricado con un material poroso capaz de transportar la
muestra líquida por capilaridad a lo largo de las diferentes secciones que lo
componen. Como puede observarse en la Figura 14, sobre algunas de estas
secciones se inmovilizan antígenos o anticuerpos marcados para que sean
arrastrados por la muestra líquida y proporcionen dos señales visibles, una
línea de control y otra de ensayo. La línea de control se forma por captura
del marcador libre, comprobando así que el ensayo se ha realizado
correctamente. En cambio, la línea de ensayo se forma por el enlace del
Introducción
‐ 53 ‐
marcador unido al analito, indicando la presencia del analito en la muestra
[156 ‐ 160].
Figura 14. Esquema de ensayo de flujo lateral.
4.3. Uso del inmunoensayo en análisis de alimentos
Aunque las técnicas de inmunoensayo tienen su principal campo
de aplicación en análisis clínico, su uso se ha ido consolidando también en
análisis de alimentos, como lo demuestra el número relativamente elevado
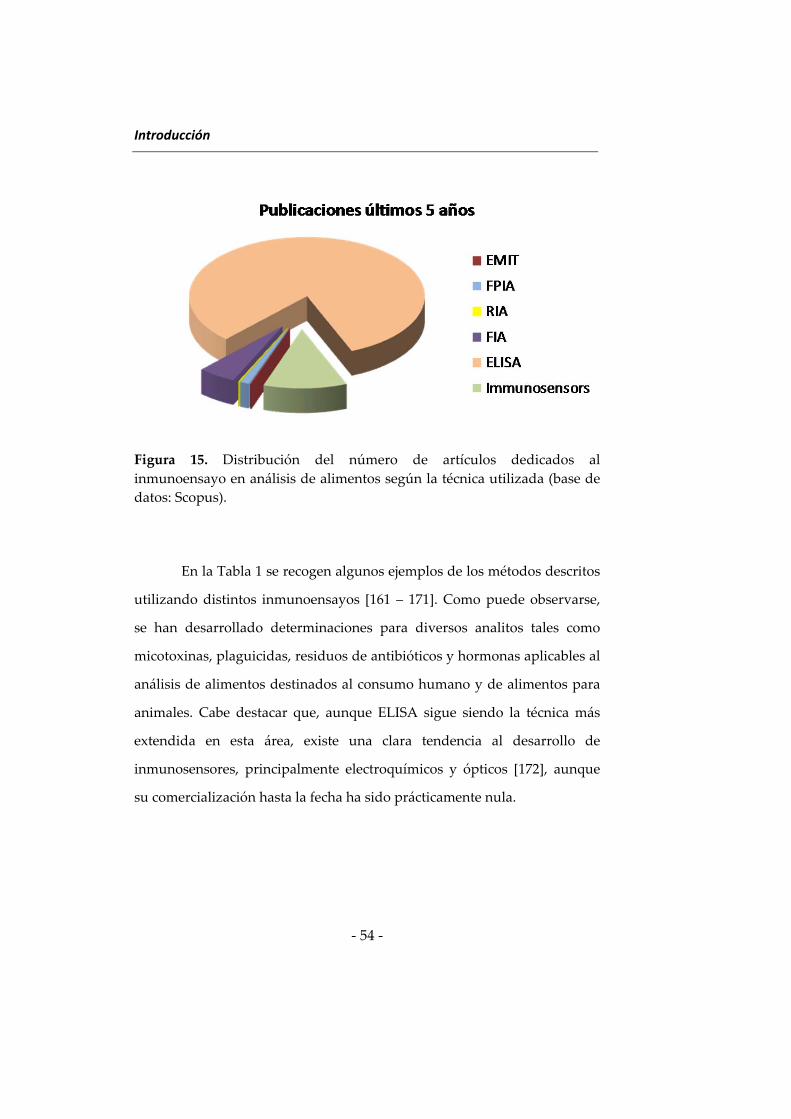
de kits de ensayos comerciales actualmente disponibles. La Figura 15
muestra la distribución de los artículos publicados en los últimos años
sobre esta área. Puede observarse que, aunque la mayoría de las técnicas
anteriormente descritas se han aplicado al análisis de alimentos, ELISA ha
sido y actualmente sigue siendo la más utilizada. Algunas de las razones
que justifican su elección inciden en los bajos límites de detección, fácil uso
y coste relativamente bajo que presentan los métodos basados en esta
técnica.
Introducción
‐ 54 ‐
Figura 15. Distribución del número de artículos dedicados al
inmunoensayo en análisis de alimentos según la técnica utilizada (base de
datos: Scopus).
En la Tabla 1 se recogen algunos ejemplos de los métodos descritos
utilizando distintos inmunoensayos [161 – 171]. Como puede observarse,
se han desarrollado determinaciones para diversos analitos tales como
micotoxinas, plaguicidas, residuos de antibióticos y hormonas aplicables al
análisis de alimentos destinados al consumo humano y de alimentos para
animales. Cabe destacar que, aunque ELISA sigue siendo la técnica más
extendida en esta área, existe una clara tendencia al desarrollo de
inmunosensores, principalmente electroquímicos y ópticos [172], aunque
su comercialización hasta la fecha ha sido prácticamente nula.
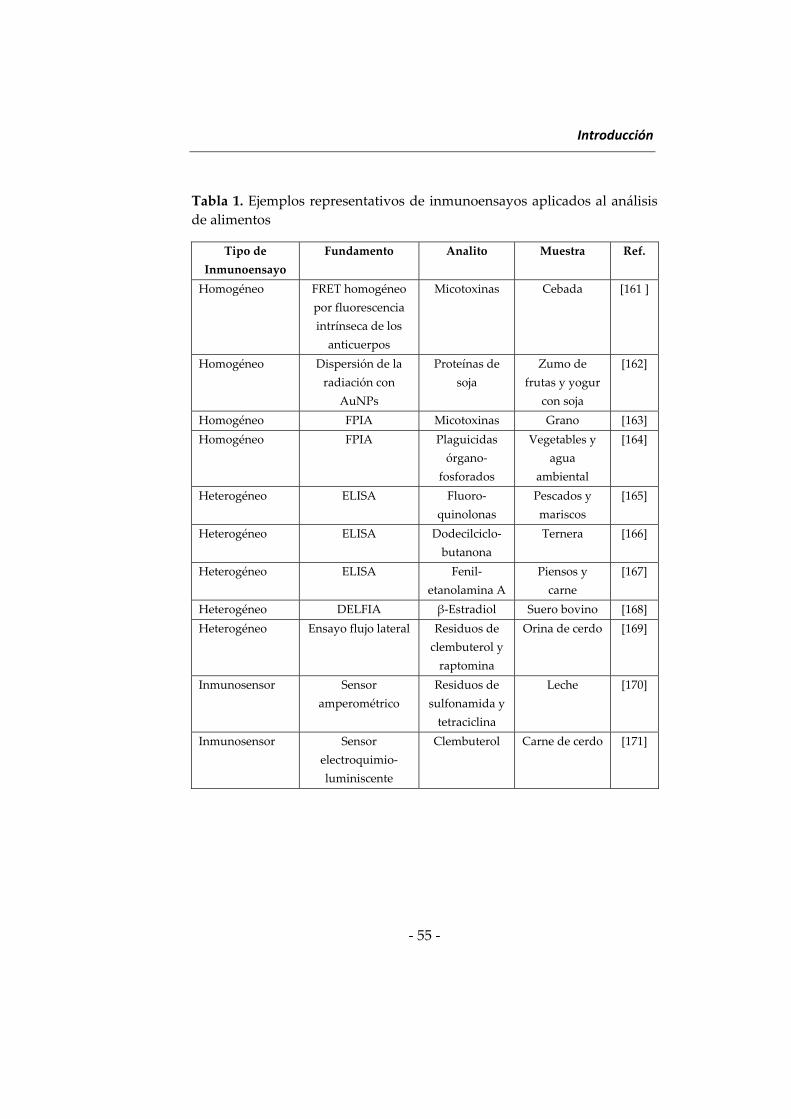
Introducción
‐ 55 ‐
Tabla 1. Ejemplos representativos de inmunoensayos aplicados al análisis
de alimentos
Tipo de
Inmunoensayo
Fundamento Analito Muestra Ref.
Homogéneo FRET homogéneo
por fluorescencia
intrínseca de los
anticuerpos
Micotoxinas Cebada [161 ]
Homogéneo Dispersión de la
radiación con
AuNPs
Proteínas de
soja
Zumo de
frutas y yogur
con soja
[162]
Homogéneo FPIA Micotoxinas Grano [163]
Homogéneo FPIA Plaguicidas
órgano‐
fosforados
Vegetables y
agua
ambiental
[164]
Heterogéneo ELISA Fluoro‐
quinolonas
Pescados y
mariscos
[165]
Heterogéneo ELISA Dodecilciclo‐
butanona
Ternera [166]
Heterogéneo ELISA Fenil‐
etanolamina A
Piensos y
carne
[167]
Heterogéneo DELFIA β‐Estradiol Suero bovino [168]
Heterogéneo Ensayo flujo lateral Residuos de
clembuterol y
raptomina
Orina de cerdo [169]
Inmunosensor Sensor
amperométrico
Residuos de
sulfonamida y
tetraciclina
Leche [170]
Inmunosensor Sensor
electroquimio‐
luminiscente
Clembuterol Carne de cerdo [171]
Introducción
‐ 56 ‐
Bibliografía
(1) D. Knopp, D. Tang, R. Niessner. Review: Bioanalytical applications
of biomolecule‐functionalized nanometer‐sized doped silica
particles. Anal. Chim. Acta (2009) 647, 14 – 30.
(2) W. Wei, M.Wei, S. Liu. Silica nanoparticles as a carrier for signal
amplification. Reviews Anal. Chem. (2012) 31, 163 – 176.
(3) S. W. Bae, W. Tan, J. I. Hong. Fluorescent dye‐doped silica
nanoparticles: new tolos for bioapplications. Chem. Commun. (2012)
48, 2270 – 2282.
(4) W. Stöber, A. Fink. Controlled growth of monodisperse silica
spheres in the micron size range. J. Colloid Interf. Sci. (1968) 26, 62 –
69.
(5) H. Yamauchi, T. Ishikawa, S. Kondo. Surface characterization of
ultramicro spherical particles of silica prepared by W/O
microemulsion method. Colloid Surface. (1989) 37, 71 – 80.
(6) N. Gan, J. Hou, F. Hu, Y. Cao, T. Li, Z. Guo, J. Wang. A renewable
and ultrasensitive electrochemiluminescence immunosensor based
on magnetic RuL @ SiO2‐Au~RuL‐Ab2 sandwich‐type nano‐
immunocomplexes. Sensors (2011) 11, 7749 – 7762.
(7) M. Zhang, S. Ge, W. Li, M. Yan, X. Song, J. Yu, W. Xu, J. Huang.
Ultrasensitive electrochemiluminescence immunoassay for tumor
marker detection using functionalized Ru‐Silica@nanoporous gold
composite as labels. Analyst (2012) 137, 680 – 685.
(8) N. P. Sardesai, K. Kadimisetty, R. Faria, J. F. Rusling. A
microfluidic electrochemiluminescent device for detecting cancer
biomarker proteins. Anal. Bioanal. Chem. (2013) 405, 3831 – 3838.
(9) N. P. Sardesai, J. C. Barron, J. F. Rusling. Carbon nanotube
microwell array for sensitive electrochemiluminescent detection of
cancer biomarker proteins. Anal. Chem. (2011) 83, 6698 – 6703.
(10) Q. Sun, X. Zhang. Electrochemiluminescence DNA sensor based on
Ru(bpy)32+ ‐doped silica nanoparticles labeling and proximity‐
dependent surface hybridization assay. J. Solid State Electr. (2012)
16, 247 – 252.
Introducción
‐ 57 ‐
(11) Z. Chen, X. He, Y. Wang, K. Wang, Y. Du, G. Yan. Ru (II)
encapsulated phosphorylate‐terminated silica nanoparticles‐based
electrochemiluminescent strategy for label‐free assay of protein
kinase activity and inhibition. Biosens. Bioelectron. (2013) 41, 519 –
525.
(12) S. Peng, J. Li., X. Zhang. Electrogenerated chemiluminescence
sensor for glutathione with Ru(bpy)32+ ‐doped silica nanoparticles.
J. Solid State Electr. (2013) 17, 795 – 803.
(13) Y. Wang, S. R. Nugen. Development of fluorescent nanoparticle‐
labeled lateral flow assay for the detection of nucleic acids. Biomed.
Microdevices. (2013) 15, 751 – 758.
(14) M. Zhang, L. Ge, S. Ge, M. Yan, J. Yu, J. Huang, S. Liu. Three‐
dimensional paper‐based electrochemiluminescence device for
simultaneous detection of Pb2+ and Hg2+ based on potential‐control
technique. Biosens. Bioelectron. (2013) 41, 544 – 550.
(15) W. Qi, D. Wu, J. Zhao, Z. Liu, W. Zhang, L. Zhang, G. Xu.
Electrochemiluminescence resonance energy transfer based on
Ru(phen)32+‐doped silica nanoparticles and its application in “Turn‐
on” detection of ozone. Anal. Chem. (2013) 85, 3207 – 3212.
(16) Y. Zhou, X. Xia, Y. Xu, W. Ke, W. Yang, Q. Li. Application of
europium (III) chelates‐bonded silica nanoparticle in time‐resolved
immunofluorometric detection assay for human thyroid
stimulating hormone. Anal. Chim. Acta (2012) 722, 95 – 99.
(17) L. Zhang, T. Tian, Z. Ye, B. Song, J. Yuan. Preparation of visible‐
light‐excited europium biolabels for time‐resolved luminescence
cell imaging application. Talanta (2013) 108, 143 – 149.
(18) J. Wang, H. Han, X. Jiang, L. Huang, L. Chen, N. Li. Quantum dot‐
based near‐infrared electrochemiluminescent immunosensor with
gold nanoparticle‐graphene nanosheet hybrids and silica
nanospheres double‐assisted signal amplification. Anal. Chem.
(2012) 84, 4893 – 4899.
(19) B. Liu, F. Zeng, G. Wu, S. Wu. Nanoparticles as scaffolds for FRET‐
based ratiometric detection of mercury ions in water with QDs as
donors. Analyst (2012) 137, 3717 – 3724.
Introducción
‐ 58 ‐
(20) F. Gao, Q. Ye, P. Cui, L. Zhang. Efficient fluorescence energy
transfer system between CdTe‐doped silica nanoparticles and gold
nanoparticles for Turn‐On fluorescence detection of melamine. J.
Agric. Food Chem. (2012) 60, 4550 – 4558.
(21) Y. Wu, P. Xue, Y. Kang, K. M. Hui. Highly specific and
ultrasensitive graphene‐enhanced electrochemical detection of low‐
abundance tumor cells using silica nanoparticles coated with
antibody‐conjugated quantum dots. Anal. Chem. (2013) 85, 3166 –
3173.
(22) F. Liu, Y. Zhang, S. Ge, J. Lu, J. Yu, X. Song, S. Liu. Magnetic
grapheme nanosheets based electrochemiluminescence
immunoassay of cancer biomarker using CdTe quantum dots
coated silica nanospheres as labels. Talanta (2012) 99, 512 – 519.
(23) Y. Li, L. Deng, C. Deng, Z. Nie, M. Yang, S. Si. Simple and sensitive
aptasensor based on quantum dot‐coated silica nanospheres and
the gold screen‐printed electrode. Talanta (2012) 99, 637 – 642.
(24) J. Qian, C. Zhang, X. Cao, S. Liu. Versatile immunosensor using a
quantum dot coated silica nanosphere as a label for signal
amplification. Anal. Chem. (2010) 82, 6422 – 6429.
(25) J. Qian, H. Dai, X. Pan, S. Liu. Simultaneous detection of dual
proteins using quantum dots coated silica nanoparticles as labels.
Biosens. Bioelectron. (2011) 28, 314 – 319.
(26) K. Zhang, H. Zhou, Q. Mei, S. Wang, G. Guan, R. Liu, J. Zhang, Z.
Zhang. Instant visual detection of trinitrotoluene particulates on
various surfaces by ratiometric fluorescence of dual‐emission
quantum dots hybrid. J. Am. Chem. Soc. (2011) 133, 8424 – 8427.
(27) X. Kong, Q. Yu, X. Zhang, X. Du, H. Gong, H. Jiang. Synthesis and
application of surface enhanced Raman scattering (SERS) tags of
Ag@SiO2 core/shell nanoparticles in protein detection. J. Mater.
Chem. (2012) 22, 7767 – 7774.
(28) F. Wang, R. G. Widejko, Z. Yang, K. V. T. Nguyen, H. Chen, L. P.
Fernando, K. A. Christensen, J. N. Anker. Surface‐enhanced raman
scattering detection of pH with silica‐encapsulated 4‐
Introducción
‐ 59 ‐
mercaptobenzoic acid‐functionalized silver nanoparticles. Anal.
Chem. (2012) 84, 8013 – 8019.
(29) P. Devi, P. Reddy, S. Arora, S. Singh, C. Ghanshyam, M. L. Singla.
Sensing behavior study of silica‐coated Ag nanoparticles deposited
on glassy carbon toward nitrobenzene. J. Nanopart. Res. (2012) 14,
1172.
(30) M. Veerapandian, Y. T. Seo, H. Shin, K. Yun, M. H. Lee.
Functionalized graphene oxide for clinical glucose biosensing in
urine and serum samples. Int. J. Nanomed. (2012) 7, 6123 – 6136.
(31) M. Li, J. Zhang, S. Suri, L. J. Sooter, D. Ma, N. Wu. Detection of
adenosine triphosphate with an aptamer biosensor based on
surface‐enhanced raman scattering. Anal. Chem. (2012) 84, 2837 –
2842.
(32) V. L. Schmit, R. Martoglio, K. T. Carron. Lab‐on‐bubble surface
enhanced raman indirect immunoassay for Cholera. Anal. Chem.
(2012) 84, 4233 – 4236.
(33) C. Ma, G. Xie, W. Zhang, M. Liang, B. Liu, H. Xiang. Label‐free
sandwich type of immunosensor for hepatitis C virus core antigen
based on the use of gold nanoparticles on a nanostructured metal
oxide surface. Microchim. Acta (2012) 178, 331 – 340.
(34) X. Liu, L. Xie, H. Li. Electrochemical biosensor on reduced
grapheme oxide and Au nanoparticles entrapped in chitosan/silica
sol‐gel hybrid membranes for determination of dopamine and uric
acid. J. Electroanal. Chem. (2012) 682, 158 – 163.
(35) B. Liu, B. Zhang, Y. Cui, H. Chen, Z. Gao, D. Tang. Multifunctional
gold‐silica nanostructures for ultrasensitive electrochemical
immunoassay of streptomycin residues. ACS Appl. Mater. Interfaces
(2011) 3, 4668 – 4676.
(36) J. Lu, S. Liu, S. Ge, M. Yan, J. Yu, X. Hu. Ultrasensitive
electrochemical immunosensor based on Au nanoparticles dotted
carbon nanotube‐graphene composite and functionalized
mesoporous materials. Biosens. Bioelectron. (2012) 33, 29 – 35.
(37) S. Hou, Z. Ou, Q. Chen, B. Wu. Amperometric acetylcholine
biosensor based on self‐assembly of gold nanoparticles and
Introducción
‐ 60 ‐
acetylcholinesterase on the sol‐gel/multi‐walled carbon
nanotubes/choline oxidase composite‐modified platinum electrode.
Biosens. Bioelectron. (2012) 33, 44 – 49.
(38) J. Lin, P. Chu, Z. Wei. A New Dual Immunoassay for tumor
markers based on chemiluminescence signal amplification by
magnetic mesoporous silica and enzyme modified gold
nanoparticles. Anal. Sci. (2012) 28, 21 – 25.
(39) J. Zhou, N. Gan, T. Li, H. Zhou, X. Li, Y. Cao, L. Wang, W. Sang, F.
Hu. Ultratrace detection of C‐reactive protein by a piezoelectric
immunosensor based on Fe3O4@SiO2 magnetic capture nanoprobes
and HRP‐antibody co‐immobilized nano gold as signal tags. Sens.
Actuat. B: Chem (2013) 178, 494 – 500.
(40) A. Venkatanarayanan, K. Crowley, E. Lestini, T. E. Keyes, J. R.
Rusling. High sensitivity carbon nanotube based
electrochemiluminescence sensor array. Biosens. Bioelectron. (2012)
31, 233 – 239.
(41) W. Zhao, Y. Fang, Q. Zhu, K. Wang, M. Liu, X. Huang, J. Shen. A
novel glucose biosensor based on phosphonic acid‐functionalized
silica nanoparticles for sensitive detection of glucose in real
samples. Electrochim. Acta (2013) 89, 278 – 283.
(42) L. Chen, Z. Zhang, X. Zhang, A. Fu, P. Xue, R. Yan. A novel
chemiluminescence immunoassay of staphylococcal enterotoxin B
using HRP‐functionalised mesoporous silica nanoparticle as label.
Food Chem. (2012) 135, 208 – 212.
(43) J. Lu, W. Wie, L. Yin, Y. Pu, S. Liu. Flow injection chemiluminescent
immunoassay of microcystin‐LR by using PEI‐modified magnetic
beads as capturer and HRP‐functionalized silica nanoparticles as
signal amplifier. Analyst (2013) 138, 1483 – 1489.
(44) H. Zhou, G. Xu, A. Zhu, Z. Zhao, C. Ren, L. Nie, X. Kan. A
multiporous electrochemical sensor for epinephrine recognition
and detection based on molecularly imprinted polypyrrole. RSC
Advances (2012) 2, 7803 – 7808.
(45) H. Qiu, L. Fan, X. Li, L. Li, M. Sun, C. Luo. A microflow
chemiluminescence sensor for indirect determination of dibutyl
Introducción
‐ 61 ‐
phatalate by hydrolyzing based on biological recognition materials.
J. Pharm. Biomed. Anal. (2013) 75, 123 – 129.
(46) P. Zhao, J. Hao. Ter‐butylhydroquinone recognition of molecular
imprinting electrochemical sensor based on core‐shell
nanoparticles. Food Chem. (2013) 139, 1001 – 1007.
(47) P. Bakthavathsalam, V. K. Rajendran, U. Saran, S. Chatterjee, B. M.
J. Ali. Immunomagnetic nanoparticle based quantitative PCR for
rapid detection of Salmonella. Microchim. Acta (2013) 180, 1241 –
1248.
(48) X. Huang, Z. P. Aguilar, H. Li, W. Lai, H. Wei, H. Xu, Y. Xiong.
Fluorescent Ru(phen)32+‐doped silica nanoparticles‐based ICTS
sensor for quantitative detection of enrofloxacin residues in chicken
meat. Anal. Chem. (2013) 85, 5120 – 5128.
(49) W. Xu, X. Chen, X. Huang, W. Yang, C. Liu, W. Lai, H. Xu, Y.
Xiong. Ru (phen)32+ doped silica nanoparticles based
immunochromatographic strip for rapid quantitative detection of
β‐agonist residues in swine urine. Talanta (2013) 114, 160 – 166
(50) W. Denk, J. H. Strickler, W. W. Web. Two‐photon laser scanning
fluorescent microscopy. Science (1990) 248, 73 – 76.
(51) F. Wang, X. Liu. Recent advances in the chemistry of lanthanide‐
doped upconversion nanocrystals. Chem. Soc. Reviews (2009) 38, 976
– 989.
(52) J. C. Bünzli, C. Piguet. Taking advance of luminescent lanthanide
ions. Chem. Soc. Reviews (2005) 34, 1048 – 1077.
(53) J. F. Suyver, D. Biner, P. Gerner, J. Grimm, S. Heer, K. Krämer, C.
Reinhard, H. U. Güdel. Novel materials doped with trivalent
lanthanides and transition metal ions showing near‐infrared to
visible photon upconversion. Opt. Mater. (2005) 27, 1111 – 1130.
(54) J. F. Suyver, J. Grimm, M. K. van Veen, D. Biner, K. W. Krämer, H.
U. Güdel. Upconversion spectroscopy and properties of NaYF4
doped with Er3+, Tm3+ and/or Yb3+. J. Luminesc. (2006) 117, 1 – 12.
(55) N. Bogdan, F. Vetrone, G. A. Ozin, J. A. Capobianco. Synthesis of
ligand‐free colloidally stable wáter dispersible brightly luminiscent
Introducción
‐ 62 ‐
lanthanide‐doped upconverting nanoparticles. Nano Lett. (2011) 11,
835 – 840.
(56) L. Wang, R. Yan, Z. Huo, L. Wang, J. Zeng, J. Bao, X. Wang, Q.
Peng, Y. Li. Fluorescence resonant energy transfer biosensor based
on upconversion luminescent nanoparticles. Ang. Chem. Int. Ed.
(2005) 44, 6054 – 6057.
(57) T. Rantanen, H. Päkkilä, L. Jämsen, K. Kuningas, T. Ukonaho, T.
Lövgren, T. Soukka. Tandem dye acceptor used to enhance
upconversion fluorescence resonance energy transfer in
homogeneous assays. Anal. Chem. (2007) 79, 6312 – 6318.
(58) M. Wang, W. Hou, C.‐C. Mi, W.‐X. Wang, Z.‐R. Xu, H. H. Teng, C.‐
B. Mao, S.‐K. Xu. Immunoassay of goat antihuman
immunoglobulin G antibody based on luminescence resonance
energy transfer between NaYF4:Yb, Er upconversion fluorescent
nanoparticles and gold nanoparticles. Anal. Chem. (2009) 81, 8783 –
8789.
(59) C. Liu, Z. Wang, H. Jia, Z. Li. Efficient fluorescence resonance
energy transfer between upconversion nanophosphors and
graphene oxide: a highly sensitive biosensing platform. Chem.
Commun. (2011) 47, 4661 – 4663.
(60) T. Ukonaho, T. Rantanen, L. Jämsen, K. Kuningas, H. Päkkilä, T.
Lövgren, T. Soukka. Comparison of infrared‐excited up‐converting
phosphors and europium nanoparticles as labels in a two‐site
immunoassay. Anal. Chim. Acta (2007) 596, 106 – 115.
(61) P. L. Corstjens, S. Li, M. Zuiderwijk, K. Kardos, W. R. Abrams, R. S.
Niedbala, H. J. Tanke. Infrared up‐converting phosphors for
bioassays. IEE Proceedings Nanotech. (2005) 152, 64 – 72.
(62) K. Kuningas, T. Rantanen, U. Karhunen, T. Lövgren, T. Soukka.
Simultaneous use of time‐resolved fluorescence and anti‐stokes
photoluminescence in bioaffinity assay. Anal. Chem. (2005) 77, 2826
– 2834.
(63) L. Li, L. Zhou, Y. Yu, Z. Zhu, C. Lin, C. Lu, R. Yang. Development
of up‐converting phosphors technology‐based lateral‐flow assay
Introducción
‐ 63 ‐
for rapidly quantitative detection of hepatitis B surface antibody.
Diagn. Micr. Infec. Dis. (2009) 63, 165 – 172.
(64) Q. Qu, Z. Zhu, Y. Wang, Z. Zhong, J. Zhao, F. Qiao, X. Du, Z.
Wang, R. Yang, L. Huang, Y. Yu, L. Zhou, Z. Chen. Rapid and
quantitative detection of Brucella by up‐converting phosphors
technology‐based lateral‐flow assay. J. Microbiol. Meth. (2009) 79,
121 – 123.
(65) C. Liu, X. Qiu, S. Ongagna, D. Chen, Z. Chen, W. R. Abrams, D.
Malamud, P. L. Corstjens, H. H. Bau. A timer‐actuated
immunoassay cassette for detecting molecular markers in oral
fluids. Lab on a Chip (2009) 9, 768 – 776.
(66) D. Chen, M. Mauk, X. Qiu, C. Liu, J. Kim, S. Ramprasad, S.
Ongagna, W. R. Abrams, D. Malamud, P. L. Corstjens, H. H. Bau.
An intregrated, self‐contained microfluidic cassette for isolation‐
amplification, and detection of nucleic acid. Biomed. Microdevices.
(2010) 12, 705 – 719.
(67) D. E. Achatz, R. J. Meier, L. H. Fischer, O. S. Wolfbeis. Luminescent
sensing of oxygen using a quenchable probe and upconverting
nanoparticle. Ang. Chem. Int. Ed. (2011) 50, 260 – 263.
(68) H. S. Mader, O. S. Wolfbeis. Optical ammonia sensor based on
upconverting luminescent nanoparticles. Anal. Chem. (2010) 82,
5002 – 5004.
(69) L. Aguilar‐Vázquez, M.P. Aguilar‐Caballos, A. Gómez‐Hens.
Development of an automatic high‐throughput assay for
tetracycline determination by using Eu2O3 nanoparticles and dry‐
reagent technology. Talanta. (2014) 119, 111 – 115.
(70) M. Seydack. Nanoparticle labels in immunosensing using optical
detection methods. Biosens. Bioelectron. (2005) 20, 29 – 43.
(71) C. Cháfer‐Pericás, A. Maquieira, R. Puchades. Functionalized
inorganic nanoparticles used as labels in solid‐phase
immunoassays. Trends Anal. Chem. (2012) 31, 144 – 156.
(72) J. Feng, G. Shan, A. Maquieira, M.E. Koivunen, B. Guo, B.D.
Hammock, I.M. Kennedy. Functionalized europium oxide
Introducción
‐ 64 ‐
nanoparticles used as a fluorescent label in an immunoassay for
atrazine. Anal. Chem. (2003) 75, 5282‐5286.
(73) M.L. Castillo‐García, M.P. Aguilar‐Caballos, A. Gómez‐Hens.
Application of Tb4O7 nanoparticles for lasalocid and salicylate
determination in food analysis. J. Agric. Food Chem. (2012) 60, 11741
– 11747.
(74) G. P. C. Drummen. Fluorescent probes and fluorescence
(microscopy) techniques –illuminating biological and biomedical
research. Molecules (2012) 17, 14067 – 14090.
(75) A. Gómez‐Hens, M. P. Aguilar‐Caballos. Long‐wavelength
fluorophores: new trend in their analytical use. Trends Anal. Chem.
(2004) 23, 127 – 136.
(76) V. J. Pansare, S. Hejazi, W. J. Faenza, R. K. Prud´homme. Review of
long‐wavelength optical and NIR imaging materials: contrast
agents, fluorophores, and multifunctional nano carriers. Chem. Mat.
(2012) 24, 812 – 827.
(77) M. Haase, H. Schäfer. Upconverting nanoparticles. Ang. Chem. Int.
Ed. (2011) 50, 5808 – 5829.
(78) T. B. Deligeorgiev, N. I. Gadjev, I. I. Timtcheva, V. A. Maximova, H.
E. Katerinopoulos, E. Foukaraki. Synthesis of homodimeric
monomethine cyanine dyes as noncovalent nucleic acid labels and
their absorption and fluorescence spectral characteristics. Dyes
Pigments (2000) 44, 131 – 136.
(79) M. Koresawa, K. Kikuchi, S. Mizukami, H. Kojima, Y. Urano, T.
Higuchi, T. Nagano. Development of a time‐resolved fluorometric
detection system using diffusion‐enhanced energy transfer. Anal.
Chem. (2000) 72, 4904 – 4907.
(80) E. M. McCorquodale, C. L. Colyer. Indocyanine green as a
noncovalent, pseudofluorogenic label for protein determination by
capillary electrophoresis. Electrophoresis (2001) 22, 2403 – 2408.
(81) L. Tarazi, A. George, G. Patonay, L. Strekowski. Spectral
characterization of a novel near‐infrared cyanine dye: a study of its
complexion with metal ions. Talanta (1998) 46, 1413 – 1424.
Introducción
‐ 65 ‐
(82) J. M. Serrano, M. Silva. Trace analysis of aminoglycoside antibiotics
in bovine milk by MEKC with LIF detection. Electrophoresis (2006)
27, 4703 – 4710.
(83) K. E. Sapsford, C. R. Taitt, S. Fertig, M. H. Moore, M. E. Lassman,
C. M. Maragos, L. C. Shriver‐Lake. Indirect competitive
immunoassay for detection of aflatoxin B1 in corn and nut products
using the array biosensors. Biosens. Bioelectron. (2006) 21, 2298 –
2305.
(84) M. Tadatsu, S. Ito, N. Muguruma, Y. Kusaka, T. Bando, Y. Tadatsu,
K. Okamoto, K. Li, Y. Nagao, S. Sano, H. Taue. A new infrared
fluorescent‐labeling agent and labeled antibody for diagnosing
microcancers. Bioorg. Med. Chem. (2003) 11, 3289 – 3294.
(85) S. Miki, T. Kaneta, T. Imasaka. Capillary electrophoresis
immunoassay based on an on‐column immunological reaction. J.
Chromatogr. A (2005) 1066, 197 – 203.
(86) J‐P. Song, Y‐J. Guo, Q. Zhao, S‐M. Shuang, C. Dong, M. M. F. Choi.
Assemblies of brilliant cresyl violet to DNA in the presence of ϒ‐cyclodextrin. Talanta (2010) 82, 681 – 686.
(87) M. L. Sánchez‐Martínez, M. P. Aguilar‐Caballos, A. Gómez‐Hens.
Long‐wavelength homogeneous enzyme immunoassay for the
determination of amikacin in wáter samples. Talanta (2009) 78, 305
– 309.
(88) J. Madsen, I. Canton, N. J. Warren, E. Thermiston, A. Blanazs, B.
Ustbas, X. Tion, R. Pearsson, G. Battaglia, A. L. Lewis, S. P. Armes.
Nile blue‐based nanosized pH sensors for simultaneous far‐red and
near‐infrared live bioimaging. J. Am. Chem. Soc. (2013) 135, 14863 –
14870.
(89) D. Kul, M. E. Ghica, R. Pauliukaite, C. M. A. Brett. A novel
amperometric sensor for ascorbic acid based on poly(Nile blue A)
and functionalized multi‐walled carbon nanotube modified
electrodes. Talanta (2013) 111, 76 – 84.
(90) S. S. Mortazavi, H. Noorizadeh, R. Hushmandfar, A. Farmany.
Ultra‐sensitive quantification of sub‐nanomolar levels of iodine in
Introducción
‐ 66 ‐
blood serum samples by kinetic‐spectro photometric method. Biol.
Trace El. Res. (2011) 144, 1430 – 1436.
(91) X. Wang, C. Boschetti, M. J. Ruedas‐Rama, A. Tunnacliffe, E. A. H.
Hall. Ratiometric pH‐dot ANSors. Analyst (2010) 135, 1585 – 1591.
(92) T. Kaneta, Y. Saito, T. Imasaka. Indirect detection of amino‐
substituted polycyclic aromatic hydrocarbons in cyclodextrin‐
modified micellar electrokinetic chromatography combined with
diode laser‐induced fluorometry. J. Chromatogr. (1999) 831, 285 –
292.
(93) G. Sivaraman, T. Anand, D. Chellappa. Turn‐on fluorescent
chemosensor for Zn (II) via ring opening of rhodamine spirolactam
and their live cell imaging. Analyst (2012) 137, 5881 – 5884.
(94) W‐D. Chen, W‐T. Gong, Z‐Q. Ye, Y. Lin, G‐L. Ning. FRET‐based
ratiometric fluorescent probes for selective Fe3+ sensing and their
applications in mitochondria. Dalton Trans. (2013) 42, 10093 – 10096.
(95) B. Hu, L‐L. Hu, M‐L. Chen, J‐H. Wang. A FRET ratiometric
fluorescence sensing system for mercury detection and intracellular
colorimetric imaging in live Hela cells. Biosens. Bioelectron. (2013)
49, 499 – 505.
(96) H‐S. Lv, S‐Y. Huang, B‐X. Zhao, J‐Y. Miao. A new rhodamine B‐
based lysosomal pH fluorescent indicator. Anal. Chim. Acta (2013)
788, 177 – 182.
(97) R. Zekavati, S. Safi, S. J. Hashemi, T. Rahmani‐Cherati, M.
Tabatabaei, A. Mohsenifar, M. Bayat. Highly sensitive FRET‐based
fluorescence immunoassay for aflatoxin B1 using cadmium
telluride quantum dots. Microchim. Acta (2013) 180, 1217 – 1223.
(98) V. C. Özalp, U. S. Zeydanli, A. Lunding, M. Kavruk, M. T. Öz, F.
Evidoqan, L. F. Olsen, H. A. Öktem. Nanoparticle embedded
enzymes for improved lateral flow sensors. Analyst (2013) 138, 4255
– 4259.
(99) E.‐O. Ganbold, T. Kang, K. Lee, S. Y. Lee, S.‐W. Joo. Aggregation
effects of gold nanoparticles for single‐base mismatch detection in
influenza A (H1N1) DNA sequences using fluorescence and Raman
measurements. Colloids Surf. B: Biointerf. (2012) 93, 148 – 153.
Introducción
‐ 67 ‐
(100) B. T. Glaser, J. P. Malerich, S. J. Duellman, J. Fong, C. Hutson, R. M.
Fine, B. Keblansky, M. J. Tanga, P. B. Madrid. A high‐throughput
fluorescence polarization assay for inhibitors of gyrase B. J. Biomol.
Screen. (2011) 16, 230 – 238.
(101) M. Baruah, W. Qin, N. Basaric, W. M. de Borgraeve, N. Boens.
BODIPY‐Based Hydroxyaryl Derivatives as Fluorescent pH Probes.
J. Organ. Chem. (2005) 70, 4152 – 4157.
(102) E. J. Park, K. R. Reid, W. Tang, R. T. Kennedy, R. Kopelman.
Ratiometric fiber optic sensors for the detection of inter‐ and intra‐
cellular dissolved oxygen. J. Mat. Chem. (2005) 15, 2913 – 2919.
(103) D. Marushchak, S. Kalinin, I. Mikhalyov, N. Gretskaya, L. B‐A.
Johansson. Pyrromethene dyes (BODIPY) can form ground state
homo and hetero dimers: Photophysics and spectral properties.
Spectrochim. Acta Part A (2006) 65, 13 – 122.
(104) M. O. Noor, U. J. Krull. Paper‐based solid‐phase multiplexed
nucleic acid hybridization assay with tunable dynamic range using
immobilized quantum dots as donors in fluorescence resonance
energy transfer. Anal. Chem. (2013) 85, 7502 – 7511.
(105) S. Ding, X. Qiao, J. Suryadi, G. S. Marrs, G. L. Kucera, U. Bierbach.
Using fluorescent post‐labeling to probe the subcellular localization
of DNA‐targeted platinum anticancer agents. Ang. Chem. Int. Ed.
(2013) 52, 3350 – 3354.
(106) E. Lerner, G. Hilzenrat, D. Amir, E. Tauber, Y. Garini, E. Haas.
Preparation of homogeneous samples of double‐labelled protein
suitable for single‐molecule FRET measurements. Anal. Bioanal.
Chem. (2013) 405, 5983 – 5991.
(107) R. Zhang B. Song, Z. Dai, Z. Ye, Y. Xiao, Y. Liu, J. Yuan. Highly
sensitive and selective phosphorescent chemosensors for
hypochlorous acid based on ruthenium (II) complexes. Biosens.
Bioelectron. (2013) 50, 1 – 7.
(108) Y. He, Y. Chai, R. Yuan, H. Wang, L. Bai, Y. Cao, Y. Yuan. An
ultrasensitive electrochemiluminescence immunoassay based on
supersandwich DNA structure amplification with histidine as a co‐
reactant. Biosens. Bioelectron. (2013) 50, 294 – 299.
Introducción
‐ 68 ‐
(109) Y. Lui, M. Luo, J. Yan, X. Xiang, X. Ji, G. Zhou, Z. He. An
ultrasensitive biosensor for DNA detection based on hybridization
chain reaction coupled with the efficient quenching of a ruthenium
complex to CdTe quantum dots. Chem. Commun. (2013) 49, 7424 –
7426.
(110) A. Andreu‐Navarro, J. M. Fernández‐Romero, A. Gómez‐Hens.
Long‐wavelength fluorescence detection of flavonoids in orange
juices by LC. Chromatographia (2010) 72, 1115 – 1120.
(111) M. Á. Molina‐Delgado, M. P. Aguilar‐Caballos, A. Gómez‐Hens.
Determination of soy protein in food samples by dispersive solid‐
phase immunoextraction and dynamic long‐wavelength
fluorometry. Microchim. Acta (2013) 180, 1279 – 1286.
(112) A. Andreu‐Navarro, J. M. Fernández‐Romero, A. Gómez‐Hens.
Determination of polyphenolic content in beverages using laccase,
gold nanoparticles and long wavelength fluorimetry. Anal. Chim.
Acta (2012) 713, 1 – 6.
(113) L. Sun, D. Hao, W. Shen, Z. Qian, C. Zhu. Highly sensitive
fluorescent sensor for copper (II) based on amplified fluorescence
quenching of a water‐soluble NIR emiting conjugated polymer.
Microchim. Acta (2012) 177, 357 – 364.
(114) Y. Li, P. Wang, X. Wang, M. Cao, Y. Xia, C. Cao, M. Liu, C. Zhu. An
immediate luminescence enhancement method for determination
of vitamin B1, using long‐wavelength emitting water‐soluble CdTe
nanorods. Microchim. Acta (2010) 169, 65 – 71.
(115) H. W. Zhao, C. Z. Huang, Y. F. Li. Immunoassay by detecting
enhanced resonance light scattering signals of immunocomplex
using a common spectrofluorometer. Talanta (2006) 70, 609 – 614.
(116) P. Montagne, P. Varcin, M. L. Cuillière, J. Duheille. Microparticle‐
enhanced nephelometric immunoassay with microsphere‐antigen
conjugates. Bioconjug. Chem. (1992) 3, 187 – 193.
(117) A. Gómez‐Hens, M. P. Aguilar‐Caballos. Trends in Immunoassay
Techniques. Encyclopedia of Analytical Chemistry (2010) a9180, Wiley.
(118) K. Huynh, G. Wang, C. Moore, R. Barhate, C. Coulter, W.
Rodrigues, P. Catbagan, J. Soares. Development of a homogeneous
Introducción
‐ 69 ‐
immunoassay for the detection of zolpidem in urine. J. Anal.
Toxicol. (2009) 33, 486 – 490.
(119) T. Tachi, N. Kaji, M. Tokeshi, Y. Baba. Microchip‐based
homogeneous immunoassay using a cloned enzyme donor. Anal.
Sciences (2009) 25, 149 – 151.
(120) R. Zekavati, S. Safi, S. J. Hashemi, T. Rahmani‐Cherati, M.
Tabatabaei, A. Mohsenifar, M. Bayat. Highly sensitive FRET‐based
fluorescence immunoassay for aflatoxin B1 using cadmium
telluride quantum dots. Microchim. Acta (2013) 180, 13 – 14.
(121) J. Tian, L. Zhou, Y. Zhao, Y. Wang, Y. Peng, X. Hong, S. Zhao. The
application of CdTe/CdS in the detection of carcinoembryonic
antigen by fluorescence polarization immunoassay. J. Fluoresc.
(2012) 22, 1571 – 1579.
(122) J. Tian, L. Zhou, Y. Zhao, Y. Wang, Y. Peng, S. Zhao. Multiplexed
detection of tumor markers with multicolor quantum dots based on
fluorescence polarization immunoassay. Talanta (2012) 92, 72 – 77.
(123) N. Kaddar, N. Bendridi, C. Harthé, M. Rolland de Ravel, A. L.
Bienvenu, C. Y. Cuilleron, E. Mappus, M. Pugeat, H. Déchaud.
Development of a radioimmunoassay for the measurement of
Bisphenol A in biological samples. Anal. Chim. Acta (2009) 645, 1 –
4.
(124) J. H. Sloan, B. J. Ackermann, M. O´Dell, R. R. Bowsher, R. A. Dean,
R. J. Konrad. Development of a novel radioimmunoassay to detect
autoantibodies to amyloid beta peptides in the presence of a cross‐
reactive therapeutic antibody. J. Pharm. Biomed. Anal. (2011) 56,
1029 – 1034.
(125) K. M. Sallam, R. R. Sheha, A. A. El‐Zahhar. Development of solid
phase radioimmunoassay system using new polymeric magnetic
micro‐spheres. J. Radioanal. Nucl. Chem. (2011) 290, 339 – 345.
(126) H. Siitari, I. Hemmilä, E. Soini, T. Lövgren. Detection of hepatitis B
surface antigen using time‐resolved fluoroimmunoassay. Nature
(1983) 301, 258 – 260.
(127) T. Valta, E. M. Puputti, I. Hyppänen, J. Kankare, H. Takalo, T.
Soukka. Ligand enabling visible wavelength excitation of
Introducción
‐ 70 ‐
europium (III) for fluoroimmunoassays in aqueous micellar
solutions. Anal. Chem. (2012) 84, 7708 – 7712.
(128) M. M. Vdovenko, A. S. Stepanova, S. A. Eremin, N. V. Cuong, N. A.
Uskova, I. Y. Sakharov. Quantification of 2,4‐
dichlorophenoxyacetic acid in oranges and mandarins by
chemiluminescent ELISA. Food Chem. (2013) 141, 865 – 868.
(129) Z. Chao, M. Tan, M. K. Paudel, S. Sakamoto, L. Ma, K. S. Tabata, H.
Tanaka, Y. Shoyama, L. Xuan, S. Morimoto. Development of an
indirect competitive enzyme‐linked immunosorbent assay
(icELISA) using highly specific monoclonal antibody against
paclitaxel. J. Nat. Med. (2013) 67, 512 – 518.
(130) M. M. Vdovenko, C. T. Hung, I. Y. Sakharov, F. Y. Yu.
Determination of okadaic acid in shellfish by using a novel
chemiluminescent enzyme‐linked immunosorbent assay method.
Talanta (2013) 116, 343 – 346.
(131) Z. J. Liu, X. Yan, X. Y. Xu, M. H. Wang. Development of a
chemiluminescence enzyme‐linked immunosorbent assay for the
simultaneous detection of imidaclothiz and thiacloprid in
agricultural samples. Analyst (2013) 138, 3280 – 3286.
(132) Q. Xue, C. Bian, J. Tong, J. Sun, H. Zhang, S. Xia. A micro
potentiometric immunosensor for hemoglobin‐A1c level detection
based on mixed SAMs wrapped nano‐spheres array. Biosens.
Bioelectron. (2011) 26, 2689 – 2693.
(133) R. Liang, H. Peng, J. Qu. Fabrication, characterization, and
application of potentiometric immunosensor based on
biocompatible and controllable three‐dimensional porous chitosan
membranes. J. Colloid Interf. Sci. (2008) 320, 125 – 13.
(134) H. Yin, Y. Zhou, Z. Xu, M. Wang, S. Ai. Ultrasensitive
electrochemical immunoassay for DNA methyltransferase activity
and inhibitor screening based on methyl binding domain protein of
MeCP2 and enzymatic signal amplification. Biosens. Bioelectron.
(2013) 49, 39 – 45.
(135) H. Kanso, L. Barthelmebs, N. Inguimbert, T. Noguer.
Immunosensors for estradiol and ethinylestradiol based on new
Introducción
‐ 71 ‐
synthetic estrogen derivatives: application to wastewater analysis.
Anal. Chem. (2013) 85, 2397 – 2404.
(136) X. Liu, Z. Yanq, Y. Zhanq, R. Yu. A novel electrochemical
immunosensor for ochratoxin A with hapten immobilization on
thionine/gold nanoparticle modified glassy carbon electrode.
Analytical Methods (2013) 5, 1481 – 1486.
(137) Y. Hou, T. Li, H. Huang, H. Quan, X. Miao, M. Yang.
Electrochemical immunosensor for the detection of tumor necrosis
factor α based on hydrogel prepared from ferrocene modified
amino acid. Sens. Actuat. B: Chem. (2013) 182, 605 – 609.
(138) K. Mao, D. Wu, Y. Li, H. Ma, Z. Ni, H. Yu, C. Luo, Q. Wei, B. Du.
Label‐free electrochemical immunosensor based on
graphene/methylene blue nanocomposite. Anal. Biochem. (2012)
422, 22 – 27.
(139) T. Yu, W. Cheng, Q. Li, C. Luo, L. Yan, D. Zhang, Y. Yin, S. Ding,
H. Ju. Electrochemical immunosensor for competitive detection of
neuron specific enolase using functional carbon nanotubes and
gold nanoprobe. Talanta (2012) 93, 433 – 438.
(140) Q. Gao, J. Han, Z. Ma. Polyamidoamine dendrimers‐capped carbón
dots/Au nanocrystal nanocomposites and its application for
electrochemical immunosensor. Biosens. Bioelectron. (2013) 49, 323 –
328.
(141) X. Cao, S. Liu, Q. Feng, N. Wang. Silver nanowire‐based
electrochemical immunoassay for sensing immunoglobulin G with
signal amplification using strawberry‐like ZnO nanostructures as
labels. Biosens. Bioelectron. (2013) 49, 256 – 262.
(142) X. Wang, L. Chen, X. Su, S. Ai. Electrochemical immunosensor with
graphene quantum dots and apoferritin‐encapsulated Cu
nanoparticles double‐assisted signal amplification for detection of
avian leucosis virus subgroup J. Biosens. Bioelectron. (2013) 47, 171 –
177.
(143) Q. Zu, Y. Chai, R. Yuan, Y. Zhuo, J. Han, Y. Li, N. Liao.
Amperometric immunosensor for simultaneous detection of three
analytes in one interface using dual functionalized graphene sheets
Introducción
‐ 72 ‐
integrated with redox‐probes as tracer matrixes. Biosens. Bioelectron.
(2013) 43, 440 – 445.
(144) A. Montrose, S. Cargou, F. Nepveu, R. Manczak, A. M. Gué, K.
Reybier. Impedimetric immunosensor for the detection of
curculating pro‐inflammatory monocytes as infection markers.
Biosens. Bioelectron. (2013) 49, 305 – 311.
(145) L. Zhang, M. Wang, C. Wang, X. Hu, G. Wang. Label‐free
impedimetric immunosensor for sensitive detection of 2,4‐
dichlorophenoxybutyric acid (2,4‐DB) in soybean. Talanta (2012)
101, 226 – 232.
(146) S. Samanman, P. Kantharana, P. Asawatreratanakul, P.
Thavarungkul. Characterization and application of self‐assembled
layer by layer gold nanoparticles for highly sensitive label‐free
capacitive immunosensing. Electrochim. Acta (2012) 80, 202 – 212.
(147) C. Zong, J. Wu, C. Wang, H. Ju, F. Yan. Chemiluminescence
imaging immunoassay of multiple tumor markers for cancer
screening. Anal. Chem. (2012) 84, 2410 – 2415.
(148) Y. Liebes, L. Amir, R. S. Marks, M. Banai. Immobilization strategies
of Brucella particles on optical fibers for use in chemiluminescence
immunosensors. Talanta (2009) 80, 338 – 345.
(149) X. Jiang, Y. Chai, R. Yuan, Y. Cao, Y. Chen, H. Wang, X. Gan. An
ultrasensitive luminol cathodic electrochemiluminescence
immunosensor based on glucose oxidase and nanocomposites:
Graphene‐carbon nanotubes and gold‐platinum alloy. Anal. Chim.
Acta (2013) 783, 49 – 55.
(150) Z. Guo, T. Hao, S. Du, B. Chen, Z. Wang, X. Li, S. Wang. Multiplex
electrochemiluminescence immunoassay of two tumor markers
using multicolor quantum dots as labels and grapheme as
conducting bridge. Biosens. Bioelectron. (2013) 44, 101 – 107.
(151) Y. R. Kim, H. J. Seo, J. W. Oh, H. Lim, T. H. Kim, H. Kim.
Immunosensor based on electrogenerated chemiluminescence
using Ru(bpy)32+‐doped silica nanoparticles and calix[4]crown‐5
self‐assembled monolayers. Electroanalysis (2013) 25, 1056 – 1063.
Introducción
‐ 73 ‐
(152) D. E. P. Souto, J. V. Silva, H. R. Martins, A. B. Reis, R. C. S. Luz, L.
T. Kubota, F. S. Damos. Development of a label‐free immunosensor
based on surface plasmon resonance technique for the detection of
anti‐Leishmania infantum antibodies in canine serum. Biosens.
Bioelectron. (2013) 46, 22 – 29.
(153) J. Zhang, Y. Sun, B. Xu, H. Zhang, Y. Gao, H. Zhang, D. Song. A
novel surface plasmon surface resonance biosensor based on
grapheme oxide decorated with gold nanorod‐antibody conjugates
for determination of transferrin. Biosens. Bioelectron. (2013) 45, 230 –
236.
(154) S. Xiulan, Z. Yinzhi, S. Jingdong, S. Liyan, Q. He, Z. Weijuan. A
quartz crystal microbalance‐based immunosensor for shrimp
allergen determination in food. Eur. food Res. Tech. (2010) 231, 563 –
570.
(155) D. Tang, Q. Li, J. Tang, B. Su, G. Chen. An enzyme‐free quartz
crystal microbalance biosensor for sensitive glucose detection in
biological fluids based on glucose/dextran displacement approach.
Anal. Chim. Acta (2011) 686, 144 – 149.
(156) C. C. Liu, C. Y. Yeung, P. H. Chen, M. K. Yeh, S. Y. Hou. Salmonella
detection using 16S ribosomal DNA/RNA probe‐gold nanoparticles
and lateral flow immunoassay. Food Chem. (2013) 141, 2526 – 2532.
(157) X. Mao, W. Wang, T. E. Du. Dry‐reagent nucleic acid biosensor
based on blue dye doped latex beads and lateral flow strip. Talanta
(2013) 114, 248 – 253.
(158) Y. K. Wang, Y. X. Yan, W. H. Ji, H. Wang, S. Q. Li, Q. Zou, J. H.
Sun. Rapid simultaneous quantification of zearalenone and
fumonisin B1 in corn and wheat by lateral flow dual immunoassay.
J. Agric. Food Chem. (2013) 61, 5031 – 5036.
(159) C. S. Pantaleón, J. Wichers, A. A. Somovilla, A. Van Amerongen, A.
A. Fuentes. Development of an immunochromatographic assay
based on carbon nanoparticles for the determination of the
phytoregulator forchlorfenuron. Biosens. Bioelectron. (2013) 42, 170 –
176.
Introducción
‐ 74 ‐
(160) A. N. Berlina, N. A. Taranova, A. V. Zherdev, Y. Y. Vengerov, B. B.
Dzantiev. Quantum dot‐based lateral flow immunoassay for
detection of chloramphenicol in milk. Anal. Bioanal. Chem. (2013)
405, 4997 – 5000.
(161) T. Li, J‐Y. Byun, B. B. Kim, Y‐B. Shin, M‐G. Kim. Label‐free
homogeneous FRET immunoassay for the detection of mycotoxins
that utilizes quenching of the intrinsic fluorescence of antibodies.
Biosens. Bioelectron. (2013) 42, 403 – 408.
(162) M. L. Sánchez‐Martínez, M. P. Aguilar‐Caballos, A. Gómez‐Hens.
Homogeneous immunoassay for soy protein determination in food
samples using gold nanoparticles as labels and light scattering
detection. Anal. Chim. Acta (2009) 636, 58 – 62.
(163) A. P. Bondarenko, S. A. Eremin. Determination of zearalenone and
ochratoxin A mycotoxins in grain by fluorescence polarization
immunoassay. J. Anal. Chem. (2012) 67, 790 – 794.
(164) Z‐L. Xu, Q. Wang, H‐T. Lei, S. A. Eremin, Y‐D. Shen, H. Wang, R.
C. Beier, J‐Y. Yang, K. A. Maksimova, Y‐M. Sun. A simple, rapid
and high‐throughput fluorescence polarization immunoassay for
simultaneous detection of organophosphorus pesticides in
vegetable and environmental water samples. Anal. Chim. Acta
(2011) 708, 123 – 129.
(165) X. Tao, M. Chen, H. Jiang, J. Shen, Z. Wang, X. Wang, X. Wu, K.
Wen. Chemiluminescence competitive indirect enzyme
immunoassay for 20 fluoroquinolone residues in fish and shrimp
based on a single‐chain variable fragment. Anal. Bioanal. Chem.
(2013) 405, 7477 – 7484.
(166) Y. Zhao, F. Wang, W. Li, Y. Ha. Development of a competitive
indirect enzyme‐linked immunosorbent assay based on
monoclonal antibodies for the detection of 2‐dodecylcyclobutanone
in irradiate beef. J. Agric. Food Chem. (2013) 61, 7749 – 7753.
(167) B. Cao, G. He, H. Yang, H. Chang, S. Li, A. Deng. Development of a
highly sensitive and specific enzyme‐linked immunosorbent assay
(ELISA) for the detection of phenylethanolamine A in tissue and
Introducción
‐ 75 ‐
feed samples and confirmed by liquid chromatography tandem
mass spectrometry (LC‐MS/MS). Talanta (2013) 115, 624 – 630.
(168) D. Scalas, S. Squadrone, M. Gili, D. Marchis, M. Prearo, M. C.
Abete. Validation of a dissociation enhanced lanthanide
fluorescence immunoassay for the screening of 17 β‐estradiol in
bovine serum according to European Union decision 2002/657/EC.
J. AOAC Int. (2007) 90, 1427 – 1431.
(169) M‐Z. Zhang, M‐Z. Wang, Z‐L. Chen, J‐H. Fang, M‐M. Fang, J. Liu,
X‐P. Yu. Development of a colloidal gold‐based lateral‐flow
immunoassay for the rapid simultaneous detection of clenbuterol
and raptopamine in swine urine. Anal. Bioanal. Chem (2009) 395,
2591 – 2599.
(170) F. Conzuelo, S. Campuzano, M. Gamella, D. G. Pinacho, A. J.
Reviejo, M. P. Marco, J. M. Pingarrón. Integrated disposable
electrochemical immunosensors for the simultaneous
determination of sulfonamide and tetracycline antibiotics residues
in milk. Biosens. Bioelectron. (2013) 50, 100 – 105.
(171) X. Pao, P. Yan, Q. Tang, A. Deng, J. Li. Quantum Dots based
electrochemiluminescent immunosensor by coupling enzymatic
amplification for ultrasensitive detection of clenbuterol. Anal. Chim.
Acta (2013) 798, 82 – 88.
(172) F. Ricci, G. Volpe, L. Micheli, G. Palleschi. A review on novel
developments and applications of immunosensors in food analysis.
Anal. Chim. Acta (2007) 605, 111 – 129.

CAPÍTULO 1
Herramientasanalíticas

Herramientas Analíticas
‐ 79 ‐
En el desarrollo experimental de la presente Tesis Doctoral se han
empleado diferentes herramientas analíticas para llevar a cabo las distintas
investigaciones realizadas. En este capítulo de la Memoria de la Tesis
Doctoral se enumeran dichas herramientas y se profundiza en sus
características y aspectos más relevantes de su utilización.
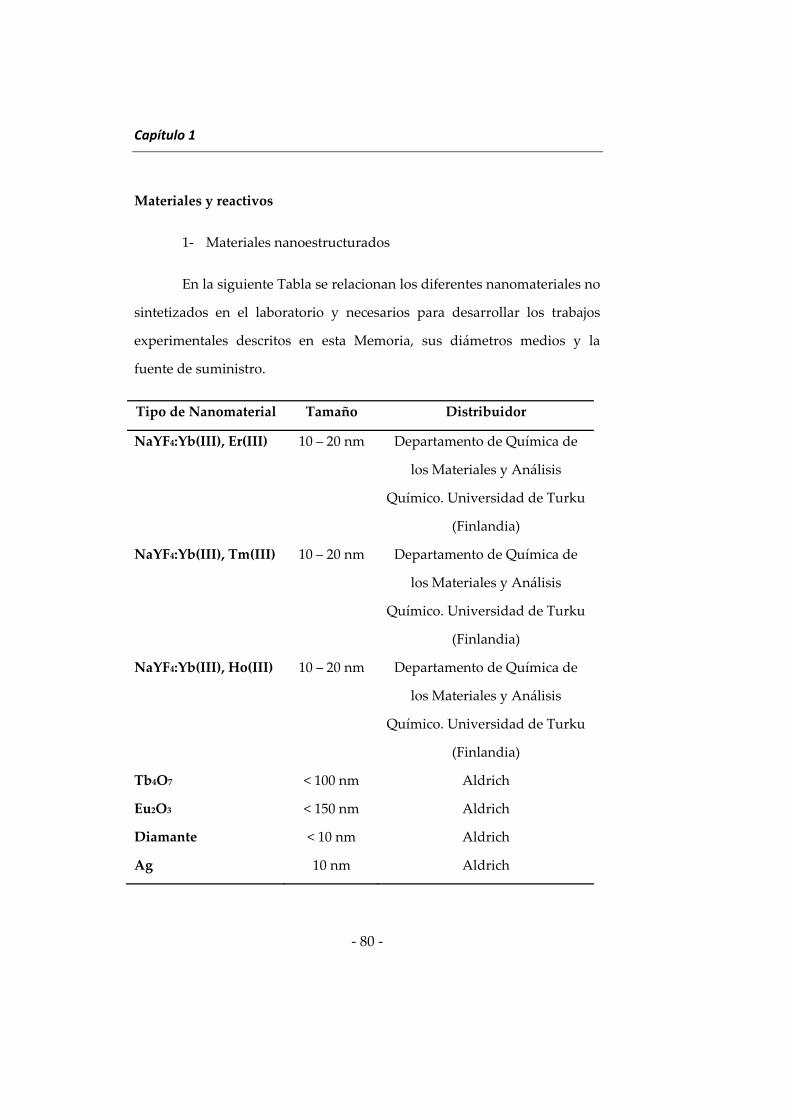
Capítulo 1
‐ 80 ‐
Materiales y reactivos
1‐ Materiales nanoestructurados
En la siguiente Tabla se relacionan los diferentes nanomateriales no
sintetizados en el laboratorio y necesarios para desarrollar los trabajos
experimentales descritos en esta Memoria, sus diámetros medios y la
fuente de suministro.
Tipo de Nanomaterial Tamaño Distribuidor
NaYF4:Yb(III), Er(III) 10 – 20 nm Departamento de Química de
los Materiales y Análisis
Químico. Universidad de Turku
(Finlandia)
NaYF4:Yb(III), Tm(III) 10 – 20 nm Departamento de Química de
los Materiales y Análisis
Químico. Universidad de Turku
(Finlandia)
NaYF4:Yb(III), Ho(III) 10 – 20 nm Departamento de Química de
los Materiales y Análisis
Químico. Universidad de Turku
(Finlandia)
Tb4O7 < 100 nm Aldrich
Eu2O3 < 150 nm Aldrich
Diamante < 10 nm Aldrich
Ag 10 nm Aldrich
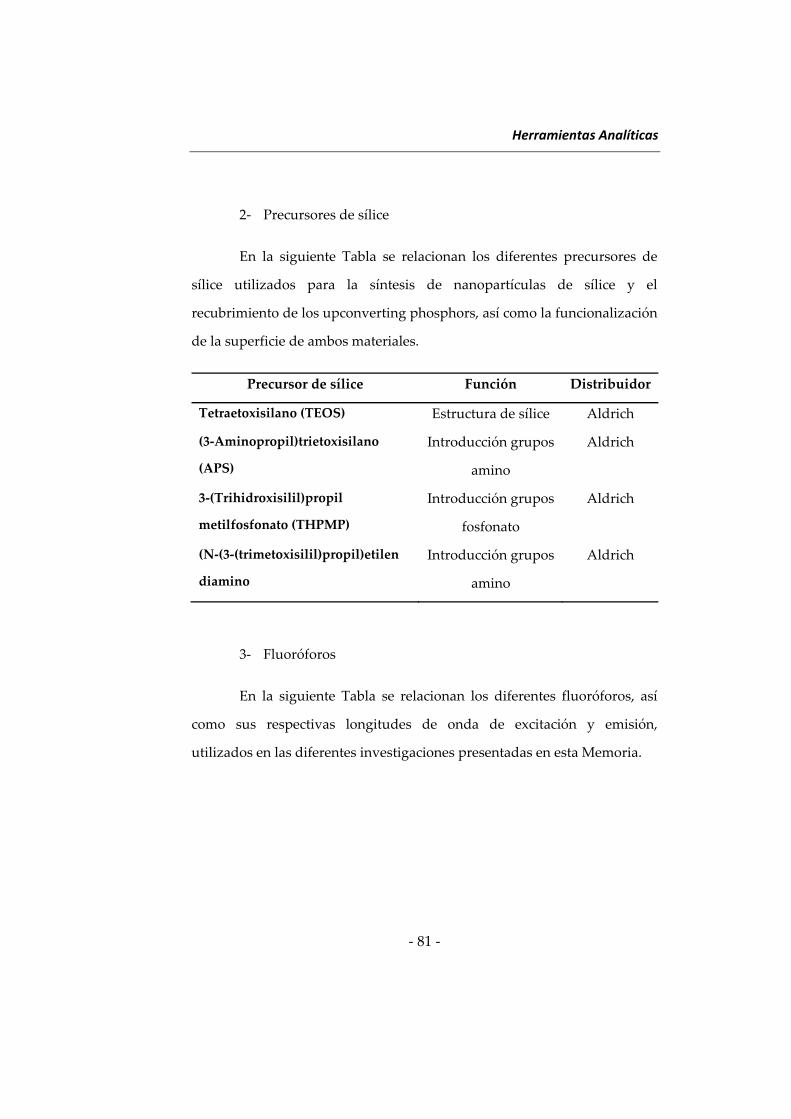
Herramientas Analíticas
‐ 81 ‐
2‐ Precursores de sílice
En la siguiente Tabla se relacionan los diferentes precursores de
sílice utilizados para la síntesis de nanopartículas de sílice y el
recubrimiento de los upconverting phosphors, así como la funcionalización
de la superficie de ambos materiales.
Precursor de sílice Función Distribuidor
Tetraetoxisilano (TEOS) Estructura de sílice Aldrich
(3‐Aminopropil)trietoxisilano
(APS)
Introducción grupos
amino
Aldrich
3‐(Trihidroxisilil)propil
metilfosfonato (THPMP)
Introducción grupos
fosfonato
Aldrich
(N‐(3‐(trimetoxisilil)propil)etilen
diamino
Introducción grupos
amino
Aldrich
3‐ Fluoróforos
En la siguiente Tabla se relacionan los diferentes fluoróforos, así
como sus respectivas longitudes de onda de excitación y emisión,
utilizados en las diferentes investigaciones presentadas en esta Memoria.
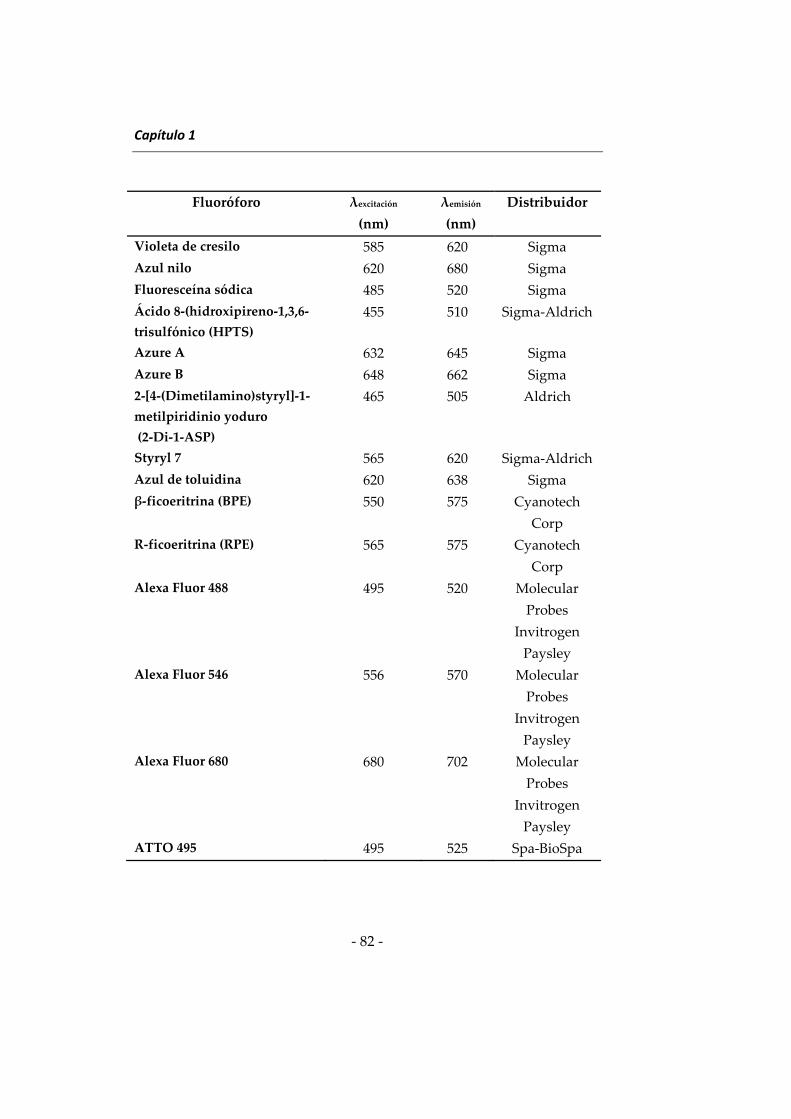
Capítulo 1
‐ 82 ‐
Fluoróforo λexcitación
(nm)
λemisión
(nm)
Distribuidor
Violeta de cresilo 585 620 Sigma
Azul nilo 620 680 Sigma
Fluoresceína sódica 485 520 Sigma
Ácido 8‐(hidroxipireno‐1,3,6‐
trisulfónico (HPTS)
455 510 Sigma‐Aldrich
Azure A 632 645 Sigma
Azure B 648 662 Sigma
2‐[4‐(Dimetilamino)styryl]‐1‐
metilpiridinio yoduro
(2‐Di‐1‐ASP)
465 505 Aldrich
Styryl 7 565 620 Sigma‐Aldrich
Azul de toluidina 620 638 Sigma
β‐ficoeritrina (BPE) 550 575 Cyanotech
Corp
R‐ficoeritrina (RPE) 565 575 Cyanotech
Corp
Alexa Fluor 488 495 520 Molecular
Probes
Invitrogen
Paysley
Alexa Fluor 546 556 570 Molecular
Probes
Invitrogen
Paysley
Alexa Fluor 680 680 702 Molecular
Probes
Invitrogen
Paysley
ATTO 495 495 525 Spa‐BioSpa
Herramientas Analíticas
‐ 83 ‐
4‐ Tensoactivos
Se han utilizado los siguientes tensoactivos neutros, aniónicos y
catiónicos: Tritón X‐100 (Sigma), Tween 20 (Sigma), dodecil sulfato sódico
(SDS) (Sigma‐Aldrich) y bromuro de hexadeciltrimetilamonio (CTAB)
(Fluka).
5‐ Disolventes orgánicos
Se han utilizado diferentes disolventes orgánicos como medio de
reacción, eliminación de reactantes y preparación de disoluciones de etanol
(Panreac), acetona (Panreac), ciclohexano (Panreac), 1‐hexanol (Merck),
metanol (Panreac), dimetilformamida (Sigma‐Aldrich) y acetonitrilo
(Panreac).
6‐ Anticuerpos
Se han utilizado varios tipos de anticuerpos para llevar a cabo los
diferentes formatos de inmunoensayo de esta tesis: Anticuerpos
policlonales anti‐proteína de soja producidos en conejo (Sigma),
anticuerpos IgG anti‐conejo producidos en cabra (Sigma‐Aldrich),
anticuerpos policlonales anti‐monensín producidos en oveja (Abcam) y
anticuerpos IgG anti‐oveja producidos en conejo (Sigma‐Aldrich).
7‐ Estándares
En la siguiente Tabla se relacionan los compuestos químicos utilizados
para preparar estándares de los analitos y de los potenciales interferentes
utilizados en las diferentes investigaciones experimentales recogidas en
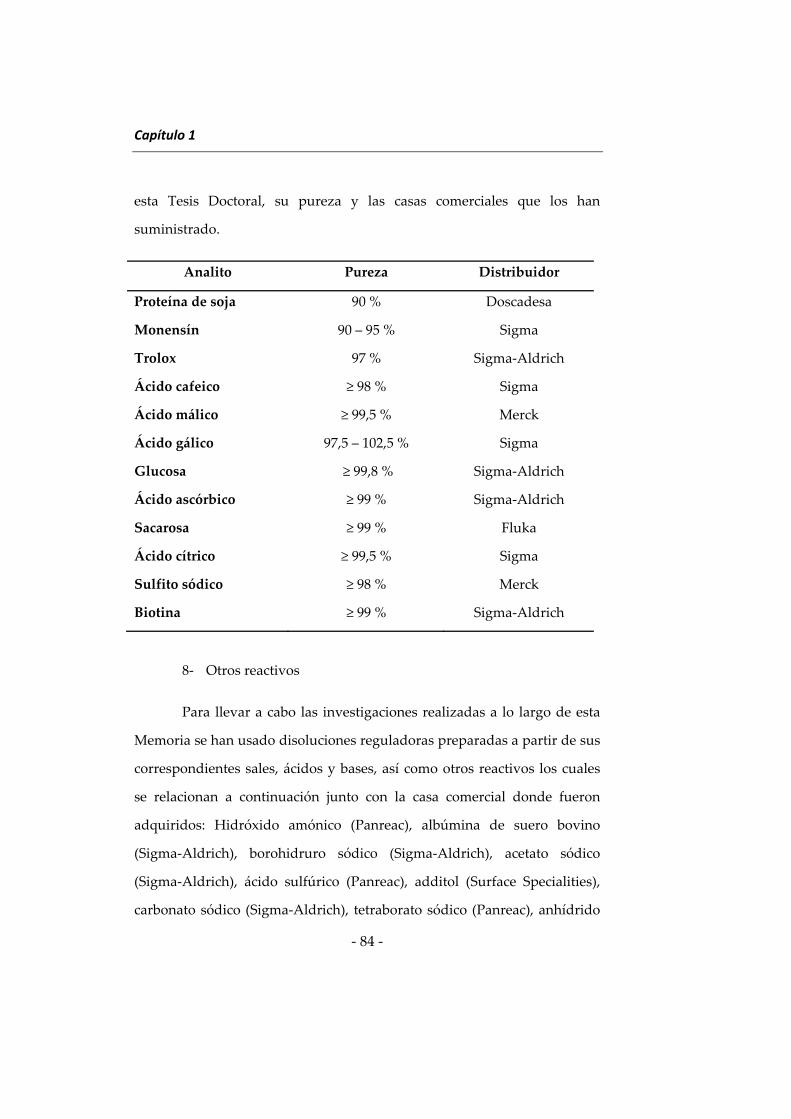
Capítulo 1
‐ 84 ‐
esta Tesis Doctoral, su pureza y las casas comerciales que los han
suministrado.
Analito Pureza Distribuidor
Proteína de soja 90 % Doscadesa
Monensín 90 – 95 % Sigma
Trolox 97 % Sigma‐Aldrich
Ácido cafeico ≥ 98 % Sigma
Ácido málico ≥ 99,5 % Merck
Ácido gálico 97,5 – 102,5 % Sigma
Glucosa ≥ 99,8 % Sigma‐Aldrich
Ácido ascórbico ≥ 99 % Sigma‐Aldrich
Sacarosa ≥ 99 % Fluka
Ácido cítrico ≥ 99,5 % Sigma
Sulfito sódico ≥ 98 % Merck
Biotina ≥ 99 % Sigma‐Aldrich
8‐ Otros reactivos
Para llevar a cabo las investigaciones realizadas a lo largo de esta
Memoria se han usado disoluciones reguladoras preparadas a partir de sus
correspondientes sales, ácidos y bases, así como otros reactivos los cuales
se relacionan a continuación junto con la casa comercial donde fueron
adquiridos: Hidróxido amónico (Panreac), albúmina de suero bovino
(Sigma‐Aldrich), borohidruro sódico (Sigma‐Aldrich), acetato sódico
(Sigma‐Aldrich), ácido sulfúrico (Panreac), additol (Surface Specialities),
carbonato sódico (Sigma‐Aldrich), tetraborato sódico (Panreac), anhídrido
Herramientas Analíticas
‐ 85 ‐
glutárico (Sigma), monohidrógeno fosfato potásico (Merck), vainillina
(Aldrich), metaperyodato sódico (Scharlau), ácido clorhídrico (Merck), N‐
(3‐dimetilaminopropil)‐N´‐etilcarbodiimida (EDAC) (Sigma‐Aldrich),
diclorhidrato 2,2´‐azobis(2‐metilpropionamida) (AAPH) (Aldrich), piridina
(Sigma), sulfo‐N‐hidroxisuccinimida (sulfo‐NHS) (Sigma‐Aldrich),
glutaraldehido (Sigma), disolución DELFIA (Perkin Elmer life and
Analytical Sciences, enzima laccasa (Sigma), nitrato de terbio (Aldrich),
tampón ensayo para reacciones de bioafinidad y disolución de lavado para
placas de ensayos de bioafinidad (Innotrac diagnostic Oy), cloruro sódico
(Sigma‐Aldrich) y reactivo de Folin‐Ciocalteau (Sigma‐Aldrich).
Instrumentación
En el desarrollo experimental de esta Memoria se ha utilizado la
siguiente instrumentación:
‐ Lector de microplacas 1420 Multilabel Counter Victor 3V (Perkin
Elmer and Analytical Sciences, Wallac Oy, Turku, Finlandia).
‐ Espectrofluorímetro SLM Aminco modelo 8100 (Urbana, IL, USA)
equipado con una lámpara de arco de xenón de 450 W y un tubo
fotomultiplicador R928.
‐ Plate Chameleon (Hidex Oy, Turku) equipped with a 200mW
infrared laser module (Roithner Lasertechnik) and RG‐850 nm
long‐pass excitation filter (Andover Corp., Salem, NH). The
photomultiplier tube in the plate fluorometer was replaced with
Hamamatsu R4632 (Hamamatsu Photonics K.K.).
Capítulo 1
‐ 86 ‐
‐ Microscopio electrónico de transmisión Philips CM‐10, resolución
0,5 nm x 0,34 nm, y equipado con una cámara digital megaview III.
Rejillas de cobre (200C‐FC) recubiertas con unas película de
carbono Formvar® 200 mesh, suministradas por Aname (Madrid,
España).
‐ Espectrofotómetro Lambda 35 UV/VIS (Perkin Elmer, Reino
Unido).
Programas informáticos
Se emplearon diferentes programas informáticos para el cálculo
estadístico y elaboración de las diferentes representaciones gráficas: Origin
7,0 (ORIGIN LAB), Statgraphics 5.1, Microsoft Excel y Sigma Plot 7.0.
CAPÍTULO 2 CHAPTER 2
Síntesisycaracterizacióndenanopartículasdesílicecon
fluorescenciaalargalongituddeondaysuaplicaciónalanálisisde
alimentos
Synthesisandcharacterizationoflong‐wavelengthfluorescentsilicananoparticlesandtheirapplication
tofoodanalysis

Síntesis de nanopartículas de sílice y su aplicación
‐ 89 ‐
Este capítulo recoge las investigaciones realizadas para desarrollar
nuevos métodos de análisis utilizando conjuntamente las prestaciones que
ofrecen la nanotecnología y la fluorimetría de larga longitud de onda. Se
describe la síntesis y caracterización de nanopartículas de sílice (SiO2NPs)
dopadas con oxazinas y se demuestra su utilidad en análisis de alimentos
mediante inmunoensayo heterogéneo. Los estudios realizados han dado
lugar a los siguientes artículos:
- Synthesis and characterization of oxazine‐doped silica
nanoparticles for their potential use as stable fluorescent reagents.
J. Godoy‐Navajas, M.P. Aguilar‐Caballos, A. Gómez‐Hens, Journal
of Fluorescence, 20 (2010) 171‐180.
- Heterogeneous immunoassay for soy protein determination using
nile blue‐doped silica nanoparticles as labels and front‐surface
long‐wavelength fluorimetry. J. Godoy‐Navajas, M.P. Aguilar
Caballos, A. Gómez‐Hens. Analytica Chimica Acta, 701 (2011) 194‐
199.
- Determination of monensin in milk samples by front‐surface long‐
wavelength fluoroimmunoassay using nile blue‐doped silica
nanoparticles as labels. J. Godoy‐Navajas, M. P. Aguilar‐Caballos,
A. Gómez‐Hens, Talanta, 94 (2012) 195‐200.
Cabe indicar que las investigaciones desarrolladas han tenido dos
objetivos: 1) Estudiar la potencial versatilidad de estas NPs con
Capítulo 2
‐ 90 ‐
fluorescencia a larga longitud de onda para aplicarlas a la determinación
de macromoléculas y moléculas pequeñas; y 2) Demostrar que los
marcadores basados en SiO2NPs dopadas con oxacinas pueden constituir
una alternativa útil frente a los marcadores enzimáticos. Para alcanzar
estos objetivos se han seleccionado las proteínas de soja y el antibiótico
monensin debido a que un porcentaje elevado de los métodos descritos
para la determinación de estos analitos en alimentos utiliza técnicas de
inmunoensayo, principalmente enzimoinmunoensayo [1,2]. Aunque
posteriormente se discutirán los resultados obtenidos, se ha demostrado
que las nuevas NPs pueden utilizarse satisfactoriamente para determinar
ambos tipos de analitos y que los correspondientes inmunoensayos
desarrollados presentan menores límites de detección que los basados en el
uso de marcadores enzimáticos, siendo también menor la duración de los
ensayos.
Otro aspecto a destacar es la contribución de las investigaciones
realizadas a expandir el uso de las SiO2NPs dopadas con fluoróforos en
análisis de alimentos, poniendo de manifiesto la utilidad del efecto
protector de las NPs en las propiedades fluorescentes del reactivo
encapsulado. Como se ha indicado en la Introducción general de esta
Memoria, dentro de los escasos antecedentes descritos, cabe citar el uso
reciente de SiO2NPs dopadas con un quelato de rutenio para la
determinación de residuos del antibiótico enrofloxacina en carne de pollo
utilizando inmunocromatografía en membranas desechables de
nitrocelulosa [3].
Síntesis de nanopartículas de sílice y su aplicación
‐ 91 ‐
BIBLIOGRAFÍA
(1) D.L. Brandon, M. Friedman. Immunoassays of soy proteins. J.
Agric. Food Chem. (2002) 50, 6635‐6642.
(2) A.C. Huet, M. Bienenmann‐Ploum, U. Vincent, P. Delahaut.
Screening methods and recent developments in the detection of
anticoccidials. Anal. Bioanal. Chem. (2013) 405, 7733‐7751.
(3) X. Huang, Z. P. Aguilar, H. Li, W. Lai, H. Wei, H. Xu, Y. Xiong.
Fluorescent Ru(phen)32+‐doped silica nanoparticles‐based ICTS
sensor for quantitative detection of enrofloxacin residues in chicken
meat. Anal. Chem. (2013) 85, 5120 – 5128.
Chapter 2
‐ 92 ‐
This chapter contains the investigations performed to develop new
analytical methods by combining the benefits of nanotechnology and long‐
wavelength fluorometry. The synthesis and characterization of silica
nanoparticles (SiO2NPs) doped with oxazine dyes is described and their
usefulness in food analysis by the development of heterogeneous
immunoassays is shown. These investigations have given rise to the
following articles:
- Synthesis and characterization of oxazine‐doped silica
nanoparticles for their potential use as stable fluorescent reagents.
J. Godoy‐Navajas, M.P. Aguilar‐Caballos, A. Gómez‐Hens, Journal
of Fluorescence, 20 (2010) 171‐180.
- Heterogeneous immunoassay for soy protein determination using
nile blue‐doped silica nanoparticles as labels and front‐surface
long‐wavelength fluorimetry. J. Godoy‐Navajas, M.P. Aguilar
Caballos, A. Gómez‐Hens. Analytica Chimica Acta, 701 (2011) 194‐
199.
- Determination of monensin in milk samples by front‐surface long‐
wavelength fluoroimmunoassay using nile blue‐doped silica
nanoparticles as labels. J. Godoy‐Navajas, M. P. Aguilar‐Caballos,
A. Gómez‐Hens, Talanta, 94 (2012) 195‐200.
The investigations performed had two main objectives: 1) To study
the potential versatility of the synthesized long‐wavelength fluorescent
Synthesis of silica nanoparticles and their application
‐ 93 ‐
NPs to be applied to the determination of macromolecules and low‐
molecular weight compounds; and 2) To demonstrate that the tracers
based on oxazine‐doped SiO2NPs can be a useful alternative to enzyme
tracers. To achieve these goals, soy proteins and the antibiotic monensin
have been selected as analytes owing to the fact that a high percentage of
analytical methods reported for their determination are based on
immunoassays, and more specifically, on enzyme immunoassays [1,2].
Although the results obtained will be discussed below, it is worth to
mention that the new NPs can be satisfactorily used to determine both
types of analytes and the immunoassays developed feature lower detection
limits and shorter analysis times than those based on the use of enzyme
tracers.
Another salient aspect of these investigations is their contribution
to expand the use of SiO2NPs doped with fluorophores in food analysis,
where the protecting role of NPs on the fluorescent properties of the
encapsulated reagent has been shown. As it has been already mentioned in
the Introduction of this Dissertation, there are a scarce number of
applications of these NPs in food analysis. A recent example is the use of
SiO2NPs doped with a ruthenium chelate to determine enrofloxacin
antibiotic residues in chicken muscle using immunochromatography on
disposable nitrocellulose membranes [3].
Chapter 2
‐ 94 ‐
LITERATURE
(1) D.L. Brandon, M. Friedman. Immunoassays of soy proteins. J.
Agric. Food Chem. (2002) 50, 6635‐6642.
(2) A.C. Huet, M. Bienenmann‐Ploum, U. Vincent, P. Delahaut.
Screening methods and recent developments in the detection of
anticoccidials. Anal. Bioanal. Chem. (2013) 405, 7733‐7751.
(3) X. Huang, Z. P. Aguilar, H. Li, W. Lai, H. Wei, H. Xu, Y. Xiong.
Fluorescent Ru(phen)32+‐doped silica nanoparticles‐based ICTS
sensor for quantitative detection of enrofloxacin residues in chicken
meat. Anal. Chem. (2013) 85, 5120 – 5128.
Síntesis de nanopartículas de sílice y su aplicación
‐ 95 ‐
Synthesis and characterization of oxazine‐doped silica
nanoparticles for their potential use as stable fluorescent
reagents
J. Godoy‐Navajas, M.P. Aguilar‐Caballos, A. Gómez‐Hens
Department of Analytical Chemistry. University of Córdoba. Campus of Rabanales.
Marie‐Curie Annex building. 14071‐Córdoba
Abstract
The synthesis process to obtain silica nanoparticles (NPs) doped with
two oxazine dyes, nile blue and cresyl violet, has been investigated using a
modification of the reverse micelle microemulsion method and a procedure
based on the Stöber method. A micellar medium provided by the non‐ionic
surfactant Triton X‐100 in a hexanol:water mixture and an ethanol:water
mixture, have been used to provide the synthesis medium in each case.
Tetraethoxysilane has been used as the initiator of the polymerization and
condensation reactions after its hydrolysis in basic medium using ammonium
hydroxide. Dye‐silane precursor NPs have been also synthesized in order to
compare their potential advantages against the NPs obtained by the direct
encapsulation of the oxazine dyes.
Size distribution and fluorescence of the synthesized NPs, which were
monitored using Transmision Electron Microscopy (TEM) and a microplate
reader, respectively, depend on the molar ratio and total concentration of the
reagents involved in the synthesis. NPs obtained using the developed
synthesis procedures had sizes below 400 nm in most instances and the best
luminescent properties were observed for NPs with sizes ranging from 100 to
300 nm. Lower sizes result in a decrease in the fluorescence intensities of these
nanomaterials. Parameters related with the luminescence features of these NPs
were calculated in order to compare the feasibility of both synthesis
approaches. The repeatability of the reverse‐micelle microemulsion procedure
performed in different days gave a relative standard deviation of 10% for the
fluorescence intensity values.
Keywords: Dye‐doped silica nanoparticles; cresyl violet; nile blue; long‐wavelength
fluorescence
Journal of Fluorescence (2010) 20:171‐180
Capítulo 2
‐ 96 ‐
1. Introduction
The use of nanomaterials is having a huge impact in the bioanalysis
field [1‐9], being their composition and physicochemical properties the
main factors to choose the detection system best suited for each assay. The
use of silica NPs as labels is interesting in bioassays with optical detection
because of the transparency of silica to visible light. Other desirable
properties are: 1) silica polymerization chemistry is well known, 2) silica
material is not microbiologically degraded, and 3) porosity or swelling
changes of silica NPs do not happen at moderate pH variations. However,
the porosity of these materials can originate drawbacks in their
performance as labels due to losses of the encapsulated substances as it will
be discussed below.
Different silica precursors, such as tetramethoxysilane (TMOS) and
tetraethoxysilane (TEOS) are commonly used to synthesize silica NPs.
These precursors undergo hydrolysis and polycondensation reactions,
which result in the formation of monodisperse spherical silica particles
[10]. There are two general routes to synthesize silica NPs, namely reverse‐
micelle microemulsion and Stöber methods. The reverse‐micelle
microemulsion method relies on the formation of a water‐in‐oil
microemulsion formed by a small amount of water, an organic solvent and
a surfactant. Water nanodroplets inside the reverse micelles act as reactors
in which the growth of silica NPs takes place. The Stöber method involves
the hydrolysis of the silica precursor in an alcohol/water mixture and the
silicic acid formed nucleates and condenses to give rise to spherical
monodisperse NPs. The choice of every synthesis approach depends on the
physicochemical properties of the species to be encapsulated [2, 4, 6]. In
Síntesis de nanopartículas de sílice y su aplicación
‐ 97 ‐
general, hydrophobic and hydrophilic dyes can be encapsulated by using
the Stöber method whereas the reverse‐micelle microemulsion method has
been mainly used for the synthesis of metal‐chelate doped silica NPs [2, 4].
An advantage of the reverse‐micelle microemulsion method is that usually
provides NPs with narrower size distributions than those obtained by the
Stöber method2.
A common issue to both synthesis approaches is the probability of
dye leakage, especially for organic dyes. This phenomenon can be
minimized or avoided by coupling the organic fluorophor to hydrophilic
species with high molecular weight, such as dextrans [11] or proteins [12],
for two reasons: 1) the resulting derivative is hydrophilic as the silica
matrix, and 2) the large size of the macromolecule can prevent the
diffusion through silica matrix pores. Another option is the synthesis of
precursors by covalent linking of the dye or a derivative, usually
containing carboxyl [13], sulfonyl chloride [14] and isothiocyanate [15]
groups, to a silane precursor, previously to the synthesis of silica NPs.
Metal chelates and organic dyes have been traditionally used as
labels in bioassays with luminescent detection [7]. Conventional fluoro‐
phores, such as fluorescein isothiocyanate, fluorescamine or umbelliferone
derivatives, provide the achievement of relatively low detection limits, but
these compounds suffer from photobleaching processes due to the
relatively high energy of their incident excitation wavelengths. However,
this drawback can be minimized by embedding these dyes into a silica
matrix, which protects them from environmental factors that would affect
their fluorescence [2, 6]. Another limitation of conventional fluorophores is
that their emission can be overlapped by static background fluorescence
Capítulo 2
‐ 98 ‐
signals from sample matrix, which usually happens at short wavelengths.
An alternative is the use of long‐wavelength fluorophores, such as organic
dyes (cyanines, oxazines, alexa dyes) and lanthanide and ruthenium
chelates [16‐18].
The work presented here encompasses different approaches to
synthesize long‐wavelength emitting silica NPs doped with cresyl violet
acetate and nile blue chloride for the first time. Two different sol‐gel
methods, based on the modification of the reverse‐micelle microemulsion
and Stöber approaches and on the use of the silane precursor TEOS and
ammonium hydroxide, have been developed for the direct encapsulation
of the fluorophore. The fluorescence of the NPs obtained by the first
method has been improved in the absence of cyclohexane, which is used in
the conventional procedure. The reverse‐micelle microemulsion method
has been also applied to the encapsulation of a newly synthesized silane
precursor from nile blue chloride using glutaraldehyde and 3‐aminopropyl
triethoxysilane (APS). The influence of the different reagents on the
features of the NPs formed in both synthesis procedures has been studied
and optimized by measuring the fluorescence intensity using a microplate
reader and the NP size by Transmission Electron Microscopy (TEM). The
luminescent features of the NPs synthesized by both methods have been
compared in order to select the synthesis procedure more suitable to obtain
nanomaterials useful as stable fluorescent reagents for analytical purposes,
such as labels in fluoroimmunoassays. Some properties of these long‐
wavelength emitting NPs, such as photodegradability, chemical stability
and dye leakage are also discussed.
Síntesis de nanopartículas de sílice y su aplicación
‐ 99 ‐
2. Experimental
2.1. Instrumentation
A 1420 Multilabel counter Victor 3V microplate reader (Perkin
Elmer and Analytical Sciences, Wallac Oy, Turku, Finland) was used to
perform fluorescence measurements. Different filters (nominal
wavelength/passband) were used to select the excitation (531/25 nm and
590/7 nm for cresyl violet, 620/8 nm for nile blue) and emission (620/8 nm
for cresyl violet, 680/10 nm for nile blue) wavelengths of the doped NPs.
An SLM‐Aminco (Urbana, IL, USA), Model 8100 photon‐counting
spectrofluorimeter, equipped with a 450 W xenon arc source and a R928
photomultiplier tube, was used to perform fluorescence excitation and
emission scans of pure dyes and synthesized NPs, as well as
photobleaching experiments. Size characterization was performed by
Transmision Electron Microscopy (TEM), using a CM10 Philips
Microscope. Copper grids (200C‐FC) coated with a Formvar® carbon film
200 mesh supplied by Aname (Madrid, Spain) were used as support in
TEM experiments.
2.2. Reagents
All reagents were of analytical grade. 3‐Aminopropyl
triethoxysilane (APS) was obtained from Aldrich (Aldrich, Milwaukee,
USA), and tetraethoxysilane (TEOS) and Triton X‐100 from Fluka (Buch,
Switzerland). Cresyl violet acetate, nile blue chloride and 25%
glutaraldehyde aqueous solution (Grade II) were supplied by Sigma (St
Louis, MO, USA) and absolute ethanol, acetone and ammonium hydroxide
(25% as NH3) by Panreac (Castellar del Vallès, Spain). Cyclohexane was
Capítulo 2
‐ 100 ‐
supplied by Probus (Badalona, España) and 1‐hexanol by Merck
(Schuchardt, Germany). Cresyl violet and nile blue solutions (1 x 10‐3 M)
were prepared by dissolving the appropriate amount of each dye in the
minimum amount of methanol and then, raised up with distilled water
until a final concentration of methanol of 10%, and stirring the mixture for
24 h.
2.3. Procedures
2.3.1. Synthesis of cresyl violet and nile blue‐doped silica NPs by a modified
reverse micelle microemulsion method
The synthesis was performed according to the following procedure:
an amount of Triton X‐100 (510 ‒ 530 mg or 0.79 ‒ 0.82 mmol) was
dissolved in 9.6 ml (0.53 mol) of distilled water by stirring vigorously this
mixture for 5 min. Then, a volume of 100 μl (0.44 mmol) of TEOS was
added and the solution was stirred for 5 min. A volume (1.8 ml) of 10‐3 M
(1.8 μmol) cresyl violet or nile blue was added and the mixture stirred
again for 5 min. Afterwards, 3 ml (0.024 mol) of hexanol were added and
the microemulsion formed was stirred for 15 min. Concentrated
ammonium hydroxide (70 μl, 0.9 mmol) was then added and the mixture
stirred for 5 min to start the TEOS hydrolysis and condensation reactions.
The mixture was then placed in a thermostated tank at 35 °C for 7.5 h in the
dark.
The reaction mixture of each fluorophore‐doped NPs, which was
composed by two phases clearly differenciated, was centrifuged for 5 min
at 2.000 rpm to complete the separation of two phases. The upper phase,
which was strongly colored, was extracted and 5 ‒ 7 ml of acetone were
Síntesis de nanopartículas de sílice y su aplicación
‐ 101 ‐
added to break the microemulsion formed, and the precipitate was
separated by centrifugation for 20 min at 3000 rpm. Then, NPs were
washed with ethanol using ultrasound sonication for 30 s to desorb the
fluorophore from the NP surface and then centrifuged for 5 min at 10000
rpm to get rid of unreacted precursors and the excess of surfactant and
fluorophore. The washing process was repeated several times with ethanol
and distilled water until the fluorescence signal of the supernatant was the
same as the blank signal. NPs were finally re‐dispersed in 1 ml of distilled
water.
2.3.2. Synthesis of cresyl‐violet doped NPs using a Stöber method‐based procedure
To a volume of 25 ml of ethanol (0.43 mol) were added 500 μl of 10‐3
M (0.5 μmol) cresyl violet. Then, 1 ml (4.4 mmol) of TEOS and 1.5 ml (19.5
mmol) of concentrated ammonium hydroxide solution were added. The
mixture was stirred for 1 hour at room temperature. After this time, it was
centrifuged at 3.000 rpm for 10 minutes. The NPs synthesized were
purified by washing them with ethanol and water for several times as
mentioned above for the reverse micelle microemulsion method.
2.3.3. Synthesis of NPs using nile blue‐APS precursor as fluorophore
A volume (12 ml) of 8.9 x 10‐4 M (10 μmol) nile blue solution was
mixed with 100 μl of 1% glutaraldehyde (10 μmol) aqueous solution and,
immediately after, 20 μl (85 μmol) of APS were added and the mixture
stirred for 5 min before its use in the reverse‐micelle microemulsion
method above described. A volume (1.2 ml) of the reaction mixture,
Capítulo 2
‐ 102 ‐
without any additional purification step, was added to the mixture instead
of the unchanged fluorophore.
2.3.4. Characterization of cresyl violet‐ and nile blue‐doped silica NPs
Synthesized NPs were characterized by TEM and fluorescence
intensity measurements. TEM experiments were carried out by spotting 10‐
μl drops of NP suspensions in ethanol onto the copper grids, which were
placed above a filter paper and let to dry at room temperature for several
minutes. Fluorescence measurements were obtained by dispensing aliquots
of 200 μl of NP suspensions onto microwells in triplicate and using the
filters above described to choose the adequate excitation and emission
wavelengths.
2.3.5. Fluorescence stability of oxazine‐doped silica NPs
Silica NPs were divided in five 1‐ml aliquots in Eppendorf tubes.
All of them were washed several times with ethanol and water until the
supernatants presented a fluorescence intensity corresponding to the blank
signal and, then, NPs were stored at 4 °C. At the time of the performance of
the fluorescence measurements, each aliquot was sonicated for 30 s and
then centrifuged at 10.000 rpm for 5 min to remove the supernatant. Then,
they were again reconstituted and re‐dispersed in water. A volume (200 μl)
of the NP suspension was added to a microwell plate and the fluorescence
intensity was measured in triplicate.
Síntesis de nanopartículas de sílice y su aplicación
‐ 103 ‐
2.3.6. Photobleaching study of oxazine‐doped silica NPs
Free organic dye solution or dye‐doped NP dispersion was placed
in a quartz cuvette and the fluorescence intensity was measured at the
corresponding maximum excitation and emission wavelengths by
continuosly irradiating the cuvette with light from the 450 W xenon arc
lamp of the photon counting spectrofluorimeter. Fluorescence intensity
measurements were monitored at room temperature for 1 h, with an
integration time of 1.0 min.
3. Results and Discussion
3.1. Synthesis of cresyl‐violet‐ and nile blue‐doped silica NPs
Both synthesis approaches were optimized by using mainly the
univariate method although, in some instances, the influence of variable
ratios of the reagents was also studied.
3.1.1 Optimization of reverse micelle microemulsion method
As indicated above, the formation of microemulsions involves the
use of a surfactant, an aqueous solution and an organic solvent. Depending
on the relative amounts of the components, water‐in‐oil microemulsions
(rich in organic solvent) or oil‐in‐water microemulsions (rich in water) can
be formed. In the first case, a co‐surfactant, generally a medium or long
hydrocarbon chain alcohol, is often incorporated in the micelles.
Cyclohexane, n‐hexanol, Triton X‐100 and water were chosen to develop
the reverse‐micelle microemulsion method, according to the procedures
previously reported [2, 4, 6, 12‐14]. These approaches involve continuous
mechanical stirring to originate stable water‐in‐oil microemulsions.
Capítulo 2
‐ 104 ‐
However, the use of the experimental conditions previously described did
not give rise to satisfactory results for the synthesis of the oxazine‐doped
silica NPs. The study of the stirring conditions showed that, after mixing
the reagents in the addition order described in the procedure and then
leaving the mixture to stand, two phases appeared: an upper phase (rich in
organic solvent) and a lower phase (rich in water). The upper phase, which
was strongly coloured, was a stable water‐in‐oil microemulsion containing
the brightest NPs.
Studies carried out about the microemulsion composition revealed
that NPs can be synthesized in the absence of cyclohexane, yielding NPs
with similar features (number, size) but with slightly higher fluorescence
intensity than that obtained using cyclohexane. Figure 1 shows TEM
images of the NPs obtained in the presence of different volumes of
cyclohexane. The water volume was also modified to keep constant the
total volume. As can be seen, the amount and sizes of NPs synthesized in
the absence of cyclohexane (Figure 1a) were comparable to those achieved
using 7.5 ml of cyclohexane (Figure 1c). However, the use of intermediate
volumes of cyclohexane (Figure 1b) provided larger NPs with wider size
distributions. According to these results, the use of cyclohexane was
precluded and only water, Triton X‐100 and 1‐hexanol were the main
components of the microemulsion.
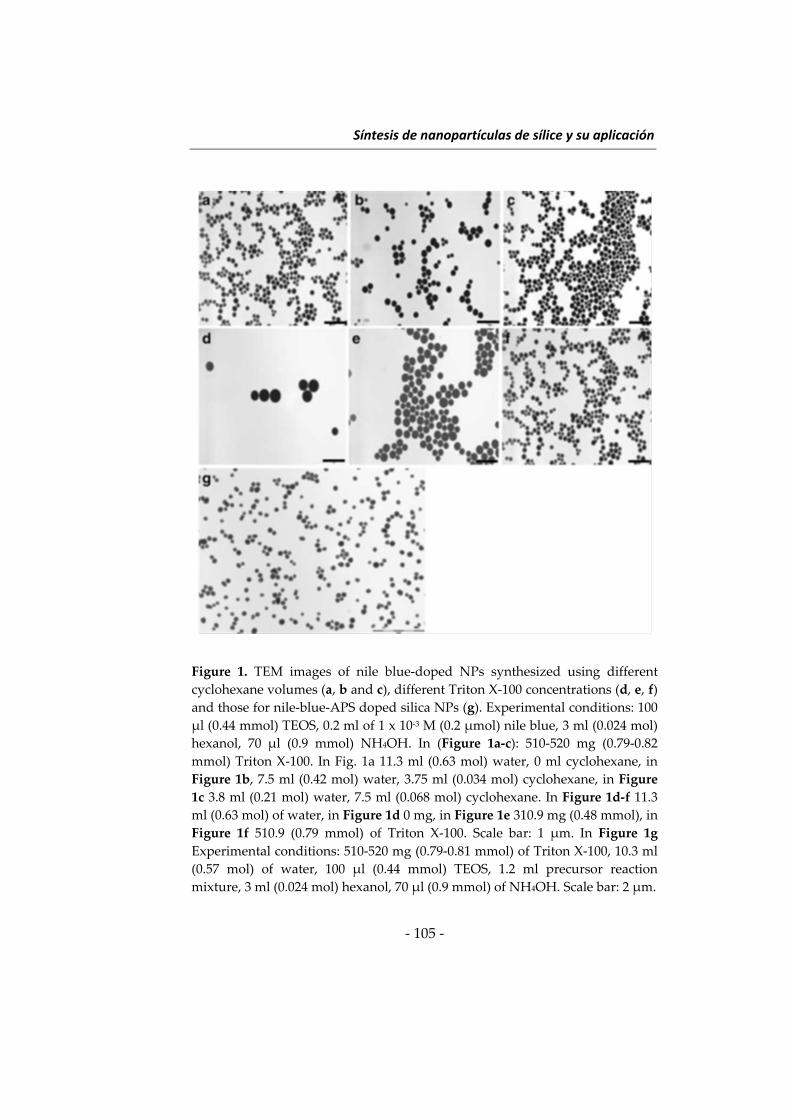
Síntesis de nanopartículas de sílice y su aplicación
‐ 105 ‐
Figure 1. TEM images of nile blue‐doped NPs synthesized using different
cyclohexane volumes (a, b and c), different Triton X‐100 concentrations (d, e, f)
and those for nile‐blue‐APS doped silica NPs (g). Experimental conditions: 100
μl (0.44 mmol) TEOS, 0.2 ml of 1 x 10‐3 M (0.2 μmol) nile blue, 3 ml (0.024 mol)
hexanol, 70 μl (0.9 mmol) NH4OH. In (Figure 1a‐c): 510‐520 mg (0.79‐0.82
mmol) Triton X‐100. In Fig. 1a 11.3 ml (0.63 mol) water, 0 ml cyclohexane, in
Figure 1b, 7.5 ml (0.42 mol) water, 3.75 ml (0.034 mol) cyclohexane, in Figure
1c 3.8 ml (0.21 mol) water, 7.5 ml (0.068 mol) cyclohexane. In Figure 1d‐f 11.3
ml (0.63 mol) of water, in Figure 1d 0 mg, in Figure 1e 310.9 mg (0.48 mmol), in
Figure 1f 510.9 (0.79 mmol) of Triton X‐100. Scale bar: 1 μm. In Figure 1g
Experimental conditions: 510‐520 mg (0.79‐0.81 mmol) of Triton X‐100, 10.3 ml
(0.57 mol) of water, 100 μl (0.44 mmol) TEOS, 1.2 ml precursor reaction
mixture, 3 ml (0.024 mol) hexanol, 70 μl (0.9 mmol) of NH4OH. Scale bar: 2 μm.
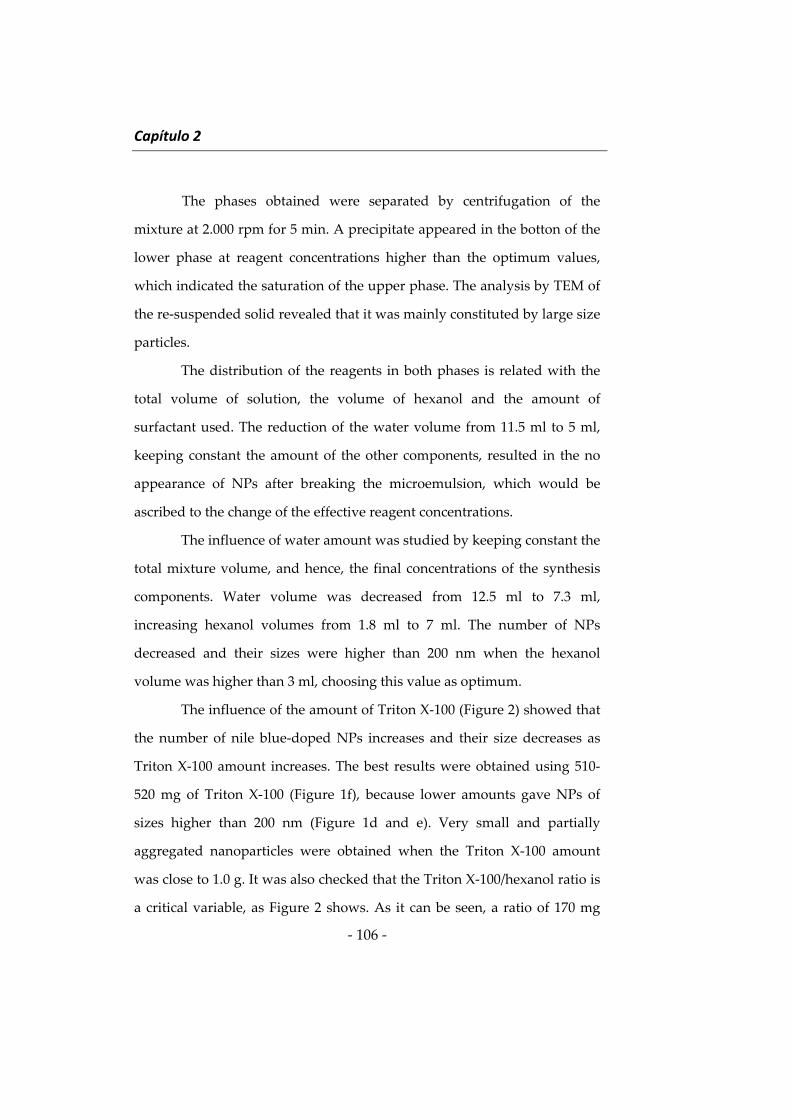
Capítulo 2
‐ 106 ‐
The phases obtained were separated by centrifugation of the
mixture at 2.000 rpm for 5 min. A precipitate appeared in the botton of the
lower phase at reagent concentrations higher than the optimum values,
which indicated the saturation of the upper phase. The analysis by TEM of
the re‐suspended solid revealed that it was mainly constituted by large size
particles.
The distribution of the reagents in both phases is related with the
total volume of solution, the volume of hexanol and the amount of
surfactant used. The reduction of the water volume from 11.5 ml to 5 ml,
keeping constant the amount of the other components, resulted in the no
appearance of NPs after breaking the microemulsion, which would be
ascribed to the change of the effective reagent concentrations.
The influence of water amount was studied by keeping constant the
total mixture volume, and hence, the final concentrations of the synthesis
components. Water volume was decreased from 12.5 ml to 7.3 ml,
increasing hexanol volumes from 1.8 ml to 7 ml. The number of NPs
decreased and their sizes were higher than 200 nm when the hexanol
volume was higher than 3 ml, choosing this value as optimum.
The influence of the amount of Triton X‐100 (Figure 2) showed that
the number of nile blue‐doped NPs increases and their size decreases as
Triton X‐100 amount increases. The best results were obtained using 510‐
520 mg of Triton X‐100 (Figure 1f), because lower amounts gave NPs of
sizes higher than 200 nm (Figure 1d and e). Very small and partially
aggregated nanoparticles were obtained when the Triton X‐100 amount
was close to 1.0 g. It was also checked that the Triton X‐100/hexanol ratio is
a critical variable, as Figure 2 shows. As it can be seen, a ratio of 170 mg
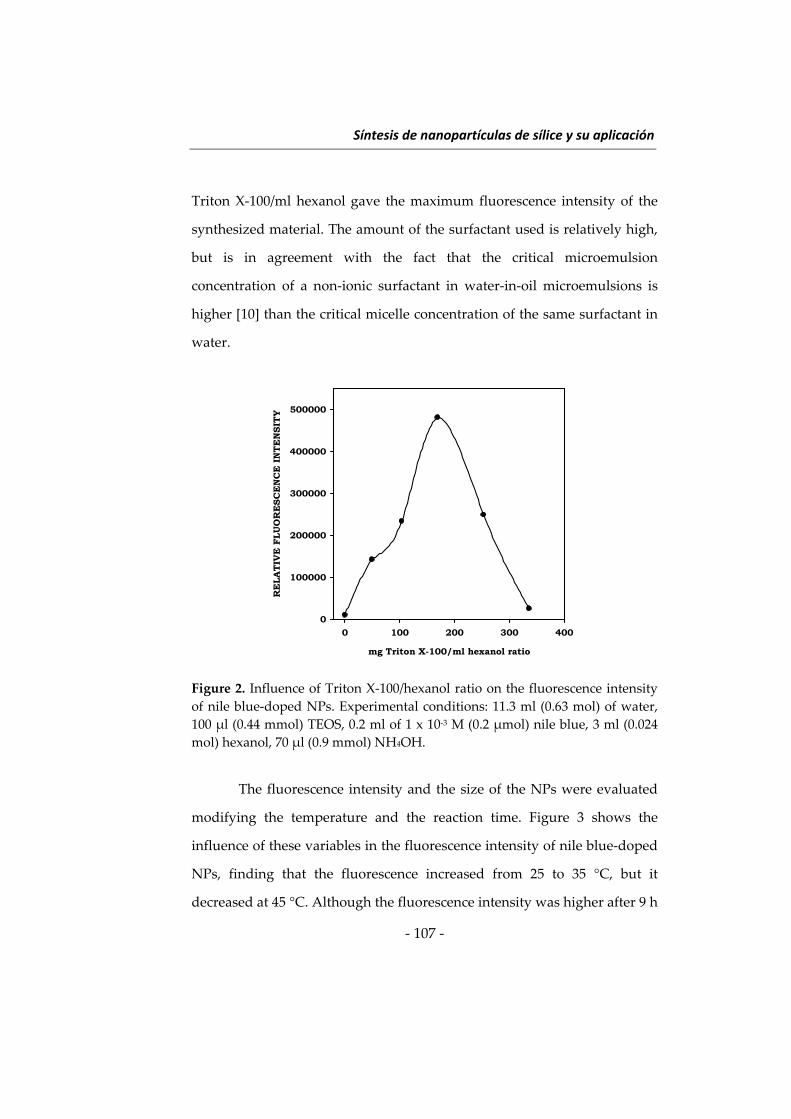
Síntesis de nanopartículas de sílice y su aplicación
‐ 107 ‐
Triton X‐100/ml hexanol gave the maximum fluorescence intensity of the
synthesized material. The amount of the surfactant used is relatively high,
but is in agreement with the fact that the critical microemulsion
concentration of a non‐ionic surfactant in water‐in‐oil microemulsions is
higher [10] than the critical micelle concentration of the same surfactant in
water.
Figure 2. Influence of Triton X‐100/hexanol ratio on the fluorescence intensity
of nile blue‐doped NPs. Experimental conditions: 11.3 ml (0.63 mol) of water,
100 μl (0.44 mmol) TEOS, 0.2 ml of 1 x 10‐3 M (0.2 μmol) nile blue, 3 ml (0.024
mol) hexanol, 70 μl (0.9 mmol) NH4OH.
The fluorescence intensity and the size of the NPs were evaluated
modifying the temperature and the reaction time. Figure 3 shows the
influence of these variables in the fluorescence intensity of nile blue‐doped
NPs, finding that the fluorescence increased from 25 to 35 °C, but it
decreased at 45 °C. Although the fluorescence intensity was higher after 9 h
mg Triton X-100/ml hexanol ratio
0 100 200 300 400
RE
LA
TIV
E F
LU
OR
ESC
EN
CE
IN
TE
NSIT
Y
0
100000
200000
300000
400000
500000
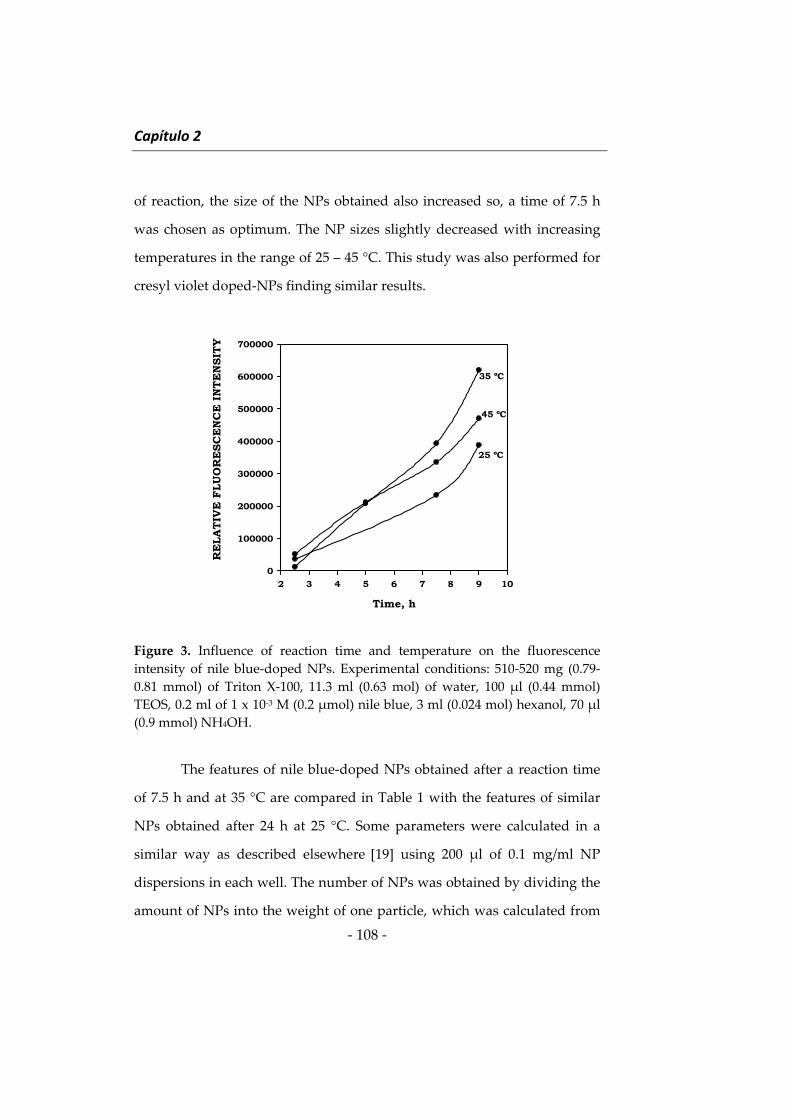
Capítulo 2
‐ 108 ‐
of reaction, the size of the NPs obtained also increased so, a time of 7.5 h
was chosen as optimum. The NP sizes slightly decreased with increasing
temperatures in the range of 25 – 45 °C. This study was also performed for
cresyl violet doped‐NPs finding similar results.
Figure 3. Influence of reaction time and temperature on the fluorescence
intensity of nile blue‐doped NPs. Experimental conditions: 510‐520 mg (0.79‐
0.81 mmol) of Triton X‐100, 11.3 ml (0.63 mol) of water, 100 μl (0.44 mmol)
TEOS, 0.2 ml of 1 x 10‐3 M (0.2 μmol) nile blue, 3 ml (0.024 mol) hexanol, 70 μl
(0.9 mmol) NH4OH.
The features of nile blue‐doped NPs obtained after a reaction time
of 7.5 h and at 35 °C are compared in Table 1 with the features of similar
NPs obtained after 24 h at 25 °C. Some parameters were calculated in a
similar way as described elsewhere [19] using 200 μl of 0.1 mg/ml NP
dispersions in each well. The number of NPs was obtained by dividing the
amount of NPs into the weight of one particle, which was calculated from
Time, h
2 3 4 5 6 7 8 9 10
RE
LA
TIV
E F
LU
OR
ESC
EN
CE
IN
TE
NSIT
Y
0
100000
200000
300000
400000
500000
600000
700000
35 ºC
45 ºC
25 ºC
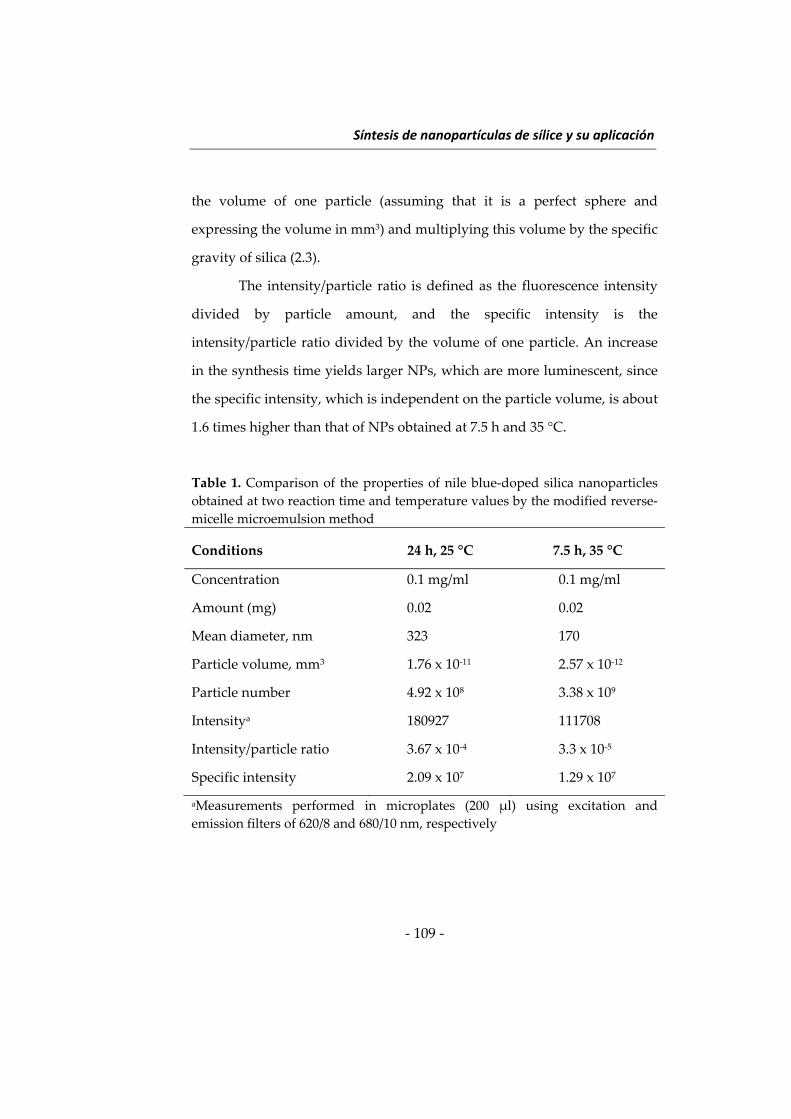
Síntesis de nanopartículas de sílice y su aplicación
‐ 109 ‐
the volume of one particle (assuming that it is a perfect sphere and
expressing the volume in mm3) and multiplying this volume by the specific
gravity of silica (2.3).
The intensity/particle ratio is defined as the fluorescence intensity
divided by particle amount, and the specific intensity is the
intensity/particle ratio divided by the volume of one particle. An increase
in the synthesis time yields larger NPs, which are more luminescent, since
the specific intensity, which is independent on the particle volume, is about
1.6 times higher than that of NPs obtained at 7.5 h and 35 °C.
Table 1. Comparison of the properties of nile blue‐doped silica nanoparticles
obtained at two reaction time and temperature values by the modified reverse‐
micelle microemulsion method
Conditions 24 h, 25 °C 7.5 h, 35 °C
Concentration 0.1 mg/ml 0.1 mg/ml
Amount (mg) 0.02 0.02
Mean diameter, nm 323 170
Particle volume, mm3 1.76 x 10‐11 2.57 x 10‐12
Particle number 4.92 x 10⁸ 3.38 x 10⁹
Intensitya 180927 111708
Intensity/particle ratio 3.67 x 10‐4 3.3 x 10‐5
Specific intensity 2.09 x 10⁷ 1.29 x 10⁷
aMeasurements performed in microplates (200 μl) using excitation and
emission filters of 620/8 and 680/10 nm, respectively
Capítulo 2
‐ 110 ‐
The influence of ammonium hydroxide was studied in the range of
35 ‒ 140 μl of a commercial concentrated solution (0.45 ‒ 1.8 mmol). The
number of nile blue‐NPs formed was scarce at the limits of the assayed
interval, being also the fluorescence intensity obtained quite low (Figure
4a). The size of the NPs obtained increased in the range of 70 ‒ 610 nm of
diameter as NH4OH was increased. The decrease in the fluorescence
intensity at high NH4OH values would be ascribed to the partial
degradation of the fluorofore in the alkaline medium, as it has been
reported elsewhere for a cyanine dye [20]. The volume chosen as optimum
was 70 μl (0.9 mmol).
The influence of TEOS was evaluated for nile blue NPs in the range
of 50‐800 μl (0.22 – 3.52 mmol). Increasing TEOS volumes, the size of NPs
increased from 140 to 300 nm, obtaining sizes larger than 200 nm above 100
μl. These results were obtained under the optimal experimental conditions,
excepting for the fluorophore amount, which was ten times lower than the
optimum value. As it was found that the fluorescence intensity also
increased with the TEOS amount, a compromised solution was adopted
and 100 μl (0.44 mmol) of TEOS was chosen as the optimum value to
obtain intermediate sizes and intensities.
The amount of fluorophore used is a critical variable. The volume
of 1 x 10‐3 M aqueous nile blue solution was varied from 100 μl to 7.2 ml by
adjusting the total volume of the aqueous phase to 11.5 ml with distilled
water, in order to keep constant the initial concentrations of the other
reagents. The influence of this variable on the fluorescence intensity is
shown in Figure 4b, in which can be seen that the maximum value was
obtained using 1.8 μmol of nile blue. The decrease in the fluorescence
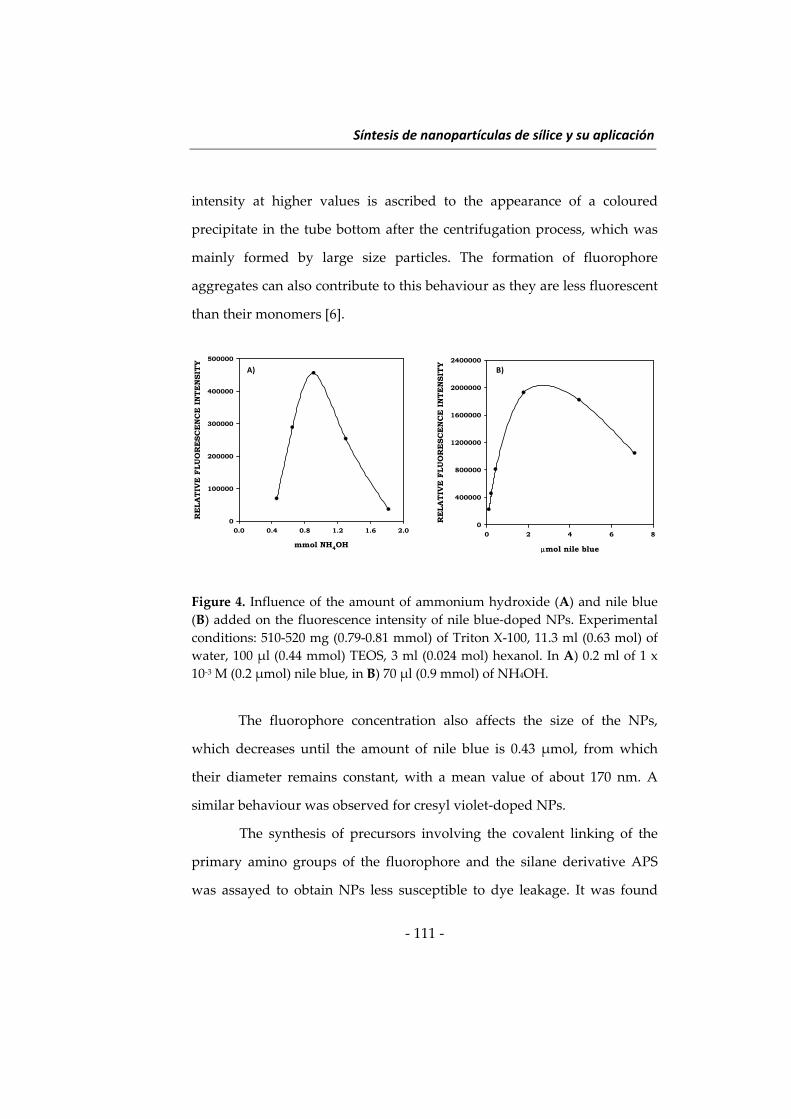
Síntesis de nanopartículas de sílice y su aplicación
‐ 111 ‐
intensity at higher values is ascribed to the appearance of a coloured
precipitate in the tube bottom after the centrifugation process, which was
mainly formed by large size particles. The formation of fluorophore
aggregates can also contribute to this behaviour as they are less fluorescent
than their monomers [6].
Figure 4. Influence of the amount of ammonium hydroxide (A) and nile blue
(B) added on the fluorescence intensity of nile blue‐doped NPs. Experimental
conditions: 510‐520 mg (0.79‐0.81 mmol) of Triton X‐100, 11.3 ml (0.63 mol) of
water, 100 μl (0.44 mmol) TEOS, 3 ml (0.024 mol) hexanol. In A) 0.2 ml of 1 x
10‐3 M (0.2 μmol) nile blue, in B) 70 μl (0.9 mmol) of NH4OH.
The fluorophore concentration also affects the size of the NPs,
which decreases until the amount of nile blue is 0.43 μmol, from which
their diameter remains constant, with a mean value of about 170 nm. A
similar behaviour was observed for cresyl violet‐doped NPs.
The synthesis of precursors involving the covalent linking of the
primary amino groups of the fluorophore and the silane derivative APS
was assayed to obtain NPs less susceptible to dye leakage. It was found
mmol NH4OH
0.0 0.4 0.8 1.2 1.6 2.0
RE
LA
TIV
E F
LU
OR
ESC
EN
CE
IN
TE
NSIT
Y
0
100000
200000
300000
400000
500000
A)
mol nile blue
0 2 4 6 8
RE
LA
TIV
E F
LU
OR
ESC
EN
CE
IN
TE
NSIT
Y
0
400000
800000
1200000
1600000
2000000
2400000
B)
Capítulo 2
‐ 112 ‐
that the use of equimolar ratios of nile blue and glutaraldehyde, and APS
in an 8.5‐fold molar excess, gave the best results in terms of fluorescence
intensity of the NPs obtained. The time of reaction of the mixture was
studied in the interval of 0 ‒ 10 min, and 5 min were found to be enough,
since larger irregular particles were obtained at longer reaction times. This
mixture was used for the NP synthesis without any further purification
step. The influence in the fluorescence intensity of the precursor volume
added to the synthesis procedure was studied in the range of 0.6 ‒ 2.4 ml,
providing 1.2 ml of precursor the highest value. The mean size of the NPs
synthesized by using 1.2 ml of precursor mixture was 150 nm, decreasing
the size at higher volumes. Figure 1g shows the aspect of the NPs obtained
using 1.2 ml of precursor, which are not completely spherical, although
they have a uniform size with a relative standard deviation around 10%.
3.1.2. Optimization of the synthesis by the Stöber method
The approach used was similar to previously described methods
for the encapsulation of a fluorescein‐silane precursor and a ruthenium
chelate [19, 21], which encompassed the use of an ethanol:water mixture as
the medium for the hydrolysis and condensation of silane reagent. The
application of this method has been carried out using cresyl violet as
fluorophore, with the aim of comparing the features of the NPs obtained
with those of the NPs obtained with the above described method.
Ethanol volume was assayed in the range of 10‐25 ml (0.17 ‒ 0.43
mol), obtaining the best fluorescence intensity values with the highest
ethanol amount. This would be ascribed to the increase in the effective
Síntesis de nanopartículas de sílice y su aplicación
‐ 113 ‐
fluorophore concentration at low volumes of ethanol, which gives rise to
the formation of the non‐fluorescent fluorophore dimers above mentioned.
The influence of water was studied in the range of 0.5‐25 ml,
yielding sizes below 180 nm, which increased (300‐350 nm) when the water
volume was 5‐10 ml. This behaviour could be explained bearing in mind
that the TEOS hydrolysis, which would be the limiting step at low water
volumes, should be favoured by an increase in water volumes leading to
faster NP synthesis and larger NP sizes. The use of 25 ml of water provided
a lower amount of NPs, owing to the dilution of the reagents involved in
the synthesis.
The optimization of the fluorophore amount, performed from 0.5 to
10 ml of 1 x 10‐3 M (0.5 ‒ 10 μmol) cresyl violet at a fixed water volume of
0.5 ml, showed that the best results were obtained for 0.5 μmol of
fluorophore. The influence of TEOS was assayed in the range of 0.1 ‒ 10 ml
finding that NPs obtained at low TEOS volumes (0.1 ‒ 2 ml) were
practically monodisperse whereas those synthesized at higher TEOS
volumes (5 ‒ 10 ml) were quite irregular in shape and in size distribution.
Table 2 shows the comparison of the cresyl violet‐doped silica NPs
obtained by the modified reverse‐micelle microemulsion and the Stöber
methods. The excitation filter used for cresyl violet was 531/25 nm, which
is an excitation wavelength shorter than the maximum, in order to
minimize scattering phenomena. The specific intensity of the NPs obtained
by the modified microemulsion method was about 12 times higher than
that obtained by the Stöber procedure. This would be ascribed to the fact
that cresyl violet is less degraded by the alkaline conditions owing to the
protection that micelles can confer.
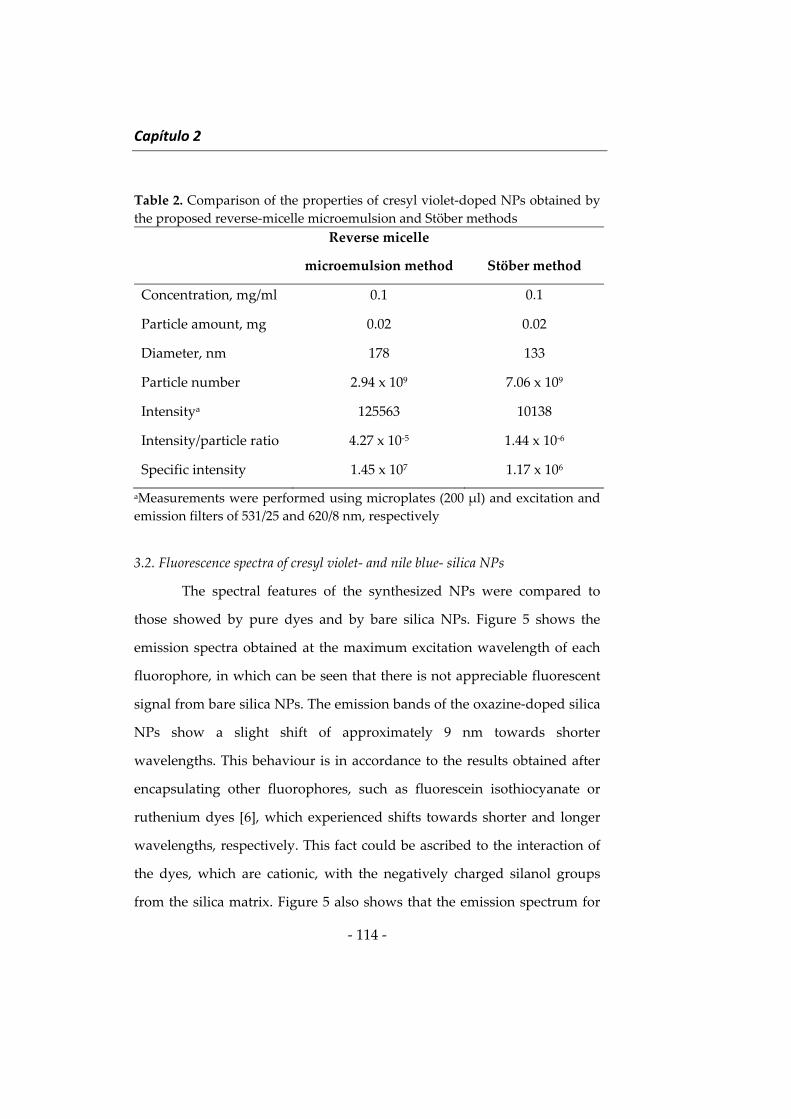
Capítulo 2
‐ 114 ‐
Table 2. Comparison of the properties of cresyl violet‐doped NPs obtained by
the proposed reverse‐micelle microemulsion and Stöber methods
Reverse micelle
microemulsion method Stöber method
Concentration, mg/ml 0.1 0.1
Particle amount, mg 0.02 0.02
Diameter, nm 178 133
Particle number 2.94 x 10⁹ 7.06 x 10⁹
Intensitya 125563 10138
Intensity/particle ratio 4.27 x 10‐5 1.44 x 10‐6
Specific intensity 1.45 x 10⁷ 1.17 x 10⁶
aMeasurements were performed using microplates (200 μl) and excitation and
emission filters of 531/25 and 620/8 nm, respectively
3.2. Fluorescence spectra of cresyl violet‐ and nile blue‐ silica NPs
The spectral features of the synthesized NPs were compared to
those showed by pure dyes and by bare silica NPs. Figure 5 shows the
emission spectra obtained at the maximum excitation wavelength of each
fluorophore, in which can be seen that there is not appreciable fluorescent
signal from bare silica NPs. The emission bands of the oxazine‐doped silica
NPs show a slight shift of approximately 9 nm towards shorter
wavelengths. This behaviour is in accordance to the results obtained after
encapsulating other fluorophores, such as fluorescein isothiocyanate or
ruthenium dyes [6], which experienced shifts towards shorter and longer
wavelengths, respectively. This fact could be ascribed to the interaction of
the dyes, which are cationic, with the negatively charged silanol groups
from the silica matrix. Figure 5 also shows that the emission spectrum for
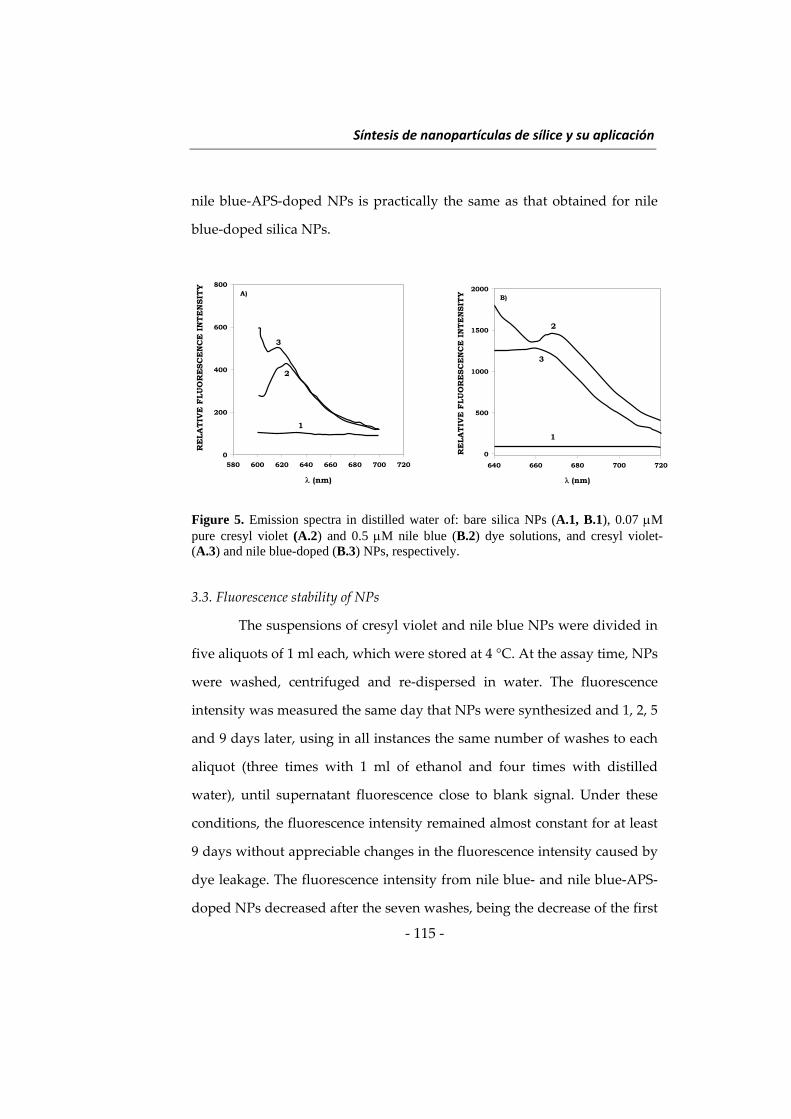
Síntesis de nanopartículas de sílice y su aplicación
‐ 115 ‐
nile blue‐APS‐doped NPs is practically the same as that obtained for nile
blue‐doped silica NPs.
Figure 5. Emission spectra in distilled water of: bare silica NPs (A.1, B.1), 0.07 M pure cresyl violet (A.2) and 0.5 M nile blue (B.2) dye solutions, and cresyl violet- (A.3) and nile blue-doped (B.3) NPs, respectively.
3.3. Fluorescence stability of NPs
The suspensions of cresyl violet and nile blue NPs were divided in
five aliquots of 1 ml each, which were stored at 4 °C. At the assay time, NPs
were washed, centrifuged and re‐dispersed in water. The fluorescence
intensity was measured the same day that NPs were synthesized and 1, 2, 5
and 9 days later, using in all instances the same number of washes to each
aliquot (three times with 1 ml of ethanol and four times with distilled
water), until supernatant fluorescence close to blank signal. Under these
conditions, the fluorescence intensity remained almost constant for at least
9 days without appreciable changes in the fluorescence intensity caused by
dye leakage. The fluorescence intensity from nile blue‐ and nile blue‐APS‐
doped NPs decreased after the seven washes, being the decrease of the first
(nm)
580 600 620 640 660 680 700 720
RE
LA
TIV
E F
LU
OR
ESC
EN
CE
IN
TE
NSIT
Y
0
200
400
600
800A)
1
2
3
1
2
3
(nm)
640 660 680 700 720R
ELA
TIV
E F
LU
OR
ESC
EN
CE
IN
TE
NSIT
Y0
500
1000
1500
2000B)
2
3
11
3
2
(nm)
580 600 620 640 660 680 700 720
RE
LA
TIV
E F
LU
OR
ESC
EN
CE
IN
TE
NSIT
Y
0
200
400
600
800A)
1
2
3
1
2
3
(nm)
580 600 620 640 660 680 700 720
RE
LA
TIV
E F
LU
OR
ESC
EN
CE
IN
TE
NSIT
Y
0
200
400
600
800A)
1
2
3
1
2
3
(nm)
640 660 680 700 720R
ELA
TIV
E F
LU
OR
ESC
EN
CE
IN
TE
NSIT
Y0
500
1000
1500
2000B)
2
3
11
3
2
(nm)
640 660 680 700 720R
ELA
TIV
E F
LU
OR
ESC
EN
CE
IN
TE
NSIT
Y0
500
1000
1500
2000B)
2
3
11
3
2
Capítulo 2
‐ 116 ‐
NPs two fold that of the second ones, which would be ascribed to the
covalent binding of the fluorophore to the silane reagent, which minimizes
dye leakage.
Once the NPs were totally purified (supernatant fluorescence close
to blank signal), they were subjected to additional subsequent washes with
1 ml of distilled water to study the potential dye leakage from the core of
NPs, finding that the fluorescence of both nile blue‐ and nile blue‐APS‐
doped NPs remained almost constant. The stability of nile blue‐doped NPs
could be ascribed to the abovementioned fact that nile blue is a cationic dye
and would interact with the negative silanol groups from silica matrix. In
this way, dye leakage would be less favoured than for anionic dyes, such as
Cy5, which are more prone to repulsion forces with the silanol groups from
silica matrix [12].
3.4. Photostability experiments
To investigate the potential photobleaching of the synthesized NPs
in aqueous solution, they were irradiated for 1 h and the results were
compared to those obtained for pure dye solutions (Figure 6). The intensity
of pure cresyl violet (Figure 6a, curve 1) and nile blue (Figure 6b, curve 1)
dropped until the 72% and the 65%, respectively, of the initial intensity.
However, the fluorescence intensity of both cresyl violet NPs (Figure 6a,
curve 2) and nile blue‐doped NPs (Figure 6b curve 2) remained almost
constant and the NPs prepared by using the nile blue‐APS precursor
(Figure 6b, curve 3) experienced a decrease by a 10% of the initial intensity.
Similar results have been reported in recently synthesized NPs containing
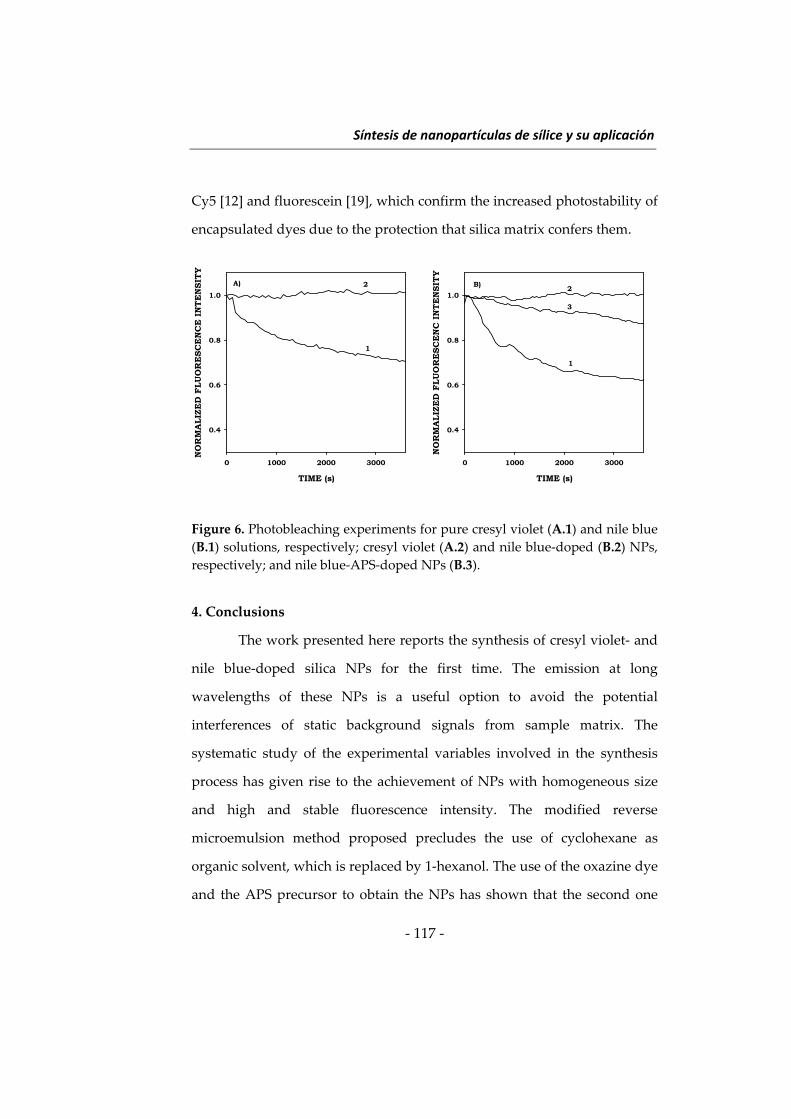
Síntesis de nanopartículas de sílice y su aplicación
‐ 117 ‐
Cy5 [12] and fluorescein [19], which confirm the increased photostability of
encapsulated dyes due to the protection that silica matrix confers them.
Figure 6. Photobleaching experiments for pure cresyl violet (A.1) and nile blue
(B.1) solutions, respectively; cresyl violet (A.2) and nile blue‐doped (B.2) NPs,
respectively; and nile blue‐APS‐doped NPs (B.3).
4. Conclusions
The work presented here reports the synthesis of cresyl violet‐ and
nile blue‐doped silica NPs for the first time. The emission at long
wavelengths of these NPs is a useful option to avoid the potential
interferences of static background signals from sample matrix. The
systematic study of the experimental variables involved in the synthesis
process has given rise to the achievement of NPs with homogeneous size
and high and stable fluorescence intensity. The modified reverse
microemulsion method proposed precludes the use of cyclohexane as
organic solvent, which is replaced by 1‐hexanol. The use of the oxazine dye
and the APS precursor to obtain the NPs has shown that the second one
TIME (s)
0 1000 2000 3000
NO
RM
ALIZ
ED
FLU
OR
ESC
EN
CE
IN
TE
NSIT
Y
0.4
0.6
0.8
1.0
A)
1
2
TIME (s)
0 1000 2000 3000
NO
RM
ALIZ
ED
FLU
OR
ESC
EN
C I
NT
EN
SIT
Y0.4
0.6
0.8
1.0
B)
1
2
3
TIME (s)
0 1000 2000 3000
NO
RM
ALIZ
ED
FLU
OR
ESC
EN
CE
IN
TE
NSIT
Y
0.4
0.6
0.8
1.0
A)
1
2
TIME (s)
0 1000 2000 3000
NO
RM
ALIZ
ED
FLU
OR
ESC
EN
C I
NT
EN
SIT
Y0.4
0.6
0.8
1.0
B)
1
2
3
Capítulo 2
‐ 118 ‐
reduces dye leakage in the purification process. The comparison of the
luminescent properties of cresyl violet‐doped NPs synthesized by
microemulsion and Stöber methods has shown the usefulness of the first
one to obtain more luminescent NPs.
The increased photostability of the synthesized NPs with respect to
the pure dye proves the succesful dye encapsulation and the protection
that silica matrix confers them. The features of the synthesized NPs seem to
make them suitable as analytical reagents in fluoroimmunoassays after
their functionalization, which is currently under research.
Acknowledgments
Authors gratefully acknowledge the financial support from the
Spanish Ministerio de Educación y Ciencia (Grant No. CTQ2006‐03263)
and from the Autonomous Andalusian Government (Grant No. P06‐
FQM1356). They also acknowledge the technical assistance of the Electron
Microscopy Section of the Central Service of Support to Research (SCAI)
from the University of Cordoba.
References
(1) A. Gómez‐Hens, J. M. Fernández‐Romero, M. P. Aguilar‐Caballos.
Nanostructures as analytical tools in bioassays. Trends Anal. Chem.
(2008) 27, 394‒406.
(2) J. Yan, M. C. Estévez, J. E. Smith, K. Wang, X. Ho, L. Wang, W. Tan.
Dye‐doped nanoparticles for bioanalysis. Nanotoday (2007) 2, 44‒50.
(3) M. Seydack. Nanoparticles labels in immunosensing using optical
detection methods. Biosens. Bioelectron. (2005) 20, 2454‒2469.
Síntesis de nanopartículas de sílice y su aplicación
‐ 119 ‐
(4) N. C. Tansil, Z. Gao. Nanoparticles in biomolecular detection.
Nanotoday (2006) 1, 28‐37.
(5) G. Liu, Y. Lin. Nanomaterial labels in electrochemical immune‐
sensors and immunoassays. Talanta (2007) 74, 308‒317.
(6) G. Yao, L. Wang, G. Wu, J. Smith, J. Xu, W. Zhao, E. Lee, W. Tan.
FloDots: luminescent nanoparticles. Anal. Bioanal. Chem. (2006) 385,
518‒524.
(7) F. Wang, W. B. Tan, Y. Zhang, X. Fan, M. Wang. Luminescent
nanomaterials for biological labelling. Nanotechnology (2006) 17, R1‒
R13.
(8) V. Wiwanitkit, A. Seereemaspun, R. J. Rojanathanes. Increasing the
agglutination reaction in slide test for weak B blood group by gold
nanoparticle solution: the first world report. J. Immunol. Methods
(2007) 328, 201‒203.
(9) B. Du, Z. Li, Y. Cheng. Homogeneous immunoassay based on
aggregation of antibody‐functionalized gold nanoparticles coupled
with light scattering detection. Talanta (2008) 75, 959‒964.
(10) F. J. Arriagada, K. Osseo‐Asare. Synthesis of nanosize silica in a
nonionic water‐in‐oil microemulsion: effects on the water/surfactant
molar ratio and ammonia concentration. J. Colloid Interf. Sci. (1999)
211, 210‒220.
(11) X. Zhao, R. P. Bagwa, W. Tan. Development of organic‐dye‐doped
silica nanoparticles in a reverse microemulsion. Adv. Mater. (2004) 16,
173‒176.
Capítulo 2
‐ 120 ‐
(12) X. He, J. Chen, K. Wang, D. Qin, W. Tan. Preparation of luminescent
Cy5 doped core‐shell SFNPs and its application as a near‐infrared
fluorescent marker. Talanta (2007) 72, 1519‒1526.
(13) X. L. Chen, J. L. Zou, T. T. Zhao, Z. B. Li. Preparation and fluoro‐
immunoassay application of new red‐region fluorescent silica
nanoparticles. J. Fluoresc. (2007) 17, 235‒241.
(14) W. Yang, C. G. Zhang, H. Y. Qu, H. H. Yang, J. G. Xu. Novel
fluorescent silica nanoparticle probe for ultrasensitive immune‐
assays. Anal. Chim. Acta (2004) 503, 163‒169.
(15) S. R. Hu, J. M. Liu, T. L. Yang, H. Z. Lin, J. L. Huang, Q. W. Lin, G. H.
Zhu, X. M. Huang. Determination of human alpha‐fetoprotein (AFP)
by solid substrate room temperature phosphorescence enzyme‐linked
immune response using luminescent nanoparticles. Microchim. Acta
(2005) 152, 53‒59.
(16) A. Gómez‐Hens, M. P. Aguilar‐Caballos. Long‐wavelength fluoro‐
phores: new trends in their analytical use. Trends Anal. Chem. (2004)
23, 127‒136.
(17) I. Hemmilä, V. Laitala. Progress in lanthanides as luminescent probes.
J. Fluoresc. (2005) 15, 529‒542.
(18) A. Gómez‐Hens, M. P. Aguilar‐Caballos. Terbium‐sensitized
luminescence: a selective and versatile analytical approach. Trends
Anal. Chem. (2002) 21, 131‒141.
(19) N. Nakamura, M. Shono, K. Ishimura. Synthesis, characterization,
and biological applications of multifluorescent silica nanoparticles.
Anal. Chem. (2007) 79, 6507‒6514.
Síntesis de nanopartículas de sílice y su aplicación
‐ 121 ‐
(20) J. F. Bringley, T. L. Penner, R. Wang, J. F. Harder, W. J. Harrison, L.
Buonemani. Silica nanoparticles encapsulating near‐infrared emissive
cyanine dyes. J. Colloid Interf. Sci. (2008) 320, 132‒139.
(21) L. M. Rossi, L. Shi, F. H. Quina, Z. Rosenzweig. Stöber synthesis of
monodispersed luminescent silica nanoparticles for bioanalytical
assays. Langmuir (2005) 21, 4277‒4280.

Síntesis de nanopartículas de sílice y su aplicación
‐ 123 ‐
Heterogeneous immunoassay for soy protein determination
using nile blue‐doped silica nanoparticles as labels and front‐
surface long‐wavelength fluorimetry
J. Godoy‐Navajas, M.P. Aguilar Caballos, A. Gómez‐Hens
Department of Analytical Chemistry, Institute of Fine Chemistry and Nanochemistry
(IAQFN). Campus of Rabanales. Marie Curie Building (Annex). University of
Cordoba. 14071‐Cordoba. Spain.
Abstract
A long‐wavelength fluoroimmunoassay for the determination of soy
protein is reported for the first time using a conjugate composed of anti‐soy protein
antibodies bound to nile‐blue doped silica nanoparticles (NPs). These NPs have
been synthesized by a reverse‐micelle microemulsion method and functionalized
by using 3‐(aminopropyl)triethoxysilane (APS) and 3‐(trihydroxysilyl)propyl
methylphosphonate (THPMP) to avoid NP aggregation. The tracer has been
obtained by linking the functionalized NPs with anti‐soy protein antibodies
previously oxidised with sodium periodate. The immunoassay has been developed
in 96‐well microplates using a heterogeneous competitive format with antibody
capture. Soy proteins are immobilised onto the wells and bovine serum albumin is
added to block the surface, thus minimising nonspecific binding. After washing,
the microplates can be stored ready to use. At the analysis time, soy protein
standards or sample and tracer are added and incubated and, after the
corresponding washing and drying steps, the fluorescence is measured onto the
solid surface at λex 620 and λem 680 nm. The method features a dynamic range of 0.1
– 10 mg L‐1 and a detection limit of 0.05 mg L‐1. The precision of the method has
been assayed at 0.5 and 5 mg L‐1 protein concentrations, obtaining the values of
relative standard deviation of 9.6% and 6.1 %, respectively. This new immunoassay
has been applied to the analysis of food containing soy protein and the results
obtained have been compared to those provided by a commercial ELISA kit with
no statistically differing results. Also, a recovery study has been performed,
providing percentages in the range of 81.5 – 111.0 %.
Keywords: soy protein, food samples, long‐wavelength fluorimetry, heterogeneous
immunoassay, nile blue‐doped silica nanoparticles
Capítulo 2
‐ 124 ‐
1. Introduction
In recent years, the global consumption of soy foodstuffs has
increased because of their reported beneficial effects on nutrition and
health, such as a decrease of the plasma cholesterol, prevention of cancer,
diabetes and obesity, and protection against bowel and kidney disease [1].
Soybean proteins are used as additives in human foodstuffs, thus being
marketed as different commercial formulations, such as soy flour, protein
concentrates and isolates. These formulations are used to obtain better
mechanical properties in soy milks, drinks, tofu and vegetarian meat
substitutes and a number of new food varieties is being developed.
However, soybeans contain proteins that can produce allergic responses in
some people. The safe choice of processed foods free from soy proteins
may become more critical for these patients because these proteins and
their derivatives have been increasingly incorporated in a number of
processed foods. The allergenicity of these proteins largely depends on the
food processing, e.g. high temperature treatments and conjugation to some
organic compounds, such as polysaccharides [2], among others.
Native soy proteins are globular proteins, mainly constituted by 7S
and 11S (glycinin and conglycinin) fractions [3], which have been
characterized and determined by liquid chromatography [4],
electrophoresis [5] and immunoblotting [6]. Also, a number of enzyme‐
linked immunosorbent assays (ELISA) methods have been described for
soy protein determination in different food samples [7‐11], thus existing
some commercial kits developed for this purpose [11]. Only few alternative
approaches to the use of enzymes as labels have been reported for soy
protein determination. A commercial four‐channel optical biosensor based
Síntesis de nanopartículas de sílice y su aplicación
‐ 125 ‐
on surface plasmon resonance (Biacore 3000) has been applied to the
determination of several non‐milk proteins, including soy proteins, in milk
products [12]. An advantage of this method is that proteins are directly
detected, avoiding the use of a label, but the relatively high cost of the
instrument hinders its generalized use. Also, a more complex
immunoassay has been described using an expensive flow analyzer
(Luminex), fluorescent microspheres and a fluorophore (Alexa 532) as label
of the proteins [13]. The use of nanoparticles (NPs) as labels for soy protein
determination has been previously described in a homogeneous
immunoassay in which the tracer, formed by gold NPs‐soy protein
antibodies, reacts with the analyte increasing the light scattering intensity
of the solution [14].
The method presented here is a long‐wavelength fluorimetric
heterogeneous immunoassay using nile blue (NB)‐doped silica NPs as
label, which have been obtained by a relatively simple reverse‐micelle
microemulsion method [15]. This procedure has been slightly changed to
achieve NP surface modification with amino‐ groups to be further linked to
soy protein antibodies in order to develop the long‐wavelength
luminescent tracer. The use of silica NPs as labels in immunoassays with
optical detection has very interesting features: 1) transparency of silica to
visible light, 2) almost negligible photobleaching phenomena of
encapsulated organic dyes, 3) stability of silica matrix at medium‐term
since it is not susceptible to microbiological degradation, and 4) porosity or
swelling changes do not happen at moderate pH variations. An additional
advantage of the use of NPs as labels is the decreased number of steps
needed to perform this heterogeneous immunoassay compared to those
Capítulo 2
‐ 126 ‐
required for the development of ELISA assays, since the use of the enzyme
conjugate and substrate solutions is avoided. To date, a limited number of
immunoassays have been described which make use of biofunctionalized
dye‐doped silica nanoparticles [16]. These assays mainly involve the
encapsulation of fluorescein and rhodamine derivatives, and ruthenium
and lanthanide chelates to obtain luminescent silica NPs. The results
obtained in these methods have shown that the sensitivity is greatly
increased when compared with the corresponding immunoassays
performed with direct fluorophore labeling.
To the best of our knowledge, the method reported here is the first
heterogeneous immunoassay described for soy protein determination in
food samples using NPs as labels. Two competitive formats involving
antibody and antigen capture were assayed, but only the first one, in which
soy proteins were immobilised on the wells of a microplate, gave rise to
satisfactory results.
The method has been applied to the analysis of fruit and soy juice,
soy yoghourt and milk samples and the results obtained have been
compared to those provided by a commercial ELISA with no statistically
relevant differences. Also, the detection limit using the reported method is
about 10 times lower than the afforded by the commercial ELISA.
2. Experimental
2.1. Instrumentation
A 1420 Multilabel counter Victor 3V microplate reader (Perkin
Elmer and Analytical Sciences, Wallac Oy, Turku, Finland) was used to
perform fluorescence measurements. Two filters (nominal
Síntesis de nanopartículas de sílice y su aplicación
‐ 127 ‐
wavelength/passband) were used to select the excitation (620/8 nm) and
emission (680/10 nm) wavelengths of the doped NPs. Fluorescence
mesurements were performed using the stabilized energy mode of the
instrument with an integration time of 1 s. NP size characterization was
performed by transmission electron microscopy (TEM), using a CM10
Philips Microscope. Copper grids (200C‐FC) coated with a Formvar®
carbon film 200 mesh supplied by Aname (Madrid, Spain) were used as
support for TEM experiments. Both 300‐μL well Opti‐plate and 100‐μL
well black and shallow Proxy‐plate 96‐well microplates (Perkin Elmer)
were assayed as supports for the development of the heterogeneous
immunoassay method.
2.2. Reagents
All the reagents were of analytical grade and used as supplied by
the manufacturer. Tetraethyl orthosilicate (TEOS) and Triton X‐100 were
obtained from Fluka (Germany). Nile Blue chloride, 3‐
(trihydroxysilyl)propyl methyl‐phosphonate monosodium salt, bovine
serum albumin (BSA), polyclonal anti‐soy protein antibodies (raised in
rabbits), sodium borohydride, sodium acetate and sodium carbonate were
supplied by Sigma‐Aldrich (USA), and (3‐aminopropyl)‐triethoxysilane
(APS) by Aldrich (Germany). 1‐Hexanol and di‐potassium hydrogen
phosphate were acquired from Merck (Germany). Ammonium hydroxide
(25% in NH3), acetone and absolute ethanol were obtained from Panreac
(Spain), sodium metaperiodate from Scharlau (Spain) and soy protein
isolate, PROTEINA SUPRO 500E (90% protein content), was kindly gifted
by DOSCADESA (Spain). Phosphate (0.02 M, pH 7.5), acetate (0.1 M, pH
Capítulo 2
‐ 128 ‐
5.5 and pH 4.8), and carbonate (0.05 M, pH 9.5) buffer solutions were
prepared by dissolving the appropriate amount of these salts and adjusting
the pH with either hydrochloric acid or sodium hydroxide when
appropriate. A commercial ELISA kit (ELISA SYSTEMS, Windsor,
Australia) for the determination of soy protein11 was used for comparative
purposes.
2.3. Procedures
2.3.1. Synthesis of amino‐functionalized NB‐doped silica NPs
The procedure used to synthesize NB‐doped silica NPs is similar to
a reverse‐micelled microemulsion method previously reported [15], but it
has been modified in the last step to provide the doped silica NP surface
with amino groups to be linked to anti‐soy protein antibodies, in order to
give rise to the conjugate used as tracer.
Briefly, an amount of Triton X‐100 (510‐530 mg or 0.79‐0.82 mmol)
was dissolved in 9.6 mL (0.53 mol) of distilled water by stirring vigorously
this mixture for 5 min. Then, a volume of 100 μL (0.44 mmol) of TEOS was
added and the solution was stirred for 5 min. A volume (1.8 mL) of 10‐3 M
(1.8 μmol) NB solution was added and the mixture stirred again for 5 min.
Afterwards, 3 mL (0.024 mol) of hexanol were added and the
microemulsion formed was stirred for 15 min. Concentrated ammonium
hydroxide (70 μL, 0.9 mmol) was then added and the mixture stirred for 5
min to start the TEOS hydrolysis and condensation reactions. The mixture
was then placed in a thermostated tank at 25 °C for 24 h in the dark and,
afterwards, it was centrifuged for 5 min at 2000 rpm to separate the phases
involved. The upper phase (about 3 mL) was transferred to a 10‐mL beaker
Síntesis de nanopartículas de sílice y su aplicación
‐ 129 ‐
and 40 μL of APS and 80 μL of THPMP were added. This mixture was
magnetically stirred during 1.5 h in a water bath to keep the temperature at
25 °C. Afterwards, the microemulsion was broken by adding 10 mL of
acetone and stirring for 5 min. The supernatant was discarded and NPs
were recovered from the bottom with 8 ‐ 10 mL of distilled water. The
mixture was centrifuged for 5 min at 10000 rpm and the NP precipitate was
washed with ethanol and water until the fluorescence intensity of
supernatants was similar to the blank. Finally, the NPs were re‐dispersed
in 1 mL of phosphate buffer solution.
2.3.2. Preparation of the NB‐doped silica nanoparticles anti‐soy protein antibody
conjugate
A volume (50 μL) of anti‐soy protein were diluted with 0.1 M
sodium acetate solution (pH 5.5) until a volume of 2 mL, and 200 μL of 0.1
M sodium metaperiodate solution were added to this volume. The mixture
was incubated for 20 min in the freezer at 0 °C and the reaction volume
was layered on a HiTrap Desalting Column (GE Healthcare) equilibrated
with 25 mL 0.1 M sodium acetate ‐ 0.5 M sodium chloride solution (pH 4.8),
at a 5 mL min‐1 flow rate, and 300‐μL fractions were taken. Their
absorbance was monitored at 280 nm and the anti‐soy protein was
recovered from the first seven fractions, accounting for about 2 mL of
solution. This volume was added to the amino‐modified NB‐doped silica
NPs, which had been previously centrifuged to remove phosphate buffer
solution. The mixture was incubated for 20 h at 4 °C, in a similar way as
previously described elsewhere [17]. Then, 50 μL of 0.66 M NaBH4 solution
were added to the dispersion and allowed to react for 20 min at 4 °C.
Capítulo 2
‐ 130 ‐
Afterwards, the reaction mixture was centrifuged and the NP‐anti‐soy
protein conjugate obtained was washed with phosphate buffer solution.
Finally, NPs were re‐dispersed in 1 mL of the same phosphate buffer
solution and stored at 4 °C for further use.
2.3.3. Preparation of soy standard
The procedure used involves a denaturation‐renaturation process,
according to the procedure indicated by the anti‐soy protein antibody
supplier, as follows: an amount of soy protein isolate (50 mg) was placed in
a glass test tube and mixed with 3 g of urea, 1 mL of 0.001 M TRIS‐HCl
buffer solution of pH 8.6, 0.1 mL of 2‐mercaptoethanol and water. The total
volume of the reaction mixture did not exceed 5 mL. The test tube was
sealed with a cap and aluminum foil and the tube was placed in a boiling
water bath for 2 h. After this time, the tube was cooled for 5 min in cold
water and the reaction mixture was diluted to 10 mL with distilled water.
This solution can be stored at 4 °C in the fridge for a month. Working
standard solutions were daily prepared by diluting this stock solution in
phosphate buffer solution.
2.3.4. Determination of soy protein
A volume (80 μL) of a 5 mg L‐1 soy protein solution prepared in
carbonate buffer solution was added to each well, and the microplate was
incubated overnight at 4 °C. Afterwards, wells were washed three times
with distilled water and then, 80 μL of a 0.01 % BSA solution prepared in
phosphate buffer were added to each well. The microplate was stirred for 1
Síntesis de nanopartículas de sílice y su aplicación
‐ 131 ‐
h at room temperature, it was washed for three times with phosphate
buffer solution and then, it was stored at 4 °C until use.
To perform the immunoassay, a volume (60 μL) of a pre‐incubated
mixture, prepared by mixing 75 μL of NB‐doped silica NPs‐labeled anti‐
soy protein antibody (20 nM) in phosphate buffer solution (0.02 M, pH 7.5),
and 225 μL of soy protein standard or sample solution (0.1‐10 μg mL‐1)
were added to each well. The microplate was incubated for 1.5 h at 37 °C,
the wells were washed three times with the same phosphate buffer
solution, and the plate was dried for 10 min at room temperature. Then, the
measurements were directly performed onto the solid surface of the well.
2.3.5. Determination of soy protein in food samples
An amount (0.85 mL or g of soy milk and yoghourt, respectively,
and 1.7 g of fruit and soy juice) of food sample was treated in the same way
as described above for soy protein standards.
The sample extracts were diluted (1:2000) in phosphate buffer
solution and 225 μL of this solution were analysed following the above
mentioned procedure for soy protein determination.
3. Results and discussion
3.1. Choice and optimization of the immunoassay system
The synthesis and optical properties of NB‐doped silica NPs used
to obtain the tracer have been recently described [15]. These NPs feature
low photobleaching phenomena because of the protection that silica matrix
confers them and good stability owing to the interaction of the fluorophor
NB with silica matrix. However, the surface functionalization to introduce
Capítulo 2
‐ 132 ‐
reactive groups to couple these NPs to either analytes or antibodies, is
described here for the first time. The NP surface was functionalized with
amino groups using APS as reagent, which has been previously described
for this purpose [18]. This process can lead to aggregation phenomena
because of the accumulation of positive charges at physiological pH onto
their surface. Thus, the amine‐modified silica NPs can back bond to
residual silanol groups, as it has been reported elsewhere [19], leading to a
very low charge in the surface, which originates NP aggregation. The use
of a silane reagent containing phosphonate groups, such as THPMP, can
partially or totally avoid this effect since more electrostatic repulsions are
created among NPs, which contribute to their dispersion. Thus, at the end
of the synthesis of NPs once the phase separation was performed, the
upper layer, which is rich in NB and hexanol, was taken and different
mixtures of APS and THPMP were assayed. Volumes ranging from 10 to 40
μL of APS and from 20 to 160 μL of THPMP, in volume ratios in the range
of 1:1 to 1:16, were used. It was found by TEM that the addition of these
reagents in an 1:2 APS:THPMP volume ratio gave rise to non‐aggregated
silica NPs. Several volumes at the 1:2 APS:THPMP ratio were assayed to
check out which volumes would give rise to a suitable amount of amino
groups, and the confirmation of their presence was followed by a
fluorescamine method [20]. The highest fluorescence intensity was
obtained using 40 μL of APS and 80 μL of THPMP, being these volumes
chosen to perform the functionalization.
The temperature of the functionalization was assayed in the range
of 0 ‐ 37 °C. Temperatures above 25 °C increase the hydrolysis rate of APS
and can lead to aggregation phenomena, thus selecting 25 °C for the
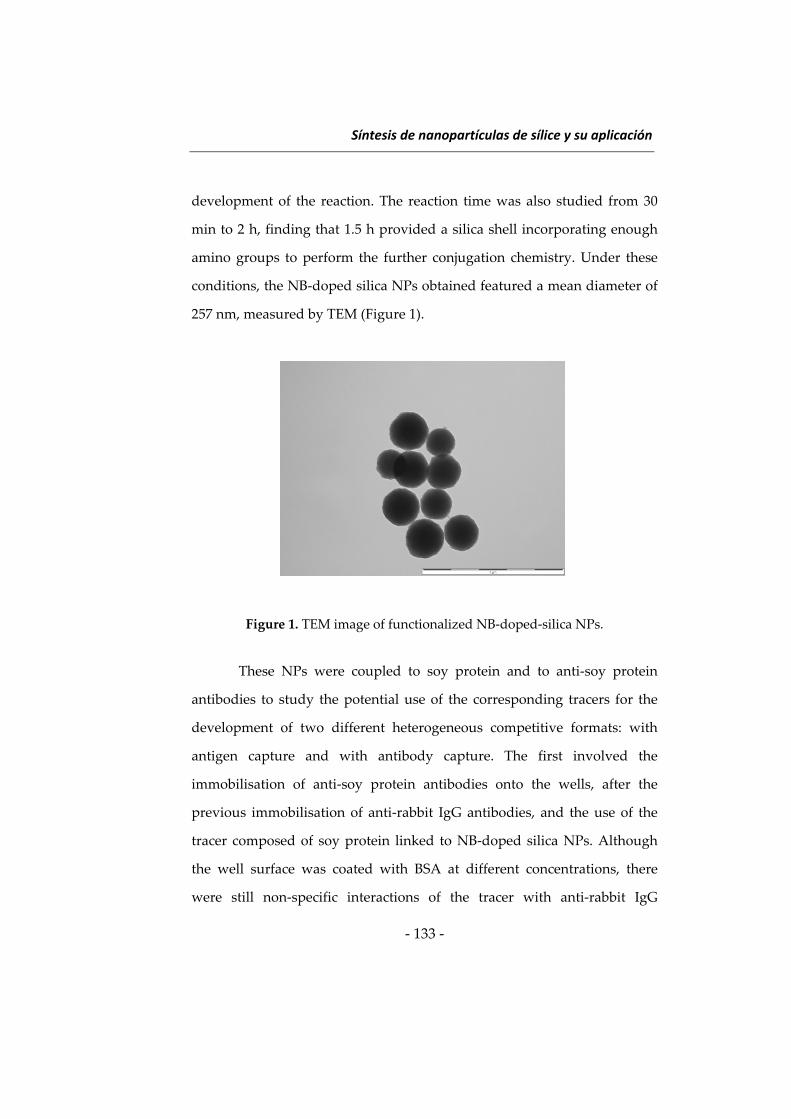
Síntesis de nanopartículas de sílice y su aplicación
‐ 133 ‐
development of the reaction. The reaction time was also studied from 30
min to 2 h, finding that 1.5 h provided a silica shell incorporating enough
amino groups to perform the further conjugation chemistry. Under these
conditions, the NB‐doped silica NPs obtained featured a mean diameter of
257 nm, measured by TEM (Figure 1).
Figure 1. TEM image of functionalized NB‐doped‐silica NPs.
These NPs were coupled to soy protein and to anti‐soy protein
antibodies to study the potential use of the corresponding tracers for the
development of two different heterogeneous competitive formats: with
antigen capture and with antibody capture. The first involved the
immobilisation of anti‐soy protein antibodies onto the wells, after the
previous immobilisation of anti‐rabbit IgG antibodies, and the use of the
tracer composed of soy protein linked to NB‐doped silica NPs. Although
the well surface was coated with BSA at different concentrations, there
were still non‐specific interactions of the tracer with anti‐rabbit IgG
Capítulo 2
‐ 134 ‐
antibodies. To overcome this problem, the use of the antibody capture
format was assayed. Thus, soy proteins were immobilised first onto the
wells, and the remaining sites of the well were blocked with BSA. Then, a
preincubated mixture of soy protein standards or sample together with a
conjugate anti‐soy protein‐NB‐doped silica NPs (tracer) was added,
competing both immobilised and in solution soy proteins for the active
sites of the conjugate. After washing, the fluorescence from bound tracer
fraction was measured. The performance of fluorescence measurements
onto the well surface was investigated assaying 100‐μL proxy‐plate and
conventional 300‐μL Optiplate microplates. The signal obtained using
proxy‐plates was slightly better, which could be ascribed to that well
bottom can be more easily approached by the detection system using these
plates. Also, an additional advantage is the use of lower volumes, which
considerably reduces immunoassay costs.
The synthesis of the tracer encompassed the previous oxidation of
carbohydrate moieties of antibody molecule to give rise to aldehyde
moieties, which react to NP surface amino groups giving rise to Schiff
bases that can be further reduced using sodium borohydride [17].
After the oxidation of the antibody with sodium metaperiodate, it is
necessary to perform a purification step using commercial desalting
columns to remove the excess of oxidant in order to proceed with the next
step, taking 300‐μL fractions. These fractions were selected by measuring
their absorbance at 280 nm. Once the antibody and NPs were coupled, the
reaction mixture was purified by subsequent washing and centrifugation
steps with phosphate buffer solution, being finally stored in this buffer.
Síntesis de nanopartículas de sílice y su aplicación
‐ 135 ‐
The optimisation of the system was carried out by modifying the
experimental conditions at different soy protein concentrations. The
concentration of immobilized soy protein onto the wells is an important
variable on the system, which influences the assay sensitivity, since
immobilised and in solution soy protein compete for the active sites of the
tracer. The influence of this variable was assayed in the range of 1 to 50 mg
L‐1, finding that 5 mg L‐1 provided the best results as the dynamic range
obtained for the calibration curve was wider and the sensitivity obtained
was also better than those obtained at higher or lower concentrations. BSA
has been used to block the remaining free sites of plate surface after soy
protein immobilization. The influence of BSA concentration was checked
out in the range of 0.001 ‐ 0.1%, finding that 0.01% BSA was enough at the
incubation conditions assayed (1 h, room temperature) (Figure 2A).
BSA concentrations above 0.01% led to a sensitivity decrease,
whereas some non‐specific interactions with the well surface were
observed at lower BSA concentrations, since a higher background signal
was obtained for high analyte concentrations.
The sensitivity of the assay also depends on the tracer
concentration, as Figure 2B shows, being the best results obtained at 20 nM.
Although the signals obtained at concentrations above 20 nM were higher,
the assays were less sensitive, since the dynamic range was shifted to soy
protein concentrations higher than 0.1 mg L‐1.
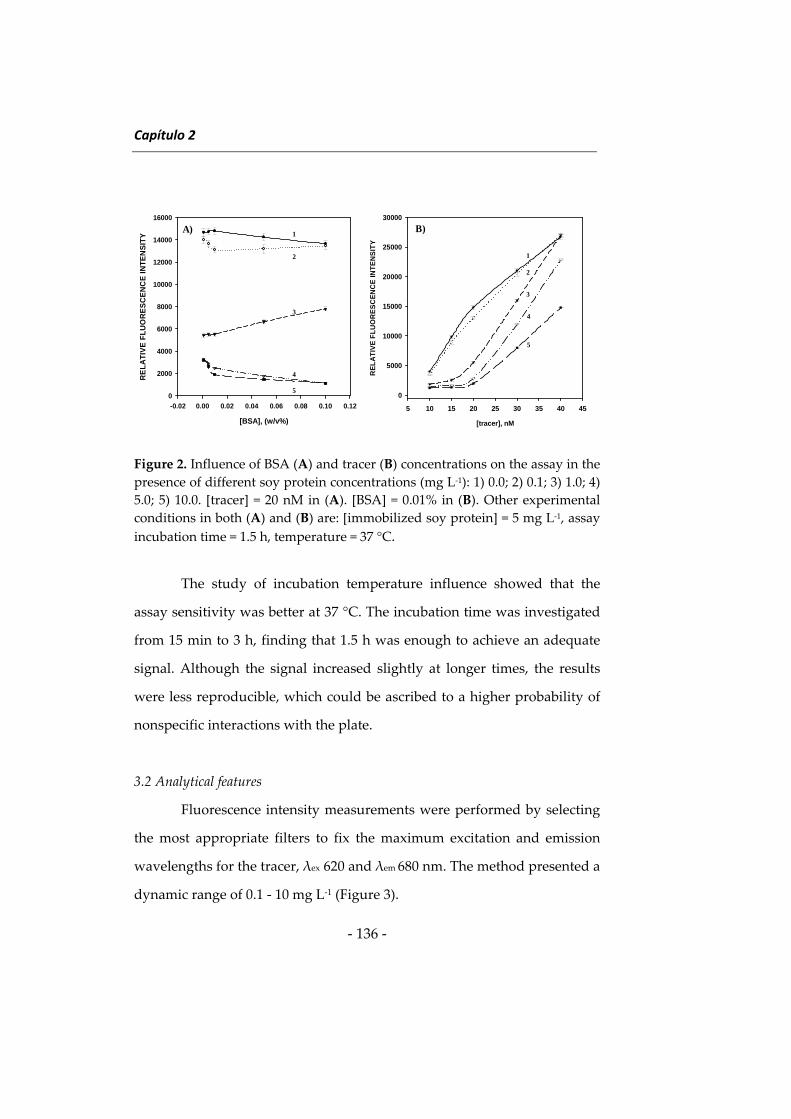
Capítulo 2
‐ 136 ‐
Figure 2. Influence of BSA (A) and tracer (B) concentrations on the assay in the
presence of different soy protein concentrations (mg L‐1): 1) 0.0; 2) 0.1; 3) 1.0; 4)
5.0; 5) 10.0. [tracer] = 20 nM in (A). [BSA] = 0.01% in (B). Other experimental
conditions in both (A) and (B) are: [immobilized soy protein] = 5 mg L‐1, assay
incubation time = 1.5 h, temperature = 37 °C.
The study of incubation temperature influence showed that the
assay sensitivity was better at 37 °C. The incubation time was investigated
from 15 min to 3 h, finding that 1.5 h was enough to achieve an adequate
signal. Although the signal increased slightly at longer times, the results
were less reproducible, which could be ascribed to a higher probability of
nonspecific interactions with the plate.
3.2 Analytical features
Fluorescence intensity measurements were performed by selecting
the most appropriate filters to fix the maximum excitation and emission
wavelengths for the tracer, λex 620 and λem 680 nm. The method presented a
dynamic range of 0.1 ‐ 10 mg L‐1 (Figure 3).
[tracer], nM
5 10 15 20 25 30 35 40 45
RE
LA
TIV
E F
LU
OR
ES
CE
NC
E IN
TE
NS
ITY
0
5000
10000
15000
20000
25000
30000
[BSA], (w/v%)
-0.02 0.00 0.02 0.04 0.06 0.08 0.10 0.12
RE
LA
TIV
E F
LU
OR
ES
CE
NC
E I
NT
EN
SIT
Y
0
2000
4000
6000
8000
10000
12000
14000
16000
A) 1
2
3
4
5
B)
1
2
3
4
5
[tracer], nM
5 10 15 20 25 30 35 40 45
RE
LA
TIV
E F
LU
OR
ES
CE
NC
E IN
TE
NS
ITY
0
5000
10000
15000
20000
25000
30000
[BSA], (w/v%)
-0.02 0.00 0.02 0.04 0.06 0.08 0.10 0.12
RE
LA
TIV
E F
LU
OR
ES
CE
NC
E I
NT
EN
SIT
Y
0
2000
4000
6000
8000
10000
12000
14000
16000
A) 1
2
3
4
5
B)
1
2
3
4
5
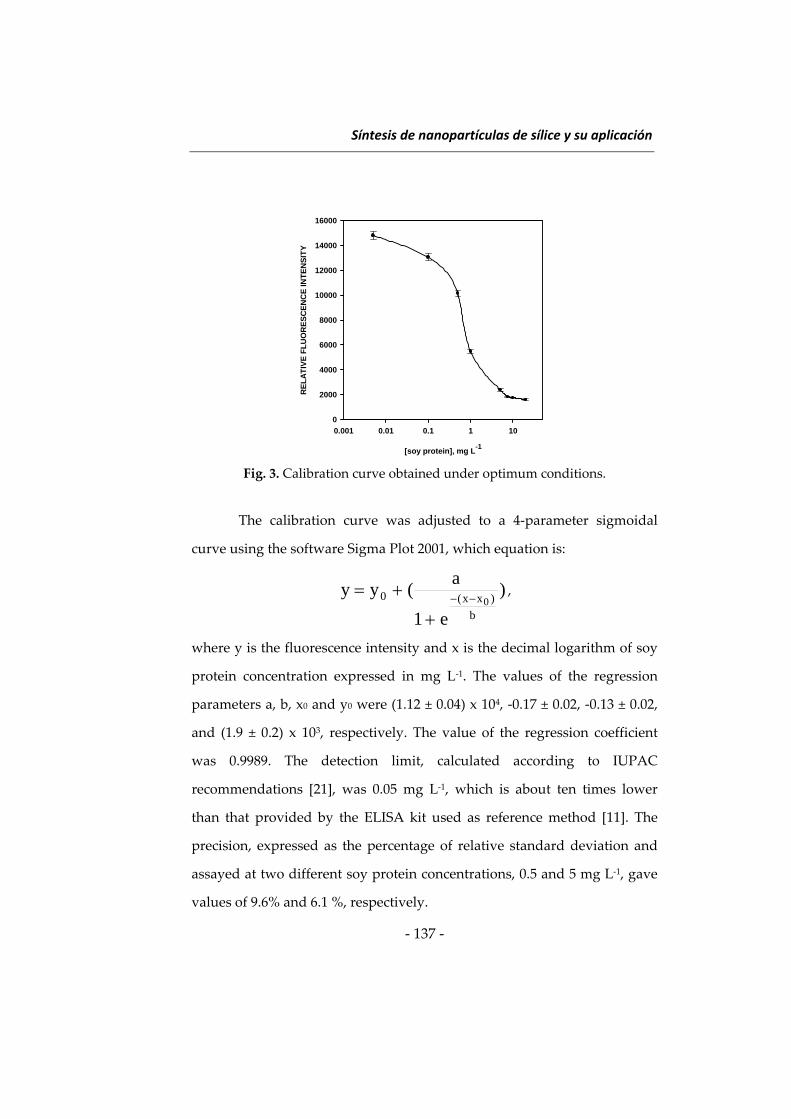
Síntesis de nanopartículas de sílice y su aplicación
‐ 137 ‐
Fig. 3. Calibration curve obtained under optimum conditions.
The calibration curve was adjusted to a 4‐parameter sigmoidal
curve using the software Sigma Plot 2001, which equation is:
)
e1
a(yy
b
)xx(0 0
,
where y is the fluorescence intensity and x is the decimal logarithm of soy
protein concentration expressed in mg L‐1. The values of the regression
parameters a, b, x0 and y0 were (1.12 ± 0.04) x 104, ‐0.17 ± 0.02, ‐0.13 ± 0.02,
and (1.9 ± 0.2) x 103, respectively. The value of the regression coefficient
was 0.9989. The detection limit, calculated according to IUPAC
recommendations [21], was 0.05 mg L‐1, which is about ten times lower
than that provided by the ELISA kit used as reference method [11]. The
precision, expressed as the percentage of relative standard deviation and
assayed at two different soy protein concentrations, 0.5 and 5 mg L‐1, gave
values of 9.6% and 6.1 %, respectively.
[soy protein], mg L-1
0.001 0.01 0.1 1 10
RE
LA
TIV
E F
LU
OR
ES
CE
NC
E IN
TE
NS
ITY
0
2000
4000
6000
8000
10000
12000
14000
16000
Capítulo 2
‐ 138 ‐
The selectivity of the method mainly depends on anti‐soy protein
antibodies selectivity. According to the antibody specification sheet, these
antibodies present some cross‐reactivity towards hot urea extracts of wheat
and ovalbumin, but no cross‐reactivity is observed in extracts from meat,
corn or casein, and rice or potato flour.
Additionally, in a previous work that involved the use of the same
anti‐soy protein antibodies [14], it was found that bovine serum albumin ,
γ‐globulins, myoglobin and hemoglobin were tolerated in excess higher
than 80‐fold the analyte concentration.
3.3 Applications
The method was applied to the analysis of milk, yoghourt and fruit
juice samples containing soy proteins. The sample treatment includes the
same procedure used for soy protein standard preparation to obtain soy
protein with a suitable conformation to be recognized by the antibody.
Similar procedures have been used for the treatment of some food samples
in immunoassays intended for soy protein determination [22]. These
samples were also analysed using a commercial ELISA kit [11], thus being
extracted using a commercial extraction solution for samples containing
polyphenols, according to the protocol given by the manufacturer.
Table 1 shows the soy protein content found by the reported
immunoassay and the ELISA method, which were compared by a paired t‐
test carried out at a 95% significance level, finding that there were not
statistically relevant differences between them.
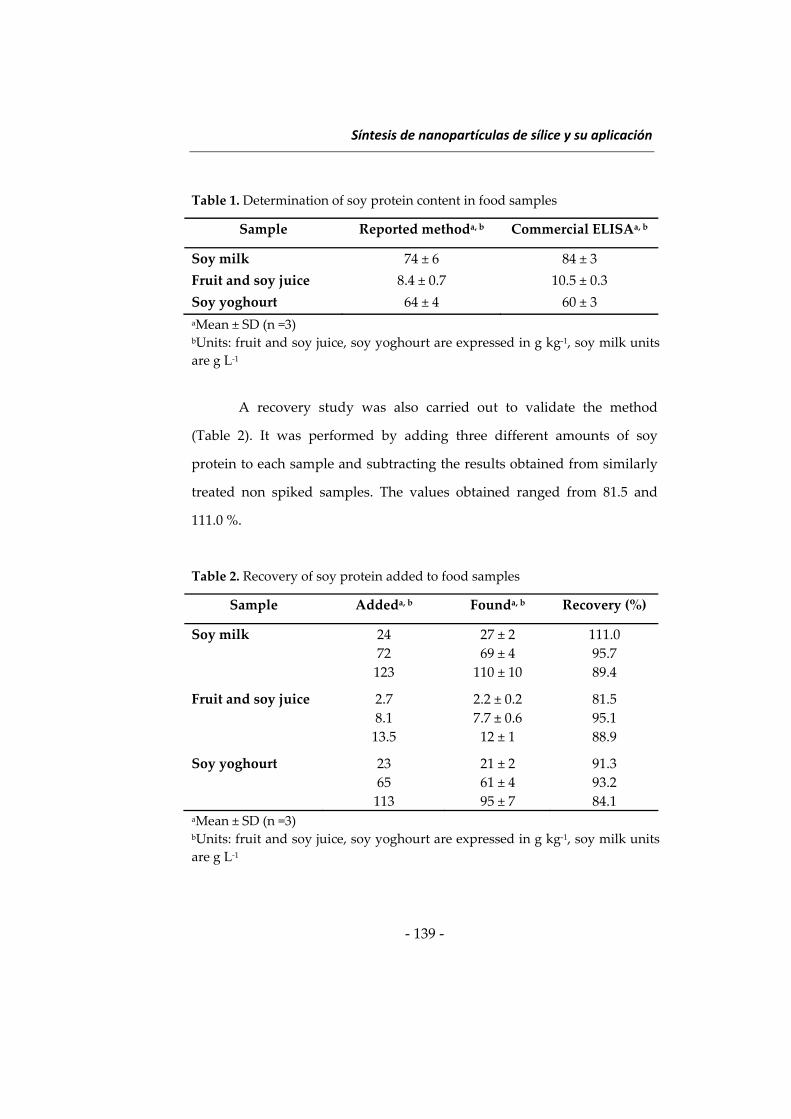
Síntesis de nanopartículas de sílice y su aplicación
‐ 139 ‐
Table 1. Determination of soy protein content in food samples
Sample Reported methoda, b Commercial ELISAa, b
Soy milk 74 ± 6 84 ± 3
Fruit and soy juice 8.4 ± 0.7 10.5 ± 0.3
Soy yoghourt 64 ± 4 60 ± 3
aMean ± SD (n =3) bUnits: fruit and soy juice, soy yoghourt are expressed in g kg‐1, soy milk units
are g L‐1
A recovery study was also carried out to validate the method
(Table 2). It was performed by adding three different amounts of soy
protein to each sample and subtracting the results obtained from similarly
treated non spiked samples. The values obtained ranged from 81.5 and
111.0 %.
Table 2. Recovery of soy protein added to food samples
Sample Addeda, b Founda, b Recovery (%)
Soy milk 24 27 ± 2 111.0
72 69 ± 4 95.7
123 110 ± 10 89.4
Fruit and soy juice 2.7 2.2 ± 0.2 81.5
8.1 7.7 ± 0.6 95.1
13.5 12 ± 1 88.9
Soy yoghourt 23 21 ± 2 91.3
65 61 ± 4 93.2
113 95 ± 7 84.1 aMean ± SD (n =3) bUnits: fruit and soy juice, soy yoghourt are expressed in g kg‐1, soy milk units
are g L‐1
Capítulo 2
‐ 140 ‐
4. Conclusions
The reported method can be regarded as a useful alternative to
enzyme‐linked immunosorbent assays , since the use of enzyme conjugate
and substrate solutions are avoided, thus decreasing the number of steps
required. In addition, the detection limit achieved with the reported
method is lower than that provided by some ELISA assays described for
this purpose [11]. The use of the 96‐well format ensures the automation of
the assay together with a relatively high sample throughput compared to
other methods, which include sequential operations. Proxy‐plates allow the
use of lower sample and tracer volumes than conventional 300‐μL wells,
which contribute to minimize the costs associated to the immunoassay.
The results obtained for the analysis of real food samples using
the reported method are in accordance with those provided by an ELISA
method used as a reference, which indicates the practical usefulness of the
developed method.
Acknowledgements
Authors gratefully acknowledge financial support from the
MICINN (Grant No. CTQ2009‐08621), from the Junta of Andalucia (Grant
No. P09‐FQM4933) and from the FEDER‐FSE Program (Grant No. P09‐
FQM4933). J. Godoy Navajas thanks the Junta of Andalucia (Grant No.
P09‐FQM4933) for the financial support of his pre‐doctoral fellowship.
Síntesis de nanopartículas de sílice y su aplicación
‐ 141 ‐
References
(1) M. Friedman, D.L. Brandon. Nutritional and health benefits of soy
proteins. J. Agr. Food Chem. (2001) 49, 1069‒1086.
(2) E. F. E. Babiker, A. Hiroyuki, N. Matsudomi, H. Iwata, T. Ogawa, N.
Bando, A. Kato. Effect of polysacchraride conjugation or
transflutaminase treatment on the allergenicity and functional
properties of soy protein. J. Agr. Food Chem. (1998) 46, 866‒871.
(3) H.D. Belitz, W. Grosch, P. Schieberle, Food Chemistry, 3rd ed.,
Springer‐Verlag, 2004, p.750.
(4) J.H.G. Cordewener, D.M.A.M. Luykx, R. Frankhuizen, M.G.E.G.
Bremer, H. Hooijerink, A.H.P. America. Untargeted LC‐Q‐TOF
mass spectrometry method for the detection of adulterations in
skimmed‐milk powder. J. Sep. Sci. (2009) 32, 1216‒1223.
(5) M. De Angelis, R. Di Cagno, F. Minervini, C.G. Rizzello, M.
Gobbetti. Two‐dimensional electrophoresis and IgE‐mediated food
allergy. Electrophoresis (2010) 31, 2126‒2136.
(6) H.B. Krishnan, W.S. Kim, M.S. Kerley. All three subunits of soybean
β‐Conglycinin are potential food allergens. J. Agr. Food Chem. (2009)
57, 938‒943.
(7) D.L. Brandon, M. Friedman. Immunoassays of soy proteins. J. Agr.
Food Chem. (2002) 50, 6635‒6642.
(8) J.M. Yeung, P.G. Collins. Determination of soy proteins in food
products by enzyme immunoassay. Food Technol. Biotechnol. (1997)
35, 209 ‐ 214.
(9) L. Sánchez, M.D. Puyol, M. Calvo, G. Brett, T.M.P. Cattaneo, W.
Haasnoot, R. López‐Fandino, M.A. Manso, L. Mata, P. Razquín, A.
Capítulo 2
‐ 142 ‐
Sánchez, C. Svenning, G.E. Vegarud. Determination of vegetal
proteins in milk powder by enzyme‐liked immunosorbent assay:
Interlaboratory study. J. AOAC Int. (2002) 85, 1390‒1397.
(10) A.F. González‐Córdova, A.M. de la Barca, M. Cota, B. Vallejo‐
Córdoba. Immunochemical detection of adulteration of pork chorizo
sausage with soy protein. Food Sci. Technol. Int. (1998) 4, 257‒262.
(11) L. L’Hocine, J.I. Boye, C. Munyana. Detection and quantification of
soy allergens in food: study of two commercial enzyme‐linked
immunosorbent assays. J. Food Sci. (2007) 72, C145‒C153.
(12) W. Haasnoot, K. Olieman, G. Cazemier, R. Verheijen. Direct
biosensor immunoassays for the detection of nonmilk proteins in
milk powder. J. Agr. Food Chem. (2001) 49, 5201‒5206.
(13) W. Haasnoot, J.G. Du Pré. Luminex‐based triplex immunoassay for
the simultaneous detection of soy, pea, and soluble wheat proteins in
milk powder. J. Agr. Food Chem. (2007) 55, 3771‒3777.
(14) M.L. Sánchez‐Martínez, M.P. Aguilar‐Caballos, A. Gómez‐Hens.
Homogeneous immunoassay for soy protein determination in food
samples using gold nanoparticles as labels and light scattering
detection. Anal. Chim. Acta (2009) 636, 58‒62.
(15) J. Godoy‐Navajas, M.P. Aguilar‐Caballos, A. Gomez‐Hens. Synthesis
and characterization of oxazine‐doped silica nanoparticles for their
potential use as stable fluorescent reagents. J. Fluoresc. (2010) 20, 171‒
180.
(16) D. Knopp, D. Tang, R. Niessner. Review: bioanalytical applications
of biomolecule‐fuctionalized nanometer‐sized doped silica particles.
Anal. Chim. Acta (2009) 647, 14‒30.
Síntesis de nanopartículas de sílice y su aplicación
‐ 143 ‐
(17) V.S. Prisyaznoy, M. Fusek, Y.B. Alakhow. Synthesis of high‐capacity
immunoaffinity sorbents with oriented immobilized
immunoglobulins or their Fab fragments for isolation of proteins. J.
Chromatogr. (1988) 424, 243‒253.
(18) J. Yan, M. C. Estévez, J. E. Smith, K. Wang, X. He, L. Wang and W.
Tan. Dye‐doped nanoparticles for bioanalysis. NanoToday (2007) 2,
44‒50.
(19) R.P. Bagwe, L.R. Hilliard, W. Tan. Surface modification of silica
nanoparticles to reduce aggregation and nonspecific binding.
Langmuir (2006) 22, 4357‒4362.
(20) T. Bantan‐Polak, M. Kassai, K.B. Grant. A comparison of
fluorescamine and naphthalene‐2,3‐dicarboxaldehyde fluorogenic
reagents for microplate‐based detection of amino acids. Anal.
Biochem. (2001) 297, 128‒136.
(21) G.L. Long, J.D. Winefordner. Limit of detection: a closer look at the
IUPAC definition. Anal. Chem. (1983) 55, 712A ‐ 724A.
(22) J. Belloque, M.C. García, M. Torre, M.L. Marina. Analysis of
soyabean proteins in meat products: a review. Crit. Rev. Food Sci.
Nutr. (2002) 42, 507 ‐ 532.

Síntesis de nanopartículas de sílice y su aplicación
‐ 145 ‐
Determination of monensin in milk samples by front‐surface
long‐wavelength fluoroimmunoassay using nile blue‐doped
silica nanoparticles as labels
Juan Godoy‐Navajas, Maria Paz Aguilar‐Caballos, Agustina Gómez‐Hens
Department of Analytical Chemistry. Institute of Fine Chemistry and Nanochemistry
(IQFN). Campus of Rabanales. Annex to Marie Curie (C‐3) Building. University of
Cordoba.14071‐Cordoba. Spain.
Abstract
A heterogeneous immunoassay for monensin determination in milk
samples using a tracer formed by anti‐monensin antibodies bound to nile blue
(NB)‐doped silica nanoparticles (NPs), 96‐well microplates as solid supports
and long‐wavelength fluorescence measurements is described for the first
time. The assay relies on the competition of the monensin present in the
samples with a monensin‐bovine serum albumin conjugate, which was
immobilized onto the well surface, for the active sites of anti‐monensin
antibodies. After subsequent incubation and washing steps, the fluorescence of
the bound tracer fraction is measured onto the dry surface of the well. An
antigen capture format was also assayed by immobilizing anti‐sheep IgG
previously to the incubation of sheep anti‐monensin antibodies and using a
tracer formed by monensin bound to nile blue‐doped silica NPs, which
competes with the analyte for binding the immobilized antibody. Although the
fluorescence signal obtained in both formats can be correlated to the analyte
concentration, better results were obtained using the antibody capture format.
After the optimization of the system using this format, the method features a
detection limit of 0.015 μg L‐1 and a dynamic range from 0.05 to 5 μg L‐1. The
precision, assayed at two different analyte concentrations, 0.2 and 1 μg L‐1, and
expressed as relative standard deviation, gave values of 5.9% and 4.0%,
respectively. The method was satisfactorily applied to the analysis of milk
samples, which only required a simple extraction step in order to remove the
proteins from samples, giving recoveries in the range 83.3 ‐ 107.5%.
Keywords: monensin; milk samples; long‐wavelength front‐surface fluorescence;
immunoassay; nile‐blue‐doped silica nanoparticles
Capítulo 2
‐ 146 ‐
1. Introduction
Monensin is a veterinary drug polyether ionophore produced by
Streptomyces cinnamonensis that exhibits both antibacterial and anticoccidial
activities and has been traditionally used to prevent coccidiosis in poultry
[1]. This antibiotic has been considered as a growth‐promoter, since this
disease prevents the growth of poultry owing to the bloody diarrhea and
weight loses associated. Although the use of many veterinary antibiotics as
growth promoters has been banned since 2006, they can be still
administered to some species according to the EU Regulation 1831/2003/EC
[2]. Also, the treatment with monensin has been extended to calves for
which the EU has set maximum residue limits (MRL) of 2 μg kg‐1 in bovine
muscle, kidney and milk, 10 μg kg‐1 in fat and 30 μg kg‐1 in liver, the
residues being determined in all the samples as unchanged monensin, as
stated in the 37/2010/EC regulation [3].
The concern on food safety has led to the search for reliable
analytical methods to screen and confirm the presence of antibiotic
residues in foodstuffs to reduce the increasing bacterial resistance to
antibiotics. The determination of polyether ionophore antibiotics has been
traditionally performed using liquid chromatographic methods with UV
and fluorometric detection after their derivatization [4, 5]. This step is
required owing to the lack of suitable chromophore and/or fluorophore
groups in their structure, except for lasalocid, which has been determined
by measuring its intrinsic fluorescence [4].
Nowadays, several LC‐MS/MS methods have been developed for
the determination of cocciodiostats [6 ‐ 10] and for multiclass residue
analysis including the ionophore class [11 ‐ 13]. These confirmatory
Síntesis de nanopartículas de sílice y su aplicación
‐ 147 ‐
methods require the availability of a sophisticated and expensive technique
and, sometimes, are time‐consuming owing to the extraction and further
clean‐up procedures involved. For this reason, the use of screening
methods plays two essential roles: in one hand, the number of samples
subjected to confirmatory analysis is lower and, on the other, the cost of the
analysis is reduced. Immunoassays, whenever used in a quantitative or
semi‐quantitative way, have shown their usefulness as screening methods
for antimicrobial residues in foodstuffs [14 ‐ 21]. Several commercial and
non‐commercial enzyme‐linked immunosorbent assays (ELISAs) have
been described for the determination of monensin in biological [14 ‐ 18]
and environmental [19] samples. Most of these methods involve the use of
photometric measurements, reaching detection limits close to 1 ng mL‐1,
but a lower detection limit (0.06 ng mL‐1) has been reported using
chemiluminescence detection [18]. Also, time‐resolved
fluoroimmunoassays involving the use of an europium (III) chelate as label
have been described for monensin determination [20, 21], but the detection
limit reached is very similar to those obtained using ELISA with
photometric detection.
The use of functionalized inorganic matrix nanoparticles (NPs) as
alternative labels in immunoassay is a relatively new trend justified by
their versatile physicochemical properties which allow the improvement of
the features of these assays [22 ‐ 25]. Among these NPs, doped silica NPs
are a useful option owing to their chemical and thermal stability, fine
dispersion in aqueous solution, transparency to visible light, capability to
encapsulate a wide variety of compounds and relatively inert
environmental behavior, in addition to their large surface area and easy
Capítulo 2
‐ 148 ‐
surface functionalization [25]. These properties have given rise to a great
variety of immunoassay methods, which have been mainly devoted to the
determination of macromolecules, such as tumor markers [23, 24].
The immunoassay reported here shows the usefulness of nile blue
(NB)‐doped silica NPs as labels for the determination of monensin in milk
samples using long‐wavelength fluorescence measurements, which
provide the spectral selectivity required to avoid interferences from the
sample matrix. The synthesis and optical properties of these NPs have been
recently reported [26]. Although a limitation of dye‐doped silica NPs is the
potential dye leakage, owing to the porosity of silica material, NB‐doped
silica NPs show an excellent stability, which is ascribed to the interaction of
the cationic dye with the negative silanol groups from silica matrix. These
NPs have been used as labels in a heterogeneous immunoassay for soy
protein determination in several food samples [27], reaching a detection
limit about 10 times lower than the afforded by a commercial ELISA kit
available for the determination of these proteins.
To the best of our knowledge, the method proposed here is the first
immunoassay for monensin determination using NPs as labels, which
shows their capability to improve the analytical features, such as the
detection limit, of the immunoassays previously described for the
determination of this drug [14 ‐ 18, 20, 21]. Although most of these assays
are applied to the analysis of plasma and liver samples, milk samples have
been chosen in this instance because they are easily obtained and allow a
non‐invasive detection of monensin for its safe use in milk producing
animals. The sample treatment is quite simple as it only requires a
deproteinization step and a suitable dilution.
Síntesis de nanopartículas de sílice y su aplicación
‐ 149 ‐
2. Experimental
2.1. Instrumentation
A 1420 Multilabel counter Victor 3V microplate reader (Perkin
Elmer and Analytical Sciences, WallacOy, Turku, Finland) was used to
perform fluorescence measurements. Two filters (nominal
wavelength/passband) were used to select the excitation (620/8 nm) and
emission (680/10 nm) wavelengths of the doped NPs. An additional filter
(531/25 nm) was used to perform absorbance measurements using the
Komarowsky reaction in order to calculate monensin concentrations.
Fluorescence measurements were performed using the constant voltage
mode of the instrument with an integration time of 1 s. NP size
characterization was performed by TEM as described elsewhere [26, 27].
Black and shallow 100‐μL well proxy‐plate 96‐well microplates (Perkin
Elmer) were assayed as support for the development of the heterogeneous
immunoassay method.
2.2. Reagents and solutions
All the reagents were of analytical grade and were used as supplied
by the manufacturer. Triton X‐100, NB chloride, sodium acetate, sodium
chloride, sodium borohydride, monensin sodium salt, anhydrous
N‐dimethylformamide (DMF), N‐hydroxysulfosuccinimide sodium salt
(sulfo‐NHS), N‐(3‐dimethylaminopropyl)‐N´‐ethylcarbodiimide hydro‐
chloride (EDAC), bovine serum albumin (BSA) and sodium carbonate were
obtained from Sigma‐Aldrich (USA). Tetraethyl orthosilicate (TEOS), (3‐
aminopropyl)‐triethoxysilane (APS), 3‐(trihydroxysilyl)propylmethyl‐
phosphonate monosodium salt (THPMP) and vanillin were supplied by
Capítulo 2
‐ 150 ‐
Aldrich (Germany). 1‐Hexanol and di‐potassium hydrogen phosphate
were acquired from Merck (Germany). Acetone, absolute ethanol, sodium
tetraborate, sulphuric acid and methanol were obtained from Panreac
(Spain), sodium metaperiodate from Scharlau (Spain) and sheep polyclonal
antibody to monensin was supplied by Abcam (United Kingdom).
NB solution was prepared in distilled water according to the
aforementioned procedures [26, 27]. A 1.0 g L‐1 stock solution of monensin
was prepared by dissolving the appropriate amount of monensin sodium
salt in ethanol. Intermediate and working monensin solutions were
prepared by further dilution in phosphate buffer solution (0.015 M, pH
8.0). Phosphate (0.015 M, pH 8.0), acetate (0.1 M, pH 5.5 and pH 4.5), and
carbonate (0.05 M, pH 9.0) buffer solutions were prepared by dissolving
the appropriate amount of these salts and adjusting the pH with either
hydrochloric acid or sodium hydroxide when appropriate. The
Komarowsky reagent solution [5, 28] was prepared by dissolving vanillin
(4 g) in methanol, adding 2 mL of concentrated sulphuric acid to adjust the
pH and raising the mixture to 100 mL with methanol. This solution was
freshly prepared whenever used.
2.3. Procedures
2.3.1. Synthesis and functionalization of NPs
The procedure used to synthesize NB‐doped silica NPs is similar to
a reverse‐micelle microemulsion method previously reported [26, 27].
Briefly: an amount of Triton X‐100 (510 ‐ 530 mg or 0.79 ‐ 0.82 mmol) was
dissolved in 9.6 mL (0.53 mol) of distilled water by stirring vigorously this
mixture for 5 min. Then, a volume of 100 μL (0.44 mmol) of TEOS was
Síntesis de nanopartículas de sílice y su aplicación
‐ 151 ‐
added and the solution was stirred for 5 min. A volume (1.8 mL) of 10‐3 M
(1.8 μmol) NB was added and the mixture stirred again for 5 min.
Afterwards, 3 mL (0.024 mol) of hexanol were added and the
microemulsion formed was stirred for 15 min. Concentrated ammonium
hydroxide (70 μL, 0.9 mmol) was then added and the mixture stirred for 5
min to start the TEOS hydrolysis and condensation reactions. The mixture
was then placed in a thermostated tank at 25 °C for 24 h in the dark and,
afterwards, it was centrifuged for 5 min at 537 x g to separate the phases
involved. The upper phase (about 3 mL) was transferred to a 10‐mL beaker
and 40 μL of APS and 80 μL of THPMP were added to introduce amino
groups onto NP surface. This mixture was magnetically stirred during 1.5
h in a water bath at 25 °C. Afterwards, the microemulsion was broken by
adding 10 mL of acetone and stirring for 5 min. The supernatant was
discarded and NPs were recovered from the bottom with 8 ‐ 10 mL of
distilled water. The mixture was centrifuged for 5 min at 9300 x g to
separate the NPs from unreacted reagents. Then, the NP precipitate was
washed with ethanol and water until the fluorescence intensity of
supernatants was similar to the blank and, finally, the NPs were re‐
dispersed in 1 mL of phosphate buffer solution.
2.3.2. Preparation of tracers using nile blue‐doped silica NPs
NB‐doped silica NPs were coupled to either anti‐monensin
antibodies or monensin to obtain the tracers required to study the potential
determination of this drug using antibody or antigen capture format,
respectively. The synthesis of the NPs‐anti‐monensin antibodies tracer
involves an oxidation step of carbohydrate moieties of the antibody
Capítulo 2
‐ 152 ‐
molecule to give rise to aldehyde groups capable of reacting to amino
groups of the NP surface. Firstly, 200 μL of 1.2 μM anti‐monensin antibody
solution prepared in 0.1 M phosphate buffer solution at pH 7.5, were
diluted with 0.1 M sodium acetate buffer solution (pH 5.5) until a volume
of 2 mL, and 200 μL of 0.1 M sodium metaperiodate solution were added
to this volume. The mixture was let to stand for 20 min at 0 °C, layered on a
HiTrap Desalting Column (GE Healthcare) equilibrated with 25 mL acetate
buffer solution (pH 4.5), at a 5 mL/min flow‐rate, and 400‐μL fractions
were taken. Their absorbance was monitored at 280 nm and the anti‐
monensin protein was recovered from fractions 7 to 11, accounting for
about 2 mL of solution. This volume was added to the amino‐modified NP‐
doped silica NPs, which had been previously centrifuged to remove
phosphate buffer solution. The mixture was incubated for 5 min at room
temperature and then, 50 μL of 0.66 M NaBH4 solution were added to the
dispersion and allowed to react for 20 h at 4 °C. Afterwards, the reaction
mixture was centrifuged and the NP‐anti‐monensin protein conjugate
obtained was washed with phosphate buffer solution (0.015 M, pH 8.0).
Finally, the tracer was re‐dispersed in 1 mL of the same phosphate molar
concentration solution and stored at 4 °C for further use.
The synthesis of the NPs‐monensin tracer was performed using a
carbodiimide reaction in which 200 μl of a 2 g L‐1 monensin solution in
DMF were mixed with the same volume of a 0.2 M EDAC solution
prepared in 0.05 M 2‐(N‐morpholino)‐ethanesulphonic acid (MES) at pH
6.2 and 21.6 mg of sulfo‐NHS were then added, being the mixture raised to
2 mL with the same MES buffer solution and incubated at room
temperature for 15 min. Then, 40 μL of 1 M 2‐mercaptoethanol were added
Síntesis de nanopartículas de sílice y su aplicación
‐ 153 ‐
and the mixture was left to stand for 10 min. An appropriate volume (50
μL) of this mixture was mixed together with the amino‐functionalized NB‐
doped silica NPs and 950 μL of phosphate saline buffer were added and
the resulting mixture was incubated for 2 h at room temperature. After this
time, the synthesized tracer was washed using absolute ethanol and
phosphate buffer solution, reconstituted in 1 mL of the same phosphate
molar concentration solution and stored at 4 °C until use.
2.3.3. Synthesis of BSA‐monensin conjugate
The use of a BSA‐monensin conjugate was required to immobilize
monensin onto the wells. The coupling of monensin to BSA molecule was
performed via a carbodiimide reaction [29] using the following procedure:
an amount of monensin (0.2 mmol) was dissolved in 1 mL of dry DMF,
then sulfo‐NHS (23.0 mg, 0.1 mmol) and EDAC (41.2 mg, 0.2 mmol) were
added in order to activate the carboxylic acid group of monensin. The
mixture was stirred at room temperature for 4 h, and then was centrifuged
to remove the precipitate from the acylisourea derivative formed. An
aliquot (250 μL) of the activated hapten solution was added dropwise to a
stirred BSA solution prepared by dissolving BSA (50 mg) in 5 mL of 0.05 M
borate buffer (pH 7.8) and DMF (1.05 mL). The synthesized conjugate was
purified using a HiTrap Desalting column (GE Healthcare) by a similar
procedure to that described above for the synthesis of NP‐anti monensin
conjugate.
The concentration of monensin in the conjugate was determined
using the Komarowsky reaction [5, 28] by reacting 500 μL aliquots of
monensin standard or BSA‐monensin conjugate dilutions prepared in
Capítulo 2
‐ 154 ‐
methanol to 1 mL of Komarowsky reagent in glass test tubes. These tubes
were sealed and placed in a water bath at 80 °C for 5 min. The red‐purple
color indicative of monensin presence was measured at 520 nm
immediately after cooling the tubes to room temperature. The BSA
concentration in the synthesized conjugate was calculated from the
absorbance of the protein measured at 280 nm. As a convention, the
concentration of the conjugate will be given in terms of the monensin
concentration found by using the abovementioned Komarowsky reaction.
2.3.4. Determination of monensin
The competitive heterogeneous immunoassay with antibody
capture involves the previous immobilization of the BSA‐monensin
conjugate in the well, which was performed by adding 60 μL of a 10 mg L‐1
BSA‐monensin conjugate prepared in carbonate buffer solution (0.05 M,
pH 9.0) to each well, and incubating the microplates overnight at 4 °C.
Afterwards, wells were washed three times with phosphate solution (0.015
M, pH 8.0) and the plates were stored at 4 °C until use.
To perform the immunoassay, a volume (60 μL) of a pre‐incubated
mixture, prepared by mixing 75 μL of NB‐doped silica NPs‐labeled anti‐
monensin antibody (10 nM) in phosphate molar concentration solution
(0.015 M, pH 8.0), and 225 μL of monensin antibiotic standard or sample
solution (0.05 ‐ 5 μg L‐1) were added to each well. The microplate was
incubated for 1.5 h at 37 °C, the wells were washed for three times with the
same phosphate buffer solution, and dried for 10 min at room temperature.
Then, fluorescence measurements were directly performed at λex 620 and
λem 680 nm onto the solid surface of the well.
Síntesis de nanopartículas de sílice y su aplicación
‐ 155 ‐
2.3.5. Analysis of milk samples
The sample preparation involved the deproteinization of food
samples using a slight modification of a previously described procedure
[21]: 0.4 g of milk sample was acidified with 0.1 mL of 0.1 M hydrochloric
acid and mixed with 1.6 mL of pure acetonitrile in order to quantitatively
precipitate all proteins. Then, the mixture was vigorously mixed during 30
min and centrifuged (2722 x g, 10 min, 10 °C). The supernatant was
collected in an Eppendorf tube® and was evaporated to dryness under a
gentle stream of nitrogen at 65 °C in order to achieve a medium compatible
with the immunoassay. Then, the samples were reconstituted in 3 mL of
phosphate buffer solution 0.015 M pH 8.0.
Spiked samples were prepared by adding suitable amounts of
monensin standard to 10 g of skimmed milk, semi skimmed milk and
whole milk and allowing sample matrix and standards to equilibrate for
1.5 h. Aliquots of 0.4 g were treated as described above for non‐spiked
samples.
3. Results and discussion
3.1. Choice and optimization of the immunoassay system
Two heterogeneous competitive immunoassays, involving
antibody or antigen capture format, were assayed to choose the best option
for monensin determination using NB‐doped silica NPs as labels. The first
format was based on the immobilization of a BSA‐monensin conjugate and
the use of an anti‐monensin antibody‐NP tracer, which was synthesized by
a similar procedure to that described in an immunoassay for soy protein
determination [27]. The second assay needed a monensin‐NP tracer,
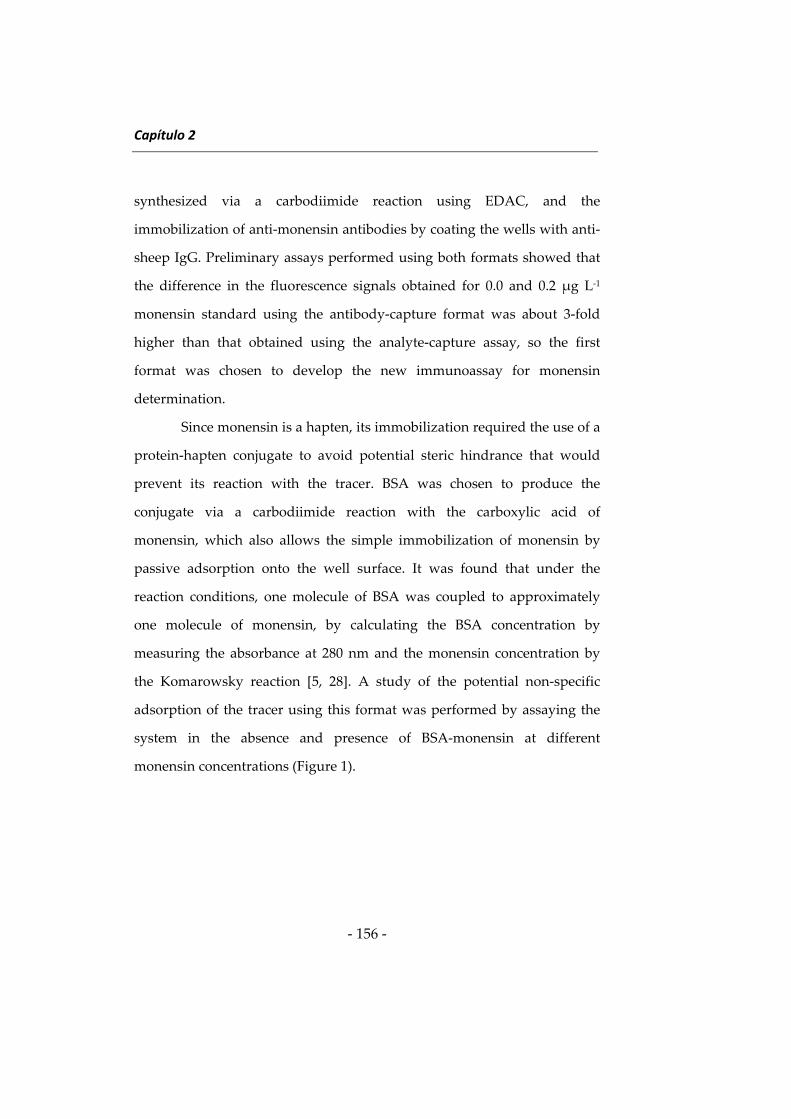
Capítulo 2
‐ 156 ‐
synthesized via a carbodiimide reaction using EDAC, and the
immobilization of anti‐monensin antibodies by coating the wells with anti‐
sheep IgG. Preliminary assays performed using both formats showed that
the difference in the fluorescence signals obtained for 0.0 and 0.2 μg L‐1
monensin standard using the antibody‐capture format was about 3‐fold
higher than that obtained using the analyte‐capture assay, so the first
format was chosen to develop the new immunoassay for monensin
determination.
Since monensin is a hapten, its immobilization required the use of a
protein‐hapten conjugate to avoid potential steric hindrance that would
prevent its reaction with the tracer. BSA was chosen to produce the
conjugate via a carbodiimide reaction with the carboxylic acid of
monensin, which also allows the simple immobilization of monensin by
passive adsorption onto the well surface. It was found that under the
reaction conditions, one molecule of BSA was coupled to approximately
one molecule of monensin, by calculating the BSA concentration by
measuring the absorbance at 280 nm and the monensin concentration by
the Komarowsky reaction [5, 28]. A study of the potential non‐specific
adsorption of the tracer using this format was performed by assaying the
system in the absence and presence of BSA‐monensin at different
monensin concentrations (Figure 1).
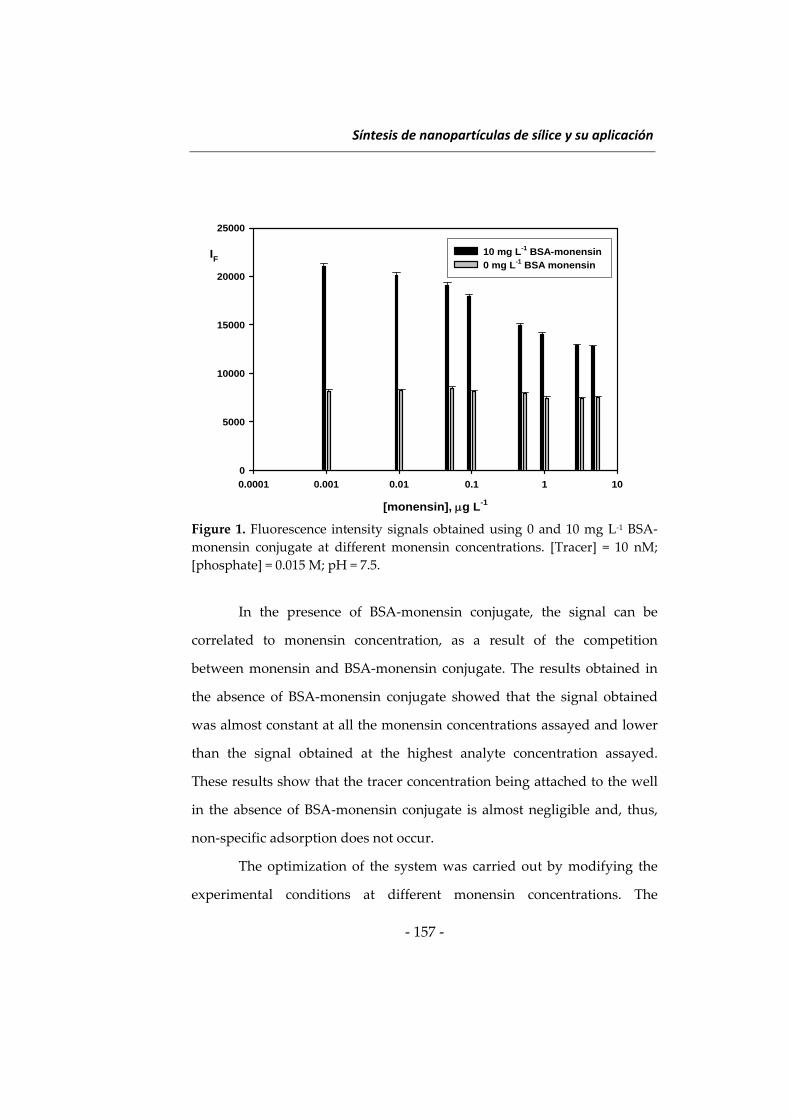
Síntesis de nanopartículas de sílice y su aplicación
‐ 157 ‐
Figure 1. Fluorescence intensity signals obtained using 0 and 10 mg L‐1 BSA‐
monensin conjugate at different monensin concentrations. [Tracer] = 10 nM;
[phosphate] = 0.015 M; pH = 7.5.
In the presence of BSA‐monensin conjugate, the signal can be
correlated to monensin concentration, as a result of the competition
between monensin and BSA‐monensin conjugate. The results obtained in
the absence of BSA‐monensin conjugate showed that the signal obtained
was almost constant at all the monensin concentrations assayed and lower
than the signal obtained at the highest analyte concentration assayed.
These results show that the tracer concentration being attached to the well
in the absence of BSA‐monensin conjugate is almost negligible and, thus,
non‐specific adsorption does not occur.
The optimization of the system was carried out by modifying the
experimental conditions at different monensin concentrations. The
[monensin], g L-1
0.0001 0.001 0.01 0.1 1 10
IF
0
5000
10000
15000
20000
25000
10 mg L-1 BSA-monensin 0 mg L-1 BSA monensin
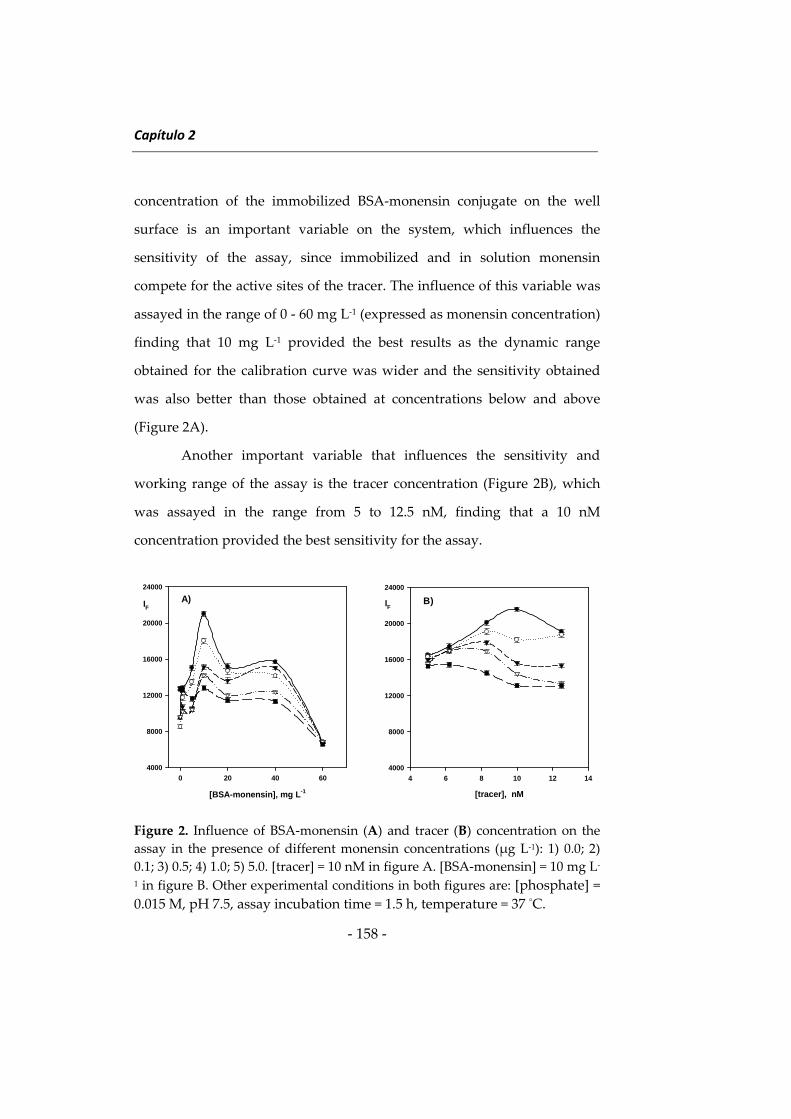
Capítulo 2
‐ 158 ‐
concentration of the immobilized BSA‐monensin conjugate on the well
surface is an important variable on the system, which influences the
sensitivity of the assay, since immobilized and in solution monensin
compete for the active sites of the tracer. The influence of this variable was
assayed in the range of 0 ‐ 60 mg L‐1 (expressed as monensin concentration)
finding that 10 mg L‐1 provided the best results as the dynamic range
obtained for the calibration curve was wider and the sensitivity obtained
was also better than those obtained at concentrations below and above
(Figure 2A).
Another important variable that influences the sensitivity and
working range of the assay is the tracer concentration (Figure 2B), which
was assayed in the range from 5 to 12.5 nM, finding that a 10 nM
concentration provided the best sensitivity for the assay.
Figure 2. Influence of BSA‐monensin (A) and tracer (B) concentration on the
assay in the presence of different monensin concentrations (μg L‐1): 1) 0.0; 2)
0.1; 3) 0.5; 4) 1.0; 5) 5.0. [tracer] = 10 nM in figure A. [BSA‐monensin] = 10 mg L‐
1 in figure B. Other experimental conditions in both figures are: [phosphate] =
0.015 M, pH 7.5, assay incubation time = 1.5 h, temperature = 37 °C.
[BSA-monensin], mg L-1
0 20 40 60
IF
4000
8000
12000
16000
20000
24000
A)
[tracer], nM
4 6 8 10 12 14
IF
4000
8000
12000
16000
20000
24000
B)
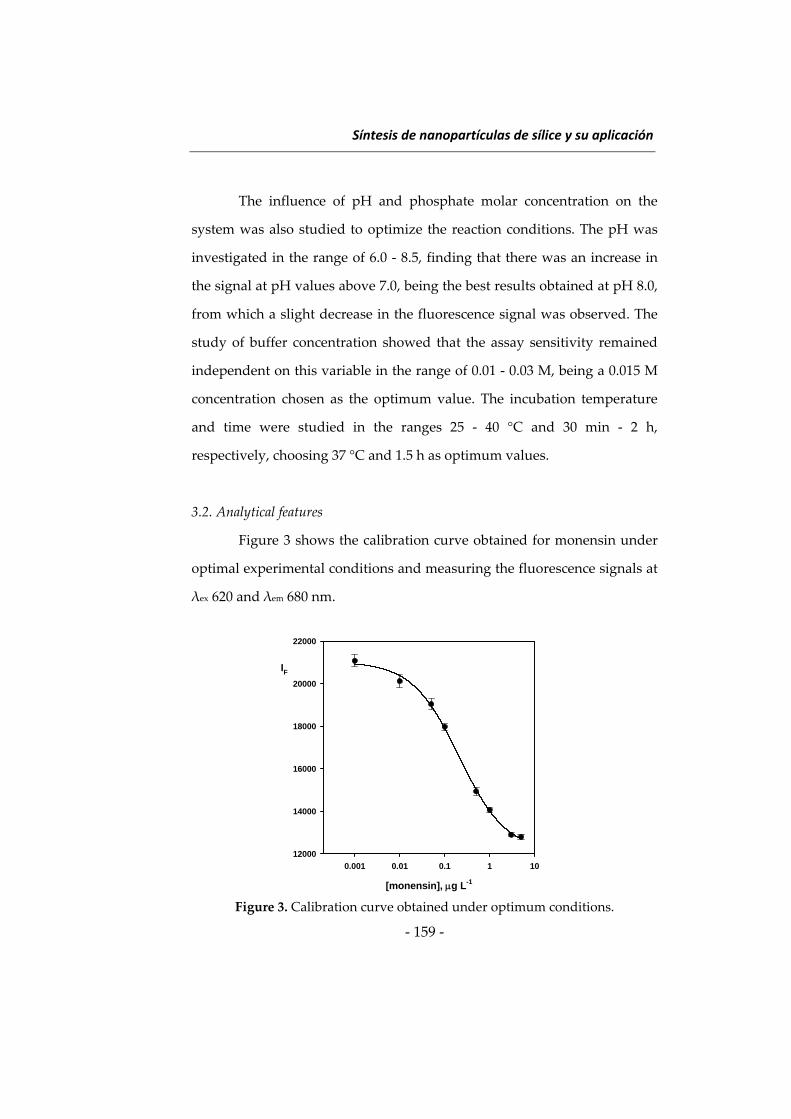
Síntesis de nanopartículas de sílice y su aplicación
‐ 159 ‐
The influence of pH and phosphate molar concentration on the
system was also studied to optimize the reaction conditions. The pH was
investigated in the range of 6.0 ‐ 8.5, finding that there was an increase in
the signal at pH values above 7.0, being the best results obtained at pH 8.0,
from which a slight decrease in the fluorescence signal was observed. The
study of buffer concentration showed that the assay sensitivity remained
independent on this variable in the range of 0.01 ‐ 0.03 M, being a 0.015 M
concentration chosen as the optimum value. The incubation temperature
and time were studied in the ranges 25 ‐ 40 °C and 30 min ‐ 2 h,
respectively, choosing 37 °C and 1.5 h as optimum values.
3.2. Analytical features
Figure 3 shows the calibration curve obtained for monensin under
optimal experimental conditions and measuring the fluorescence signals at
λex 620 and λem 680 nm.
Figure 3. Calibration curve obtained under optimum conditions.
[monensin], g L-1
0.001 0.01 0.1 1 10
IF
12000
14000
16000
18000
20000
22000
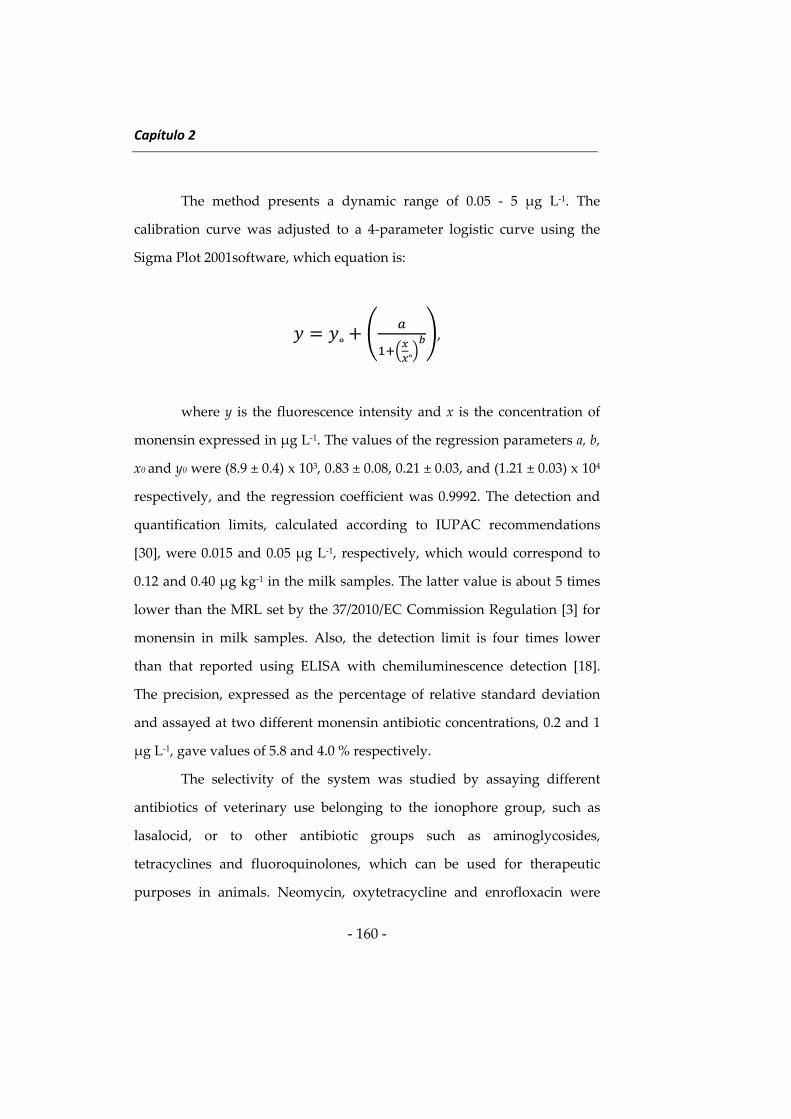
Capítulo 2
‐ 160 ‐
The method presents a dynamic range of 0.05 ‐ 5 μg L‐1. The
calibration curve was adjusted to a 4‐parameter logistic curve using the
Sigma Plot 2001software, which equation is:
˳˳
,
where y is the fluorescence intensity and x is the concentration of
monensin expressed in μg L‐1. The values of the regression parameters a, b,
x0 and y0 were (8.9 ± 0.4) x 103, 0.83 ± 0.08, 0.21 ± 0.03, and (1.21 ± 0.03) x 104
respectively, and the regression coefficient was 0.9992. The detection and
quantification limits, calculated according to IUPAC recommendations
[30], were 0.015 and 0.05 μg L‐1, respectively, which would correspond to
0.12 and 0.40 μg kg‐1 in the milk samples. The latter value is about 5 times
lower than the MRL set by the 37/2010/EC Commission Regulation [3] for
monensin in milk samples. Also, the detection limit is four times lower
than that reported using ELISA with chemiluminescence detection [18].
The precision, expressed as the percentage of relative standard deviation
and assayed at two different monensin antibiotic concentrations, 0.2 and 1
μg L‐1, gave values of 5.8 and 4.0 % respectively.
The selectivity of the system was studied by assaying different
antibiotics of veterinary use belonging to the ionophore group, such as
lasalocid, or to other antibiotic groups such as aminoglycosides,
tetracyclines and fluoroquinolones, which can be used for therapeutic
purposes in animals. Neomycin, oxytetracycline and enrofloxacin were
Síntesis de nanopartículas de sílice y su aplicación
‐ 161 ‐
chosen as representative components of these groups. A compound was
considered not to interfere at a given concentration when the analytical
signal obtained in the presence of this substance was within one standard
deviation of the value obtained in its absence. The maximum concentration
tested for all these compounds was 200 μg L‐1 using a 0.2 μg L‐1 monensin
concentration, finding that all of them were tolerated at this 1000:1
concentration ratio. This result agrees with the results already reported for
other monensin immunoassays [15 ‐ 17, 20, 21], which shows the good
selectivity of anti‐monensin antibodies.
3.3. Applications
The method was applied to the analysis of skimmed, semi
skimmed and whole milk samples. The sample treatment was quite simple
and consisted in a deproteinization step after which the solvent was
evaporated owing to the lack of compatibility of the organic solvent with
the immunoassay performance. This compatibility was studied using
methanol and ethanol and they proved to decrease the fluorescence signal
at percentages above 3% of each solvent. These extraction and evaporation
steps are common to those required by immunoassays for monensin
determination in sample extracts of feedstuff [15, 16] and foodstuff [21]
samples. The monensin concentration in the milk samples was determined
according to the procedure above described. A recovery study was also
carried out to validate the method (Table 1), obtaining values in the range
of 83.3 – 107.5%.
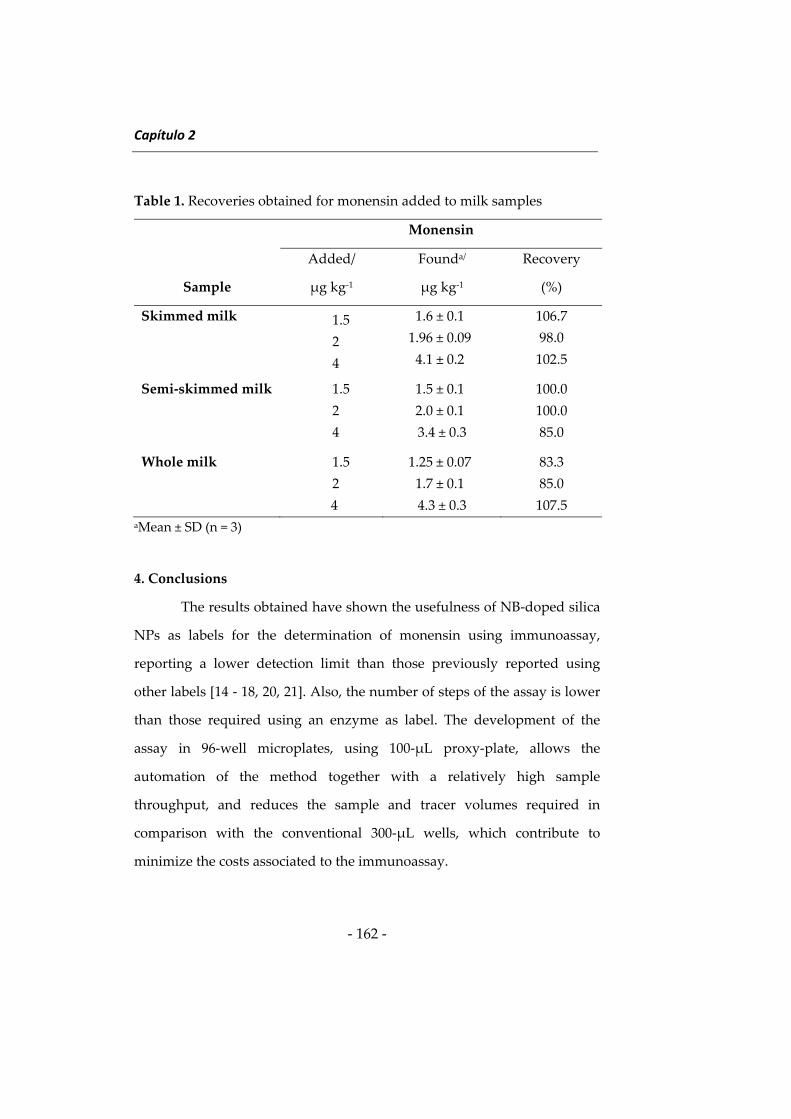
Capítulo 2
‐ 162 ‐
Table 1. Recoveries obtained for monensin added to milk samples
Sample
Monensin
Added/
μg kg‐1
Founda/
μg kg‐1
Recovery
(%)
Skimmed milk 1.5
2
4
1.6 ± 0.1
1.96 ± 0.09
4.1 ± 0.2
106.7
98.0
102.5
Semi‐skimmed milk 1.5
2
4
1.5 ± 0.1
2.0 ± 0.1
3.4 ± 0.3
100.0
100.0
85.0
Whole milk 1.5
2
4
1.25 ± 0.07
1.7 ± 0.1
4.3 ± 0.3
83.3
85.0
107.5
aMean ± SD (n = 3)
4. Conclusions
The results obtained have shown the usefulness of NB‐doped silica
NPs as labels for the determination of monensin using immunoassay,
reporting a lower detection limit than those previously reported using
other labels [14 ‐ 18, 20, 21]. Also, the number of steps of the assay is lower
than those required using an enzyme as label. The development of the
assay in 96‐well microplates, using 100‐μL proxy‐plate, allows the
automation of the method together with a relatively high sample
throughput, and reduces the sample and tracer volumes required in
comparison with the conventional 300‐μL wells, which contribute to
minimize the costs associated to the immunoassay.
Síntesis de nanopartículas de sílice y su aplicación
‐ 163 ‐
The low quantification limit of this method allows the
determination of monensin at levels below its MRL for milk samples. The
use of these samples to control the potential presence of monensin in
foodstuffs is a useful alternative to the analysis of other biological samples,
since they can be easily obtained.
Acknowledgments
Authors gratefully acknowledge financial support from the
MICINN (grant no. CTQ2009‐08621), from the Junta of Andalucia (grant
no. P09‐FQM4933) and from the FEDER‐FSE Program (grant no.P09‐
FQM4933). J. Godoy‐Navajas thanks the Junta of Andalucia (grant no. P09‐
FQM4933) for the financial support of his pre‐doctoral fellowship.
References
(1) Opinion of the Scientific Panel on Contaminants in the Food Chain.
EFSA J (2008) 592, 1–40.
(2) Regulation (EC) No 1831/2003 of the European Parliament and of
the Council of 22 September 2003 on additives for use in animal
nutrition. Off. J. Eur. Union (2003) L268, 29–43.
(3) Commission Regulation (EU) No 37/2010 on pharmacologically
active substances and their classification regarding maximum
residue limits in foodstuffs of animal origin. Off. J. Eur. Union (2010)
L15, 1–72.
(4) C.T. Elliot, D.G. Kennedy, W.J. McCaughey. Methods for the
detection of polyether ionophore residues in poultry. Analyst (1998)
123, 45R–56R
Capítulo 2
‐ 164 ‐
(5) M. Sokolic, M. Pokorny. Comparative determination of salinomycin
by high‐performance liquid chromatography, microbiological and
colorimetric methods in testing production processes and animal
feed preparations. J. Pharm. Biomed. Anal. (1991) 9, 1047–1053.
(6) R. Galarini, L. Fioroni, S. Moretti, L. Pettinacci, G. Dusi.
Development and validation of a multi‐residue liquid
chromatography‐tandem mass spectrometry confirmatory method
for eleven coccidiostasts in eggs. Anal. Chim. Acta, (2011) 700, 167–
176.
(7) M. Cronly, P. Behan, B. Foley, E. Malone, P. Shearan, L. Regan.
Determination of eleven coccidiostats in animal feed by liquid
chromatography‐tandem spectrometry at cross contamination
levels. Anal. Chim. Acta (2011) 700, 26–33.
(8) U. Vincent, Z. Ezerskis, M. Chedin, C. von Holst. Determination of
ionophore coccidiostats in feeding stuffs by liquid chromatography‐
tandem mass spectrometry. Part II. Application to cross‐
contamination levels and non‐targeted fee. J. Pharm. Biomed. Anal.
(2011) 54, 526–534.
(9) T.S. Thompson, D.K. Noot, J.D. Kendall. Determination of
ionophores in raw bovine milk using LC—MS/MS: Application to
residue surveillance. Food Chem. (2011) 127, 321–326.
(10) M. Olejnik, T. Szprengier‐Juzskiewicz, P. Jedziniak. Multi‐residue
confirmatory method for the determination of twelve coccidiostats
in chicken liver using liquid chromatography tandem mass
spectrometry. J. Chromatogr. A (2009) 1216, 8141–8148.
Síntesis de nanopartículas de sílice y su aplicación
‐ 165 ‐
(11) G. Stubbings, T. Bigwood. The development and validation of a
multiclass liquid chromatography tandem mass spectrometry (LC‐
MS/MS) procedure for the determination of veterinary drug
residues in animal tissue using a QuEChERS (Quick, Easy, Cheap,
Effective, Rugged and Safe) approach. Anal. Chim. Acta (2009) 637,
68–78.
(12) B. Ferraz Spisso, R. Gomes Ferreira, M. Ulberg Pereira, M. Alves
Monteiro, T. Ávila Cruz, R. Pinto da Costa, A.M. Belém Lima, A.
Wanderley da Nóbrega. Simultaneous determination of polyether
ionophores, macrolides and lincosamides in hen eggs by liquid
chromatography‐electrospray ionization tandem mass spectrometry
using a simple solvent extraction. Anal. Chim. Acta (2010) 682, 82–92.
(13) A. Boscher, C. Guignard, T. Pellet, L. Hoffmann, T. Bohn.
Development of a multi‐class method for the quantification of
veterinary drug residues in feedingstuffs by liquid
chromatography‐tandem mass spectrometry. J. Chromatogr. A (2010)
1217, 6394–6404.
(14) H. Watanabe, A. Satake, M. Matsumoto, Y. Kido, A. Tsuji, K. Ito, M.
Maeda. Monoclonal‐based enzyme‐linked immnosorbent assay and
immunochromatographic rapid assay for monensin. Analyst (1998)
123, 2573–2578.
(15) Monensin ELISA kit (Cat # KA1422 V.01), http://www.abnova.com/.
(16) Monensin ELISA. Enzyme‐linked Immunosorbent Assay for the
Determination of Monensin in Feed and Contaminated Samples,
http://www.abraxiskits.com/.
Capítulo 2
‐ 166 ‐
(17) S.R.H. Crooks, I.M. Traynor, C.T. Elliott, W.J. McCaughey.
Detection of monensin residues in poultry liver using an enzyme
immunoassay. Analyst (1997) 122, 161–163.
(18) M.A.J. Godfrey, M.F. Luckey, P. Kwasowski. IAC/cELISA detection
of monensin elimination from chicken tissues, following oral
therapeutic dosing. Food Addit. Contam. (1997) 14, 281–286.
(19) H. Dolliver, K. Kumar, S. Gupta, A. Singh. Application of enzyme‐
linked immunosorbent assay analysis for determination of
monensin in environmental samples. J. Environ. Qual. (2008) 37,
1220–1226.
(20) S.R.H. Crooks, T.L. Fodey, G.R. Gilmore, C.T. Elliott. Rapid
screening for monensin residues in poultry plasma by a dry reagent
dissociation enhanced lanthanide fluoroimmunoassay. Analyst
(1998) 123, 2493–2496.
(21) V. Hagren, P. Peippo, M. Tuomola, T. Lövgren. Rapid time‐resolved
fluoroimmunoassay for the screening of monensin residues in eggs.
Anal. Chim. Acta (2006) 557, 164–168.
(22) C. Cháfer‐Pericás, A. Maquieira, R. Puchades. Functionalized
inorganic nanoparticles uses as labels in solid‐phase immunoassays.
Trends Anal. Chem. (2012) 31, 144–156.
(23) A. Gómez‐Hens, J.M. Fernández‐Romero, M.P. Aguilar‐Caballos.
Nanostructures as analytical tolos in bioassays. Trends Anal. Chem.
(2008) 27, 394–406.
(24) A. Gómez‐Hens, J.M. Fernández‐Romero, M.P. Aguilar‐Caballos.
Control of tumor markers using nanotechnology. Mini‐Rev. Med.
Chem. (2009) 9, 1064–1074.
Síntesis de nanopartículas de sílice y su aplicación
‐ 167 ‐
(25) D. Knopp, D. Tang, R. Niessner. Review: Bioanalytical applications
of biomolecule‐functionalized nanometer‐sized doped silica
particles. Anal. Chim.Acta (2009) 647, 14–30.
(26) J. Godoy‐Navajas, M.P. Aguilar‐Caballos, A. Gómez‐Hens.
Synthesis and characterization of oxazine‐doped silica nanoparticles
for their potential use as stable fluorescent reagents. J. Fluoresc.
(2010) 20, 171–180.
(27) J. Godoy‐Navajas, M.P. Aguilar‐Caballos, A. Gómez‐Hens.
Heterogeneous immunoassay for soy protein determination using
nile blue‐doped silica nanoparticles as labels and front‐surface long‐
wavelength fluorimetry. Anal. Chim. Acta (2011) 701, 194–199.
(28) M. Blazsek, M. Kubis. HPLC determination of salinomycin and
related compounds in fermentation media of Streptomyces albus
and premixes. J. Pharm. Biomed. Anal. (2005) 39, 564–571.
(29) E. Watanabe, H. Kubo, Y. Kanzaki, H. Nakazawa. Immunoassay
based on a polyclonal antibody for sex steroid hormones produced
by a heterogeneous hapten‐conjugated immunogen: Estimation of
its potentiality and antibody characteristics. Anal. Chim. Acta (2010)
658, 56–62.
(30) G. Long, J.D. Winefordner. Limit of detection a close look at the
IUPAC definition. Anal. Chem. (1983) 55, 712–724.

CAPÍTULO 3 CHAPTER 3
Nuevasaportacionesparaladeterminacióndeantioxidantesen
alimentos
Newapproachesforthedeterminationoffoodantioxidants

Determinación de antioxidantes en alimentos
‐ 171 ‐
Este capítulo recoge las investigaciones realizadas para la
propuesta de nuevas metodologías analíticas para la determinación de
antioxidantes en alimentos. En concreto, se ha trabajado en el desarrollo de
un método para la determinación de la capacidad antioxidante de
alimentos y, en segundo lugar, se ha abordado la puesta a punto de un
método para la determinación de polifenoles en muestras de vinos. Estos
estudios han originado dos artículos científicos:
‐ J. Godoy‐Navajas, M.P. Aguilar‐Caballos, A. Gómez‐Hens.
Long‐wavelength fluorimetric determination of food
antioxidant capacity using nile blue as reagent. Journal of
Agriculture and Food Chemistry, 59 (2011) 2235 – 2240.
‐ J. Godoy‐Navajas, M.P. Aguilar‐Caballos, A. Gómez‐Hens.
Automatic determination of polyphenols in wines using laccase
and terbium oxide nanoparticles. Food Chemistry, enviado.
El interés de estas determinaciones emana de las numerosas
investigaciones realizadas en las últimas décadas sobre el impacto del
estrés oxidativo en la salud humana y las causas que lo producen. El estrés
oxidativo se define como el desequilibrio entre la producción de especies
reactivas de oxígeno (ROS) o de nitrógeno (RNS) y la defensa antioxidante,
encontrándose que desempeña un papel fundamental en distintas
condiciones patofisiológicas [1]. La existencia de este estrés oxidativo se
atribuye a la incapacidad de los antioxidantes endógenos para evitar el
daño oxidativo de biomoléculas claves.
Los antioxidantes se han definido como “cualquier sustancia que,
cuando se encuentra presente a bajas concentraciones con respecto a un
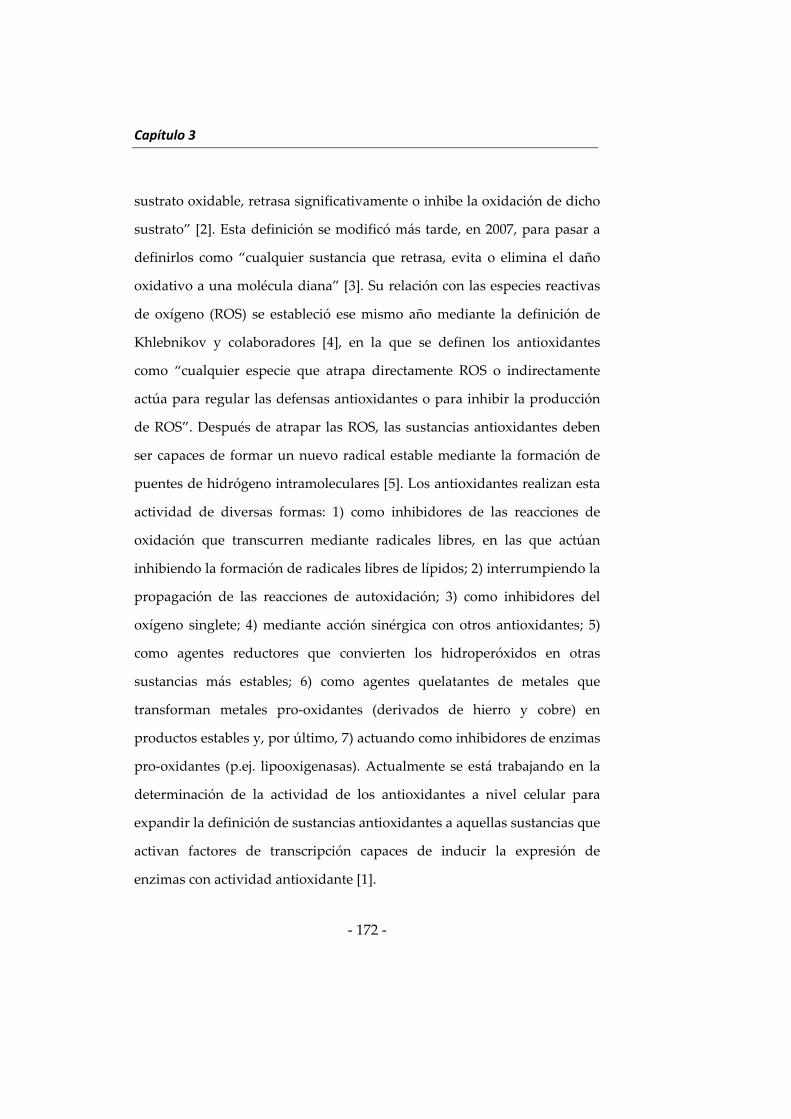
Capítulo 3
‐ 172 ‐
sustrato oxidable, retrasa significativamente o inhibe la oxidación de dicho
sustrato” [2]. Esta definición se modificó más tarde, en 2007, para pasar a
definirlos como “cualquier sustancia que retrasa, evita o elimina el daño
oxidativo a una molécula diana” [3]. Su relación con las especies reactivas
de oxígeno (ROS) se estableció ese mismo año mediante la definición de
Khlebnikov y colaboradores [4], en la que se definen los antioxidantes
como “cualquier especie que atrapa directamente ROS o indirectamente
actúa para regular las defensas antioxidantes o para inhibir la producción
de ROS”. Después de atrapar las ROS, las sustancias antioxidantes deben
ser capaces de formar un nuevo radical estable mediante la formación de
puentes de hidrógeno intramoleculares [5]. Los antioxidantes realizan esta
actividad de diversas formas: 1) como inhibidores de las reacciones de
oxidación que transcurren mediante radicales libres, en las que actúan
inhibiendo la formación de radicales libres de lípidos; 2) interrumpiendo la
propagación de las reacciones de autoxidación; 3) como inhibidores del
oxígeno singlete; 4) mediante acción sinérgica con otros antioxidantes; 5)
como agentes reductores que convierten los hidroperóxidos en otras
sustancias más estables; 6) como agentes quelatantes de metales que
transforman metales pro‐oxidantes (derivados de hierro y cobre) en
productos estables y, por último, 7) actuando como inhibidores de enzimas
pro‐oxidantes (p.ej. lipooxigenasas). Actualmente se está trabajando en la
determinación de la actividad de los antioxidantes a nivel celular para
expandir la definición de sustancias antioxidantes a aquellas sustancias que
activan factores de transcripción capaces de inducir la expresión de
enzimas con actividad antioxidante [1].
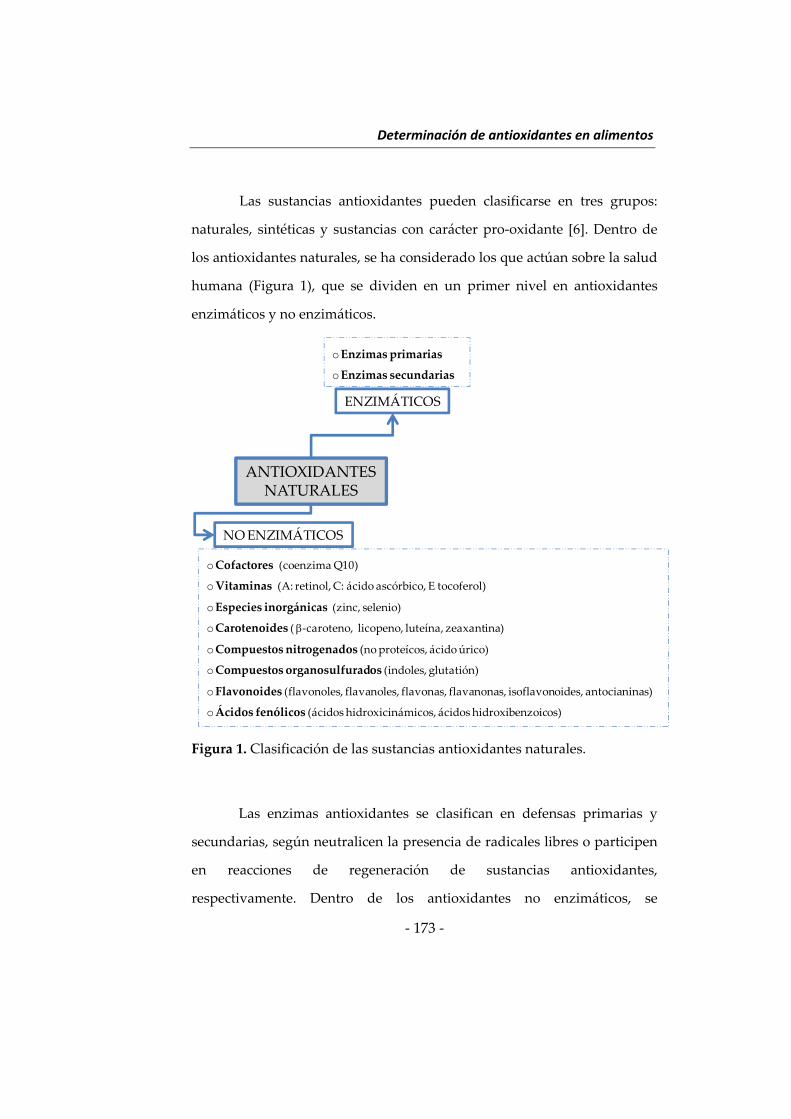
Determinación de antioxidantes en alimentos
‐ 173 ‐
Las sustancias antioxidantes pueden clasificarse en tres grupos:
naturales, sintéticas y sustancias con carácter pro‐oxidante [6]. Dentro de
los antioxidantes naturales, se ha considerado los que actúan sobre la salud
humana (Figura 1), que se dividen en un primer nivel en antioxidantes
enzimáticos y no enzimáticos.
Figura 1. Clasificación de las sustancias antioxidantes naturales.
Las enzimas antioxidantes se clasifican en defensas primarias y
secundarias, según neutralicen la presencia de radicales libres o participen
en reacciones de regeneración de sustancias antioxidantes,
respectivamente. Dentro de los antioxidantes no enzimáticos, se
ANTIOXIDANTESNATURALES
NO ENZIMÁTICOS
oCofactores (coenzima Q10)
oVitaminas (A: retinol, C: ácido ascórbico, E tocoferol)
oEspecies inorgánicas (zinc, selenio)
oCarotenoides ( ‐caroteno, licopeno, luteína, zeaxantina)
oCompuestos nitrogenados (no proteícos, ácido úrico)
oCompuestos organosulfurados (indoles, glutatión)
oFlavonoides (flavonoles, flavanoles, flavonas, flavanonas, isoflavonoides, antocianinas)
oÁcidos fenólicos (ácidos hidroxicinámicos, ácidos hidroxibenzoicos)
oEnzimas primarias
oEnzimas secundarias
ENZIMÁTICOS
Capítulo 3
‐ 174 ‐
encuentran las vitaminas, coenzimas, especies inorgánicas, carotenoides,
compuestos orgánicos de azufre y de nitrógeno no proteico, flavonoides y,
por último, ácidos fenólicos. A pesar de que muchas de estas sustancias
antioxidantes se encuentran de forma endógena en nuestro sistema, se
necesita un aporte externo mediante la dieta para mantener una baja
concentración de radicales libres. Algunos antioxidantes se encuentran en
relativamente alta concentración como metabolitos secundarios en las
plantas. De esta forma, los zumos naturales, extractos de plantas y vinos,
entre otros, presentan contenidos elevados de antioxidantes como
vitaminas, especies inorgánicas, flavonoides y ácidos fenólicos [7].
Los antioxidantes sintéticos son compuestos químicos que se
adicionan a los alimentos para mantener sus propiedades después de los
tratamientos incluidos en el procesado de alimentos y, también, para
prolongar su duración. La Figura 2 muestra algunos componentes de esta
familia, tales como butilhidroxianisol (BHA), butilhidroxitolueno (BHT),
terbutilhidroquinona, ésteres del ácido gálico (más conocidos como
galatos) y derivados de otros fenoles como, por ejemplo, el resorcinol. La
Autoridad Europea de Seguridad Alimentaria (EFSA) revisó en 2012 las
concentraciones máximas permitidas de estos aditivos, que siguen estando
en uso a pesar de algunos estudios que indican efectos nocivos en la salud
[8].
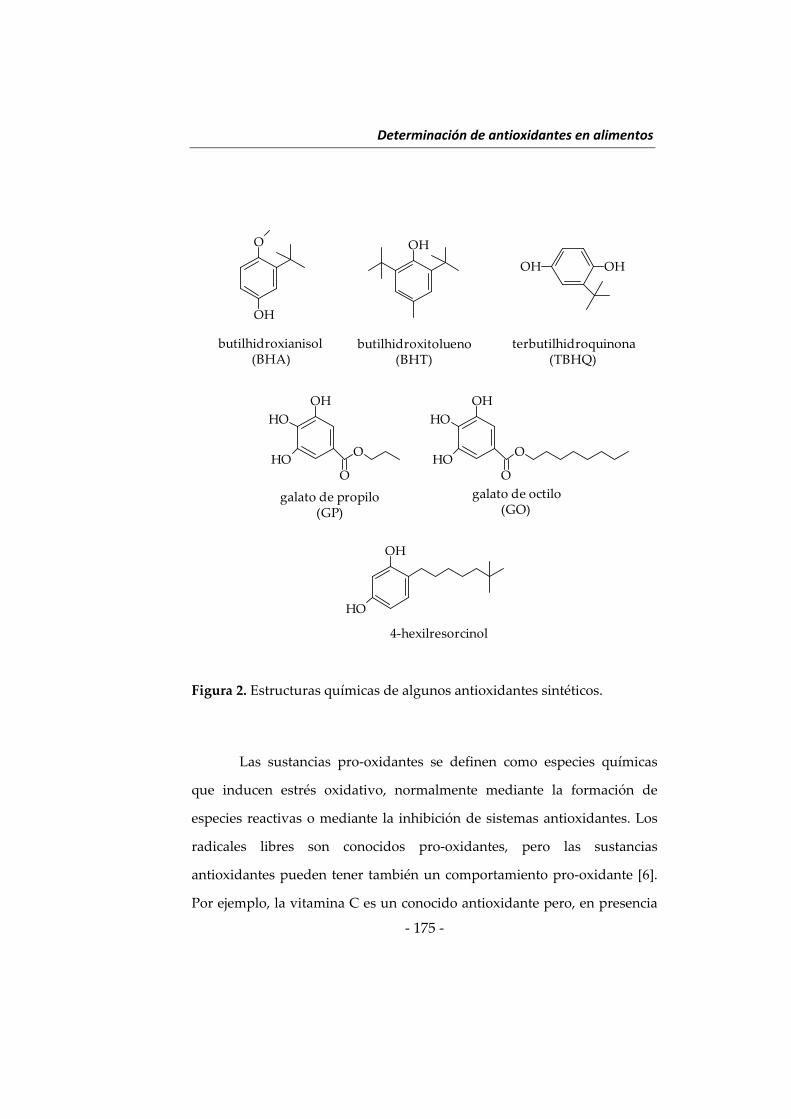
Determinación de antioxidantes en alimentos
‐ 175 ‐
Figura 2. Estructuras químicas de algunos antioxidantes sintéticos.
Las sustancias pro‐oxidantes se definen como especies químicas
que inducen estrés oxidativo, normalmente mediante la formación de
especies reactivas o mediante la inhibición de sistemas antioxidantes. Los
radicales libres son conocidos pro‐oxidantes, pero las sustancias
antioxidantes pueden tener también un comportamiento pro‐oxidante [6].
Por ejemplo, la vitamina C es un conocido antioxidante pero, en presencia
O
OH
OH
OHOH
OH
HO
HOO
O
OH
HO
HOO
O
OH
HO
butilhidroxianisol(BHA)
butilhidroxitolueno(BHT)
terbutilhidroquinona(TBHQ)
galato de propilo(GP)
galato de octilo(GO)
4‐hexilresorcinol
Capítulo 3
‐ 176 ‐
de hierro, puede descomponer peróxido de hidrógeno en radicales
hidroxilo, lo que le confiere naturaleza pro‐oxidante. El comportamiento
antioxidante o pro‐oxidante depende del antioxidante considerado y de su
concentración, siendo el estudio de la relación antioxidante:pro‐oxidante
un área de investigación muy activa en la actualidad.
La gran variedad de sustancias antioxidantes que pueden existir en
los alimentos dificulta la determinación individual de cada una de las
especies de este grupo y, por otra parte, el poder antioxidante total de un
alimento es una herramienta muy útil para evaluar los efectos beneficiosos
de la ingesta de antioxidantes en la salud humana. Cabe distinguir entre
dos conceptos que se utilizan a menudo de forma indistinta pero que
tienen connotaciones ligeramente diferentes: actividad y capacidad
antioxidante. La actividad antioxidante se relaciona con la cinética de una
reacción entre un antioxidante y un pro‐oxidante o un radical al que reduce
o atrapa, mientras que la capacidad antioxidante mide la eficacia de la
transformación termodinámica de la reacción de un pro‐oxidante con una
sustancia antioxidante. Se han desarrollado diversos ensayos para evaluar
el poder antioxidante total de un alimento, pero no proporcionan medidas
que puedan correlacionarse entre sí, debido fundamentalmente a que no
existen métodos normalizados para estas determinaciones [9]. En general,
los ensayos químicos de actividad antioxidante se pueden clasificar en dos
grandes grupos, atendiendo al tipo de reacción involucrada:
‐ Ensayos basados en transferencia de átomos de hidrógeno
(HAT)
‐ Ensayos basados en transferencia de electrones (ET)
Determinación de antioxidantes en alimentos
‐ 177 ‐
Los ensayos basados en reacciones HAT miden la capacidad de un
antioxidante para inhibir los radicales libres (generalmente radicales
peróxido) mediante la cesión de átomos de hidrógeno. El mecanismo por el
que se interpreta la acción antioxidante de un compuesto fenólico que
transfiere un protón a un radical es el siguiente:
/
/
donde el radical oxiarilo (ArO∙) formado por la reacción del antioxidante
fenólico con el radical peróxido se estabiliza mediante resonancia y las
especies AH y ArOH se corresponden con las biomoléculas protegidas y
las de antioxidante fenólico, respectivamente. En estos ensayos, se utiliza
un fluoróforo que compite con la sustancia antioxidante por los radicales
peróxido. La actividad antioxidante se determina mediante medidas de la
diferencia en la inhibición de la fluorescencia del fluoróforo en ausencia y
presencia de las sustancias antioxidantes. Algunos ensayos basados en
HAT son el que mide la capacidad de absorción de radicales de oxígeno
(ORAC), el de poder antioxidante total (TRAP) y los ensayos de
decoloración de crocina y β‐carotenos.
En los ensayos mediante reacciones ET, el antioxidante reacciona
con un cromóforo o un fluoróforo con naturaleza oxidante en lugar de
reaccionar con los radicales peróxido. Así, la presencia de sustancias
antioxidantes origina una variación en la absorbancia o en la fluorescencia
del cromóforo y fluoróforo, respectivamente, de forma que estos cambios
se pueden correlacionar con la concentración de sustancias antioxidantes
presentes en la muestra. Algunos ejemplos de ensayos basados en estas
Capítulo 3
‐ 178 ‐
reacciones son el que mide la capacidad antioxidante total equivalente de
Trolox (TEAC), el ensayo DPPH (que utiliza radicales 2,2‐
difenilpicrilhidracilo), el método de Folin‐Ciocalteu, el del potencial
antioxidante reductor de iones férricos (FRAP) y la capacidad antioxidante
reductora de iones cúpricos (CUPRAC).
Las investigaciones de esta Memoria que abordan el desarrollo de
un método para la determinación de la capacidad antioxidante están
basadas en la aplicación del método ORAC. Este método utiliza un
iniciador azo‐bis, como el diclorhidrato de 2,2’‐azobis(2‐amidinopropano)
(AAPH), el cual libera radicales peróxido cuando se calienta con ayuda del
oxígeno disuelto [10].
2
ó
ó
Los radicales peróxido liberados reaccionan con un fluoróforo e
inhiben su fluorescencia. Los fluoróforos utilizados de forma convencional
han sido β‐ficoeritrina [11], que se sustituyó posteriormente por
fluoresceína y diclorofluoresceína [12], debido a que éstas presentaban
mayor fotoestabilidad y una reactividad prácticamente nula con los
polifenoles.
Determinación de antioxidantes en alimentos
‐ 179 ‐
El estudio realizado ha estado orientado a investigar la utilidad
analítica de los fluoróforos de larga longitud de onda con objeto de mejorar
algunas propiedades analíticas del ensayo ORAC, tales como la
selectividad espectral, como se discutirá más adelante. Esta mejora es
posible ya que las medidas se realizan a longitudes de onda más largas que
las que presentan los fluoróforos tradicionalmente utilizados con este fin.
Estas innovaciones están en consonancia con las directrices de un informe
técnico de la IUPAC [9] publicado recientemente, en el que se proponen las
siguientes acciones de mejora:
‐ Desplazar el foco de atención desde el “screening” al estudio de los
mecanismos de reacción de las sustancias antioxidantes.
‐ Sustituir la fluoresceína por otros fluoróforos que no presenten
inhibición de la fluorescencia por irradiación, reacciones o
interacciones colaterales.
‐ Analizar potenciales interferencias mediante el análisis de muestras
blanco en las que se analice la contribución de las muestras sin
antioxidantes junto con el fluoróforo, en presencia y ausencia del
reactivo generador de radicales.
‐ Ensayar intervalos de concentraciones de antioxidantes para
proponer mecanismos de reacción de las sustancias antioxidantes y
conocer a partir de qué concentraciones se comportan como pro‐
oxidantes.
‐ Obtener información para la normalización de los procedimientos
ORAC: relación fluoróforo:generador de radicales para eliminar
efectos de auto‐inhibición del fluoróforo que oculten la acción del
antioxidante, estudio sistemático de la influencia de los niveles de
Capítulo 3
‐ 180 ‐
oxígeno disuelto en la velocidad de reacción, determinación de los
niveles de oxígeno disuelto mínimos para que la reacción tenga
lugar y desarrollo de métodos para asegurar niveles de oxígeno
adecuados, de acuerdo a lo expuesto anteriormente.
‐ Diseñar métodos para controlar adecuadamente la temperatura.
‐ Desarrollar normas para el desarrollo de métodos en el formato de
microplacas en ensayos de actividad antioxidante y conseguir que
los fabricantes diseñen la instrumentación apropiada para tal fin.
‐ Poner a punto métodos normalizados para el cálculo de áreas bajo
la curva.
‐ Proporcionar datos conjuntos de capacidad antioxidante y de otros
parámetros como la concentración total de polifenoles para conocer
los perfiles de actividad.
‐ Conocer la capacidad antioxidante en extractos naturales después
de su tratamiento con polivinilpirrolidona para la eliminación de
compuestos fenólicos y deducir la contribución de los compuestos
no fenólicos a dicho ensayo.
De los dos últimos puntos de mejora del informe técnico anterior se
deduce la importancia de proporcionar datos complementarios, tales como
la concentración total de antioxidantes fenólicos y la de antioxidantes no
fenólicos, íntimamente relacionada con la capacidad antioxidante para
conocer los perfiles de actividad antioxidante de cada alimento. En la
segunda sección de este capítulo se aborda la determinación de
antioxidantes fenólicos mediante el uso de la enzima laccasa en presencia
de nanopartículas de óxido de terbio como activador.
Determinación de antioxidantes en alimentos
‐ 181 ‐
Las enzimas de la familia de las laccasas son fenoloxidasas que
oxidan las sustancias antioxidantes con ayuda del oxígeno disuelto en el
medio. Las enzimas laccasas son activas frente a compuestos antioxidantes
que incorporan grupos orto‐ y para‐difenol, aunque presentan mayor
afinidad por los compuestos fenólicos sustituidos en para‐. Estas enzimas
presentan una relativa selectividad por los sustratos, que pueden tener
mayor o menor potencial de reducción dependiendo del tipo de laccasa.
Las enzimas laccasas catalizan la oxidación de una amplia variedad de
sustratos, entre los que se incluyen mono‐, di‐ y polifenoles, aminofenoles,
metoxifenoles, aminas aromáticas y ascorbato, con la reducción de oxígeno
a agua mediante el intercambio de cuatro electrones.
Estas enzimas pueden obtenerse de diversas fuentes, ya sean
plantas, como es el caso de la planta japonesa Rhus vernicifera, de la cual se
aisló la primera variedad de laccasa, insectos y bacterias [13]. No obstante,
la mayoría de las laccasas actualmente utilizadas se obtienen de hongos
superiores, como Trametes versicolor y Trametes hirsuta, entre otros.
Estas enzimas presentan numerosas aplicaciones industriales y
analíticas cuando se encuentran inmovilizadas sobre un soporte sólido. Se
han revisado recientemente [13] las diversas opciones de inmovilización
tales como atrapamiento, adsorción, encapsulamiento, entre otras, para
finalmente concluir que no siempre se recupera la actividad enzimática de
forma satisfactoria tras el proceso de inmovilización. Las aplicaciones
analíticas más destacables de la enzima laccasa han estado orientadas al
desarrollo de biosensores con detección electroquímica [14]. El modo de
operación de estos biosensores es generalmente secuencial, lo que limita su
velocidad de muestreo, a diferencia de otros ensayos que utilizan
Capítulo 3
‐ 182 ‐
microplacas de pocillos donde las medidas se realizan de forma
prácticamente simultánea. Éste es un aspecto que se ha estudiado y
optimizado en las investigaciones descritas en esta Memoria. En concreto,
el segundo apartado de este capítulo ha tenido como objeto el desarrollo de
un método de alta velocidad de muestreo para la determinación de
polifenoles en vinos con el que se pretende reducir el consumo de enzima
con las nanopartículas de óxido de terbio como activador, al mismo tiempo
que se acorta el tiempo requerido para las determinaciones analíticas
basadas en el uso de esta enzima.
BIBLIOGRAFÍA
(1) B.D. Craft, A.L. Kerrihard, R. Amarowicz, R.B.Pegg. Phenol‐based
antioxidants and the in vitro methods used for their assessment.
Compr. Rev. Food Sci. Food Safety. (2012) 11, 148 – 173.
(2) B. Halliwell, J.M. Gutteridge. The definition and measurement of
antioxidants in biological systems. Free Radic. Biol. Med. (1995) 18, 125
– 126.
(3) B. Halliwell. Biochemistry of oxidative stress. Biochem. Soc. Trans.
(2007) 35, 1147 – 1150.
(4) A.J. Khlebnikov. I.A. Schepetkin, N.G. Domina, L.N. Kirpotina, M.T.
Quinn. Improved quantitative structure‐activity relationship models
to predict antioxidant activity of flavonoids in chemical, enzymatic,
and cellular systems. Bioorg. Med. Chem. (2007) 15, 1749 – 1770.
(5) B. Halliwell. How to characterize a biological antioxidant. Free Radic.
Res. (1990) 9, 1 – 32.
(6) M. Carocho, I.C.F.R. Ferreira. A review on antioxidants, prooxidants
and relatived controversy: Natural and synthetic compounds,
screening and analysis methodologies and future perspectives. Food
Chem. Tox. (2013) 51, 15 – 25.
Determinación de antioxidantes en alimentos
‐ 183 ‐
(7) B. Lorrain, I. Kay, L. Pechamat, P.L. Teissedre. Evolution of analysis
of polyphenols from grapes, wines and extracts. Molecules. (2013) 18,
1076 – 1100.
(8) European Food Safety Authority (EFSA). Statement on the safety
assessment of the exposure to butylated hydroxyanisole E320 (BHA)
by applying a new exposure assessment methodology. EFSA J. (2012)
10:2759, 1 – 16.
(9) R. Apak, S. Gorinstein, V. Böhm, K.M. Schaich, M. Ozyürek, K.
Güçlü. Methods of measurement and evaluation of natural
antioxidant capacity/activity (IUPAC Technical Report). Pure Appl.
Chem. (2013) 85, 957 – 998.
(10) R.L. Prior, X. Wu, K. Schaich. Standardized methods for the
determination of antioxidant capacity and phenolics in foods and
dietary supplements. J. Agric. Food Chem. (2005) 53, 4290 – 4294.
(11) G.H. Cao, H.M. Alessio, R.G. Cutler. Oxygen‐radical absorbance
capacity assay for antioxidants. Free Radical Biol. Med. (1993) 14, 303 –
465.
(12) B. Ou, M. Hampsch‐Woodill, R.L. Prior. Development and validation
of an improved oxygen radical absorbance capacity assay using
fluorescein as the fluorescent probe. J. Agric. Food Chem. (2001) 49,
4619 – 4621.
(13) M. Fernández‐Fernández, M.A. Sanromán, D. Moldes. Recent
developments and applications of immobilized laccase. Biotechnol.
Adv. (2013) 31, 1808‐1825.
(14) A. Sánchez‐Arribas, M. Martínez‐Fernández, M. Chicharro. The role
of electroanalytical techniques in analysis of polyphenols in wine.
Trends Anal. Chem. (2012) 34, 78 – 96.
Chapter 3
‐ 184 ‐
This chapter contains the investigations performed to develop new
analytical methodologies for the determination of antioxidants in food
samples. More specifically, these investigations have been focused to the
development of a method to determine the antioxidant capacity in food
samples, and secondly, on the proposal of a method to determine
polyphenols in wines. These studies have given rise to two scientific
articles:
‐ J. Godoy‐Navajas, M.P. Aguilar‐Caballos, A. Gómez‐Hens.
Long‐wavelength fluorimetric determination of food
antioxidant capacity using nile blue as reagent. Journal of
Agricultural and Food Chemistry, 59 (2011) 2235 – 2240.
‐ J. Godoy‐Navajas, M.P. Aguilar‐Caballos, A. Gómez‐Hens.
Automatic determination of polyphenols in wines using laccase
and terbium oxide nanoparticles. Food Chemistry, submitted for
publication.
The interest on these determinations comes from the numerous
investigations performed in the latest decades on the impact of the
oxidative stress on human health and its causes. The oxidative stress can be
defined as the unbalance between the production of reactive oxygen (ROS)
or nitrogen (RNS) species and the antioxidant defence, finding that it plays
a significant role in different pathophysiological conditions [1]. The reason
for this oxidative stress is the inability of endogen antioxidants to avoid the
oxidative damage of key biomolecules.
Antioxidant substances have been defined as “any substance that at
very low concentration can significantly delay or inhibit the oxidation of a
Determination of food antioxidants
‐ 185 ‐
substrate” [2]. This definition was later modified in 2007, to define an
antioxidant as “any substance that delays, prevents or removes the
oxidative damage to a target molecule” [3]. The relationship of oxidative
stress with ROS was established in the same year by Khlebnikov et al. [4],
who defined antioxidants as “any species that scavenges ROS directly or
indirectly acts to up‐regulate antioxidant defences or to inhibit ROS
production”. After scavenging ROS, proper antioxidant substances must be
able to give rise to new stable radicals by means of intramolecular
hydrogen bonds [5]. Antioxidants can act in many different ways: 1) as
inhibitors of redox reactions happening via free radicals, by mainly
inhibiting lipid free radicals; 2) breaking the chain of auto‐oxidation
reactions; 3) as inhibitors of singlet oxygen; 4) through synergism with
other antioxidants; 5) as reducing agents that change hydroperoxides into
more stable compounds; 6) as metal chelating agents that convert pro‐
oxidative metal species (mainly derived from iron and copper) into stable
products, and, 7) as inhibitors of pro‐oxidant enzymes (e.g.
lipooxygenases). Nowadays, an active area of research is the determination
of cellular antioxidant activity to expand the definition of antioxidant
compounds to those substances that activate transcription factors able to
induce the expression of antioxidant enzymes [1].
Antioxidant compounds can be categorized into three different
groups: natural, synthetic and pro‐oxidant substances [6]. Figure 1 shows
the most important natural antioxidants involved in the human system,
which can be divided in first instance in enzymatic and non‐enzymatic
antioxidants.
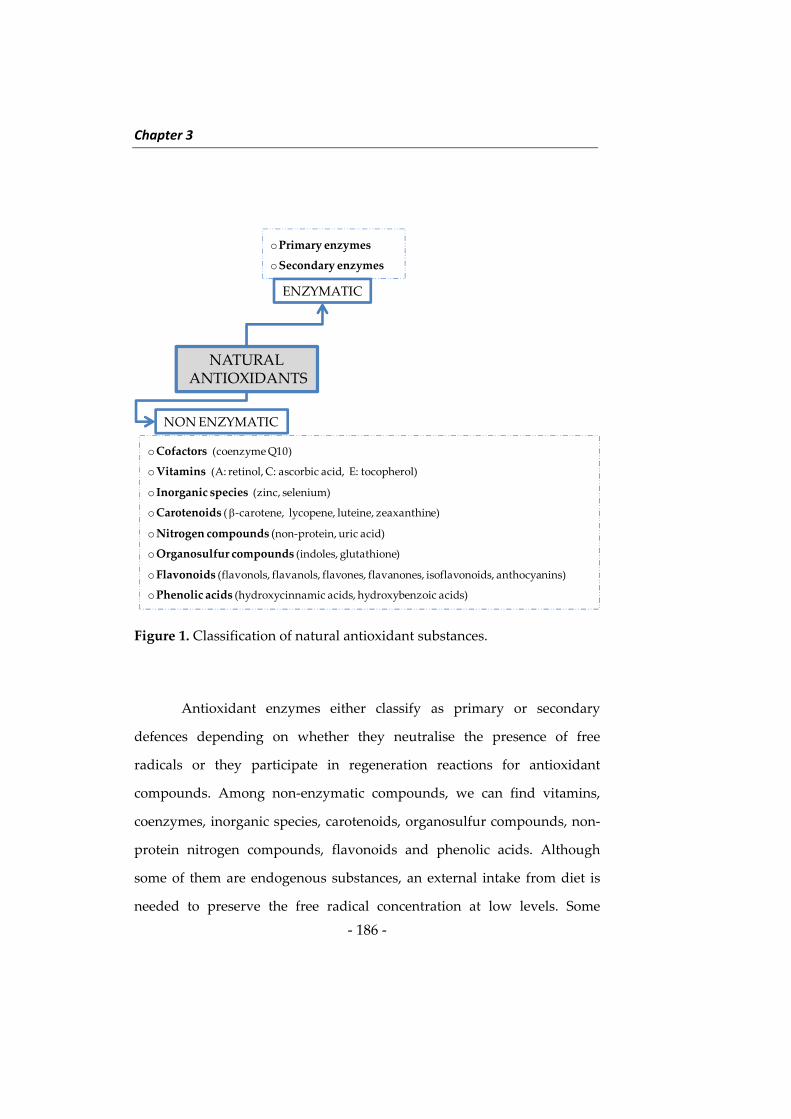
Chapter 3
‐ 186 ‐
Figure 1. Classification of natural antioxidant substances.
Antioxidant enzymes either classify as primary or secondary
defences depending on whether they neutralise the presence of free
radicals or they participate in regeneration reactions for antioxidant
compounds. Among non‐enzymatic compounds, we can find vitamins,
coenzymes, inorganic species, carotenoids, organosulfur compounds, non‐
protein nitrogen compounds, flavonoids and phenolic acids. Although
some of them are endogenous substances, an external intake from diet is
needed to preserve the free radical concentration at low levels. Some
NATURALANTIOXIDANTS
NON ENZYMATIC
oCofactors (coenzymeQ10)
oVitamins (A: retinol, C: ascorbic acid, E: tocopherol)
o Inorganic species (zinc, selenium)
oCarotenoids ( ‐carotene, lycopene, luteine, zeaxanthine)
oNitrogen compounds (non‐protein, uric acid)
oOrganosulfur compounds (indoles, glutathione)
oFlavonoids (flavonols, flavanols, flavones, flavanones, isoflavonoids, anthocyanins)
oPhenolic acids (hydroxycinnamic acids, hydroxybenzoic acids)
oPrimary enzymes
oSecondary enzymes
ENZYMATIC
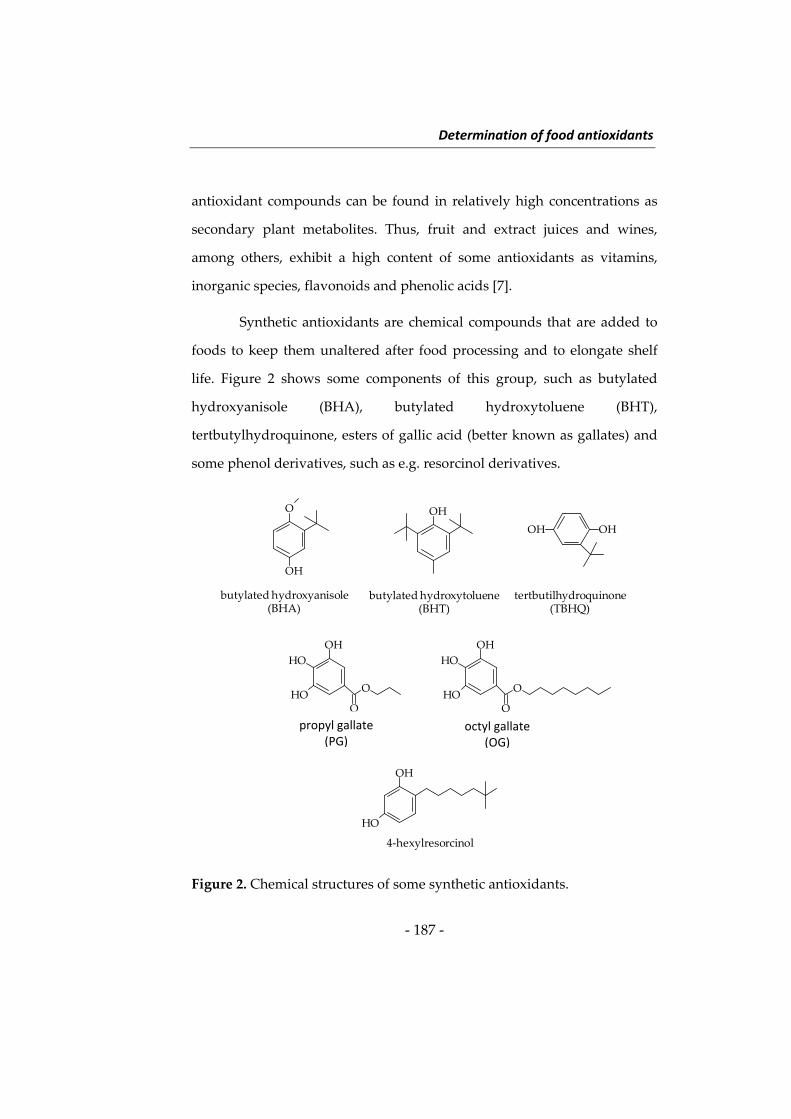
Determination of food antioxidants
‐ 187 ‐
antioxidant compounds can be found in relatively high concentrations as
secondary plant metabolites. Thus, fruit and extract juices and wines,
among others, exhibit a high content of some antioxidants as vitamins,
inorganic species, flavonoids and phenolic acids [7].
Synthetic antioxidants are chemical compounds that are added to
foods to keep them unaltered after food processing and to elongate shelf
life. Figure 2 shows some components of this group, such as butylated
hydroxyanisole (BHA), butylated hydroxytoluene (BHT),
tertbutylhydroquinone, esters of gallic acid (better known as gallates) and
some phenol derivatives, such as e.g. resorcinol derivatives.
Figure 2. Chemical structures of some synthetic antioxidants.
OHO
OH
OHOH
OH
HO
HOO
O
OH
HO
HOO
O
OH
HO
butylatedhydroxyanisole(BHA)
butylatedhydroxytoluene(BHT)
tertbutilhydroquinone(TBHQ)
propyl gallate(GP)
octyl gallateGO)
4‐hexylresorcinol
propyl gallate(PG)
octyl gallate(OG)
Chapter 3
‐ 188 ‐
The European Food Safety Authority (EFSA) revised in 2012 the
maximum allowed concentrations for these additives, which are still in use,
though the results obtained in some studies indicated they can pose a
hazard to human health [8].
Pro‐oxidant substances are defined as chemical species that induce
oxidative stress, usually by giving rise to the formation of reactive species
or by inhibiting antioxidant systems. Free radicals are well known pro‐
oxidant substances, but antioxidant compounds can also bear a pro‐
oxidant behavior [6]. For instance, vitamin C is a well known antioxidant
that in presence of iron can decompose hydrogen peroxide into hydroxyl
radicals, as a pro‐oxidative substance would do. The antioxidant or pro‐
oxidant behavior depends on the antioxidant substance and on the
concentration, the study of antioxidant:pro‐oxidant ratio for each
compound being an active current research area.
The great variety of antioxidant compounds that can exist in food
makes it difficult the individual determination of every single species
belonging to this family, and on the other hand, the total antioxidant
power of a food sample is a very useful tool to assess the beneficial effects
of antioxidant intake on human health. There are two terms, which are
often indistinctly used, but have slightly different meanings: antioxidant
activity and capacity. The antioxidant activity is related to the kinetics of
reaction between an antioxidant compound and a pro‐oxidant or a radical
to which reduces or scavenges, whereas the antioxidant capacity measures
the efficiency of the thermodynamic transformation through the reaction of
Determination of food antioxidants
‐ 189 ‐
a pro‐oxidant with an antioxidant. Several assays have been developed for
the assessment of the total antioxidant power of foods, but they do not
provide measurements that correlate mainly owing to the lack of
standardized methods [9]. In general, the chemical assays of antioxidant
activity can be divided into two main groups according to the type of
reaction involved:
‐ Assays based on hydrogen atom transfer (HAT)
‐ Assays based on electron transfer (ET)
The assays based on HAT reactions measure the ability of an
antioxidant compound to inhibit free radicals (generally peroxyl radicals)
by the donation of hydrogen atoms. The mechanism interpreting the
antioxidant action of a phenol compound that transfers a proton to a
radical is the following:
/
/
where the aryloxy radical (ArO∙) formed after the reaction of the phenolic
antioxidant with the peroxyl radical is stabilized by resonance, and AH
and ArOH species are the protected biomolecules and the antioxidant
molecules, respectively. In these assays, a fluorophore competes with the
antioxidant substance for the peroxyl radicals and the antioxidant activity
is determined by measuring the difference in the inhibition of the
fluorophore signals obtained in the presence and in the absence of
antioxidant compounds. Some HAT‐based assays are the oxygen radical
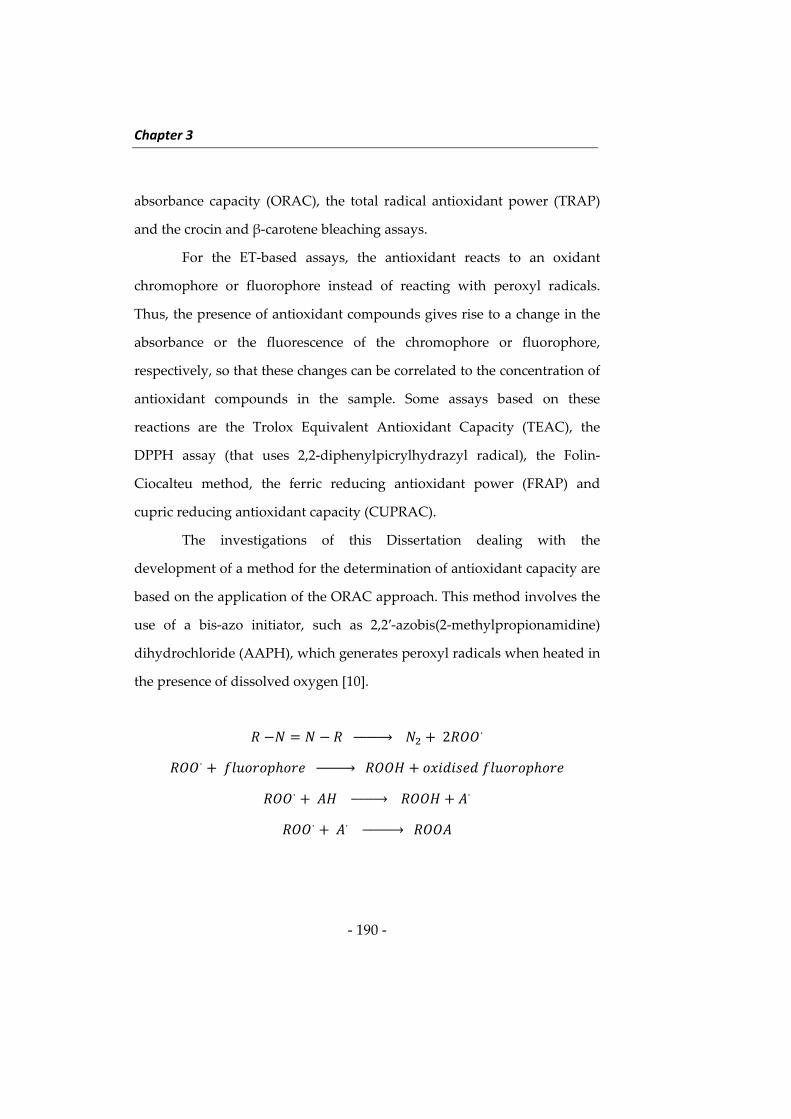
Chapter 3
‐ 190 ‐
absorbance capacity (ORAC), the total radical antioxidant power (TRAP)
and the crocin and β‐carotene bleaching assays.
For the ET‐based assays, the antioxidant reacts to an oxidant
chromophore or fluorophore instead of reacting with peroxyl radicals.
Thus, the presence of antioxidant compounds gives rise to a change in the
absorbance or the fluorescence of the chromophore or fluorophore,
respectively, so that these changes can be correlated to the concentration of
antioxidant compounds in the sample. Some assays based on these
reactions are the Trolox Equivalent Antioxidant Capacity (TEAC), the
DPPH assay (that uses 2,2‐diphenylpicrylhydrazyl radical), the Folin‐
Ciocalteu method, the ferric reducing antioxidant power (FRAP) and
cupric reducing antioxidant capacity (CUPRAC).
The investigations of this Dissertation dealing with the
development of a method for the determination of antioxidant capacity are
based on the application of the ORAC approach. This method involves the
use of a bis‐azo initiator, such as 2,2′‐azobis(2‐methylpropionamidine)
dihydrochloride (AAPH), which generates peroxyl radicals when heated in
the presence of dissolved oxygen [10].
2
Determination of food antioxidants
‐ 191 ‐
The peroxyl radicals generated react to a fluorophore thus
inhibiting its fluorescence. The fluorophores traditionally used have been
β‐phycoerythrin [11], which was further replaced by fluorescein and
dichlorofluorescein [12] owing to the fact that these later presented higher
photostability and a practically negligible reactivity toward polyphenols.
The investigations performed have been focused to the study of the
analytical usefulness of long‐wavelength fluorophores with the aim of
improving the spectral selectivity of ORAC assays, as it will be discussed
below in this Dissertation. This improvement is possible because the
measurements are performed at longer wavelengths than those exhibited
by the fluorophores conventionally used for this purpose. These
innovations are in agreement with the guidelines of a recently published
IUPAC technical report [9], where the following improvement actions are
suggested:
‐ To shift the focus of these assays from screening to elucidation of
the antioxidant mechanism.
‐ To replace fluorescein by other fluorophores insensitive to
photobleaching, to side reactions or interactions.
‐ To analyze potential interferences by the analysis of blank samples
where the contribution of samples and fluorophore can be
analyzed in the absence and in the presence of the radical
generator.
‐ To test antioxidant concentration ranges to suggest reaction
mechanisms of antioxidants and to identify pro‐oxidant
concentration ranges.
Chapter 3
‐ 192 ‐
‐ To obtain information in order to standardize ORAC procedures:
fluorophore:radical generator ratio to avoid quenching effects of
the fluorophore that can hide the antioxidant action, systematic
study of the influence of dissolved oxygen levels on the reaction
rate, determination of minimum dissolved oxygen levels to observe
the reaction and development of methods to ensure suitable
oxygen levels according to the abovementioned.
‐ To devise methods for suitable temperature monitoring and
control.
‐ To establish standards for the development of microplate‐based
methods for the determination of antioxidant capacity and to
encourage manufacturers to design appropriate instrumentation.
‐ To develop standardized methods for the calculation of area under
the curve.
‐ To provide data of antioxidant capacity and other parameters, such
as for instance, the total polyphenol concentration to know the
activity profile.
‐ To know the capacity profile in natural extracts after their
treatment with polyvinylpyrrolidone for the removal of phenolic
compounds and to obtain the contribution of non‐phenolic
compounds to this assay.
From the last two actions described above, it can be seen the
significance of complementary data, such as total concentration of phenolic
antioxidants and that of non‐phenolic antioxidants, intimately related with
the antioxidant activity to know the activity profile of each food. The
second section of this chapter tackles the determination of phenolic
Determination of food antioxidants
‐ 193 ‐
antioxidant concentration by using laccase enzyme in the presence of
terbium oxide nanoparticles as activators.
Laccase enzymes are phenoloxidases that can oxidise antioxidant
compounds using dissolved oxygen. These enzymes have activity for
antioxidant compounds with ortho‐ and para‐diphenol groups, although
their affinity is higher toward para‐substituted phenolic compounds.
Laccases have a relative selectivity toward their substrates, which have
higher or lower reduction potential depending on the laccase type. These
enzymes catalyze the oxidation of a wide variety of substrates, such as
mono‐, di‐ and polyphenols, aminophenols, methoxyphenols, aromatic
amines and ascorbate, with the reduction of oxygen to water by
exchanging four electrons.
These enzymes can be obtained from different sources, such as
from plants, like the Japanese lacquer tree Rhus vernicifera, which the first
laccase variety was isolated from, insects and bacteria [13]. However, most
laccase currently in use are obtained from higher fungi, such as Trametes
versicolor and Trametes hirsuta, among others.
These enzymes have found a great number of industrial and
analytical applications when immobilised onto a solid support. Different
immobilisation approaches, such as entrapment, adsorption and
encapsulation, among others, have been recently reviewed [13], to finally
conclude that the initial enzyme activity cannot be satisfactorily recovered
in all instances after these procedures. The most salient analytical
applications of laccase enzyme have been focused to the development of
electrochemical biosensors [14]. These biosensors often operate
sequentially, which limits their sample throughput, unlike other assays
Chapter 3
‐ 194 ‐
based on the use of well microplates, where measurements are performed
almost simultaneously. This is an aspect that has been investigated and
optimized in this Dissertation. More specifically, the second section of this
chapter has dealt with the development of a high‐throughput method for
the determination of polyphenols in wines, where the enzyme
consumption has been lowered by using terbium oxide nanoparticles as
activators. The method also decreases the analysis times required when the
enzyme is used in the absence of nanoparticles.
LITERATURE
(1) B.D. Craft, A.L. Kerrihard, R. Amarowicz, R.B.Pegg. Phenol‐based
antioxidants and the in vitro methods used for their assessment.
Compr. Rev. Food Sci. Food Safety. (2012) 11, 148 – 173.
(2) B. Halliwell, J.M. Gutteridge. The definition and measurement of
antioxidants in biological systems. Free Radic. Biol. Med. (1995) 18, 125
– 126.
(3) B. Halliwell. Biochemistry of oxidative stress. Biochem. Soc. Trans.
(2007) 35, 1147 – 1150.
(4) A.J. Khlebnikov. I.A. Schepetkin, N.G. Domina, L.N. Kirpotina, M.T.
Quinn. Improved quantitative structure‐activity relationship models
to predict antioxidant activity of flavonoids in chemical, enzymatic,
and cellular systems. Bioorg. Med. Chem. (2007) 15, 1749 – 1770.
(5) B. Halliwell. How to characterize a biological antioxidant. Free Radic.
Res. (1990) 9, 1 – 32.
(6) M. Carocho, I.C.F.R. Ferreira. A review on antioxidants, prooxidants
and relative controversy: Natural and synthetic compounds,
screening and analysis methodologies and future perspectives. Food
Chem. Tox. (2013), 51, 15 – 25.
Determination of food antioxidants
‐ 195 ‐
(7) B. Lorrain, I. Kay, L. Pechamat, P.L. Teissedre. Evolution of analysis
of polyphenols from grapes, wines and extracts. Molecules. (2013) 18,
1076 – 1100.
(8) European Food Safety Authority (EFSA). Statement on the safety
assessment of the exposure to butylated hydroxyanisole E320 (BHA)
by applying a new exposure assessment methodology. EFSA J. (2012)
10:2759, 1 – 16.
(9) R. Apak, S. Gorinstein, V. Böhm, K.M. Schaich, M. Ozyürek, K.
Güçlü. Methods of measurement and evaluation of natural
antioxidant capacity/activity (IUPAC Technical Report). Pure Appl.
Chem. (2013), 85, 957 – 998.
(10) R.L. Prior, X. Wu, K. Schaich. Standardized methods for the
determination of antioxidant capacity and phenolics in foods and
dietary supplements. J. Agric. Food Chem. (2005), 53, 4290 – 4294.
(11) G.H. Cao, H.M. Alessio, R.G. Cutler. Oxygen‐radical absorbance
capacity assay for antioxidants. Free Radical Biol. Med. (1993), 14, 303
– 465.
(12) B. Ou, M. Hampsch‐Woodill, R.L. Prior. Development and validation
of an improved oxygen radical absorbance capacity assay using
fluorescein as the fluorescent probe. J. Agric. Food Chem. (2001) 49,
4619 – 4621.
(13) M. Fernández‐Fernández, M.A. Sanromán, D. Moldes. Recent
developments and applications of immobilized laccase. Biotechnol.
Adv. (2013) 31, 1808‐1825.
(14) A. Sánchez‐Arribas, M. Martínez‐Fernández, M. Chicharro. The role
of electroanalytical techniques in analysis of polyphenols in wine.
Trends Anal. Chem. (2012) 34, 78 – 96.

Determinación de antioxidantes en alimentos
‐ 197 ‐
Long‐Wavelength Fluorimetric Determination of Food
Antioxidant Capacity by Using Nile Blue as Reagent J. Godoy‐Navajas, M.P. Aguilar Caballos, A. Gómez‐Hens
Department of Analytical Chemistry, University of Cordoba, Campus of Rabanales.
Annex to Marie Curie Building. 14071‐Cordoba. Spain
ABSTRACT
A method for the determination of the antioxidant capacity by using
long‐wavelength fluorescence measurements is described for the first time.
This method is a modification of the conventional oxygen radical absorbance
capacity (ORAC) method that uses fluorescein or phycoerythrin and the
generator of peroxyl radicals 2,2’ azo‐bis‐(2‐methylpropionamidine)
dihydrochloride (AAPH). The long‐wavelength fluorophor nile blue is
proposed as an analytical reagent alternative to these conventional
fluorophores.
Kinetic curves have been obtained by monitoring the fluorescence
variation (λex 620, λem 680 nm) with time, using the 96‐well microplate format.
The vitamin E analogue 6‐hydroxy‐2,5,7,8‐tetramethylchroman‐2‐carboxylic
acid (Trolox) has been chosen as model analyte, and the normalized area under
the decay curve has been used as the analytical parameter. The dynamic range
of the calibration curve is 0.8 – 8.0 μM and the detection limit is 0.45 μM. The
precision of the method, expressed as relative standard deviation and assayed
using 1 and 5 μM Trolox concentrations, was 5.6 and 2.9%, respectively. The
method has been applied to the analysis of fruit juices and wines, obtaining
results that did not differ significantly from those provided using the ORAC
method with fluorescein as reagent.
Keywords: nile blue, antioxidant capacity, long‐wavelength fluorimetry, 96‐well plate
J. Agric. Food Chem. 2011, 59, 2235‐2240
Capítulo 3
‐ 198 ‐
1. Introduction
Oxidation processes involving free radicals contribute to the
development of many types of illnesses, such as, e.g., cardiovascular
disease, Alzheimer’s disorder, and cancer. This redox phenomenon is
produced by reactive oxygen species (ROS), which damage cell
membranes, with this effect being reduced by the ingest of antioxidant
compounds. The antioxidant capacity of foods is mainly given by
polyphenols, such as flavonoids, and vitamins C and E, among others [1].
From an analytical point of view, there are two types of methods for
assessing this parameter. The first group involves a single electron‐transfer
reaction, which can be followed by a change in the colour as the oxidant
species is reduced. The second involves the use of hydrogen atom transfer
reactions, in which the antioxidant and the substrate compete for the free
radicals generated. The oxygen radical absorbance capacity (ORAC) assay
is an example of the latter methods. This assay involves the use of 2,2’ azo‐
bis‐(2‐methylpropionamidine)dihydro‐chloride (AAPH) to give rise to
peroxyl radicals that directly attack absorbing or fluorescent probes,
leading to the quenching of their absorbance or fluorescence, respectively.
The dyes β‐phycoerythrin [2‐4] and fluorescein (FL) [1, 5‐14] have been by
far the most used fluorescent probes, although Pyrogallol Red has been
also described to develop photometric approaches for the determination of
the antioxidant capacity in berry extracts [15] and human blood plasma
and urine [16]. This assay relies on the performance of photometric
measurements of Pyrogallol Red bleaching by action of the peroxyl radical
generator, AAPH. It has been reported that this dye allows for the separate
estimation of the contribution of ascorbic acid and some polyphenols to the
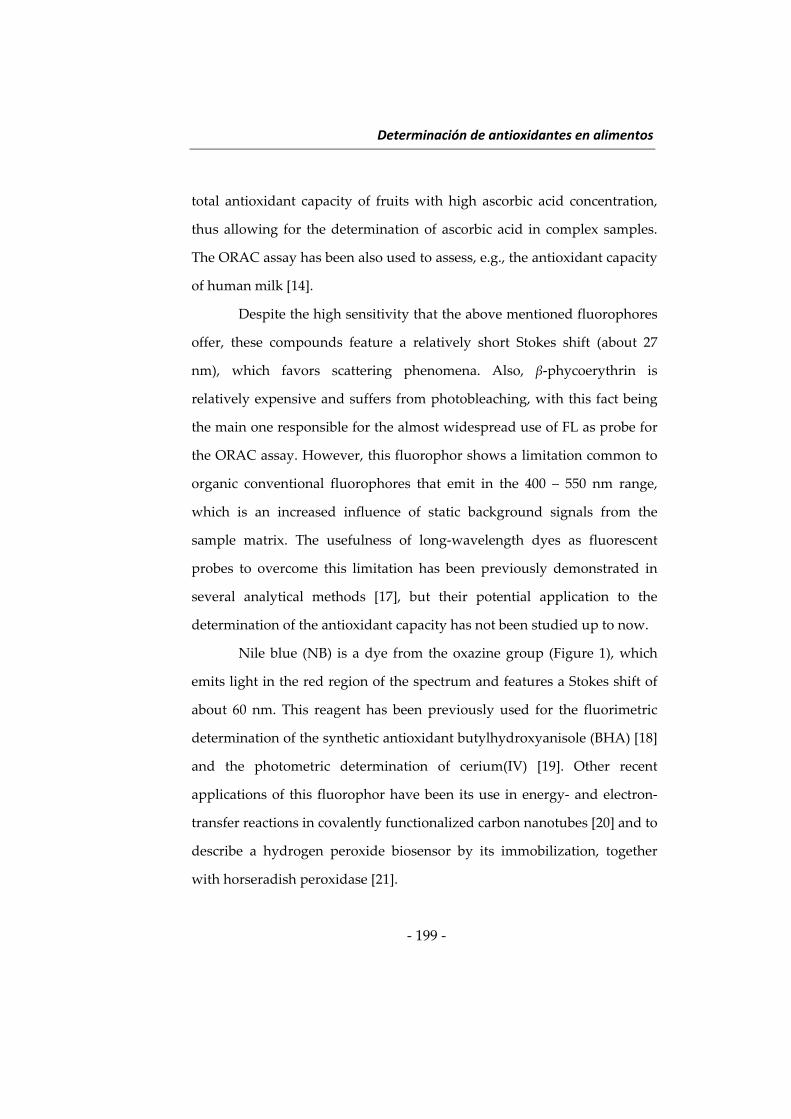
Determinación de antioxidantes en alimentos
‐ 199 ‐
total antioxidant capacity of fruits with high ascorbic acid concentration,
thus allowing for the determination of ascorbic acid in complex samples.
The ORAC assay has been also used to assess, e.g., the antioxidant capacity
of human milk [14].
Despite the high sensitivity that the above mentioned fluorophores
offer, these compounds feature a relatively short Stokes shift (about 27
nm), which favors scattering phenomena. Also, β‐phycoerythrin is
relatively expensive and suffers from photobleaching, with this fact being
the main one responsible for the almost widespread use of FL as probe for
the ORAC assay. However, this fluorophor shows a limitation common to
organic conventional fluorophores that emit in the 400 – 550 nm range,
which is an increased influence of static background signals from the
sample matrix. The usefulness of long‐wavelength dyes as fluorescent
probes to overcome this limitation has been previously demonstrated in
several analytical methods [17], but their potential application to the
determination of the antioxidant capacity has not been studied up to now.
Nile blue (NB) is a dye from the oxazine group (Figure 1), which
emits light in the red region of the spectrum and features a Stokes shift of
about 60 nm. This reagent has been previously used for the fluorimetric
determination of the synthetic antioxidant butylhydroxyanisole (BHA) [18]
and the photometric determination of cerium(IV) [19]. Other recent
applications of this fluorophor have been its use in energy‐ and electron‐
transfer reactions in covalently functionalized carbon nanotubes [20] and to
describe a hydrogen peroxide biosensor by its immobilization, together
with horseradish peroxidase [21].
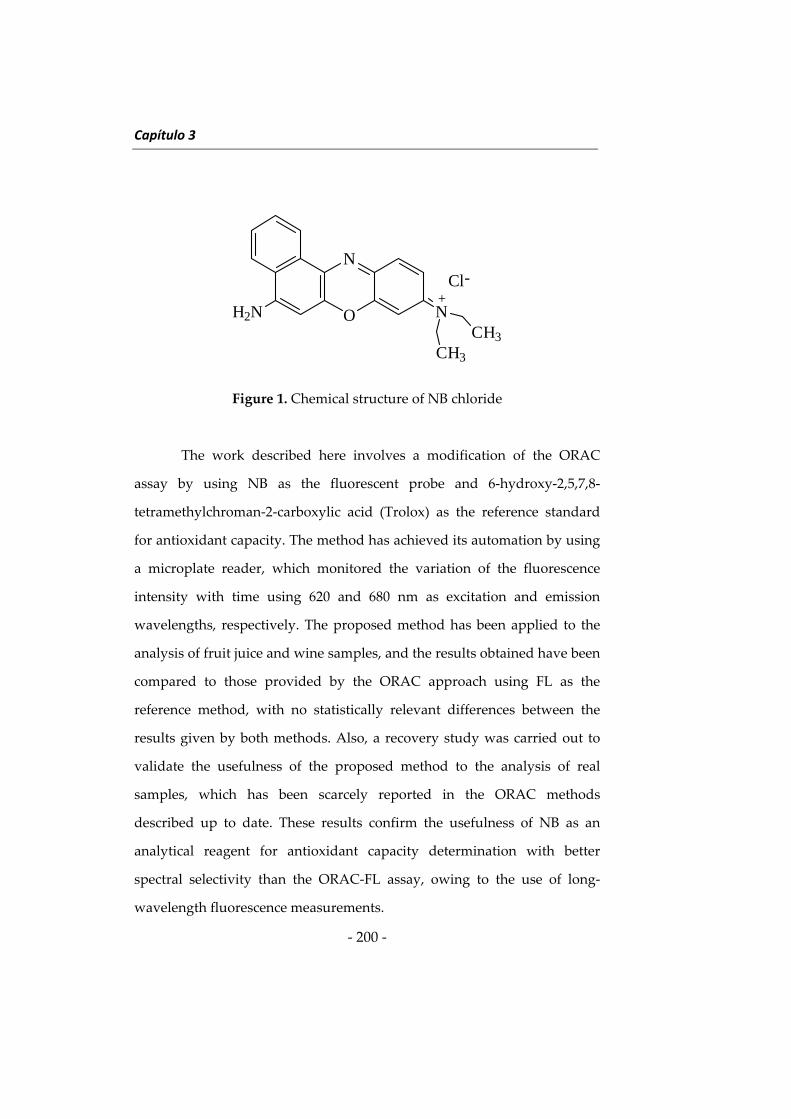
Capítulo 3
‐ 200 ‐
Figure 1. Chemical structure of NB chloride
The work described here involves a modification of the ORAC
assay by using NB as the fluorescent probe and 6‐hydroxy‐2,5,7,8‐
tetramethylchroman‐2‐carboxylic acid (Trolox) as the reference standard
for antioxidant capacity. The method has achieved its automation by using
a microplate reader, which monitored the variation of the fluorescence
intensity with time using 620 and 680 nm as excitation and emission
wavelengths, respectively. The proposed method has been applied to the
analysis of fruit juice and wine samples, and the results obtained have been
compared to those provided by the ORAC approach using FL as the
reference method, with no statistically relevant differences between the
results given by both methods. Also, a recovery study was carried out to
validate the usefulness of the proposed method to the analysis of real
samples, which has been scarcely reported in the ORAC methods
described up to date. These results confirm the usefulness of NB as an
analytical reagent for antioxidant capacity determination with better
spectral selectivity than the ORAC‐FL assay, owing to the use of long‐
wavelength fluorescence measurements.
O
N
NH2NCH3
CH3
+Cl-
Determinación de antioxidantes en alimentos
‐ 201 ‐
2. Materials and methods
2.1. Instrumentation
A 1420 Multilabel counter Victor 3V microplate reader (Perkin
Elmer and Analytical Sciences, Wallac Oy, Turku, Finland) was used to
perform fluorescence measurements. Different filters (nominal
wavelength/passband) were used to select the excitation (485/15 nm for FL
and 620/8 nm for NB) and emission (535/25 nm for FL and 680/10 nm for
NB) wavelengths used to monitor ORAC‐FL and ORAC‐NB systems,
respectively. Each measurement was obtained in 0.5 s, and the subsequent
measurements for each well with time were made in 1 min intervals.
2.2. Reagents
All reagents used were of analytical grade. NB chloride was
supplied by Sigma (St Louis, MO), and Trolox and AAPH were obtained
from Aldrich (Milwaukee, WI, and Steinheim, Germany). Dipotassium
hydrogen phosphate was purchased from Merck (Darmstadt, Germany).
Phosphate buffer solutions (0.085 M pH 6.9 and 0.075 M pH 7.5) were
prepared by dissolving appropriate amounts of dipotassium hydrogen salt
and adjusting the pH values with hydrochloric acid to develop ORAC‐NB
and ORAC‐FL methods, respectively. A NB stock solution (29.4 μM) was
prepared by dissolving the appropriate amount of the dye in distilled
water by magnetic stirring for 24 h and stored at room temperature.
Working standard solutions of 89 nM NB were prepared daily by diluting
the appropriate volume of the stock solution in phosphate buffer solution
(0.085 M at pH 6.9). A stock 4.5 x 10‐4 M FL solution was prepared by
dissolving the appropriate amount of sodium fluorescein in distilled
Capítulo 3
‐ 202 ‐
water, and subsequent dilutions were made daily in phosphate buffer
(0.075 M at pH 7.5) to prepare working 70 nM FL solutions. A 0.012 M
AAPH solution was also prepared daily in phosphate buffer solution (0.085
M at pH 6.9) and kept at room temperature protected from light to prevent
its degradation.
3. Procedures
3.1. Determination of Antioxidant Capacity by the ORAC‐NB Method
A volume (20 μL) of standard (0.8 – 8 μM Trolox), wine or juice
diluted sample, or blank (0.085 M phosphate buffer at pH 6.9) solutions
was added to each well together with 120 μL of 89 nM NB. This mixture
was preincubated in sealed plates at 37 °C for 15 minutes, and then, 60 μL
of AAPH 0.012 M was added to each well by using an eight‐channel
electronic micropipet to achieve the simultaneous addition of this reagent.
Immediately, the plate was inserted into the microplate reader, and the
variation of the fluorescence intensity with time was monitored at 37 °C for
60 min, using the instrumental conditions indicated above. Each
measurement was performed in triplicate, and a blank triplicate was
recorded at the beginning of each series to control potential changes that
may occur, owing to the lack of stability of AAPH, which was kept
protected from light at room temperature to ensure identical thermal
conditions at time 0 of the reaction. The decay curves were integrated by
using Origin software, and then, the normalized net area under the curve
(AUC) was calculated by subtracting the blank signal from the signal
obtained in the presence of the standard or sample and dividing the result
by the blank signal.
Determinación de antioxidantes en alimentos
‐ 203 ‐
3.2. Determination of the Antioxidant Capacity using the ORAC‐FL Method
The ORAC‐FL measurements were done according to the
instructions described elsewhere [5], which involve the use of a microplate
reader and FL as reagent. Briefly, 20 μL of standard or diluted sample
solutions were mixed with 120 μL of 70 nM FL in phosphate buffer (0.075
M, pH 7.4) for 15 min at 37 °C, and then, 60 μL of 0.012 M AAPH were
added. The variation of the fluorescence intensity with time was monitored
for 60 min using 485 and 535 nm filters to select excitation and emission
wavelengths, respectively. The curves obtained were processed in the same
way as that described for the ORAC‐NB method.
3.3. Determination of Antioxidant Capacity in Commercial Wine and Fruit Juice
Samples
Several wines (white, semidry and red) and fruit juices (peach,
pineapple and apple) were bought in a local market and analysed
immediately after they were opened according to the following procedure:
A volume (4.5 mL) of sample was treated with 300 μL of 1 M NaOH to
increase the pH to neutral values, and it was raised up to 5 mL with
phosphate buffer. Then, an adequate dilution (1:500 – 1:10000 dilutions)
with the same phosphate buffer was performed to match the dynamic
ranges of the calibration curves of either ORAC‐FL or ORAC‐NB method.
A volume (20 μL) of the diluted sample was treated according to the
procedures indicated above for both methods.
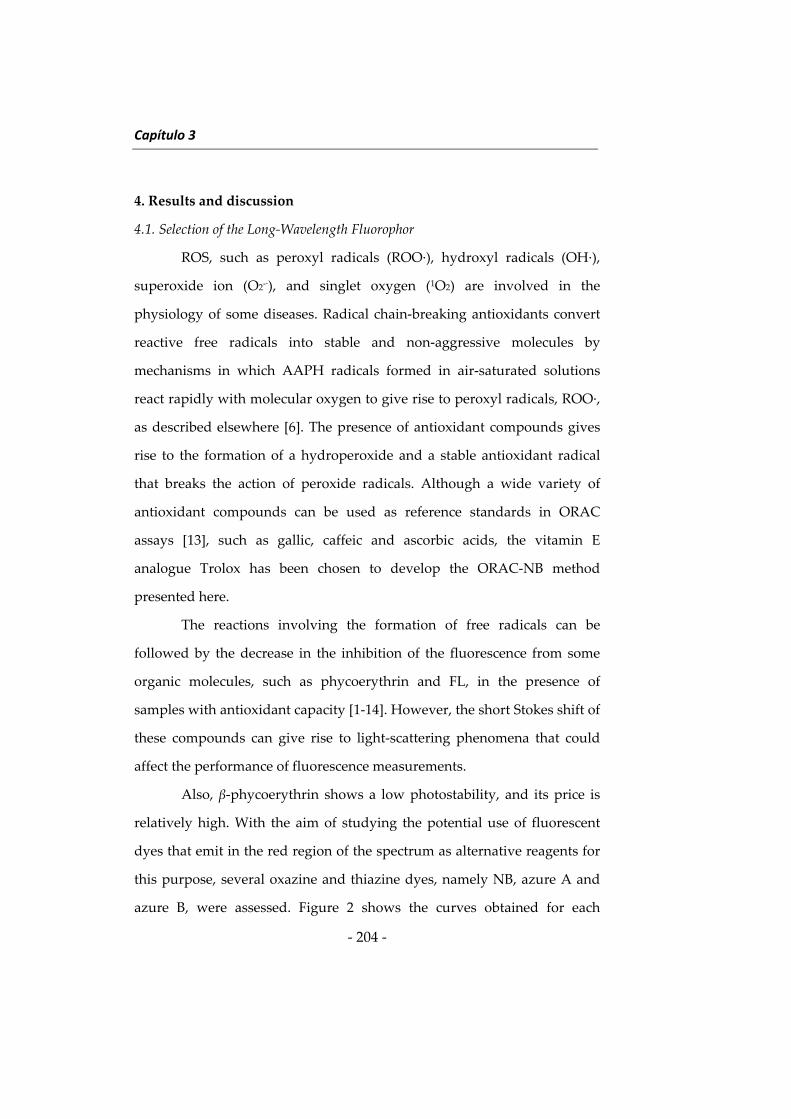
Capítulo 3
‐ 204 ‐
4. Results and discussion
4.1. Selection of the Long‐Wavelength Fluorophor
ROS, such as peroxyl radicals (ROO∙), hydroxyl radicals (OH∙),
superoxide ion (O2‐∙), and singlet oxygen (1O2) are involved in the
physiology of some diseases. Radical chain‐breaking antioxidants convert
reactive free radicals into stable and non‐aggressive molecules by
mechanisms in which AAPH radicals formed in air‐saturated solutions
react rapidly with molecular oxygen to give rise to peroxyl radicals, ROO∙,
as described elsewhere [6]. The presence of antioxidant compounds gives
rise to the formation of a hydroperoxide and a stable antioxidant radical
that breaks the action of peroxide radicals. Although a wide variety of
antioxidant compounds can be used as reference standards in ORAC
assays [13], such as gallic, caffeic and ascorbic acids, the vitamin E
analogue Trolox has been chosen to develop the ORAC‐NB method
presented here.
The reactions involving the formation of free radicals can be
followed by the decrease in the inhibition of the fluorescence from some
organic molecules, such as phycoerythrin and FL, in the presence of
samples with antioxidant capacity [1‐14]. However, the short Stokes shift of
these compounds can give rise to light‐scattering phenomena that could
affect the performance of fluorescence measurements.
Also, β‐phycoerythrin shows a low photostability, and its price is
relatively high. With the aim of studying the potential use of fluorescent
dyes that emit in the red region of the spectrum as alternative reagents for
this purpose, several oxazine and thiazine dyes, namely NB, azure A and
azure B, were assessed. Figure 2 shows the curves obtained for each
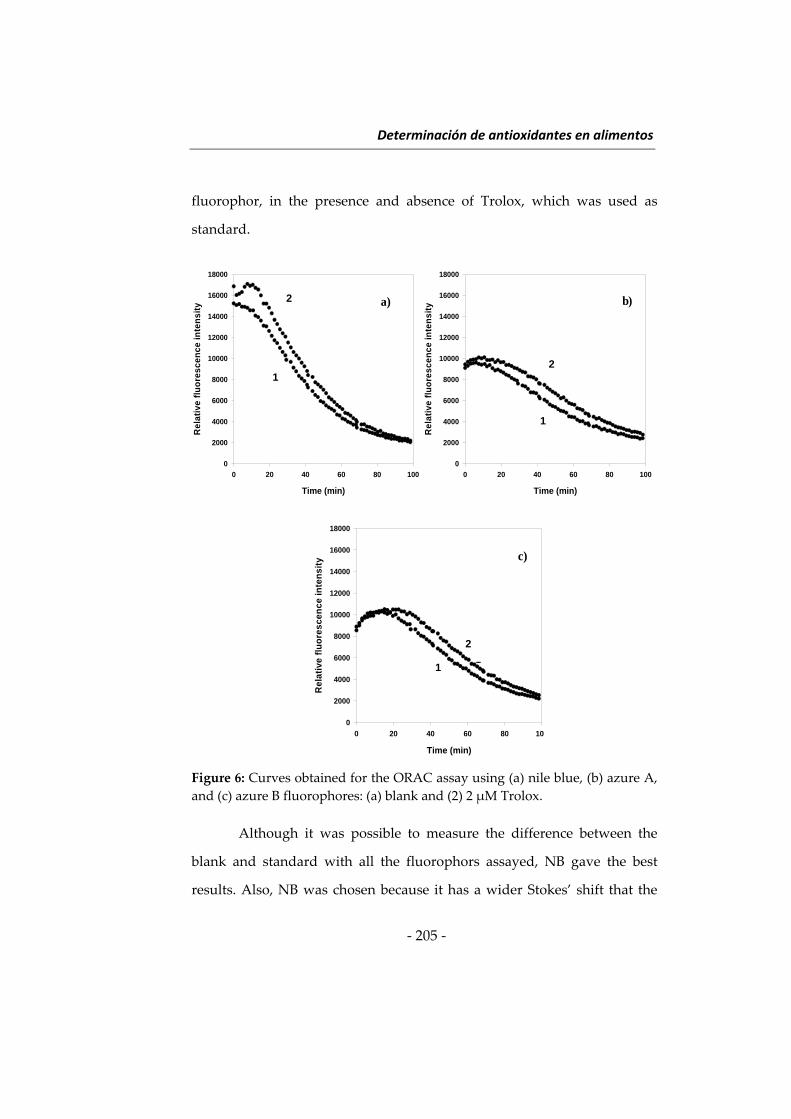
Determinación de antioxidantes en alimentos
‐ 205 ‐
fluorophor, in the presence and absence of Trolox, which was used as
standard.
Figure 6: Curves obtained for the ORAC assay using (a) nile blue, (b) azure A,
and (c) azure B fluorophores: (a) blank and (2) 2 μM Trolox.
Although it was possible to measure the difference between the
blank and standard with all the fluorophors assayed, NB gave the best
results. Also, NB was chosen because it has a wider Stokes’ shift that the
Time (min)
0 20 40 60 80 100
Rel
ativ
e fl
uo
res
cen
ce in
ten
sity
0
2000
4000
6000
8000
10000
12000
14000
16000
18000
Time (min)
0 20 40 60 80 100
Rel
ativ
e fl
uo
res
cen
ce in
ten
sity
0
2000
4000
6000
8000
10000
12000
14000
16000
18000
a) b)
Time (min)
0 20 40 60 80 100
Rel
ativ
e fl
uo
res
cen
ce in
ten
sity
0
2000
4000
6000
8000
10000
12000
14000
16000
18000
Time (min)
0 20 40 60 80 100
Rel
ativ
e fl
uo
res
cen
ce in
ten
sity
0
2000
4000
6000
8000
10000
12000
14000
16000
18000
a) b)
1
2
1
2
Time (min)
0 20 40 60 80 10
Rel
ati
ve f
luo
res
cen
ce
inte
ns
ity
0
2000
4000
6000
8000
10000
12000
14000
16000
18000
c)
Time (min)
0 20 40 60 80 10
Rel
ati
ve f
luo
res
cen
ce
inte
ns
ity
0
2000
4000
6000
8000
10000
12000
14000
16000
18000
c)
1
2
1
2
1
2
1
2
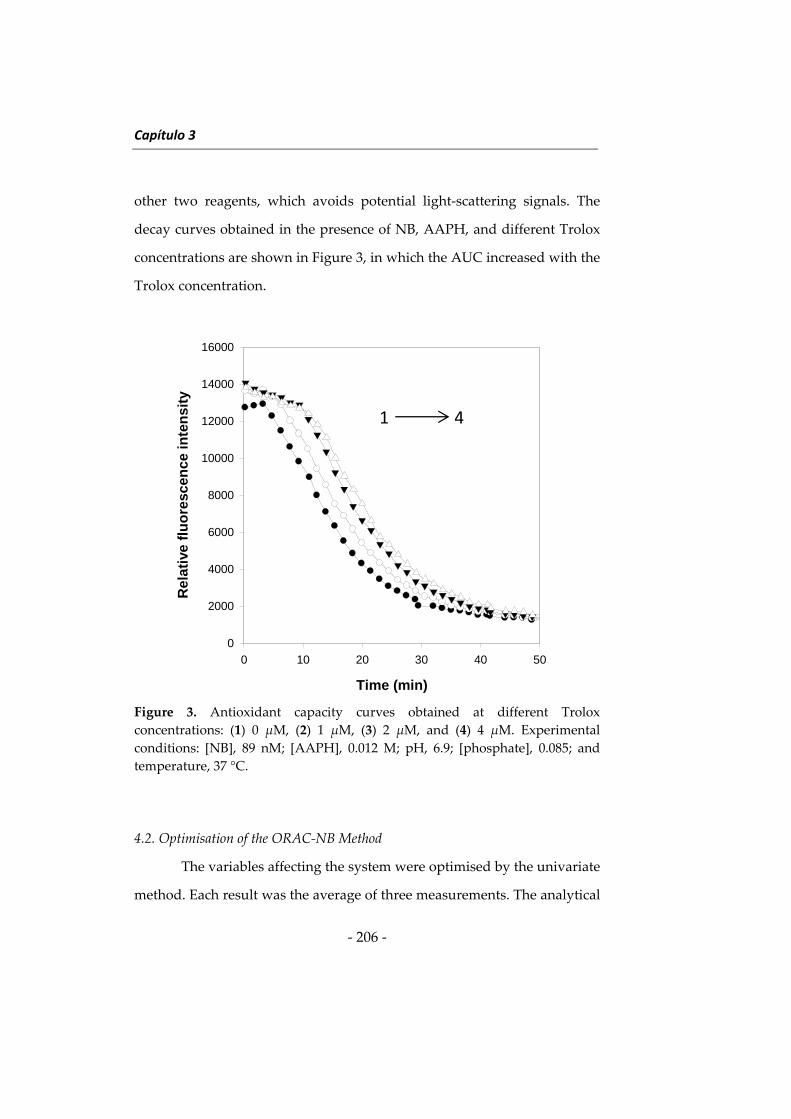
Capítulo 3
‐ 206 ‐
other two reagents, which avoids potential light‐scattering signals. The
decay curves obtained in the presence of NB, AAPH, and different Trolox
concentrations are shown in Figure 3, in which the AUC increased with the
Trolox concentration.
Figure 3. Antioxidant capacity curves obtained at different Trolox
concentrations: (1) 0 μM, (2) 1 μM, (3) 2 μM, and (4) 4 μM. Experimental
conditions: [NB], 89 nM; [AAPH], 0.012 M; pH, 6.9; [phosphate], 0.085; and
temperature, 37 °C.
4.2. Optimisation of the ORAC‐NB Method
The variables affecting the system were optimised by the univariate
method. Each result was the average of three measurements. The analytical
Time (min)
0 10 20 30 40 50
Re
lati
ve f
luo
resc
ence
inte
nsi
ty
0
2000
4000
6000
8000
10000
12000
14000
16000
1 4
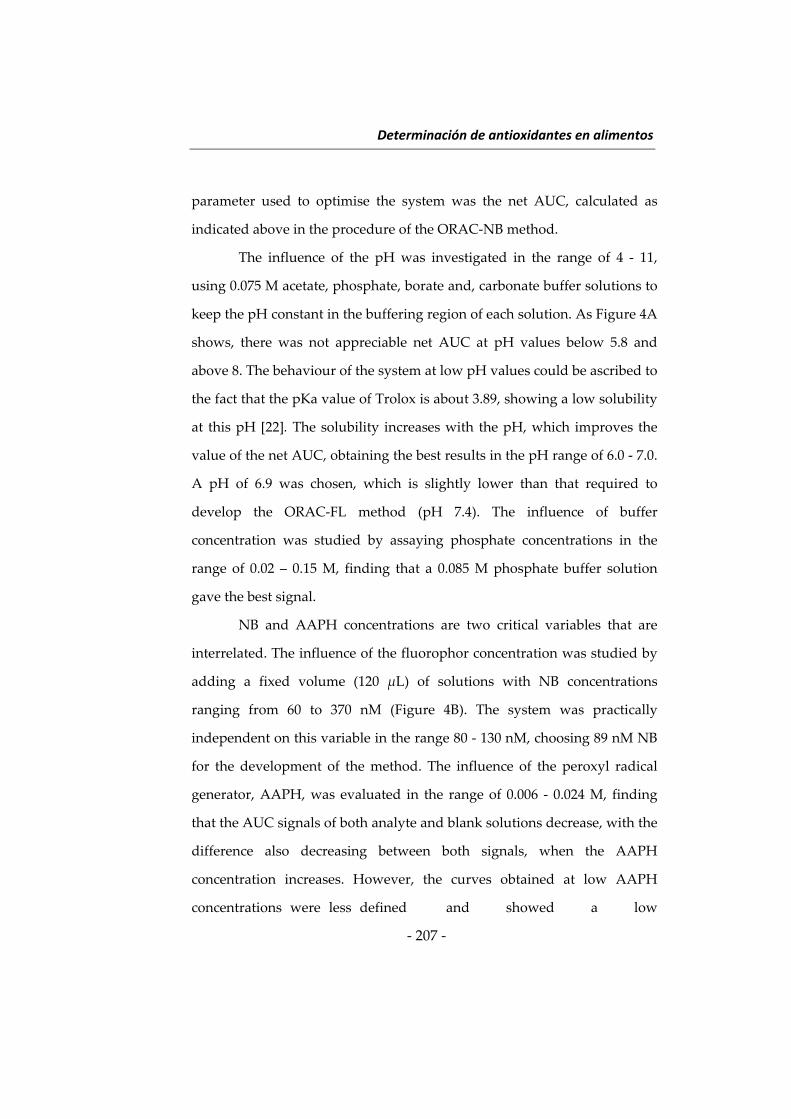
Determinación de antioxidantes en alimentos
‐ 207 ‐
parameter used to optimise the system was the net AUC, calculated as
indicated above in the procedure of the ORAC‐NB method.
The influence of the pH was investigated in the range of 4 ‐ 11,
using 0.075 M acetate, phosphate, borate and, carbonate buffer solutions to
keep the pH constant in the buffering region of each solution. As Figure 4A
shows, there was not appreciable net AUC at pH values below 5.8 and
above 8. The behaviour of the system at low pH values could be ascribed to
the fact that the pKa value of Trolox is about 3.89, showing a low solubility
at this pH [22]. The solubility increases with the pH, which improves the
value of the net AUC, obtaining the best results in the pH range of 6.0 ‐ 7.0.
A pH of 6.9 was chosen, which is slightly lower than that required to
develop the ORAC‐FL method (pH 7.4). The influence of buffer
concentration was studied by assaying phosphate concentrations in the
range of 0.02 – 0.15 M, finding that a 0.085 M phosphate buffer solution
gave the best signal.
NB and AAPH concentrations are two critical variables that are
interrelated. The influence of the fluorophor concentration was studied by
adding a fixed volume (120 μL) of solutions with NB concentrations
ranging from 60 to 370 nM (Figure 4B). The system was practically
independent on this variable in the range 80 ‐ 130 nM, choosing 89 nM NB
for the development of the method. The influence of the peroxyl radical
generator, AAPH, was evaluated in the range of 0.006 ‐ 0.024 M, finding
that the AUC signals of both analyte and blank solutions decrease, with the
difference also decreasing between both signals, when the AAPH
concentration increases. However, the curves obtained at low AAPH
concentrations were less defined and showed a low
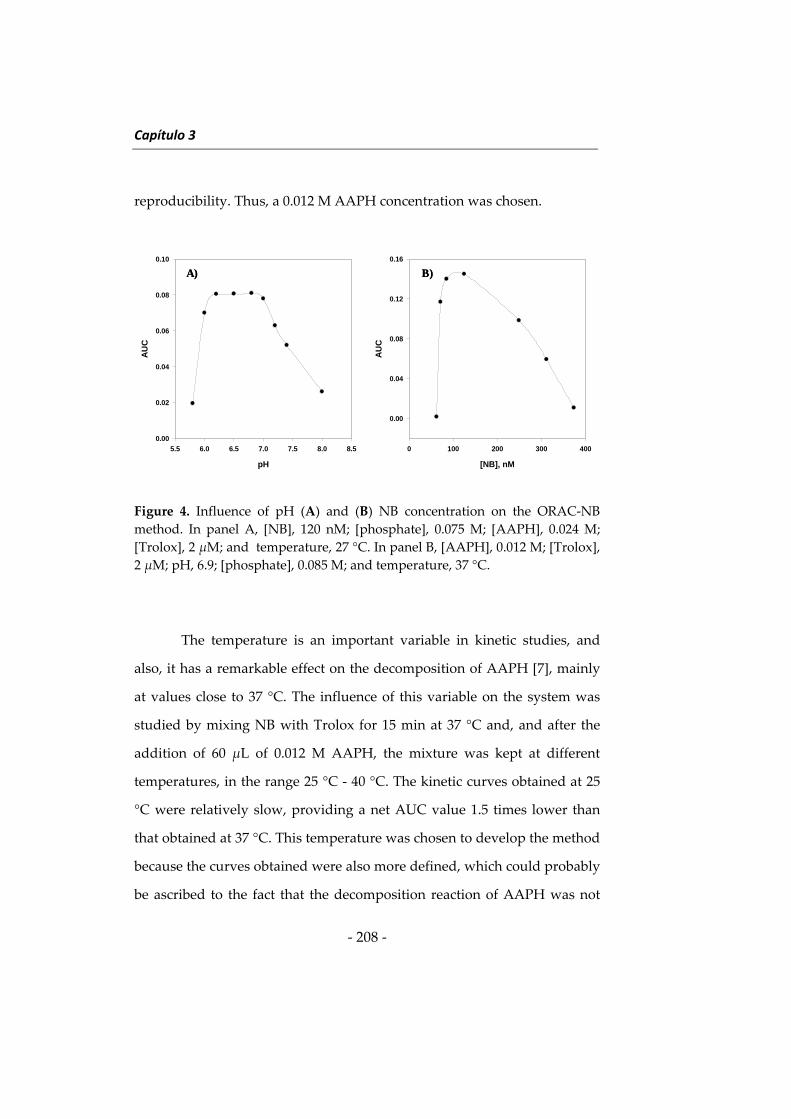
Capítulo 3
‐ 208 ‐
reproducibility. Thus, a 0.012 M AAPH concentration was chosen.
Figure 4. Influence of pH (A) and (B) NB concentration on the ORAC‐NB
method. In panel A, [NB], 120 nM; [phosphate], 0.075 M; [AAPH], 0.024 M;
[Trolox], 2 μM; and temperature, 27 °C. In panel B, [AAPH], 0.012 M; [Trolox],
2 μM; pH, 6.9; [phosphate], 0.085 M; and temperature, 37 °C.
The temperature is an important variable in kinetic studies, and
also, it has a remarkable effect on the decomposition of AAPH [7], mainly
at values close to 37 °C. The influence of this variable on the system was
studied by mixing NB with Trolox for 15 min at 37 °C and, and after the
addition of 60 μL of 0.012 M AAPH, the mixture was kept at different
temperatures, in the range 25 °C ‐ 40 °C. The kinetic curves obtained at 25
°C were relatively slow, providing a net AUC value 1.5 times lower than
that obtained at 37 °C. This temperature was chosen to develop the method
because the curves obtained were also more defined, which could probably
be ascribed to the fact that the decomposition reaction of AAPH was not
[NB], nM
0 100 200 300 400
AU
C
0.00
0.04
0.08
0.12
0.16
pH
5.5 6.0 6.5 7.0 7.5 8.0 8.5
AU
C
0.00
0.02
0.04
0.06
0.08
0.10
A) B)
[NB], nM
0 100 200 300 400
AU
C
0.00
0.04
0.08
0.12
0.16
pH
5.5 6.0 6.5 7.0 7.5 8.0 8.5
AU
C
0.00
0.02
0.04
0.06
0.08
0.10
A) B)A) B)
Determinación de antioxidantes en alimentos
‐ 209 ‐
the limiting step. The method using FL as reagent [8] is also developed at
37 °C.
4.3. Analytical Features
The kinetic curves were obtained under optimum conditions, using
λex of 620 nm and λem of 680 nm to monitor the variation of the
fluorescence intensity with time for 60 min and the net AUC as the
analytical parameter. The dynamic range of the calibration graph was 0.8 ‐
8 μM Trolox. The regression equation was AUC = (0.02 ± 0.01) + (0.074 ±
0.006) X, where X was the Trolox concentration expressed in micromolar.
The regression coefficient (R) is 0.993, which is indicative of a good
linearity of the calibration curve. The detection limit, calculated following
International Union of Pure and Applied Chemistry (IUPAC)
recommendations [23], was 0.45 μM, which is lower [6, 7] or similar [8] to
those obtained in other ORAC methods involving FL. The precision of the
method was assessed at two different Trolox concentrations, 1 and 5 μM,
and expressed as the percentage of relative standard deviation, giving 5.6
and 2.9%, respectively.
4.4. Applications
The proposed method was applied to the analysis of wines,
namely, white, semi‐dry and red, and commercial fruit juices, namely,
pineapple, peach and apple. These samples were analyzed by both ORAC‐
FL and ORAC‐NB methods with a simple sample treatment, which
consisted in the adjustment of the pH to neutral values, because the
samples featured acidic pH values. Then, the samples were
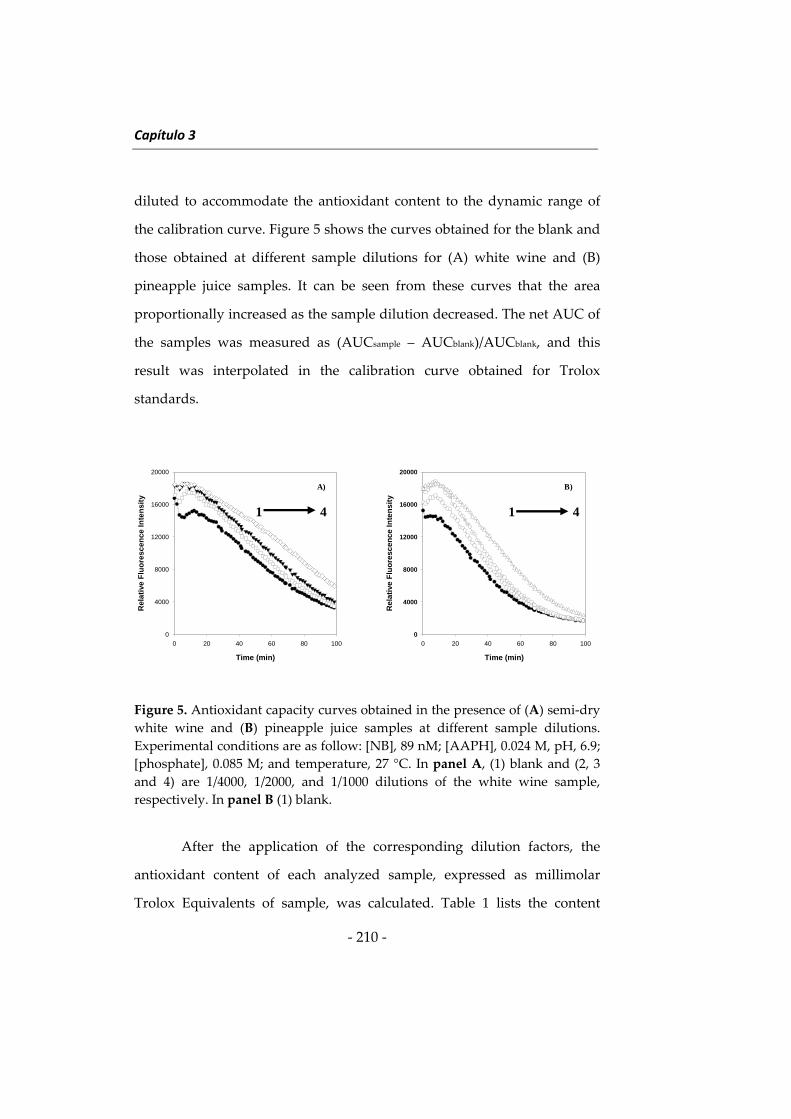
Capítulo 3
‐ 210 ‐
diluted to accommodate the antioxidant content to the dynamic range of
the calibration curve. Figure 5 shows the curves obtained for the blank and
those obtained at different sample dilutions for (A) white wine and (B)
pineapple juice samples. It can be seen from these curves that the area
proportionally increased as the sample dilution decreased. The net AUC of
the samples was measured as (AUCsample – AUCblank)/AUCblank, and this
result was interpolated in the calibration curve obtained for Trolox
standards.
Figure 5. Antioxidant capacity curves obtained in the presence of (A) semi‐dry
white wine and (B) pineapple juice samples at different sample dilutions.
Experimental conditions are as follow: [NB], 89 nM; [AAPH], 0.024 M, pH, 6.9;
[phosphate], 0.085 M; and temperature, 27 °C. In panel A, (1) blank and (2, 3
and 4) are 1/4000, 1/2000, and 1/1000 dilutions of the white wine sample,
respectively. In panel B (1) blank.
After the application of the corresponding dilution factors, the
antioxidant content of each analyzed sample, expressed as millimolar
Trolox Equivalents of sample, was calculated. Table 1 lists the content
Time (min)
0 20 40 60 80 100
Rel
ati
ve F
luo
resc
ence
Inte
nsi
ty
0
4000
8000
12000
16000
20000
Time (min)
0 20 40 60 80 100
Rel
ati
ve F
luo
resc
ence
Inte
nsi
ty
0
4000
8000
12000
16000
20000
A) B)
Time (min)
0 20 40 60 80 100
Rel
ati
ve F
luo
resc
ence
Inte
nsi
ty
0
4000
8000
12000
16000
20000
Time (min)
0 20 40 60 80 100
Rel
ati
ve F
luo
resc
ence
Inte
nsi
ty
0
4000
8000
12000
16000
20000
A) B)
1 4 1 4
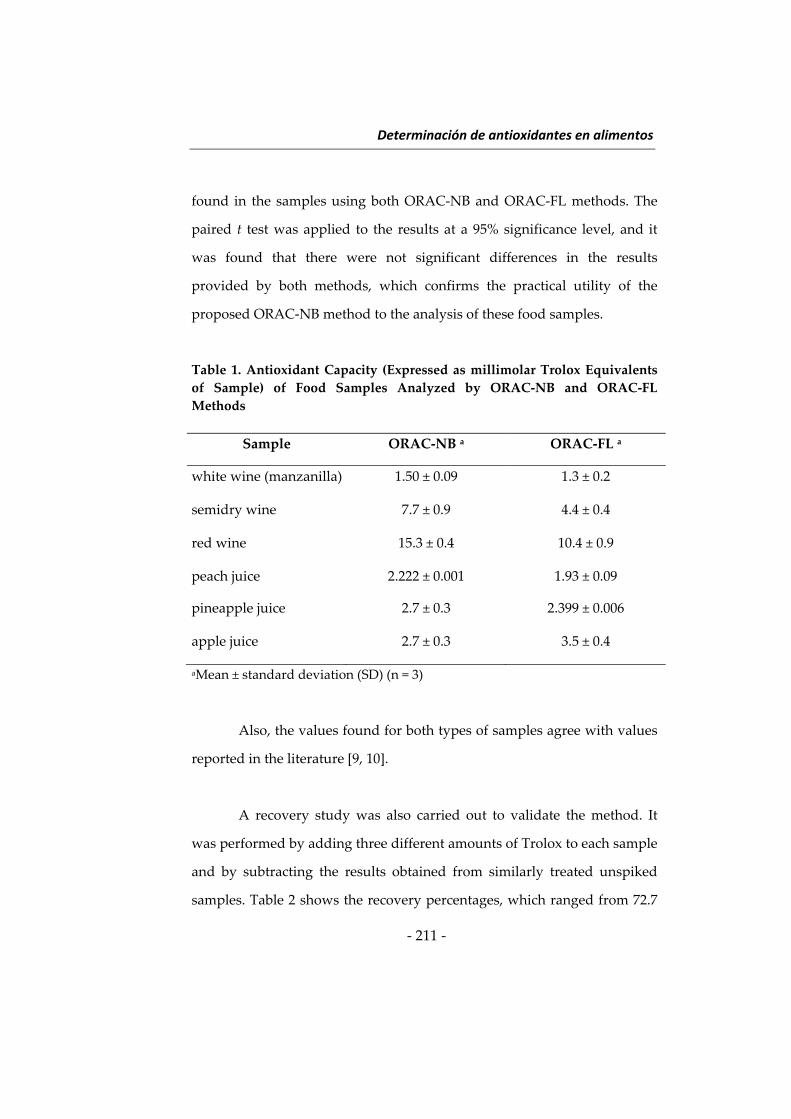
Determinación de antioxidantes en alimentos
‐ 211 ‐
found in the samples using both ORAC‐NB and ORAC‐FL methods. The
paired t test was applied to the results at a 95% significance level, and it
was found that there were not significant differences in the results
provided by both methods, which confirms the practical utility of the
proposed ORAC‐NB method to the analysis of these food samples.
Table 1. Antioxidant Capacity (Expressed as millimolar Trolox Equivalents
of Sample) of Food Samples Analyzed by ORAC‐NB and ORAC‐FL
Methods
Sample ORAC‐NB a ORAC‐FL a
white wine (manzanilla) 1.50 ± 0.09 1.3 ± 0.2
semidry wine 7.7 ± 0.9 4.4 ± 0.4
red wine 15.3 ± 0.4 10.4 ± 0.9
peach juice 2.222 ± 0.001 1.93 ± 0.09
pineapple juice 2.7 ± 0.3 2.399 ± 0.006
apple juice 2.7 ± 0.3 3.5 ± 0.4
aMean ± standard deviation (SD) (n = 3)
Also, the values found for both types of samples agree with values
reported in the literature [9, 10].
A recovery study was also carried out to validate the method. It
was performed by adding three different amounts of Trolox to each sample
and by subtracting the results obtained from similarly treated unspiked
samples. Table 2 shows the recovery percentages, which ranged from 72.7
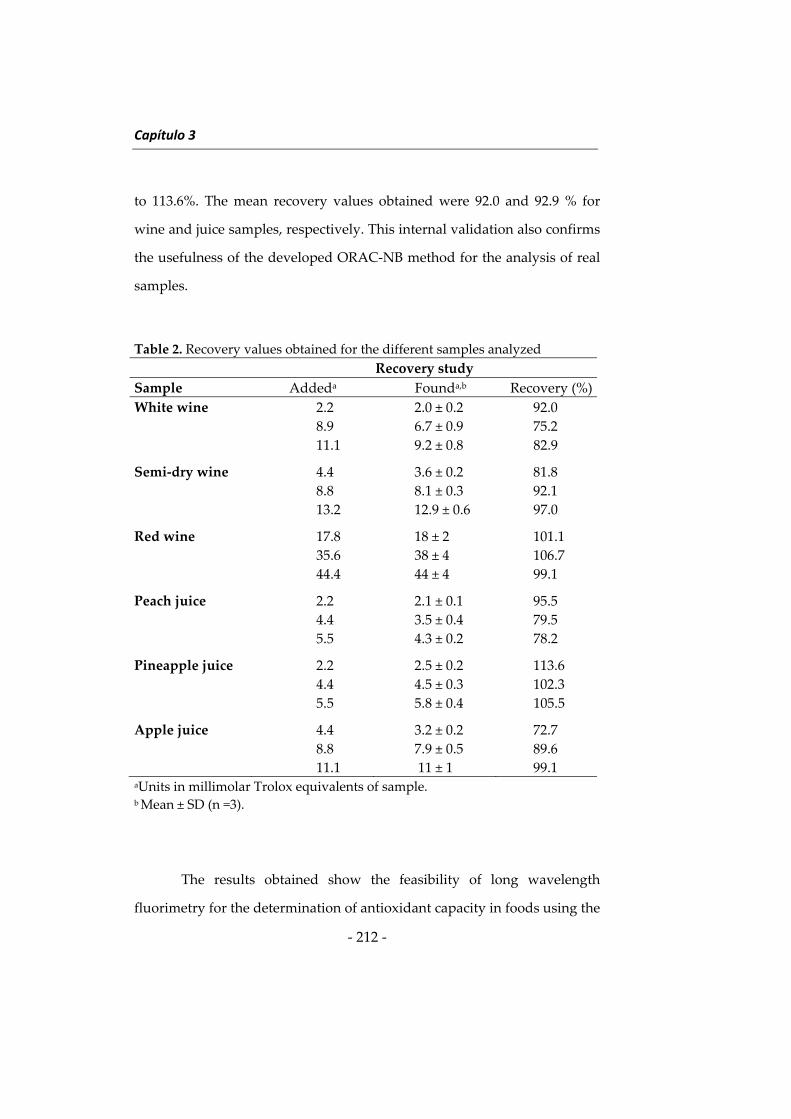
Capítulo 3
‐ 212 ‐
to 113.6%. The mean recovery values obtained were 92.0 and 92.9 % for
wine and juice samples, respectively. This internal validation also confirms
the usefulness of the developed ORAC‐NB method for the analysis of real
samples.
Table 2. Recovery values obtained for the different samples analyzed
Recovery study
Sample Addeda Founda,b Recovery (%)
White wine 2.2
8.9
11.1
2.0 ± 0.2
6.7 ± 0.9
9.2 ± 0.8
92.0
75.2
82.9
Semi‐dry wine 4.4
8.8
13.2
3.6 ± 0.2
8.1 ± 0.3
12.9 ± 0.6
81.8
92.1
97.0
Red wine 17.8
35.6
44.4
18 ± 2
38 ± 4
44 ± 4
101.1
106.7
99.1
Peach juice 2.2
4.4
5.5
2.1 ± 0.1
3.5 ± 0.4
4.3 ± 0.2
95.5
79.5
78.2
Pineapple juice 2.2
4.4
5.5
2.5 ± 0.2
4.5 ± 0.3
5.8 ± 0.4
113.6
102.3
105.5
Apple juice 4.4
8.8
11.1
3.2 ± 0.2
7.9 ± 0.5
11 ± 1
72.7
89.6
99.1 aUnits in millimolar Trolox equivalents of sample. b Mean ± SD (n =3).
The results obtained show the feasibility of long wavelength
fluorimetry for the determination of antioxidant capacity in foods using the
Determinación de antioxidantes en alimentos
‐ 213 ‐
fluorophor NB for the first time as an analytical reagent. The use of this
reagent instead of other fluorophores previously proposed for this
purpose, such as FL or β‐phycoerythrin, is a useful alternative to avoid
potential background signals from the sample matrix, which can appear at
lower wavelengths. Also, the relatively wide Stokes shift of NB allows
analytical measurements to be free of scattering signals, which can be a
limitation when the above‐mentioned fluorophores are used. Finally, the
probability of photobleaching processes for NB is lower than that for β‐
phycoerythrin, as well as its cost.
Acknowledgement
The authors gratefully acknowledge financial support from the
Ministerio de Ciencia e Innovación (MICINN) (Grant CTQ2009‐08621) and
from the Junta of Andalucia (Grant P09‐FQM4933).
Abbreviations used
AAPH, 2,2’ azo‐bis‐(2‐methylpropionamidine) dihydrochloride; AUC, area
under the curve; BHA, butylhydroxyanisole; FL, fluorescein; NB, nile blue;
ORAC, oxygen radical absorbance capacity; ROS, reactive oxygen species
Capítulo 3
‐ 214 ‐
References
(1) M. Ciz, H. Cizova, P. Deneb, M. Kratchanova, A. Slavov, A. Lojek.
Different methods for control and comparison of the antioxidant
properties of vegetables. Food Control (2010) 21, 518‒523.
(2) M. D. Rivero‐Pérez, M. L. González‐Sanjosé, M. Ortega Herás, P.
Muñiz. Antioxidant potential of single‐variety red wines aged in the
barrel and in the bottle. Food Chem. (2008) 111, 957–964.
(3) E. Sofic, Z. Rimpapa, Z. Kundurovic, A. Sapcanin, I. Tahirovic, A.
Rustembegovic, G. Cao. Antioxidant capacity of the neurohormone
melatonin. J. Neural Transm. (2005) 112, 349–358.
(4) G. Cao, C. P. Verdon, A. H. B. Wu, H. Wang, R. L. Prior. Automated
assay of oxygen radical absorbance capacity with the COBAS FARA
II. Clin. Chem. (1995) 41, 1738–1744.
(5) G. Cao, H. M. Alessie, R. G. Cutler. Oxygen‐radical absorbance
capacity assay for antioxidants. Free Radical Bio. Med. (1993) 14, 303–
311.
(6) B. Ou, M. Hampsch‐Woodill, R. L. Prior. Development and
validation of an improved oxygen radical absorbance capacity assay
using fluorescein as the fluorescent probe. J. Agric. Food Chem. (2001)
49, 4619–4626.
(7) D. Huang, B. Ou, M. Hampsch‐Woodill, J. A. Flanagan, R. L. Prior.
High‐throughput assay of oxygen radical absorbance capacity
(ORAC) using a multichannel liquid handling system coupled with a
microplate fluorescence reader in 96‐well format. J. Agric. Food Chem.
(2002) 50, 4437–4444.
Determinación de antioxidantes en alimentos
‐ 215 ‐
(8) A. Dávalos, C. Gómez‐Cordovés, B. Bartolomé. Extending
applicability of the Oxygen Radical Absorbance Capacity (ORAC‐
Fluorescein) assay. J. Agric. Food Chem. (2004) 52, 48–54.
(9) A. Dávalos, B. Bartolomé, C. Gómez‐Cordovés. Antioxidant
properties of commercial grape juices and vinegars. Food Chem.
(2005) 93, 325–330.
(10) W. Mullen, S. C. Marks, A. Crozier. Evaluation of phenolic
compounds in commercial fruit juices and fruit drinks. J. Agric. Food
Chem. (2007) 55, 3148‒3157.
(11) J. Tabart, C. Kevers, J. Pincemail, J. O. Defraigne, J. Dommes.
Comparative antioxidant capacities of phenolic compounds
measured by various tests. Food Chem. (2009) 113, 1226–1233.
(12) L. Müller, S. Groyke, A. M. Popken, V. Böhm. Antioxidant capacity
and related parameters of different fruit formulations. Food Sci.
Technol. (2010) 43, 992–999.
(13) N. Nenadis, O. Lazaridou, M. Z. Tsimidou. Use of reference
compounds in antioxidant activity assessment. J. Agric. Food Chem.
(2007) 55, 5452–5460.
(14) A. Tijerina‐Sáenz, I. Elisia, S. M. Innis, J. K. Friel, D. D. Kitts. Use of
ORAC to assess antioxidant capacity of human milk. J. Food Compos.
Anal. (2009) 22, 694–698.
(15) E. Atala, L. Vásquez, H. Speisky, E. Lissi, C. López‐Alarcón. Ascorbic
acid contribution to ORAC values in berry extracts: An evaluation by
the ORAC‐pyrogallol red methodology. Food Chem. (2009) 113, 331–
335.
(16) P. Torres, P. Galleguillos, E. Lissi, C. López‐Alarcón.
Capítulo 3
‐ 216 ‐
Antioxidant capacity of human blood plasma and human urine:
Simultaneous evaluation of the ORAC index and ascorbic acid
concentration employing pyrogallol red as probe. Bioorg. Med. Chem.
(2008) 16, 9171–9175.
(17) A. Gómez‐Hens, M. P. Aguilar‐Caballos. Long‐wavelength fluoro‐
phores: new trends in their analytical use. Trends Anal. Chem. (2004)
23, 127–136.
(18) M. P. Aguilar‐Caballos, A. Gómez‐Hens, D. Pérez‐Bendito. Simulta‐
neous stopped‐flow determination of butylated hydroxyanisole and
propyl gallate using a T‐format spectrofluorimeter. J. Agric. Food
Chem. (2000) 48, 312–317.
(19) H. Tavallali, E. Asrari, M. A. Ameri Siahoe. Sensitive kinetic spectro‐
photometric method for trace determination of cerium (IV) based on
decolarization of nile blue by potassium periodate. Int. J. Chem. Tech
Res. (2009) 1, 359–362.
(20) G. M. do Nascimento, R. C. de Oliveira, N. A. Pradie, P. R. G. Lins, P.
R. Worfel, G. R. Martinez, P. Di Mascio, M. S. Dresselhaus, P. Corio.
Redox mediator single‐wall carbon nanotubes modified with organic
dyes: Synthesis, characterization and potential cytotoxic effects. J.
Photochem. Photobiol. A (2010) 211, 99–107.
(21) A. K. Upadhyay, Y. Y. Peng, S. M. Chen. Immobilization of
horseradish peroxidase and nile blue into the ormosil nanocomposite
for the fabrication of hydrogen peroxide biosensor based on
MWCNT modified glassy carbon electrode. Sens. Actuat. B (2009)
141, 557‒565.
Determinación de antioxidantes en alimentos
‐ 217 ‐
(22) M. Lúcio, C. Nunes, D. Gaspar, H. Ferreira, J. L. F. C. Lima, S. Reis.
Antioxidant activity of vitamin E and Trolox: Understanding of the
factors that govern lipid peroxidation studies in vitro. Food Biophys.
(2009) 4, 312–320.
(23) G. L. Long, J. D. Winefordner. Limit of detection: A closer look at the
IUPAC’s definition. Anal. Chem. (1983) 55, 712A‒724A.

Determinación de antioxidantes en alimentos
‐ 219 ‐
Automatic determination of polyphenols in wines
using laccase and terbium oxide nanoparticles
J. Godoy‐Navajas, M.P. Aguilar Caballos, A. Gómez‐Hens
Department of Analytical Chemistry, University of Cordoba, Campus
of Rabanales. Annex to Marie Curie Building. 14071‐Cordoba. Spain
Abstract
The analytical usefulness of the combined use of laccase, terbium
oxide nanoparticles (Tb4O7NPs) and 8‐hydroxypyrene‐3‐sulfonate
trisodium (HPTS) for the determination of polyphenol compounds in wine
samples is described. The system is based on the temporal inhibition by
polyphenols on the decrease of the HPTS fluorescence in the presence of
laccase and on the activating effect of Tb4O7NPs, which increase the
reaction rate of the system, shortening analysis times.
The method has been developed in a microplate format using an
automatic reader, reaching a sample throughput of 35 samples h‐1. The
dynamic range of the calibration graph is 0.5 ‐ 12 μM gallic acid, which was
chosen as model analyte, and the detection limit is 0.14 μM. Precision data,
expressed as relative standard deviation, ranged between 2.5 and 6.3%. The
method was applied to the analysis of several wine samples, obtaining
recovery values in the range of 80.0‐108.3%.
Keywords: Polyphenols, terbium oxide nanoparticles, laccase, fluorometric
detection, wine analysis.
Capítulo 3
‐ 220 ‐
1. Introduction
Polyphenols are an important group of natural antioxidant
compounds present in the human diet that, after numerous
epidemiological and clinical studies, have shown their usefulness in the
prevention of various chronic diseases. The interest in the determination of
these compounds has given rise to chromatographic (Lorrain, Ky,
Pechamat & Teissedre, 2013; Medić‐Ŝarić, Rastija & Bojić, 2011) and
capillary electrophoretic (Franquet‐Griell, Checa, Núñez, Saurina,
Hernández‐Cassou & Puignou, 2012; Sánchez‐Arribas, Martínez‐
Fernández & Chicharro, 2012) methods for their identification and
quantification. However, the high variety of compounds that form this
group justifies the development of methods devoted to determine phenol
content and antioxidant activity, which is another related parameter that
includes non‐phenolic antioxidants. Both parameters are widely
determined in fruits and beverages such as wines.
The photometric Folin‐Ciocalteu method (Magalhães, Segundo,
Reis, Lima & Rangel, 2006; Nenadis, Lazaridou & Tsimidou, 2007; Sánchez‐
Rangel, Benavides, Heredia, Cisneros‐Zevallos & Jacobo‐Velázquez, 2013)
is usually chosen for phenolic content determination, using a polyphenol,
such as gallic acid, as calibration standard. However, a limitation of this
method is that usually provides an overestimation of these compounds
due to interferences from some non‐phenolic reducing substances. Several
methods involving the measurement of scavenging capacity of
antioxidants against a given radical have been described for antioxidant
activity determination (Sochor et al., 2010; Dawidowicz, Wianowska &
Olszowy, 2012; Nkhili & Prat, 2011; Godoy‐Navajas, Aguilar‐Caballos &
Determinación de antioxidantes en alimentos
‐ 221 ‐
Gómez‐Hens, 2011). Most of these methods use Trolox (6‐hydroxy‐2,5,7,8‐
tetramethylchroman‐2‐carboxylic acid), which is a water‐soluble analogue
of vitamin E, as calibration standard. Although several studies have been
carried out using different wine types to relate the phenol content with the
antioxidant activity, the correlation coefficients obtained are usually low
(Fernández‐Pachón, Villaño, García‐Parrilla & Troncoso, 2004; Di Majo, La
Guardia, Giammanco, La Neve & Giammanco, 2008; Li, Wang, Li, Li &
Wang, 2009), which is the result of the different antioxidant potential of the
phenol compounds present in wines.
Laccase is a phenoloxidase enzyme that has been described for the
determination of both phenolic content and antioxidant activity, using
different experimental conditions. This enzyme catalyzes the oxidation of
phenolic compounds to quinones or radicals by reducing the dissolved
oxygen to water. Several laccase‐based amperometric sensors have been
described for polyphenol determination in wines (Gamella, Campuzano,
Reviejo & Pingarrón, 2006; Di Fusco, Tortolini, Deriu & Mazzei, 2010;
Montereali, Della Seta, Vastarella & Pilloton, 2010) using gallic acid as the
polyphenol standard. Although the detection limits of these methods are
adequate for their use in routine analysis, they show a limited life time that
is ascribed to the adsorption of oxidized products on the surface of the
electrode with the consequent negative effect on the enzyme activity. A
fluorometric method has been reported for the determination of
polyphenol content in juice and tea samples using indocyanine green and
positively charged gold nanoparticles (Andreu‐Navarro, Fernández‐
Romero & Gómez‐Hens, 2012). The method is based on the temporal
inhibition caused by polyphenols on the oxidation of the fluorophore and
Capítulo 3
‐ 222 ‐
the modification of the enzyme activity by its interaction with the
nanoparticles. Laccase has also been described for the determination of
antioxidant activity using high reactive chromophore substrates, such as
2,2´‐azino‐bis‐(3‐ethylbenzothiazolin‐6‐sulfonic) acid (ABTS) (Kulys &
Bratkovskaya, 2007) or syringaldazine (Nugroho‐Pratseyo, Kudanga,
Steiner, Murkovic, Nyanhongo & Guebitz, 2009; Nugroho‐Pratseyo,
Kudanga, Steiner, Murkovic, Nyanhongo & Guebitz, 2010), which are
oxidized to free radicals that react with the phenolic and non‐phenolic
antioxidants present in the sample. In addition to the use of laccase in food
analysis, this enzyme has been also applied in detoxification procedures of
effluents from chemical industries, in which the degradation of some
compounds, such as phenol is performed (Wang, Hu, Guo, Huang & Liu,
2012). Also, it has been used in textile industries for dye decolourization
and degradation (Benzina et al., 2013; Ashrafi, Rezaei, Foroontanfar, Mahvi
& Faramarzi, 2013; Taha, Shwaish, Mohamed, Haider & Stamatis, 2013).
A feature of the methods described for the determination of
polyphenol content and antioxidant capability is that measurements are
usually performed sequentially, so that the sample throughput is lower
than in systems operating simultaneously such as those involving the use
of a microplate reader. This approach has been here used for the first time
to develop an automatic method for the determination of polyphenols in
wines using laccase and the fluorophore 8‐hydroxypyrene‐1,3,6‐trisulfonic
acid trisodium salt (HPTS or pyranine) in the presence of Tb4O7
nanoparticles (NPs). Other aims of this research were the study of the
potential usefulness of HPTS as a laccase substrate and the capacity of
these NPs to play a role as laccase activators.
Determinación de antioxidantes en alimentos
‐ 223 ‐
HPTS has been previously used for the evaluation of the
antioxidant potential of polyphenols by measuring the bleaching of HPTS
by peroxyl radicals using 2,2’‐azo‐bis(2‐amidinopropane) hydrochloride
(AAPH) as the free radical source (Campos, Sotomayour, Pino & Lissi,
2004). However, the practical application of this method was not described.
A comparative study of the radical‐scavenging capacity of red wine has
been carried out using the bleaching of HPTS and pyrogallol red induced
by free radicals generated from an azo initiator (Omata, Saito, Yoshida &
Niki, 2008). This study showed that HTPS has much lower reactivity
toward peroxyl radicals than pyrogallol red, which allows antioxidants to
inhibit HTPS bleaching almost completely to produce a lag phase, from
which the total amounts of free radicals that can be scavenged by
antioxidants, may be estimated. The results obtained in the study carried
out here have shown the usefulness of HPTS as a laccase substrate for
polyphenol determination and the positive effect of Tb4O7 NPs to improve
the features of the developed method.
2. Experimental
2.1 Instrumentation
A 1420 multilabel counter Victor 3V microplate reader (Perkin‐
Elmer and Analytical Sciences, Wallac Oy, Turku, Finland) was used to
perform fluorescence measurements. Different filters (nominal
wavelength/passband) were used to select excitation and emission
wavelengths of several fluorophores assayed in the study (Table 1) and
each measurement was made in 0.5 s. An SLM‐Aminco (Urbana, IL, USA),
Model 8100 photon‐counting spectrofluorometer, equipped with a 450 W
Capítulo 3
‐ 224 ‐
xenon arc source and a R928 photomultiplier tube, was used to perform
fluorescence excitation and emission scans of the different fluorophores in
solution and photobleaching experiments. A Lambda 35 UV/VIS
spectrometer (Perkin‐Elmer, United Kingdom) was used to perform
photometric measurements of the Folin‐Ciocalteu method. 1/2AreaPlateTM
microplates (PerkinElmer, USA) with a total volume of 180 �L were used to
record the kinetic curves of the system.
2.2 Reagents
All reagents used were of analytical grade. The fluorophores 8‐
hydroxypyrene‐1,3,6‐trisulfonic acid trisodium salt (HPTS), 2‐[4‐
(dimethylamino)styryl]‐1‐methylpyridinium iodide (2‐Di‐1‐ASP), 2‐[4‐
(dimethylaminophenyl]‐1,3‐butadienyl)‐3‐ethylbenzothiazolium p‐
toluenesulfonate salt (Styryl 7), nile blue chloride, azure B chloride and
toluidine blue O were provided by Sigma‐Aldrich (St. Louis, Mo, USA), as
well as Tween 20, laccase enzyme (Trametes Versicolor, EC Number 1.10.3.2,
2.05 U/mg), and caffeic acid. The surfactants Triton X‐100 and hexadecyl‐
trimethylammonium bromide (CTAB) were purchased from Fluka (Buchs,
Switzerland). Europium (III) oxide nanoparticles (Eu2O3 nanopowder, <150
nm), diamond nanoparticles (<10 nm particle size) and gallic acid were
acquired from Sigma. Terbium oxide nanopowder (TEM <150 nm), silver
nanoparticles (10 nm, in aqueous buffer containing citrate as stabilizer),
terbium nitrate pentahydrate and sodium chloride were purchased for
Sigma‐Aldrich and fluorescein sodium was purchased for Fluka. Ascorbic
acid was acquired from Sigma‐Aldrich while citric acid and sulfuric acid
were purchased from Panreac (Barcelona, Spain). Glucose and sucrose
Determinación de antioxidantes en alimentos
‐ 225 ‐
were purchased from Sigma‐Aldrich and Fluka, respectively. Di‐potassium
hydrogen phosphate, tris(hydroxymethyl)‐aminomethane (TRIS), sodium
sulfite, malic acid and sodium hydroxide were purchased from Merck
(Darmstadt, Germany). Sodium carbonate, sodium acetate and sodium
dodecyl sulfate (SDS), Folin‐Ciocalteu´s phenol reagent (2N) and 6‐
hydroxy‐2,5,7,8‐tetramethylchromane‐2‐carboxylic acid (Trolox) were
provided from Sigma‐Adrich.
Phosphate buffer solution (0.4 M pH 7.0) was prepared by
dissolving an appropriate amount of dipotassium hydrogen phosphate salt
(Merck) in distilled water and adjusting the pH with hydrochloric acid. A
HPTS stock solution (890 μM) was prepared by dissolving the appropriate
amount of the fluorophore in distilled water by magnetic stirring for
several minutes and stored at room temperature. Working solutions (10
μM HPTS) were prepared daily by diluting the appropriate volume of the
stock solution in the phosphate buffer solution. A 10 mM stock solution of
gallic acid was prepared daily by dissolving the appropriate amount of the
reagent in distilled water and the different standards solutions were
prepared diluting the appropriate volume of the stock solution in distilled
water. A 4 mg/mL stock Tb4O7 NPs dispersion was prepared daily by
dispersing the appropriate amount of nanopowder in distilled water by
using an ultrasound bath. Working solutions were prepared by diluting
the stock dispersion in the phosphate buffer solution. A laccase stock
solution (4 U/mL) was prepared daily by sonication for 10 s and let
overnight to stand before use. Working laccase solutions were prepared by
diluting the appropriate volume of the stock solution in the phosphate
buffer solution.
Capítulo 3
‐ 226 ‐
2.3. Procedures
2.3.1. Determination of polyphenols using the laccase‐Tb4O7 NP method
A volume (75 μL) of zero standard, gallic acid standards (0.5 – 12
μM) or diluted wine sample was firstly added to each well of the
microplate together with 15 μL of 10 μM HPTS. This mixture was kept for
15 minutes at 37 oC to reach constant temperature and, then, a volume (60
μL) of a mixture containing 1 mg/mL Tb4O7 NPs and 1 U/mL laccase in
phosphate buffer solution was added to each well by using an electronic
multichannel micropipette. Immediately after, the microplate was inserted
into the microplate reader, and the variation of the fluorescence intensity of
HPTS with time was monitored at 37 oC for 36 min, using nominal
excitation and emission wavelength filters of 450 and 535 nm, respectively.
Normalized decay curves were obtained by dividing the fluorescence
signals obtained at each time by the fluorescence signal obtained at time
zero for each curve. These curves were later integrated using Origin
software, and then, the net normalized area under the curve (AUC) was
calculated by subtracting the AUC for the blank from the AUC obtained in
the presence of gallic acid.
2.3.2. Analysis of wine samples
Wine samples (red, white and sweet wine samples) were bought at
a local supermarket and analyzed immediately after they were opened.
Samples were diluted according to their content to match the dynamic
range of the calibration curve. The dilutions were in the ranges of 1:4000 ‐
Determinación de antioxidantes en alimentos
‐ 227 ‐
1:8000 for red, 1:100 – 1:500 for white and 1:500 – 1:2000 for sweet wine
samples.
2.3.3. Folin‐Ciocalteu method
This method was performed as described elsewhere (Magalhães et
al., 2006). Briefly, a volume (2.5 mL) of gallic acid standard (15‐150 μM
prepared in distilled water) or diluted wine sample was mixed with 500 μL
of Folin‐Ciocalteu reagent (heteropolyphosphotungstate‐ molybdate) and 5
mL of sodium carbonate (60 g/L). This mixture was kept at room
temperature for 2 h and, afterwards, the absorbance was measured at 760
nm.
3. Results and Discussion
3.1. Study of the system
This study was carried out to choose the experimental conditions
that allow the development of a fast and automatic fluorometric method
for the determination of polyphenol compounds using laccase. The study
was carried out in an automatic system involving the use of microplates
with a volume of 180 μL for each well, so that the sample and reagent
consumption was lower than in conventional microplates (350‐400 μL).
Several potential fluorescent laccase substrates (Styryl 7, 2‐Di‐1‐
ASP, azure B chloride, toluidine blue O, nile blue chloride, sodium
fluorescein and HPTS) (Table 1) were assayed to study their capability to
compete with phenolic antioxidants for the active sites of the enzyme.
Although indocyanine green has been described as a laccase substrate
(Andreu‐Navarro et al., 2012), it was not assayed because its long
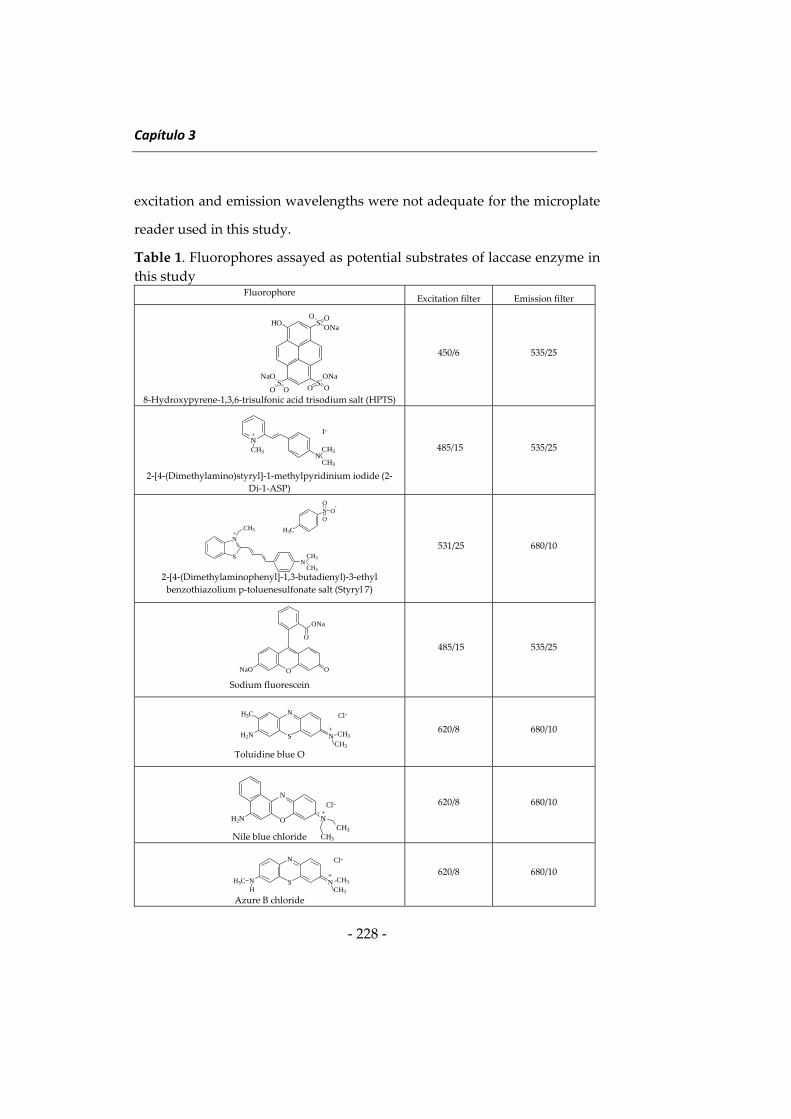
Capítulo 3
‐ 228 ‐
excitation and emission wavelengths were not adequate for the microplate
reader used in this study.
Table 1. Fluorophores assayed as potential substrates of laccase enzyme in
this study Fluorophore
Excitation filter Emission filter
8‐Hydroxypyrene‐1,3,6‐trisulfonic acid trisodium salt (HPTS)
450/6 535/25
2‐[4‐(Dimethylamino)styryl]‐1‐methylpyridinium iodide (2‐
Di‐1‐ASP)
485/15 535/25
2‐[4‐(Dimethylaminophenyl]‐1,3‐butadienyl)‐3‐ethyl
benzothiazolium p‐toluenesulfonate salt (Styryl 7)
531/25 680/10
Sodium fluorescein
485/15 535/25
Toluidine blue O
620/8 680/10
Nile blue chloride
620/8 680/10
Azure B chloride
620/8 680/10
ONaO
O
ONa
O
SHO
S S
O OONa
ONa
OO
NaO
O O
NCH3
NCH3
CH3
+ I-
S
N
NCH3
CH3
CH3+
SO
OO
H3C
-
O
N
NH2NCH3
CH3
+Cl-
S
N
N CH3
CH3
NH
H3C+
Cl-
Cl-
S
N
N CH3
CH3
H2N
H3C
+
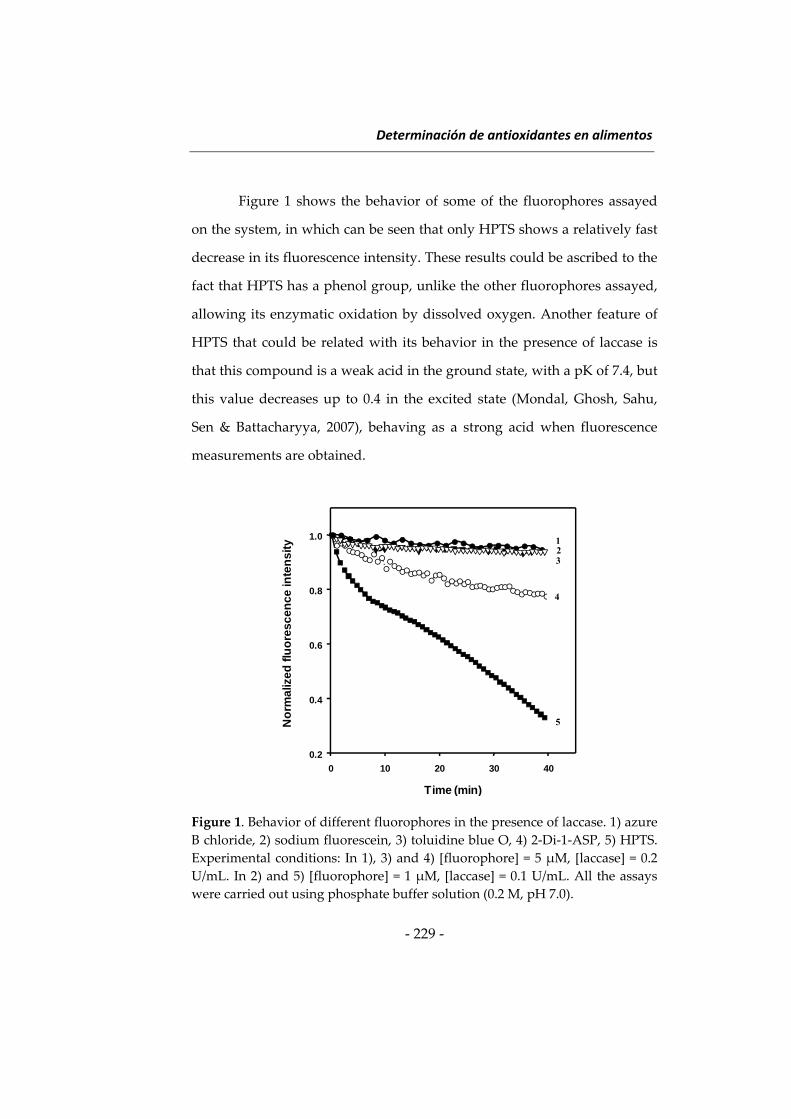
Determinación de antioxidantes en alimentos
‐ 229 ‐
Figure 1 shows the behavior of some of the fluorophores assayed
on the system, in which can be seen that only HPTS shows a relatively fast
decrease in its fluorescence intensity. These results could be ascribed to the
fact that HPTS has a phenol group, unlike the other fluorophores assayed,
allowing its enzymatic oxidation by dissolved oxygen. Another feature of
HPTS that could be related with its behavior in the presence of laccase is
that this compound is a weak acid in the ground state, with a pK of 7.4, but
this value decreases up to 0.4 in the excited state (Mondal, Ghosh, Sahu,
Sen & Battacharyya, 2007), behaving as a strong acid when fluorescence
measurements are obtained.
Figure 1. Behavior of different fluorophores in the presence of laccase. 1) azure
B chloride, 2) sodium fluorescein, 3) toluidine blue O, 4) 2‐Di‐1‐ASP, 5) HPTS.
Experimental conditions: In 1), 3) and 4) [fluorophore] = 5 μM, [laccase] = 0.2
U/mL. In 2) and 5) [fluorophore] = 1 μM, [laccase] = 0.1 U/mL. All the assays
were carried out using phosphate buffer solution (0.2 M, pH 7.0).
Time (min)
0 10 20 30 40
No
rma
lize
d f
luo
res
ce
nc
e in
ten
sit
y
0.2
0.4
0.6
0.8
1.0 1
3
4
5
2
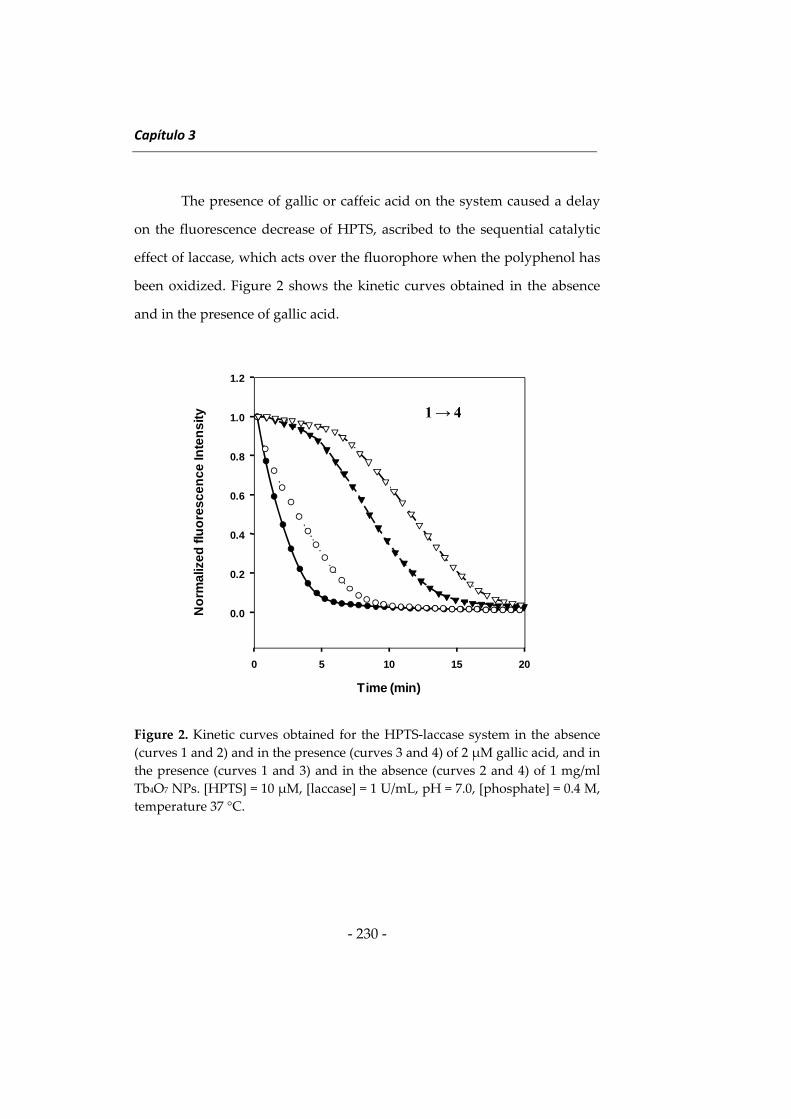
Capítulo 3
‐ 230 ‐
The presence of gallic or caffeic acid on the system caused a delay
on the fluorescence decrease of HPTS, ascribed to the sequential catalytic
effect of laccase, which acts over the fluorophore when the polyphenol has
been oxidized. Figure 2 shows the kinetic curves obtained in the absence
and in the presence of gallic acid.
Figure 2. Kinetic curves obtained for the HPTS‐laccase system in the absence
(curves 1 and 2) and in the presence (curves 3 and 4) of 2 μM gallic acid, and in
the presence (curves 1 and 3) and in the absence (curves 2 and 4) of 1 mg/ml
Tb4O7 NPs. [HPTS] = 10 μM, [laccase] = 1 U/mL, pH = 7.0, [phosphate] = 0.4 M,
temperature 37 °C.
Time (min)
0 5 10 15 20
No
rma
lize
d f
luo
res
ce
nce
Inte
ns
ity
0.0
0.2
0.4
0.6
0.8
1.0
1.2
1 → 4
Determinación de antioxidantes en alimentos
‐ 231 ‐
Another assay carried out to improve the features of the system
was the study of the potential activator effect of different NPs on the
catalytic behavior of laccase. The positive effect of copper oxide NPs on the
degrading activity of laccase has been previously described using
syringaldazine, but the activation mechanism of these NPs has not been
elucidated (Mukhopadhyay, Dasgupta & Chakrabarti, 2013). Although
Cu(II) in solution also caused an activation effect, it was lower than that
obtained in the presence of the NPs. Several NPs, such as diamond, Eu2O3,
Tb4O7, magnetic‐gold NPs and silver NPs (AgNPs) were assayed in the
range of 0.1‐2 mg/mL, finding that only Tb4O7 NPs notably increased the
reaction rate of the system. Both blank and analyte AUC decreased, but the
net AUC difference was better than in the absence of the NPs, as can be
seen in Figure 2. Also, the effect of Tb4O7 NPs on the system was checked
in the absence of laccase, finding that the NPs did not modify the
fluorescence of HPTS. Diamond and magnetic‐gold NPs caused the
fluorescence quenching of HPTS and AgNPs inhibited the catalytic effect of
laccase, while no change on the kinetic behavior of the system was found
in the presence of Eu2O3 NPs. Terbium(III) ions in solution were assayed at
equivalent concentrations than Tb4O7 NPs, obtaining lower net AUC values
than using the NPs. These results show the usefulness of these NPs as
activators of the enzymatic system. Terbium(III) in solution has been
recently described as an activator of deoxyribozymes, which are DNA
catalysts (Javadi‐Zarnaghi & Höbartner, 2013), but the use of Tb4O7 NPs as
a catalyst activator has not been described up to date.
The effect of cationic (CTAB), anionic (SDS) and non‐ionic (Triton
X‐100 and Tween 20) surfactants on the system was assayed below and
Capítulo 3
‐ 232 ‐
above their critical micellar concentration. The strong interaction of HPTS
with CTAB, which has been previously described (Pramanik, Banerjee &
Bhattacharya, 2007), gave rise to a decrease of the reaction rate of the
system, which made difficult to develop an assay with a suitable sample
throughput. The presence of SDS and Triton X‐100 caused a decrease in the
fluorescence intensity of HPTS, decreasing also the AUC values obtained in
the absence and the presence of the analyte. Finally, the fluorescence of
HPTS and the reaction rate of the system were not affected in the presence
of Tween 20. According to these results, surfactants were not used for the
development of the system.
3.2. Optimization of the system
The variables affecting the system were optimized by the univariate
method using the net AUC as the analytical parameter, which was
calculated as indicated in the procedure. However, it was necessary to find
a compromised solution between this parameter and the time required to
obtain each measurement, in order to avoid the excessive duration of the
procedure. Each result was the average of three measurements.
The influence of the pH on the system was studied in the range of
4.0‐9.0 using different buffers solutions, such as acetic acid/acetate,
phosphate and carbonate at a 0.2 M concentration. The fluorescence of
HPTS was very low at pH 4.0 in the presence of acetate ions and it
remained constant without undergoing any oxidation reaction with
laccase. HPTS showed a high fluorescence at pH values in the range of 8.0‐
9.0, but it was not modified in the presence of laccase. However,
appropriate net AUC values were obtained at pH 7.0 ‐ 7.5. Hexamine,
Determinación de antioxidantes en alimentos
‐ 233 ‐
imidazole and phosphate buffer solutions were assayed to adjust the pH
within this range, obtaining the best net AUC in the presence of phosphate
buffer solution in the concentration range of 0.2 – 0.5 M. The influence of
the HPTS concentration was studied adding a fixed volume (15 μL) of
solutions with HPTS concentrations ranging from 2.5 to 20 μM, obtaining
that the system was independent of this variable in the range of 8‐12 μM
HPTS concentration.
Laccase activity and Tb4O7 NPs concentration are two critical
variables that have a remarkable effect on both the net AUC and the
duration of the kinetic curve. Both variables were studied in the ranges of
0.5 ‐ 2 U/mL and 0.2 ‐ 2 mg/mL for laccase activity and Tb4O7NP
concentration, respectively. High values of both variables gave rise to very
high reaction rates and low net AUC, which has a negative effect on the
sensitivity of the method. Several assays were carried out using different
values of these variables, obtaining appropriate net AUC and duration of
the process in the presence of 1 U/mL laccase and 1 mg/mL NPs. As Figure
2 shows, the activation effect of the NPs on the catalytic action of laccase is
demonstrated under these experimental conditions. The temperature was
studied in the range of 20 ‐ 40 °C, and the best results were obtained at 37
°C.
3.3. Analytical features
The net AUC values were obtained from the normalized kinetic
curves, monitored at λex 450 nm and λem 535 nm under the optimum
experimental conditions for different gallic acid concentrations (Figure 3).
The dynamic range of the calibration graph was 0.5 – 12 μM gallic acid and
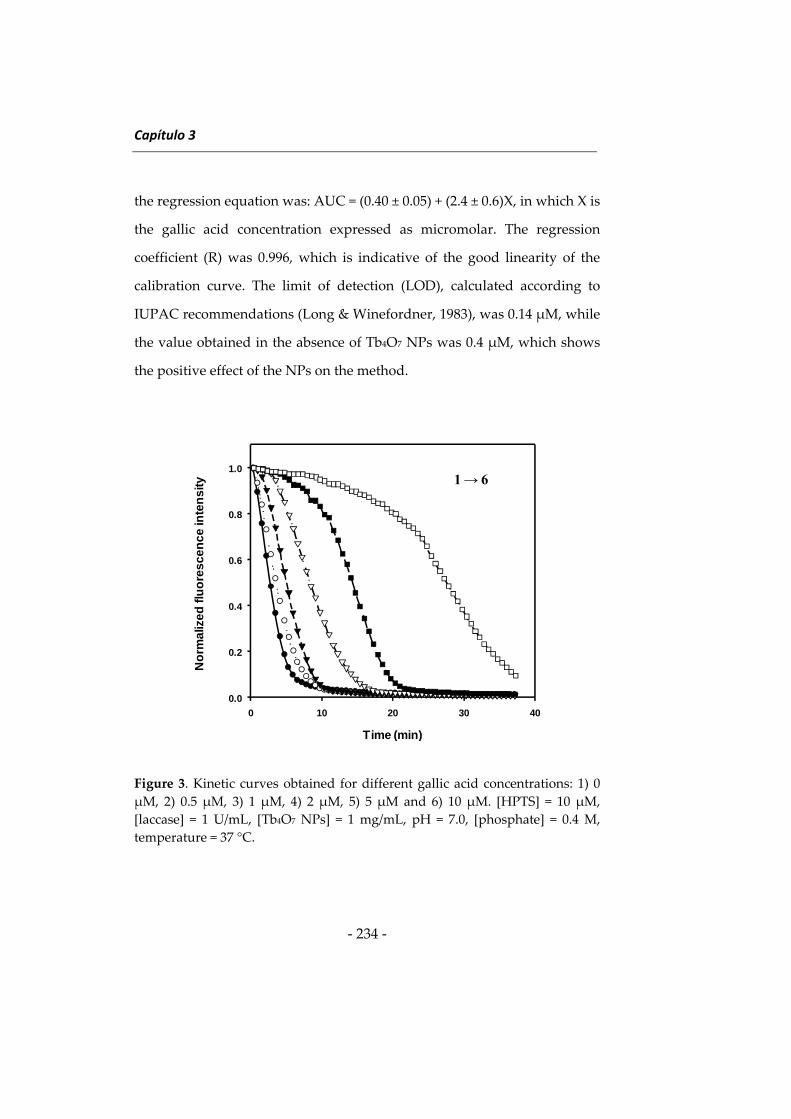
Capítulo 3
‐ 234 ‐
the regression equation was: AUC = (0.40 ± 0.05) + (2.4 ± 0.6)X, in which X is
the gallic acid concentration expressed as micromolar. The regression
coefficient (R) was 0.996, which is indicative of the good linearity of the
calibration curve. The limit of detection (LOD), calculated according to
IUPAC recommendations (Long & Winefordner, 1983), was 0.14 μM, while
the value obtained in the absence of Tb4O7 NPs was 0.4 μM, which shows
the positive effect of the NPs on the method.
Figure 3. Kinetic curves obtained for different gallic acid concentrations: 1) 0
μM, 2) 0.5 μM, 3) 1 μM, 4) 2 μM, 5) 5 μM and 6) 10 μM. [HPTS] = 10 μM,
[laccase] = 1 U/mL, [Tb4O7 NPs] = 1 mg/mL, pH = 7.0, [phosphate] = 0.4 M,
temperature = 37 °C.
Time (min)
0 10 20 30 40
No
rma
lize
d fl
uo
res
ce
nc
e in
ten
sity
0.0
0.2
0.4
0.6
0.8
1.01 → 6
Determinación de antioxidantes en alimentos
‐ 235 ‐
The LOD reached in the presence of the NPs is lower than those
described for gallic acid using some amperometric biosensors (Di Fusco et
al., 2010; Montereali et al., 2010). Although a LOD of 0.04 μM has been
obtained for gallic acid using indocyanine green (Andreu‐Navarro et al.,
2012), this method involves the sequential analysis of each sample,
requiring about 15 min to carry out each measurement. However, the
automation of the measurements using a microplate reader allows a
sample throughput of 35 samples h‐1 (three measurements for each sample)
in the new method. The precision of the method, expressed as the
percentage of relative standard deviation, was assessed at 0.7 and 5 μM
gallic acid concentrations, providing values of 6.3 and 2.5 %, respectively.
The selectivity of the method was checked by assaying some non‐
phenolic reducing substances, which could be present in wines. A
compound was considered not to interfere if the analytical signal obtained
in its presence was within one standard deviation the signal obtained in its
absence. Table 2 shows the results obtained after assaying different
potential interfering compounds. The most serious interference was caused
by ascorbic acid, which was tolerated at the same molar concentration than
that of the analyte. However, this interference would be negligible because
the maximum limit allowed for ascorbic acid when used as an additive in
wine is 0.85 mM (“Oxford companion to wine”, Robinson J. (Ed.), 2006),
which is lower than the usual content of polyphenols in wines. Sulfites
were tolerated in a concentration 20‐fold of the analyte. Although this
interference could be removed using a pre‐treatment step (Montereali et
al., 2010), it was not necessary as the presence of sulfites in wines is
controlled according to their total content in reducing substances
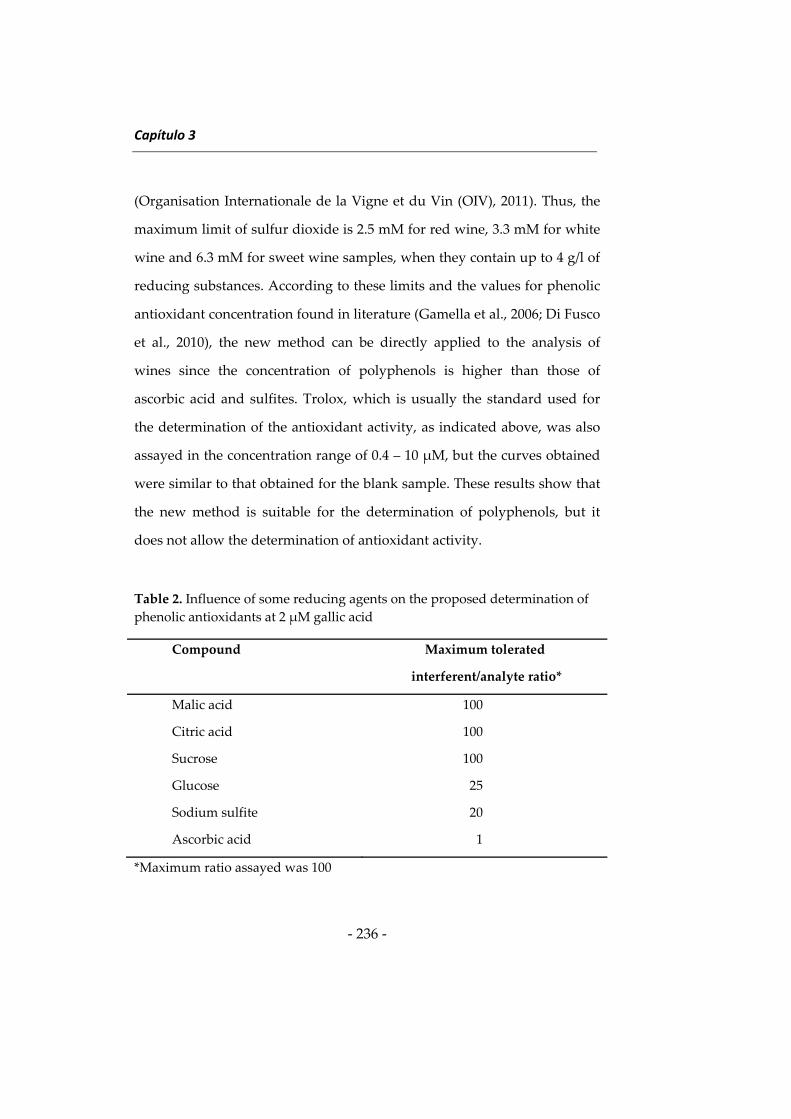
Capítulo 3
‐ 236 ‐
(Organisation Internationale de la Vigne et du Vin (OIV), 2011). Thus, the
maximum limit of sulfur dioxide is 2.5 mM for red wine, 3.3 mM for white
wine and 6.3 mM for sweet wine samples, when they contain up to 4 g/l of
reducing substances. According to these limits and the values for phenolic
antioxidant concentration found in literature (Gamella et al., 2006; Di Fusco
et al., 2010), the new method can be directly applied to the analysis of
wines since the concentration of polyphenols is higher than those of
ascorbic acid and sulfites. Trolox, which is usually the standard used for
the determination of the antioxidant activity, as indicated above, was also
assayed in the concentration range of 0.4 – 10 μM, but the curves obtained
were similar to that obtained for the blank sample. These results show that
the new method is suitable for the determination of polyphenols, but it
does not allow the determination of antioxidant activity.
Table 2. Influence of some reducing agents on the proposed determination of
phenolic antioxidants at 2 μM gallic acid
Compound Maximum tolerated
interferent/analyte ratio*
Malic acid 100
Citric acid 100
Sucrose 100
Glucose 25
Sodium sulfite 20
Ascorbic acid 1
*Maximum ratio assayed was 100
Determinación de antioxidantes en alimentos
‐ 237 ‐
3.4. Applications
The proposed method was applied to the analysis of red, white and
sweet wines. The sample treatment only consisted in the dilution of the
samples to match the dynamic range of the calibration curve, using gallic
acid standards and the net AUC as analytical parameter. Table 3 shows the
content of antioxidants found in these samples analyzed by the proposed
method and by the Folin‐Ciocalteu method. The values found by using the
new method agree with those reported in the literature (Gamella et al.,
2006; Di Fusco et al., 2010). As it can be seen from the table, the values
provided by Folin‐Ciocalteu method were higher in all instances than those
provided by the laccase method, which is ascribed to the capability of the
later to also detect non‐phenolic substances. A recovery study was
performed by adding three different amounts of gallic acid to each sample
and subtracting the results obtained from similarly treatment unspiked
samples (Table 3). The recovery percentages obtained ranged from 81.0 to
108.3 % and the mean recoveries for red, white and sweet wines were 90.9,
92.4 and 99.5 %, respectively.
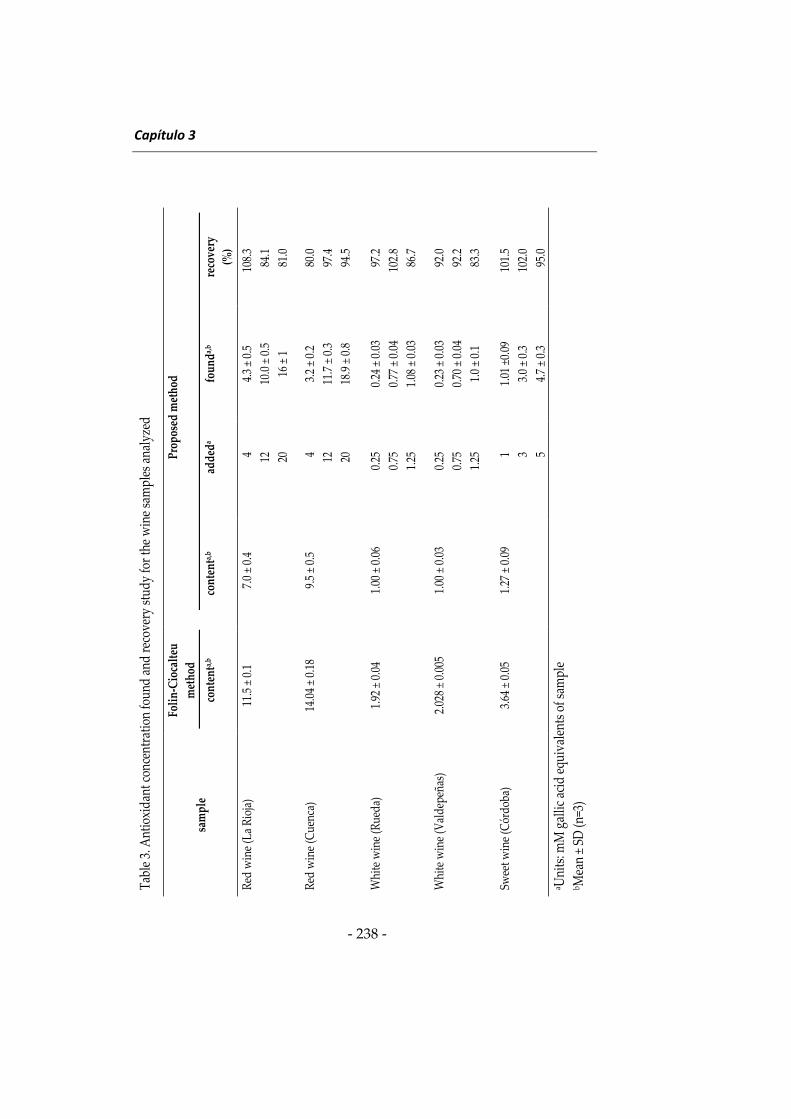
Capítulo 3
‐ 238 ‐
Table 3. Antioxida
nt con
centratio
n foun
d an
d recovery study fo
r the wine samples ana
lyzed
sample
Folin‐Ciocalteu
method
Proposed method
content
a,b
content
a,b
addeda
founda
,b
recovery
(%)
Red w
ine (La Rioja)
11.5 ± 0.1
7.0 ± 0.4
4 4.3 ± 0.5
108.3
12
10.0 ± 0.5
84.1
20
16 ± 1
81.0
Red w
ine (Cue
nca)
14.04 ± 0.18
9.5 ± 0.5
4 3.2 ± 0.2
80.0
12
11.7 ± 0.3
97.4
20
18.9 ± 0.8
94.5
White w
ine (Rue
da)
1.92 ± 0.04
1.00 ± 0.06
0.25
0.24 ± 0.03
97.2
0.75
0.77 ± 0.04
102.8
1.25
1.08 ± 0.03
86.7
White w
ine (Valde
peña
s)
2.028 ± 0.005
1.00 ± 0.03
0.25
0.23 ± 0.03
92.0
0.75
0.70 ± 0.04
92.2
1.25
1.0 ± 0.1
83.3
Sweet w
ine (Córdo
ba)
3.64 ± 0.05
1.27 ± 0.09
1 1.01 ±0.09
101.5
3 3.0 ± 0.3
102.0
5 4.7 ± 0.3
95.0
a Units: m
M gallic acid equivalents of sam
ple
b Mean ± SD (n
=3)
Determinación de antioxidantes en alimentos
‐ 239 ‐
4. Conclusions
An automated method has been reported for the determination of
polyphenols in wine samples using HPTS as a new fluorescent laccase
substrate and Tb4O7 NPs as activators of laccase. The presence of these NPs
on the system allows shorter analysis times and lower enzyme
consumption. The microplate reader enables the simultaneous processing
of 96 tests, reaching an overall sample throughput of about 35 samples h‐1,
when analysed in triplicate. Also, the use of wells with a total volume of
180 μL, in spite of conventional microplates with volumes of 350‐400 μL
per well, is cost‐effective, since the reagent consumption is lower.
The analytical usefulness of the proposed method for the
determination of polyphenols in wine samples has been demonstrated and
the results have been compared with those provided by the Folin‐Ciocalteu
method, which was used as reference. The results obtained for all samples
analyzed by the new method were lower owing to its better selectivity
compared to the reference method, which is a common aspect for other
laccase‐based enzyme methods previously described for wine analysis
(Gamella et al., 2006; Di Fusco et al., 2010).
Acknowledgements
Authors gratefully acknowledge financial support from the Spanish
Ministerio de Economía y Competitividad MINECO (Grant No. CTQ2012‐
32941), the Junta de Andalucía Program (Grant No. P09‐ FQM4933) and the
FEDER‐FSE program.
Capítulo 3
‐ 240 ‐
References
Andreu‐Navarro, A., Fernández‐Romero, J. M. & Gómez‐Hens, A. (2012).
Determination of polyphenolic content in beverages using laccase,
gold nanoparticles and long wavelength fluorimetry. Analytica Chimica
Acta, 713, 1‐6.
Ashrafi, S D., Rezaei, S., Forootanfar, H., Mahvi, A. H. & Faramarzi, M.A.
(2013). The enzymatic decolorization and detoxification of synthetic
dyes by the laccase from a soil‐isolated ascomycete, Paraconiothyrium
variabile. International Biodeterioration and Biodegradation, 85, 173 ‐ 181.
Benzina, O., Daâssi, D., Zouari‐Mechichi, H., Frikha, F., Woodward, S.,
Belbahri, L., Rodríguez‐Couto, S. & Mechichi, T. (2013). Decolorization
and detoxification of two textile industry effluents by the laccase/1‐
hydroxybenzotriazole system. Environmental Science and Pollution
Research, 20, 5177 ‐ 5187.
Campos, A. M., Sotomayor, C. P., Pino, E. & Lissi, E. (2004). A pyranine
based procedure for evaluation of the total antioxidant potential
(TRAP) of polyphenols. A comparison with closely related
methodologies Biological Research, 37, 287 ‐ 292.
Dawidowicz, A. L., Wianowska, D. & Olszowy, M. (2012). On practical
problems in estimation of antioxidant activity of compounds by DPPH
method (Problems in estimation of antioxidant activity). Food
Chemistry, 131, 1037‐1043.
Di Fusco, M., Tortolini, C., Deriu, D. & Mazzei, F. (2010). Laccase‐based
biosensor for the determination of polyphenol index in wine. Talanta,
81, 235 ‐ 240.
Determinación de antioxidantes en alimentos
‐ 241 ‐
Di Majo, D., La Guardia, M., Giammanco, S., La Neve, L. & Giammanco,
M. (2008) The antioxidant capacity of red wine in relationshipwith its
polyphenolic constituents. Food Chemistry, 111, 45 ‐ 49.
Fernández‐Pachón, M. S., Villaño, D., García‐Parrilla, M. C. & Troncoso, A.
M. (2004). Antioxidant activity of wines and relation with their
polyphenolic composition. Analytica Chimica Acta, 513, 113 ‐ 118.
Franquet‐Griell, H., Checa, A., Núñez, O., Saurina, J., Hernández‐Cassou,
S. & Puignou, L. (2012). Determination of polyphenols in spanish
wines by capillary zone electrophoresis. Application to wine
characterization by using chemometrics. Journal of Agricultural and
Food Chemistry, 60, 8340 ‐ 8349.
Gamella, M., Campuzano, S., Reviejo, A. J. & Pingarrón, J. M. (2006).
Electrochemical estimation of the polyphenol index in wines using a
laccase biosensor. Journal of Agricultural and Food Chemistry, 54, 7960 ‐
7967.
Godoy‐Navajas, J., Aguilar‐Caballos, M. P. & Gómez‐Hens, A. (2011).
Long‐wavelength fluorimetric determination of food antioxidant
capacity using nile blue as reagent. Journal of Agricultural and Food
Chemistry, 59, 2235‐2240.
Javadi‐Zarnaghi, F. & Höbartner, C. (2013). Lanthanide cofactors accelerate
DNA‐catalyzed synthesis of branched RNA. Journal of the American
Chemical Society, 135, 12839 ‐ 12848.
Kulys, J. & Bratkovskaya, I. (2007). Antioxidants determination with
laccase. Talanta, 72, 526 – 531.
Capítulo 3
‐ 242 ‐
Li, H. H., Wang, X., Li, Y., Li, P. & Wang, H. (2009). Polyphenolic
compounds and antioxidant properties of selected China wines. Food
Chemistry, 112, 454 ‐ 460.
Long, G. L. & Winefordner, J. D. (1983). Limit of detection. A closer look at
the IUPAC definition. Analytical Chemistry, 55, 712A ‐ 724A.
Lorrain, B., Ky, I., Pechamat, L. & Teissedre, P. L. (2013). Evolution of
analysis of polyphenols from grapes, wines, and extracts. Molecules,
18, 1076 ‐ 1100.
Magalhães, L. M., Segundo, M. A., Reis, S., Lima, J. L. F. C. & Rangel, A. O.
S. S. (2006). Automatic method for the determination of Folin‐
Ciocalteu reducing capacity in food products. Journal of Agricultural
and Food Chemistry, 54, 5241 ‐ 5246.
Medić‐Ŝarić, M., Rastija, V. & Bojić, M. (2011). Recent advances in the
application of high performance liquid chromatography in the
analysis of polyphenols in wine and propolis. Journal of AOAC
International, 94, 32 ‐ 42.
Mondal, S. K., Ghosh, S., Sahu, K., Sen, P. & Bhattacharyya, K. (2007).
Excited state proton transfer from pyranine to acetate in methanol.
Journal of Chemical Sciences, 119, 71 ‐ 76.
Montereali, M.R., Della Seta, L., Vastarella, W. & Pilloton, R. (2010). A
disposable Laccase‐Tyrosinase based biosensor for amperometric
detection of phenolic compounds in wine. Journal of Molecular Catalysis
B: Enzymatic, 64, 189 ‐ 194.
Mukhopadhyay, A., Dasgupta, A. K. & Chakrabarti, K. (2013).
Thermostability, pH stability and dye degrading activity of a bacterial
Determinación de antioxidantes en alimentos
‐ 243 ‐
laccase are enhanced in the presence of Cu2O nanoparticles. Bioresource
Technology, 127, 25 ‐ 36.
Nenadis, N., Lazaridou, O. & Tsimidou, M. Z. (2007). Use of reference
compounds in antioxidant activity assessment. Journal of Agricultural
and Food Chemistry, 55, 5452 ‐ 5460.
Nkhili, E. & Brat, P. (2011). Reexamination of the ORAC assay: effect of
metal ions. Analytical and Bioanalytical Chemistry, 400, 1451 ‐ 1458.
Nugroho Prasetyo, E., Kudanga, T., Steiner, W., Murkovic, M., Nyanhongo,
G. S. & Guebitz, G. M. (2010). Laccase‐generated tetramethoxy
azobismethylene quinone (TMAMQ) as a tool for antioxidant activity
measurement. Food Chemistry, 118, 437 ‐ 444.
Nugroho Prasetyo, E., Kudanga, T., Steiner, W., Murkovic, M., Nyanhongo,
G. S. & Guebitz, G. M. (2009). Antioxidant activity assay based on
laccase‐generated radicals. Analytical and Bioanalytical Chemistry, 393,
679 ‐ 687.
Omata, Y., Saito, Y., Yoshida, Y. & Niki, E. (2008). Simple assessment of
radical scavenging capacity of beverages. Journal of Agricultural and
Food Chemistry, 56, 3386 ‐ 3390.
Organisation Internationale de la Vigne et du Vin (OIV). Maximum
acceptable limits of various substances contained in wine. Compendium
of International Methods of Analysis, OIV‐MA‐C1‐01:R2011.
Pramanik, S., Banerjee, P. & Bhattacharya, S.C. (2007). Interaction of 8‐
hydroxypyrene‐1,3,6‐trisulphonate in alkyltrimethylammonium
bromide (CnTAB) micellar medium. Journal of Photochemistry and
Photobiology A: Chemistry, 187, 384 ‐ 388.
Robinson, J. (Ed.) “Oxford companion to wine” 3rd edition. (2006) 35 – 36.
Capítulo 3
‐ 244 ‐
Sánchez‐Arribas, A., Martínez‐Fernández, M. & Chicharro, M. (2012). The
role of electroanalytical techniques in analysis of polyphenols in wine.
Trends in Analytical Chemistry, 34, 78 ‐ 96.
Sánchez‐Rangel, J. C., Benavides, J., Heredia, J. B., Cisneros‐Zevallos, L. &
Jacobo‐Velázquez, D. A. (2013). The Folin–Ciocalteu assay revisited:
improvement of its specificity for total phenolic content determination.
Analytical Methods, 5, 5990 ‐ 5999.
Sochor, J., Ryvolova, M., Krystofova, O., Salas, P., Hubalek, J., Adam, V.,
Trnkova, L., Havel, L., Beklova, M., Zehnalek, J., Provaznik, I. & Kizek,
R. (2010). Fully automated spectrometric protocols for determination
of antioxidant activity: advantages and disadvantages. Molecules, 15,
8618 ‐ 8640.
Taha, A.A., Shwaish, I.I., Mohamed, A.H., Haider, A. J. & Stamatis, H.
(2013). Production of a laccase from Botrytis cinerea (DSMZ 877) and
application for textile phenolic dye decolorization. Energy Procedia, 36,
862 – 871.
Wang, F., Hu, Y, Guo, C., Huang, W. & Liu, C.Z. (2012). Enhanced phenol
degradation in coking wastewater by immobilized laccase on
magnetic mesoporous silica nanoparticles in a magnetically stabilized
fluidized bed. Bioresource Technology, 110, 120 ‐ 124.
CAPÍTULO 4 CHAPTER 4
Innovacionesenensayosdeafinidadmedianteelusode“upconverting
phosphors”yfenómenosdetransferenciadeenergíaresonante
luminiscente
Innovationsinaffinityassaysbyusingupconvertingphosphorsandluminescenceresonanceenergy
transfer

Upconverting phosphors
‐ 247 ‐
Este capítulo aborda un estudio sistemático del uso de
”upconverting phosphors” (UCPs) en ensayos homogéneos de afinidad con
detección de la luminiscencia basada en transferencia de energía resonante
luminiscente (LRET). Estas investigaciones se realizaron durante la
estancia de tres meses en el Departamento de Biotecnología de la
Universidad de Turku (Finlandia) bajo la supervisión del Prof. Tero
Soukka. Con esta visita se cumple uno de los requisitos para optar a la
Mención de Doctorado Internacional. El estudio realizado ha dado origen a
un artículo científico en vías de redacción:
‐ J. Godoy‐Navajas, T. Riuttamäki, T. Soukka. Evaluation of different
donor‐acceptor pairs for the development of homogeneous
bioaffinity assays using upconversion luminescence resonance
energy transfer.
La transferencia de energía resonante (RET) o transferencia de
energía electrónica (EET) es un proceso que tiene lugar entre dos moléculas
o materiales. Una de estas moléculas actúa como dador, emitiendo energía
a una determinada longitud de onda, mientras que la otra molécula actúa
como aceptor, absorbiendo la energía emitida. Cuando las dos moléculas
son fluorescentes, a este mecanismo se le conoce como transferencia de
energía resonante de fluorescencia (FRET) o de luminiscencia (LRET). No
obstante, la energía no siempre se transmite por fluorescencia y no
necesariamente el aceptor emite fluorescencia ya que pueden utilizarse
también inhibidores de fluorescencia. Para que este proceso tenga lugar se
tiene que cumplir una serie de requisitos: (1) la molécula dadora debe tener
un elevado rendimiento cuántico; (2) debe existir un solapamiento
Capítulo 4
‐ 248 ‐
sustancial entre el espectro de emisión del dador y el espectro de absorción
del aceptor; (3) es necesario un adecuado alineamiento entre los momentos
de transición de la absorción y la emisión; y (4) la distancia que separa al
dador del aceptor debe ser muy corta, normalmente menor de 10 nm [1].
Los UCPs han sido usados para el desarrollo de diferentes ensayos
basados en la tecnología LRET utilizando fluoróforos con una longitud de
onda de absorción similar a la emisión del UCP en cuestión. Por ejemplo,
los UCPs se han usado como dadores, mientras que el fluoróforo Oyster
556 se utilizó como aceptor para el desarrollo de un inmunoensayo
homogéneo para la determinación de estradiol [2]. Utilizando otros tipos
de fluoróforos, como son las ficobiliproteínas (Figura 1), se ha descrito un
ensayo de transferencia de energía con los UCPs como dadores mediante el
sistema de afinidad biotina‐estreptavina [3]. En estos estudios de afinidad,
los UCPs se unen a estreptavidina (SA) para formar un conjugado SA‐UCP
que actúa como dador y un fluoróforo orgánico se enlaza a biotina para
que actúe como aceptor. Cuando el dador y el aceptor interaccionan, se
produce la transferencia de energía, cuya intensidad se utiliza como
parámetro analítico. Esta metodología LRET permite excitar en la zona del
infrarrojo cercano (para los UCPs dopados con Yb(III), la excitación ocurre
a 980 nm). En esta zona del espectro, la probabilidad de interferencias
debidas a la matriz de la muestra es relativamente baja, lo que contribuye a
disminuir las señales de fondo y, por tanto, a mejorar los límites de
detección. La emisión ocurre en la zona del visible, sobre 600 nm, si se
utiliza β‐ficoeritrina como aceptor. Los ensayos de afinidad desarrollados
por el grupo del Prof. Soukka, basados en metodologías LRET, han
implicado el uso de UCPs dopados con Er(III) para formar el dador [2,3]
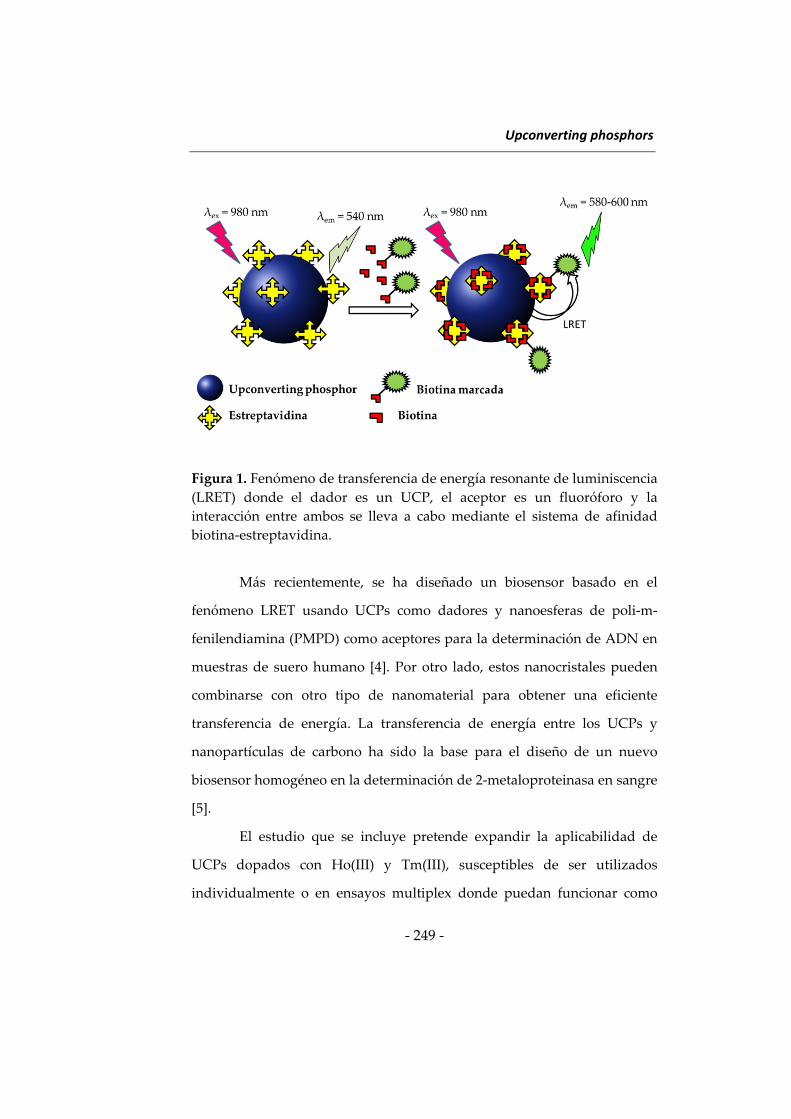
Upconverting phosphors
‐ 249 ‐
Figura 1. Fenómeno de transferencia de energía resonante de luminiscencia
(LRET) donde el dador es un UCP, el aceptor es un fluoróforo y la
interacción entre ambos se lleva a cabo mediante el sistema de afinidad
biotina‐estreptavidina.
Más recientemente, se ha diseñado un biosensor basado en el
fenómeno LRET usando UCPs como dadores y nanoesferas de poli‐m‐
fenilendiamina (PMPD) como aceptores para la determinación de ADN en
muestras de suero humano [4]. Por otro lado, estos nanocristales pueden
combinarse con otro tipo de nanomaterial para obtener una eficiente
transferencia de energía. La transferencia de energía entre los UCPs y
nanopartículas de carbono ha sido la base para el diseño de un nuevo
biosensor homogéneo en la determinación de 2‐metaloproteinasa en sangre
[5].
El estudio que se incluye pretende expandir la aplicabilidad de
UCPs dopados con Ho(III) y Tm(III), susceptibles de ser utilizados
individualmente o en ensayos multiplex donde puedan funcionar como
Capítulo 4
‐ 250 ‐
dadores, además de los convencionalmente utilizados, que son
nanocristales dopados con Er(III). Por otra parte, se han ensayado diversos
fluoróforos orgánicos pertenecientes a los ATTO y los Alexa Fluor, para
investigar su uso como potenciales aceptores.
BIBLIOGRAFÍA
(1) J. Fan, M. Hu, P. Zhan, X. Peng. Energy transfer cassettes based on
organic fluorophores: construction and applications in ratiometric sensing.
Chem. Soc. Reviews (2013) 42, 29 – 43.
(2) K. Kuningas, T. Ukonaho, H. Päkkilä, T. Rantanen, T. Lövgren, T.
Soukka. Upconversion fluorescence resonance energy transfer in a
homogeneous immunoassay for estradiol. Anal. Chem. (2006) 78, 4690 –
4696
(3) K. Kuningas, T. Rantanen, T. Ukonaho, T. Lövgren, T. Soukka.
Homogeneous assay technology based on upconverting phosphors. Anal.
Chem. (2005) 77, 7348 – 7355
(4) Y. Wang, Z. Wu, Z. Liu. Upconversion fluorescence resonance
energy transfer biosensor with aromatic polymer nanospheres as the label‐
free energy acceptor. Anal. Chem. (2013) 85, 258 – 264
(5) Y. Wang, P. Shen, C. Li, Y. Wang, Z. Liu. Upconversion
fluorescence resonance energy transfer based biosensor for ultrasensitive
detection of matrix metalloproteinase‐2 in blood. Anal. Chem. (2012) 84,
1466 – 1473.
Upconverting phosphors
‐ 251 ‐
This chapter tackles a systematic study of the usefulness of
”upconverting phosphors” (UCPs) in homogeneous affinity assays with
detection of luminescence resonance energy transfer (LRET). These
investigations were performed during the three‐month stay at the
Department of Biotechnology of the University of Turku (Finland)
under the supervision of Prof. Tero Soukka. This is one of the requisites
for the International Doctorate Mention. The study performed has
given rise to a scientific article currently in preparation:
‐ J. Godoy‐Navajas, T. Riuttamäki, T. Soukka. Evaluation of
different donor‐acceptor pairs for the development of
homogeneous bioaffinity assays using up‐conversion
luminescence resonance energy transfer.
The resonance energy transfer energy (RET) or electron energy
transfer (EET) is a process that happens between two molecules or
materials. One of these molecules acts as donor, which emits energy at
a specific wavelength, whereas the other molecule acts as acceptor, thus
absorbing the emitted energy. When both molecules are fluorescent,
this phenomenon is known as fluorescence or luminescence resonance
energy transfer (FRET or LRET). However, the energy is not always
transferred as fluorescence and the acceptor does not necessarily emit
fluorescence, since fluorescence quenchers can also be used. Some
requisites need to be met for this process to occur: (1) the donor
molecule should have a high quantum yield; (2) both donor emission
Chapter 4
‐ 252 ‐
and acceptor absorption spectra have to overlap in a high extent; (3) an
adequate alignment of absorption and emission transition moments is
required; and (4) the distance that separates donor from acceptor needs
to be very short, usually lower than 10 nm [1].
The UCPs have been used to develop different assays based on
LRET using fluorophores with an absorption wavelength similar to the
UCP emission wavelength. For instance, the UCPs have been used as
donors, while the Oyster 556 fluorophore was used as acceptor to
develop a homogeneous immunoassay for the determination of
estradiol [2]. Another energy transfer assay has been reported using
other types of fluorophores, such as phycobiliproteins as acceptors
(Figure 1) and UCPs as donors, using the biotin‐streptavidin affinity
system [3]. In these studies, the UCPs bind streptavidin (SA) to give rise
to a SA‐UCP conjugate, which acts as a donor and an organic
fluorophore bound to biotin is the acceptor. When donor and acceptor
interact, the energy transfer process occurs, which intensity is used as
analytical parameter. This LRET methodology allows the excitation in
the near IR region of the spectrum (Yb(III)‐doped UCPs are excited at
980 nm). In this region of the spectrum, the probability of interferences
owing to sample matrix is relatively low, which contributes to decrease
background signals, and hence, to improve detection limits. When β‐
phycoerythrin is used as acceptor, the emission happens in the visible
region, at about 600 nm. The affinity assays based on LRET
methodologies developed by the research team of Prof. Soukka have
involved the use of Er(III)‐doped UCPs to give rise to the donor [2,3]
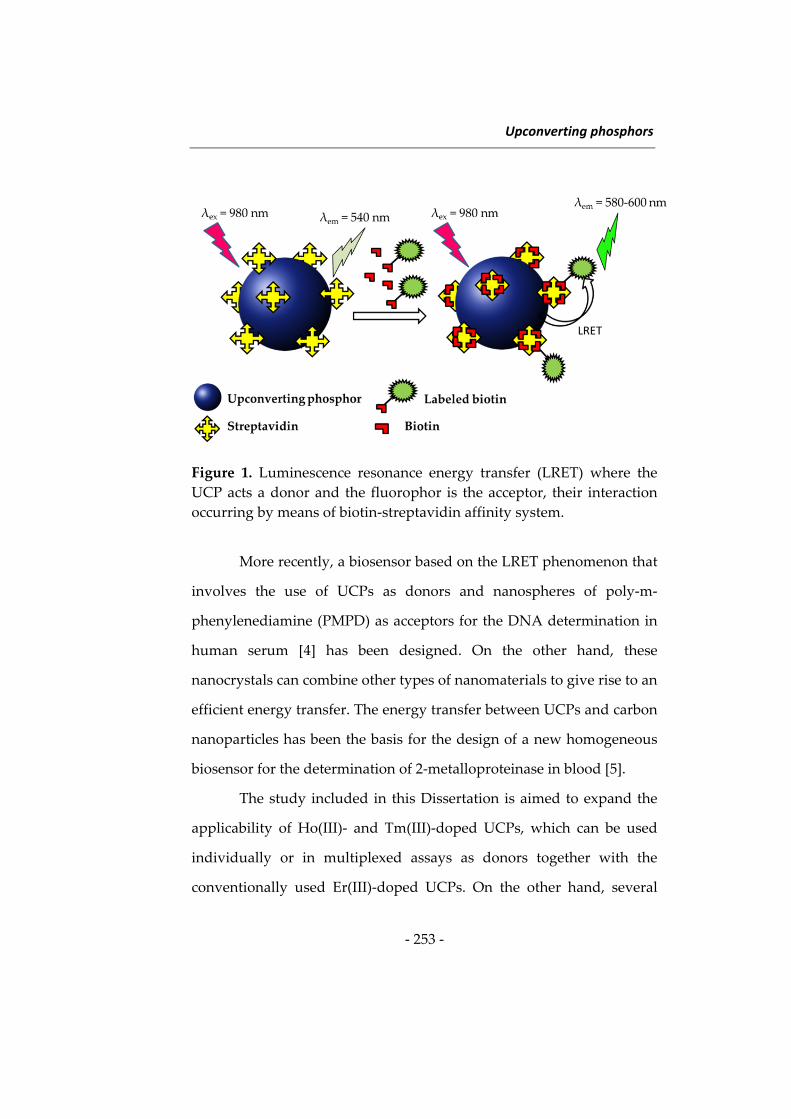
Upconverting phosphors
‐ 253 ‐
Figure 1. Luminescence resonance energy transfer (LRET) where the
UCP acts a donor and the fluorophor is the acceptor, their interaction
occurring by means of biotin‐streptavidin affinity system.
More recently, a biosensor based on the LRET phenomenon that
involves the use of UCPs as donors and nanospheres of poly‐m‐
phenylenediamine (PMPD) as acceptors for the DNA determination in
human serum [4] has been designed. On the other hand, these
nanocrystals can combine other types of nanomaterials to give rise to an
efficient energy transfer. The energy transfer between UCPs and carbon
nanoparticles has been the basis for the design of a new homogeneous
biosensor for the determination of 2‐metalloproteinase in blood [5].
The study included in this Dissertation is aimed to expand the
applicability of Ho(III)‐ and Tm(III)‐doped UCPs, which can be used
individually or in multiplexed assays as donors together with the
conventionally used Er(III)‐doped UCPs. On the other hand, several
Chapter 4
‐ 254 ‐
organic fluorophores belonging to ATTO and Alexa Fluor families have
been assayed in order to investigate their potential use as acceptors.
LITERATURE
(1) J. Fan, M. Hu, P. Zhan, X. Peng. Energy transfer cassettes based
on organic fluorophores: construction and applications in ratiometric
sensing. Chem. Soc. Reviews (2013) 42, 29 – 43.
(2) K. Kuningas, T. Ukonaho, H. Päkkilä, T. Rantanen, T. Lövgren,
T. Soukka. Upconversion fluorescence resonance energy transfer in a
homogeneous immunoassay for estradiol. Anal. Chem. (2006) 78, 4690 –
4696
(3) K. Kuningas, T. Rantanen, T. Ukonaho, T. Lövgren, T. Soukka.
Homogeneous assay technology based on upconverting phosphors.
Anal. Chem. (2005) 77, 7348 – 7355
(4) Y. Wang, Z. Wu, Z. Liu. Upconversion fluorescence resonance
energy transfer biosensor with aromatic polymer nanospheres as the
Label‐free energy acceptor. Anal. Chem. (2013) 85, 258 – 264
(5) Y. Wang, P. Shen, C. Li, Y. Wang, Z. Liu. Upconversion
fluorescence resonance energy transfer based biosensor for
ultrasensitive detection of matrix metalloproteinase‐2 in blood. Anal.
Chem. (2012) 84, 1466 – 1473.
Upconverting phosphors
‐ 255 ‐
Evaluation of different donor‐acceptor pairs for the
development of homogeneous bioaffinity assays using
upconversion luminescence resonance energy transfer
J. Godoy‐Navajasa, T. Riuttamäkib, T. Soukkab
aDepartment of Analytical Chemistry. Research Institute on Fine Chemistry. Campus
Rabanales. Annex to Marie Curie Building. 14071‐Córdoba. Spain bDepartment of Biotechnology. University of Turku. Biocity 6A. 20520‐Turku.
Finland
Abstract
A systematic study on the suitability of different donor‐acceptor
pairs for the development of affinity assays with biotin as model analyte is
reported. Upconversion luminescence resonance energy transfer (LRET) has
been measured for several streptavidin‐coated up‐converting phosphors
(UCPs) (donors) with different biotinylated fluorescent acceptors. The donors
assayed were streptavidin‐coated UCPs of different chemical composition,
such as NaYF4, Yb(III)Er(III); NaYF4, Yb(III)Ho(III) and NaYF4, Yb(III)Tm(III).
Biotinylated derivatives of suitable fluorescent acceptors, namely β‐
phycoerythrin (BPE), R‐phycoerythrin (RPE), Alexa Fluor 488 (AF488), Alexa
Fluor 546 (AF546), Alexa Fluor 680 (AF680) and ATTO 495, were assayed.
The results obtained show that the LRET intensity depends on the
UCP considered. The brightest luminescence was obtained with Er(III)‐doped
UCP, but the sensitivity of the assays, in terms of biotin IC50 values, was not
influenced by UCP composition. The use of Tm(III) provides good opportunity
to develop LRET assays using biotinylated R‐phycoerythrin (bio‐RPE) as the
acceptor. Thus, the present study opens the possible use of UCPs other than
Er(III)‐doped ones to develop sensitive LRET affinity assays.
Keywords: homogeneous affinity assays, upconversion luminescence, resonance
energy transfer assays, nanosphosphors.
Capítulo 4
‐ 256 ‐
Introduction
The analytical applications of anti‐Stokes luminescence have
experienced a huge increase in the last decade, with the advent of
lanthanide upconverting phosphors (UCPs). These phosphors are
composed of inorganic host lattices, where NaYF4 is one of the most
commonly used, although the use of Gd and La lattices has also been
reported [1‐7]. These inorganic matrices are usually doped with the
infrared emitting Yb(III) ion together with other lanthanide ions, such as
Er(III), Ho(III) and Tm(III), among others.
The phenomenon of anti‐Stokes luminescence happens by irradiating
these nanophosphors with a laser source in the infrared region, generally at
980 nm, and measuring thereafter the emission of the other lanthanide ions
in the green to red region of the spectrum. This effect constitutes an
advantage compared to Stokes luminescence since many undesirable
phenomena that usually affect the performance of photoluminescence
emission techniques, such as the autofluorescence coming from sample
matrix when excited at short wavelengths in the UV‐visible region, are
avoided. Sample matrices do not absorb at the long excitation wavelength
used to excite UCPs, so a high spectral selectivity is attained. Another
advantage of using these nanophosphors is the excellent photostability
owing to their inorganic nature and to the low power required for their
excitation, thus being these laser sources much cheaper than the powerful
lasers required for two‐photon excitation. Also, some excellent properties
that are common to conventional Stokes lanthanide sensitized
luminescence, such as narrow emission peaks, long luminescence lifetime
Upconverting phosphors
‐ 257 ‐
and their low toxicity make them especially suitable for bioanalytical and
biomedical applications [2,8]. Some applications describe their use as labels
in heterogeneous assays to determine prostate specific antigen (PSA) [8]
and biotin [9,10]. However, many analytical applications of UCPs have
been focused on the development of luminescence resonance energy
transfer (LRET) assays [11‐14], which have opened new possibilities for
homogeneous binding assays. LRET phenomenon relies on the
nonradiative energy transfer from one fluorescent molecule (donor) to an
acceptor, which is also a fluorophore.
The excellent features of UCPs above mentioned have enabled the
avoidance the influence of background signals from biological samples,
and hence, to obtain relatively low detection limits using homogeneous
assays. The use of UCPs in bioanalysis requires these nanocrystals to be
biocompatible and readily dispersed in water, owing to their hydrophobic
shell, e.g. of oleic acid, after some synthesis procedures [1,2]. Thus, the use
of functionalization procedures is needed, among which ligand exchange
[11‐14] and silanization [1,2] have been used for this purpose. Ligand
exchange procedures are simple to perform but it has been reported that
the ligands attached to the surface can be finally lost. The stability of silica‐
encapsulated UCPs is better, although it has been observed in some cases a
decrease in the luminescence intensity, which has been ascribed to the
remaining free amino groups on the surface and to a subsequent decrease
in the quantum yield [15]. Furthermore, the performance of LRET assays
relies on the use of streptavidin‐coated UCPs donors and biotinylated
acceptors, where similar functionalization procedures to those above
mentioned are needed. However, the comparison of the performance of
Capítulo 4
‐ 258 ‐
LRET assays using different UCP functionalization procedures has not
been performed, although this can be a factor influencing the sensitivity of
the homogeneous assays developed.
The work presented here reports a systematic study of the behaviour
of different UCPs according to the dopant element (Er(III), Ho(III) and
Tm(III)). Er(III)‐doped UCPs have already proven to give rise to very
luminescent donors in LRET assays. However, the use of Ho(III) and
Tm(III) may provide good options for multiplexing or to expand the
application field of UCP technology, since the emission wavelength of
Tm(III) is much shorter than those of Er(III) and Ho(III) phosphors and it is
closer to the maximum excitation wavelength of many organic acceptors.
Bearing this in mind, the performance of several donor‐acceptor pairs has
been evaluated, using streptavidin coated nanophosphors doped with
either Er(III), Ho(III) and Tm(III) as the donors and organic dyes as the
acceptors. Phycobiliprotein dyes have been used as acceptors in some
LRET assays [11,13]. Although these compounds show an intense
fluorescence, they are also relatively expensive, so the potential usefulness
of other fluorophores, such as Alexa Fluor or ATTO dyes has been
checked. Also, the influence of UCP functionalization procedures based on
silylation and on ligand exchange has been studied for Er(III) and Ho(III)‐
doped UCPs. This study was carried out to elucidate which is the most
adequate for the development of homogeneous LRET assays and whether
the treatment depends on the chemical composition of the UCP.
Upconverting phosphors
‐ 259 ‐
2. Experimental procedures
2.1. Reagents
Different infrared to visible nanosized UCPs, which were doped
with Er(III), Ho(III) and Tm(III) and obtained by a re‐precipitation method
[16], were used to perform all the experiments. Fluorescent
phycobiliproteins, such as β‐phycoerythrin and R‐phycoerythrin (BPE)
were purchased from Cyanotech Corp (Kailua‐Kona, HI), supplied in 100
mM sodium phosphate buffer, pH 7.0, containing 60% ammonium
sulphate and 0.02% (w/v) sodium azide, with protein concentration of 10
mg/mL. Alexa Fluor 488, Alexa Fluor 546 and Alexa Fluor 680 succinimidyl
esters were purchased from Molecular Probes Invitrogen Paysley, UK) and
ATTO 495 succinimidyl ester was obtained from Sigma. Streptavidin was
purchased from Spa‐BioSpa (Milan, Italy). Biotinamidohexanoic acid N‐
hydroxysuccinimide ester (bio‐LC‐NHS) was from Pierce (Rockford, IL).
Fluorescent protein (bio‐BPE) was biotinylated with a 25‐fold molar excess
of NHS‐LC‐biotin according to a previously described procedure [11]. A
freshly prepared solution of NHS‐LC‐biotin in dimethylformamide was
added into protein solution containing 8.5 mg/mL phycobiliproteins in 50
mM carbonate buffer, pH 9.3. The reaction mixture, with a total volume of
500 μL and containing about 2% (v/v) DMF, was incubated in rotation at 17
rpm (Rotamix RK, Heto‐Holten A/S, Allerod, Denmark) protected from
light for 3 h at room temperature. Finally, it was purified using NAP‐5 and
NAP‐10 columns (Amersham Biosciences, Uppsala, Sweden). Polyacrylic
acid ammonium salt, Additol XW330 (MW 30000 – 50000) (Surface
Capítulo 4
‐ 260 ‐
Specialities) was used to prepare 5% Additol solutions in doubly de‐
ionized water to coat UCPs.
Cyclohexane, n‐hexanol, N‐(3‐trimethoxysilyl)propyl)ethylene
diamine (TMED, 97% purity) and 3‐(trihydroxysilyl)propyl
methylphosphonate (THPMP, purity 42%) (Sigma Aldrich), Triton X‐100
and tetraethyl orthosilicate (TEOS, 98% purity) (Acros Organics), were
used for the silylation of UCPs. Ammonium hydroxide, acetone and
absolute ethanol were used to purify the conjugated UCPs. Glutaric
anhydride (95% purity, Sigma‐Aldrich) and dry pyridine were used to
change amino‐ groups of silica‐UCPs into carboxyl‐ groups. N‐(3‐
dimethylamino)propyl)‐N’‐ethylcarbodiimide hydrochloride (EDAC) and
N‐hydroxysulfosuccinimide sodium salt (sulfo‐NHS) (Fluka) and a buffer
solution of morpholino ethanesulfonic acid (MES) (20 mM, pH 6.1) were
used for conjugation reactions by using carbodiimide mediated synthesis.
Streptavidin‐coated normal‐capacity microtitration wells, assay buffer (50
mM Tris‐HCl, pH 7.8, containing 9 g/L NaCl, 0.5 g/L NaN3, 5 g/L BSA, 0.1
g/L bovine ϒ‐globulin and 20 μM DTPA), and wash solution (5 mM Tris‐
HCl, pH 7.8, containing 9 g/L NaCl, 0.05 g/L Tween 20, and 1 g/L Germal
II) were obtained from Innotrac Diagnostics Oy (Turku). Delfia
enhancement solution (DES) and enhancer solution (DE) were purchased
from PerkinElmer Life and Analytical Sciences (Wallac Oy, Turku).
2.2. Instrumentation
A Plate Chameleon (Hidex Oy, Turku) equipped with a 200 mW
infrared laser module (Roithner Lasertechnik) and RG‐850 nm long‐pass
excitation filter (Andover Corp., Salem, NH) was used. The
Upconverting phosphors
‐ 261 ‐
photomultiplier tube in the plate fluorometer was replaced with
Hamamatsu R4632 (Hamamatsu Photonics K.K.). Emission light coming
from donor and acceptor at their corresponding wavelengths was collected
for 2000 ms under continuous laser excitation at 980 nm. Anti‐Stokes
photoluminescence emission from Ho(III) and Er(III) doped UCPs was
measured at 550 nm employing a band‐pass emission filter of 535/50 nm
(center wavelength 535 nm, half‐width 50 nm; peak transmittance ≥ 60%;
Bk Interferezoptik Electronik, Nabburg, Germany), combined with an
absorptive neutral density filter (optical density 2.0; i.e. average
transmittance 1%; Thorlabs, Newton, NJ). The LRET sensitized emission
was measured at 600 nm for 1000 ms, by using a band‐pass emission filter
of 600/40 nm (peak transmittance ≥ 80%; Chroma Technology Corp.). For
Tm(III)‐doped UCPs, LRET was measured using a emission filter of 555/20
nm.
2.3. Measurement of NaYF4:Yb(III), Er(III)‐, Ho(III)‐, and Tm(III) luminescence
intensity
An amount of UCP (ca. 1 mg) is placed in an Eppendorf tube and a
volume of 0.75% acetic acid is added to reach a UCP concentration of 6
mg/mL. The tube is sonicated for 20 cycles, then, doubly‐deionized water is
added to dilute the dispersion up to 2 mg/mL and the tube is placed in a
thermal block at 77 °C at the maximum power for 1 h and it is vortexed
once during incubation. After this, it is incubated for 30 minutes under
continuous rotation at room temperature and sonicated again. A volume of
this dispersion was diluted 10 times with the measurement buffer and 150
μL were dispensed in triplicate onto Maxisorp microplates and the
Capítulo 4
‐ 262 ‐
luminescence was measured using Chameleon 5 instrument fitted with the
appropriate filters for each UCP composition.
2.4. Measurement of UCP concentration
The preparation of UCP standards and UCP samples was done by
diluting the phosphor in the measurement buffer and by sonicating them
for 1 min. Then, a duplicate analysis was done in duplicate by adding 150
μL to each well. The measurements were obtained for 2 s by using a 550
nm for Er(III) and Ho(III) doped UCPs and 470 nm for Tm(III)‐doped
UCPs.
2.5. UCP suspension and pre‐precipitation
The dispersion of the synthesized nanophosphors is made more
reproducible in size by a suspension and pre‐precipitation method to get a
more colloidal form of these UCPs and to remove the largest aggregates in
order to discard them prior to the functionalization step. The suspension
was performed by weighing 15 mg of UCP in an Eppendorf tube and 930
μL of 50% diethyleneglycol in doubly de‐ionized water were added. The
suspension was vortexed and sonicated using 20 + 20 cycles with 100%
amplitude. The bath was left in swirl for 3 min and the dispersion was
vortexed again and sonicated with 20 + 20 cycles. The Eppendorf tube was
incubated again in rotation at 60 °C for 1 h and then, sonicated in swirl
until the UCP was totally dispersed, and incubated for 1 h at room
temperature. The mixture was vortexed and sonicated for 20 + 20 cycles
again and incubated on rotation overnight.
Upconverting phosphors
‐ 263 ‐
The pre‐precipitation process was done just before coating and the
UCP suspension was let to stand for 30 min and 870 μL of the suspension
was taken from the top and transferred to another tube and the rest of the
dispersion, which contained large particles, was discarded.
2.6. Functionalization of the surface with carboxylic acid groups
‐ Coating with poly(acrylic acid): An amount of pre‐precipitated
UCPs (5 mg, 390 μL), was taken and mixed with Additol 0.1% and the
reaction mixture was left to react overnight at 35 °C in rotation.
Afterwards, the Additol excess was removed by centrifugating first for 7
min at 8000 rpm, then, the supernatant was replaced with Milli‐Q water
and the dispersion vortexed and sonicated for 1 min and subjected to
centrifugation again. This process was repeated four times, leaving the
third wash aliquot for 45 min at room temperature and rotation. The wash
process was ended by suspending UCPs in Milli‐Q water, until a final
volume of 300 μL.
‐ Coating with glutaric anhydride after UCP silylation: An amount of
pre‐precipitated UCPs (6 mg, 470 μL) was taken for silylation. The process
was done by using a reverse micelle microemulsion method, which was
performed first by mixing 11.25 mL of cyclohexane, 2.66 mL of Triton X‐
100 and 2.7 mL of n‐hexanol. The mixture was divided in two different
microemulsion fractions A (7.5 mL) and B (the rest of the microemulsion).
The tube with microemulsion A was mixed with 435 μL UCP suspension
and 90 μL of ammonium hydroxide were added and the tube was
sonicated in a bath for 10 min. To the tube with microemulsion B, 350 μL of
water were added to give rise to a water‐in‐oil microemulsion, 9.4 μL of
Capítulo 4
‐ 264 ‐
TEOS, 37.5 μL of TMED and 37.5 μL of THPMP were subsequently added
and the mixture vortexed after each addition. Both tubes A and B were
combined, vortexed and incubated for 2 h at room temperature with
sonication in the first 10 min and the rest of the time with continuous
vortexing. Afterwards, a volume (2.25 mL) of acetone was added to break
the microemulsion and precipitate the UCPs, which were collected after
centrifugation at 2860 rpm for 1 min. The supernatant was transferred to
another tube and acetone was added to reach a total volume of 20 mL and
centrifuged again (2860 rpm, 3 min), the supernatant was discarded and
the UCP‐pellet was suspended in a small volume (400 μL) of doubly‐
deionized water. The UCP particles obtained after the two precipitation
processes were combined in a single 2‐mL Eppendorf tube. The precipitate
was washed twice with ethanol and twice with doubly‐deionized water, by
sonicating each washing for 1 min and centrifugating at 8000 rpm for 7
min. The pellet was finally suspended in doubly‐deionized water to obtain
a final volume of 500 μL. These functionalized UCPs were stored at room
temperature in rotation and the concentration of the silica‐functionalized
NPs was measured following the procedure described in section 2.4. The
next step was to change the amino‐functionalized UCPs into carboxylic‐
functionalized UCPs.
The introduction of carboxylate groups was done by reacting the
silylated amino UCPs with glutaric anhydride. The UCPs obtained in the
above mentioned procedure were centrifuged (12000 rpm, 7 min), the
supernatant liquid was discarded and 150 μL of dry pyridine was added.
Then, glutaric anhydride was added in a 10‐fold mass ratio compared to
UCP mass, after being dissolved in 120 μL of pyridine. The mixture was
Upconverting phosphors
‐ 265 ‐
vortexed and sonicated for 5 min and later transferred to a bath for 2.5 h at
50 °C. Afterwards, another batch of glutaric anhydride was diluted and
added and the process was repeated as for the first batch. At the end, a
volume (400 μL) of ethanol was added and centrifuged at 12000 rpm for 7
min. Finally, the pellet was washed twice with doubly‐deionized water,
suspended in 450 μL of doubly‐deionized water and stored at room
temperature in slow rotation.
2.7. Conjugation of –COOH functionalized UCPs with streptavidin
The conjugate of streptavidin (SA) with the functionalized UCPs
was synthesized by using a carbodiimide reaction in the presence of sulfo‐
NHS and EDC. To start the process, functionalized UCPs were washed
with 1 mL of MES buffer (pH 6.1, 20 mM) and then, they were re‐
suspended in 500 μL. On the other hand, 20 mM EDC and 30 mM sulfo‐
NHS were dissolved by weighing the appropriate amount brought to room
temperature. Afterwards, a volume (10 μL) of sulfo‐NHS and a volume (10
μL) of EDC were added to the UCP dispersion and the resulting mixture
was incubated for 45 min at room temperature in rotation. After this time,
the dispersion was washed with MES buffer, centrifuged at 12000 rpm for 7
min and the dispersion was reconstituted with MES buffer. To the
synthesized sulfo‐succinimidyl ester, 33 μL of streptavidin (30 mg/mL)
were added to the mixture and incubated for 2.5 h at room temperature
and in rotation. The reaction was stopped by adding 12.8 mL of 2 M
glycine, pH 11, and the mixture was allowed to react for 30 min with
rotation. The conjugate obtained was purified by washing twice with
borate buffer (10 mM, pH 8.5) containing 0.1% Tween 20 and one with
Capítulo 4
‐ 266 ‐
storage buffer, which consisted of borate buffer (5 mM, pH 8.5), 0.2%
Tween 85, 0.5% BSA and 0.05%NaN3. The conjugate was stored at room
temperature in an Eppendorf tube in rotation and its concentration was
determined as described in the procedure for the measurement of UCP
concentration.
The amount of total SA and free SA was calculated by using a
heterogeneous competitive binding for streptavidin using a biotin‐Tb‐
chelate conjugate [11]. Unconjugated SA was separated from UCP
suspension by centrifugation and collection of the supernatant. In the
assay, 0‐50 ng of streptavidin in 75 μL of assay buffer, or appropriate
dilutions of phosphor suspension and supernatant, were mixed with 75 μL
of 4 nM biotin conjugate of Tb‐chelate and the reactions were incubated for
30 min at room temperature with slow shaking to capture all unbound
biotin conjugates of Tb‐chelate. Finally, the wells were washed twice and
the signal was developed and measured similarly to the heterogeneous
biotin‐binding assay.
2.8. Homogeneous acceptor titration
The amount of biotin‐acceptor concentration necessary to saturate
SA‐UCP binding sites was found using a homogeneous acceptor titration,
which involves the use of biotin as the analyte, a donor (a SA‐conjugate)
and an acceptor (biotinylated fluorophores). The microtiter plates used
were black half area 96‐well plates.
The assay was performed as follows: a volume (32 μL) of biotin
12.5 μM or same volume of reaction buffer was added to 24 μL of a SA‐
UCP (0.05 mg/mL, 0.015mg/ml in the final reaction mixture). The mixture
Upconverting phosphors
‐ 267 ‐
was incubated for 15 min at 23 °C and at 900 rpm using a plate tape to
protect the plate from light and the luminescence was measured with the
Chameleon 5 instrument, using an emission filter of 550 nm, for 2000 ms.
Afterwards, biotinylated‐acceptor at different concentrations (0.25, 0.74,
2.2, 7, 20 nM in the final reaction mixture) was added and the incubation
was performed at 23 °C at 900 rpm. Luminescence measurements were
taken at 45 min using 600 and 550 nm as emission filters for 2000 ms in the
case of Er(III) and Ho(III)‐doped UCPs, and of 555 and 470 nm for Tm(III)‐
doped UCPs. Signals were treated as described previously elsewhere [11].
2.9 Homogeneous LRET affinity assay for D‐biotin
The homogeneous competitive format for biotin determination was
also assayed using D‐biotin concentrations in the range of 0 – 12.5 μM in
the assay tube. The concentration of SA‐UCP was 0.015 mg/mL for Er(III)
and Ho(III) donors and 0.03 mg/mL for Tm(III) donor. The acceptor
concentrations used were 0.2 and 0.4 nM, for bio‐BPE, 1.33 nM for bio‐RPE
and 4 nM for AF680. A 12.5 μM biotin concentration was used to verify the
background level.
3. Results and Discussion
3.1. Luminescent features of donor‐acceptor pairs
The LRET study presented has been carried out using the
streptavidin‐biotin affinity system, as model assay. Streptavidin was
coated to UCP donors, whereas biotin was coupled to fluorescent
acceptors. Figure 1 shows a typical scheme for this system, in which can be
seen that after UCP excitation, there is an energy transfer process from the
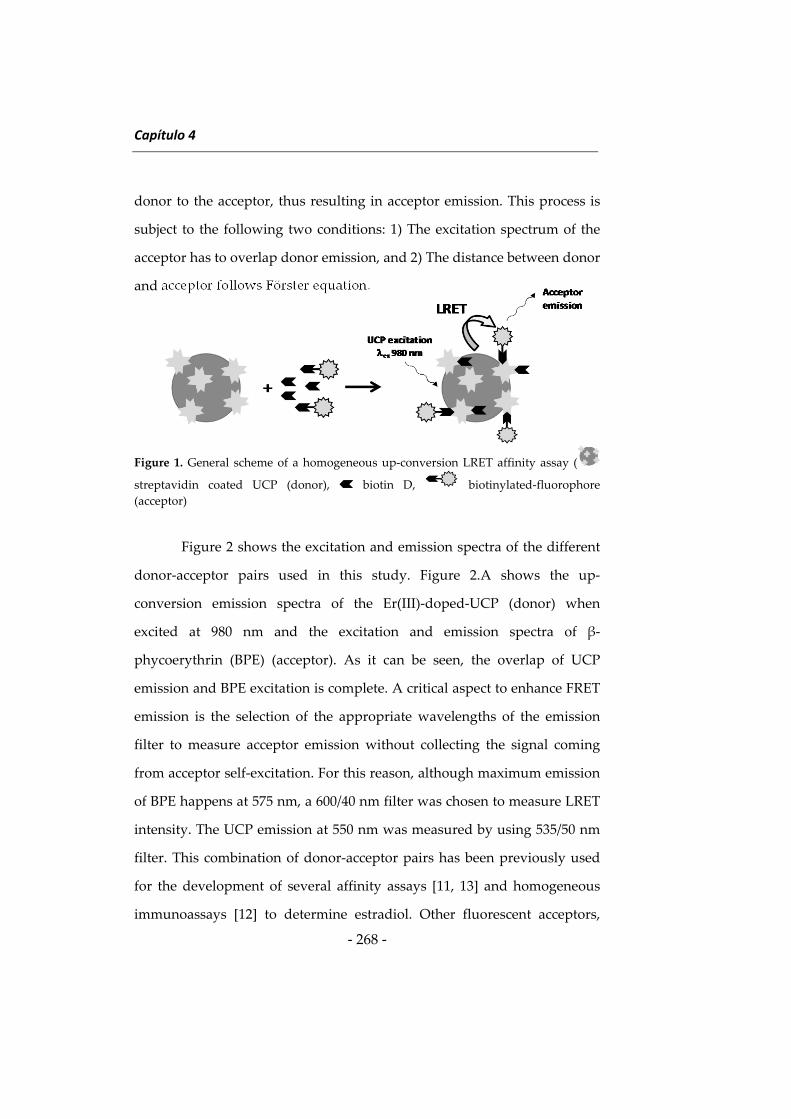
Capítulo 4
‐ 268 ‐
donor to the acceptor, thus resulting in acceptor emission. This process is
subject to the following two conditions: 1) The excitation spectrum of the
acceptor has to overlap donor emission, and 2) The distance between donor
and acceptor follows Förster equation.
Figure 1. General scheme of a homogeneous up‐conversion LRET affinity assay (
streptavidin coated UCP (donor), biotin D, biotinylated‐fluorophore
(acceptor)
Figure 2 shows the excitation and emission spectra of the different
donor‐acceptor pairs used in this study. Figure 2.A shows the up‐
conversion emission spectra of the Er(III)‐doped‐UCP (donor) when
excited at 980 nm and the excitation and emission spectra of β‐
phycoerythrin (BPE) (acceptor). As it can be seen, the overlap of UCP
emission and BPE excitation is complete. A critical aspect to enhance FRET
emission is the selection of the appropriate wavelengths of the emission
filter to measure acceptor emission without collecting the signal coming
from acceptor self‐excitation. For this reason, although maximum emission
of BPE happens at 575 nm, a 600/40 nm filter was chosen to measure LRET
intensity. The UCP emission at 550 nm was measured by using 535/50 nm
filter. This combination of donor‐acceptor pairs has been previously used
for the development of several affinity assays [11, 13] and homogeneous
immunoassays [12] to determine estradiol. Other fluorescent acceptors,
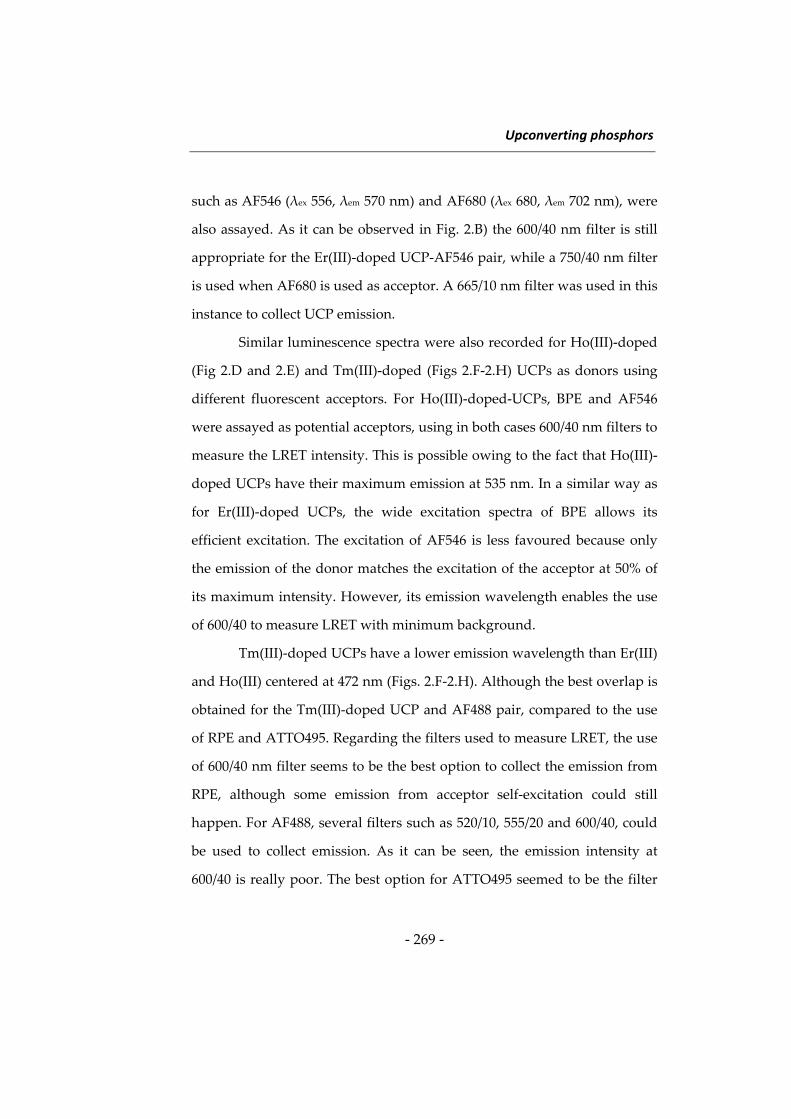
Upconverting phosphors
‐ 269 ‐
such as AF546 (λex 556, λem 570 nm) and AF680 (λex 680, λem 702 nm), were
also assayed. As it can be observed in Fig. 2.B) the 600/40 nm filter is still
appropriate for the Er(III)‐doped UCP‐AF546 pair, while a 750/40 nm filter
is used when AF680 is used as acceptor. A 665/10 nm filter was used in this
instance to collect UCP emission.
Similar luminescence spectra were also recorded for Ho(III)‐doped
(Fig 2.D and 2.E) and Tm(III)‐doped (Figs 2.F‐2.H) UCPs as donors using
different fluorescent acceptors. For Ho(III)‐doped‐UCPs, BPE and AF546
were assayed as potential acceptors, using in both cases 600/40 nm filters to
measure the LRET intensity. This is possible owing to the fact that Ho(III)‐
doped UCPs have their maximum emission at 535 nm. In a similar way as
for Er(III)‐doped UCPs, the wide excitation spectra of BPE allows its
efficient excitation. The excitation of AF546 is less favoured because only
the emission of the donor matches the excitation of the acceptor at 50% of
its maximum intensity. However, its emission wavelength enables the use
of 600/40 to measure LRET with minimum background.
Tm(III)‐doped UCPs have a lower emission wavelength than Er(III)
and Ho(III) centered at 472 nm (Figs. 2.F‐2.H). Although the best overlap is
obtained for the Tm(III)‐doped UCP and AF488 pair, compared to the use
of RPE and ATTO495. Regarding the filters used to measure LRET, the use
of 600/40 nm filter seems to be the best option to collect the emission from
RPE, although some emission from acceptor self‐excitation could still
happen. For AF488, several filters such as 520/10, 555/20 and 600/40, could
be used to collect emission. As it can be seen, the emission intensity at
600/40 is really poor. The best option for ATTO495 seemed to be the filter
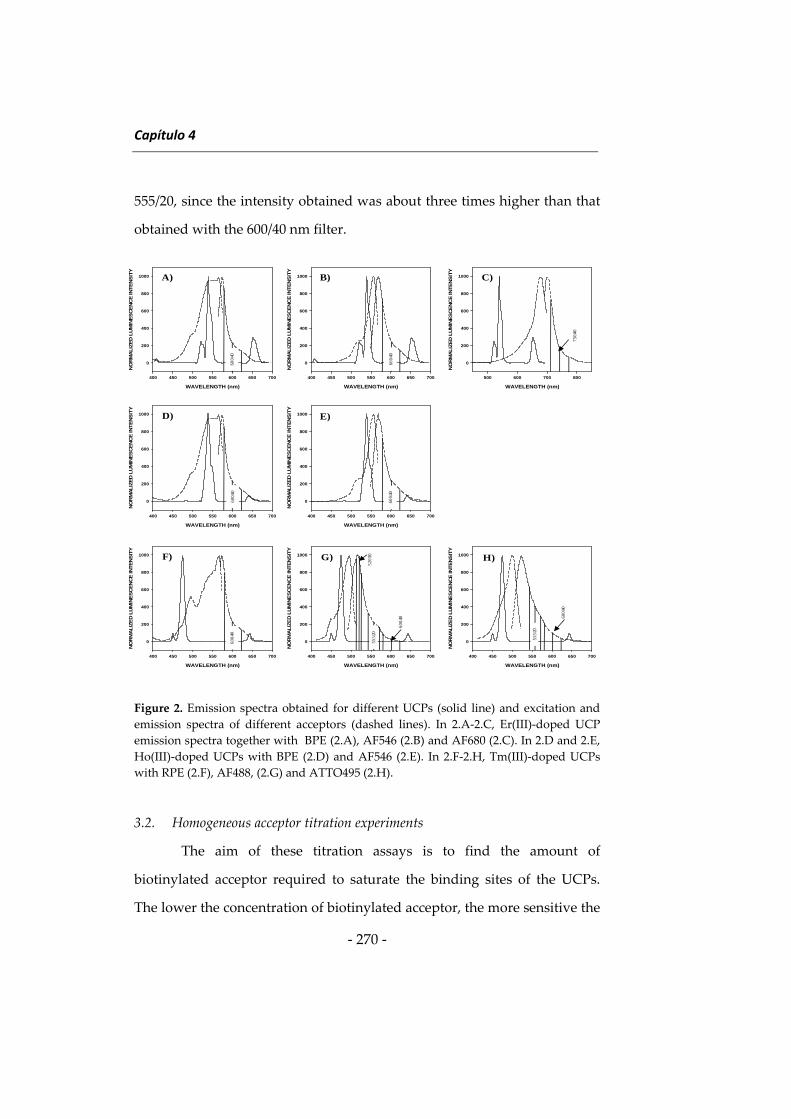
Capítulo 4
‐ 270 ‐
555/20, since the intensity obtained was about three times higher than that
obtained with the 600/40 nm filter.
Figure 2. Emission spectra obtained for different UCPs (solid line) and excitation and
emission spectra of different acceptors (dashed lines). In 2.A‐2.C, Er(III)‐doped UCP
emission spectra together with BPE (2.A), AF546 (2.B) and AF680 (2.C). In 2.D and 2.E,
Ho(III)‐doped UCPs with BPE (2.D) and AF546 (2.E). In 2.F‐2.H, Tm(III)‐doped UCPs
with RPE (2.F), AF488, (2.G) and ATTO495 (2.H).
3.2. Homogeneous acceptor titration experiments
The aim of these titration assays is to find the amount of
biotinylated acceptor required to saturate the binding sites of the UCPs.
The lower the concentration of biotinylated acceptor, the more sensitive the
WAVELENGTH (nm)
400 450 500 550 600 650 700
NO
RM
ALIZ
ED
LU
MIN
ES
CE
NC
E IN
TE
NS
ITY
0
200
400
600
800
1000
WAVELENGTH (nm)
400 450 500 550 600 650 700
NO
RM
ALIZ
ED
LU
MIN
ES
CE
NC
E IN
TE
NS
ITY
0
200
400
600
800
1000
WAVELENGTH (nm)
400 450 500 550 600 650 700
NO
RM
ALIZ
ED
LU
MIN
ES
CE
NC
E IN
TE
NS
ITY
0
200
400
600
800
1000F) G) H)
555/
20
555/
20
600/
40
520/
10
600/
40
600/
40
WAVELENGTH (nm)
400 450 500 550 600 650 700
NO
RM
ALIZ
ED
LU
MIN
ES
CE
NC
E IN
TE
NS
ITY
0
200
400
600
800
1000
WAVELENGTH (nm)
400 450 500 550 600 650 700
NO
RM
ALIZ
ED
LU
MIN
ES
CE
NC
E IN
TE
NS
ITY
0
200
400
600
800
1000D) E)
600/
40
600/
40
WAVELENGTH (nm)
400 450 500 550 600 650 700
NO
RM
ALIZ
ED
LU
MIN
ES
CE
NC
E IN
TE
NS
ITY
0
200
400
600
800
1000
WAVELENGTH (nm)
400 450 500 550 600 650 700
NO
RM
ALIZ
ED
LU
MIN
ES
CE
NC
E IN
TE
NS
ITY
0
200
400
600
800
1000
WAVELENGTH (nm)
500 600 700 800
NO
RM
ALIZ
ED
LU
MIN
ES
CE
NC
E IN
TE
NS
ITY
0
200
400
600
800
1000A) B) C)
600/
40
600/
40
750/
40
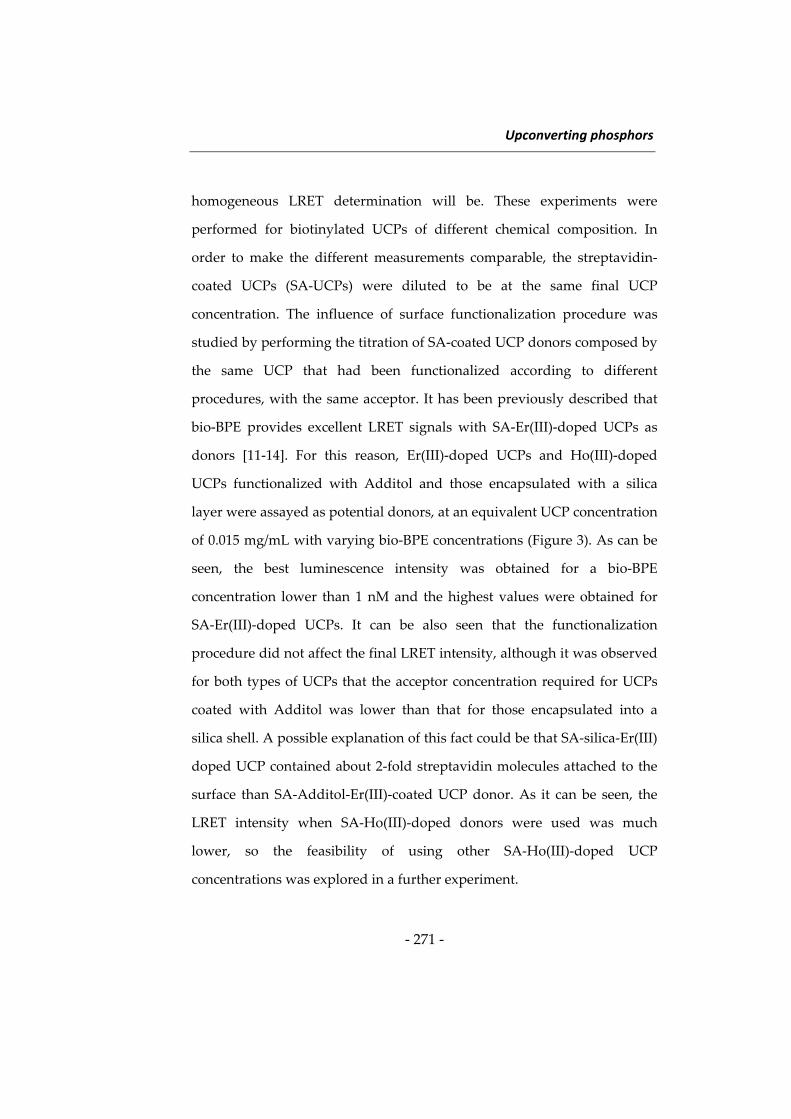
Upconverting phosphors
‐ 271 ‐
homogeneous LRET determination will be. These experiments were
performed for biotinylated UCPs of different chemical composition. In
order to make the different measurements comparable, the streptavidin‐
coated UCPs (SA‐UCPs) were diluted to be at the same final UCP
concentration. The influence of surface functionalization procedure was
studied by performing the titration of SA‐coated UCP donors composed by
the same UCP that had been functionalized according to different
procedures, with the same acceptor. It has been previously described that
bio‐BPE provides excellent LRET signals with SA‐Er(III)‐doped UCPs as
donors [11‐14]. For this reason, Er(III)‐doped UCPs and Ho(III)‐doped
UCPs functionalized with Additol and those encapsulated with a silica
layer were assayed as potential donors, at an equivalent UCP concentration
of 0.015 mg/mL with varying bio‐BPE concentrations (Figure 3). As can be
seen, the best luminescence intensity was obtained for a bio‐BPE
concentration lower than 1 nM and the highest values were obtained for
SA‐Er(III)‐doped UCPs. It can be also seen that the functionalization
procedure did not affect the final LRET intensity, although it was observed
for both types of UCPs that the acceptor concentration required for UCPs
coated with Additol was lower than that for those encapsulated into a
silica shell. A possible explanation of this fact could be that SA‐silica‐Er(III)
doped UCP contained about 2‐fold streptavidin molecules attached to the
surface than SA‐Additol‐Er(III)‐coated UCP donor. As it can be seen, the
LRET intensity when SA‐Ho(III)‐doped donors were used was much
lower, so the feasibility of using other SA‐Ho(III)‐doped UCP
concentrations was explored in a further experiment.
Capítulo 4
‐ 272 ‐
Figure 3. Homogeneous acceptor titrations for streptavidin‐Er(III) and streptavidin‐
Ho(III) doped UCP donors obtained by ligand exchange with Additol (2,4) and by
silylation (1,3). In 1,2 [Ho(III)‐doped UCP] = 0.015 mg/mL. In (3,4) [Er(III)‐doped UCP] =
0.015 mg/mL. LRET signals were calculated by subtracting the background signal of the
assay (excess of D‐biotin) from the maximum signal (absence of D‐biotin), cts: counts.
In an attempt to increase the signal exhibited by SA‐Ho(III)‐doped‐
UCPs, higher equivalent UCP concentrations (0.03 and 0.045 mg/mL) were
assayed, using bio‐BPE as acceptor (Figure 4). However, the LRET signals
obtained were 5‐times lower than those obtained for SA‐Er(III)‐doped UCP
donors. A 0.4 nM bio‐BPE and 0.03 mg/mL SA‐Er(III)‐UCP were chosen to
perform homogeneous assays for biotin determination, since they provide
an adequate LRET signal with a bio‐BPE concentration relatively low,
reaching an adequate sensitivity.
[Bio-BPE] (nM)
0 1 2 3 4 5 6 7
up
co
nve
rsio
n L
RE
T (
cts)
0
200000
400000
600000
800000
1,2 3
4
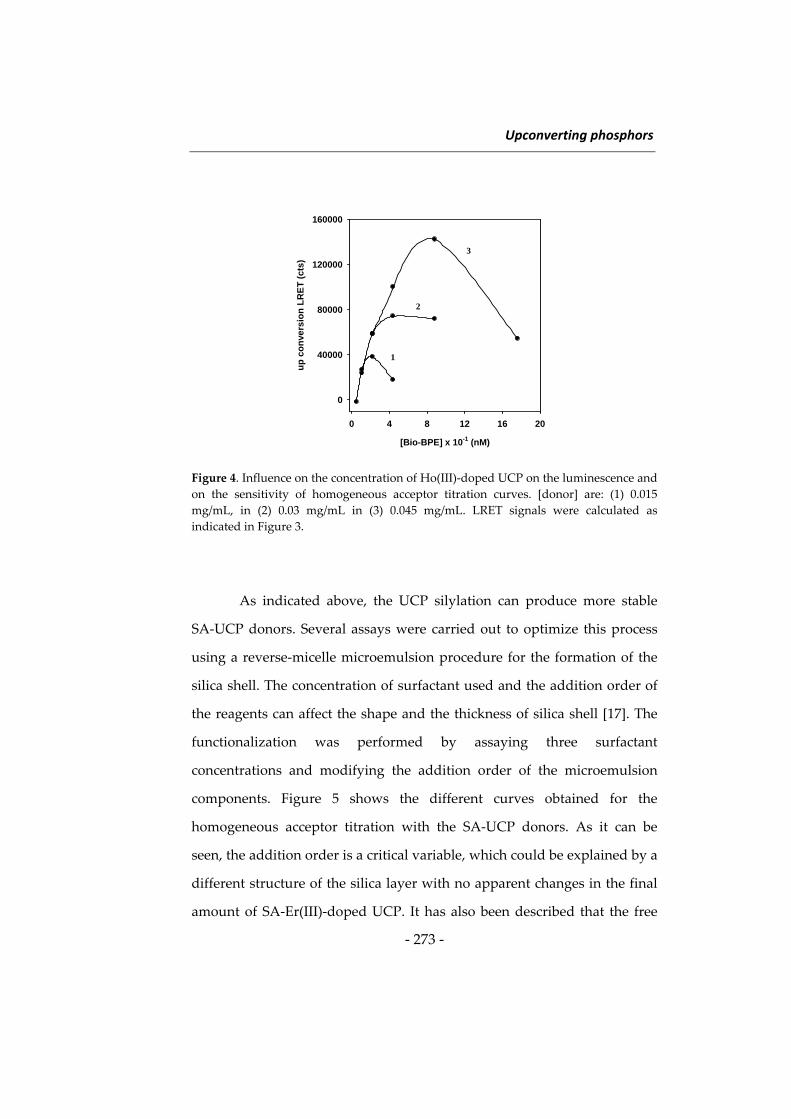
Upconverting phosphors
‐ 273 ‐
Figure 4. Influence on the concentration of Ho(III)‐doped UCP on the luminescence and
on the sensitivity of homogeneous acceptor titration curves. [donor] are: (1) 0.015
mg/mL, in (2) 0.03 mg/mL in (3) 0.045 mg/mL. LRET signals were calculated as
indicated in Figure 3.
As indicated above, the UCP silylation can produce more stable
SA‐UCP donors. Several assays were carried out to optimize this process
using a reverse‐micelle microemulsion procedure for the formation of the
silica shell. The concentration of surfactant used and the addition order of
the reagents can affect the shape and the thickness of silica shell [17]. The
functionalization was performed by assaying three surfactant
concentrations and modifying the addition order of the microemulsion
components. Figure 5 shows the different curves obtained for the
homogeneous acceptor titration with the SA‐UCP donors. As it can be
seen, the addition order is a critical variable, which could be explained by a
different structure of the silica layer with no apparent changes in the final
amount of SA‐Er(III)‐doped UCP. It has also been described that the free
[Bio-BPE] x 10-1 (nM)
0 4 8 12 16 20
up
co
nve
rsio
n L
RE
T (
cts
)
0
40000
80000
120000
160000
1
2
3
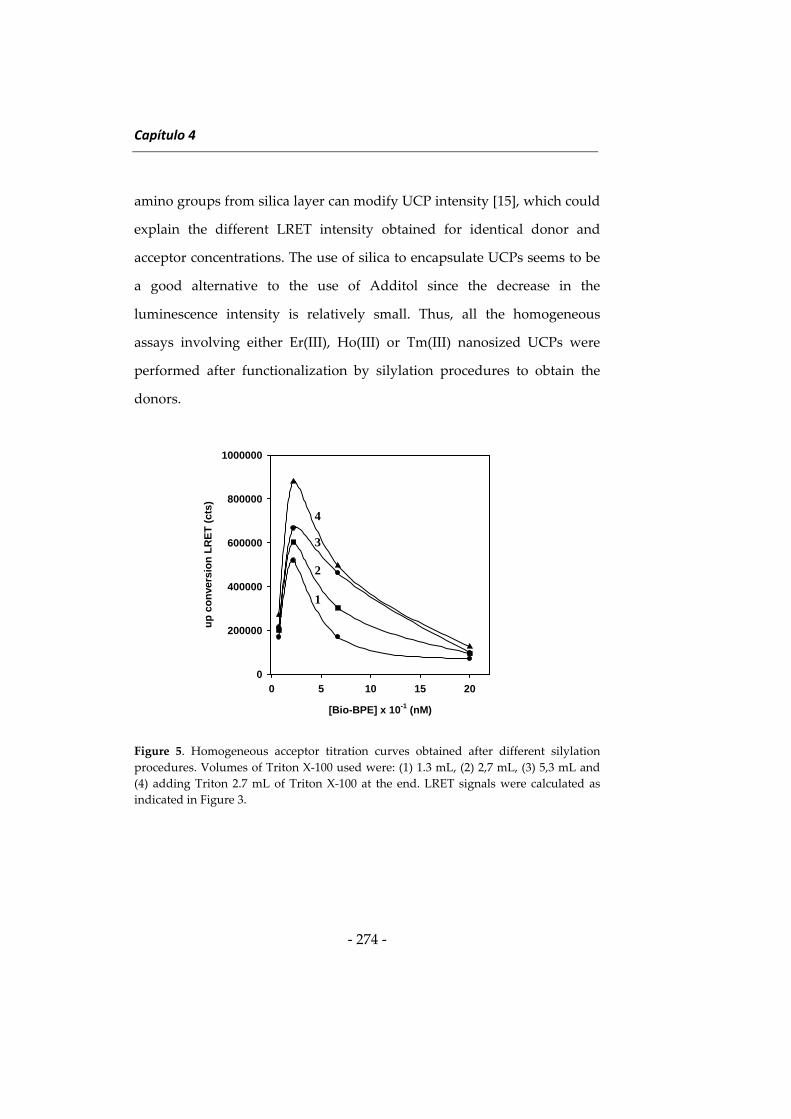
Capítulo 4
‐ 274 ‐
amino groups from silica layer can modify UCP intensity [15], which could
explain the different LRET intensity obtained for identical donor and
acceptor concentrations. The use of silica to encapsulate UCPs seems to be
a good alternative to the use of Additol since the decrease in the
luminescence intensity is relatively small. Thus, all the homogeneous
assays involving either Er(III), Ho(III) or Tm(III) nanosized UCPs were
performed after functionalization by silylation procedures to obtain the
donors.
Figure 5. Homogeneous acceptor titration curves obtained after different silylation
procedures. Volumes of Triton X‐100 used were: (1) 1.3 mL, (2) 2,7 mL, (3) 5,3 mL and
(4) adding Triton 2.7 mL of Triton X‐100 at the end. LRET signals were calculated as
indicated in Figure 3.
[Bio-BPE] x 10-1 (nM)
0 5 10 15 20
up
co
nve
rsio
n L
RE
T (
cts)
0
200000
400000
600000
800000
1000000
1
2
3
4
Upconverting phosphors
‐ 275 ‐
BPE and RPE are very fluorescent proteins commercially available,
but they are relatively expensive. Thus, the feasibility of other alternative
fluorophores, with suitable wavelengths to produce LRET was checked.
Figure 6 shows the titration curves obtained for SA‐Er(III)‐doped (6.A) and
SA‐Ho(III)‐doped (6.B) UCP donors with bio‐BPE and bio‐AF546 as
acceptors. The LRET intensity was much lower for bio‐AF546 and the
increase of SA‐Ho(III)‐doped UCP concentration did not improve the LRET
signal unlike it happened for the pairs with SA‐Er(III)‐doped UCPs and
bio‐BPE as donor and acceptor, respectively. The same behaviour was
observed for SA‐Tm(III) donors, in which the acceptors used were bio‐RPE,
bio‐AF488 and bio‐ATTO 495 (Fig. 6.C). All of them provided LRET signal,
but the highest intensity was obtained using bio‐RPE, so this pair was
chosen to develop further homogeneous affinity assays for biotin with
Tm(III)‐doped UCPs as donors.
3.3 Determination of biotin using homogeneous LRET assays
Several donor‐acceptor pairs were used to perform homogeneous
LRET assays for biotin. Figure 7 shows the curves for biotin obtained for
the donor‐acceptor pairs studied. These pairs were chosen amongst those
which provided better LRET intensities with minimal acceptor
concentrations.
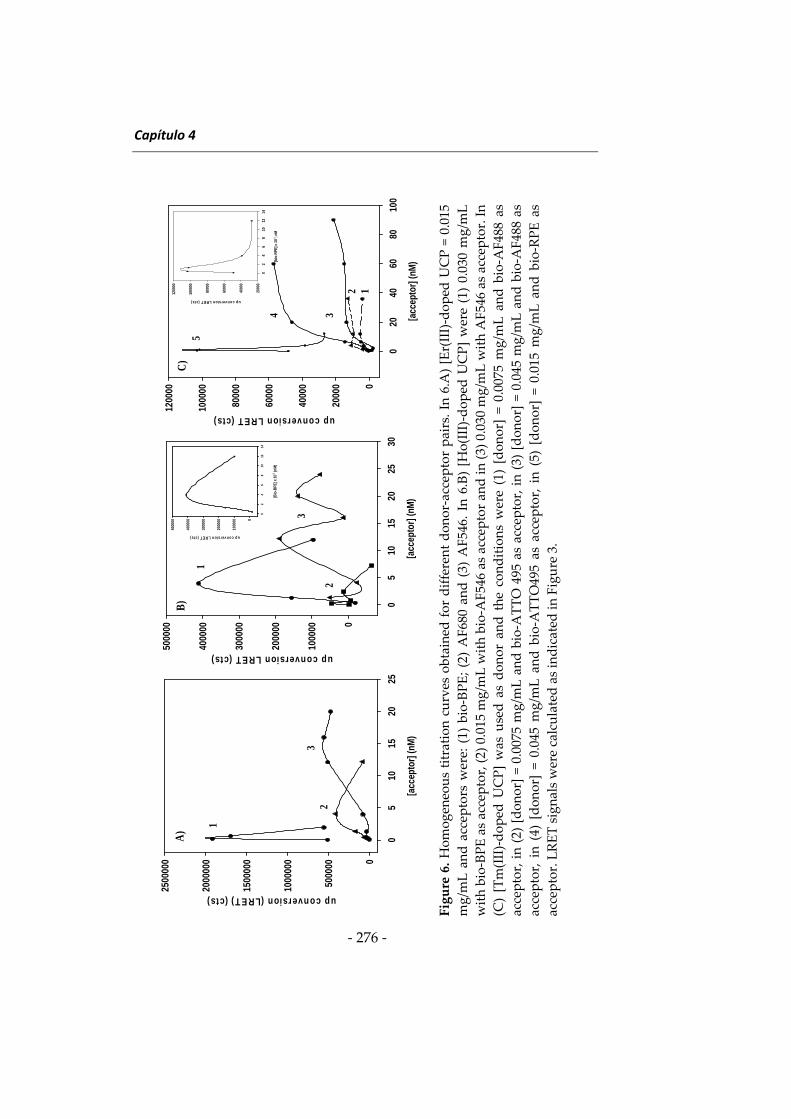
Capítulo 4
‐ 276 ‐
Figure 6. Homogeneous titration curves obtained for different donor‐acceptor pairs. In 6.A) [Er(III)‐doped U
CP = 0.015
mg/m
L and accep
tors w
ere: (1) bio‐BPE; (2) AF680 an
d (3) A
F546. In 6.B) [H
o(III)‐doped U
CP] were (1) 0.030 mg/m
L
with bio‐BPE as acceptor, (2) 0.015 m
g/m
L w
ith bio‐A
F546 as accep
tor an
d in (3) 0.030 m
g/m
L w
ith AF546 as accep
tor. In
(C) [Tm(III)‐doped U
CP] was used as donor an
d the conditions were (1) [donor] = 0.0075 mg/m
L and bio‐A
F488 as
acceptor, in (2) [donor] = 0.0075 mg/m
L and bio‐A
TTO 495 as acceptor, in (3) [donor] = 0.045 m
g/m
L and bio‐A
F488 as
acceptor, in (4) [donor] = 0.045 m
g/m
L and bio‐A
TTO495 as accep
tor, in (5) [donor] = 0.015 m
g/m
L and bio‐RPE as
acceptor. LRET signals were calculated as indicated in Figure 3.
[acc
epto
r] (n
M)
05
1015
2025
up conversion (LRET) (cts)
0
5000
00
1000
000
1500
000
2000
000
2500
000
A) 1
23
[acc
epto
r] (n
M)
05
1015
2025
30
up conversion LRET (cts)
0
1000
00
2000
00
3000
00
4000
00
5000
00
[Bio
-BPE
] x 1
0-1 (n
M)
02
46
810
1214
up conversion LRET (cts)
0
1000
00
2000
00
3000
00
4000
00
5000
00
B)
1
2
3
[acc
epto
r] (n
M)
020
4060
8010
0
up conversion LRET (cts)
0
2000
0
4000
0
6000
0
8000
0
1000
00
1200
00
[bio
-RPE
] x 1
0-1, n
M
02
46
810
1214
up conversion LRET (cts)
2000
0
4000
0
6000
0
8000
0
1000
00
1200
00
C)
12
34
5
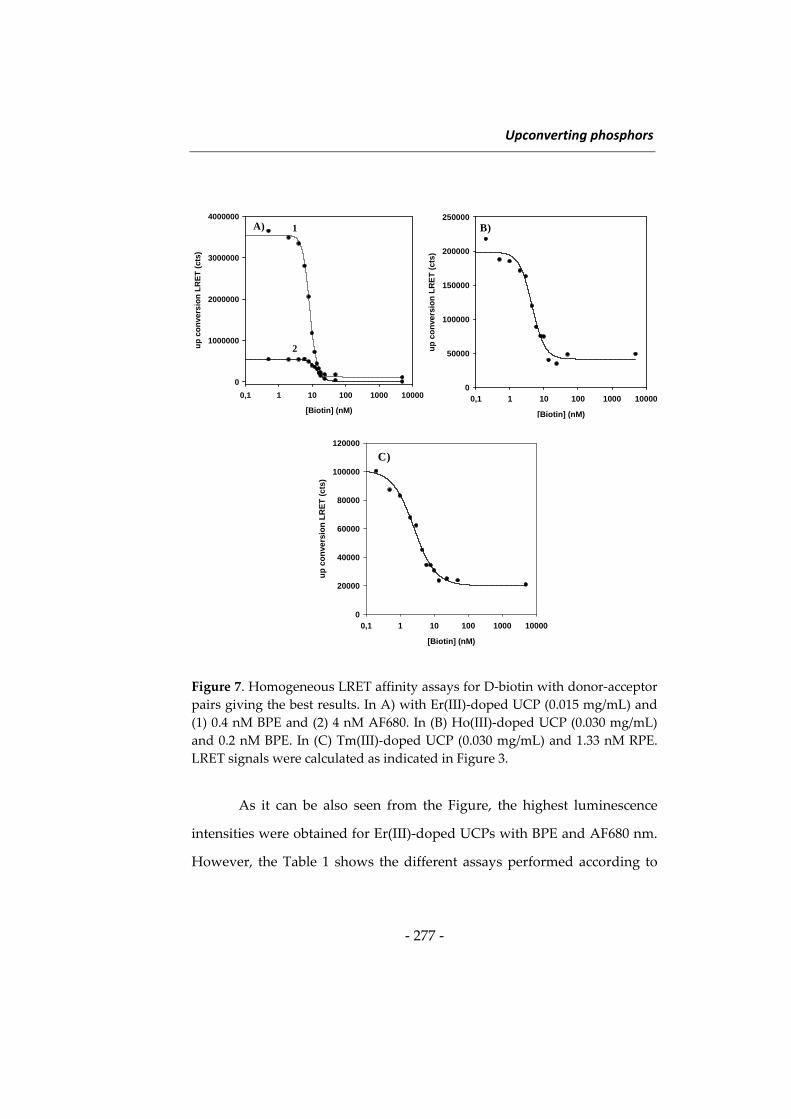
Upconverting phosphors
‐ 277 ‐
Figure 7. Homogeneous LRET affinity assays for D‐biotin with donor‐acceptor
pairs giving the best results. In A) with Er(III)‐doped UCP (0.015 mg/mL) and
(1) 0.4 nM BPE and (2) 4 nM AF680. In (B) Ho(III)‐doped UCP (0.030 mg/mL)
and 0.2 nM BPE. In (C) Tm(III)‐doped UCP (0.030 mg/mL) and 1.33 nM RPE.
LRET signals were calculated as indicated in Figure 3.
As it can be also seen from the Figure, the highest luminescence
intensities were obtained for Er(III)‐doped UCPs with BPE and AF680 nm.
However, the Table 1 shows the different assays performed according to
[Biotin] (nM)
0,1 1 10 100 1000 10000
up
co
nve
rsio
n L
RE
T (
cts
)
0
50000
100000
150000
200000
250000
B)
[Biotin] (nM)
0,1 1 10 100 1000 10000
up
co
nve
rsio
n L
RE
T (
cts)
0
20000
40000
60000
80000
100000
120000
C)
[Biotin] (nM)
0,1 1 10 100 1000 10000
up
co
nve
rsio
n L
RE
T (
cts)
0
1000000
2000000
3000000
4000000A) 1
2
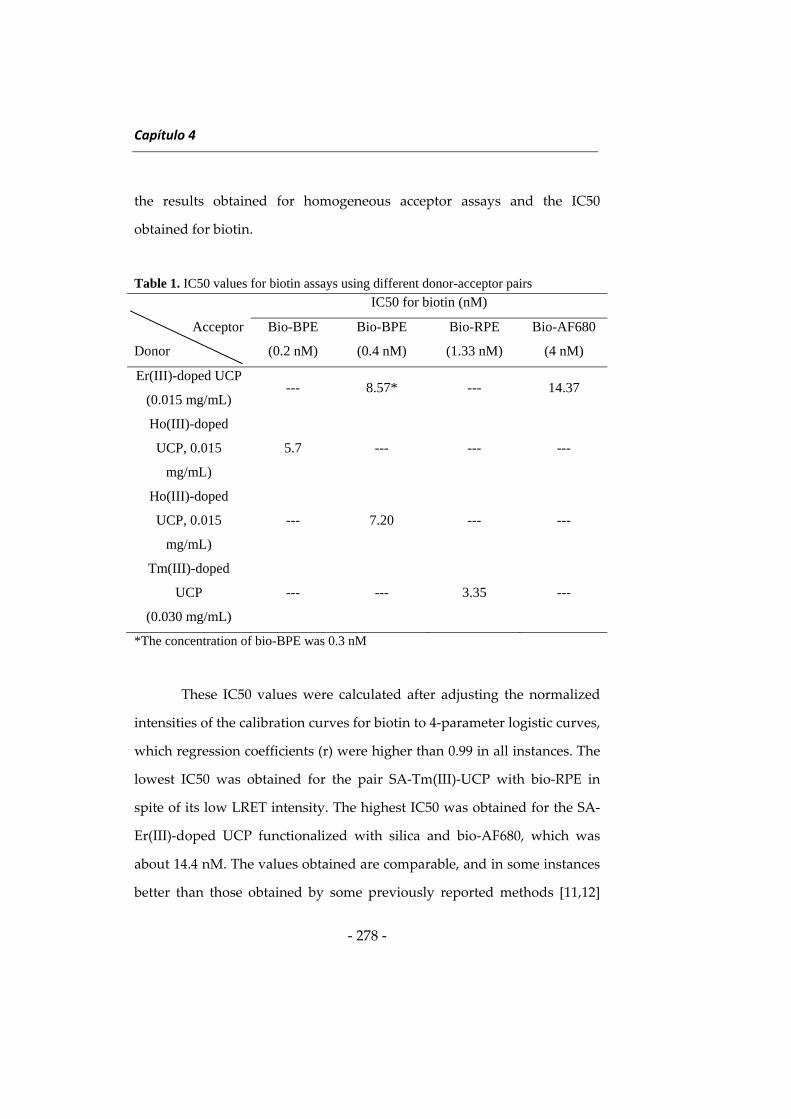
Capítulo 4
‐ 278 ‐
the results obtained for homogeneous acceptor assays and the IC50
obtained for biotin.
Table 1. IC50 values for biotin assays using different donor-acceptor pairs
IC50 for biotin (nM)
Acceptor
Donor
Bio-BPE
(0.2 nM)
Bio-BPE
(0.4 nM)
Bio-RPE
(1.33 nM)
Bio-AF680
(4 nM)
Er(III)-doped UCP
(0.015 mg/mL) --- 8.57* --- 14.37
Ho(III)-doped
UCP, 0.015
mg/mL)
5.7 --- --- ---
Ho(III)-doped
UCP, 0.015
mg/mL)
--- 7.20 --- ---
Tm(III)-doped
UCP
(0.030 mg/mL)
--- --- 3.35 ---
*The concentration of bio-BPE was 0.3 nM
These IC50 values were calculated after adjusting the normalized
intensities of the calibration curves for biotin to 4‐parameter logistic curves,
which regression coefficients (r) were higher than 0.99 in all instances. The
lowest IC50 was obtained for the pair SA‐Tm(III)‐UCP with bio‐RPE in
spite of its low LRET intensity. The highest IC50 was obtained for the SA‐
Er(III)‐doped UCP functionalized with silica and bio‐AF680, which was
about 14.4 nM. The values obtained are comparable, and in some instances
better than those obtained by some previously reported methods [11,12]
Upconverting phosphors
‐ 279 ‐
using Er(III)‐doped UCPs coated with Additol as donors and bio‐BPE as
acceptor.
4. Conclusions
A systematic study on the suitability of different UCP donor‐acceptor
pairs has been performed using biotin as model analyte. The use of Er(III)‐
doped UCPs has resulted in higher LRET intensities, the maximum of
which have been obtained using bio‐BPE as acceptor. Although BPE and
RPE have shown to provide the best LRET intensities, the use of other
fluorophores, such as AF680 allows determinations of biotin with IC50
values in the nM range.
The results obtained show the potential feasibility of multiplexed
assays using different LRET donor‐acceptor pairs.
References
(1) Gnach A., Bednarkiewicz A. Lanthanide‐doped up‐coverting
nanoparticles: merits and challenges. Nano Today (2012) 7, 532 – 536.
(2) Wang F., Banerjee D., Liu Y., Chen X., Liu X. Analyst (2010) 135,
1839 – 1854.
(3) Misiak M., Prorok K., Cichy B., Berdnarkiewicz, Strek W. Thulium
cocentration quenching in the up‐converting a‐Tm3+/Yb3+ NaYF4
colloidal nanocrystals. Opt. Mat. (2013) 35, 1124 – 1128.
(4) Jiang T., Song W., Liu S. Qin W., Synthesis and upconversion
luminescene properties study of NaYbF4:Tm3+ crystals with
different dopant concentration. J. Fluorine Chem. (2012) 140, 70 ‐75.
Capítulo 4
‐ 280 ‐
(5) Prorok K., Gnach A., Beednarkiewicz A., Strek W. Energy up‐
conversion in Tb3+/Yb3+ co‐doped colloidal a‐NaYF4 nanocrystals. J.
Luminesc. (2013) 140, 103 – 109.
(6) Koepke C., Piatkowski D., Wisniewski K., Naftaly M. On
competition between two types of anti‐Stokes emission in the Ho3+
and Nd3+ ions in glasses. J. Non‐Cryst. Solids (2010) 356, 435 – 440.
(7) Wnuk A., Kaczkan M., Frukacz Z., Pracka I., Chadeyron G., Joubert
M.F., Malinowski M. Infra‐red to visible up‐conversion in
holmium‐doped materials. J. Alloys Compounds (2002) 341, 353 –
357.
(8) Ukonaho T., Rantanen T., Jämsen L. Kuningas K., Päkkilä, T.
Lövgren, T. Soukka. Comparison of infrared‐excited up‐converting
phosphors and europium nanoparticles in a two‐site immunoassay.
Anal. Chim. Acta (2007) 596, 106 – 115.
(9) Kuningas K., Rantanen T., Lövgren T., Soukka T. Enhanced
photoluminescence of up‐converting phosphors in a solid phase
bioaffinity assay. Anal. Chim. Acta (2005) 543, 130 – 136.
(10) Kuningas K., Rantanen T., Karhunen U., Lövgren T., Soukka T.
Simultaneous use of time‐resolved fluorescence and anti‐Stokes
Photoluminescence in a Bioaffinity Assay. Anal. Chem. (2005) 77,
2826 – 2834.
(11) Kuningas K., Rantanen T., Ukonaho T., Lövgren T., Soukka T.
Homogeneous assay technology based on upconverting phosphors.
Anal. Chem. (2005) 77, 7348 – 7355.
(12) Kuningas K., Ukonaho T.,Pakkilä H., Rantanen T., Rosenberg J.
Lövgren T., Soukka T. Upconversion fluorescence resonance energy
Upconverting phosphors
‐ 281 ‐
transfer in a homogeneous immunoassay for estradiol. Anal. Chem.
(2006) 78, 4690 – 4696.
(13) Rantanen T., Päkkilä H., Jämsen L., Kuningas K., Ukonaho t.,
Lövgren T., Soukka T. Tandem dye acceptor used to enhance
upconversion fluorescence resonance energy transfer in
homogeneous assays. Anal. Chem. (2007) 29, 6312 – 6318.
(14) Rantanen T., Jarvenpäa M.L., Vuojola J., Kuningas K., Soukka T.
Fluorescence quenching‐based enzyme activity assay using photon
up‐conversion. Angew. Chem. Int. Ed. (2008) 47, 3811 – 3813.
(15) Kong Y.L., Wang Z.L., Lin C.K., Quan Z.W., Li Y.Y., Li C.X.
Biofunctionalization of CeF3:Tb3+ nanoparticles. Nanotechnology
(2007) 18, 075601.
(16) Hyppänen I., Hölsä J., Kankare M., Lastusaart M., Pihlgren L.,
Soukka T., Terrae Rarae. Preparation and up‐conversion
luminescence properties of NaYF4:Yb3+,Er3+ nanomaterials. Terra
Rarae (2009) 16, 1 – 6.
(17) Godoy‐Navajas J., Aguilar‐Caballos M.P., Gómez‐Hens J. Synthesis
and characterization of oxazine‐doped silica nanoparticles for their
potential use as stable fluorescent reagents. J. Fluoresc. (2010) 20,
171 – 180.

CAPÍTULO 5 CHAPTER 5
Discusiónderesultados
Discussionoftheresults

Discusión de resultados
‐ 285 ‐
Introducción
En este capítulo se discuten las características de los métodos
desarrollados en esta Memoria, realizando un estudio comparativo de sus
ventajas y limitaciones frente a métodos previamente descritos en la
bibliografía. También se discute la utilidad de las metodologías propuestas
mediante su aplicación al análisis de alimentos.
El capítulo se ha dividido en tres apartados: 1) Nanopartículas de
sílice en análisis de alimentos, 2) Nuevas estrategias para la determinación
de antioxidantes en alimentos y 3) Nuevas investigaciones en el uso de
“upconverting phosphors” en sistemas de transferencia de energía de
resonancia luminiscente.
1. Nanopartículas de sílice en análisis de alimentos.
Como ya se ha indicado, el uso de nanomateriales está teniendo un
importante auge en distintas áreas de la Química Analítica [1 – 5]. Dentro
de la gran diversidad de nanomateriales existentes en la actualidad, la
utilización de nanopartículas de sílice (SiO2NPs) se ha extendido
rápidamente a lo largo de la última década gracias a sus excelentes
propiedades que las hacen viables para su uso como marcadores en el
campo del bioanálisis. En el siguiente apartado se discutirán los resultados
obtenidos con estas NPs en tres de los artículos incluidos en esta Memoria.
Síntesis y caracterización de nanopartículas dopadas con
fluoróforos de larga longitud de onda
Capítulo 5
‐ 286 ‐
El uso de SiO2NPs para formar marcadores tiene interés en los
métodos con detección óptica debido principalmente a la transparencia de
la sílice a la radiación visible, además de otra serie de ventajas descritas en
la Introducción de esta Memoria.
En los dos métodos generales para la síntesis de SiO2NPs, el
método Stöber y el de formación de microemulsión de micelas inversas, se
utilizan precursores de sílice tales como el tetrametoxisilano (TMOS) y el
tetraetoxisilano (TEOS), los cuales, tras reacciones de hidrólisis y
condensación dan lugar a NPs esféricas dispersas [6]. La elección de uno u
otro método va a depender de las propiedades físicas y químicas de las
especies que se pretenden encapsular en estas NPs [2, 4].
En la Memoria presentada se describe el procedimiento para
sintetizar SiO2NPs con emisión a larga longitud de onda, basado en la
formación de una microemulsión de micelas inversas, dopando las NPs
con dos fluoróforos de larga longitud de onda (LWFs): violeta de cresilo y
azul nilo. Para ello se han optimizado todas las variables implicadas en el
proceso de síntesis y se han comparado sus características (tamaño de NP,
cantidad de nanomaterial, intensidad de fluorescencia, etc) con las que
presentan las obtenidas mediante el método Stöber.
La formación de la microemulsión utilizada para la síntesis de las
NPs dopadas con los fluoróforos anteriormente indicados implica el uso de
un tensoactivo, una disolución acuosa y un disolvente orgánico, mientras
que para la formación de la base estructural de las NPs es necesario un
precursor de sílice. Dependiendo de las cantidades relativas de estos
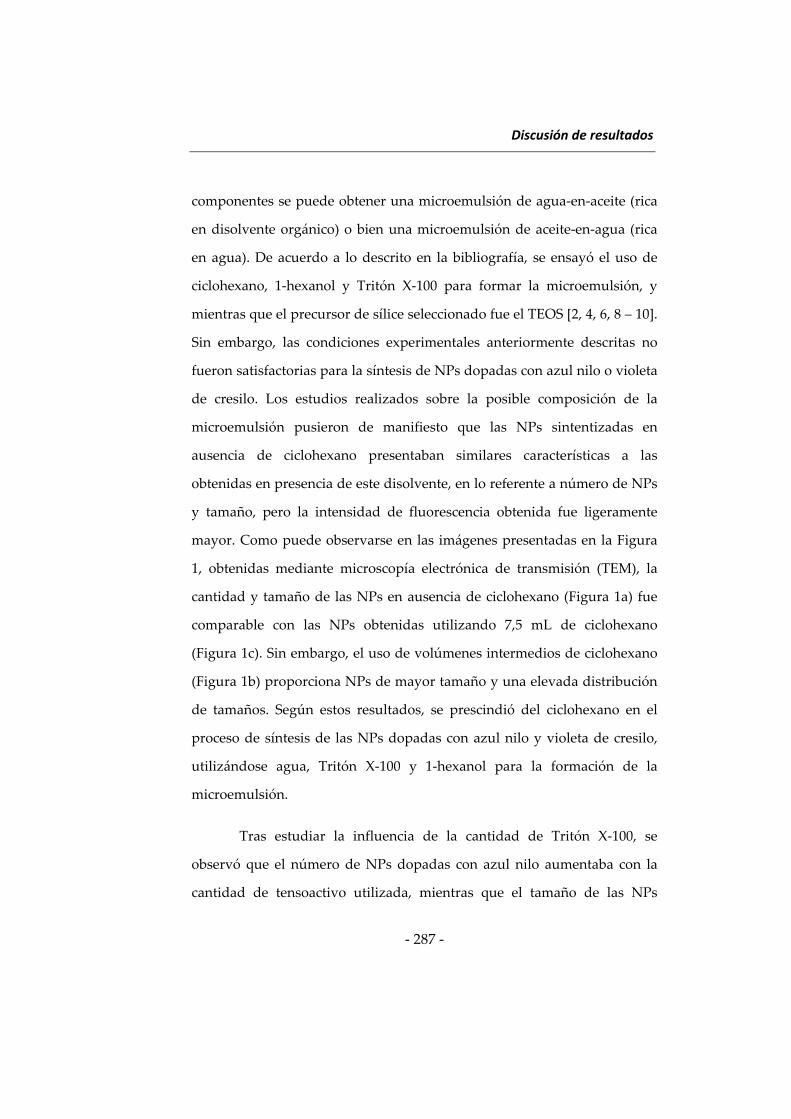
Discusión de resultados
‐ 287 ‐
componentes se puede obtener una microemulsión de agua‐en‐aceite (rica
en disolvente orgánico) o bien una microemulsión de aceite‐en‐agua (rica
en agua). De acuerdo a lo descrito en la bibliografía, se ensayó el uso de
ciclohexano, 1‐hexanol y Tritón X‐100 para formar la microemulsión, y
mientras que el precursor de sílice seleccionado fue el TEOS [2, 4, 6, 8 – 10].
Sin embargo, las condiciones experimentales anteriormente descritas no
fueron satisfactorias para la síntesis de NPs dopadas con azul nilo o violeta
de cresilo. Los estudios realizados sobre la posible composición de la
microemulsión pusieron de manifiesto que las NPs sintentizadas en
ausencia de ciclohexano presentaban similares características a las
obtenidas en presencia de este disolvente, en lo referente a número de NPs
y tamaño, pero la intensidad de fluorescencia obtenida fue ligeramente
mayor. Como puede observarse en las imágenes presentadas en la Figura
1, obtenidas mediante microscopía electrónica de transmisión (TEM), la
cantidad y tamaño de las NPs en ausencia de ciclohexano (Figura 1a) fue
comparable con las NPs obtenidas utilizando 7,5 mL de ciclohexano
(Figura 1c). Sin embargo, el uso de volúmenes intermedios de ciclohexano
(Figura 1b) proporciona NPs de mayor tamaño y una elevada distribución
de tamaños. Según estos resultados, se prescindió del ciclohexano en el
proceso de síntesis de las NPs dopadas con azul nilo y violeta de cresilo,
utilizándose agua, Tritón X‐100 y 1‐hexanol para la formación de la
microemulsión.
Tras estudiar la influencia de la cantidad de Tritón X‐100, se
observó que el número de NPs dopadas con azul nilo aumentaba con la
cantidad de tensoactivo utilizada, mientras que el tamaño de las NPs
Capítulo 5
‐ 288 ‐
decrecía. Los mejores resultados fueron obtenidos utilizando 510‐520 mg
de Tritón X‐100 (Figura 1f), ya que menores cantidades de este tensoactivo
proporcionaron NPs de tamaño superior a los 200 nm de diámetro (Figuras
1d y 1e). En cambio, cuando la cantidad de Tritón X‐100 era próxima a 1,0 g
se obtenían NPs muy pequeñas y parcialmente agregadas.
También se estudió la posibilidad de encapsular el fluoróforo en las
SiO2NPs mediante el proceso de formación de microemulsión de micelas
inversas con una ligera modificación adicional. Esta modificación consiste
en un paso previo de reacción, donde el fluoróforo reacciona con un
precursor de sílice, 3‐aminopropiltrietoxisilano (APS), para que, una vez
unido covalentemente a este precursor, ambos se incluyan en el proceso de
polimerización de las NPs. El objetivo de este procedimiento fue evitar
posibles pérdidas de fluoróforo a través de la matriz de la sílice,
reduciendo también el número de lavados necesarios para eliminar el
exceso de fluoróforo, etapa previa a la utilización de las NPs. No obstante,
como puede observarse en la Figura 1g, la cantidad de NPs resultante fue
considerablemente menor a la obtenida sin la formación del precursor
APS‐azul nilo, además de presentar una elevada distribución de tamaños.
Por lo tanto, se descartó la posibilidad de utilizar este tipo de NPs para la
obtención de marcadores utilizables en posteriores ensayos, puesto que no
mejoraban las características de las NPs frente a las obtenidas sin incluir
esta modificación. Este comportamiento se puede atribuir a la
estabilización de los fluoróforos, cargados positivamente, con los grupos
silanoles, cargados negativamente, característicos de la matriz de sílice.
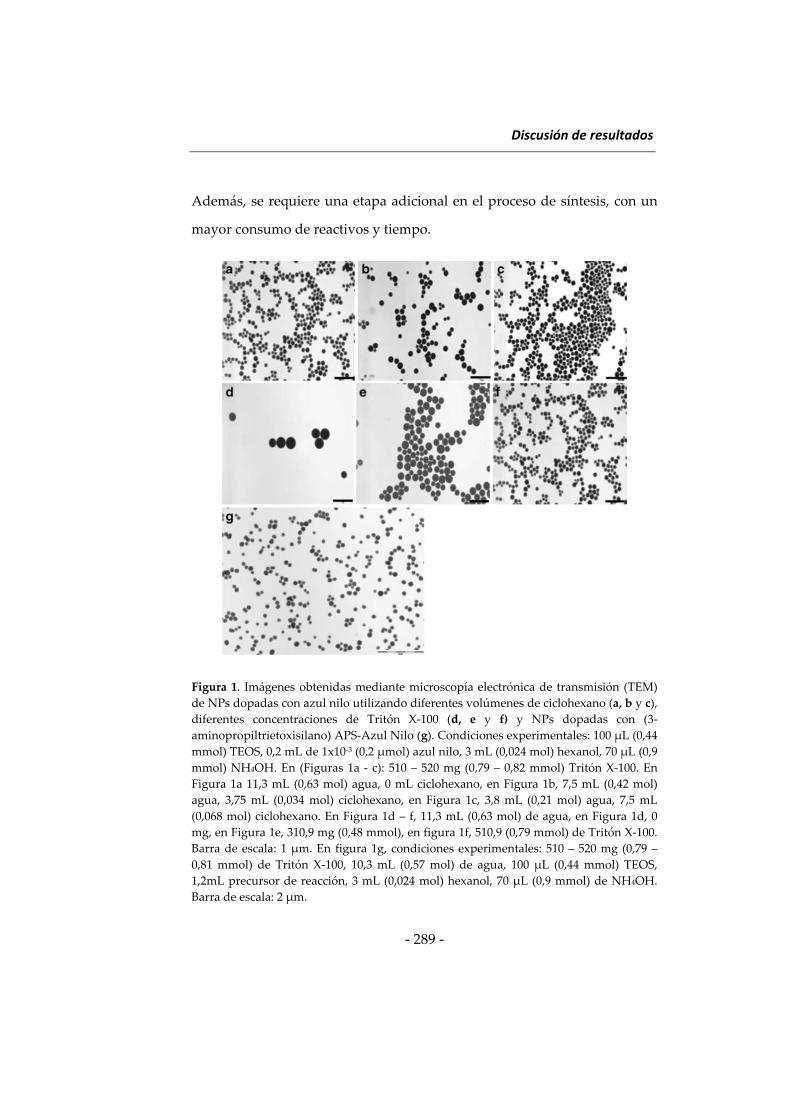
Discusión de resultados
‐ 289 ‐
Además, se requiere una etapa adicional en el proceso de síntesis, con un
mayor consumo de reactivos y tiempo.
Figura 1. Imágenes obtenidas mediante microscopía electrónica de transmisión (TEM)
de NPs dopadas con azul nilo utilizando diferentes volúmenes de ciclohexano (a, b y c),
diferentes concentraciones de Tritón X‐100 (d, e y f) y NPs dopadas con (3‐
aminopropiltrietoxisilano) APS‐Azul Nilo (g). Condiciones experimentales: 100 μL (0,44
mmol) TEOS, 0,2 mL de 1x10‐3 (0,2 μmol) azul nilo, 3 mL (0,024 mol) hexanol, 70 μL (0,9
mmol) NH4OH. En (Figuras 1a ‐ c): 510 – 520 mg (0,79 – 0,82 mmol) Tritón X‐100. En
Figura 1a 11,3 mL (0,63 mol) agua, 0 mL ciclohexano, en Figura 1b, 7,5 mL (0,42 mol)
agua, 3,75 mL (0,034 mol) ciclohexano, en Figura 1c, 3,8 mL (0,21 mol) agua, 7,5 mL
(0,068 mol) ciclohexano. En Figura 1d – f, 11,3 mL (0,63 mol) de agua, en Figura 1d, 0
mg, en Figura 1e, 310,9 mg (0,48 mmol), en figura 1f, 510,9 (0,79 mmol) de Tritón X‐100.
Barra de escala: 1 μm. En figura 1g, condiciones experimentales: 510 – 520 mg (0,79 –
0,81 mmol) de Tritón X‐100, 10,3 mL (0,57 mol) de agua, 100 μL (0,44 mmol) TEOS,
1,2mL precursor de reacción, 3 mL (0,024 mol) hexanol, 70 μL (0,9 mmol) de NH4OH.
Barra de escala: 2 μm.
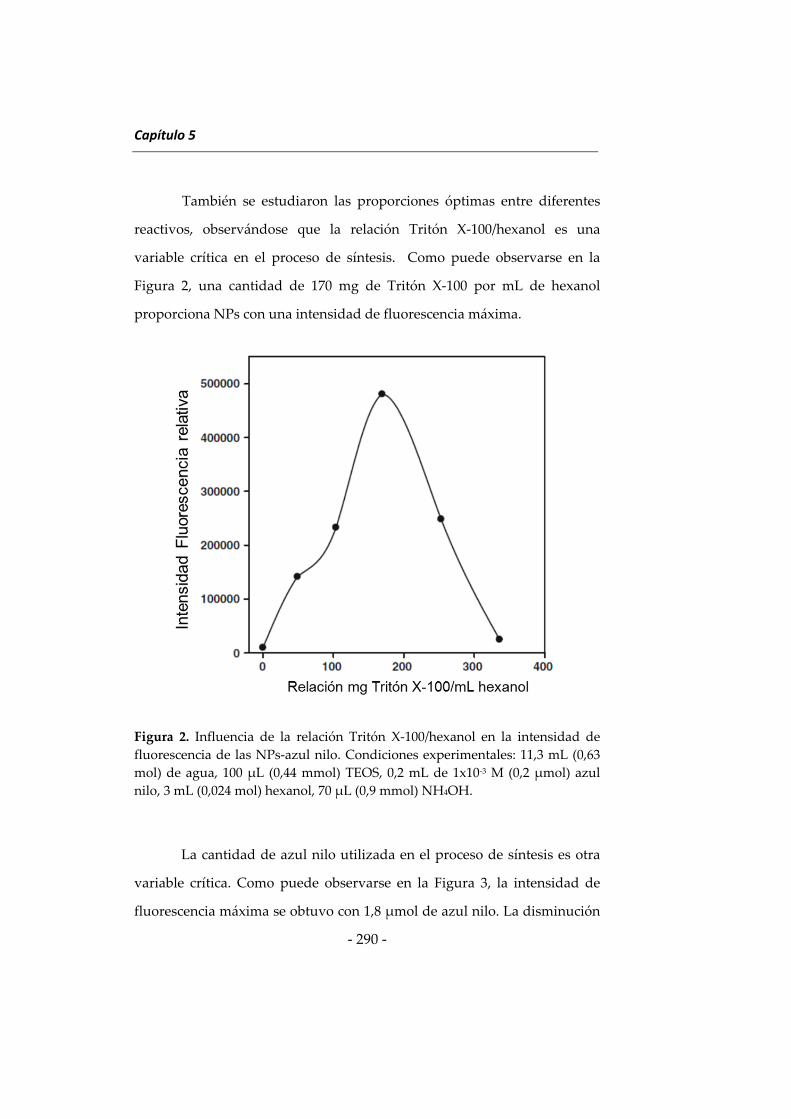
Capítulo 5
‐ 290 ‐
También se estudiaron las proporciones óptimas entre diferentes
reactivos, observándose que la relación Tritón X‐100/hexanol es una
variable crítica en el proceso de síntesis. Como puede observarse en la
Figura 2, una cantidad de 170 mg de Tritón X‐100 por mL de hexanol
proporciona NPs con una intensidad de fluorescencia máxima.
Figura 2. Influencia de la relación Tritón X‐100/hexanol en la intensidad de
fluorescencia de las NPs‐azul nilo. Condiciones experimentales: 11,3 mL (0,63
mol) de agua, 100 μL (0,44 mmol) TEOS, 0,2 mL de 1x10‐3 M (0,2 μmol) azul
nilo, 3 mL (0,024 mol) hexanol, 70 μL (0,9 mmol) NH4OH.
La cantidad de azul nilo utilizada en el proceso de síntesis es otra
variable crítica. Como puede observarse en la Figura 3, la intensidad de
fluorescencia máxima se obtuvo con 1,8 μmol de azul nilo. La disminución
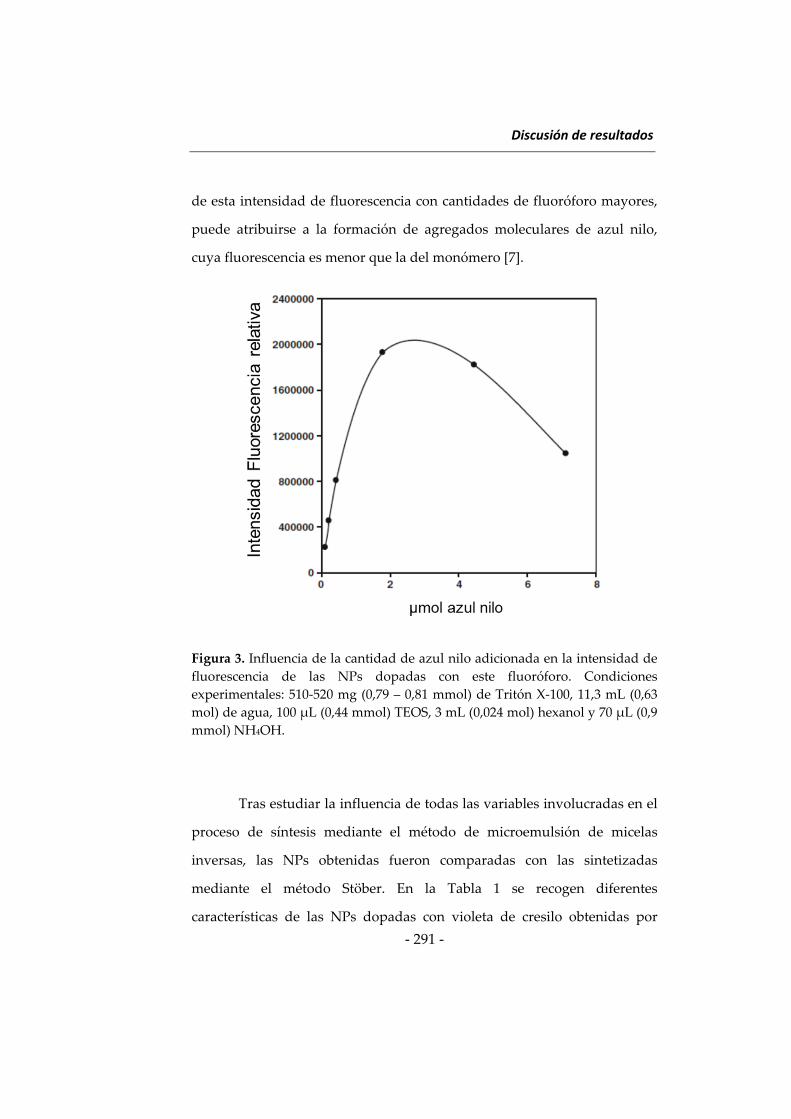
Discusión de resultados
‐ 291 ‐
de esta intensidad de fluorescencia con cantidades de fluoróforo mayores,
puede atribuirse a la formación de agregados moleculares de azul nilo,
cuya fluorescencia es menor que la del monómero [7].
Figura 3. Influencia de la cantidad de azul nilo adicionada en la intensidad de
fluorescencia de las NPs dopadas con este fluoróforo. Condiciones
experimentales: 510‐520 mg (0,79 – 0,81 mmol) de Tritón X‐100, 11,3 mL (0,63
mol) de agua, 100 μL (0,44 mmol) TEOS, 3 mL (0,024 mol) hexanol y 70 μL (0,9
mmol) NH4OH.
Tras estudiar la influencia de todas las variables involucradas en el
proceso de síntesis mediante el método de microemulsión de micelas
inversas, las NPs obtenidas fueron comparadas con las sintetizadas
mediante el método Stöber. En la Tabla 1 se recogen diferentes
características de las NPs dopadas con violeta de cresilo obtenidas por
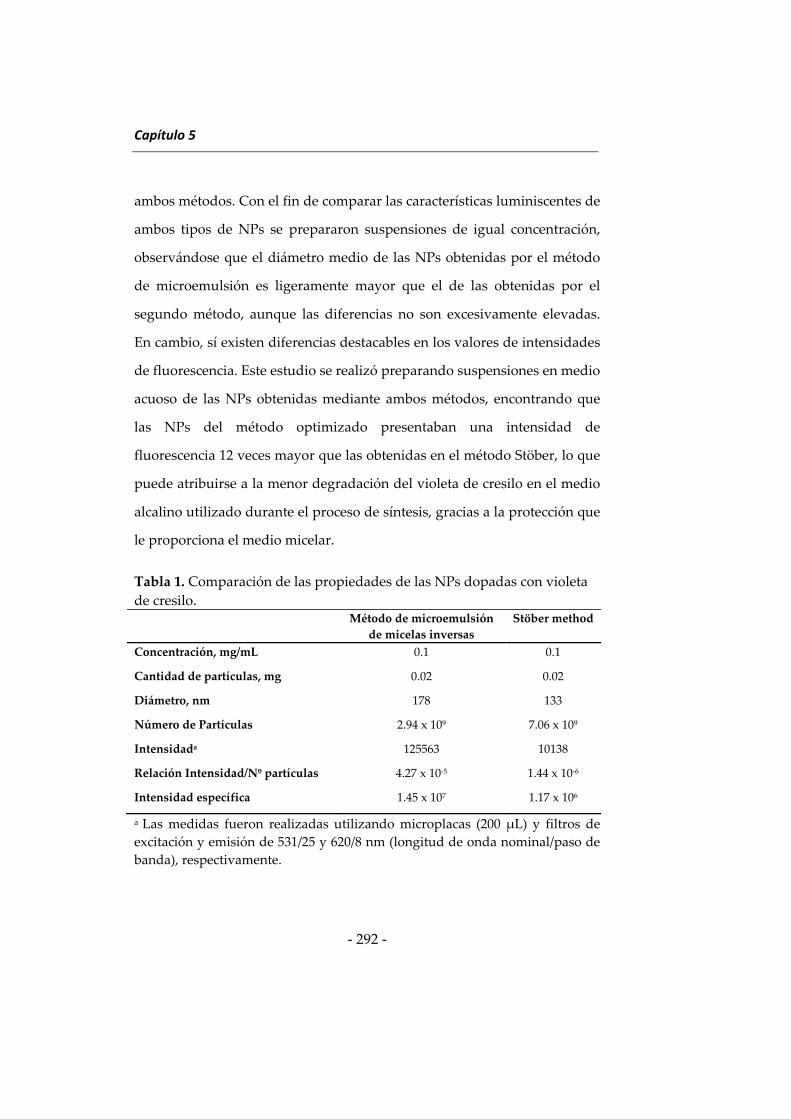
Capítulo 5
‐ 292 ‐
ambos métodos. Con el fin de comparar las características luminiscentes de
ambos tipos de NPs se prepararon suspensiones de igual concentración,
observándose que el diámetro medio de las NPs obtenidas por el método
de microemulsión es ligeramente mayor que el de las obtenidas por el
segundo método, aunque las diferencias no son excesivamente elevadas.
En cambio, sí existen diferencias destacables en los valores de intensidades
de fluorescencia. Este estudio se realizó preparando suspensiones en medio
acuoso de las NPs obtenidas mediante ambos métodos, encontrando que
las NPs del método optimizado presentaban una intensidad de
fluorescencia 12 veces mayor que las obtenidas en el método Stöber, lo que
puede atribuirse a la menor degradación del violeta de cresilo en el medio
alcalino utilizado durante el proceso de síntesis, gracias a la protección que
le proporciona el medio micelar.
Tabla 1. Comparación de las propiedades de las NPs dopadas con violeta
de cresilo. Método de microemulsión
de micelas inversas
Stöber method
Concentración, mg/mL 0.1 0.1
Cantidad de partículas, mg 0.02 0.02
Diámetro, nm 178 133
Número de Partículas 2.94 x 10⁹ 7.06 x 10⁹
Intensidada 125563 10138
Relación Intensidad/Nº partículas 4.27 x 10‐5 1.44 x 10‐6
Intensidad específica 1.45 x 10⁷ 1.17 x 10⁶
a Las medidas fueron realizadas utilizando microplacas (200 μL) y filtros de
excitación y emisión de 531/25 y 620/8 nm (longitud de onda nominal/paso de
banda), respectivamente.
Discusión de resultados
‐ 293 ‐
La comparación de los espectros de emisión de las NPs dopadas
con cada uno de los fluoróforos con los obtenidos para los mismos
fluoróforos en disolución y para las NPs sin dopante, mostró que la sílice
por sí sola no presenta emisión fluorescente a las longitudes de onda
típicas de los fluoróforos y que el máximo de emisión de las NPs dopadas
con estas oxacinas sufre un ligero desplazamiento hipsocrómico de unos 9
nm frente a los fluoróforos en disolución. Para llevar a cabo los estudios de
foto‐descomposición, se irradiaron los fluoróforos en disolución y las NPs
dopadas durante una hora a las longitudes de onda de máxima excitación
y emisión. La intensidad de fluorescencia disminuyó un 75 % para el
violeta de cresilo y un 62 % para el azul nilo, ambos en disolución,
mientras que la fluorescencia de las NPs prácticamente no se alteró. El
mismo estudio se realizó con las SiO2NPs preparadas en presencia de la
mezcla azul nilo y APS, obteniendo una disminución de fluorescencia de
aproximadamente el 10%. La estabilidad del fluoróforo encapsulado en las
NPs también se estudió a lo largo del tiempo, comprobándose que la señal
fluorescente permanecía constante durante al menos un mes.
En resumen, se puede afirmar que el método modificado de
microemulsión de micelas para la síntesis de NPs dopadas con dos LWFs
(azul nilo y violeta de cresilo) proporciona unas NPs de similares
características (tamaño, cantidad de material, diámetro medio) que las
obtenidas mediante el método Stöber, considerado como método de
referencia. Sin embargo, la intensidad de fluorescencia de las NPs
sintetizadas en el primer caso es mucho mayor que la obtenida por el
Capítulo 5
‐ 294 ‐
método Stöber, atribuibles a la estabilidad y protección que les confiere a
los LWFs la microemulsión donde tiene lugar la polimerización de la sílice.
Utilización de nanopartículas de sílice en inmunoensayo
heterogéneo para la determinación de macromoléculas y moléculas
pequeñas
La determinación de biomoléculas constituye un campo de
aplicación de la Química Analítica de gran interés. Se han desarrollado
numerosos métodos cromatográficos y electroforéticos para la
determinación de macromoléculas y moléculas pequeñas [11 – 15].
Normalmente, este tipo de técnicas requiere que el analito presente una
propiedad medible como, por ejemplo, absorbancia o fluorescencia. En
caso contrario, es imprescindible el uso de una etapa de derivatización que
complica y aumenta la duración del análisis [16, 17]. Se han desarrollado
diferentes métodos cromatográficos acoplados a espectrometría de masas
para la determinación de biomoléculas, los cuales requieren
instrumentación sofisticada y costosa [18 – 20]. Además, en algunos casos,
es necesario incluir etapas previas para la eliminación de la matriz de la
muestra, que alargan el proceso y aumentan la manipulación por parte del
analista. Los métodos de “screening” desempeñan dos funciones muy
importantes en el análisis de biomoléculas: por un lado, el número de
muestras susceptibles de ser sometidas a métodos confirmatorios es menor
y, por otro lado, se reduce el coste del análisis. Los inmunoensayos,
extensamente utilizados en análisis cuantitativo y semicuantitativo,
presentan una serie de ventajas para su uso como métodos de “screening”
en la determinación de sustancias antigénicas, ya sean moléculas pequeñas
Discusión de resultados
‐ 295 ‐
(haptenos) o macromoléculas. Se han descritos varios inmunoensayos
heterogéneos que utilizan marcadores enzimáticos (ELISA) comerciales y
no comerciales [21 – 25]. Un porcentaje destacable de estos métodos hace
uso de medidas fotométricas, obteniéndose límites de detección próximos a
ng/mL, mientras que para obtener menores límites de detección es
necesario el uso de sistemas de detección quimioluminiscente [26] o bien, el
uso de quelatos de europio (III) para formar el marcador [27, 28].
La utilización de NPs inorgánicas funcionalizadas para obtener
marcadores en inmunoensayo es un campo relativamente nuevo y de gran
proyección gracias a las versátiles propiedades físicas y químicas que
presentan estos materiales, mejorando frecuentemente las características de
los ensayos [29 – 31]. Entre las NPs inorgánicas, las SiO2NPs dopadas son
una opción muy útil debido a las propiedades anteriormente indicadas.
Además, presentan la capacidad de encapsular una gran variedad de
compuestos, que quedan protegidos frente a los agentes ambientales, gran
área superficial y fácil funcionalización de su superficie. Estas propiedades
han dado lugar a numerosos inmunoensayos para la determinación de
macromoléculas y haptenos [32, 33]. Por ejemplo, se ha desarrollado un
método para la determinación de E. Coli utilizando NPs dopadas con el
complejo rutenio (II) tris(bipiridina) (Ru(bpy)32+) inmovilizando el
anticuerpo en la superficie de la NP, lo que ha permitido llegar a
determinar una sola bacteria sin requerir la amplificación de la señal [34].
De manera similar, se ha determinado albúmina de suero bovino (BSA)
mediante un ensayo de afinidad biotina‐estreptavidina utilizando NPs
dopadas con rodamina 6G para formar el marcador [35], así como la
Capítulo 5
‐ 296 ‐
determinación de α‐fetoproteina (AFP) y antígeno de superficie de la
hepatitis B (HBsAg) utilizando SiO2NPs dopadas con fluoresceína [36, 37].
Estas SiO2NPs también pueden encapsular otras especies como quelatos de
terbio y europio, que han sido utilizados como marcadores para la
determinación de HBsAg, antígeno carcinoembriónico (CEA) y antígeno
prostático específico (PSA) [38 – 40]. De los ejemplos citados, se deduce que
las SiO2NPs dopadas han sido principalmente utilizadas en análisis clínico,
pero su uso para desarrollar inmunoensayos aplicables al análisis de
alimentos está claramente justificado.
En los inmunoensayos presentados en esta Memoria se utilizan
SiO2NPs dopadas con azul nilo para obtener el marcador, aplicándolas a la
determinación de proteínas de soja (macromoléculas) y del antibiótico de
uso veterinario monensín, cuya presencia en los alimentos de origen
animal está regulada a nivel europeo. Los resultados obtenidos han
demostrado que el uso de estas NPs proporciona algunas ventajas respecto
a otros tipos de inmunoensayos, como son límites de detección más bajos
y, en el caso del enzimoinmunoensayo, un menor número de etapas ya que
no es necesaria la adición de un sustrato para medir la actividad de la
enzima.
La incorporación de azul nilo a las SiO2NPs ha tenido como
objetivo el uso de medidas de fluorescencia a larga longitud de onda, las
cuales proporcionan una selectividad espectral adecuada al eliminar las
señales de fondo producidas por la matriz de la muestra. Como se ha
indicado anteriormente, el uso de SiO2NPs podría estar limitado por la
posible pérdida de fluoróforo a través de la matriz de sílice. No obstante,
Discusión de resultados
‐ 297 ‐
como ya se ha comentado, las SiO2NPs dopadas con azul nilo muestran
una excelente estabilidad debida a las interacciones electrostáticas del
fluoróforo cargado positivamente con los grupos silanoles de la sílice.
A continuación se discuten los resultados obtenidos en los
inmunoensayos desarrollados en esta Memoria.
Determinación de proteínas de soja en alimentos mediante
inmunoensayo heterogéneo.
En los últimos años, el consumo de alimentos enriquecidos con
proteínas de soja se ha incrementado sustancialmente debido a los aspectos
beneficiosos para la salud que se han descrito para estas proteínas, tales
como un descenso del colesterol en sangre, prevención de enfermedades
como el cáncer, la diabetes o la obesidad, así como protección frente a
enfermedades que dañan el intestino o el riñón. Sin embargo, también se
ha descrito que el consumo de estas proteínas puede originar reacciones
alérgicas.
En esta Memoria se describe el desarrollo de un inmunoensayo
heterogéneo competitivo para la determinación de proteínas de soja en
muestras de alimentos utilizando SiO2NPs dopadas con azul nilo para
formar el marcador, estudiándose dos modalidades de inmunoensayo, con
captura de analito y con captura de anticuerpo, como se esquematiza en las
Figuras 4 y 5. Las NPs fueron unidas a proteínas de soja y a anticuerpos
anti‐proteína de soja para estudiar su viabilidad como trazadores en los
dos formatos de inmunoensayo. El primero de ellos (Figura 4), con captura
de analito, implica la inmovilización de anticuerpos anti‐IgG de conejo en
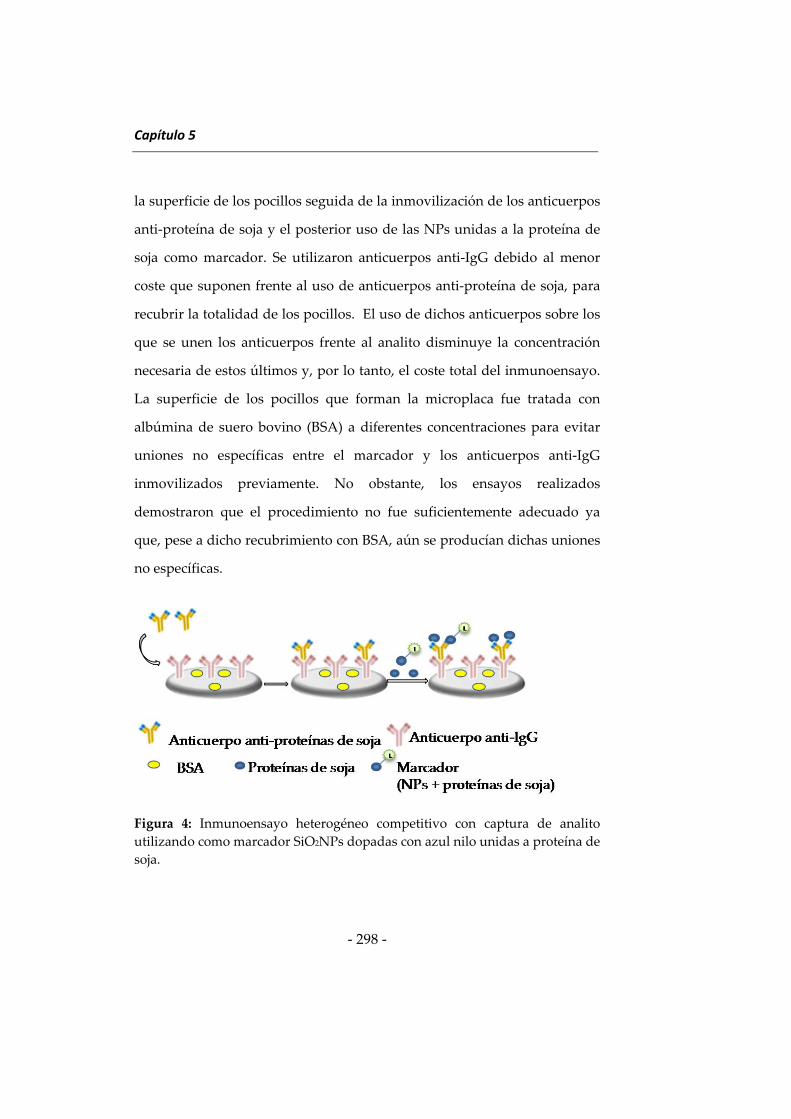
Capítulo 5
‐ 298 ‐
la superficie de los pocillos seguida de la inmovilización de los anticuerpos
anti‐proteína de soja y el posterior uso de las NPs unidas a la proteína de
soja como marcador. Se utilizaron anticuerpos anti‐IgG debido al menor
coste que suponen frente al uso de anticuerpos anti‐proteína de soja, para
recubrir la totalidad de los pocillos. El uso de dichos anticuerpos sobre los
que se unen los anticuerpos frente al analito disminuye la concentración
necesaria de estos últimos y, por lo tanto, el coste total del inmunoensayo.
La superficie de los pocillos que forman la microplaca fue tratada con
albúmina de suero bovino (BSA) a diferentes concentraciones para evitar
uniones no específicas entre el marcador y los anticuerpos anti‐IgG
inmovilizados previamente. No obstante, los ensayos realizados
demostraron que el procedimiento no fue suficientemente adecuado ya
que, pese a dicho recubrimiento con BSA, aún se producían dichas uniones
no específicas.
Figura 4: Inmunoensayo heterogéneo competitivo con captura de analito
utilizando como marcador SiO2NPs dopadas con azul nilo unidas a proteína de
soja.
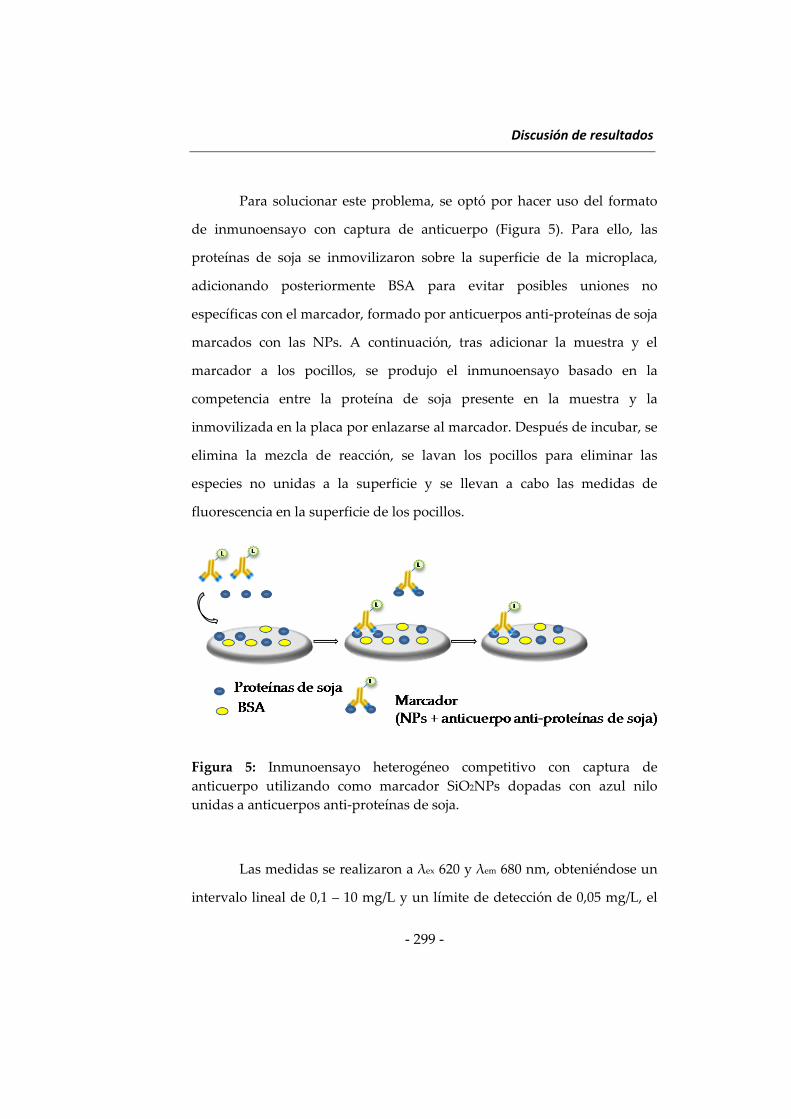
Discusión de resultados
‐ 299 ‐
Para solucionar este problema, se optó por hacer uso del formato
de inmunoensayo con captura de anticuerpo (Figura 5). Para ello, las
proteínas de soja se inmovilizaron sobre la superficie de la microplaca,
adicionando posteriormente BSA para evitar posibles uniones no
específicas con el marcador, formado por anticuerpos anti‐proteínas de soja
marcados con las NPs. A continuación, tras adicionar la muestra y el
marcador a los pocillos, se produjo el inmunoensayo basado en la
competencia entre la proteína de soja presente en la muestra y la
inmovilizada en la placa por enlazarse al marcador. Después de incubar, se
elimina la mezcla de reacción, se lavan los pocillos para eliminar las
especies no unidas a la superficie y se llevan a cabo las medidas de
fluorescencia en la superficie de los pocillos.
Figura 5: Inmunoensayo heterogéneo competitivo con captura de
anticuerpo utilizando como marcador SiO2NPs dopadas con azul nilo
unidas a anticuerpos anti‐proteínas de soja.
Las medidas se realizaron a λex 620 y λem 680 nm, obteniéndose un
intervalo lineal de 0,1 – 10 mg/L y un límite de detección de 0,05 mg/L, el
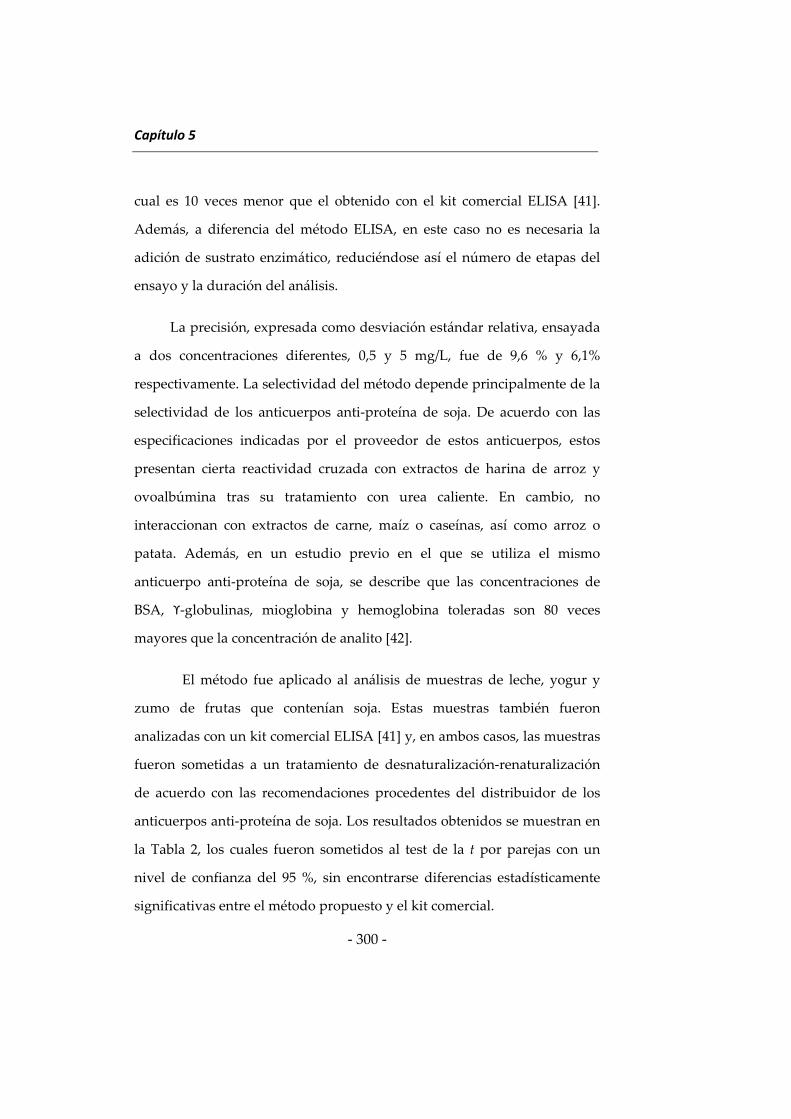
Capítulo 5
‐ 300 ‐
cual es 10 veces menor que el obtenido con el kit comercial ELISA [41].
Además, a diferencia del método ELISA, en este caso no es necesaria la
adición de sustrato enzimático, reduciéndose así el número de etapas del
ensayo y la duración del análisis.
La precisión, expresada como desviación estándar relativa, ensayada
a dos concentraciones diferentes, 0,5 y 5 mg/L, fue de 9,6 % y 6,1%
respectivamente. La selectividad del método depende principalmente de la
selectividad de los anticuerpos anti‐proteína de soja. De acuerdo con las
especificaciones indicadas por el proveedor de estos anticuerpos, estos
presentan cierta reactividad cruzada con extractos de harina de arroz y
ovoalbúmina tras su tratamiento con urea caliente. En cambio, no
interaccionan con extractos de carne, maíz o caseínas, así como arroz o
patata. Además, en un estudio previo en el que se utiliza el mismo
anticuerpo anti‐proteína de soja, se describe que las concentraciones de
BSA, ϒ‐globulinas, mioglobina y hemoglobina toleradas son 80 veces
mayores que la concentración de analito [42].
El método fue aplicado al análisis de muestras de leche, yogur y
zumo de frutas que contenían soja. Estas muestras también fueron
analizadas con un kit comercial ELISA [41] y, en ambos casos, las muestras
fueron sometidas a un tratamiento de desnaturalización‐renaturalización
de acuerdo con las recomendaciones procedentes del distribuidor de los
anticuerpos anti‐proteína de soja. Los resultados obtenidos se muestran en
la Tabla 2, los cuales fueron sometidos al test de la t por parejas con un
nivel de confianza del 95 %, sin encontrarse diferencias estadísticamente
significativas entre el método propuesto y el kit comercial.
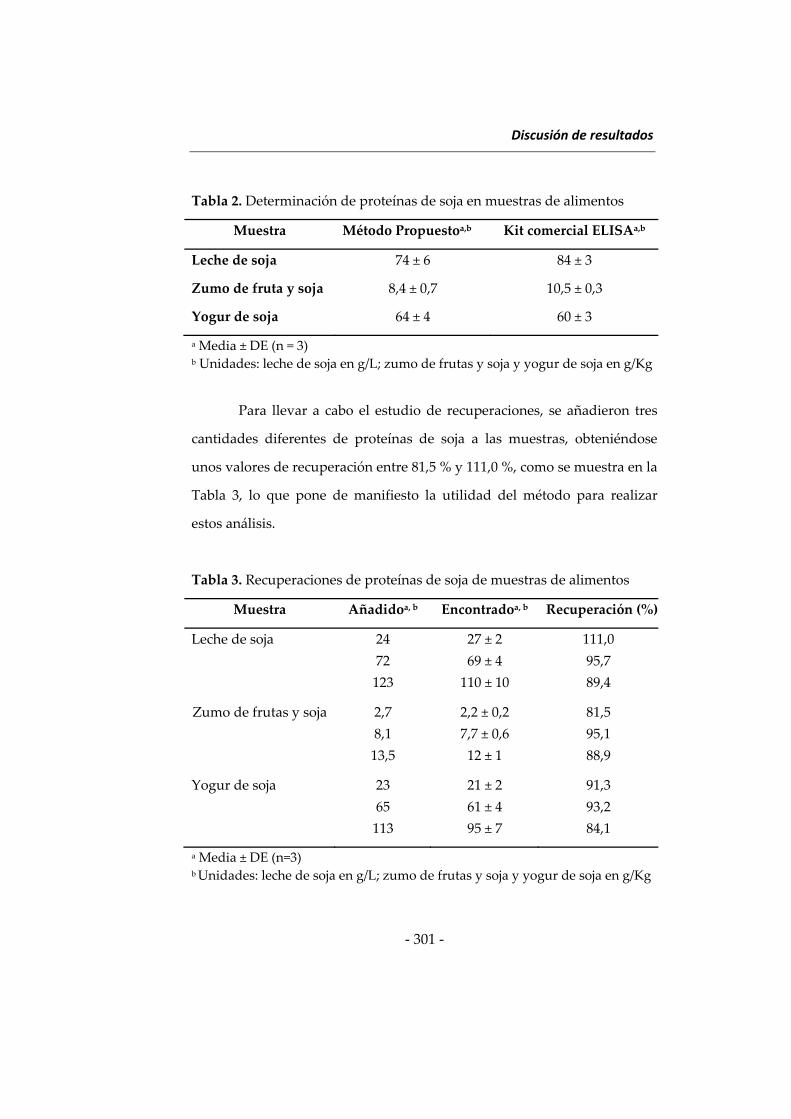
Discusión de resultados
‐ 301 ‐
Tabla 2. Determinación de proteínas de soja en muestras de alimentos
Muestra Método Propuestoa,b Kit comercial ELISAa,b
Leche de soja 74 ± 6 84 ± 3
Zumo de fruta y soja 8,4 ± 0,7 10,5 ± 0,3
Yogur de soja 64 ± 4 60 ± 3
a Media ± DE (n = 3) b Unidades: leche de soja en g/L; zumo de frutas y soja y yogur de soja en g/Kg
Para llevar a cabo el estudio de recuperaciones, se añadieron tres
cantidades diferentes de proteínas de soja a las muestras, obteniéndose
unos valores de recuperación entre 81,5 % y 111,0 %, como se muestra en la
Tabla 3, lo que pone de manifiesto la utilidad del método para realizar
estos análisis.
Tabla 3. Recuperaciones de proteínas de soja de muestras de alimentos
Muestra Añadidoa, b Encontradoa, b Recuperación (%)
Leche de soja 24 27 ± 2 111,0
72 69 ± 4 95,7
123 110 ± 10 89,4
Zumo de frutas y soja 2,7 2,2 ± 0,2 81,5
8,1 7,7 ± 0,6 95,1
13,5 12 ± 1 88,9
Yogur de soja 23 21 ± 2 91,3
65 61 ± 4 93,2
113 95 ± 7 84,1
a Media ± DE (n=3) b Unidades: leche de soja en g/L; zumo de frutas y soja y yogur de soja en g/Kg
Capítulo 5
‐ 302 ‐
Determinación de monensín en muestras de leche mediante
inmunoensayo heterogéneo.
El monensín es un antibiótico de uso veterinario con actividad
antibacteriana y coccidiostática, usado tradicionalmente para prevenir la
coccidiosis en pollos [43]. Este antibiótico es utilizado también como
promotor del crecimiento, ya que previene enfermedades que retrasan el
crecimiento de los pollos como diarreas hemorrágicas y pérdidas de peso
asociadas. Aunque el uso de promotores del crecimiento comenzó a
prohibirse a partir de 2006, algunos de estos aún pueden ser administrados
bajo regulación de la Unión Europea [44]. Además, el tratamiento con
monensín ha sido ampliado por la Unión Europea a terneros,
estableciéndose límites máximos de residuo para este antibiótico.
La preocupación por la seguridad alimentaria ha llevado a buscar y
desarrollar nuevos métodos analíticos de “screening” y confirmatorios
para detectar la presencia de residuos de antibióticos en alimentos, los
cuales, al llegar al consumidor, pueden dar lugar a un incremento de la
resistencia bacteriana a antibióticos.
En esta Memoria se ha presentado un método que constituye el
primer inmunoensayo para la determinación de monensín utilizando
SiO2NPs dopadas con azul nilo para formar el marcador. Se ha demostrado
su utilidad para mejorar las características analíticas, tales como el límite
de detección, respecto a los inmunoensayos descritos anteriormente para la
determinación de este fármaco utilizando marcadores enzimáticos [22, 45 –
48].
Discusión de resultados
‐ 303 ‐
Como se ha indicado anteriormente, el uso de SiO2NPs dopadas
con azul nilo puede mejorar los límites de detección gracias a la
selectividad espectral que presentan los LWFs ya que se minimiza la señal
de fondo procedente de la matriz de la muestra. Además, la excelente
estabilidad del fluoróforo encapsulado en las NPs frente a agentes
ambientales y a la radiación excitante, evitando su fotodescomposición, así
como la estabilidad temporal de estas NPs dopadas, justifican la utilización
de este nanomaterial para formar marcadores y aplicarlos en
inmunoensayos. Otra ventaja del método propuesto es el uso de
microplacas con pocillos de 100 μL, a diferencia de las microplacas
tradicionales con pocillos de 300 μL. De esta manera, se reducen los
volúmenes de reactivos utilizados durante el desarrollo del método,
disminuyéndose así el coste total del inmunoensayo y los volúmenes de
residuos generados. Se utilizan este tipo de placas ya que las medidas se
realizan en superficie sólida y el fondo de estos pocillos está a una mayor
altura que en las placas tradicionales, de forma que la distancia entre la
superficie sólida y el detector disminuye, minimizando pérdidas de señal
luminiscente y mejorando la sensibilidad.
Al igual que en el apartado anterior, se estudiaron dos posibles
formatos competitivos para este inmunoensayo heterogéneo, con captura
de anticuerpo y con captura de analito. El primero de ellos se basó en la
inmovilización en la microplaca de un conjugado BSA‐monensín y un
marcador formado por NPs sobre las que se inmovilizó el anticuerpo anti‐
monensín. En cambio, el segundo formato necesitó un marcador formado
por NPs‐monensín, sintetizado via carbodiimida usando EDAC
Capítulo 5
‐ 304 ‐
(clorhidrato de N‐(3‐dimetilaminopropil)‐N´‐etilcarbodiimida), la
inmovilización del anticuerpo anti‐IgG de oveja sobre los pocillos y la
posterior unión del anticuerpo anti‐monensín sobre esta superficie sólida.
En ambos ensayos se obtuvo una diferencia apreciable entre los valores de
intensidad de fluorescencia obtenidos en ausencia y en presencia (0,2 μg/L)
de monensín. Sin embargo, esta diferencia de señal fue tres veces mayor
utilizando el formato de captura de anticuerpo, por lo que se seleccionó
este formato para la determinación de monensín en muestras de leche.
El método desarrollado presenta un intervalo lineal dinámico de
0,05 – 5 μg/L y unos límites de detección y cuantificación de 0,015 y 0,05
μg/L, respectivamente, que corresponden a 0,12 y 0,40 μg/Kg en muestras
de leche. Este último valor es 5 veces menor que el límite máximo de
residuo (MRL) establecido por la Comisión de Regulación de la Unión
Europea en la normativa 37/2010/EC en muestras de leche. Además, el
límite de detección es cuatro veces menor que el descrito en el kit ELISA
con detección quimioluminiscente [32]. La precisión, expresada como
desviación estándar relativa, fue ensayada a dos concentraciones de
monensín, 0,2 y 1 μg/L, obteniéndose unos porcentajes de 5,8 % y 4,0 %,
respectivamente.
El método se aplicó al análisis de muestras de leche entera, semi‐
desnatada y desnatada, realizando un tratamiento previo sencillo basado
en una etapa de desproteinización y la posterior evaporación del
disolvente. Para validar el método se llevó a cabo un estudio de
recuperaciones (Tabla 4), obteniendo valores entre 83,3 % y 107,5 %, lo que
demuestra su utilidad para el análisis de estas muestras.
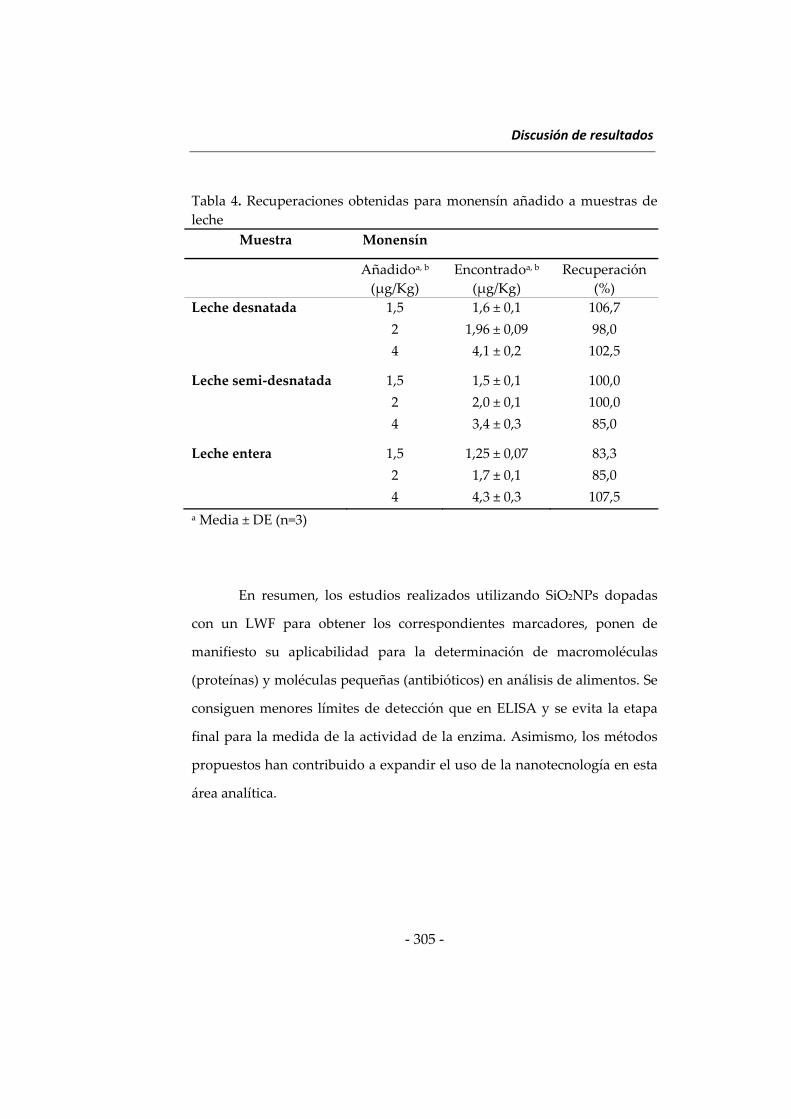
Discusión de resultados
‐ 305 ‐
Tabla 4. Recuperaciones obtenidas para monensín añadido a muestras de
leche
Muestra Monensín
Añadidoa, b
(μg/Kg)
Encontradoa, b
(μg/Kg)
Recuperación
(%)
Leche desnatada 1,5 1,6 ± 0,1 106,7
2 1,96 ± 0,09 98,0
4 4,1 ± 0,2 102,5
Leche semi‐desnatada 1,5 1,5 ± 0,1 100,0
2 2,0 ± 0,1 100,0
4 3,4 ± 0,3 85,0
Leche entera 1,5 1,25 ± 0,07 83,3
2 1,7 ± 0,1 85,0
4 4,3 ± 0,3 107,5
a Media ± DE (n=3)
En resumen, los estudios realizados utilizando SiO2NPs dopadas
con un LWF para obtener los correspondientes marcadores, ponen de
manifiesto su aplicabilidad para la determinación de macromoléculas
(proteínas) y moléculas pequeñas (antibióticos) en análisis de alimentos. Se
consiguen menores límites de detección que en ELISA y se evita la etapa
final para la medida de la actividad de la enzima. Asimismo, los métodos
propuestos han contribuido a expandir el uso de la nanotecnología en esta
área analítica.
Capítulo 5
‐ 306 ‐
2. Nuevas estrategias para la determinación de antioxidantes en
alimentos
Los procesos de oxidación que se producen en el organismo
implican la formación de radicales libres responsables del desarrollo de
algunas enfermedades, tales como enfermedades cardiovasculares,
Alzheimer y cáncer. Este fenómeno redox es producido por especies
reactivas de oxígeno (ROS), capaces de dañar las membranas celulares,
aunque este efecto puede ser reducido por la ingesta de compuestos
antioxidantes. La capacidad antioxidante de algunos alimentos viene dada
principalmente por la presencia de polifenoles, como los flavonoides, y de
las vitaminas C y E, entre otros [49].
En esta Memoria se ha desarrollado un método para la determinación
de la capacidad antioxidante de algunos alimentos, en el que se demuestra
la utilidad de medidas de fluorescencia a larga longitud de onda, y otro
método para la determinación de polifenoles en el que se propone el uso de
nanomateriales como activadores de la enzima laccasa. A continuación, se
discuten las características de estos métodos y su aplicabilidad.
Determinación fluorimétrica a larga longitud de onda de la
capacidad antioxidante de alimentos utilizando azul nilo como
reactivo
Desde el punto de vista analítico, existen dos tipos de métodos para
la determinación de la capacidad antioxidante de los alimentos. El primer
grupo implica reacciones de transferencia de electrones, las cuales pueden
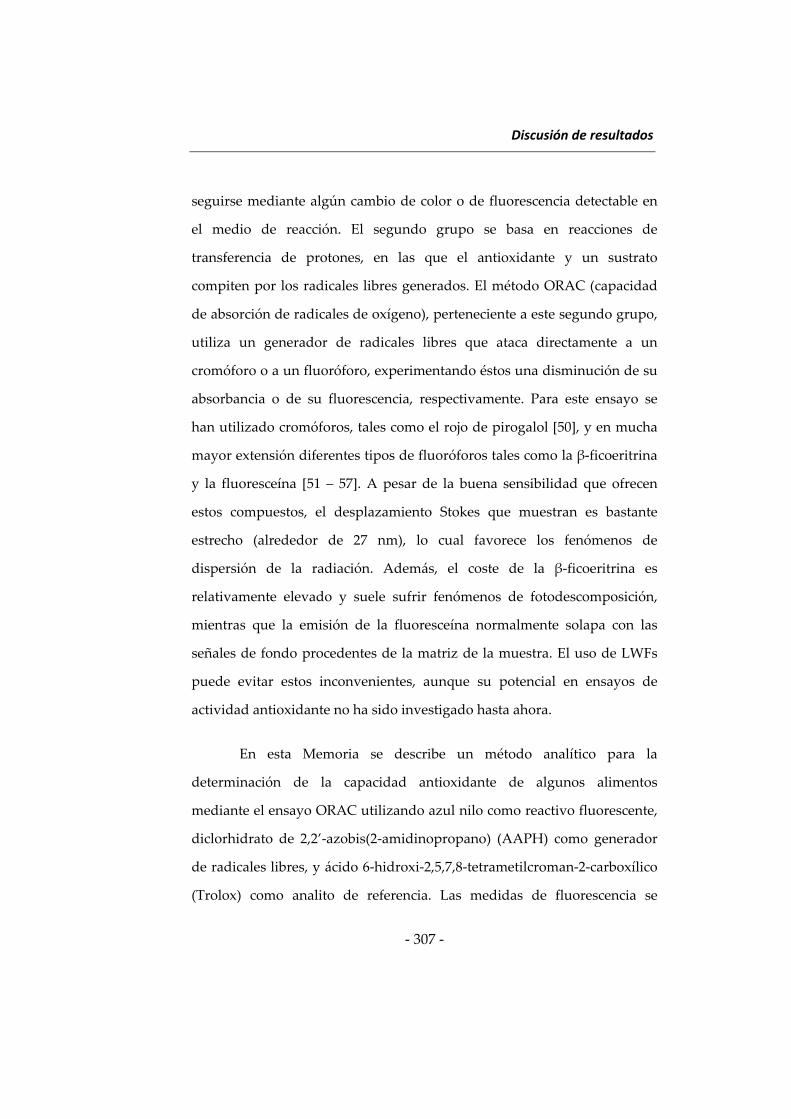
Discusión de resultados
‐ 307 ‐
seguirse mediante algún cambio de color o de fluorescencia detectable en
el medio de reacción. El segundo grupo se basa en reacciones de
transferencia de protones, en las que el antioxidante y un sustrato
compiten por los radicales libres generados. El método ORAC (capacidad
de absorción de radicales de oxígeno), perteneciente a este segundo grupo,
utiliza un generador de radicales libres que ataca directamente a un
cromóforo o a un fluoróforo, experimentando éstos una disminución de su
absorbancia o de su fluorescencia, respectivamente. Para este ensayo se
han utilizado cromóforos, tales como el rojo de pirogalol [50], y en mucha
mayor extensión diferentes tipos de fluoróforos tales como la β‐ficoeritrina
y la fluoresceína [51 – 57]. A pesar de la buena sensibilidad que ofrecen
estos compuestos, el desplazamiento Stokes que muestran es bastante
estrecho (alrededor de 27 nm), lo cual favorece los fenómenos de
dispersión de la radiación. Además, el coste de la β‐ficoeritrina es
relativamente elevado y suele sufrir fenómenos de fotodescomposición,
mientras que la emisión de la fluoresceína normalmente solapa con las
señales de fondo procedentes de la matriz de la muestra. El uso de LWFs
puede evitar estos inconvenientes, aunque su potencial en ensayos de
actividad antioxidante no ha sido investigado hasta ahora.
En esta Memoria se describe un método analítico para la
determinación de la capacidad antioxidante de algunos alimentos
mediante el ensayo ORAC utilizando azul nilo como reactivo fluorescente,
diclorhidrato de 2,2’‐azobis(2‐amidinopropano) (AAPH) como generador
de radicales libres, y ácido 6‐hidroxi‐2,5,7,8‐tetrametilcroman‐2‐carboxílico
(Trolox) como analito de referencia. Las medidas de fluorescencia se
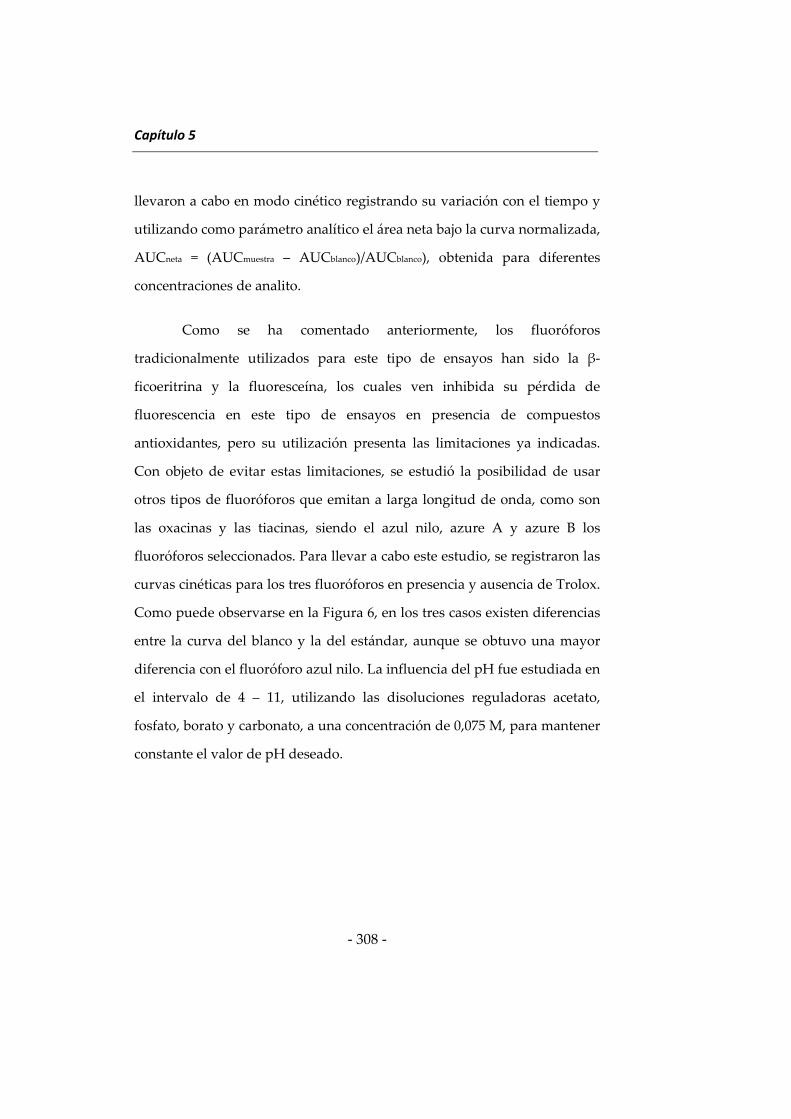
Capítulo 5
‐ 308 ‐
llevaron a cabo en modo cinético registrando su variación con el tiempo y
utilizando como parámetro analítico el área neta bajo la curva normalizada,
AUCneta = (AUCmuestra – AUCblanco)/AUCblanco), obtenida para diferentes
concentraciones de analito.
Como se ha comentado anteriormente, los fluoróforos
tradicionalmente utilizados para este tipo de ensayos han sido la β‐
ficoeritrina y la fluoresceína, los cuales ven inhibida su pérdida de
fluorescencia en este tipo de ensayos en presencia de compuestos
antioxidantes, pero su utilización presenta las limitaciones ya indicadas.
Con objeto de evitar estas limitaciones, se estudió la posibilidad de usar
otros tipos de fluoróforos que emitan a larga longitud de onda, como son
las oxacinas y las tiacinas, siendo el azul nilo, azure A y azure B los
fluoróforos seleccionados. Para llevar a cabo este estudio, se registraron las
curvas cinéticas para los tres fluoróforos en presencia y ausencia de Trolox.
Como puede observarse en la Figura 6, en los tres casos existen diferencias
entre la curva del blanco y la del estándar, aunque se obtuvo una mayor
diferencia con el fluoróforo azul nilo. La influencia del pH fue estudiada en
el intervalo de 4 – 11, utilizando las disoluciones reguladoras acetato,
fosfato, borato y carbonato, a una concentración de 0,075 M, para mantener
constante el valor de pH deseado.
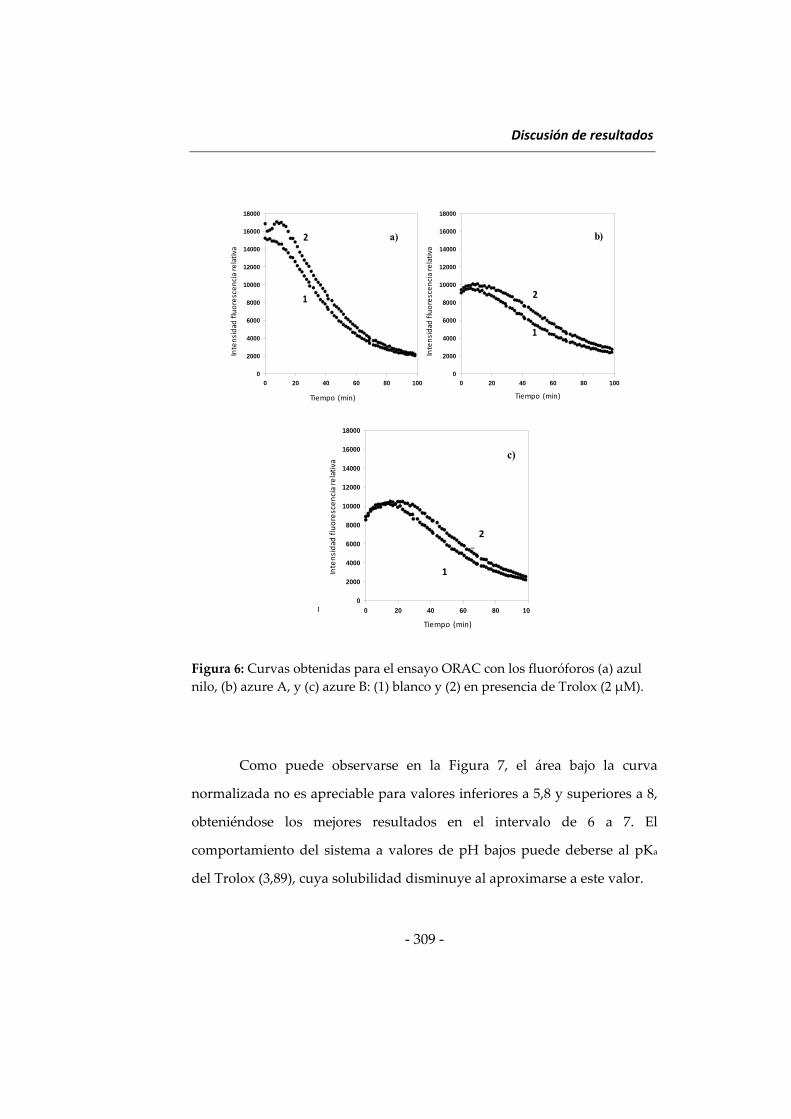
Discusión de resultados
‐ 309 ‐
Figura 6: Curvas obtenidas para el ensayo ORAC con los fluoróforos (a) azul
nilo, (b) azure A, y (c) azure B: (1) blanco y (2) en presencia de Trolox (2 μM).
Como puede observarse en la Figura 7, el área bajo la curva
normalizada no es apreciable para valores inferiores a 5,8 y superiores a 8,
obteniéndose los mejores resultados en el intervalo de 6 a 7. El
comportamiento del sistema a valores de pH bajos puede deberse al pKa
del Trolox (3,89), cuya solubilidad disminuye al aproximarse a este valor.
Time (min)
0 20 40 60 80 100
Rel
ativ
e fl
uo
resc
ence
inte
nsi
ty
0
2000
4000
6000
8000
10000
12000
14000
16000
18000
Time (min)
0 20 40 60 80 100
Rel
ativ
e fl
uo
resc
ence
inte
nsi
ty
0
2000
4000
6000
8000
10000
12000
14000
16000
18000
a) b)
Time (min)
0 20 40 60 80 100
Rel
ativ
e fl
uo
resc
ence
inte
nsi
ty
0
2000
4000
6000
8000
10000
12000
14000
16000
18000
Time (min)
0 20 40 60 80 100
Rel
ativ
e fl
uo
resc
ence
inte
nsi
ty
0
2000
4000
6000
8000
10000
12000
14000
16000
18000
a) b)
1
2
1
2
Intensidad
fluorescencia relativa
Intensidad
fluorescencia relativa
Tiempo (min) Tiempo (min)
Time (min)
0 20 40 60 80 10
Re
lati
ve f
luo
res
cen
ce
inte
ns
ity
0
2000
4000
6000
8000
10000
12000
14000
16000
18000
0
c)
Time (min)
0 20 40 60 80 10
Re
lati
ve f
luo
res
cen
ce
inte
ns
ity
0
2000
4000
6000
8000
10000
12000
14000
16000
18000
0
c)
1
2
Intensidad
fluorescencia relativa
Tiempo (min)
2
1
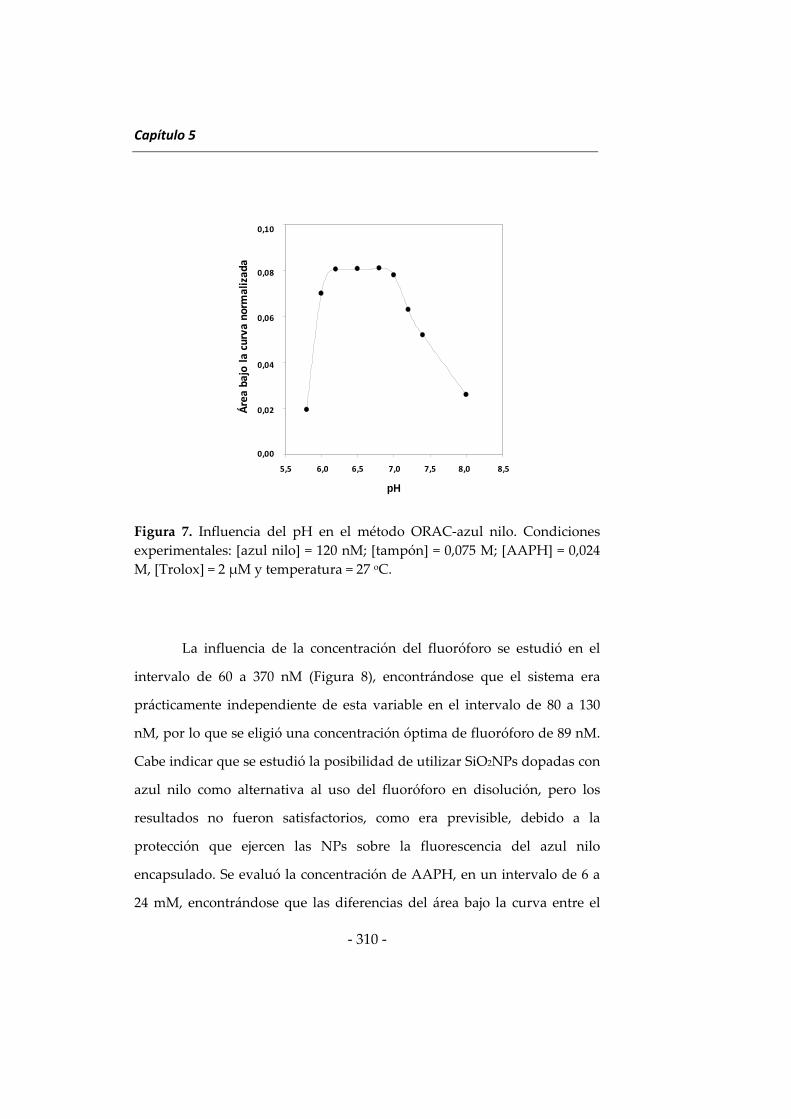
Capítulo 5
‐ 310 ‐
Figura 7. Influencia del pH en el método ORAC‐azul nilo. Condiciones
experimentales: [azul nilo] = 120 nM; [tampón] = 0,075 M; [AAPH] = 0,024
M, [Trolox] = 2 μM y temperatura = 27 oC.
La influencia de la concentración del fluoróforo se estudió en el
intervalo de 60 a 370 nM (Figura 8), encontrándose que el sistema era
prácticamente independiente de esta variable en el intervalo de 80 a 130
nM, por lo que se eligió una concentración óptima de fluoróforo de 89 nM.
Cabe indicar que se estudió la posibilidad de utilizar SiO2NPs dopadas con
azul nilo como alternativa al uso del fluoróforo en disolución, pero los
resultados no fueron satisfactorios, como era previsible, debido a la
protección que ejercen las NPs sobre la fluorescencia del azul nilo
encapsulado. Se evaluó la concentración de AAPH, en un intervalo de 6 a
24 mM, encontrándose que las diferencias del área bajo la curva entre el
pH
5.5 6.0 6.5 7.0 7.5 8.0 8.5
AU
C
0.00
0.02
0.04
0.06
0.08
0.10
A)
pH
5.5 6.0 6.5 7.0 7.5 8.0 8.5
AU
C
0.00
0.02
0.04
0.06
0.08
0.10
A)A)0,10
0,08
0,06
0,04
0,02
0,00
5,5 6,0 6,5 7,0 7,5 8,0 8,5
Área bajo la curva norm
alizada
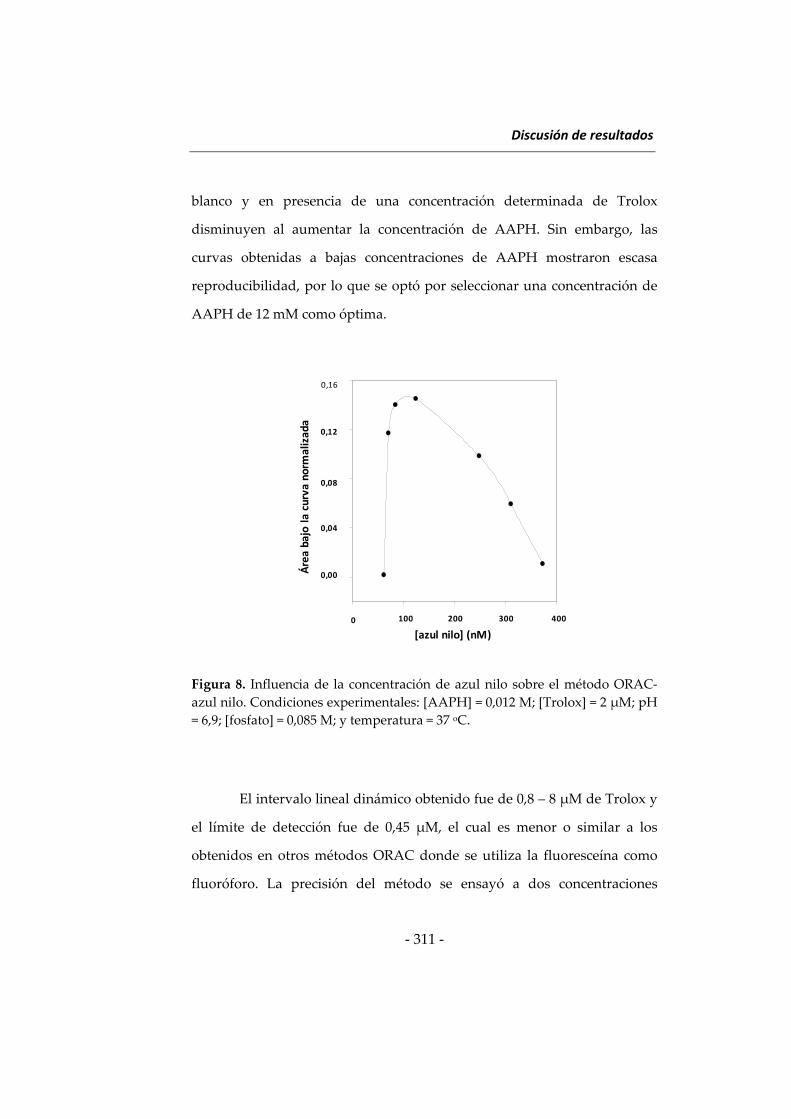
Discusión de resultados
‐ 311 ‐
blanco y en presencia de una concentración determinada de Trolox
disminuyen al aumentar la concentración de AAPH. Sin embargo, las
curvas obtenidas a bajas concentraciones de AAPH mostraron escasa
reproducibilidad, por lo que se optó por seleccionar una concentración de
AAPH de 12 mM como óptima.
Figura 8. Influencia de la concentración de azul nilo sobre el método ORAC‐
azul nilo. Condiciones experimentales: [AAPH] = 0,012 M; [Trolox] = 2 μM; pH
= 6,9; [fosfato] = 0,085 M; y temperatura = 37 oC.
El intervalo lineal dinámico obtenido fue de 0,8 – 8 μM de Trolox y
el límite de detección fue de 0,45 μM, el cual es menor o similar a los
obtenidos en otros métodos ORAC donde se utiliza la fluoresceína como
fluoróforo. La precisión del método se ensayó a dos concentraciones
[NB], nM
0 100 200 300 400
AU
C
0.00
0.04
0.08
0.12
0.16
B)
[NB], nM
0 100 200 300 400
AU
C
0.00
0.04
0.08
0.12
0.16
B)B)0,16
0,12
0,08
0,04
0,00
0 100 200 300 400
[azul nilo] (nM)
Área bajo la curva norm
alizada
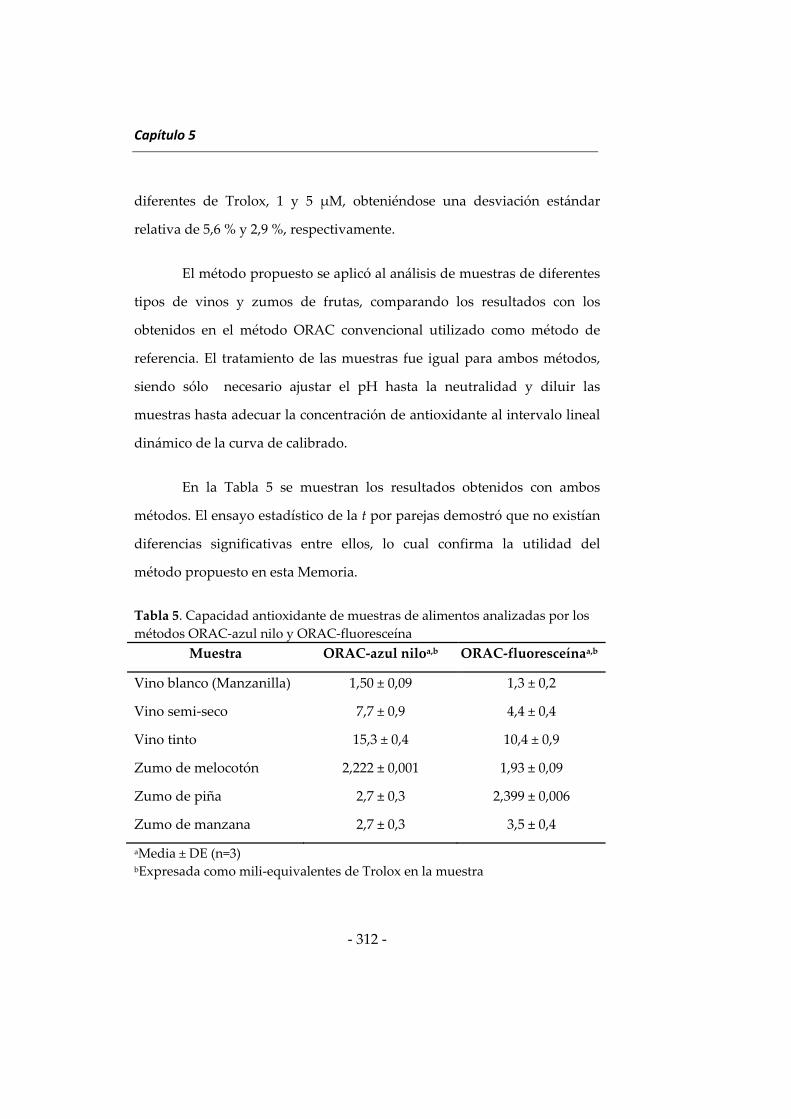
Capítulo 5
‐ 312 ‐
diferentes de Trolox, 1 y 5 μM, obteniéndose una desviación estándar
relativa de 5,6 % y 2,9 %, respectivamente.
El método propuesto se aplicó al análisis de muestras de diferentes
tipos de vinos y zumos de frutas, comparando los resultados con los
obtenidos en el método ORAC convencional utilizado como método de
referencia. El tratamiento de las muestras fue igual para ambos métodos,
siendo sólo necesario ajustar el pH hasta la neutralidad y diluir las
muestras hasta adecuar la concentración de antioxidante al intervalo lineal
dinámico de la curva de calibrado.
En la Tabla 5 se muestran los resultados obtenidos con ambos
métodos. El ensayo estadístico de la t por parejas demostró que no existían
diferencias significativas entre ellos, lo cual confirma la utilidad del
método propuesto en esta Memoria.
Tabla 5. Capacidad antioxidante de muestras de alimentos analizadas por los
métodos ORAC‐azul nilo y ORAC‐fluoresceína
Muestra ORAC‐azul niloa,b ORAC‐fluoresceínaa,b
Vino blanco (Manzanilla) 1,50 ± 0,09 1,3 ± 0,2
Vino semi‐seco 7,7 ± 0,9 4,4 ± 0,4
Vino tinto 15,3 ± 0,4 10,4 ± 0,9
Zumo de melocotón 2,222 ± 0,001 1,93 ± 0,09
Zumo de piña 2,7 ± 0,3 2,399 ± 0,006
Zumo de manzana 2,7 ± 0,3 3,5 ± 0,4
aMedia ± DE (n=3) bExpresada como mili‐equivalentes de Trolox en la muestra
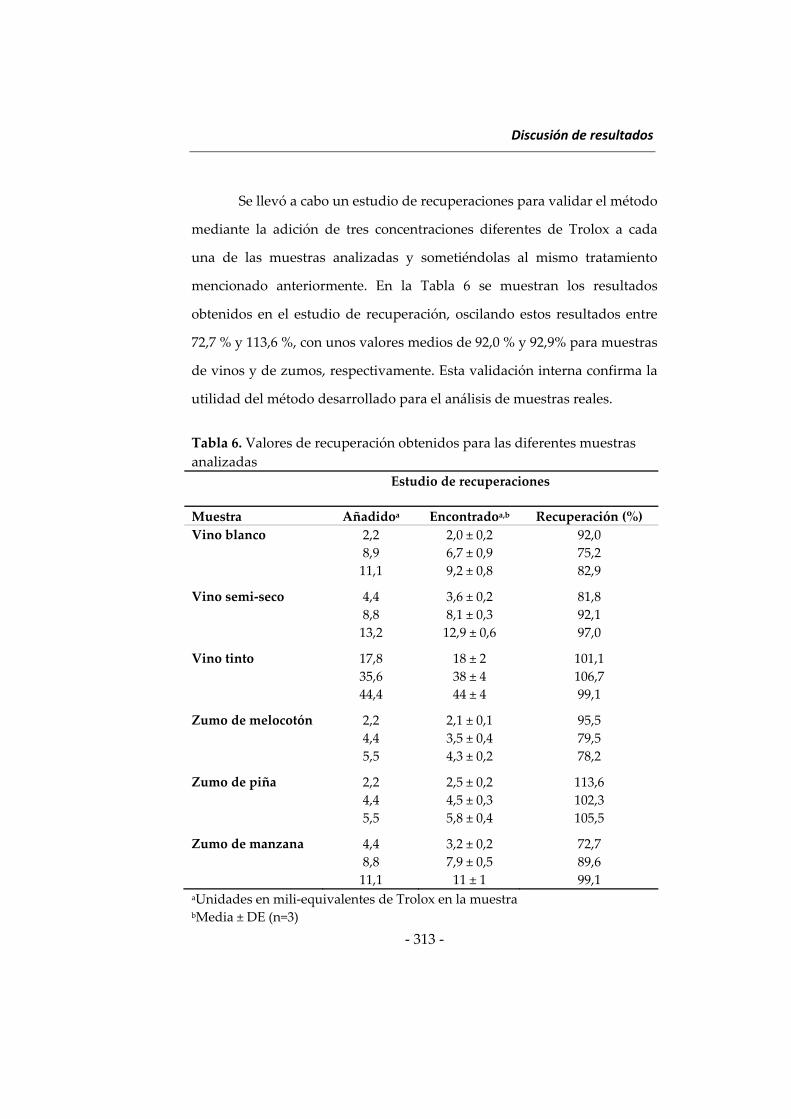
Discusión de resultados
‐ 313 ‐
Se llevó a cabo un estudio de recuperaciones para validar el método
mediante la adición de tres concentraciones diferentes de Trolox a cada
una de las muestras analizadas y sometiéndolas al mismo tratamiento
mencionado anteriormente. En la Tabla 6 se muestran los resultados
obtenidos en el estudio de recuperación, oscilando estos resultados entre
72,7 % y 113,6 %, con unos valores medios de 92,0 % y 92,9% para muestras
de vinos y de zumos, respectivamente. Esta validación interna confirma la
utilidad del método desarrollado para el análisis de muestras reales.
Tabla 6. Valores de recuperación obtenidos para las diferentes muestras
analizadas
Estudio de recuperaciones
Muestra Añadidoa Encontradoa,b Recuperación (%)
Vino blanco 2,2
8,9
11,1
2,0 ± 0,2
6,7 ± 0,9
9,2 ± 0,8
92,0
75,2
82,9
Vino semi‐seco 4,4
8,8
13,2
3,6 ± 0,2
8,1 ± 0,3
12,9 ± 0,6
81,8
92,1
97,0
Vino tinto 17,8
35,6
44,4
18 ± 2
38 ± 4
44 ± 4
101,1
106,7
99,1
Zumo de melocotón 2,2
4,4
5,5
2,1 ± 0,1
3,5 ± 0,4
4,3 ± 0,2
95,5
79,5
78,2
Zumo de piña 2,2
4,4
5,5
2,5 ± 0,2
4,5 ± 0,3
5,8 ± 0,4
113,6
102,3
105,5
Zumo de manzana 4,4
8,8
11,1
3,2 ± 0,2
7,9 ± 0,5
11 ± 1
72,7
89,6
99,1 aUnidades en mili‐equivalentes de Trolox en la muestra bMedia ± DE (n=3)
Capítulo 5
‐ 314 ‐
Los resultados obtenidos muestran la utilidad de la fluorescencia a
larga longitud de onda para la determinación de la capacidad antioxidante
de alimentos utilizando el fluoróforo azul nilo. El uso de este reactivo en
lugar de otros fluoróforos previamente utilizados con este propósito, como
son la fluoresceína y la β‐ficoeritrina, supone una alternativa para reducir
posibles señales de fondo procedentes de la matriz de la muestra, las cuales
pueden aparecer al excitar a longitudes de onda más cortas. Además, el
relativamente ancho desplazamiento Stokes que presenta el azul nilo
minimiza los efectos de dispersión de la radiación, muy comunes al usar
fluoróforos con desplazamientos Stokes relativamente estrechos. Por
último, la pérdida de fluorescencia debida a la fotodescomposición del azul
nilo es menor que en el caso de la β‐ficoeritrina, siendo también su coste
inferior.
Determinación automática de polifenoles en vinos utilizando
laccasa y nanopartículas de óxido de terbio
Los polifenoles constituyen un importante grupo de compuestos
antioxidantes naturales presentes en alimentos que, tras numerosos
estudios clínicos, han mostrado su eficacia para la prevención de algunas
enfermedades crónicas. Como se ha descrito en el apartado anterior, se ha
desarrollado una gran diversidad de métodos analíticos cromatográficos
[58, 59] y electroforéticos [60, 61] para la determinación de estos
antioxidantes naturales. Sin embargo, debido al elevado número de
compuestos fenólicos que pueden encontrarse en muestras alimenticias, es
frecuente el uso de métodos analíticos que determinan el contenido
Discusión de resultados
‐ 315 ‐
fenólico total así como la capacidad antioxidante total. Estos parámetros
han sido ampliamente determinados mediante métodos fotométricos o
fluorimétricos haciendo uso de generadores de radicales libres o bien
reacciones enzimáticas, que compiten con los antioxidantes con el fin de
inhibir la pérdida de fluorescencia o absorbancia que tendría lugar en
ausencia de los mismos [56, 62 – 67].
La laccasa es una enzima feniloxidasa que ha sido utilizada para la
determinación del contenido fenólico total y la capacidad antioxidante,
utilizando diferentes condiciones experimentales. Como ya se ha
comentado anteriormente en esta Memoria, esta enzima cataliza la
oxidación de compuestos fenólicos a quinonas o radicales mediante
reducción del oxígeno disuelto en el medio, lo cual ha sido utilizado para el
desarrollo de sensores amperómetricos [68 – 70] así como métodos con
detección fotométrica [71 – 73] y fluorimétrica [74].
En esta Memoria se muestra la utilidad analítica del uso combinado
de nanopartículas de óxido de terbio (Tb4O7NPs), laccasa, y el fluoróforo 8‐
hidroxipireno‐1,3,6‐trisulfonato trisódico (HPTS) para la determinación de
polifenoles en muestras de vino. Al igual que en el método expuesto en el
apartado anterior, las medidas de fluorescencia se llevaron a cabo en modo
cinético registrando su variación con el tiempo y utilizando como
parámetro analítico el área bajo las curvas obtenidas a diferentes
concentraciones de ácido gálico, utilizado como estándar de calibración.
En primer lugar, se investigó el comportamiento de diversos
fluoróforos como posibles sustratos de la laccasa. Con tal fin se ensayó la
capacidad de Styryl 7, 2‐Di‐1‐ASP, azure B, azul de toluidina, azul nilo,
fluoresceína y HPTS para competir con los compuestos fenólicos por los
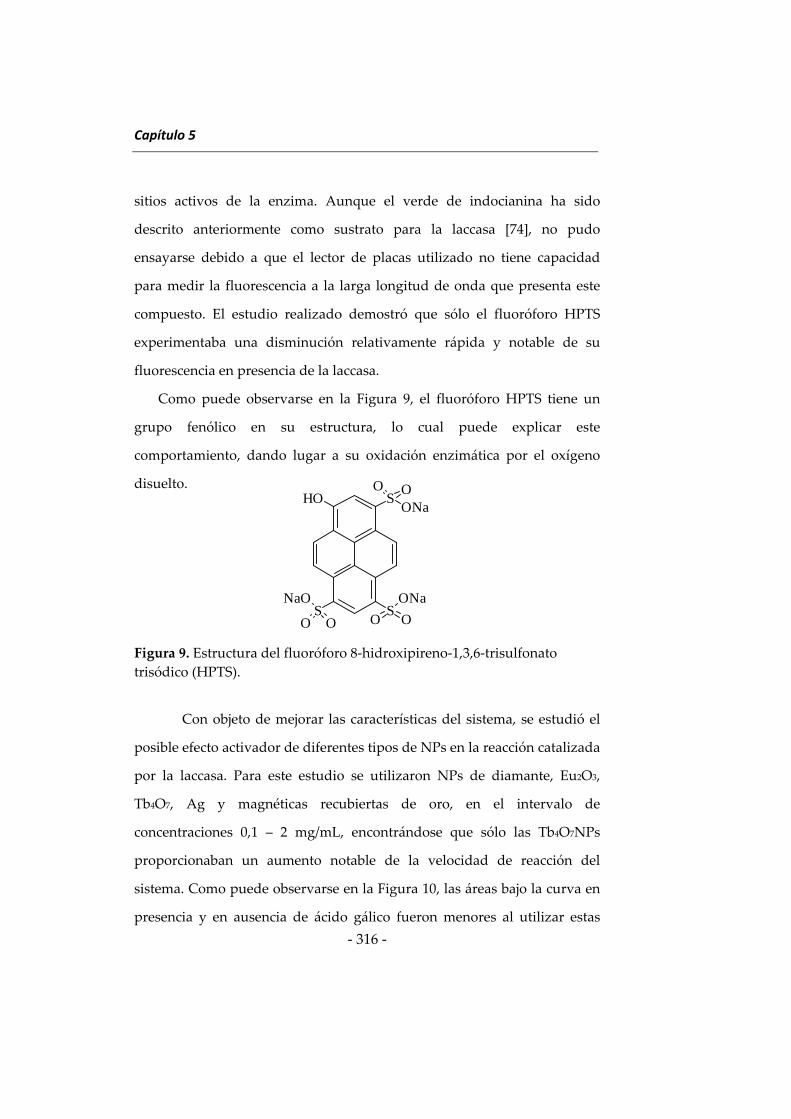
Capítulo 5
‐ 316 ‐
sitios activos de la enzima. Aunque el verde de indocianina ha sido
descrito anteriormente como sustrato para la laccasa [74], no pudo
ensayarse debido a que el lector de placas utilizado no tiene capacidad
para medir la fluorescencia a la larga longitud de onda que presenta este
compuesto. El estudio realizado demostró que sólo el fluoróforo HPTS
experimentaba una disminución relativamente rápida y notable de su
fluorescencia en presencia de la laccasa.
Como puede observarse en la Figura 9, el fluoróforo HPTS tiene un
grupo fenólico en su estructura, lo cual puede explicar este
comportamiento, dando lugar a su oxidación enzimática por el oxígeno
disuelto.
Figura 9. Estructura del fluoróforo 8‐hidroxipireno‐1,3,6‐trisulfonato
trisódico (HPTS).
Con objeto de mejorar las características del sistema, se estudió el
posible efecto activador de diferentes tipos de NPs en la reacción catalizada
por la laccasa. Para este estudio se utilizaron NPs de diamante, Eu2O3,
Tb4O7, Ag y magnéticas recubiertas de oro, en el intervalo de
concentraciones 0,1 – 2 mg/mL, encontrándose que sólo las Tb4O7NPs
proporcionaban un aumento notable de la velocidad de reacción del
sistema. Como puede observarse en la Figura 10, las áreas bajo la curva en
presencia y en ausencia de ácido gálico fueron menores al utilizar estas
SHO
S S
O OONa
ONa
OO
NaO
O O
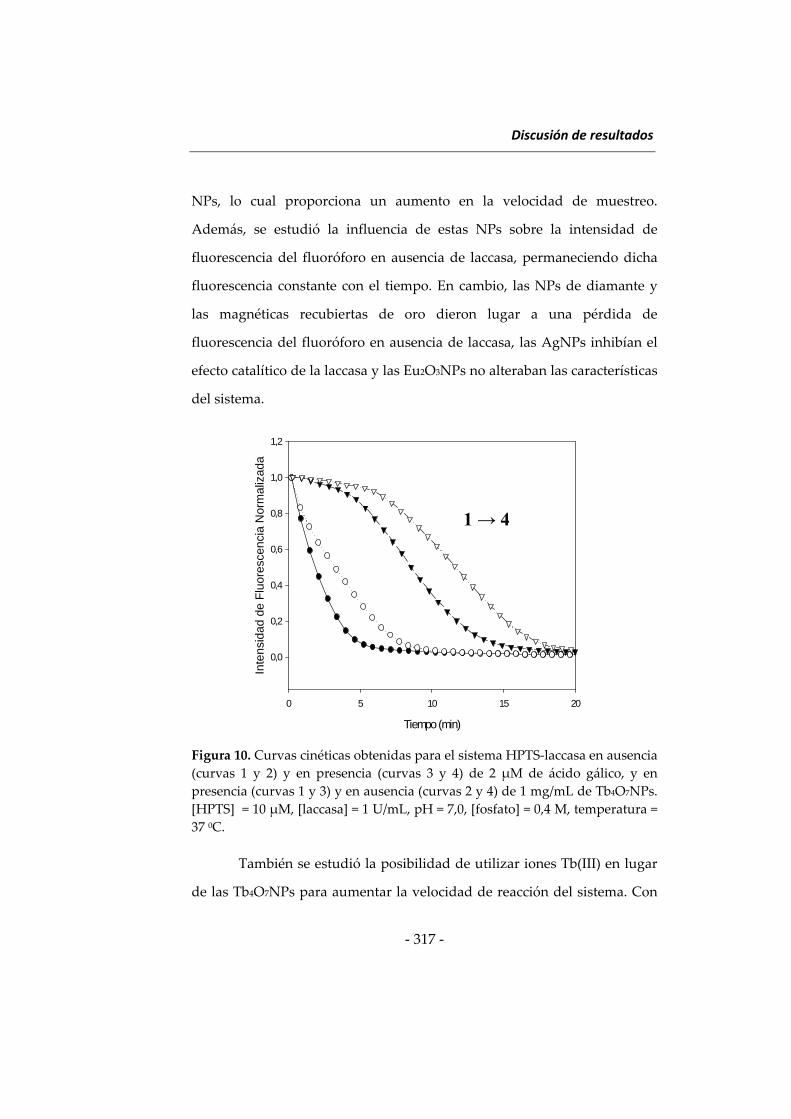
Discusión de resultados
‐ 317 ‐
NPs, lo cual proporciona un aumento en la velocidad de muestreo.
Además, se estudió la influencia de estas NPs sobre la intensidad de
fluorescencia del fluoróforo en ausencia de laccasa, permaneciendo dicha
fluorescencia constante con el tiempo. En cambio, las NPs de diamante y
las magnéticas recubiertas de oro dieron lugar a una pérdida de
fluorescencia del fluoróforo en ausencia de laccasa, las AgNPs inhibían el
efecto catalítico de la laccasa y las Eu2O3NPs no alteraban las características
del sistema.
Figura 10. Curvas cinéticas obtenidas para el sistema HPTS‐laccasa en ausencia
(curvas 1 y 2) y en presencia (curvas 3 y 4) de 2 μM de ácido gálico, y en
presencia (curvas 1 y 3) y en ausencia (curvas 2 y 4) de 1 mg/mL de Tb4O7NPs.
[HPTS] = 10 μM, [laccasa] = 1 U/mL, pH = 7,0, [fosfato] = 0,4 M, temperatura =
37 0C.
También se estudió la posibilidad de utilizar iones Tb(III) en lugar
de las Tb4O7NPs para aumentar la velocidad de reacción del sistema. Con
Tiempo (min)
0 5 10 15 20
Inte
nsi
dad
de
Flu
ores
cen
cia
Nor
mal
iza
da
0,0
0,2
0,4
0,6
0,8
1,0
1,2
1 → 4
Capítulo 5
‐ 318 ‐
este fin se utilizaron concentraciones equivalentes de Tb(III) a las utilizadas
en forma de NPs, obteniéndose áreas bajo la curva netas menores, lo cual
ratifica la utilidad de estas Tb4O7NPs como activadoras en el sistema
enzimático.
Las variables implicadas en el sistema fueron optimizadas
mediante el método univariante utilizando el área bajo la curva neta (AUC)
como parámetro analítico. Sin embargo, fue necesario alcanzar una
solución de compromiso entre este parámetro y el tiempo necesario para
llevar a cabo la medida, con el fin de obtener una sensibilidad y una
duración del ensayo adecuadas.
La influencia del pH en el sistema se estudió entre 4,0 – 9,0
utilizando diferentes disoluciones reguladoras, obteniéndose que la
intensidad de fluorescencia prácticamente desaparecía a valores de pH
ácidos, mientras que dicha señal era muy elevada a pH 8,0 – 9,0, pero la
laccasa no presentaba actividad sobre el fluoróforo a estos valores de pH.
Sin embargo, a valores próximos a la neutralidad, 7,0 – 7,5, la intensidad de
fluorescencia del HPTS era bastante elevada y se inhibía en presencia de la
enzima. Por lo tanto, el valor de pH seleccionado para desarrollar el
método fue 7,0, utilizando una disolución de fosfato, de concentración 0,4
M, para ajustar el pH. El estudio de la influencia de la concentración de
HPTS en el sistema demostró que ésta era independiente de esta variable
en el intervalo de concentraciones 8 ‐ 12 μM, seleccionándose el valor
intermedio, 10 μM, como concentración óptima.
La actividad de la laccasa y la concentración de Tb4O7 NPs son dos
variables críticas que afectan notablemente al valor neto de AUC y a la
velocidad de reacción. Ambas variables fueron estudiadas en los intervalos
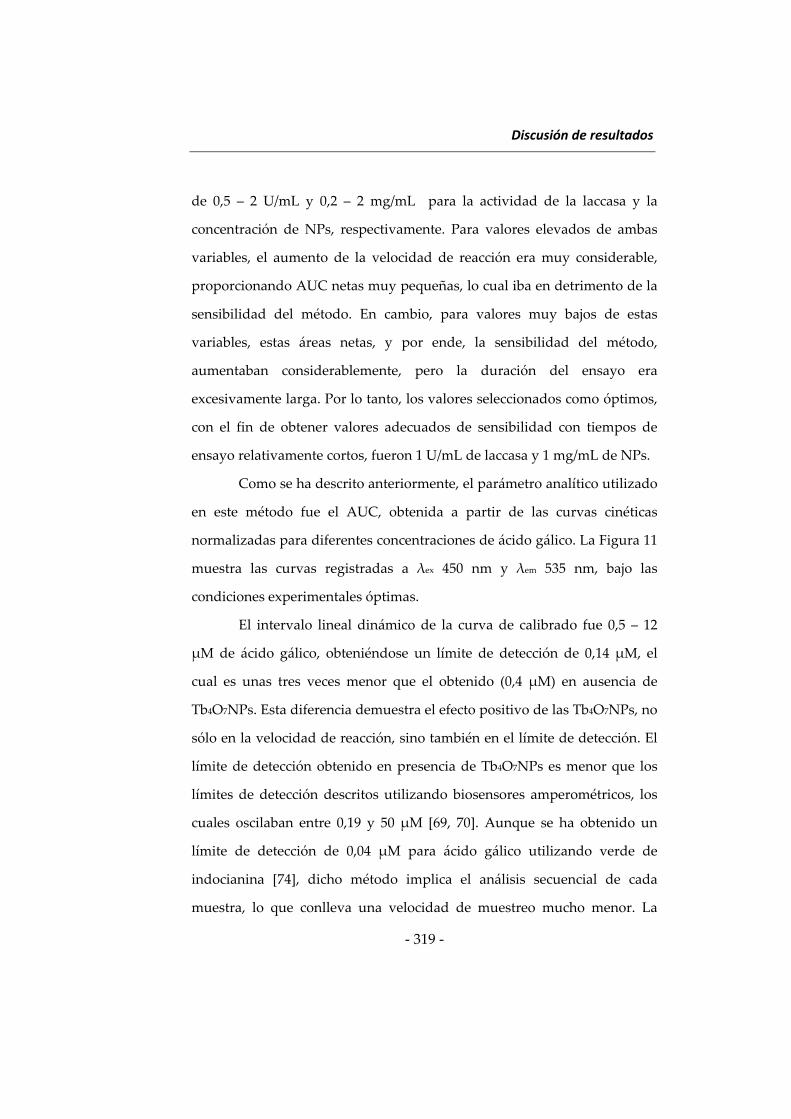
Discusión de resultados
‐ 319 ‐
de 0,5 – 2 U/mL y 0,2 – 2 mg/mL para la actividad de la laccasa y la
concentración de NPs, respectivamente. Para valores elevados de ambas
variables, el aumento de la velocidad de reacción era muy considerable,
proporcionando AUC netas muy pequeñas, lo cual iba en detrimento de la
sensibilidad del método. En cambio, para valores muy bajos de estas
variables, estas áreas netas, y por ende, la sensibilidad del método,
aumentaban considerablemente, pero la duración del ensayo era
excesivamente larga. Por lo tanto, los valores seleccionados como óptimos,
con el fin de obtener valores adecuados de sensibilidad con tiempos de
ensayo relativamente cortos, fueron 1 U/mL de laccasa y 1 mg/mL de NPs.
Como se ha descrito anteriormente, el parámetro analítico utilizado
en este método fue el AUC, obtenida a partir de las curvas cinéticas
normalizadas para diferentes concentraciones de ácido gálico. La Figura 11
muestra las curvas registradas a λex 450 nm y λem 535 nm, bajo las
condiciones experimentales óptimas.
El intervalo lineal dinámico de la curva de calibrado fue 0,5 – 12
μM de ácido gálico, obteniéndose un límite de detección de 0,14 μM, el
cual es unas tres veces menor que el obtenido (0,4 μM) en ausencia de
Tb4O7NPs. Esta diferencia demuestra el efecto positivo de las Tb4O7NPs, no
sólo en la velocidad de reacción, sino también en el límite de detección. El
límite de detección obtenido en presencia de Tb4O7NPs es menor que los
límites de detección descritos utilizando biosensores amperométricos, los
cuales oscilaban entre 0,19 y 50 μM [69, 70]. Aunque se ha obtenido un
límite de detección de 0,04 μM para ácido gálico utilizando verde de
indocianina [74], dicho método implica el análisis secuencial de cada
muestra, lo que conlleva una velocidad de muestreo mucho menor. La
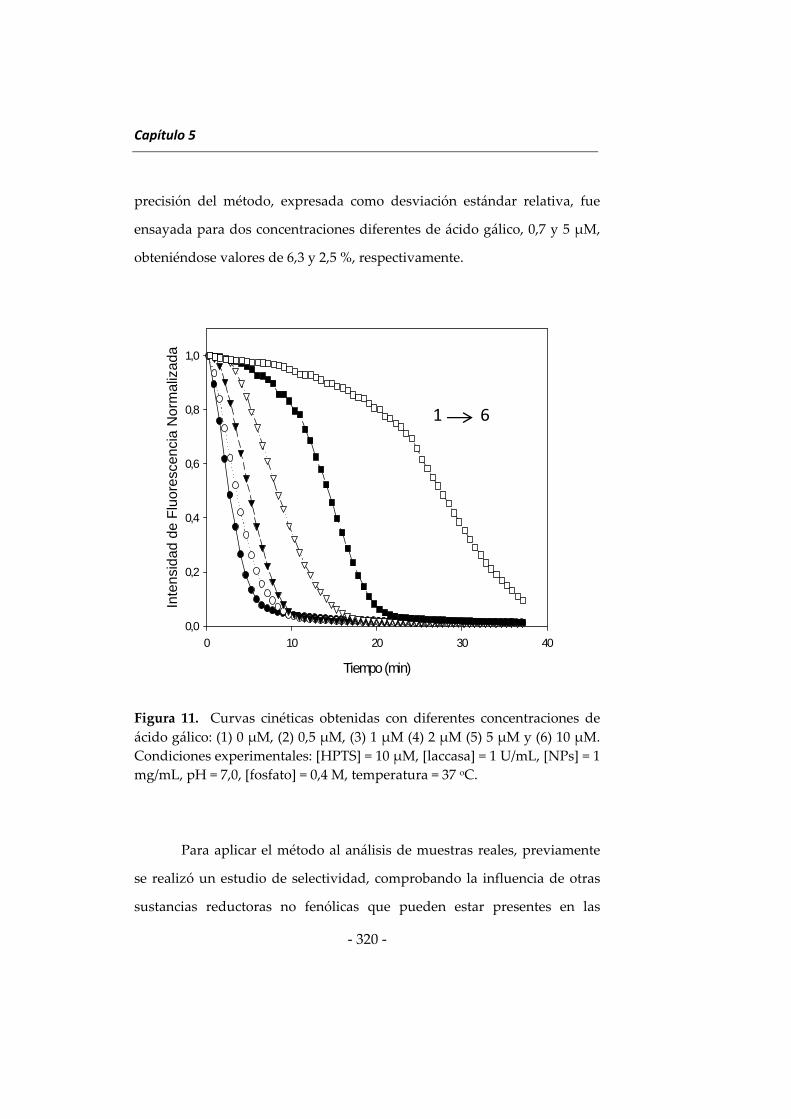
Capítulo 5
‐ 320 ‐
precisión del método, expresada como desviación estándar relativa, fue
ensayada para dos concentraciones diferentes de ácido gálico, 0,7 y 5 μM,
obteniéndose valores de 6,3 y 2,5 %, respectivamente.
Figura 11. Curvas cinéticas obtenidas con diferentes concentraciones de
ácido gálico: (1) 0 μM, (2) 0,5 μM, (3) 1 μM (4) 2 μM (5) 5 μM y (6) 10 μM.
Condiciones experimentales: [HPTS] = 10 μM, [laccasa] = 1 U/mL, [NPs] = 1
mg/mL, pH = 7,0, [fosfato] = 0,4 M, temperatura = 37 oC.
Para aplicar el método al análisis de muestras reales, previamente
se realizó un estudio de selectividad, comprobando la influencia de otras
sustancias reductoras no fenólicas que pueden estar presentes en las
Tiempo (min)
0 10 20 30 40
Inte
nsi
dad
de
Flu
ores
cenc
ia N
orm
aliz
ada
0,0
0,2
0,4
0,6
0,8
1,0
1 6
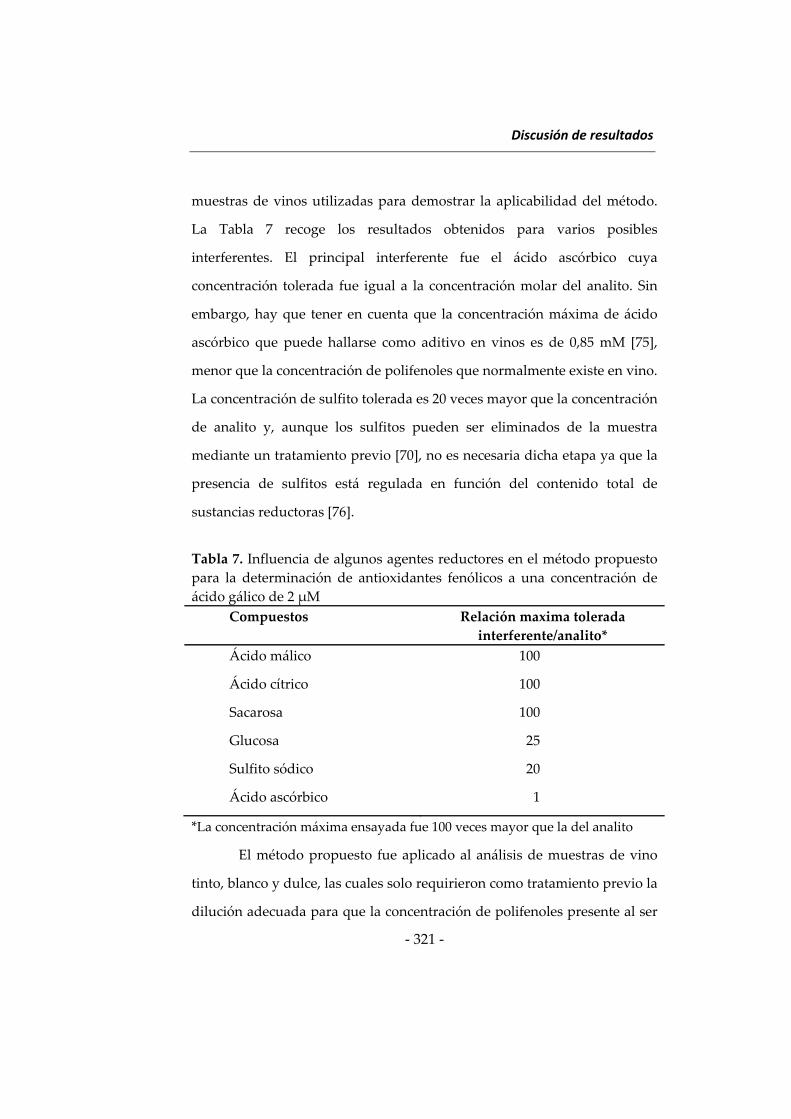
Discusión de resultados
‐ 321 ‐
muestras de vinos utilizadas para demostrar la aplicabilidad del método.
La Tabla 7 recoge los resultados obtenidos para varios posibles
interferentes. El principal interferente fue el ácido ascórbico cuya
concentración tolerada fue igual a la concentración molar del analito. Sin
embargo, hay que tener en cuenta que la concentración máxima de ácido
ascórbico que puede hallarse como aditivo en vinos es de 0,85 mM [75],
menor que la concentración de polifenoles que normalmente existe en vino.
La concentración de sulfito tolerada es 20 veces mayor que la concentración
de analito y, aunque los sulfitos pueden ser eliminados de la muestra
mediante un tratamiento previo [70], no es necesaria dicha etapa ya que la
presencia de sulfitos está regulada en función del contenido total de
sustancias reductoras [76].
Tabla 7. Influencia de algunos agentes reductores en el método propuesto
para la determinación de antioxidantes fenólicos a una concentración de
ácido gálico de 2 μM
Compuestos Relación maxima tolerada
interferente/analito*
Ácido málico 100
Ácido cítrico 100
Sacarosa 100
Glucosa 25
Sulfito sódico 20
Ácido ascórbico 1
*La concentración máxima ensayada fue 100 veces mayor que la del analito
El método propuesto fue aplicado al análisis de muestras de vino
tinto, blanco y dulce, las cuales solo requirieron como tratamiento previo la
dilución adecuada para que la concentración de polifenoles presente al ser
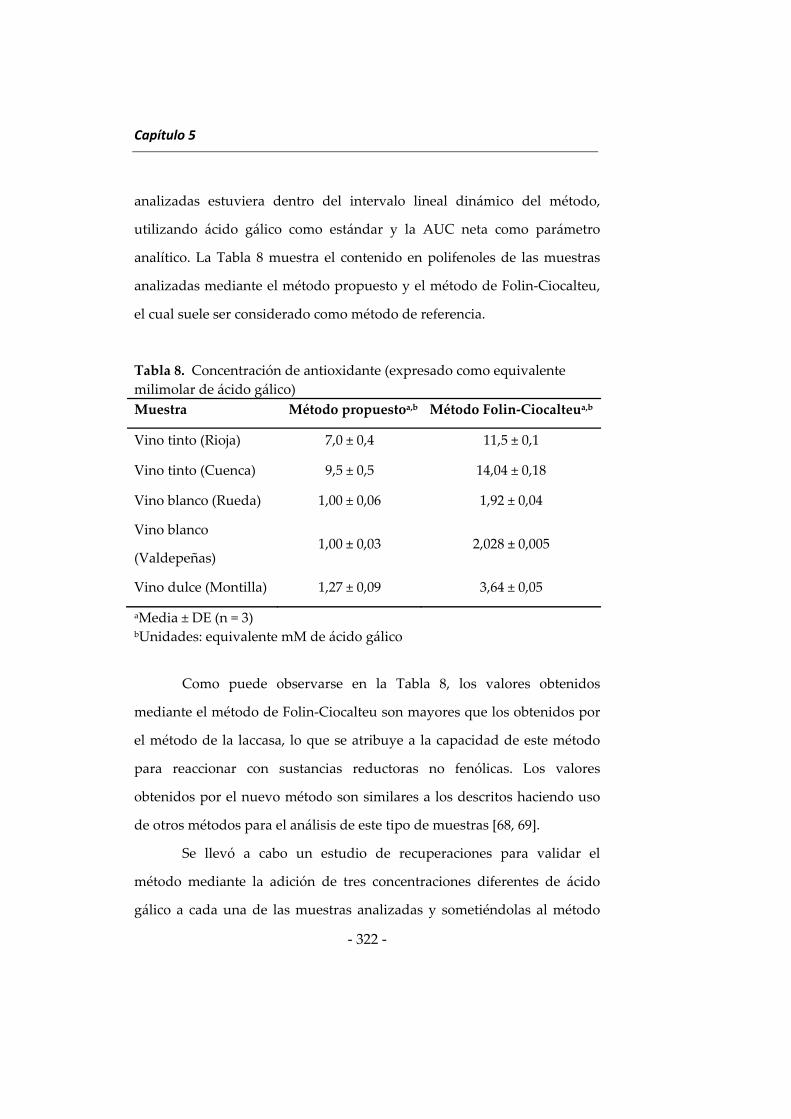
Capítulo 5
‐ 322 ‐
analizadas estuviera dentro del intervalo lineal dinámico del método,
utilizando ácido gálico como estándar y la AUC neta como parámetro
analítico. La Tabla 8 muestra el contenido en polifenoles de las muestras
analizadas mediante el método propuesto y el método de Folin‐Ciocalteu,
el cual suele ser considerado como método de referencia.
Tabla 8. Concentración de antioxidante (expresado como equivalente
milimolar de ácido gálico)
Muestra Método propuestoa,b Método Folin‐Ciocalteua,b
Vino tinto (Rioja) 7,0 ± 0,4 11,5 ± 0,1
Vino tinto (Cuenca) 9,5 ± 0,5 14,04 ± 0,18
Vino blanco (Rueda) 1,00 ± 0,06 1,92 ± 0,04
Vino blanco
(Valdepeñas) 1,00 ± 0,03 2,028 ± 0,005
Vino dulce (Montilla) 1,27 ± 0,09 3,64 ± 0,05
aMedia ± DE (n = 3) bUnidades: equivalente mM de ácido gálico
Como puede observarse en la Tabla 8, los valores obtenidos
mediante el método de Folin‐Ciocalteu son mayores que los obtenidos por
el método de la laccasa, lo que se atribuye a la capacidad de este método
para reaccionar con sustancias reductoras no fenólicas. Los valores
obtenidos por el nuevo método son similares a los descritos haciendo uso
de otros métodos para el análisis de este tipo de muestras [68, 69].
Se llevó a cabo un estudio de recuperaciones para validar el
método mediante la adición de tres concentraciones diferentes de ácido
gálico a cada una de las muestras analizadas y sometiéndolas al método
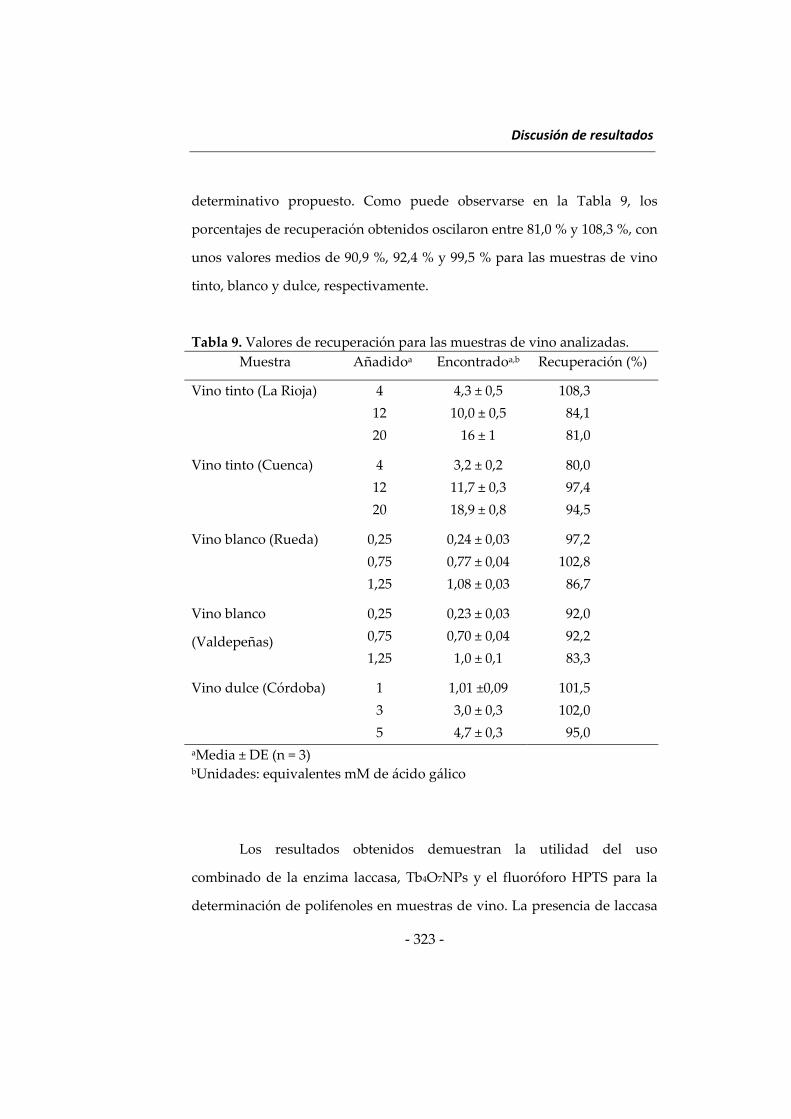
Discusión de resultados
‐ 323 ‐
determinativo propuesto. Como puede observarse en la Tabla 9, los
porcentajes de recuperación obtenidos oscilaron entre 81,0 % y 108,3 %, con
unos valores medios de 90,9 %, 92,4 % y 99,5 % para las muestras de vino
tinto, blanco y dulce, respectivamente.
Tabla 9. Valores de recuperación para las muestras de vino analizadas.
Muestra Añadidoa Encontradoa,b Recuperación (%)
Vino tinto (La Rioja) 4 4,3 ± 0,5 108,3
12 10,0 ± 0,5 84,1
20 16 ± 1 81,0
Vino tinto (Cuenca) 4 3,2 ± 0,2 80,0
12 11,7 ± 0,3 97,4
20 18,9 ± 0,8 94,5
Vino blanco (Rueda) 0,25 0,24 ± 0,03 97,2
0,75 0,77 ± 0,04 102,8
1,25 1,08 ± 0,03 86,7
Vino blanco
(Valdepeñas)
0,25 0,23 ± 0,03 92,0
0,75 0,70 ± 0,04 92,2
1,25 1,0 ± 0,1 83,3
Vino dulce (Córdoba) 1 1,01 ±0,09 101,5
3 3,0 ± 0,3 102,0
5 4,7 ± 0,3 95,0
aMedia ± DE (n = 3) bUnidades: equivalentes mM de ácido gálico
Los resultados obtenidos demuestran la utilidad del uso
combinado de la enzima laccasa, Tb4O7NPs y el fluoróforo HPTS para la
determinación de polifenoles en muestras de vino. La presencia de laccasa
Capítulo 5
‐ 324 ‐
y NPs permite aumentar la velocidad de muestreo del método y mejorar
los valores de sensibilidad, siendo estos superiores a los obtenidos en la
mayoría de los métodos descritos anteriormente [68, 69]. Como aspecto
más novedoso de la investigación realizada, cabe destacar que se describe
por primera vez el efecto activador de las Tb4O7NPs en un sistema
enzimático. Además, el uso del lector automático de microplacas, permite
el procesamiento simultáneo de las muestras consiguiendo una velocidad
de muestreo de 35 muestras a la hora, analizando cada muestra por
triplicado.
3. Nuevas investigaciones en el uso de “upconverting phosphors”
en sistemas de transferencia de energía resonante luminiscente
Este estudio se ha realizado durante la estancia de tres meses en el
Departamento de Biotecnología de la Universidad de Turku (Finlandia).
Debido a la corta duración de dicha estancia, la investigación se centró en
la evaluación sistemática de diferentes dadores y aceptores para el diseño
de un sistema de transferencia de energía resonante luminiscente (LRET)
haciendo uso del fenómeno anti‐Stokes en ensayos de afinidad biotina‐
estreptavidina. Este estudio tuvo como objetivo la selección del sistema
más adecuado para su posterior aplicación analítica.
Como se ha descrito en la Introducción de esta Memoria, los
“upconverting phosphors” (UCPs) son un tipo de NPs inorgánicas que
pueden ser dopadas con iones lantánidos para llevar a cabo el fenómeno de
emisión de fluorescencia anti‐Stokes. En esta investigación se presenta el
estudio sistemático de diferentes UCPs dopados con Er(III), Ho(III) y
Discusión de resultados
‐ 325 ‐
Tm(III), utilizados como dadores, y varios fluoróforos, utilizados como
aceptores, para el desarrollo de nuevas metodologías basadas en el
fenómeno LRET. Para que se produzca este fenómeno son imprescindibles
dos condiciones: 1) el espectro de excitación del aceptor tiene que solapar
con el espectro de emisión del dador, y 2) la distancia entre dador y aceptor
tiene que cumplir la ecuación de Förster.
Entre la gran variedad de fluoróforos existentes, las
ficobiliproteínas, tales como la β‐ficoeritrina (BPE) y la R‐ficoeritrina (RPE),
han sido utilizadas anteriormente como aceptores en diferentes ensayos
LRET [77 – 79]. Su uso se debe principalmente a su elevada emisión de
fluorescencia, aunque tienen el inconveniente de un coste relativamente
elevado. Por este motivo se ha estudiado la posibilidad de utilizar otros
tipos de fluoróforos de menor coste para el desarrollo de ensayos de
afinidad LRET, como los Alexa Fluor o los ATTO. Para llevar a cabo este
estudio sistemático entre dadores y aceptores, los UCPs fueron marcados
con estreptavidina (SA) mientras que los fluoróforos fueron marcados con
biotina (Bio).
En la Figura 12 se muestran los espectros de emisión de los dadores
y los espectros de excitación de los aceptores. Las Figuras 12.A‐12.C
corresponden a la combinación del UCP dopado con Er(III) con la proteína
fluorescente BPE y los fluoróforos Alexa Fluor 546 (AF546) y 680 (AF680),
observándose un buen solapamiento entre los espectros de emisión y
excitación de dador y aceptor, respectivamente.
Capítulo 5
‐ 326 ‐
Similares espectros fueron obtenidos al utilizar los UCPs dopados
con Ho(III) (Figura 12.D‐12.E) ensayados con BPE y AF546. Al igual que
ocurre al usar el Er(III), el ancho espectro de excitación de la BPE permite
excitarla eficientemente mientras que al usarse AF546, esta transferencia
de energía presenta un menor rendimiento.
Los UCPs dopados con Tm(III) se combinaron con RPE, Alexa
Fluor 488 (AF488) y el fluoróforo ATTO495 (Figura 12.F‐12.H). En este
caso, el dador presenta un máximo de emisión a una longitud de onda
menor que el Er(III) y el Ho(III), con un buen solapamiento teórico con el
fluoróforo AF488, aunque, como podrá observarse posteriormente, no
siempre un adecuado solapamiento teórico da lugar en la práctica a una
transferencia de energía eficaz.
Como ya se indicó en la Introducción de esta Memoria, la ausencia
de grupos funcionales en este tipo de nanomateriales inorgánicos hace
imprescindible llevar a cabo previamente su recubrimiento y
funcionalización para, posteriormente, unirlos a biomoléculas. Después de
este proceso, los diferentes dadores y aceptores fueron marcados con SA y
Bio, respectivamente, para llevar a cabo la optimización de las
concentraciones de cada uno de ellos y, finalmente, obtener las curvas de
calibrado para la Bio, utilizada como analito modelo, en las mejores
condiciones. Para evitar el elevado coste de las ficobiliproteínas BPE y RPE,
se estudió la alternativa de utilizar otros fluoróforos para diseñar el sistema
LRET, comparando los resultados con los obtenidos usando estas
proteínas.
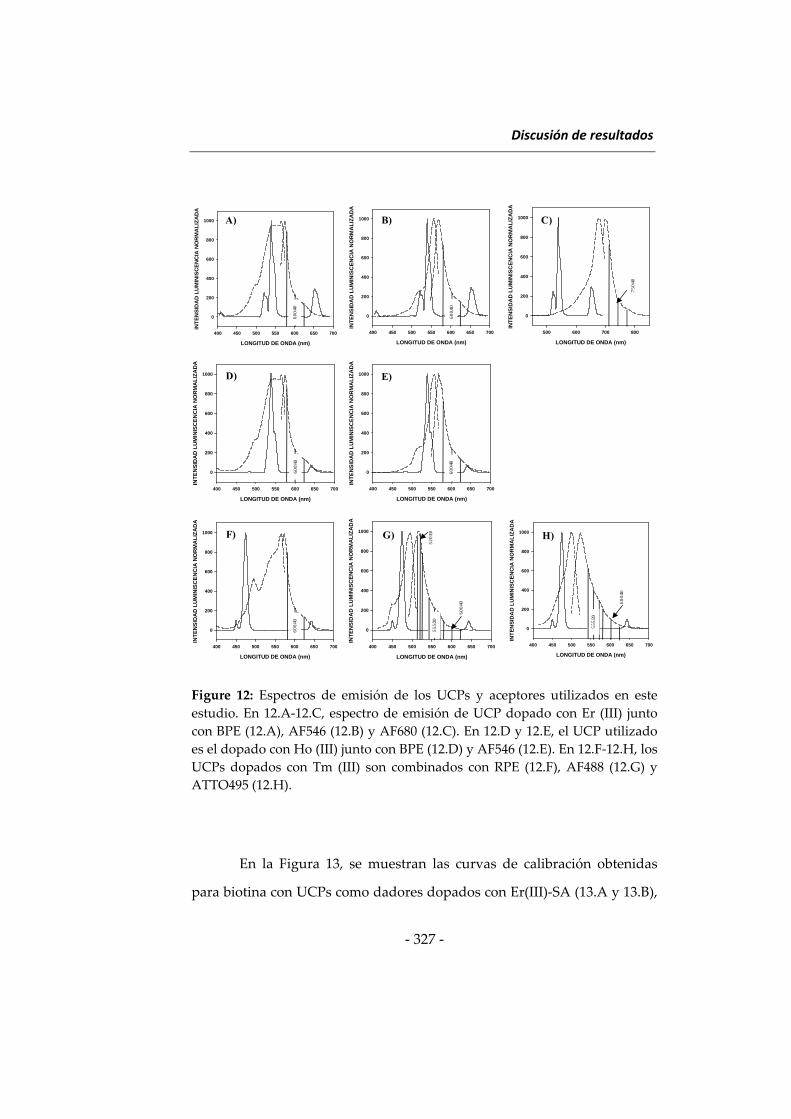
Discusión de resultados
‐ 327 ‐
Figure 12: Espectros de emisión de los UCPs y aceptores utilizados en este
estudio. En 12.A‐12.C, espectro de emisión de UCP dopado con Er (III) junto
con BPE (12.A), AF546 (12.B) y AF680 (12.C). En 12.D y 12.E, el UCP utilizado
es el dopado con Ho (III) junto con BPE (12.D) y AF546 (12.E). En 12.F‐12.H, los
UCPs dopados con Tm (III) son combinados con RPE (12.F), AF488 (12.G) y
ATTO495 (12.H).
En la Figura 13, se muestran las curvas de calibración obtenidas
para biotina con UCPs como dadores dopados con Er(III)‐SA (13.A y 13.B),
LONGITUD DE ONDA (nm)
400 450 500 550 600 650 700
INT
EN
SID
AD
LU
MIN
ISC
EN
CIA
NO
RM
AL
IZA
DA
0
200
400
600
800
1000
LONGITUD DE ONDA (nm)
400 450 500 550 600 650 700
INT
EN
SID
AD
LU
MIN
ISC
EN
CIA
NO
RM
AL
IZA
DA
0
200
400
600
800
1000
LONGITUD DE ONDA (nm)
400 450 500 550 600 650 700
INT
EN
SID
AD
LU
MIN
ISC
EN
CIA
NO
RM
AL
IZA
DA
0
200
400
600
800
1000
LONGITUD DE ONDA (nm)
400 450 500 550 600 650 700
INT
EN
SID
AD
LU
MIN
ISC
EN
CIA
NO
RM
AL
IZA
DA
0
200
400
600
800
1000
LONGITUD DE ONDA (nm)
400 450 500 550 600 650 700
INT
EN
SID
AD
LU
MIN
ISC
EN
CIA
NO
RM
AL
IZA
DA
0
200
400
600
800
1000
LONGITUD DE ONDA (nm)
500 600 700 800
INT
EN
SID
AD
LU
MIN
ISC
EN
CIA
NO
RM
AL
IZA
DA
0
200
400
600
800
1000
LONGITUD DE ONDA (nm)
400 450 500 550 600 650 700
INT
EN
SID
AD
LU
MIN
ISC
EN
CIA
NO
RM
AL
IZA
DA
0
200
400
600
800
1000
LONGITUD DE ONDA (nm)
400 450 500 550 600 650 700
INT
EN
SID
AD
LU
MIN
ISC
EN
CIA
NO
RM
AL
IZA
DA
0
200
400
600
800
1000
F) G) H)
55
5/2
0
60
0/4
0
52
0/1
0
60
0/4
0
60
0/4
0
D) E)
60
0/4
0
60
0/4
0
A) B) C)
60
0/4
0
60
0/4
0
75
0/4
0
55
5/2
0
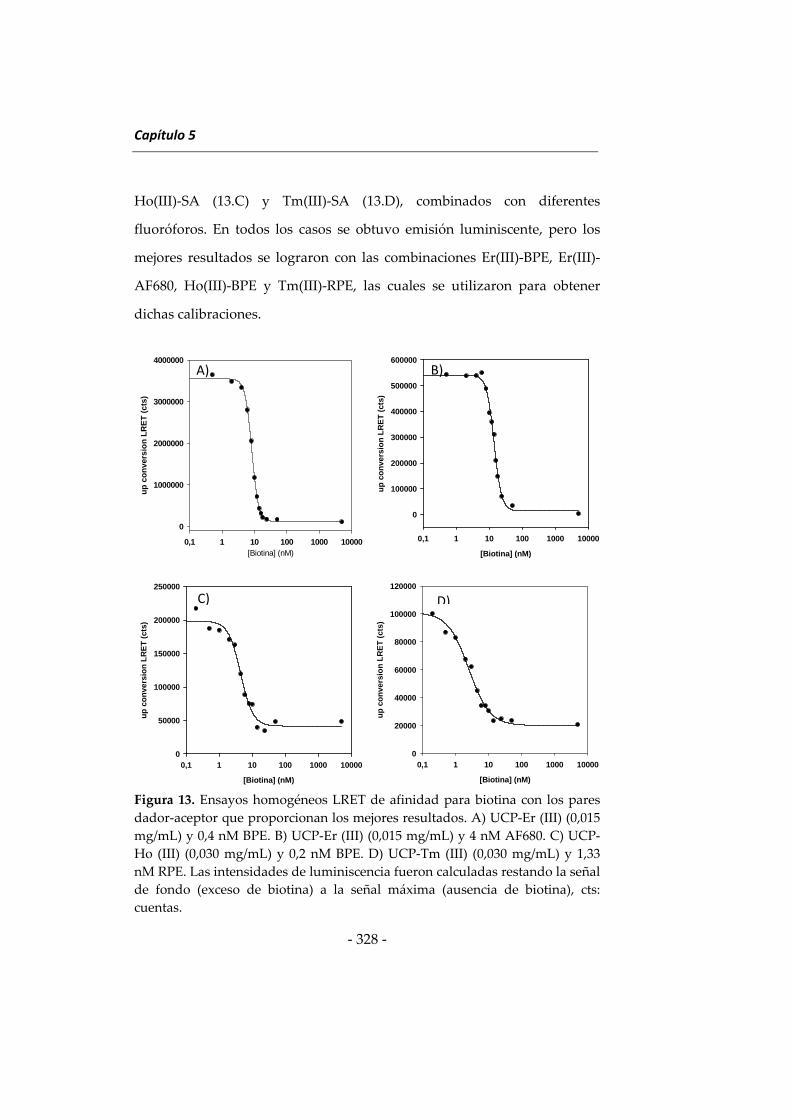
Capítulo 5
‐ 328 ‐
Ho(III)‐SA (13.C) y Tm(III)‐SA (13.D), combinados con diferentes
fluoróforos. En todos los casos se obtuvo emisión luminiscente, pero los
mejores resultados se lograron con las combinaciones Er(III)‐BPE, Er(III)‐
AF680, Ho(III)‐BPE y Tm(III)‐RPE, las cuales se utilizaron para obtener
dichas calibraciones.
Figura 13. Ensayos homogéneos LRET de afinidad para biotina con los pares
dador‐aceptor que proporcionan los mejores resultados. A) UCP‐Er (III) (0,015
mg/mL) y 0,4 nM BPE. B) UCP‐Er (III) (0,015 mg/mL) y 4 nM AF680. C) UCP‐
Ho (III) (0,030 mg/mL) y 0,2 nM BPE. D) UCP‐Tm (III) (0,030 mg/mL) y 1,33
nM RPE. Las intensidades de luminiscencia fueron calculadas restando la señal
de fondo (exceso de biotina) a la señal máxima (ausencia de biotina), cts:
cuentas.
[Biotina] (nM)0,1 1 10 100 1000 10000
up
co
nve
rsio
n L
RE
T (
cts
)
0
1000000
2000000
3000000
4000000
A)
[Biotina] (nM)
0,1 1 10 100 1000 10000
up
co
nve
rsio
n L
RE
T (
cts)
0
100000
200000
300000
400000
500000
600000
B)
[Biotina] (nM)
0,1 1 10 100 1000 10000
up
co
nve
rsio
n L
RE
T (
cts)
0
50000
100000
150000
200000
250000
C)
[Biotina] (nM)
0,1 1 10 100 1000 10000
up
co
nve
rsio
n L
RE
T (
cts)
0
20000
40000
60000
80000
100000
120000
D)
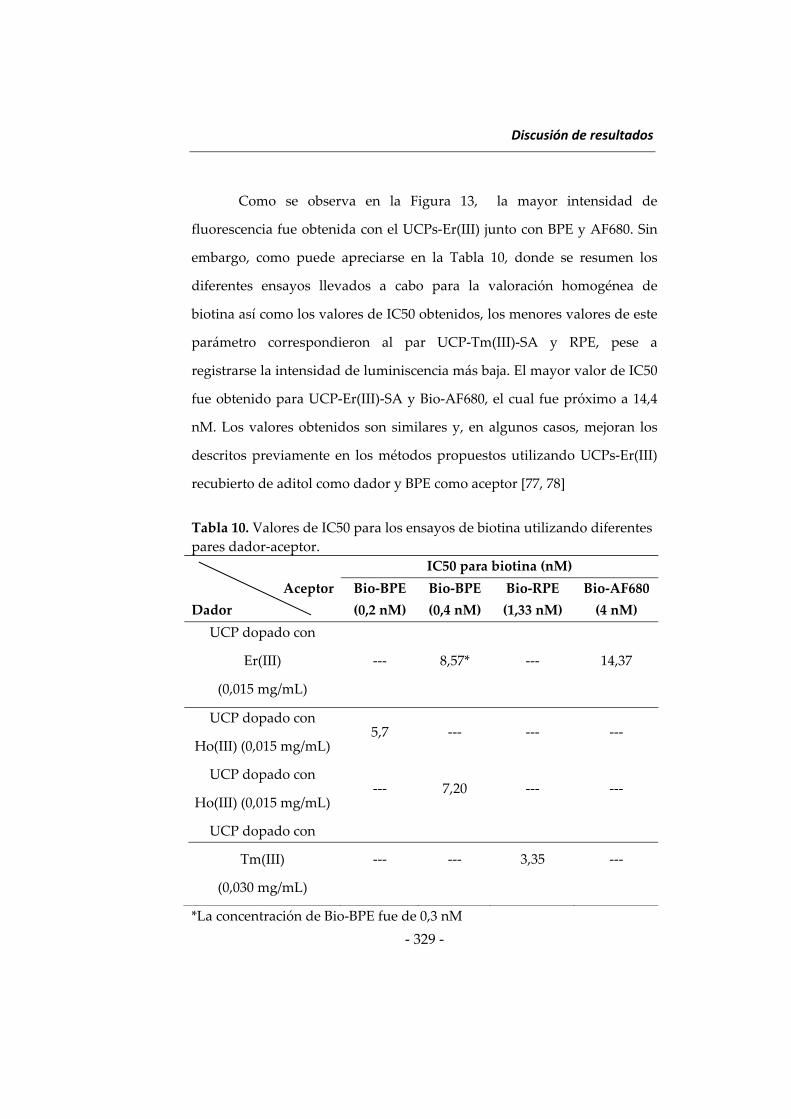
Discusión de resultados
‐ 329 ‐
Como se observa en la Figura 13, la mayor intensidad de
fluorescencia fue obtenida con el UCPs‐Er(III) junto con BPE y AF680. Sin
embargo, como puede apreciarse en la Tabla 10, donde se resumen los
diferentes ensayos llevados a cabo para la valoración homogénea de
biotina así como los valores de IC50 obtenidos, los menores valores de este
parámetro correspondieron al par UCP‐Tm(III)‐SA y RPE, pese a
registrarse la intensidad de luminiscencia más baja. El mayor valor de IC50
fue obtenido para UCP‐Er(III)‐SA y Bio‐AF680, el cual fue próximo a 14,4
nM. Los valores obtenidos son similares y, en algunos casos, mejoran los
descritos previamente en los métodos propuestos utilizando UCPs‐Er(III)
recubierto de aditol como dador y BPE como aceptor [77, 78]
Tabla 10. Valores de IC50 para los ensayos de biotina utilizando diferentes
pares dador‐aceptor.
IC50 para biotina (nM)
Aceptor
Dador
Bio‐BPE
(0,2 nM)
Bio‐BPE
(0,4 nM)
Bio‐RPE
(1,33 nM)
Bio‐AF680
(4 nM)
UCP dopado con
Er(III)
(0,015 mg/mL)
‐‐‐ 8,57* ‐‐‐ 14,37
UCP dopado con
Ho(III) (0,015 mg/mL) 5,7 ‐‐‐ ‐‐‐ ‐‐‐
UCP dopado con
Ho(III) (0,015 mg/mL) ‐‐‐ 7,20 ‐‐‐ ‐‐‐
UCP dopado con
Tm(III)
(0,030 mg/mL)
‐‐‐ ‐‐‐ 3,35 ‐‐‐
*La concentración de Bio‐BPE fue de 0,3 nM
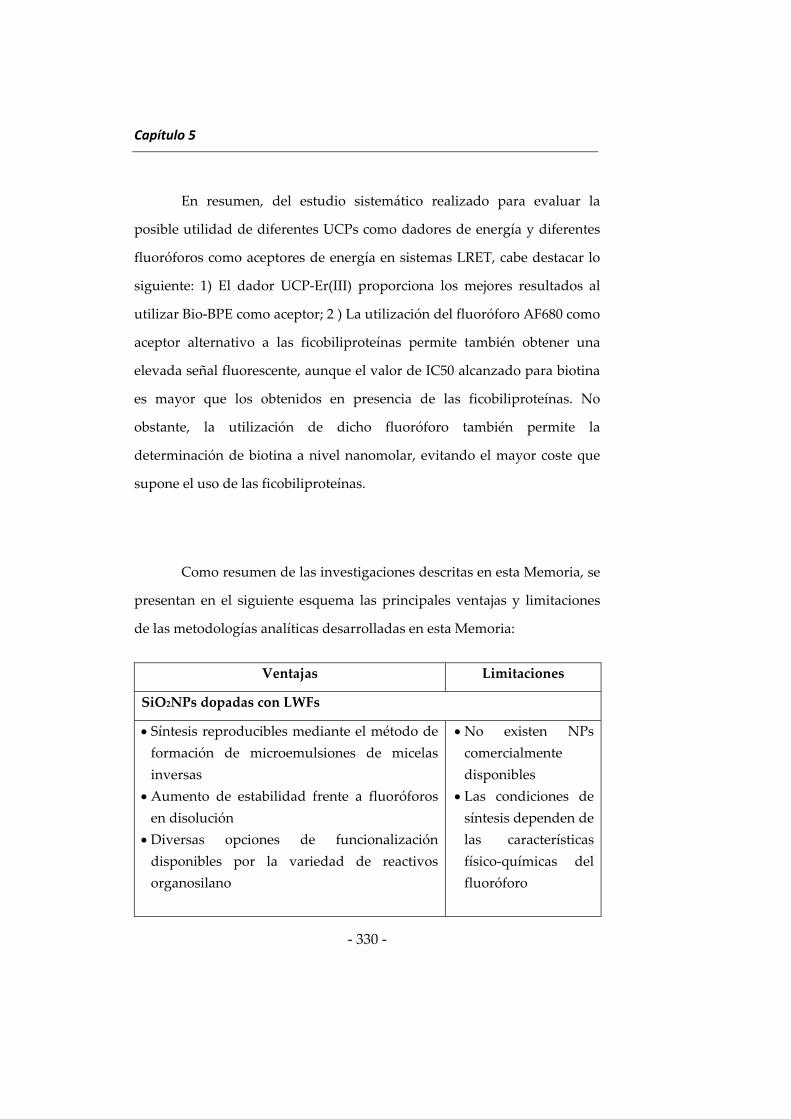
Capítulo 5
‐ 330 ‐
En resumen, del estudio sistemático realizado para evaluar la
posible utilidad de diferentes UCPs como dadores de energía y diferentes
fluoróforos como aceptores de energía en sistemas LRET, cabe destacar lo
siguiente: 1) El dador UCP‐Er(III) proporciona los mejores resultados al
utilizar Bio‐BPE como aceptor; 2 ) La utilización del fluoróforo AF680 como
aceptor alternativo a las ficobiliproteínas permite también obtener una
elevada señal fluorescente, aunque el valor de IC50 alcanzado para biotina
es mayor que los obtenidos en presencia de las ficobiliproteínas. No
obstante, la utilización de dicho fluoróforo también permite la
determinación de biotina a nivel nanomolar, evitando el mayor coste que
supone el uso de las ficobiliproteínas.
Como resumen de las investigaciones descritas en esta Memoria, se
presentan en el siguiente esquema las principales ventajas y limitaciones
de las metodologías analíticas desarrolladas en esta Memoria:
Ventajas Limitaciones
SiO2NPs dopadas con LWFs
Síntesis reproducibles mediante el método de
formación de microemulsiones de micelas
inversas
Aumento de estabilidad frente a fluoróforos
en disolución
Diversas opciones de funcionalización
disponibles por la variedad de reactivos
organosilano
No existen NPs
comercialmente
disponibles
Las condiciones de
síntesis dependen de
las características
físico‐químicas del
fluoróforo
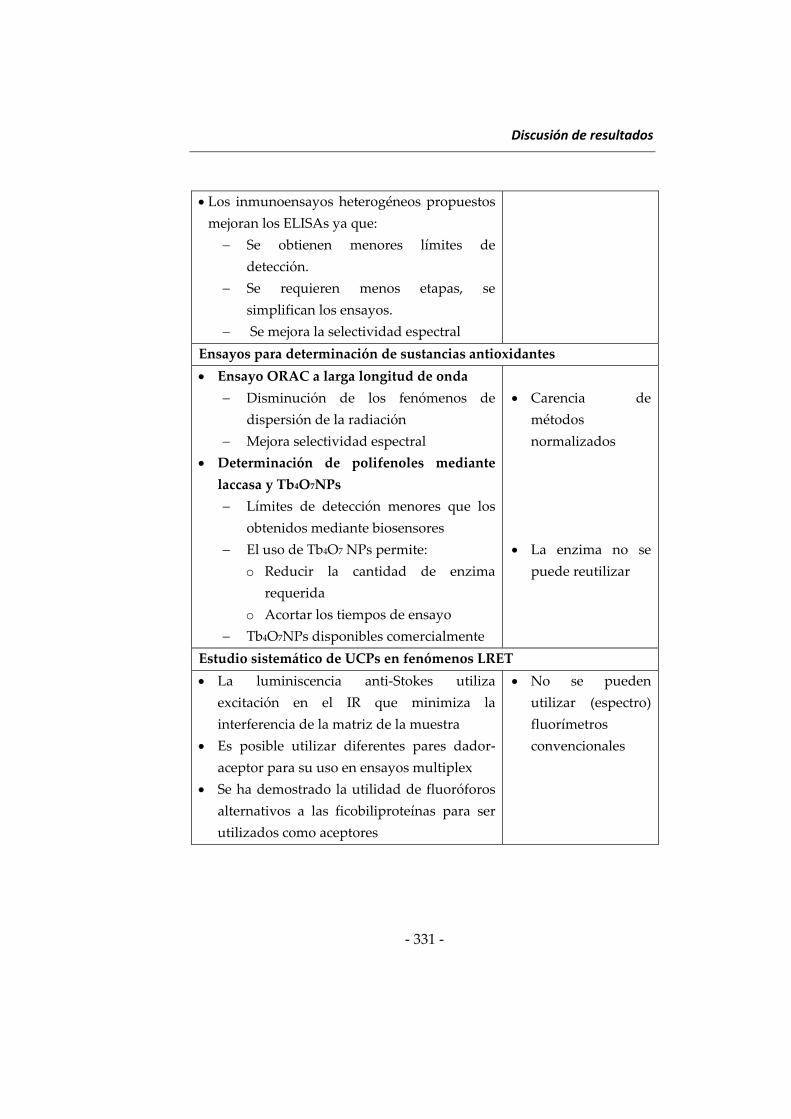
Discusión de resultados
‐ 331 ‐
Los inmunoensayos heterogéneos propuestos
mejoran los ELISAs ya que:
Se obtienen menores límites de
detección.
Se requieren menos etapas, se
simplifican los ensayos.
Se mejora la selectividad espectral
Ensayos para determinación de sustancias antioxidantes
Ensayo ORAC a larga longitud de onda
Disminución de los fenómenos de
dispersión de la radiación
Mejora selectividad espectral
Determinación de polifenoles mediante
laccasa y Tb4O7NPs
Límites de detección menores que los
obtenidos mediante biosensores
El uso de Tb4O7 NPs permite:
o Reducir la cantidad de enzima
requerida
o Acortar los tiempos de ensayo
Tb4O7NPs disponibles comercialmente
Carencia de
métodos
normalizados
La enzima no se
puede reutilizar
Estudio sistemático de UCPs en fenómenos LRET
La luminiscencia anti‐Stokes utiliza
excitación en el IR que minimiza la
interferencia de la matriz de la muestra
Es posible utilizar diferentes pares dador‐
aceptor para su uso en ensayos multiplex
Se ha demostrado la utilidad de fluoróforos
alternativos a las ficobiliproteínas para ser
utilizados como aceptores
No se pueden
utilizar (espectro)
fluorímetros
convencionales
Capítulo 5
‐ 332 ‐
Referencias
(1) A. Gómez‐Hens, J.M. Fernández‐Romero, M. P. Aguilar‐Caballos.
Nanostructures as analytical tools in bioassays. Trends Anal. Chem.
(2008) 27, 394 – 406.
(2) J. Yan, M. C. Estévez, J. E. Smith, K. Wang, X. Ho, L. Wang, W. Tan.
Dye‐doped nanoparticles for bioanalysis. Nanotoday (2007) 2, 44 –
50.
(3) M. Seydack. Nanoparticles labels in immunosensing using optical
detection methods. Biosens. Bioelectron. (2005) 20, 2454 – 2469.
(4) N. C. Tansil, Z. Gao. Nanoparticles in biomolecular detection.
Nanotoday (2006) 1, 28 – 37.
(5) G. Liu, Y. Lin. Nanomaterial labels in electrochemical
immunosensors and immunoassays. Talanta (2007) 74, 308 – 317.
(6) F. J. Arriagada, K. Osseo‐Asare. Synthesis of nanosize silica in a
noionic water‐in‐oil microemulsion: effects on the water/surfactant
molar ratio and ammonia concentration. J. Colloid Interf. Sci. (1999)
211, 210 – 220.
(7) G. Yao, L. Wang, G. Wu, J. Smith, J. Xu, W. Zhao, E. Lee, W. tan.
FlotDots: luminescent nanoparticles. Anal. Bioanal. Chem. (2006)
385, 518 – 524.
(8) X. He, J. Chen, K. Wang, D. Qin, W. Tan. Preparation of
luminescent Cy5 doped core‐shell SFNPs and its application as a
near‐infrared fluorescent marker. Talanta (2007) 72, 1519 – 1526.

Discusión de resultados
‐ 333 ‐
(9) X‐L. Chen, J‐L. Zou, T‐T. Zhao, Z‐B. Li. Preparation and
fluoroimmunoassay application of new red‐region fluorescent
silica nanoparticles. J. Fluoresc. (2007) 17, 235 – 241.
(10) W. Yang, C‐G. Zhang, H‐Y. Qu, H‐H. Yang, J‐G. Xu. Novel
fluorescent silica nanoparticle probe for ultrasensitive
immunoassays. Anal. Chim. Acta (2004) 503, 163 – 169.
(11) Z. Zhang, F. Zhang, Y. Liu. Recent advances in enhancing the
sensitivity and resolution of capillary electrophoresis. J. Chromatogr.
Sci. (2013) 51, 666 – 683.
(12) G. A. Saleh, H. F. Askal, I. H. Refaat, F. A. M. Abdel‐Aal. Review on
recent separation methods for determination of some
fluoroquinolones. J. Liq. Chromatogr. (2013) 36, 1401 – 1420.
(13) M. Szultka, B. Buszewki, K. Papaj, W. Szeja, A. Rusin.
Determination of flavonoids and their metabolites by
chromatographic techniques. Trends Anal. Chem. (2013) 47, 47 – 67.
(14) B. Tang, K. H. Row. Development of gas chromatography analysis
of fatty acids in marine organisms. J. Chromatogr. Sci. (2013) 51, 599
– 607.
(15) I. G. Zenkevich, Y. S. Drugov. Gas chromatographic methods for
the determination of trace organic pollutans in environmental
samples. J. Anal. Chem. (2013) 68, 845 – 861.
(16) C. T. Elliot, D. G. Kennedy, W. J. McCaughey. Methods for the
detection of polyether ionophore residues in poultry. Analyst (1998)
123, 45R – 56R.
(17) M. Sokolic, M. Pokorny. Comparative determination of
salinomycin by high‐performance liquid chromatography,
Capítulo 5
‐ 334 ‐
microbiological and colorimetric methods in testing production
processes and animal feed preparations. J. Pharmaceut. Biomed.
(1991) 9, 1047 – 1053.
(18) S. Magiera. Fast, simultaneous quantification of three novel cardiac
drugs in human urine by MEPS‐UHPLC‐MS/MS for therapeutic
drug monitoring. J. Chromatogr. B (2013) 938, 86 – 95.
(19) R. Ciayadi, G. F. Kelso, M. K. Potdar, S. J. Harris, K. L. Walton, C.
A. Harrison, M. T. W. Hearn. Identification of protein binding
partners of ALK‐5 Kinase inhibitors. Bioorgan. Med. Chem. (2013) 21,
6496 – 6500.
(20) G. Pierri, D. Kotoni, P. Simone, C. Villani, G. Pepe, P. Campiglia, P.
Dugo, F. Gasparrini. Analysis of bovine milk caseins on organic
monolithic columns:An integrated capillary liquid
chromatography‐high resolution mass spectrometry approach for
the study of time‐dependent casein degradation. J. Chromatogr. A
(2013) 1313, 259 – 269.
(21) T. F. McGrath, C. T. Elliot, T. L. Fodey. Biosensors for the analysis
of microbiological and chemical contaminants in foods. Anal.
Bioanal. Chem. (2012) 403, 75 – 92.
(22) X. Pei, B. Zhang, J. Tang, B. Liu, W. Lai, D. Tang. Sandwich‐type
immunosensors and immunoassays exploiting nanostructure
labels: A review. Anal. Chim. Acta (2013) 758, 1 – 18.
(23) S. Girotti, S. Ghini, E. Maiolini, L. Bolelli, E. N. Feri. Trace analysis
of pollutants by use of honeybees, immunoassays, and
chemiluminescence detection. Anal. Bioanal. Chem. (2013) 405, 555 –
571.

Discusión de resultados
‐ 335 ‐
(24) L. Anfossi, C. Baggiani, C. Giavannoli, G. D´Arco, G. Giraudi.
Lateral‐flow immunoassays for mycotoxins and phycotoxins: A
review. Anal. Bioanal. Chem. (2013) 405, 467 – 480.
(25) D. L. Brandon, M. Friedman. Immunoassays of Soy Proteins. J. Agr.
Food Chem. (2002) 50, 6635 – 6642.
(26) M. A. J. Godfrey, M. F. Luckey, P. Kwasowski. IAC/cELISA
detection of monensin elimination from chicken tissues, following
oral therapeutic dosing. Food Add. Contam. (1997) 14, 281 – 286.
(27) S. R. H. Crooks, T. L. Fodey, G. R. Gilmore, C. T. Elliot. Rapid
screening for monensin residues in poultry plasma by a dry
reagent dissociation enhanced lanthanide fluoroimmunoassay.
Analyst (1998) 123, 2493 – 2496.
(28) V. Hagren, P. Peippo, M. Tuomola, T. Lövgren. Rapid time‐
resolved fluoroimmunoassay for the screening of monensin
residues in eggs. Anal. Chim. Acta (2006) 557, 164 – 168.
(29) C. Cháfer‐Pericás, A. Maquieira, R. Puchades. Functionalized
inorganic nanoparticles used as labels in solid‐phase
immunoassays. Trends Anal. Chem. (2012) 31, 144 – 156.
(30) A. Gómez‐Hens, J. M. Fernández‐Romero, M. P. Aguilar‐Caballos.
Nanostructures as analytical tolos in bioassays. Trends Anal. Chem.
(2008) 27, 394 – 406.
(31) D. Knopp, D. Tang, R. Niessner. Review: Bioanalytical applications
of biomolecule‐functionalized nanometer‐sized doped silica
nanoparticles. Anal. Chim. Acta (2009) 647, 14 – 30.

Capítulo 5
‐ 336 ‐
(32) M. A. J. Godfrey, M. F. Luckey, P. Kwasowski. IAC/cELISA
detection of monensin elimination from chicken tissues, following
oral therapeutic dosing. Food Addit. Contam. (1997) 14, 281 – 286..
(33) M. Hazansadeh, N. Shadjou, E. Omidina, M. Eskandani, M. de la
Guardia. Mesoporous silica materials for use in electrochemical
immunosensing. TrAC – Trends Anal. Chem. (2013) 45, 93 – 106.
(34) X. Zhao, L. R. Hilliard, S. J. Mechery, Y. Wang, R. P. Bagwe, S. Jin,
W. Tan. A rapid bioassay for single bacterial cell quantitation using
bioconjugated nanoparticles. P. Ntl. Aca. Sci. USA (2004) 101, 15027
– 15032.
(35) R. Tapec, X. J. Zhao, W. Tan. Development of organic dye‐doped
silica nanoparticles for bioanalysis and biosensors. J. Nanosci.
Nanotech. (2002) 2, 405 – 409.
(36) H‐H. Yang, H‐Y. Qu, P. Lin, S‐H. Li, M‐T. Ding, J‐G. Xu.
Nanometer fluorescent hybrid silica particle as ultrasensitive and
photostable biological labels. Analyst (2003) 128, 462 – 466.
(37) W. Yang, C. G. Zhang, H. Y. Qu, H. H. Yang, J. G. Xu. Novel
fluorescent silica nanoparticles probe for ultrasensitive
immunoassays. Anal. Chim. Acta (2004) 503, 163 – 169.
(38) M. Tan, G. Wang, X. Hai, Z. Ye, J. Yuan. Development of
functionalized fluorescent europium nanoparticles for biolabelling
and time‐resolved fluorometric applications. J. Mater. Chem. (2004)
14, 2896 – 2901.
(39) Z. Ye, M. Tan, G. Wang, J. Yuan. Novel fluorescent europium
chelate‐doped silica nanoparticles: preparation, characterization
Discusión de resultados
‐ 337 ‐
and time‐resolved fluorometric application. J. Mater. Chem. (2004)
14, 851 – 856.
(40) Z. Ye, M. Tan, G. Wang, J. Yuan. Preparation, Characterization, and
time‐resolved fluorometric application of ailica‐coated terbium (III)
fluorescent nanoparticles. Anal. Chem. (2004) 76, 513 – 518.
(41) L. L´Hocine, J. I. Boye, C. Munyana. Detection and quantification of
soy allergens in food: study of two commercial enzyme‐linked
immunosorbent assays. J. Food Sci. (2007) 72, C145 ‐ C153.
(42) M. L. Sánchez‐Martínez, M. P. Aguilar‐Caballos, A. Gómez‐Hens.
Homogeneous immunoassay for soy protein determination in food
samples using gold nanoparticles as labels and light scattering
detection. Anal. Chim. Acta (2009) 636, 58 – 62.
(43) Opinion of the scientific panel on contaminants in the food chain.
EFSA Journal (2008) 592, 1 – 40.
(44) Regulation (EC) No 1831/2003 of the European Parliament and of
the Council of 22 Septembre 2003 on additives for use in animal
nutrition. Official Journal of European Union (2003) L268, 29 – 43.
(45) H. Watanabe, A. Satake, M. Matsumoto, Y. Kido, A. Tsuji, K. Ito, M.
Maeda. Monoclonal‐based enzyme‐linked immunosorbent assay
and immunochromatographic rapid assay for monensin. Analyst
(1998) 123, 2573 – 2578.
(46) Monensin ELISA kit (Cat # KA1422 V.01),
http://www.abnova.com/.
(47) Monensin ELISA. Enzyme‐linked immunosorbent assay for the
determination of monensin in feed and contaminated samples.
http://abraxiskits.com/.

Capítulo 5
‐ 338 ‐
(48) S. R. H. Crooks, I. M. Traynor, C. T. Elliott, W. J. McCaughey.
Detection of monensin residues in poultry liver using an enzyme
immunoassay. Analyst (1997) 122, 161 – 163.
(49) M. Ciz, H. Cizova, P. Deneb, M. Kratchanova, A. Slavov, A. Lojek.
Different methods for control and comparison of the antioxidant
properties of vegetables. Food Control (2010) 21, 518 – 523.
(50) E. Atala, L. Vásquez, H. Speisky, E. Lissi, C. López‐Alarcón.
Ascorbic acid contribution to ORAC values in berry extracts: An
evaluation by the ORAC‐pyrogallol red methodology. Food Chem.
(2009) 113, 331 – 335.
(51) M. D. Rivero‐Pérez, M. L. González‐Sanjosé, M. Ortega‐Herás, P.
Muñiz. Antioxidant potential of single‐variety red wines aged in
the barrel and in the bottle. Food Chem. (2008) 111, 957 – 964.
(52) E. Sofic, Z. Rimpapa, Z. Kundurovic, A. Sapcanin, I. Tahirovic, A.
Rustembegovic, G. Cao. Antioxidant capacity of the neurohormone
melatonin. J. Neural Transm. (2005) 112, 349 – 358.
(53) G. Cao, H. M. Alessie, R. G. Cutler. Oxygen‐radical absorbance
capacity assay for antioxidants. Free Radical Bio. Med. (1993) 14, 303
– 311.
(54) W. Mullen, S. C. Marks, A. Crozier. Evaluation of phenolic
compounds in commercial fruit juices and fruit drinks. J. Agr. Food
Chem. (2007) 55, 3148 – 3157.
(55) J. Tabart, C. Kevers, J. Pincemail, J. O. Defraigne, J. Dommes.
Comparative antioxidant capacities of phenolic compounds
measured by various tests. Food Chem. (2009) 113, 1226 – 1233,
Discusión de resultados
‐ 339 ‐
(56) L. Müller, S. Groyke, A. M. Popken, V. Böhm. Antioxidant capacity
and related parameters of different fruit formulations. Food Sci.
Technol. (2010) 43, 992 – 999.
(57) N. Nenadis, O. Lazaridou, M. Z. Tsimidou. Use of reference
compounds in antioxidant activity assessment. J. Agr. Food Chem.
(2007) 55, 5452 – 5460.
(58) B. Lorrain, I. Ky, L. Pechamat, P. L. Teissedre, Evolution of analysis
of polyphenols from grapes, wines, and extracts. Molecules (2013)
18, 1076 ‐ 1100.
(59) M. Medić‐Ŝarić, V. Rastija, M. Bojić. Recent advances in the
application of high performance liquid chromatography in the
analysis of polyphenols in wine and propolis. J. AOAC Int. (2011)
94, 32 ‐ 42.
(60) H. Franquet‐Griell, A. Checa, O. Núñez, J. Saurina, S. Hernández‐
Cassou, L. Puignou. Determination of polyphenols in Spanish
wines by capillary zone electrophoresis. Application to wine
characterization by using chemometrics. J. Agr. Food. Chem. (2012)
60, 8340 ‐ 8349.
(61) A. Sánchez‐Arribas, M. Martínez‐Fernández, M. Chicharro. The
role of electroanalytical techniques in analysis of polyphenols in
wine. Trends Anal. Chem. (2012) 34, 78 ‐ 96.
(62) L. M. Magalhães, M. A. Segundo, S. Reis, J. L. C. Lima, A. O. S. S.
Rangel. Automatic method for the determination of Folin‐Ciocalteu
reducing capacity in food products. J. Agr. Food Chem. (2006) 54,
5241 ‐ 5246.
Capítulo 5
‐ 340 ‐
(63) J. C. Sánchez‐Rangel, J. Benavides, J. B. Heredia, L. Cisneros‐
Zevallos, D. A. Jacobo‐Velázquez. The Folin‐Ciocalteu assay
revisited: improvement of its specificity for total phenolic content
determination. Anal. Methods (2013) 5, 5990 ‐ 5999.
(64) J. Sochor, M. Ryvolova, O. Krystofova, P. Salas, J. Hubalek, V.
Adam, L. Trnkova, L. Havel, M. Beklova, J. Zehnalek, I. Provaznik,
R. Kizek. Fully automated spectrometric protocols for
determination of antioxidant activity: advantages and
disadvantages. Molecules (2010) 15, 8618 ‐ 8640.
(65) A. L. Dawidowicz, D. Wianowska, M. Olszowy. On practical
problems in estimation of antioxidant activity of compounds by
DPPH method (Problems in estimation of antioxidant activity).
Food Chem. (2012) 131, 1037‐1043.
(66) E. Nkhili, P. Brat. Reexamination of the ORAC assay: effect of metal
ions. Anal. Bioanal. Chem. (2011) 400, 1451 ‐ 1458.
(67) J. Godoy‐Navajas, M. P. Aguilar‐Caballos, A. Gómez‐Hens. Long‐
wavelength fluorimetric determination of food antioxidant capacity
using nile blue as reagent. J. Agr. Food Chem. (2011) 59, 2235‐2240.
(68) M. Gamella, S. Campuzano, A. J. Reviejo, J. M. Pingarrón.
Electrochemical estimation of the polyphenol index in wines using
a laccase biosensor. J. Agric. Food Chem. (2006) 54, 7960 ‐ 7967.
(69) M. Di Fusco, C. Tortolini, D. Deriu, F. Mazzei. Laccase‐based
biosensor for the determination of polyphenol index in wine.
Talanta (2010) 81, 235 ‐ 240.
(70) M.R. Montereali, L. Della Seta, W. Vastarella, R. Pilloton. A
disposable laccase‐tyrosinase based biosensor for amperometric
Discusión de resultados
‐ 341 ‐
detection of phenolic compounds in must and wine. J. Mol. Catal. B‐
Enzym. (2010) 64, 189 ‐ 194.
(71) J. Kulys, I. Bratkovskaja. Antioxidants determination with laccase.
Talanta (2007) 72, 526 – 531.
(72) E. Nugroho Prasetyo, T. Kudanga, W. Steiner, M. Murkovic, G. S.
Nyanhongo, G. M. Guebitz. Laccase‐generated tetramethoxy
azobismethylene quinone (TMAMQ) as a tool for antioxidant
activity measurement, Food Chem. (2010) 118, 437 ‐ 444.
(73) E. Nugroho Prasetyo, T. Kudanga, W. Steiner, M. Murkovic, G. S.
Nyanhongo, G. M. Guebitz. Antioxidant activity assay based on
laccase‐generated radicals. Anal. Bioanal. Chem. (2009) 393, 679 ‐
687.
(74) A. Andreu‐Navarro, J. M. Fernández‐Romero, A. Gómez‐Hens.
Determination of polyphenolic content in beverages using laccase,
gold nanoparticles and long wavelength fluorimetry. Anal. Chim.
Acta (2012) 713, 1‐6.
(75) J. Robinson (Ed.) “Oxford companion to wine” 3rd edition. (2006) 35
– 36.
(76) Maximum acceptable limits of various substances contained in
wine. Compendium of International Methods of Analysis, OIV, OIV‐
MA‐C1‐01:R2011.
(77) K. Kuningas, T. Rantanen, T. Ukonaho, T. Lövgren, T. Soukka.
Homogeneous assay technology based on upconverting phosphors.
Anal. Chem. (2005) 77, 7348 – 7355
(78) K. Kuningas, T. Ukonaho, H. Pakkilä, T. Rantanen, J. Rosenberg, T.
Lövgren, T. Soukka. Upconversion fluorescence resonance energy

Capítulo 5
‐ 342 ‐
transfer in a homogeneous immunoassay for estradiol. Anal. Chem.
(2006) 78, 4690 – 4696.
(79) T. Rantanen, H. Päkkilä, L. Jämsen, K. Kuningas, T. Ukonaho, T.
Lövgren, T. Soukka. Tandem dye acceptor used to enhance
upconversion fluorescence resonance energy transfer in
homogeneous assays. Anal. Chem. (2007) 79, 6312 – 6318.
Discussion of the results
‐ 343 ‐
Introduction
The features of the methods developed in this Dissertation are
discussed in this chapter. A comparative study of their advantages and
disadvantages to the methods previously described on the literature is
carried out. Also, the usefulness of the proposed methodologies by their
application to food analysis is discussed.
This chapter is structured in three sections: 1) Silica nanoparticles in
food analysis, 2) New strategies for the determination of antioxidants in
foods and 3) New investigations in the use of upconverting phosphors in
luminescence resonance energy transfer systems.
1. Silica nanoparticles in food analysis.
As it has been previously described, the use of nanomaterials is
having a huge growth in different areas of Analytical Chemistry [1 – 5].
Among the wide range of nanomaterials currently available, the use of
silica nanoparticles (SiO2NPs) has rapidly grown in the last decade due to
their excellent properties, which are especially appropriate for their use as
labels in bioanalysis. The results achieved with these NPs in the three
articles included in this Dissertation will be discussed in the next section.
Synthesis and characterization of long‐wavelength fluorophore‐
doped silica nanoparticles
The use of SiO2NPs as alternative labels in methods with optical
detection is very interesting due to transparency of silica to visible light, as
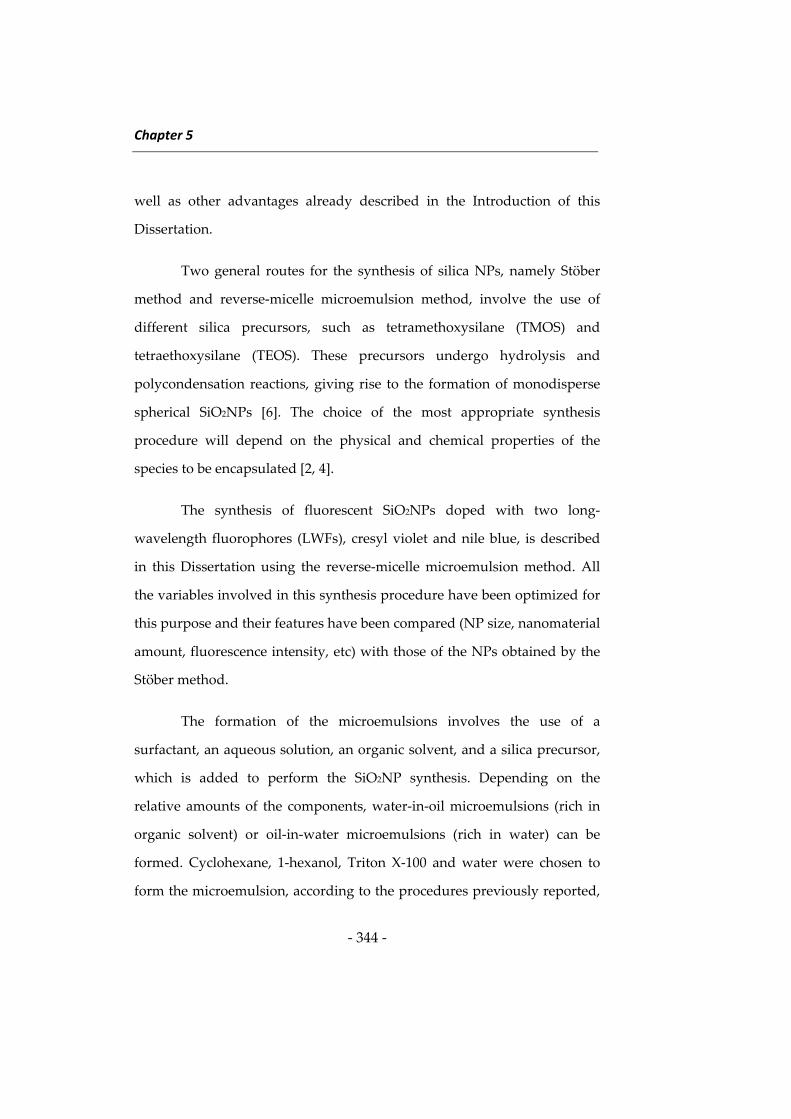
Chapter 5
‐ 344 ‐
well as other advantages already described in the Introduction of this
Dissertation.
Two general routes for the synthesis of silica NPs, namely Stöber
method and reverse‐micelle microemulsion method, involve the use of
different silica precursors, such as tetramethoxysilane (TMOS) and
tetraethoxysilane (TEOS). These precursors undergo hydrolysis and
polycondensation reactions, giving rise to the formation of monodisperse
spherical SiO2NPs [6]. The choice of the most appropriate synthesis
procedure will depend on the physical and chemical properties of the
species to be encapsulated [2, 4].
The synthesis of fluorescent SiO2NPs doped with two long‐
wavelength fluorophores (LWFs), cresyl violet and nile blue, is described
in this Dissertation using the reverse‐micelle microemulsion method. All
the variables involved in this synthesis procedure have been optimized for
this purpose and their features have been compared (NP size, nanomaterial
amount, fluorescence intensity, etc) with those of the NPs obtained by the
Stöber method.
The formation of the microemulsions involves the use of a
surfactant, an aqueous solution, an organic solvent, and a silica precursor,
which is added to perform the SiO2NP synthesis. Depending on the
relative amounts of the components, water‐in‐oil microemulsions (rich in
organic solvent) or oil‐in‐water microemulsions (rich in water) can be
formed. Cyclohexane, 1‐hexanol, Triton X‐100 and water were chosen to
form the microemulsion, according to the procedures previously reported,
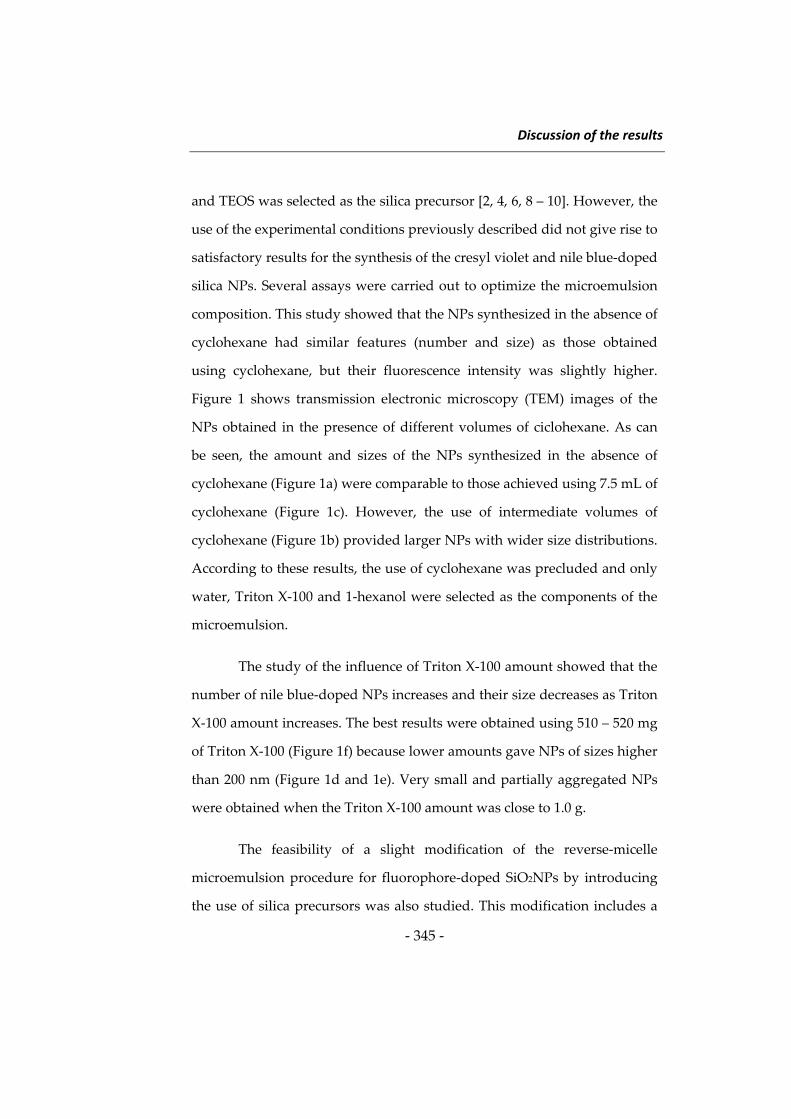
Discussion of the results
‐ 345 ‐
and TEOS was selected as the silica precursor [2, 4, 6, 8 – 10]. However, the
use of the experimental conditions previously described did not give rise to
satisfactory results for the synthesis of the cresyl violet and nile blue‐doped
silica NPs. Several assays were carried out to optimize the microemulsion
composition. This study showed that the NPs synthesized in the absence of
cyclohexane had similar features (number and size) as those obtained
using cyclohexane, but their fluorescence intensity was slightly higher.
Figure 1 shows transmission electronic microscopy (TEM) images of the
NPs obtained in the presence of different volumes of ciclohexane. As can
be seen, the amount and sizes of the NPs synthesized in the absence of
cyclohexane (Figure 1a) were comparable to those achieved using 7.5 mL of
cyclohexane (Figure 1c). However, the use of intermediate volumes of
cyclohexane (Figure 1b) provided larger NPs with wider size distributions.
According to these results, the use of cyclohexane was precluded and only
water, Triton X‐100 and 1‐hexanol were selected as the components of the
microemulsion.
The study of the influence of Triton X‐100 amount showed that the
number of nile blue‐doped NPs increases and their size decreases as Triton
X‐100 amount increases. The best results were obtained using 510 – 520 mg
of Triton X‐100 (Figure 1f) because lower amounts gave NPs of sizes higher
than 200 nm (Figure 1d and 1e). Very small and partially aggregated NPs
were obtained when the Triton X‐100 amount was close to 1.0 g.
The feasibility of a slight modification of the reverse‐micelle
microemulsion procedure for fluorophore‐doped SiO2NPs by introducing
the use of silica precursors was also studied. This modification includes a
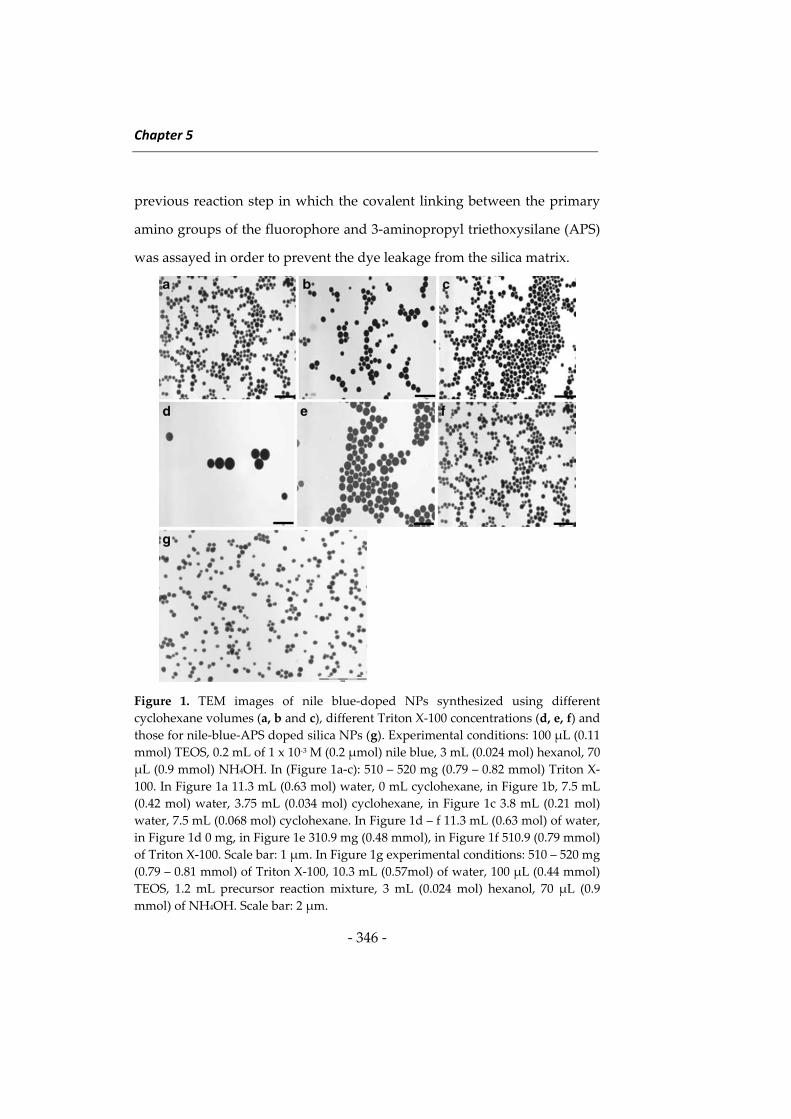
Chapter 5
‐ 346 ‐
previous reaction step in which the covalent linking between the primary
amino groups of the fluorophore and 3‐aminopropyl triethoxysilane (APS)
was assayed in order to prevent the dye leakage from the silica matrix.
Figure 1. TEM images of nile blue‐doped NPs synthesized using different
cyclohexane volumes (a, b and c), different Triton X‐100 concentrations (d, e, f) and
those for nile‐blue‐APS doped silica NPs (g). Experimental conditions: 100 μL (0.11
mmol) TEOS, 0.2 mL of 1 x 10‐3 M (0.2 μmol) nile blue, 3 mL (0.024 mol) hexanol, 70
μL (0.9 mmol) NH4OH. In (Figure 1a‐c): 510 – 520 mg (0.79 – 0.82 mmol) Triton X‐
100. In Figure 1a 11.3 mL (0.63 mol) water, 0 mL cyclohexane, in Figure 1b, 7.5 mL
(0.42 mol) water, 3.75 mL (0.034 mol) cyclohexane, in Figure 1c 3.8 mL (0.21 mol)
water, 7.5 mL (0.068 mol) cyclohexane. In Figure 1d – f 11.3 mL (0.63 mol) of water,
in Figure 1d 0 mg, in Figure 1e 310.9 mg (0.48 mmol), in Figure 1f 510.9 (0.79 mmol)
of Triton X‐100. Scale bar: 1 μm. In Figure 1g experimental conditions: 510 – 520 mg
(0.79 – 0.81 mmol) of Triton X‐100, 10.3 mL (0.57mol) of water, 100 μL (0.44 mmol)
TEOS, 1.2 mL precursor reaction mixture, 3 mL (0.024 mol) hexanol, 70 μL (0.9
mmol) of NH4OH. Scale bar: 2 μm.
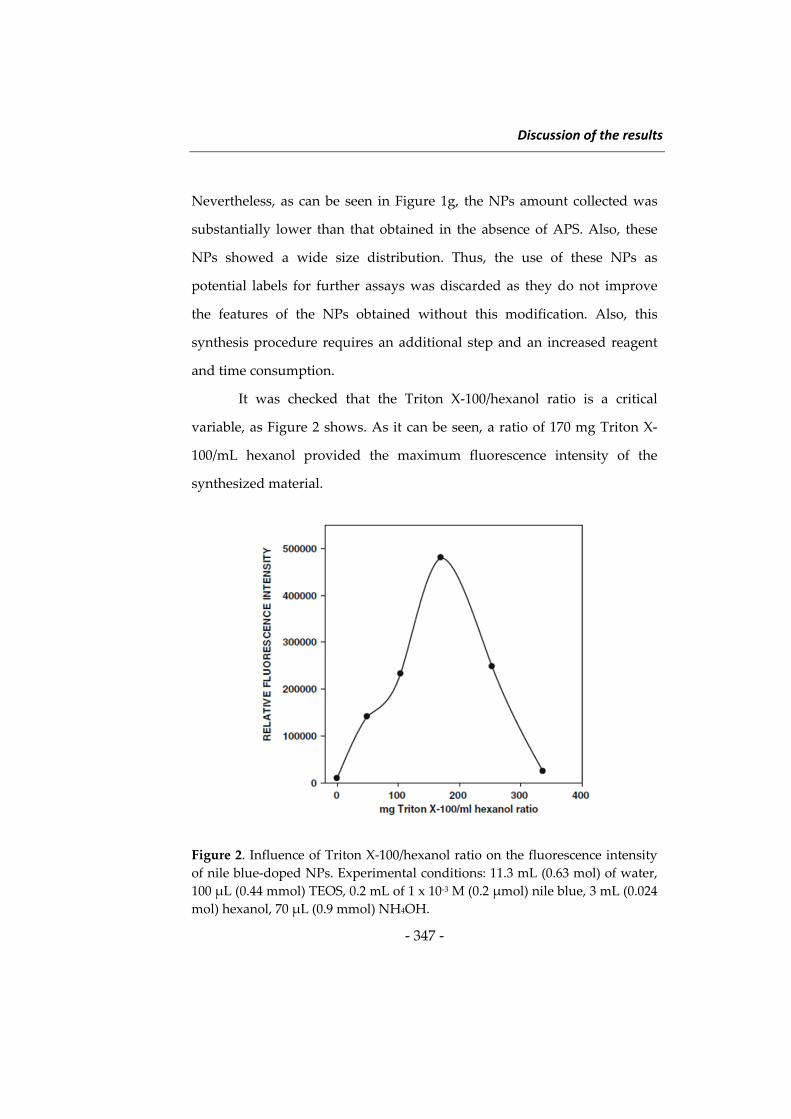
Discussion of the results
‐ 347 ‐
Nevertheless, as can be seen in Figure 1g, the NPs amount collected was
substantially lower than that obtained in the absence of APS. Also, these
NPs showed a wide size distribution. Thus, the use of these NPs as
potential labels for further assays was discarded as they do not improve
the features of the NPs obtained without this modification. Also, this
synthesis procedure requires an additional step and an increased reagent
and time consumption.
It was checked that the Triton X‐100/hexanol ratio is a critical
variable, as Figure 2 shows. As it can be seen, a ratio of 170 mg Triton X‐
100/mL hexanol provided the maximum fluorescence intensity of the
synthesized material.
Figure 2. Influence of Triton X‐100/hexanol ratio on the fluorescence intensity
of nile blue‐doped NPs. Experimental conditions: 11.3 mL (0.63 mol) of water,
100 μL (0.44 mmol) TEOS, 0.2 mL of 1 x 10‐3 M (0.2 μmol) nile blue, 3 mL (0.024
mol) hexanol, 70 μL (0.9 mmol) NH4OH.
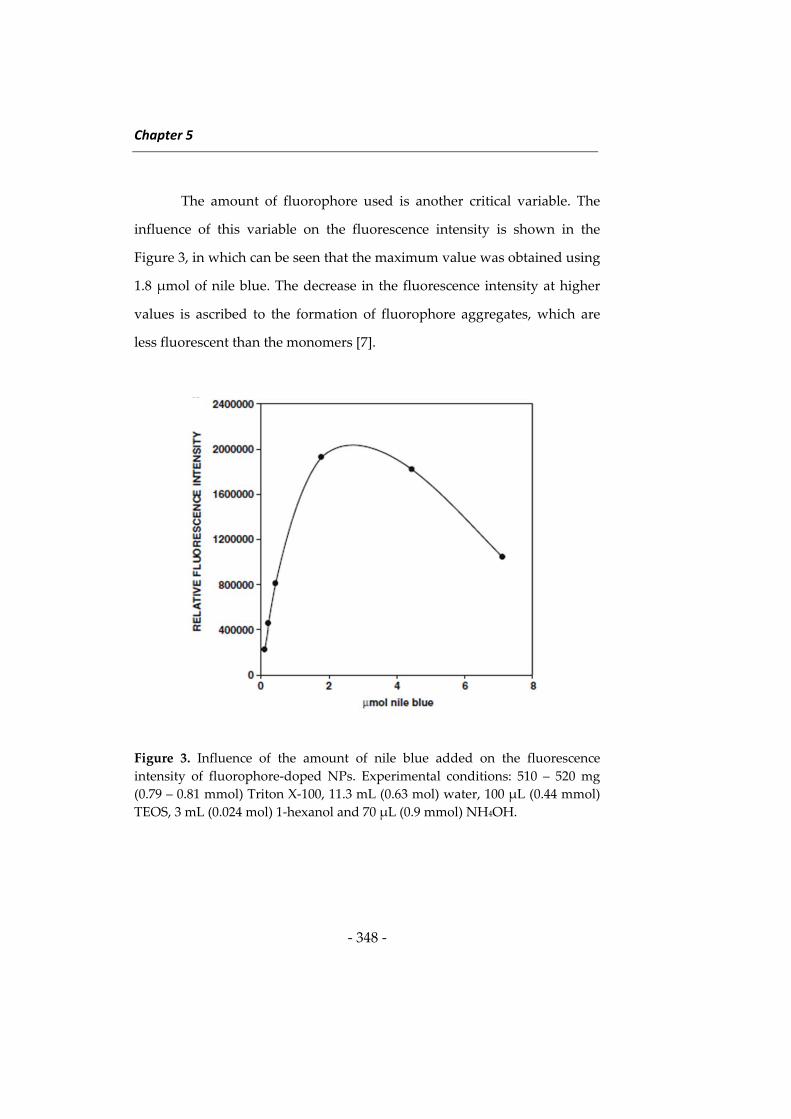
Chapter 5
‐ 348 ‐
The amount of fluorophore used is another critical variable. The
influence of this variable on the fluorescence intensity is shown in the
Figure 3, in which can be seen that the maximum value was obtained using
1.8 μmol of nile blue. The decrease in the fluorescence intensity at higher
values is ascribed to the formation of fluorophore aggregates, which are
less fluorescent than the monomers [7].
Figure 3. Influence of the amount of nile blue added on the fluorescence
intensity of fluorophore‐doped NPs. Experimental conditions: 510 – 520 mg
(0.79 – 0.81 mmol) Triton X‐100, 11.3 mL (0.63 mol) water, 100 μL (0.44 mmol)
TEOS, 3 mL (0.024 mol) 1‐hexanol and 70 μL (0.9 mmol) NH4OH.
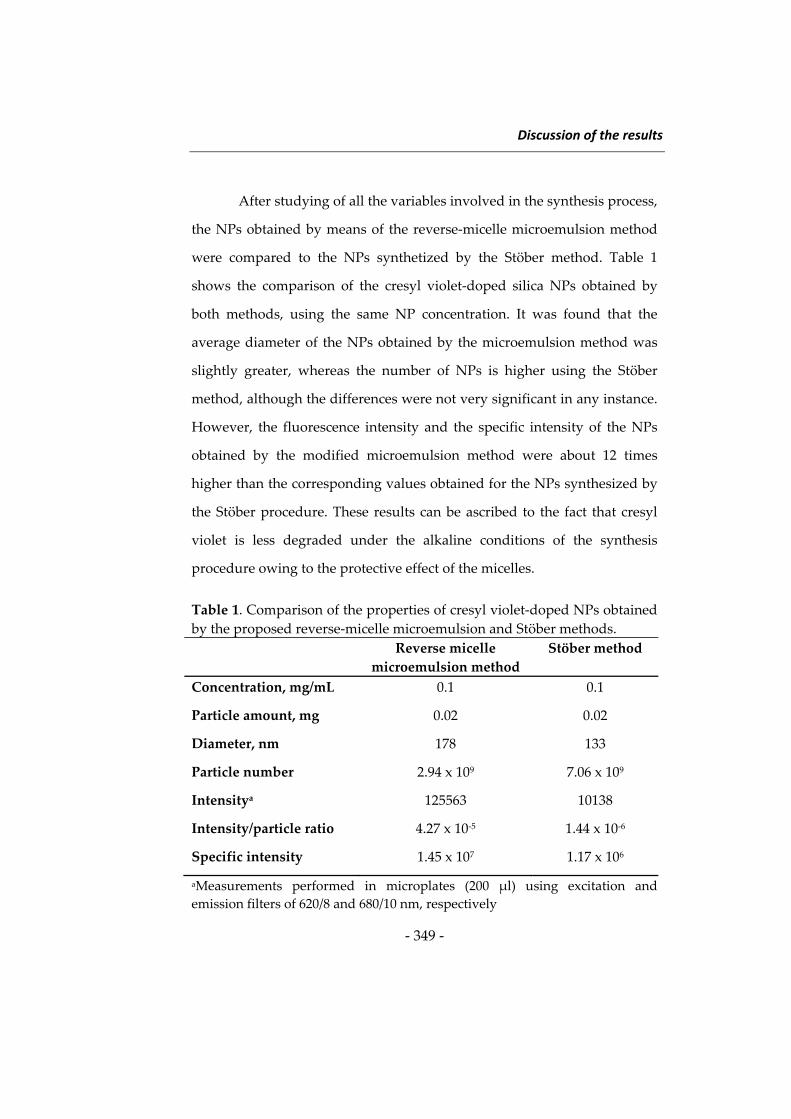
Discussion of the results
‐ 349 ‐
After studying of all the variables involved in the synthesis process,
the NPs obtained by means of the reverse‐micelle microemulsion method
were compared to the NPs synthetized by the Stöber method. Table 1
shows the comparison of the cresyl violet‐doped silica NPs obtained by
both methods, using the same NP concentration. It was found that the
average diameter of the NPs obtained by the microemulsion method was
slightly greater, whereas the number of NPs is higher using the Stöber
method, although the differences were not very significant in any instance.
However, the fluorescence intensity and the specific intensity of the NPs
obtained by the modified microemulsion method were about 12 times
higher than the corresponding values obtained for the NPs synthesized by
the Stöber procedure. These results can be ascribed to the fact that cresyl
violet is less degraded under the alkaline conditions of the synthesis
procedure owing to the protective effect of the micelles.
Table 1. Comparison of the properties of cresyl violet‐doped NPs obtained
by the proposed reverse‐micelle microemulsion and Stöber methods.
Reverse micelle
microemulsion method
Stöber method
Concentration, mg/mL 0.1 0.1
Particle amount, mg 0.02 0.02
Diameter, nm 178 133
Particle number 2.94 x 10⁹ 7.06 x 10⁹
Intensitya 125563 10138
Intensity/particle ratio 4.27 x 10‐5 1.44 x 10‐6
Specific intensity 1.45 x 10⁷ 1.17 x 10⁶
aMeasurements performed in microplates (200 μl) using excitation and
emission filters of 620/8 and 680/10 nm, respectively
Chapter 5
‐ 350 ‐
The spectral features of the synthesized NPs were compared to
those shown by the dyes in solution and by bare SiO2NPs. The emission
maxima of the oxazine‐doped SiO2NPs showed a hypsochromic shift of
about 9 nm, when compared to the emission maxima of the fluorophores in
solution, whereas the bare SiO2NPs did not show any fluorescent signal.
The synthesized NPs in aqueous solution were irradiated at their
corresponding maximum excitation wavelength for one hour to investigate
their potential photobleaching and the results were compared to those
obtained for the dyes in solution. The fluorescence intensity of cresyl violet
and nile blue in solution showed a fluorescence decrease of about 72 % and
65 %, respectively, but the fluorescence intensity of both cresyl violet and
nile blue‐doped NPs remained almost constant. The same study was
carried out for the SiO2NPs prepared by using the nile blue‐APS mixture,
obtaining a decrease of about a 10 % of the initial fluorescence intensity.
Also, the stability of the fluorescent SiO2NPs was checked over time and it
was found that the luminescence intensity was constant for at least one
month.
In summary, it can be confirmed that the modified reverse‐micelle
microemulsion method to synthesize two types of LWFs‐doped silica NPs,
using nile blue and cresyl violet, provides NPs with similar characteristics
(size, amount and average diameter) as those obtained by means of the
Stöber method, which is considered as a reference method. However, the
fluorescence intensity of the NPs synthetized by the first method is higher
than that of NPs obtained by the Stöber method. This behavior can be
Discussion of the results
‐ 351 ‐
ascribed to the stability and protection that the microemulsion used to
perform the synthesis confers to the LWFs.
Utilization of silica nanoparticles in heterogeneous
immunoassay for the determination of macromolecules and
small molecules
The determination of biomolecules is an application field of great
interest in Analytical Chemistry. A high number of chromatographic and
electrophoretic methods have been developed for the determination of
macromolecules and small molecules [11 – 15]. Usually, these techniques
require that the analyte shows a measurable property, such as absorbance
or fluorescence. Otherwise, the use of a derivatization step is required,
which lengthens and complicates the analysis [16, 17]. Although
chromatographic methods with mass spectrometry detection are available,
they require sophisticated and expensive instrumentation [18 – 20]. Also,
these methods usually involve time‐consuming sample treatment steps to
remove the sample matrix. The use of screening methods plays two
essential roles: in one hand, the number of samples subjected to
confirmatory analysis is lower and, on the other, the cost of the analysis is
reduced. Immunoassays, which can be used for quantitative or semi‐
quantitative purposes, have shown their usefulness as screening methods
for the determination of antigenic substances, either small molecules
(haptens) or macromolecules. Numerous commercial and non‐commercial
enzyme‐linked immunosorbent assays (ELISAs) have been described for
this purpose [21 – 25]. A high percentage of these methods involve the use
of photometric measurements, reaching detection limits close to ng/mL,
Chapter 5
‐ 352 ‐
but lower values can be obtained using chemiluminescence detection [26]
or time‐resolved luminescence detection with europium(III) chelates as
labels [27, 28].
The use of functionalized inorganic NPs as labels in immunoassays
is a relatively new trend justified by their versatile physicochemical
properties, which allow the improvement of these assays features [29 – 31].
Among these NPs, doped SiO2NPs are a useful option owing to their above
mentioned characteristics. These SiO2NPs can encapsulate a wide variety of
compounds, which are protected from environmental factors. Also, they
show large surface area and easy surface functionalization. These
properties have given rise to a great variety of immunoassays devoted to
the determination of macromolecules and haptens [32, 33]. For example, a
method for the determination of E. Coli using tris(bipyridine)ruthenium
(II)‐doped NPs has been developed by immobilizing the antibody on the
NP surface, which has allowed the determination of only one bacteria
without using of an enhancement signal procedure [34]. Similarly, bovine
serum albumin (BSA) has been determined by a streptavidin‐biotin affinity
assay using rhodamine 6G‐doped SiO2NPs as labels [35]. Also, the
determination of α‐fetoprotein (AFP) and hepatitis B surface antigen
(HBsAg) have been reported by using fluorescein‐doped SiO2NPs [36, 37].
These SiO2NPs can also encapsulate other species such as terbium and
europium chelates, which have been used as labels to determine HBsAg,
carcinoembrionic antigen (CEA) and prostate‐specific antigen (PSA) [38 –
40]. From these examples it can be inferred that doped SiO2NPs have been
Discussion of the results
‐ 353 ‐
mainly used in clinical analysis, which clearly justifies the investigations
performed to develop immunoassays for food analysis.
The immunoassays described in this Dissertation have used nile
blue‐doped SiO2NPs as labels for the determination of soy proteins
(macromolecules) and the veterinary antibiotic monensin, which presence
in food is regulated by the European Union. The results obtained have
demonstrated that the use of these NPs provides some advantages over
other immunoassays, such as lower detection limits and, in the case of
ELISAs, fewer steps because the use of a substrate to measure the
enzymatic activity is not required.
Nile blue‐doped SiO2NPs were chosen to use long‐wavelength
fluorescence measurements, which provide a suitable spectral selectivity,
avoiding the background signal from the sample matrix. As mentioned
above, a potential limitation of doped SiO2NPs is the potential leakage of
the fluorophore from the silica matrix. However, nile blue‐doped SiO2NPs
show an excellent stability due to the electrostatic interactions between the
positively charged fluorophore and the negatively charged silanol groups.
The results obtained in the immunoassays developed in this
Dissertation are discussed below.
Determination of soy proteins by heterogeneous immunoassay
In recent years, the global consumption of soy foodstuffs has
increased because of their reported beneficial effect on nutrition and
health, such as decrease of plasma cholesterol, prevention of cancer,
Chapter 5
‐ 354 ‐
diabetes and obesity, and protection against bowel and kidney diseases.
However, it has also been described that soy proteins can produce allergic
responses in some people.
A competitive heterogeneous immunoassay for the determination
of soy proteins in food samples, using nile blue‐doped SiO2NPs as labels,
has been developed in this Dissertation. For this purpose, two different
formats either involving analyte capture or antibody capture were assayed,
respectively (Figures 4 and 5). These NPs were coupled to either soy
proteins or to anti‐soy protein antibodies to study the potential use of the
corresponding tracers for the development of the two immunoassay
formats. The analyte capture format (Figure 4) involves the immobilization
of anti‐soy protein onto the wells, after the previous immobilization of
anti‐rabbit IgG antibodies, and the use of the tracer composed of soy
protein linked to nile blue‐doped SiO2NPs. The use of anti‐rabbit IgG
antibodies to immobilize the anti‐soy protein antibodies reduces the
consumption of these antibodies and, therefore, the total cost of the
immunoassay. However, although the well surface was coated with BSA at
different concentrations, non‐specific interactions of the tracer with the
anti‐rabbit IgG antibodies were still observed, so that this approach was
unsuitable.
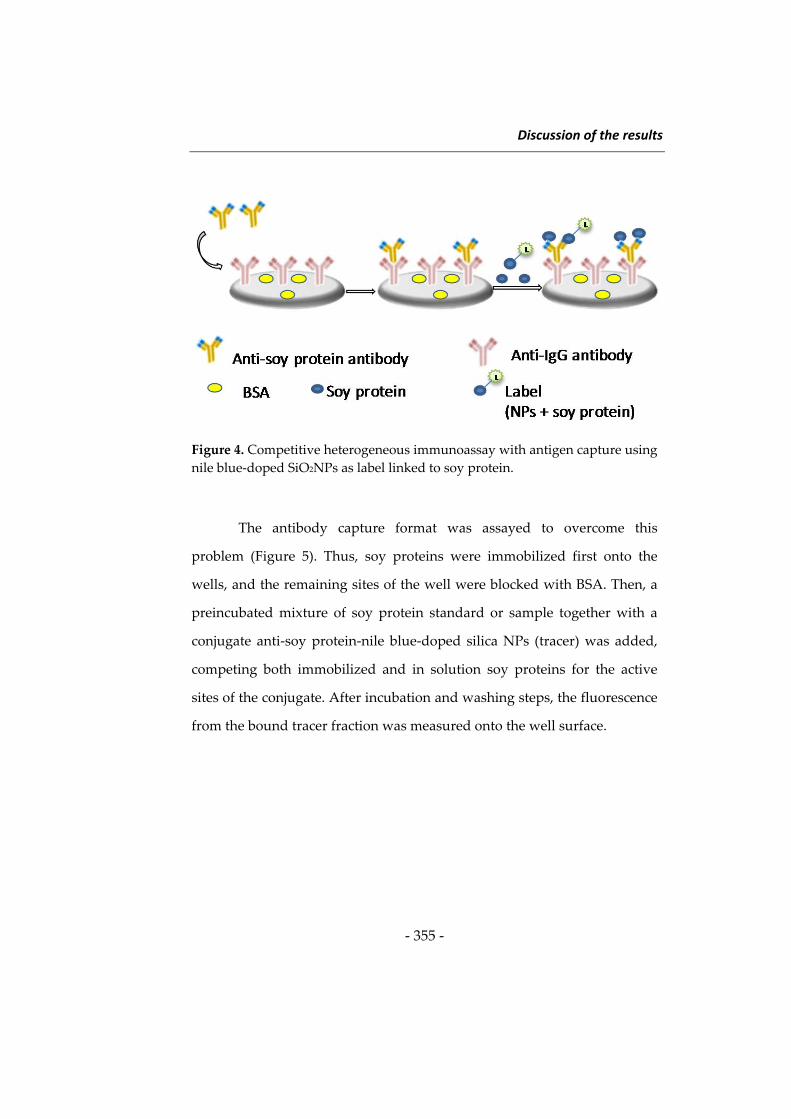
Discussion of the results
‐ 355 ‐
Figure 4. Competitive heterogeneous immunoassay with antigen capture using
nile blue‐doped SiO2NPs as label linked to soy protein.
The antibody capture format was assayed to overcome this
problem (Figure 5). Thus, soy proteins were immobilized first onto the
wells, and the remaining sites of the well were blocked with BSA. Then, a
preincubated mixture of soy protein standard or sample together with a
conjugate anti‐soy protein‐nile blue‐doped silica NPs (tracer) was added,
competing both immobilized and in solution soy proteins for the active
sites of the conjugate. After incubation and washing steps, the fluorescence
from the bound tracer fraction was measured onto the well surface.
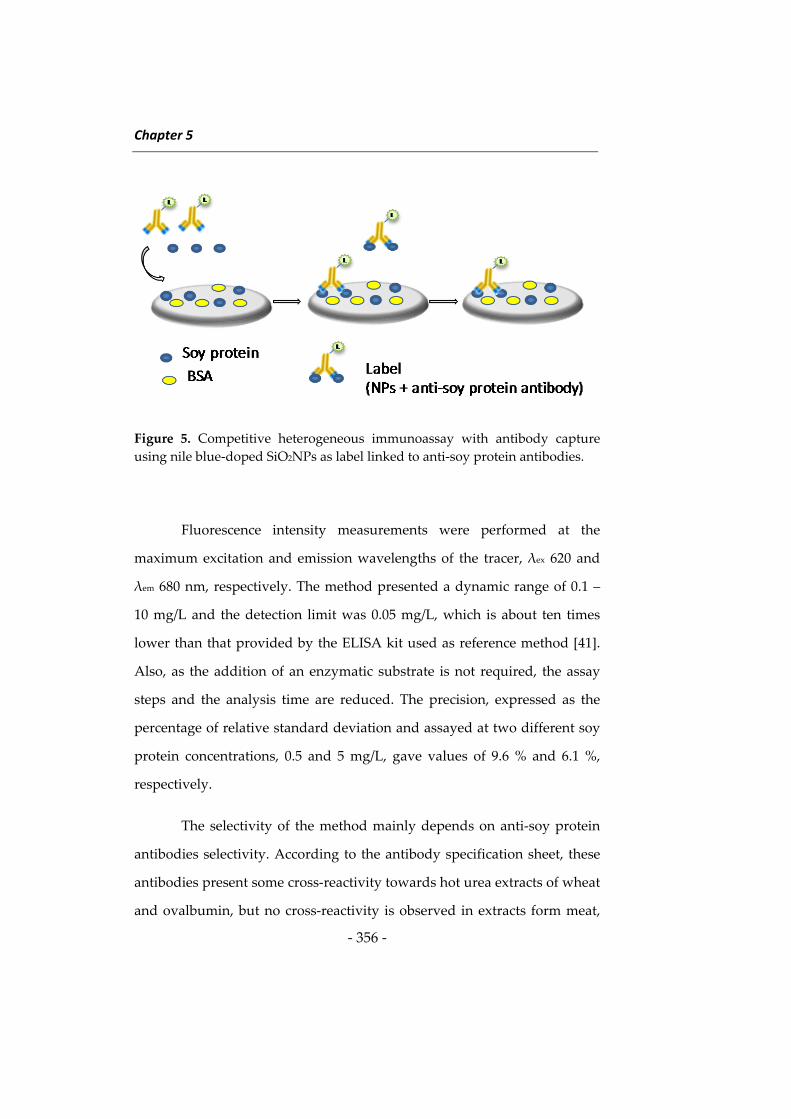
Chapter 5
‐ 356 ‐
Figure 5. Competitive heterogeneous immunoassay with antibody capture
using nile blue‐doped SiO2NPs as label linked to anti‐soy protein antibodies.
Fluorescence intensity measurements were performed at the
maximum excitation and emission wavelengths of the tracer, λex 620 and
λem 680 nm, respectively. The method presented a dynamic range of 0.1 –
10 mg/L and the detection limit was 0.05 mg/L, which is about ten times
lower than that provided by the ELISA kit used as reference method [41].
Also, as the addition of an enzymatic substrate is not required, the assay
steps and the analysis time are reduced. The precision, expressed as the
percentage of relative standard deviation and assayed at two different soy
protein concentrations, 0.5 and 5 mg/L, gave values of 9.6 % and 6.1 %,
respectively.
The selectivity of the method mainly depends on anti‐soy protein
antibodies selectivity. According to the antibody specification sheet, these
antibodies present some cross‐reactivity towards hot urea extracts of wheat
and ovalbumin, but no cross‐reactivity is observed in extracts form meat,
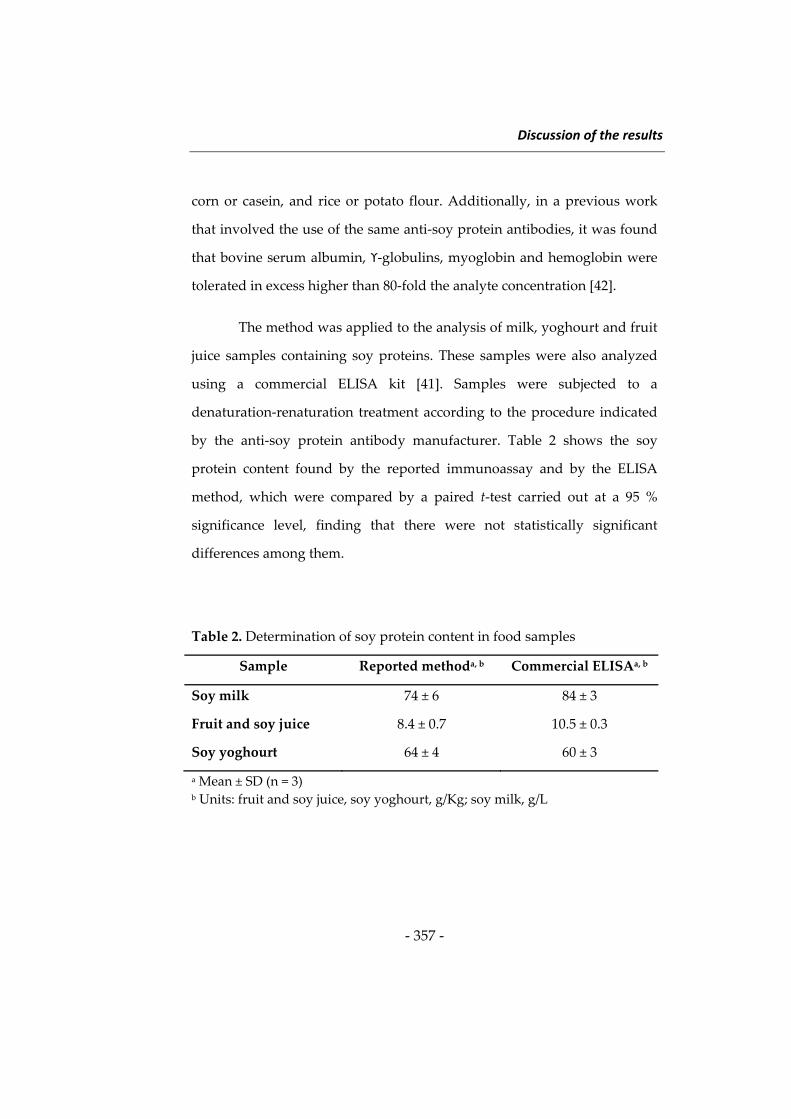
Discussion of the results
‐ 357 ‐
corn or casein, and rice or potato flour. Additionally, in a previous work
that involved the use of the same anti‐soy protein antibodies, it was found
that bovine serum albumin, ϒ‐globulins, myoglobin and hemoglobin were
tolerated in excess higher than 80‐fold the analyte concentration [42].
The method was applied to the analysis of milk, yoghourt and fruit
juice samples containing soy proteins. These samples were also analyzed
using a commercial ELISA kit [41]. Samples were subjected to a
denaturation‐renaturation treatment according to the procedure indicated
by the anti‐soy protein antibody manufacturer. Table 2 shows the soy
protein content found by the reported immunoassay and by the ELISA
method, which were compared by a paired t‐test carried out at a 95 %
significance level, finding that there were not statistically significant
differences among them.
Table 2. Determination of soy protein content in food samples
Sample Reported methoda, b Commercial ELISAa, b
Soy milk 74 ± 6 84 ± 3
Fruit and soy juice 8.4 ± 0.7 10.5 ± 0.3
Soy yoghourt 64 ± 4 60 ± 3
a Mean ± SD (n = 3) b Units: fruit and soy juice, soy yoghourt, g/Kg; soy milk, g/L
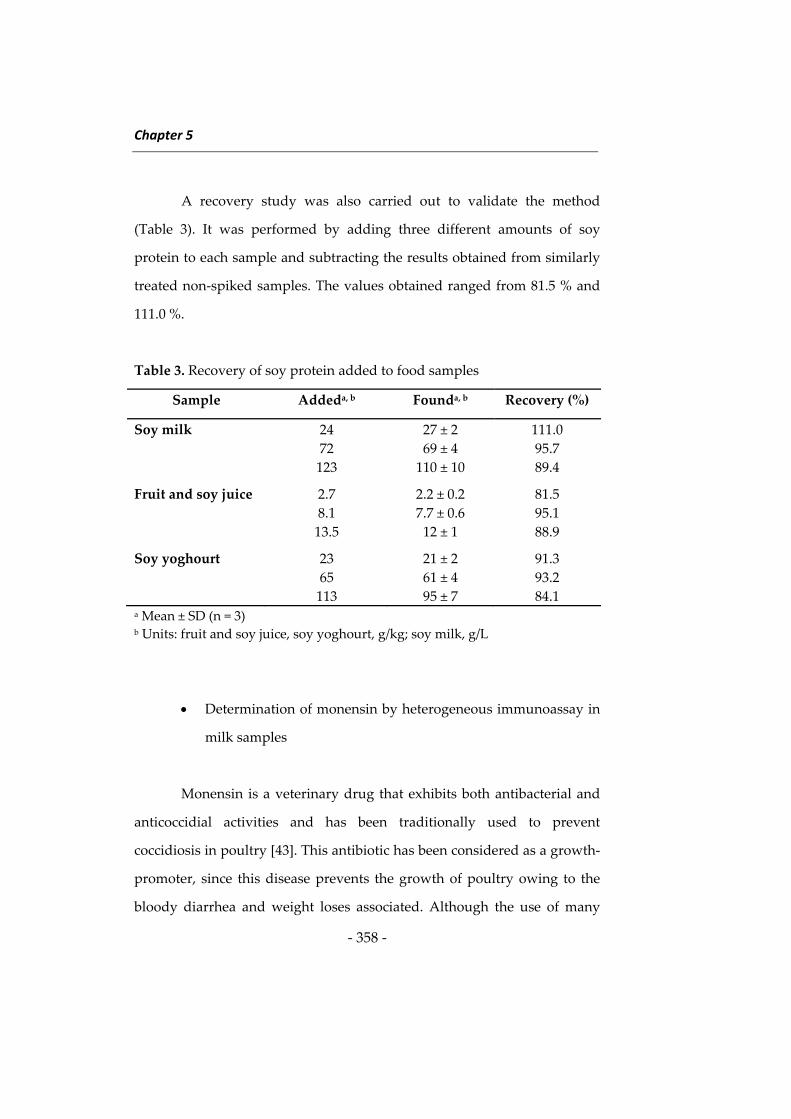
Chapter 5
‐ 358 ‐
A recovery study was also carried out to validate the method
(Table 3). It was performed by adding three different amounts of soy
protein to each sample and subtracting the results obtained from similarly
treated non‐spiked samples. The values obtained ranged from 81.5 % and
111.0 %.
Table 3. Recovery of soy protein added to food samples
Sample Addeda, b Founda, b Recovery (%)
Soy milk 24 27 ± 2 111.0
72 69 ± 4 95.7
123 110 ± 10 89.4
Fruit and soy juice 2.7 2.2 ± 0.2 81.5
8.1 7.7 ± 0.6 95.1
13.5 12 ± 1 88.9
Soy yoghourt 23 21 ± 2 91.3
65 61 ± 4 93.2
113 95 ± 7 84.1 a Mean ± SD (n = 3) b Units: fruit and soy juice, soy yoghourt, g/kg; soy milk, g/L
Determination of monensin by heterogeneous immunoassay in
milk samples
Monensin is a veterinary drug that exhibits both antibacterial and
anticoccidial activities and has been traditionally used to prevent
coccidiosis in poultry [43]. This antibiotic has been considered as a growth‐
promoter, since this disease prevents the growth of poultry owing to the
bloody diarrhea and weight loses associated. Although the use of many
Discussion of the results
‐ 359 ‐
veterinary antibiotics as growth promoters has been banned since 2006,
they can be still administered to some species according to the European
Union regulation [44]. Also, the treatment with monensin has been
extended to calves for the European Union with maximum residue limits.
The concern on food safety has led to the search for reliable
analytical methods to screen and confirm the presence of antibiotic
residues in foodstuffs, which contribute to increase bacterial resistance to
antibiotics.
The first immunoassay for monensin determination using nile blue‐
doped SiO2NPs as labels has been presented in this Dissertation. The
usefulness of this approach to improve the analytical features, such as the
detection limit, of the immunoassays previously described using enzymatic
labels for the determination of this drug is shown [22, 45 – 48].
As it has been previously indicated, the use of nile blue‐doped
SiO2NPs as labels provides the spectral selectivity required to avoid
interferences from the sample matrix. In addition, the encapsulated
fluorophore inside the NPs shows an excellent stability to the action of
environmental agents and the incident light, avoiding photobleaching
phenomena. These features justify the use of these NPs as labels in
immunoassays. Another advantage of the new method is the use of 96‐well
microplates with 100‐μL wells, which reduces the sample and tracer
volumes required in comparison to the conventional 300‐μL wells, which
contributes to minimize the costs associated with the immunoassay and the
amount of waste generated. This plate type facilitates the use of front‐
Chapter 5
‐ 360 ‐
surface measurements as the distance between the well bottom and the
detector is shorter than that for conventional plates, which minimizes
fluorescence signal losses and improves the sensitivity.
As in the previous section, two heterogeneous immunoassays,
involving antibody or antigen capture format, were assayed to choose the
best option for monensin determination using nile blue‐doped SiO2NPs as
labels. The first format was based on the immobilization of a BSA‐
monensin conjugate and the use of an anti‐monensin antibody‐NP tracer.
The second assay needed a monensin‐NP tracer, synthesized via a
carbodiimide reaction using EDAC (N‐(3‐methylaminopropyl)‐N´‐
ethylcarbodiimide hydrochloride), and the immobilization of anti‐
monensin antibodies by coating the wells with anti‐sheep IgG. A
significant difference between the fluorescence intensity values obtained in
the absence and in the presence (0.2 μg/L) of monensin was reached in both
assays, but this difference was about 3‐fold higher for the antibody‐capture
format. Thus, this format was chosen to develop the new immunoassay for
monensin determination.
The method presents a dynamic range of 0.05 – 5 μg/L and the
detection and quantification limits are 0.015 and 0.05 μg/L, respectively,
which would correspond to 0.12 and 0.40 μg/Kg in the milk samples. The
latter value is about 5 times lower than the maximum residue limit (MRL)
set by the 37/2010/EC Commission Regulation for monensin in milk
samples. Also, the detection limit is four times lower than that reported
using ELISA with chemiluminescence detection [32]. The precision,
expressed as the percentage of relative standard deviation and assayed at
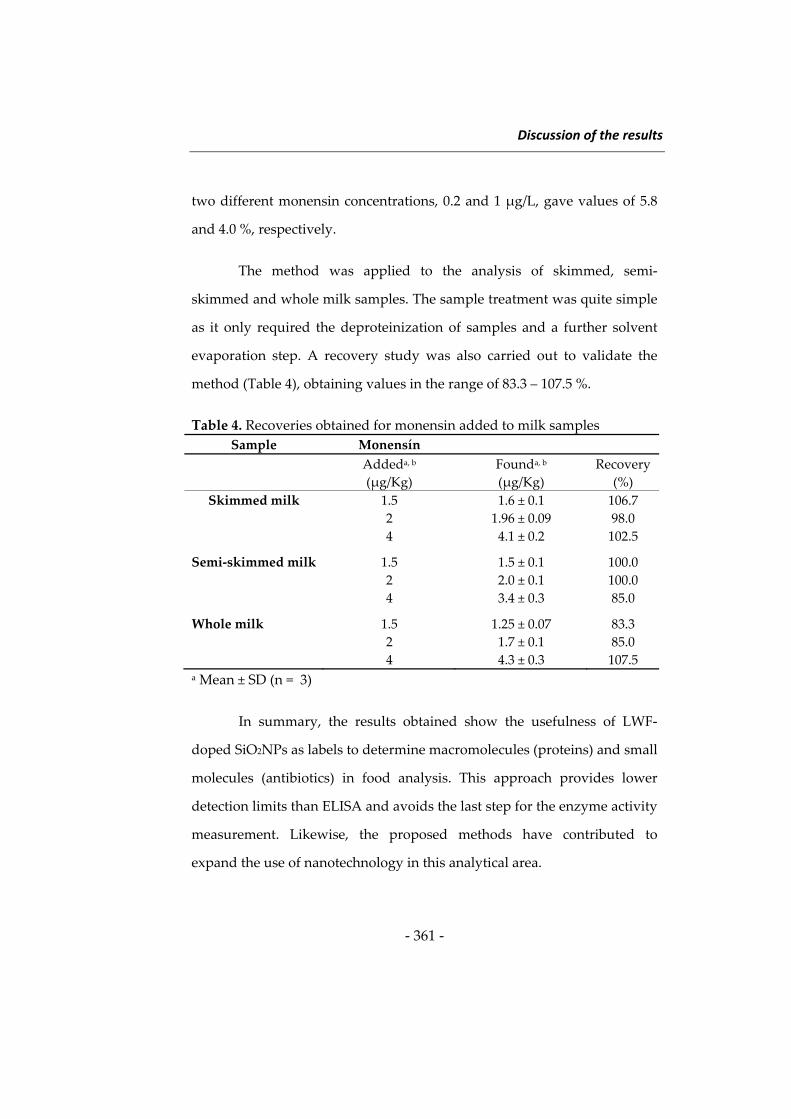
Discussion of the results
‐ 361 ‐
two different monensin concentrations, 0.2 and 1 μg/L, gave values of 5.8
and 4.0 %, respectively.
The method was applied to the analysis of skimmed, semi‐
skimmed and whole milk samples. The sample treatment was quite simple
as it only required the deproteinization of samples and a further solvent
evaporation step. A recovery study was also carried out to validate the
method (Table 4), obtaining values in the range of 83.3 – 107.5 %.
Table 4. Recoveries obtained for monensin added to milk samples
Sample Monensín
Addeda, b
(μg/Kg)
Founda, b
(μg/Kg)
Recovery
(%)
Skimmed milk 1.5 1.6 ± 0.1 106.7
2 1.96 ± 0.09 98.0
4 4.1 ± 0.2 102.5
Semi‐skimmed milk 1.5 1.5 ± 0.1 100.0
2 2.0 ± 0.1 100.0
4 3.4 ± 0.3 85.0
Whole milk 1.5 1.25 ± 0.07 83.3
2 1.7 ± 0.1 85.0
4 4.3 ± 0.3 107.5 a Mean ± SD (n = 3)
In summary, the results obtained show the usefulness of LWF‐
doped SiO2NPs as labels to determine macromolecules (proteins) and small
molecules (antibiotics) in food analysis. This approach provides lower
detection limits than ELISA and avoids the last step for the enzyme activity
measurement. Likewise, the proposed methods have contributed to
expand the use of nanotechnology in this analytical area.
Chapter 5
‐ 362 ‐
2. New strategies for the determination of antioxidants in foods
Oxidation processes involving free radicals contribute to the
development of many illnesses, such as cardiovascular disease,
Alzheimer´s disorder and cancer. This redox phenomenon is produced by
reactive oxygen species (ROS), which damage cell membranes, but this
effect can be minimized by the intake of antioxidant compounds. The
antioxidant capacity of foods is mainly ascribed to polyphenols, such as
flavonoids, and vitamins C and E, among others [49].
A method for the determination of the antioxidant capacity of some
food samples has been described in this Dissertation, which shows the
usefulness of long‐wavelength measurements. Another method for the
determination of polyphenols using nanomaterials as laccase enzyme
activators is also included. The features of both methods and their
applicability are discussed below.
Long‐wavelength fluorimetric determination of food
antioxidant capacity using nile blue as reagent
From an analytical point of view, there are two types of methods
for assessing food antioxidant capacity. The first group involves a single
electron‐transfer reaction, which can be followed by a change in the
solution color or fluorescence. The second group is based on the use of a
hydrogen atom transfer reaction, where the antioxidant and a substrate
compete for the free radicals generated. The oxygen radical absorbance
capacity (ORAC) assay, which belongs to the second group, involves the
use of a free radical generator that directly attacks either a chromophore or
Discussion of the results
‐ 363 ‐
a fluorophore, leading to the decrease of their absorbance or fluorescence,
respectively. The chromophore pyrogallol red [50] and the fluorophores β‐
phycoerythrin and fluorescein [51 – 57], have been used to develop this
assay. Despite the high sensitivity that the above‐mentioned fluorophores
offer, these compounds feature a relatively short Stokes shift (about 27
nm), which favors scattering phenomena. Also, β‐phycoerythrin is
relatively expensive and suffers from photobleaching, while fluorescein
emission is usually overlapped by the static background signals from the
sample matrix. The use of long‐wavelength fluorophores can avoid these
problems, but their potential application to the determination of the
antioxidant capacity has not been studied up to now.
An analytical method has been described in this Dissertation for
food antioxidant capacity determination by the ORAC assay using nile
blue as fluorescent probe, 2,2´‐azo‐bis‐(2‐methylpropionamidine)
dihydrochloride (AAPH), as free radical generator, and 6‐hydroxi‐2,5,7,8‐
tetramethylcroman‐2carboxylic acid (Trolox) as model analyte have been
used for this purpose. Fluorescent measurements were carried out in the
kinetic mode by monitoring the change of fluorescence over time and using
the normalized net area under the curve, AUCnet = (AUCsample –
AUCblanck)/AUCblanck), obtained for different analyte concentrations, as the
analytical parameter.
As it has been already mentioned, the traditional fluorophores used
for these assays have been β‐phycoerythrin and fluorescein, which show a
delay in their fluorescence quenching in the presence of antioxidant
compounds, but their use has the limitations above indicated. The potential
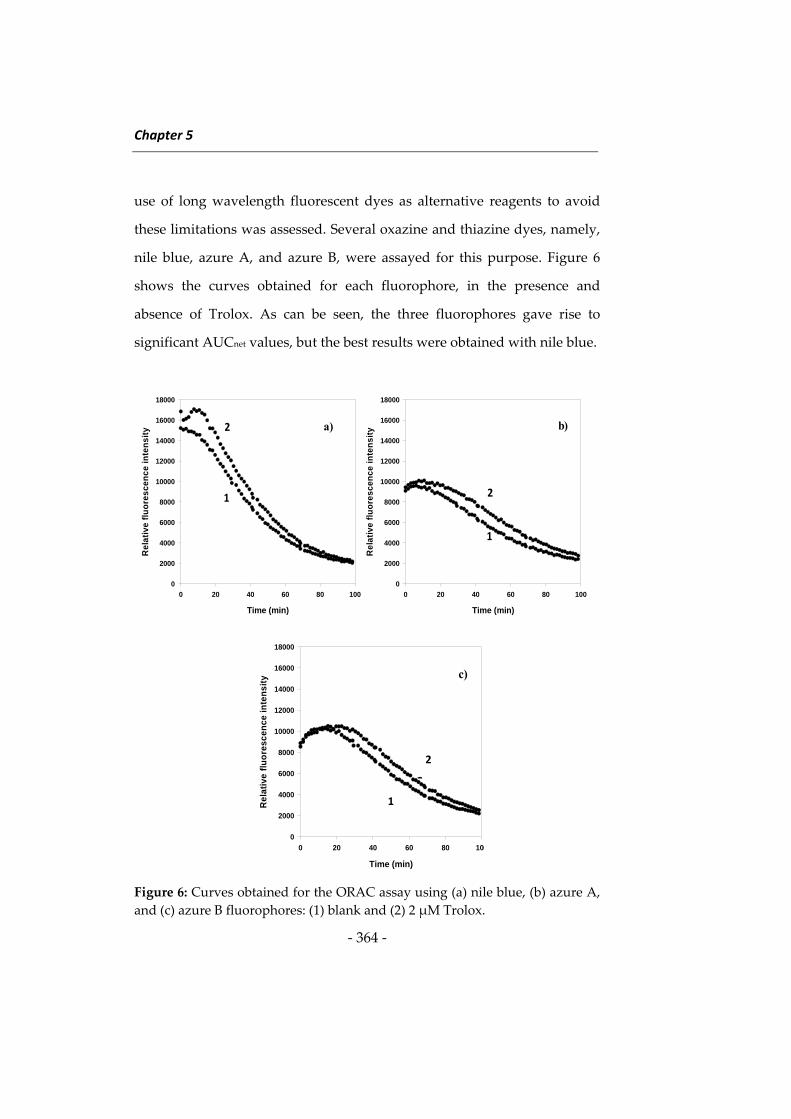
Chapter 5
‐ 364 ‐
use of long wavelength fluorescent dyes as alternative reagents to avoid
these limitations was assessed. Several oxazine and thiazine dyes, namely,
nile blue, azure A, and azure B, were assayed for this purpose. Figure 6
shows the curves obtained for each fluorophore, in the presence and
absence of Trolox. As can be seen, the three fluorophores gave rise to
significant AUCnet values, but the best results were obtained with nile blue.
Figure 6: Curves obtained for the ORAC assay using (a) nile blue, (b) azure A,
and (c) azure B fluorophores: (1) blank and (2) 2 μM Trolox.
Time (min)
0 20 40 60 80 100
Rel
ati
ve f
luo
res
cen
ce
inte
nsi
ty
0
2000
4000
6000
8000
10000
12000
14000
16000
18000
Time (min)
0 20 40 60 80 100
Rel
ati
ve f
luo
res
cen
ce
inte
nsi
ty
0
2000
4000
6000
8000
10000
12000
14000
16000
18000
a) b)
Time (min)
0 20 40 60 80 100
Rel
ati
ve f
luo
res
cen
ce
inte
nsi
ty
0
2000
4000
6000
8000
10000
12000
14000
16000
18000
Time (min)
0 20 40 60 80 100
Rel
ati
ve f
luo
res
cen
ce
inte
nsi
ty
0
2000
4000
6000
8000
10000
12000
14000
16000
18000
a) b)
1
2
1
2
Time (min)
0 20 40 60 80 10
Rel
ativ
e fl
uo
resc
ence
inte
ns
ity
0
2000
4000
6000
8000
10000
12000
14000
16000
18000
c)
Time (min)
0 20 40 60 80 10
Rel
ativ
e fl
uo
resc
ence
inte
ns
ity
0
2000
4000
6000
8000
10000
12000
14000
16000
18000
c)
1
2
2
1
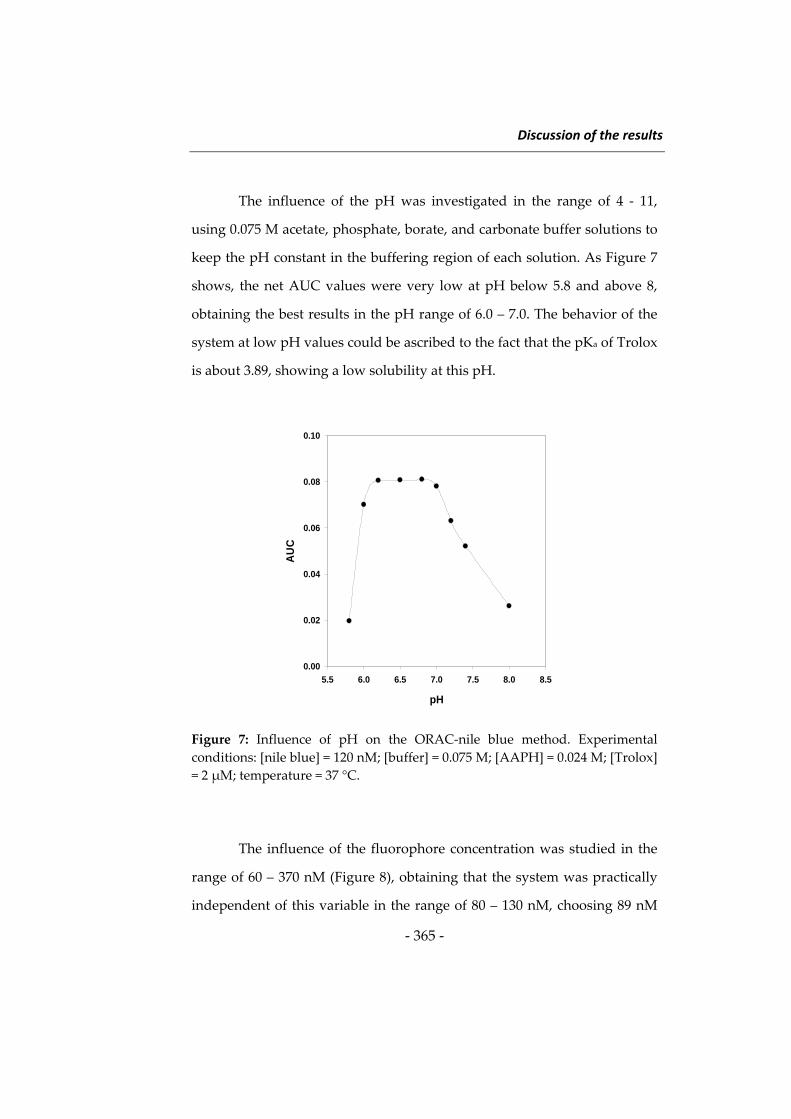
Discussion of the results
‐ 365 ‐
The influence of the pH was investigated in the range of 4 ‐ 11,
using 0.075 M acetate, phosphate, borate, and carbonate buffer solutions to
keep the pH constant in the buffering region of each solution. As Figure 7
shows, the net AUC values were very low at pH below 5.8 and above 8,
obtaining the best results in the pH range of 6.0 – 7.0. The behavior of the
system at low pH values could be ascribed to the fact that the pKa of Trolox
is about 3.89, showing a low solubility at this pH.
Figure 7: Influence of pH on the ORAC‐nile blue method. Experimental
conditions: [nile blue] = 120 nM; [buffer] = 0.075 M; [AAPH] = 0.024 M; [Trolox]
= 2 μM; temperature = 37 °C.
The influence of the fluorophore concentration was studied in the
range of 60 – 370 nM (Figure 8), obtaining that the system was practically
independent of this variable in the range of 80 – 130 nM, choosing 89 nM
pH
5.5 6.0 6.5 7.0 7.5 8.0 8.5
AU
C
0.00
0.02
0.04
0.06
0.08
0.10
A)
pH
5.5 6.0 6.5 7.0 7.5 8.0 8.5
AU
C
0.00
0.02
0.04
0.06
0.08
0.10
A)A)
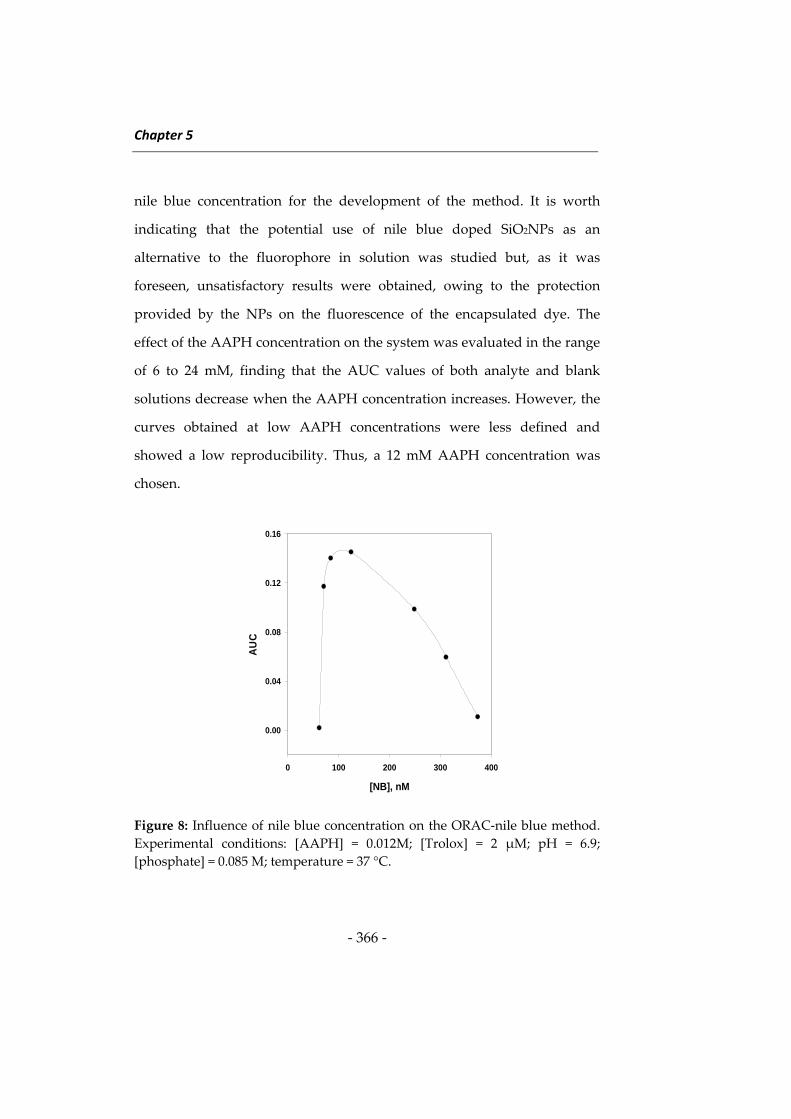
Chapter 5
‐ 366 ‐
nile blue concentration for the development of the method. It is worth
indicating that the potential use of nile blue doped SiO2NPs as an
alternative to the fluorophore in solution was studied but, as it was
foreseen, unsatisfactory results were obtained, owing to the protection
provided by the NPs on the fluorescence of the encapsulated dye. The
effect of the AAPH concentration on the system was evaluated in the range
of 6 to 24 mM, finding that the AUC values of both analyte and blank
solutions decrease when the AAPH concentration increases. However, the
curves obtained at low AAPH concentrations were less defined and
showed a low reproducibility. Thus, a 12 mM AAPH concentration was
chosen.
Figure 8: Influence of nile blue concentration on the ORAC‐nile blue method.
Experimental conditions: [AAPH] = 0.012M; [Trolox] = 2 μM; pH = 6.9;
[phosphate] = 0.085 M; temperature = 37 °C.
[NB], nM
0 100 200 300 400
AU
C
0.00
0.04
0.08
0.12
0.16
B)
[NB], nM
0 100 200 300 400
AU
C
0.00
0.04
0.08
0.12
0.16
B)B)
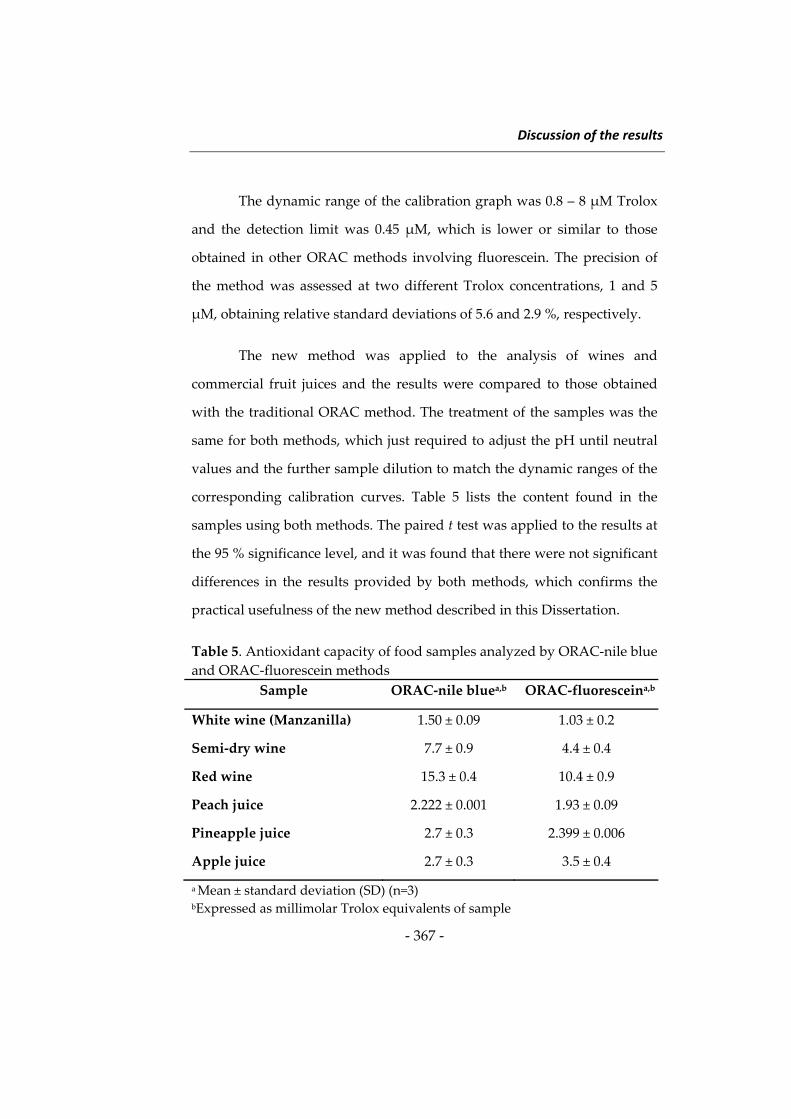
Discussion of the results
‐ 367 ‐
The dynamic range of the calibration graph was 0.8 – 8 μM Trolox
and the detection limit was 0.45 μM, which is lower or similar to those
obtained in other ORAC methods involving fluorescein. The precision of
the method was assessed at two different Trolox concentrations, 1 and 5
μM, obtaining relative standard deviations of 5.6 and 2.9 %, respectively.
The new method was applied to the analysis of wines and
commercial fruit juices and the results were compared to those obtained
with the traditional ORAC method. The treatment of the samples was the
same for both methods, which just required to adjust the pH until neutral
values and the further sample dilution to match the dynamic ranges of the
corresponding calibration curves. Table 5 lists the content found in the
samples using both methods. The paired t test was applied to the results at
the 95 % significance level, and it was found that there were not significant
differences in the results provided by both methods, which confirms the
practical usefulness of the new method described in this Dissertation.
Table 5. Antioxidant capacity of food samples analyzed by ORAC‐nile blue
and ORAC‐fluorescein methods
Sample ORAC‐nile bluea,b ORAC‐fluoresceina,b
White wine (Manzanilla) 1.50 ± 0.09 1.03 ± 0.2
Semi‐dry wine 7.7 ± 0.9 4.4 ± 0.4
Red wine 15.3 ± 0.4 10.4 ± 0.9
Peach juice 2.222 ± 0.001 1.93 ± 0.09
Pineapple juice 2.7 ± 0.3 2.399 ± 0.006
Apple juice 2.7 ± 0.3 3.5 ± 0.4
a Mean ± standard deviation (SD) (n=3) bExpressed as millimolar Trolox equivalents of sample
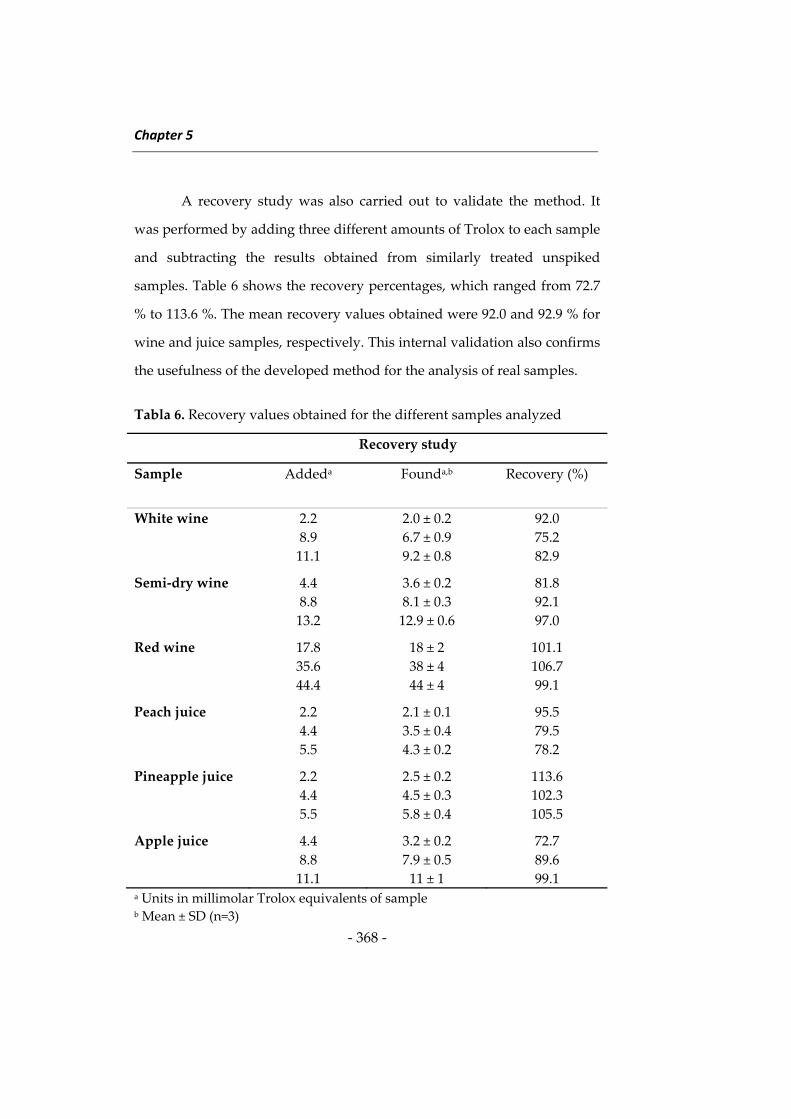
Chapter 5
‐ 368 ‐
A recovery study was also carried out to validate the method. It
was performed by adding three different amounts of Trolox to each sample
and subtracting the results obtained from similarly treated unspiked
samples. Table 6 shows the recovery percentages, which ranged from 72.7
% to 113.6 %. The mean recovery values obtained were 92.0 and 92.9 % for
wine and juice samples, respectively. This internal validation also confirms
the usefulness of the developed method for the analysis of real samples.
Tabla 6. Recovery values obtained for the different samples analyzed
Recovery study
Sample Addeda Founda,b Recovery (%)
White wine 2.2
8.9
11.1
2.0 ± 0.2
6.7 ± 0.9
9.2 ± 0.8
92.0
75.2
82.9
Semi‐dry wine 4.4
8.8
13.2
3.6 ± 0.2
8.1 ± 0.3
12.9 ± 0.6
81.8
92.1
97.0
Red wine 17.8
35.6
44.4
18 ± 2
38 ± 4
44 ± 4
101.1
106.7
99.1
Peach juice 2.2
4.4
5.5
2.1 ± 0.1
3.5 ± 0.4
4.3 ± 0.2
95.5
79.5
78.2
Pineapple juice 2.2
4.4
5.5
2.5 ± 0.2
4.5 ± 0.3
5.8 ± 0.4
113.6
102.3
105.5
Apple juice 4.4
8.8
11.1
3.2 ± 0.2
7.9 ± 0.5
11 ± 1
72.7
89.6
99.1 a Units in millimolar Trolox equivalents of sample b Mean ± SD (n=3)
Discussion of the results
‐ 369 ‐
The results obtained show the feasibility of long wavelength
fluorimetry for the determination of the antioxidant capacity in food using
the fluorophore nile blue. The use of this reagent instead of other
fluorophores previously reported for this purpose, such as fluorescein or β‐
phycoerythrin, is a useful alternative to avoid potential background signals
from the sample matrix, which can appear at lower wavelengths. Also, the
relatively wide Stokes shift of nile blue reduces the scattering signals.
Finally, the probability of photobleaching for nile blue is lower than that
for β‐phycoerythrin, as well as its cost.
Automatic determination of polyphenols in wine using laccase
and terbium oxide nanoparticles
Polyphenols are an important group of natural antioxidant
compounds present in the human diet that, after numerous clinical studies,
have shown their usefulness in the prevention of various chronic diseases.
As it has been above mentioned, numerous chromatographic [58, 59] and
electrophoretic [60, 61] methods have been developed for the
determination of these natural antioxidants. However, the high variety of
phenolic compounds that can be found in food samples justifies the use of
analytical methods to determine total phenolic content and total
antioxidant capacity. Both parameters have been widely determined by
using photometric or fluorimetric methods involving free radical
generators or enzymatic reactions, which compete with the antioxidant in
order to inhibit the fluorescence or absorbance decrease observed in
absence of these antioxidants [56, 62 – 67].
Chapter 5
‐ 370 ‐
Laccase is a phenoloxidase enzyme that has been described for the
determination of both phenolic content and antioxidant activity, using
different experimental conditions. As it has been already mentioned, this
enzyme catalyzes the oxidation of phenolic compounds to quinones or
radicals by reducing the dissolved oxygen to water, which has been used
to develop amperometric sensors [68 – 70] as well as photometric [71 – 73]
and fluorimetric [74] methods.
The usefulness of terbium oxide nanoparticles (Tb4O7NPs), laccase
and the fluorophore 8‐hydroxypyrene‐1,3,6‐trisulfonic acid trisodium salt
(HPTS) for the determination of polyphenols in wine samples is described
in this Dissertation. As for the method reported in the previous section,
fluorescence measurements were carried out in the kinetic mode, by
measuring the change of fluorescence over time and using as analytical
parameter the net AUC values obtained for different concentrations of
gallic acid, which was used as the calibration standard.
Firstly, several potential fluorescent laccase substrates (Styryl 7, 2‐
Di‐1‐ASP, azure B chloride, toluidine blue O, nile blue chloride, sodium
fluorescein and HPTS) were assayed to study their capability to compete
with phenolic antioxidants for the active sites of the enzyme. Although
indocyanine green has been described as a laccase substrate [74], it was not
assayed because its long excitation and emission wavelengths were not
adequate for the microplate reader used in this study. The results obtained
from the study of the behavior of the different fluorophores assayed
proved that only HPTS showed a relatively fast and remarkable decrease
in its fluorescence intensity in the presence of laccase.
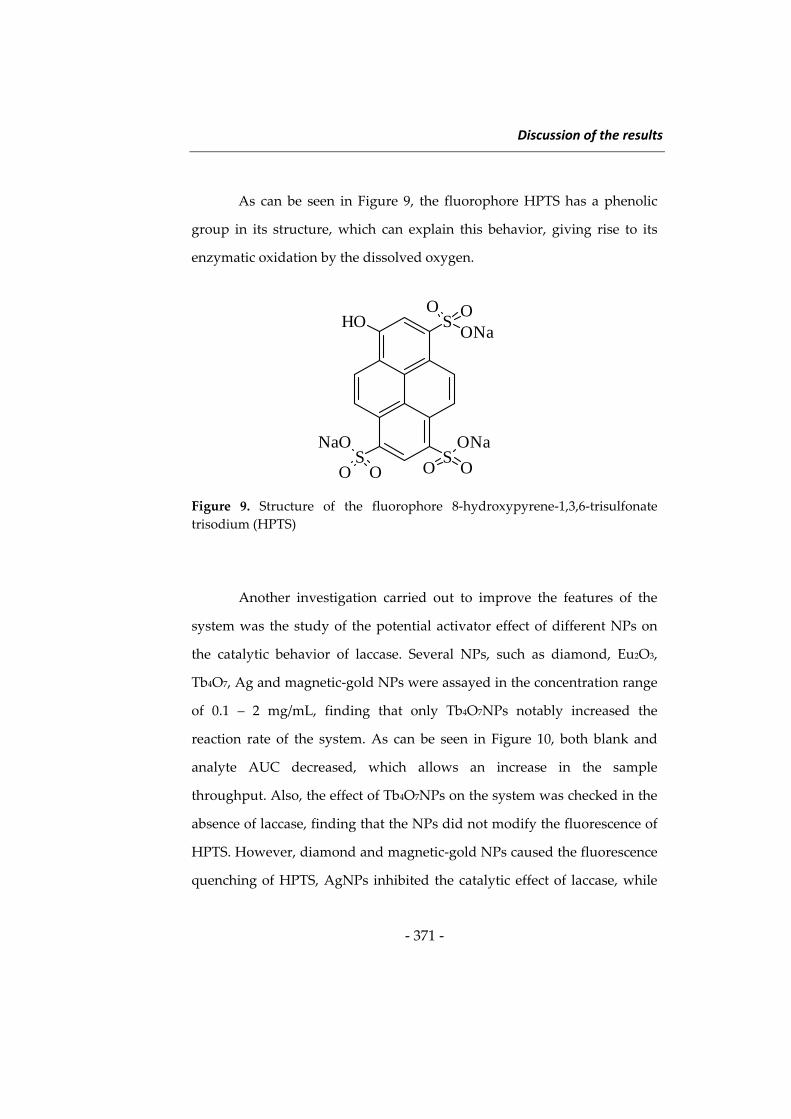
Discussion of the results
‐ 371 ‐
As can be seen in Figure 9, the fluorophore HPTS has a phenolic
group in its structure, which can explain this behavior, giving rise to its
enzymatic oxidation by the dissolved oxygen.
Figure 9. Structure of the fluorophore 8‐hydroxypyrene‐1,3,6‐trisulfonate
trisodium (HPTS)
Another investigation carried out to improve the features of the
system was the study of the potential activator effect of different NPs on
the catalytic behavior of laccase. Several NPs, such as diamond, Eu2O3,
Tb4O7, Ag and magnetic‐gold NPs were assayed in the concentration range
of 0.1 – 2 mg/mL, finding that only Tb4O7NPs notably increased the
reaction rate of the system. As can be seen in Figure 10, both blank and
analyte AUC decreased, which allows an increase in the sample
throughput. Also, the effect of Tb4O7NPs on the system was checked in the
absence of laccase, finding that the NPs did not modify the fluorescence of
HPTS. However, diamond and magnetic‐gold NPs caused the fluorescence
quenching of HPTS, AgNPs inhibited the catalytic effect of laccase, while
SHO
S S
O OONa
ONa
OO
NaO
O O
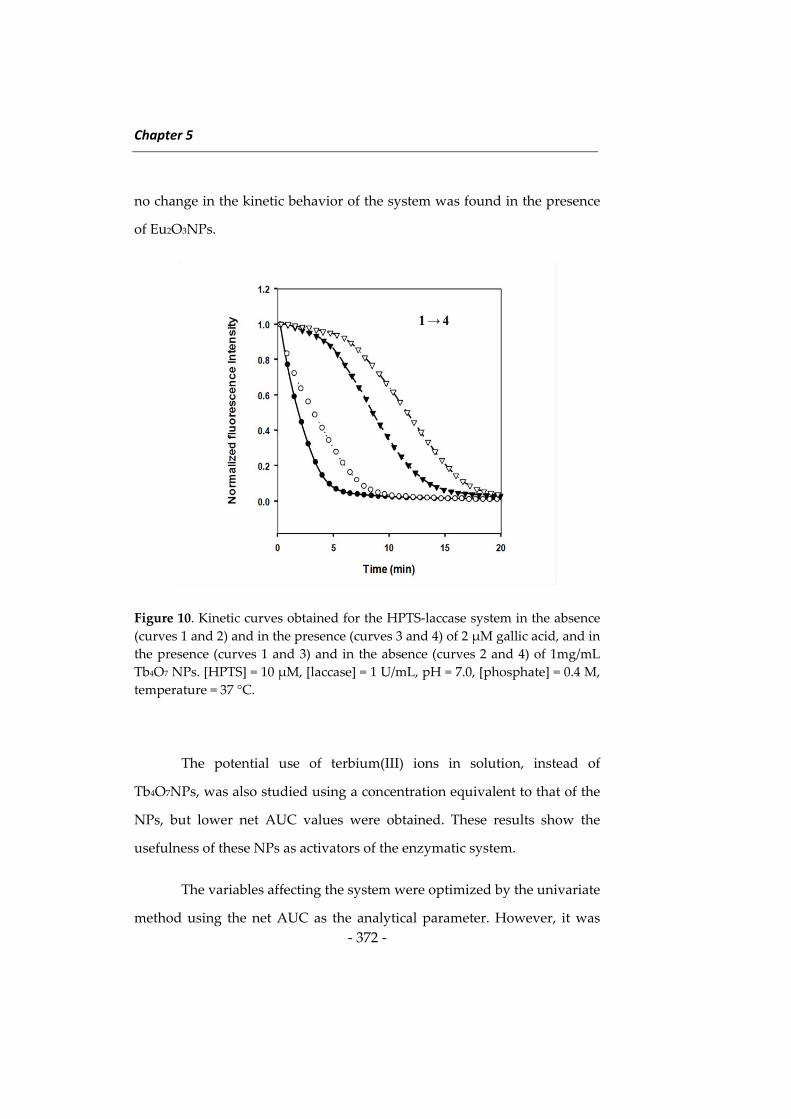
Chapter 5
‐ 372 ‐
no change in the kinetic behavior of the system was found in the presence
of Eu2O3NPs.
Figure 10. Kinetic curves obtained for the HPTS‐laccase system in the absence
(curves 1 and 2) and in the presence (curves 3 and 4) of 2 μM gallic acid, and in
the presence (curves 1 and 3) and in the absence (curves 2 and 4) of 1mg/mL
Tb4O7 NPs. [HPTS] = 10 μM, [laccase] = 1 U/mL, pH = 7.0, [phosphate] = 0.4 M,
temperature = 37 °C.
The potential use of terbium(III) ions in solution, instead of
Tb4O7NPs, was also studied using a concentration equivalent to that of the
NPs, but lower net AUC values were obtained. These results show the
usefulness of these NPs as activators of the enzymatic system.
The variables affecting the system were optimized by the univariate
method using the net AUC as the analytical parameter. However, it was
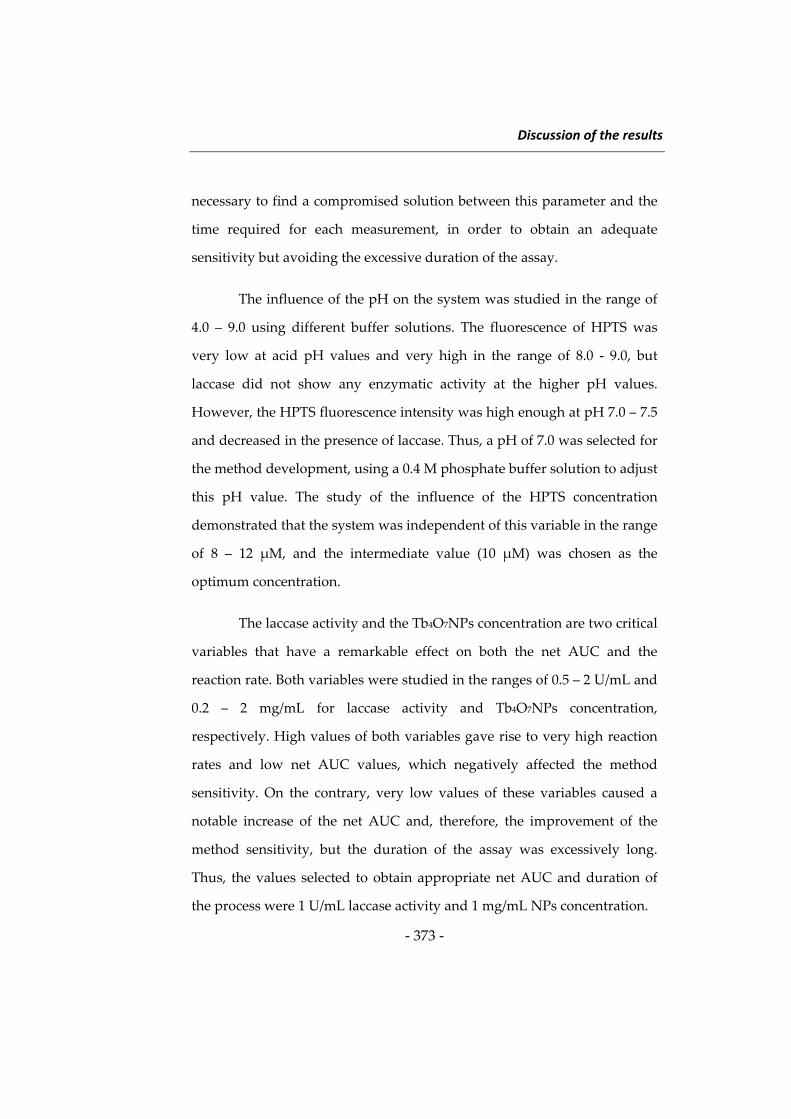
Discussion of the results
‐ 373 ‐
necessary to find a compromised solution between this parameter and the
time required for each measurement, in order to obtain an adequate
sensitivity but avoiding the excessive duration of the assay.
The influence of the pH on the system was studied in the range of
4.0 – 9.0 using different buffer solutions. The fluorescence of HPTS was
very low at acid pH values and very high in the range of 8.0 ‐ 9.0, but
laccase did not show any enzymatic activity at the higher pH values.
However, the HPTS fluorescence intensity was high enough at pH 7.0 – 7.5
and decreased in the presence of laccase. Thus, a pH of 7.0 was selected for
the method development, using a 0.4 M phosphate buffer solution to adjust
this pH value. The study of the influence of the HPTS concentration
demonstrated that the system was independent of this variable in the range
of 8 – 12 μM, and the intermediate value (10 μM) was chosen as the
optimum concentration.
The laccase activity and the Tb4O7NPs concentration are two critical
variables that have a remarkable effect on both the net AUC and the
reaction rate. Both variables were studied in the ranges of 0.5 – 2 U/mL and
0.2 – 2 mg/mL for laccase activity and Tb4O7NPs concentration,
respectively. High values of both variables gave rise to very high reaction
rates and low net AUC values, which negatively affected the method
sensitivity. On the contrary, very low values of these variables caused a
notable increase of the net AUC and, therefore, the improvement of the
method sensitivity, but the duration of the assay was excessively long.
Thus, the values selected to obtain appropriate net AUC and duration of
the process were 1 U/mL laccase activity and 1 mg/mL NPs concentration.
Chapter 5
‐ 374 ‐
As it has been above mentioned, the analytical parameter used in
this method was the net AUC, obtained from the normalized kinetic curves
for different gallic acid concentrations. Figure 11 show the kinetic curves
obtained to λex 450 nm y λem 535 nm under the optimum experimental
conditions.
Figure 11. Kinetic curves obtained for different gallic acid concentrations: (1)
(1) 0 μM, (2) 0.5 μM, (3) 1 μM (4) 2 μM (5) 5 μM y (6) 10 μM. Experimental
conditions: [HPTS] = 10 μM, [laccasa] = 1 U/mL, [NPs] = 1 mg/mL, pH = 7.0,
[phosphate] = 0.4 M, temperature = 37 oC.
The dynamic range of the calibration graph was 0.5 – 12 μM gallic
acid and the detection limit was 0.14 μM, which is about three times lower
than that obtained in the absence of Tb4O7 NPs (0.4 μM). This difference
shows the positive effect of the NPs on the method, improving both the
reaction rate and the detection limit. The detection limit reached in the
presence of the NPs is lower than those described for gallic acid using
Time (min)
0 10 20 30 40
No
rma
lized
flu
ore
sc
enc
e in
ten
sit
y
0.0
0.2
0.4
0.6
0.8
1.01 → 6
Discussion of the results
‐ 375 ‐
some amperometric biosensors, which were ranged between 0.19 and 50
μM [69, 70]. Although a detection limit for gallic acid of 0.04 μM has been
obtained using indocyanine green [74], this method involves the sequential
analysis of each sample, obtaining lower sample throughput. The precision
of the method, expressed as the percentage of relative standard deviation,
was assessed at 0.7 and 5 μM gallic acid concentrations, providing values
of 6.3 and 2.5 %, respectively.
The selectivity of the method was checked by assaying some non‐
phenolic reducing substances, which could be present in the wine samples
used to demonstrate the applicability of the method. Table 7 shows the
results obtained after assaying different potential interfering compounds.
The most serious interference was caused by ascorbic acid, which was
tolerated at the same molar concentration than that of the analyte.
However, this interference would be negligible because the maximum limit
allowed for ascorbic acid when used as an additive in wine is 0.85 mM [75],
which is lower than the usual content of polyphenols in wines. Sulfites
were tolerated in a concentration 20‐fold that of the analyte. Although this
interference could be removed using a pre‐treatment step [70], it was not
necessary as the presence of sulfites is controlled according to their total
content in reducing substances [76].
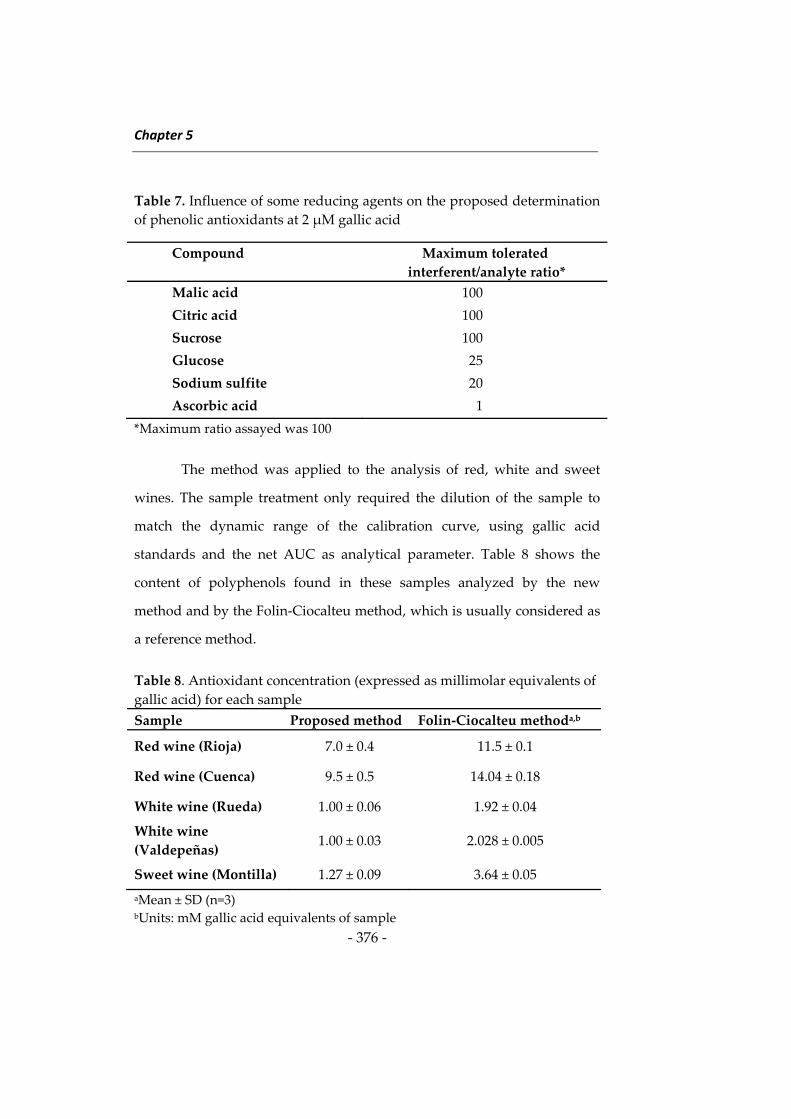
Chapter 5
‐ 376 ‐
Table 7. Influence of some reducing agents on the proposed determination
of phenolic antioxidants at 2 μM gallic acid
Compound Maximum tolerated
interferent/analyte ratio*
Malic acid 100
Citric acid 100
Sucrose 100
Glucose 25
Sodium sulfite 20
Ascorbic acid 1
*Maximum ratio assayed was 100
The method was applied to the analysis of red, white and sweet
wines. The sample treatment only required the dilution of the sample to
match the dynamic range of the calibration curve, using gallic acid
standards and the net AUC as analytical parameter. Table 8 shows the
content of polyphenols found in these samples analyzed by the new
method and by the Folin‐Ciocalteu method, which is usually considered as
a reference method.
Table 8. Antioxidant concentration (expressed as millimolar equivalents of
gallic acid) for each sample
Sample Proposed method Folin‐Ciocalteu methoda,b
Red wine (Rioja) 7.0 ± 0.4 11.5 ± 0.1
Red wine (Cuenca) 9.5 ± 0.5 14.04 ± 0.18
White wine (Rueda) 1.00 ± 0.06 1.92 ± 0.04
White wine
(Valdepeñas) 1.00 ± 0.03 2.028 ± 0.005
Sweet wine (Montilla) 1.27 ± 0.09 3.64 ± 0.05
aMean ± SD (n=3) bUnits: mM gallic acid equivalents of sample
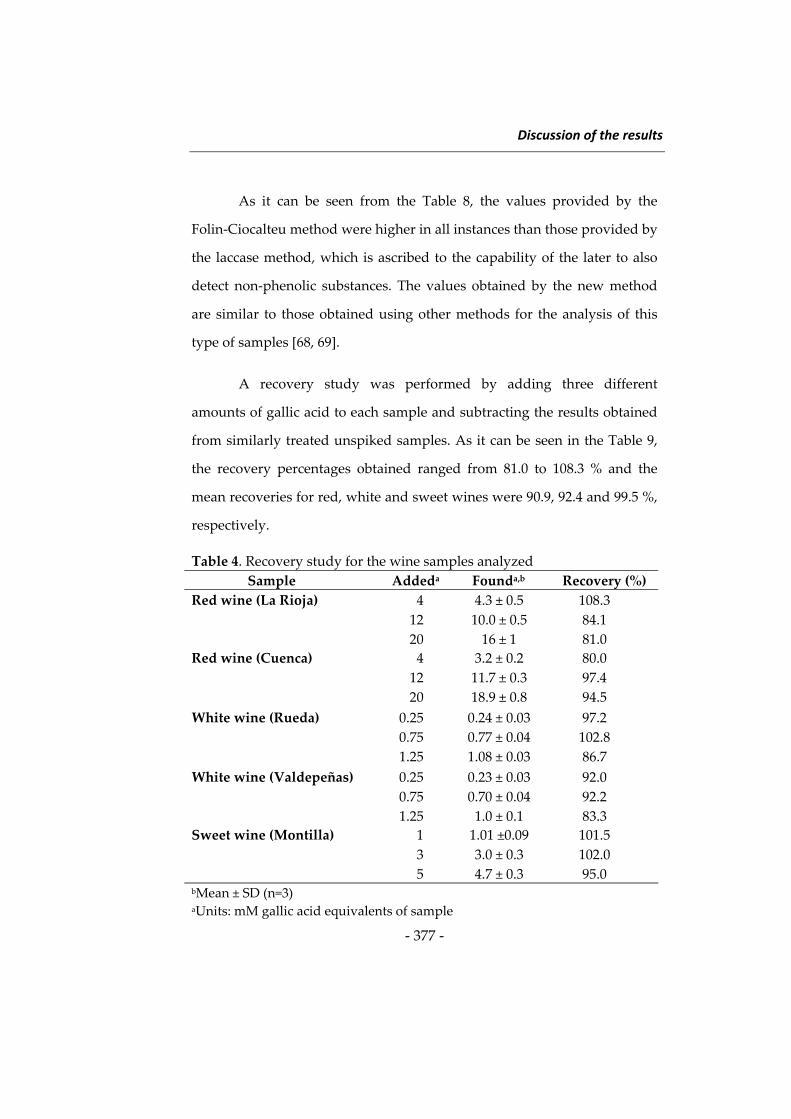
Discussion of the results
‐ 377 ‐
As it can be seen from the Table 8, the values provided by the
Folin‐Ciocalteu method were higher in all instances than those provided by
the laccase method, which is ascribed to the capability of the later to also
detect non‐phenolic substances. The values obtained by the new method
are similar to those obtained using other methods for the analysis of this
type of samples [68, 69].
A recovery study was performed by adding three different
amounts of gallic acid to each sample and subtracting the results obtained
from similarly treated unspiked samples. As it can be seen in the Table 9,
the recovery percentages obtained ranged from 81.0 to 108.3 % and the
mean recoveries for red, white and sweet wines were 90.9, 92.4 and 99.5 %,
respectively.
Table 4. Recovery study for the wine samples analyzed
Sample Addeda Founda,b Recovery (%)
Red wine (La Rioja) 4 4.3 ± 0.5 108.3
12 10.0 ± 0.5 84.1
20 16 ± 1 81.0
Red wine (Cuenca) 4 3.2 ± 0.2 80.0
12 11.7 ± 0.3 97.4
20 18.9 ± 0.8 94.5
White wine (Rueda) 0.25 0.24 ± 0.03 97.2
0.75 0.77 ± 0.04 102.8
1.25 1.08 ± 0.03 86.7
White wine (Valdepeñas) 0.25 0.23 ± 0.03 92.0
0.75 0.70 ± 0.04 92.2
1.25 1.0 ± 0.1 83.3
Sweet wine (Montilla) 1 1.01 ±0.09 101.5
3 3.0 ± 0.3 102.0
5 4.7 ± 0.3 95.0 bMean ± SD (n=3) aUnits: mM gallic acid equivalents of sample
Chapter 5
‐ 378 ‐
The results obtained evidence the usefulness of the combined use
of laccase, Tb4O7NPs and the fluorophore HPTS for the determination of
polyphenols in wine samples. It is noteworthy to mention that the activator
effect of Tb4O7NPs on an enzymatic system is described for the first time.
The use of laccase and NPs increases the sample throughput of the method
and improves the sensibility, being these values better than those obtained
for other methods previously described [68, 69]. Also, the use of an
automatic microplate reader enables the simultaneous processing of the
samples, reaching an overall sample throughput of about 35 samples h‐1,
when analyzed in triplicate.
3. New investigations in the use of upconverting phosphors in
luminescence resonance energy transfer
This study was developed during the three‐month stay at the
Department of Biotechnology of the University of Turku (Finland). Due to
the short duration of this period, the research was focused to the
systematic evaluation of several donors and acceptors to design a
luminescence resonance energy transfer system (LRET) using the anti‐
Stokes phenomenon in biotin‐streptavidin affinity assays. This study
aimed the selection of the most appropriate system for its subsequent
analytical application.
As it has been described in the Introduction of this dissertation,
upconverting phosphors (UCPs) are composed of inorganic host lattices
usually doped with lanthanide ions to achieve the phenomenon of anti‐
Stokes fluorescence emission. The research presented here reports a
Discussion of the results
‐ 379 ‐
systematic study of the behavior of different UCPs doped with Er(III),
Ho(III) and Tm(III), used as donors, and several fluorophores, used as
acceptors, to develop new methodologies based in the LRET phenomenon.
Two main requirements have to be fulfilled for this process to happen: 1)
The excitation spectrum of the acceptor should overlap with the donor
emission spectrum; 2) The distance between donor and acceptor should
follow the Förster equation.
Among the wide variety of existing fluorophores,
phycobiliproteins, such as β‐phycoerythrin (BPE) and R‐phycoerythrin
(RPE) have been previously used as acceptors in different LRET assays [77
– 79]. Their use is mainly due to their excellent fluorescence emission,
although their price is relatively high. For this reason, the possibility to use
less costly fluorophores, such as Alexa Fluor or ATTO, to develop LRET
affinity assays has been studied. These fluorophores could also be used to
develop multiplexed assays, since they feature different excitation and
emission wavelengths. To perform this systematic study between donors
and acceptors, streptavidin (SA) was used to coat UCP donors, whereas
biotin (Bio) was coupled to fluorescent acceptors.
Figure 12 shows the excitation and emission spectra of the different
donor‐acceptor pairs used in this study. Figures 12.A‐12.C show the
combination between the UCP doped with Er(III) and the fluorescent
protein BPE and Alexa Fluor 546 (AF546) and 680 (AF680) fluorophores. As
it can be seen, there is an excellent overlap between the emission and
excitation spectra of donors and acceptors, respectively..
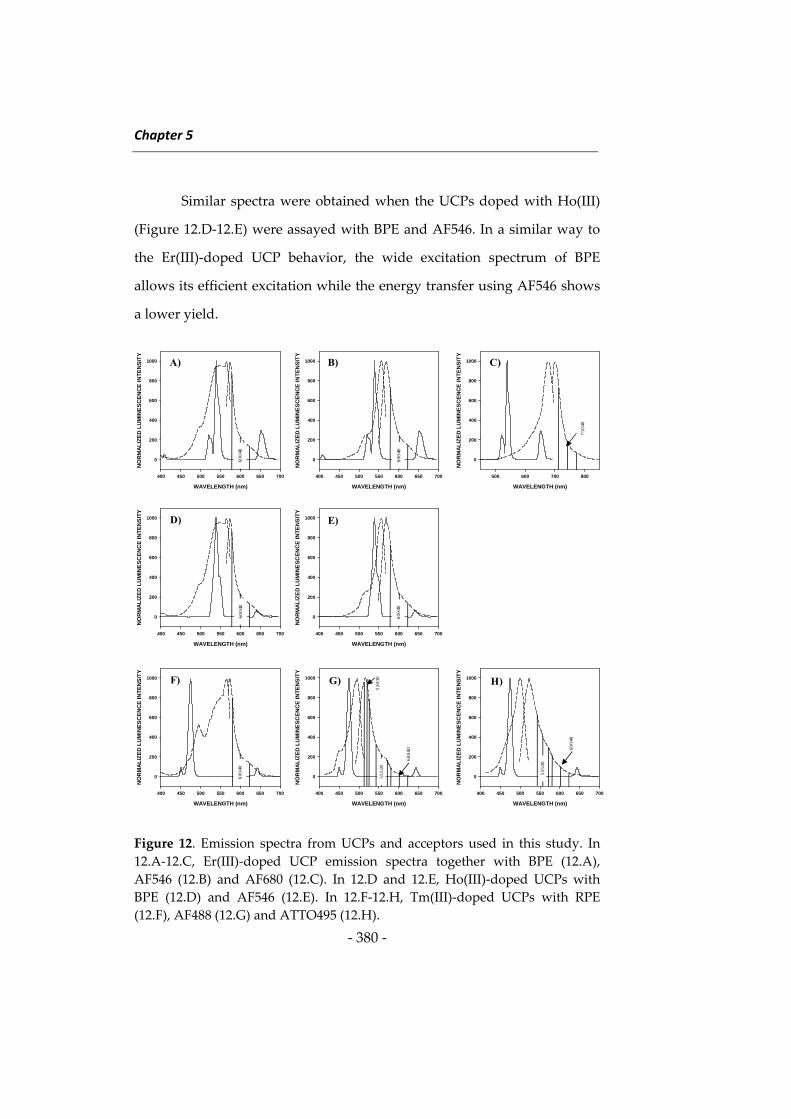
Chapter 5
‐ 380 ‐
Similar spectra were obtained when the UCPs doped with Ho(III)
(Figure 12.D‐12.E) were assayed with BPE and AF546. In a similar way to
the Er(III)‐doped UCP behavior, the wide excitation spectrum of BPE
allows its efficient excitation while the energy transfer using AF546 shows
a lower yield.
Figure 12. Emission spectra from UCPs and acceptors used in this study. In
12.A‐12.C, Er(III)‐doped UCP emission spectra together with BPE (12.A),
AF546 (12.B) and AF680 (12.C). In 12.D and 12.E, Ho(III)‐doped UCPs with
BPE (12.D) and AF546 (12.E). In 12.F‐12.H, Tm(III)‐doped UCPs with RPE
(12.F), AF488 (12.G) and ATTO495 (12.H).
WAVELENGTH (nm)
400 450 500 550 600 650 700
NO
RM
AL
IZE
D L
UM
INE
SC
EN
CE
IN
TE
NS
ITY
0
200
400
600
800
1000
WAVELENGTH (nm)
400 450 500 550 600 650 700
NO
RM
AL
IZE
D L
UM
INE
SC
EN
CE
IN
TE
NS
ITY
0
200
400
600
800
1000
WAVELENGTH (nm)
400 450 500 550 600 650 700
NO
RM
AL
IZE
D L
UM
INE
SC
EN
CE
IN
TE
NS
ITY
0
200
400
600
800
1000F) G) H)
55
5/2
0
55
5/2
0
60
0/4
0
52
0/1
0
60
0/4
0
60
0/4
0
WAVELENGTH (nm)
400 450 500 550 600 650 700
NO
RM
AL
IZE
D L
UM
INE
SC
EN
CE
IN
TE
NS
ITY
0
200
400
600
800
1000
WAVELENGTH (nm)
400 450 500 550 600 650 700
NO
RM
AL
IZE
D L
UM
INE
SC
EN
CE
IN
TE
NS
ITY
0
200
400
600
800
1000D) E)
60
0/4
0
60
0/4
0
WAVELENGTH (nm)
400 450 500 550 600 650 700
NO
RM
AL
IZE
D L
UM
INE
SC
EN
CE
IN
TE
NS
ITY
0
200
400
600
800
1000
WAVELENGTH (nm)
400 450 500 550 600 650 700
NO
RM
AL
IZE
D L
UM
INE
SC
EN
CE
IN
TE
NS
ITY
0
200
400
600
800
1000
WAVELENGTH (nm)
500 600 700 800
NO
RM
AL
IZE
D L
UM
INE
SC
EN
CE
IN
TE
NS
ITY
0
200
400
600
800
1000A) B) C)
60
0/4
0
60
0/4
0
75
0/4
0
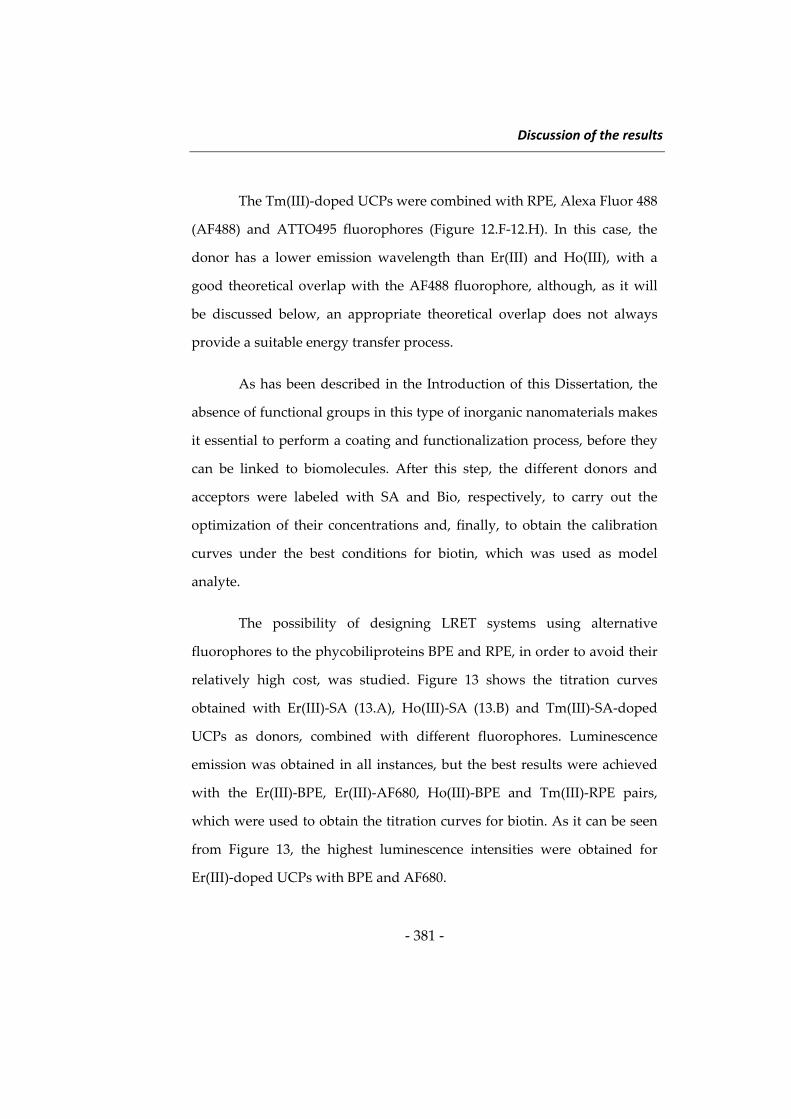
Discussion of the results
‐ 381 ‐
The Tm(III)‐doped UCPs were combined with RPE, Alexa Fluor 488
(AF488) and ATTO495 fluorophores (Figure 12.F‐12.H). In this case, the
donor has a lower emission wavelength than Er(III) and Ho(III), with a
good theoretical overlap with the AF488 fluorophore, although, as it will
be discussed below, an appropriate theoretical overlap does not always
provide a suitable energy transfer process.
As has been described in the Introduction of this Dissertation, the
absence of functional groups in this type of inorganic nanomaterials makes
it essential to perform a coating and functionalization process, before they
can be linked to biomolecules. After this step, the different donors and
acceptors were labeled with SA and Bio, respectively, to carry out the
optimization of their concentrations and, finally, to obtain the calibration
curves under the best conditions for biotin, which was used as model
analyte.
The possibility of designing LRET systems using alternative
fluorophores to the phycobiliproteins BPE and RPE, in order to avoid their
relatively high cost, was studied. Figure 13 shows the titration curves
obtained with Er(III)‐SA (13.A), Ho(III)‐SA (13.B) and Tm(III)‐SA‐doped
UCPs as donors, combined with different fluorophores. Luminescence
emission was obtained in all instances, but the best results were achieved
with the Er(III)‐BPE, Er(III)‐AF680, Ho(III)‐BPE and Tm(III)‐RPE pairs,
which were used to obtain the titration curves for biotin. As it can be seen
from Figure 13, the highest luminescence intensities were obtained for
Er(III)‐doped UCPs with BPE and AF680.
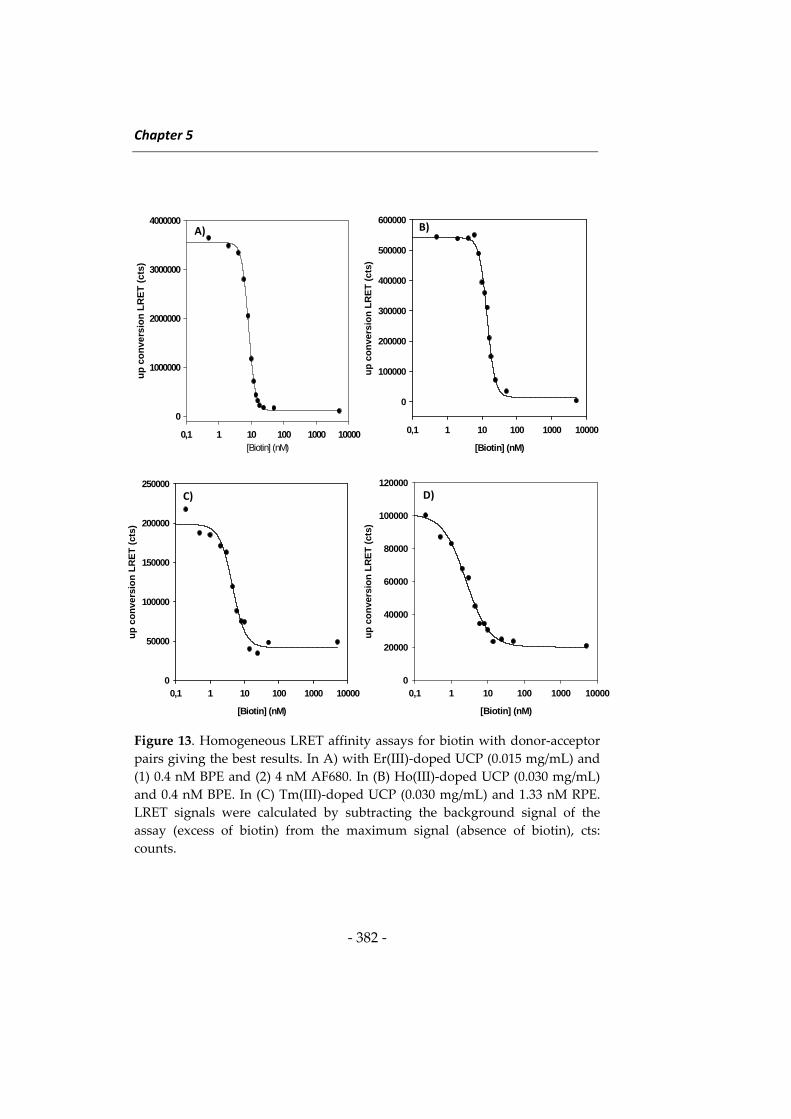
Chapter 5
‐ 382 ‐
Figure 13. Homogeneous LRET affinity assays for biotin with donor‐acceptor
pairs giving the best results. In A) with Er(III)‐doped UCP (0.015 mg/mL) and
(1) 0.4 nM BPE and (2) 4 nM AF680. In (B) Ho(III)‐doped UCP (0.030 mg/mL)
and 0.4 nM BPE. In (C) Tm(III)‐doped UCP (0.030 mg/mL) and 1.33 nM RPE.
LRET signals were calculated by subtracting the background signal of the
assay (excess of biotin) from the maximum signal (absence of biotin), cts:
counts.
[Biotin] (nM)0,1 1 10 100 1000 10000
up
co
nve
rsio
n L
RE
T (
cts)
0
1000000
2000000
3000000
4000000A)
[Biotin] (nM)
0,1 1 10 100 1000 10000
up
co
nve
rsio
n L
RE
T (
cts)
0
100000
200000
300000
400000
500000
600000B)
[Biotin] (nM)
0,1 1 10 100 1000 10000
up
co
nve
rsio
n L
RE
T (
cts)
0
50000
100000
150000
200000
250000C)
[Biotin] (nM)
0,1 1 10 100 1000 10000
up
co
nve
rsio
n L
RE
T (
cts)
0
20000
40000
60000
80000
100000
120000D)
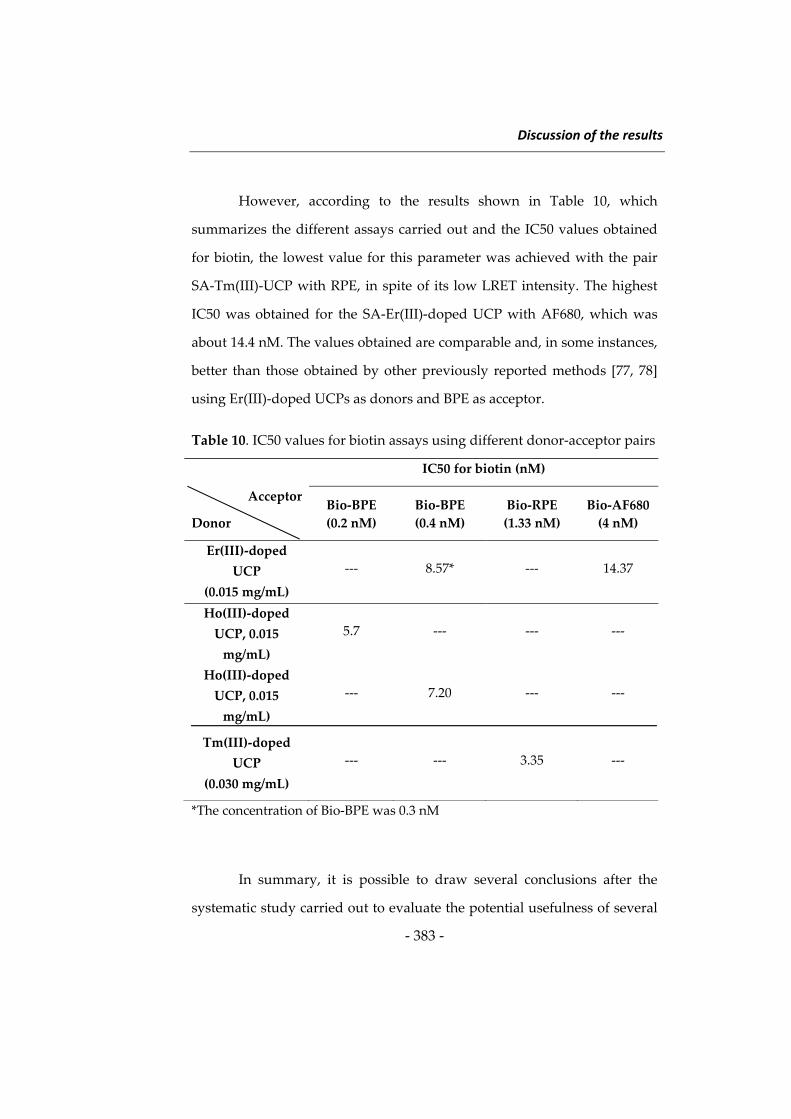
Discussion of the results
‐ 383 ‐
However, according to the results shown in Table 10, which
summarizes the different assays carried out and the IC50 values obtained
for biotin, the lowest value for this parameter was achieved with the pair
SA‐Tm(III)‐UCP with RPE, in spite of its low LRET intensity. The highest
IC50 was obtained for the SA‐Er(III)‐doped UCP with AF680, which was
about 14.4 nM. The values obtained are comparable and, in some instances,
better than those obtained by other previously reported methods [77, 78]
using Er(III)‐doped UCPs as donors and BPE as acceptor.
Table 10. IC50 values for biotin assays using different donor‐acceptor pairs
IC50 for biotin (nM)
Acceptor
Donor
Bio‐BPE
(0.2 nM)
Bio‐BPE
(0.4 nM)
Bio‐RPE
(1.33 nM)
Bio‐AF680
(4 nM)
Er(III)‐doped
UCP
(0.015 mg/mL)
‐‐‐ 8.57* ‐‐‐ 14.37
Ho(III)‐doped
UCP, 0.015
mg/mL)
5.7 ‐‐‐ ‐‐‐ ‐‐‐
Ho(III)‐doped
UCP, 0.015
mg/mL)
‐‐‐ 7.20 ‐‐‐ ‐‐‐
Tm(III)‐doped
UCP
(0.030 mg/mL)
‐‐‐ ‐‐‐ 3.35 ‐‐‐
*The concentration of Bio‐BPE was 0.3 nM
In summary, it is possible to draw several conclusions after the
systematic study carried out to evaluate the potential usefulness of several
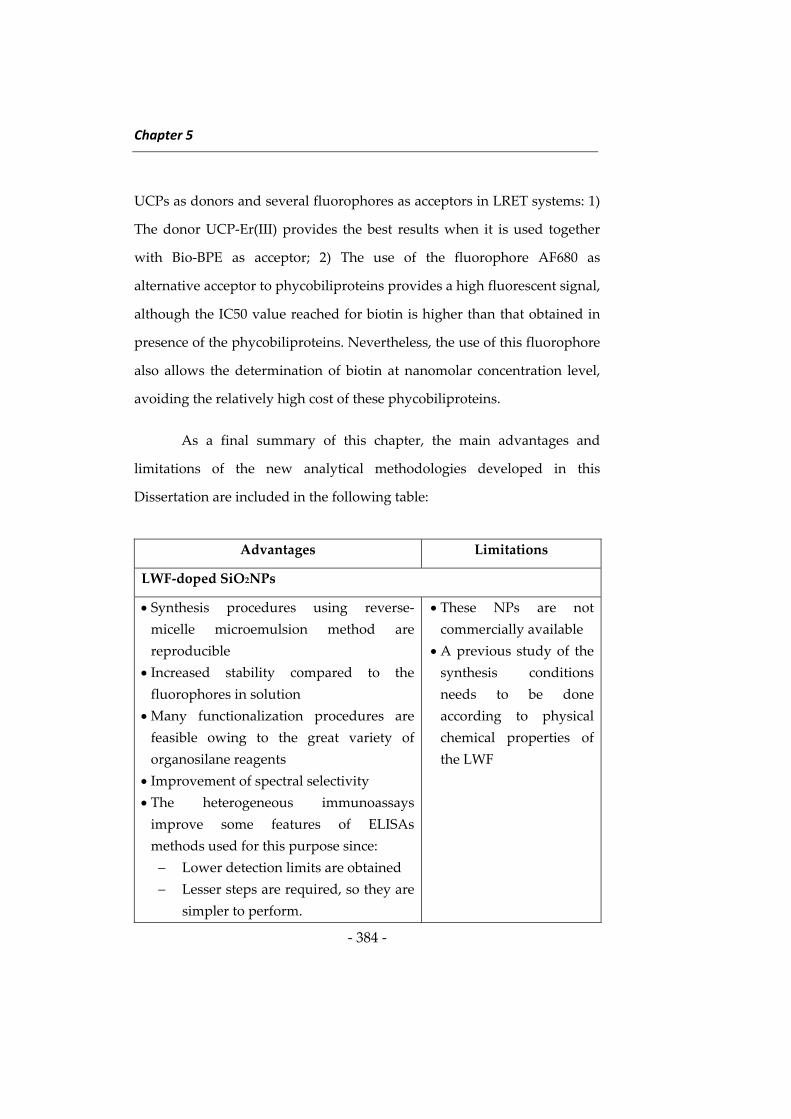
Chapter 5
‐ 384 ‐
UCPs as donors and several fluorophores as acceptors in LRET systems: 1)
The donor UCP‐Er(III) provides the best results when it is used together
with Bio‐BPE as acceptor; 2) The use of the fluorophore AF680 as
alternative acceptor to phycobiliproteins provides a high fluorescent signal,
although the IC50 value reached for biotin is higher than that obtained in
presence of the phycobiliproteins. Nevertheless, the use of this fluorophore
also allows the determination of biotin at nanomolar concentration level,
avoiding the relatively high cost of these phycobiliproteins.
As a final summary of this chapter, the main advantages and
limitations of the new analytical methodologies developed in this
Dissertation are included in the following table:
Advantages Limitations
LWF‐doped SiO2NPs
Synthesis procedures using reverse‐
micelle microemulsion method are
reproducible
Increased stability compared to the
fluorophores in solution
Many functionalization procedures are
feasible owing to the great variety of
organosilane reagents
Improvement of spectral selectivity
The heterogeneous immunoassays
improve some features of ELISAs
methods used for this purpose since:
Lower detection limits are obtained
Lesser steps are required, so they are
simpler to perform.
These NPs are not
commercially available
A previous study of the
synthesis conditions
needs to be done
according to physical
chemical properties of
the LWF
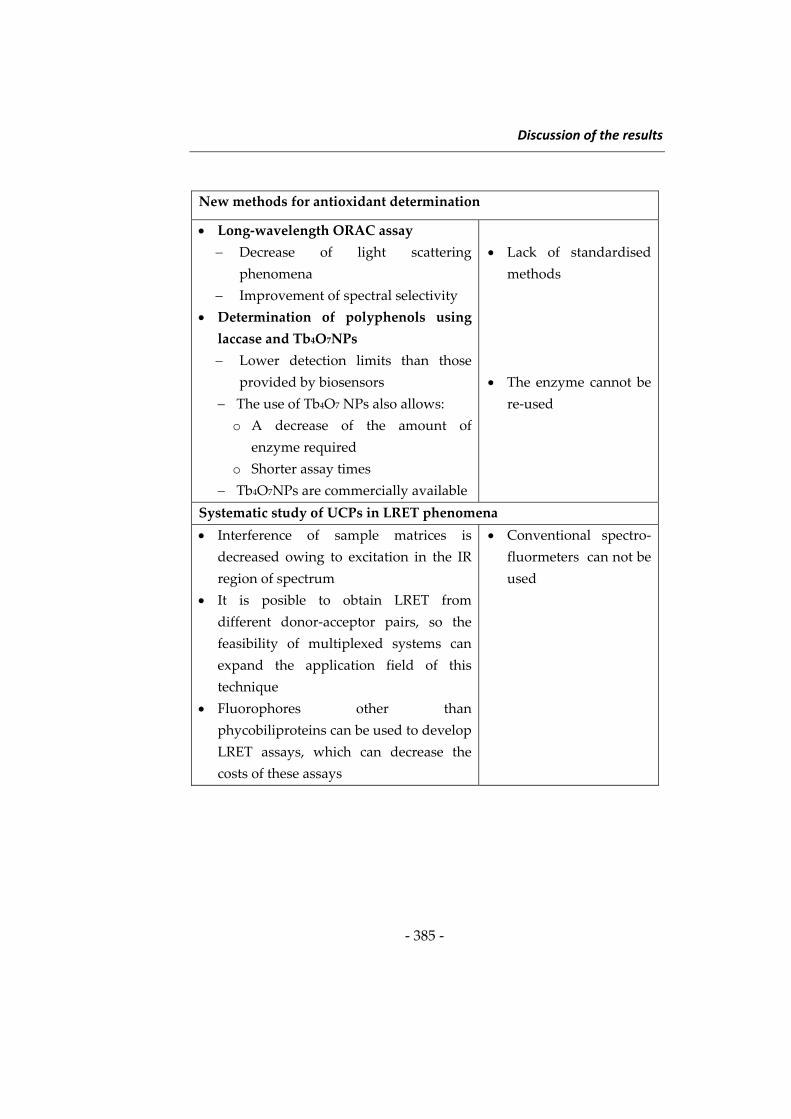
Discussion of the results
‐ 385 ‐
New methods for antioxidant determination
Long‐wavelength ORAC assay
Decrease of light scattering
phenomena
Improvement of spectral selectivity
Determination of polyphenols using
laccase and Tb4O7NPs
Lower detection limits than those
provided by biosensors
The use of Tb4O7 NPs also allows:
o A decrease of the amount of
enzyme required
o Shorter assay times
Tb4O7NPs are commercially available
Lack of standardised
methods
The enzyme cannot be
re‐used
Systematic study of UCPs in LRET phenomena
Interference of sample matrices is
decreased owing to excitation in the IR
region of spectrum
It is posible to obtain LRET from
different donor‐acceptor pairs, so the
feasibility of multiplexed systems can
expand the application field of this
technique
Fluorophores other than
phycobiliproteins can be used to develop
LRET assays, which can decrease the
costs of these assays
Conventional spectro‐
fluormeters can not be
used

Chapter 5
‐ 386 ‐
References
(1) A. Gómez‐Hens, J.M. Fernández‐Romero, M. P. Aguilar‐Caballos.
Nanostructures as analytical tools in bioassays. Trends Anal. Chem.
(2008) 27, 394 – 406.
(2) J. Yan, M. C. Estévez, J. E. Smith, K. Wang, X. Ho, L. Wang, W. Tan.
Dye‐doped nanoparticles for bioanalysis. Nanotoday (2007) 2, 44 –
50.
(3) M. Seydack. Nanoparticles labels in immunosensing using optical
detection methods. Biosens. Bioelectron. (2005) 20, 2454 – 2469.
(4) N. C. Tansil, Z. Gao. Nanoparticles in biomolecular detection.
Nanotoday (2006) 1, 28 – 37.
(5) G. Liu, Y. Lin. Nanomaterial labels in electrochemical
immunosensors and immunoassays. Talanta (2007) 74, 308 – 317.
(6) F. J. Arriagada, K. Osseo‐Asare. Synthesis of nanosize silica in a
noionic water‐in‐oil microemulsion: effects on the water/surfactant
molar ratio and ammonia concentration. J. Colloid Interf. Sci. (1999)
211, 210 – 220.
(7) G. Yao, L. Wang, G. Wu, J. Smith, J. Xu, W. Zhao, E. Lee, W. tan.
FlotDots: luminescent nanoparticles. Anal. Bioanal. Chem. (2006)
385, 518 – 524.
(8) X. He, J. Chen, K. Wang, D. Qin, W. Tan. Preparation of
luminescent Cy5 doped core‐shell SFNPs and its application as a
near‐infrared fluorescent marker. Talanta (2007) 72, 1519 – 1526.
Discussion of the results
‐ 387 ‐
(9) X‐L. Chen, J‐L. Zou, T‐T. Zhao, Z‐B. Li. Preparation and
fluoroimmunoassay application of new red‐region fluorescent
silica nanoparticles. J. Fluoresc. (2007) 17, 235 – 241.
(10) W. Yang, C‐G. Zhang, H‐Y. Qu, H‐H. Yang, J‐G. Xu. Novel
fluorescent silica nanoparticle probe for ultrasensitive
immunoassays. Anal. Chim. Acta (2004) 503, 163 – 169.
(11) Z. Zhang, F. Zhang, Y. Liu. Recent advances in enhancing the
sensitivity and resolution of capillary electrophoresis. J. Chromatogr.
Sci. (2013) 51, 666 – 683.
(12) G. A. Saleh, H. F. Askal, I. H. Refaat, F. A. M. Abdel‐Aal. Review on
recent separation methods for determination of some
fluoroquinolones. J. Liq. Chromatogr. (2013) 36, 1401 – 1420.
(13) M. Szultka, B. Buszewki, K. Papaj, W. Szeja, A. Rusin.
Determination of flavonoids and their metabolites by
chromatographic techniques. Trends Anal. Chem. (2013) 47, 47 – 67.
(14) B. Tang, K. H. Row. Development of gas chromatography analysis
of fatty acids in marine organisms. J. Chromatogr. Sci. (2013) 51, 599
– 607.
(15) I. G. Zenkevich, Y. S. Drugov. Gas chromatographic methods for
the determination of trace organic pollutans in environmental
samples. J. Anal. Chem. (2013) 68, 845 – 861.
(16) C. T. Elliot, D. G. Kennedy, W. J. McCaughey. Methods for the
detection of polyether ionophore residues in poultry. Analyst (1998)
123, 45R – 56R.
(17) M. Sokolic, M. Pokorny. Comparative determination of
salinomycin by high‐performance liquid chromatography,

Chapter 5
‐ 388 ‐
microbiological and colorimetric methods in testing production
processes and animal feed preparations. J. Pharmaceut. Biomed.
(1991) 9, 1047 – 1053.
(18) S. Magiera. Fast, simultaneous quantification of three novel cardiac
drugs in human urine by MEPS‐UHPLC‐MS/MS for therapeutic
drug monitoring. J. Chromatogr. B (2013) 938, 86 – 95.
(19) R. Ciayadi, G. F. Kelso, M. K. Potdar, S. J. Harris, K. L. Walton, C.
A. Harrison, M. T. W. Hearn. Identification of protein binding
partners of ALK‐5 Kinase inhibitors. Bioorgan. Med. Chem. (2013) 21,
6496 – 6500.
(20) G. Pierri, D. Kotoni, P. Simone, C. Villani, G. Pepe, P. Campiglia, P.
Dugo, F. Gasparrini. Analysis of bovine milk caseins on organic
monolithic columns:An integrated capillary liquid
chromatography‐high resolution mass spectrometry approach for
the study of time‐dependent casein degradation. J. Chromatogr. A
(2013) 1313, 259 – 269.
(21) T. F. McGrath, C. T. Elliot, T. L. Fodey. Biosensors for the analysis
of microbiological and chemical contaminants in foods. Anal.
Bioanal. Chem. (2012) 403, 75 – 92.
(22) X. Pei, B. Zhang, J. Tang, B. Liu, W. Lai, D. Tang. Sandwich‐type
immunosensors and immunoassays exploiting nanostructure
labels: A review. Anal. Chim. Acta (2013) 758, 1 – 18.
(23) S. Girotti, S. Ghini, E. Maiolini, L. Bolelli, E. N. Feri. Trace analysis
of pollutants by use of honeybees, immunoassays, and
chemiluminescence detection. Anal. Bioanal. Chem. (2013) 405, 555 –
571.
Discussion of the results
‐ 389 ‐
(24) L. Anfossi, C. Baggiani, C. Giavannoli, G. D´Arco, G. Giraudi.
Lateral‐flow immunoassays for mycotoxins and phycotoxins: A
review. Anal. Bioanal. Chem. (2013) 405, 467 – 480.
(25) D. L. Brandon, M. Friedman. Immunoassays of Soy Proteins. J. Agr.
Food Chem. (2002) 50, 6635 – 6642.
(26) M. A. J. Godfrey, M. F. Luckey, P. Kwasowski. IAC/cELISA
detection of monensin elimination from chicken tissues, following
oral therapeutic dosing. Food Add. Contam. (1997) 14, 281 – 286.
(27) S. R. H. Crooks, T. L. Fodey, G. R. Gilmore, C. T. Elliot. Rapid
screening for monensin residues in poultry plasma by a dry
reagent dissociation enhanced lanthanide fluoroimmunoassay.
Analyst (1998) 123, 2493 – 2496.
(28) V. Hagren, P. Peippo, M. Tuomola, T. Lövgren. Rapid time‐
resolved fluoroimmunoassay for the screening of monensin
residues in eggs. Anal. Chim. Acta (2006) 557, 164 – 168.
(29) C. Cháfer‐Pericás, A. Maquieira, R. Puchades. Functionalized
inorganic nanoparticles used as labels in solid‐phase
immunoassays. Trends Anal. Chem. (2012) 31, 144 – 156.
(30) A. Gómez‐Hens, J. M. Fernández‐Romero, M. P. Aguilar‐Caballos.
Nanostructures as analytical tolos in bioassays. Trends Anal. Chem.
(2008) 27, 394 – 406.
(31) D. Knopp, D. Tang, R. Niessner. Review: Bioanalytical applications
of biomolecule‐functionalized nanometer‐sized doped silica
nanoparticles. Anal. Chim. Acta (2009) 647, 14 – 30.
Chapter 5
‐ 390 ‐
(32) M. A. J. Godfrey, M. F. Luckey, P. Kwasowski. IAC/cELISA
detection of monensin elimination from chicken tissues, following
oral therapeutic dosing. Food Addit. Contam. (1997) 14, 281 – 286..
(33) M. Hazansadeh, N. Shadjou, E. Omidina, M. Eskandani, M. de la
Guardia. Mesoporous silica materials for use in electrochemical
immunosensing. TrAC – Trends Anal. Chem. (2013) 45, 93 – 106.
(34) X. Zhao, L. R. Hilliard, S. J. Mechery, Y. Wang, R. P. Bagwe, S. Jin,
W. Tan. A rapid bioassay for single bacterial cell quantitation using
bioconjugated nanoparticles. P. Ntl. Aca. Sci. USA (2004) 101, 15027
– 15032.
(35) R. Tapec, X. J. Zhao, W. Tan. Development of organic dye‐doped
silica nanoparticles for bioanalysis and biosensors. J. Nanosci.
Nanotech. (2002) 2, 405 – 409.
(36) H‐H. Yang, H‐Y. Qu, P. Lin, S‐H. Li, M‐T. Ding, J‐G. Xu.
Nanometer fluorescent hybrid silica particle as ultrasensitive and
photostable biological labels. Analyst (2003) 128, 462 – 466.
(37) W. Yang, C. G. Zhang, H. Y. Qu, H. H. Yang, J. G. Xu. Novel
fluorescent silica nanoparticles probe for ultrasensitive
immunoassays. Anal. Chim. Acta (2004) 503, 163 – 169.
(38) M. Tan, G. Wang, X. Hai, Z. Ye, J. Yuan. Development of
functionalized fluorescent europium nanoparticles for biolabelling
and time‐resolved fluorometric applications. J. Mater. Chem. (2004)
14, 2896 – 2901.
(39) Z. Ye, M. Tan, G. Wang, J. Yuan. Novel fluorescent europium
chelate‐doped silica nanoparticles: preparation, characterization

Discussion of the results
‐ 391 ‐
and time‐resolved fluorometric application. J. Mater. Chem. (2004)
14, 851 – 856.
(40) Z. Ye, M. Tan, G. Wang, J. Yuan. Preparation, Characterization, and
time‐resolved fluorometric application of silica‐coated terbium (III)
fluorescent nanoparticles. Anal. Chem. (2004) 76, 513 – 518.
(41) L. L´Hocine, J. I. Boye, C. Munyana. Detection and quantification of
soy allergens in food: study of two commercial enzyme‐linked
immunosorbent assays. J. Food Sci. (2007) 72, C145 ‐ C153.
(42) M. L. Sánchez‐Martínez, M. P. Aguilar‐Caballos, A. Gómez‐Hens.
Homogeneous immunoassay for soy protein determination in food
samples using gold nanoparticles as labels and light scattering
detection. Anal. Chim. Acta (2009) 636, 58 – 62.
(43) Opinion of the scientific panel on contaminants in the food chain.
EFSA Journal (2008) 592, 1 – 40.
(44) Regulation (EC) No 1831/2003 of the European Parliament and of
the Council of 22 Septembre 2003 on additives for use in animal
nutrition. Official Journal of European Union (2003) L268, 29 – 43.
(45) H. Watanabe, A. Satake, M. Matsumoto, Y. Kido, A. Tsuji, K. Ito, M.
Maeda. Monoclonal‐based enzyme‐linked immunosorbent assay
and immunochromatographic rapid assay for monensin. Analyst
(1998) 123, 2573 – 2578.
(46) Monensin ELISA kit (Cat # KA1422 V.01),
http://www.abnova.com/.
(47) Monensin ELISA. Enzyme‐linked immunosorbent assay for the
determination of monensin in feed and contaminated samples.
http://abraxiskits.com/.
Chapter 5
‐ 392 ‐
(48) S. R. H. Crooks, I. M. Traynor, C. T. Elliott, W. J. McCaughey.
Detection of monensin residues in poultry liver using an enzyme
immunoassay. Analyst (1997) 122, 161 – 163.
(49) M. Ciz, H. Cizova, P. Deneb, M. Kratchanova, A. Slavov, A. Lojek.
Different methods for control and comparison of the antioxidant
properties of vegetables. Food Control (2010) 21, 518 – 523.
(50) E. Atala, L. Vásquez, H. Speisky, E. Lissi, C. López‐Alarcón.
Ascorbic acid contribution to ORAC values in berry extracts: An
evaluation by the ORAC‐pyrogallol red methodology. Food Chem.
(2009) 113, 331 – 335.
(51) M. D. Rivero‐Pérez, M. L. González‐Sanjosé, M. Ortega‐Herás, P.
Muñiz. Antioxidant potential of single‐variety red wines aged in
the barrel and in the bottle. Food Chem. (2008) 111, 957 – 964.
(52) E. Sofic, Z. Rimpapa, Z. Kundurovic, A. Sapcanin, I. Tahirovic, A.
Rustembegovic, G. Cao. Antioxidant capacity of the neurohormone
melatonin. J. Neural Transm. (2005) 112, 349 – 358.
(53) G. Cao, H. M. Alessie, R. G. Cutler. Oxygen‐radical absorbance
capacity assay for antioxidants. Free Radical Bio. Med. (1993) 14, 303
– 311.
(54) W. Mullen, S. C. Marks, A. Crozier. Evaluation of phenolic
compounds in commercial fruit juices and fruit drinks. J. Agr. Food
Chem. (2007) 55, 3148 – 3157.
(55) J. Tabart, C. Kevers, J. Pincemail, J. O. Defraigne, J. Dommes.
Comparative antioxidant capacities of phenolic compounds
measured by various tests. Food Chem. (2009) 113, 1226 – 1233,

Discussion of the results
‐ 393 ‐
(56) L. Müller, S. Groyke, A. M. Popken, V. Böhm. Antioxidant capacity
and related parameters of different fruit formulations. Food Sci.
Technol. (2010) 43, 992 – 999.
(57) N. Nenadis, O. Lazaridou, M. Z. Tsimidou. Use of reference
compounds in antioxidant activity assessment. J. Agr. Food Chem.
(2007) 55, 5452 – 5460.
(58) B. Lorrain, I. Ky, L. Pechamat, P. L. Teissedre, Evolution of analysis
of polyphenols from grapes, wines, and extracts. Molecules (2013)
18, 1076 ‐ 1100.
(59) M. Medić‐Ŝarić, V. Rastija, M. Bojić. Recent advances in the
application of high performance liquid chromatography in the
analysis of polyphenols in wine and propolis. J. AOAC Int. (2011)
94, 32 ‐ 42.
(60) H. Franquet‐Griell, A. Checa, O. Núñez, J. Saurina, S. Hernández‐
Cassou, L. Puignou. Determination of polyphenols in Spanish
wines by capillary zone electrophoresis. Application to wine
characterization by using chemometrics. J. Agr. Food. Chem. (2012)
60, 8340 ‐ 8349.
(61) A. Sánchez‐Arribas, M. Martínez‐Fernández, M. Chicharro. The
role of electroanalytical techniques in analysis of polyphenols in
wine. Trends Anal. Chem. (2012) 34, 78 ‐ 96.
(62) L. M. Magalhães, M. A. Segundo, S. Reis, J. L. C. Lima, A. O. S. S.
Rangel. Automatic method for the determination of Folin‐Ciocalteu
reducing capacity in food products. J. Agr. Food Chem. (2006) 54,
5241 ‐ 5246.
Chapter 5
‐ 394 ‐
(63) J. C. Sánchez‐Rangel, J. Benavides, J. B. Heredia, L. Cisneros‐
Zevallos, D. A. Jacobo‐Velázquez. The Folin‐Ciocalteu assay
revisited: improvement of its specificity for total phenolic content
determination. Anal. Methods (2013) 5, 5990 ‐ 5999.
(64) J. Sochor, M. Ryvolova, O. Krystofova, P. Salas, J. Hubalek, V.
Adam, L. Trnkova, L. Havel, M. Beklova, J. Zehnalek, I. Provaznik,
R. Kizek. Fully automated spectrometric protocols for
determination of antioxidant activity: advantages and
disadvantages. Molecules (2010) 15, 8618 ‐ 8640.
(65) A. L. Dawidowicz, D. Wianowska, M. Olszowy. On practical
problems in estimation of antioxidant activity of compounds by
DPPH method (Problems in estimation of antioxidant activity).
Food Chem. (2012) 131, 1037‐1043.
(66) E. Nkhili, P. Brat. Reexamination of the ORAC assay: effect of metal
ions. Anal. Bioanal. Chem. (2011) 400, 1451 ‐ 1458.
(67) J. Godoy‐Navajas, M. P. Aguilar‐Caballos, A. Gómez‐Hens. Long‐
wavelength fluorimetric determination of food antioxidant capacity
using nile blue as reagent. J. Agr. Food Chem. (2011) 59, 2235‐2240.
(68) M. Gamella, S. Campuzano, A. J. Reviejo, J. M. Pingarrón.
Electrochemical estimation of the polyphenol index in wines using
a laccase biosensor. J. Agric. Food Chem. (2006) 54, 7960 ‐ 7967.
(69) M. Di Fusco, C. Tortolini, D. Deriu, F. Mazzei. Laccase‐based
biosensor for the determination of polyphenol index in wine.
Talanta (2010) 81, 235 ‐ 240.
(70) M.R. Montereali, L. Della Seta, W. Vastarella, R. Pilloton. A
disposable laccase‐tyrosinase based biosensor for amperometric
Discussion of the results
‐ 395 ‐
detection of phenolic compounds in must and wine. J. Mol. Catal. B‐
Enzym. (2010) 64, 189 ‐ 194.
(71) J. Kulys, I. Bratkovskaja. Antioxidants determination with laccase.
Talanta (2007) 72, 526 – 531.
(72) E. Nugroho Prasetyo, T. Kudanga, W. Steiner, M. Murkovic, G. S.
Nyanhongo, G. M. Guebitz. Laccase‐generated tetramethoxy
azobismethylene quinone (TMAMQ) as a tool for antioxidant
activity measurement, Food Chem. (2010) 118, 437 ‐ 444.
(73) E. Nugroho Prasetyo, T. Kudanga, W. Steiner, M. Murkovic, G. S.
Nyanhongo, G. M. Guebitz. Antioxidant activity assay based on
laccase‐generated radicals. Anal. Bioanal. Chem. (2009) 393, 679 ‐
687.
(74) A. Andreu‐Navarro, J. M. Fernández‐Romero, A. Gómez‐Hens.
Determination of polyphenolic content in beverages using laccase,
gold nanoparticles and long wavelength fluorimetry. Anal. Chim.
Acta (2012) 713, 1‐6.
(75) J. Robinson (Ed.) “Oxford companion to wine” 3rd edition. (2006) 35
– 36.
(76) Maximum acceptable limits of various substances contained in
wine. Compendium of International Methods of Analysis, OIV, OIV‐
MA‐C1‐01:R2011.
(77) K. Kuningas, T. Rantanen, T. Ukonaho, T. Lövgren, T. Soukka.
Homogeneous assay technology based on upconverting phosphors.
Anal. Chem. (2005) 77, 7348 – 7355
(78) K. Kuningas, T. Ukonaho, H. Pakkilä, T. Rantanen, J. Rosenberg, T.
Lövgren, T. Soukka. Upconversion fluorescence resonance energy
Chapter 5
‐ 396 ‐
transfer in a homogeneous immunoassay for estradiol. Anal. Chem.
(2006) 78, 4690 – 4696.
(79) T. Rantanen, H. Päkkilä, L. Jämsen, K. Kuningas, T. Ukonaho, T.
Lövgren, T. Soukka. Tandem dye acceptor used to enhance
upconversion fluorescence resonance energy transfer in
homogeneous assays. Anal. Chem. (2007) 79, 6312 – 6318.

CONCLUSIONES
CONCLUSIONS

Conclusiones
‐ 399 ‐
Las investigaciones presentadas en esta Memoria han contribuido a
expandir la aplicabilidad de la Nanotecnología al análisis de alimentos
mediante el desarrollo de diversos métodos que presentan niveles
adecuados de sensibilidad y selectividad. El uso de microplacas ha
permitido la automatización de estos métodos con un bajo consumo de
muestras y reactivos y una elevada velocidad de muestreo. A partir del
trabajo realizado se extraen las siguientes conclusiones:
‐ Se han sintetizado nanopartículas de sílice dopadas con los fluoróforos
de larga longitud de onda violeta de cresilo y azul nilo. La utilización
de estos nanomateriales con fines analíticos permite mejorar
simultáneamente la selectividad espectral, evitando la señal de fondo
de la matriz de la muestra, y la sensibilidad, consecuencia de su
elevada relación superficie/volumen. Los principales resultados
obtenidos con estas nanopartículas se resumen a continuación:
o La síntesis mediante el método de formación de
microemulsiones en micelas inversas proporciona
nanopartículas con un mayor porcentaje de fluoróforo
encapsulado que con el método Stöber, que en general ha
sido el más utilizado.
o Los nuevos nanomateriales desarrollados presentan mayor
estabilidad fotoluminiscente que los fluoróforos orgánicos
en disolución.
o La interacción entre las cargas positivas de estos fluoróforos
y las cargas negativas de la matriz de sílice favorece la
Conclusiones
‐ 400 ‐
estabilización de los fluoróforos encapsulados, no siendo
necesario su enlace covalente a dicha matriz de sílice.
o La versatilidad y aplicabilidad analítica de las
nanopartículas de sílice dopadas con azul nilo se ha puesto
de manifiesto mediante su uso para formar marcadores en
fluorinmunoensayo heterogéneo. Se ha demostrado su
utilidad para la determinación de macromoléculas como las
proteínas de soja y moléculas pequeñas como el antibiótico
de uso veterinario monensín.
o Los dos métodos de inmunoensayo desarrollados
constituyen una alternativa útil frente a los métodos ELISA
normalmente usados para la determinación de estas
especies, ya que alcanzan menores límites de detección y
evitan la etapa adicional para la medida de la actividad
enzimática.
o La elevada sensibilidad obtenida con estos marcadores
permite realizar medidas de fluorescencia en superficie
sólida utilizando pocillos de menor volumen que los
convencionales, lo que disminuye el consumo de reactivos
y el coste de los ensayos.
‐ Se ha desarrollado un nuevo método ORAC para la determinación de
la capacidad antioxidante en zumos y vinos con el uso del fluoróforo
de larga longitud de onda azul nilo como reactivo, mejorando la
selectividad espectral de las determinaciones convencionales basadas
en el uso de fluoresceína o de β‐ficoeritrina.
Conclusiones
‐ 401 ‐
‐ Se ha propuesto un nuevo método enzimático con detección
fluorimétrica para la determinación de polifenoles en vinos basado en
el uso del fluoróforo 8‐hidroxipireno 3‐sulfonato sódico como nuevo
sustrato de la laccasa y de nanopartículas de óxido de terbio como
activadores de esta enzima. Se ha demostrado que el límite de
detección del método en presencia de estas nanopartículas es tres
veces inferior al obtenido en su ausencia.
‐ Se ha ampliado el campo de aplicación de los procesos basados en
transferencia de energía de resonancia luminiscente (LRET) utilizando
nanocristales de iones lantánidos que presentan luminiscencia anti‐
Stokes, denominados “upconverting phosphors”, como dadores de
energía, y fluoróforos orgánicos que emiten en el visible, como
aceptores. Las conclusiones más destacables de este estudio son las
siguientes:
o Se han obtenido señales LRET adecuadas utilizando
nanocristales dopados con Er(III), Ho(III) y Tm(III), con
diámetros medios entre 10 y 20 nm, como dadores y, β‐
ficoeritrina, R‐ficoeritrina y Alexa Fluor 680 como
aceptores.
o Mediante ensayos de afinidad homogéneos, utilizando el
sistema biotina‐estreptavidina, se ha obtenido la mayor
luminiscencia con el par formado por nanocristales
dopados con Er(III) y β‐ficoeritrina. No obstante, se ha
demostrado que los pares formados por nanocristales
dopados con Ho(III) y Tm(III) como dadores y β‐ficoeritrina
Conclusiones
‐ 402 ‐
y R‐ficoeritrina como aceptores también originan señales
luminiscentes adecuadas, permitiendo en todos los casos la
determinación de biotina a nivel nM.
‐ Se ha demostrado la utilidad analítica de la mayoría de los métodos
desarrollados mediante su aplicación al análisis de diversos alimentos,
tales como vinos, zumos y leche. Las propiedades analíticas que
presentan estos métodos han permitido que las determinaciones
realizadas no requieran tratamientos de muestra complejos, siendo sólo
necesaria la dilución de las muestras de vinos y zumos y la
desproteinización de las muestras de leche.
Conclusions
‐ 403 ‐
The investigations included in this Dissertation have contributed to
expand the application of Nanotechnology to food analysis by the
development of several methods that present adequate levels of sensitivity
and selectivity. The use of the microplate format has allowed the
automation of these methods, also featuring low sample and reagent
consumption and a relatively high sample throughput. Bearing in mind the
results obtained, the following conclusions can be drawn:
‐ Silica nanoparticles doped with the long‐wavelength fluorophores
cresyl violet and nile blue have been synthesized. The use of these
nanomaterials for analytical purposes allows the simultaneous
improvement of the spectral selectivity, by avoiding the background
signal of simple matrix, and the sensitivity, this later as a consequence
of their high surface/volume ratio. The main results obtained with
these nanoparticles can be summarized as follows:
o The reverse‐micelle microemulsion synthesis procedure
provides nanoparticles with a higher percentage of
encapsulated fluorophore than the Stöber method, which
has been generally used.
o The newly developed nanomaterials feature better
photoluminescent stability than the organic fluorophores in
solution.
o The interaction between the positive charges of these
fluorophores and the negative charges of silica matrix
favours the stabilization of the encapsulated fluorophores,
which avoids their covalent linking to the silica matrix.
Conclusions
‐ 404 ‐
o The versatility and analytical usefulness of nile blue‐doped
silica nanoparticles has been shown by their application to
the synthesis of tracers to be used in heterogeneous
fluoroimmunoassays. Their analytical potential has been
demonstrated by developing methods for the determination
of macromolecules, such as soy proteins, and for small
molecules (haptens), namely the veterinary antibiotic
monensin.
o The two immunoassay methods developed can be regarded
as useful alternatives to the ELISA methods commonly
used for the determination of these species, since lower
detection limits are achieved and the addition of a substrate
to measure the enzymatic activity of the tracer is avoided.
o The high sensitivity obtained with these tracers allows the
performance of front‐surface fluorescence measurements
using wells with a lower volume than the conventional
ones, which lowers reagent consumption and decreases the
cost of assays.
‐ A new ORAC method to determine the antioxidant capacity in juice
and wine samples has been developed by using the long‐wavelength
fluorophore nile blue as reagent. This approach has improved the
spectral selectivity of the conventional determinations based on the
use of fluorescein or β‐phycoerythrin.
Conclusions
‐ 405 ‐
‐ A new enzymatic method for polyphenol determination in wines with
fluorometric detection has been developed using the fluorophore 8‐
hydroxypyrene 3‐sulfonate trisodium and terbium oxide nanoparticles
as new laccase substrate and activator, respectively. This study has
shown that the detection limit obtained using nanoparticles is about
three times lower than that obtained in their absence.
‐ The application field of luminescence resonance energy transfer
(LRET) processes has been expanded using nanocrystals of lanthanide
ions capable of providing anti‐Stokes luminescence, so called
“upconverting phosphors”. These nanocrystals have been used as
energy donors and organic fluorophores emitting in the visible region
as energy acceptors. The main conclusions of this study are:
o Suitable LRET signals have been obtained using
nanocrystals doped with Er(III), Ho(III) y Tm(III), which
feature mean diameters between 10 and 20 nm, as donors,
and β‐phycoerythrin, R‐phycoerythrin and Alexa Fluor 680
as acceptors.
o The performance of homogeneous affinity assays for the
biotin‐streptavidin system has shown that the highest
luminescence is obtained with the pair integrated by Er(III)‐
doped nanocrystals and β‐phycoerythrin. Nevertheless, it
has been shown that the pairs integrated by Ho(III) and
Tm(III) doped nanocrystals as donors and β‐phycoerythrin
and R‐phycoerythrin as acceptors also provide adequate
Conclusions
‐ 406 ‐
luminescent signals, allowing the biotin determination at
nM level in all instances.
‐ The analytical usefulness of most developed methods has been
demonstrated by their application to the analysis of several foods, such
as wine, juice and milk. The analytical features of these methods have
allowed the use of very simple sample treatments, such as the dilution
of wine and juice samples or the protein removal from milk samples.
ANEXO
ANNEX
ProducciónCientífica
ScientificProduction

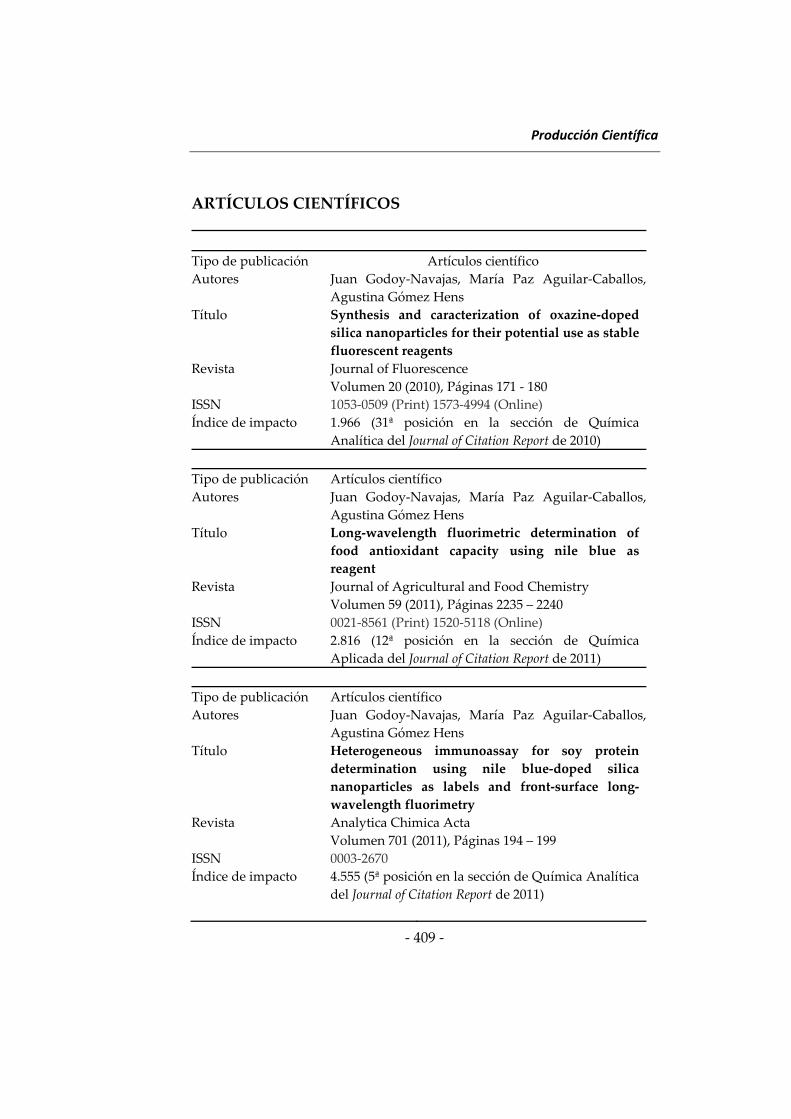
Producción Científica
‐ 409 ‐
ARTÍCULOS CIENTÍFICOS
Tipo de publicación Artículos científico
Autores Juan Godoy‐Navajas, María Paz Aguilar‐Caballos,
Agustina Gómez Hens
Título Synthesis and caracterization of oxazine‐doped
silica nanoparticles for their potential use as stable
fluorescent reagents
Revista Journal of Fluorescence
Volumen 20 (2010), Páginas 171 ‐ 180
ISSN 1053‐0509 (Print) 1573‐4994 (Online)
Índice de impacto 1.966 (31ª posición en la sección de Química
Analítica del Journal of Citation Report de 2010)
Tipo de publicación Artículos científico
Autores Juan Godoy‐Navajas, María Paz Aguilar‐Caballos,
Agustina Gómez Hens
Título Long‐wavelength fluorimetric determination of
food antioxidant capacity using nile blue as
reagent
Revista Journal of Agricultural and Food Chemistry
Volumen 59 (2011), Páginas 2235 – 2240
ISSN 0021‐8561 (Print) 1520‐5118 (Online)
Índice de impacto 2.816 (12ª posición en la sección de Química
Aplicada del Journal of Citation Report de 2011)
Tipo de publicación Artículos científico
Autores Juan Godoy‐Navajas, María Paz Aguilar‐Caballos,
Agustina Gómez Hens
Título Heterogeneous immunoassay for soy protein
determination using nile blue‐doped silica
nanoparticles as labels and front‐surface long‐
wavelength fluorimetry
Revista Analytica Chimica Acta
Volumen 701 (2011), Páginas 194 – 199
ISSN 0003‐2670
Índice de impacto 4.555 (5ª posición en la sección de Química Analítica
del Journal of Citation Report de 2011)
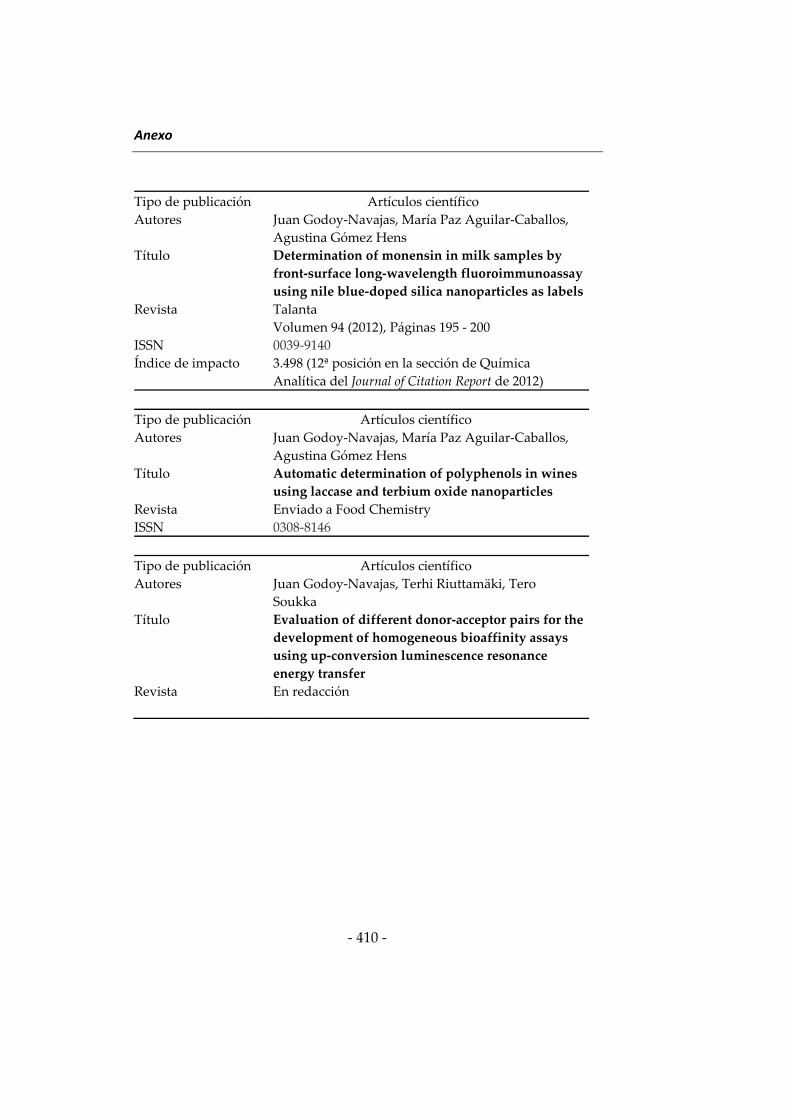
Anexo
‐ 410 ‐
Tipo de publicación Artículos científico
Autores Juan Godoy‐Navajas, María Paz Aguilar‐Caballos,
Agustina Gómez Hens
Título Determination of monensin in milk samples by
front‐surface long‐wavelength fluoroimmunoassay
using nile blue‐doped silica nanoparticles as labels
Revista Talanta
Volumen 94 (2012), Páginas 195 ‐ 200
ISSN 0039‐9140
Índice de impacto 3.498 (12ª posición en la sección de Química
Analítica del Journal of Citation Report de 2012)
Tipo de publicación Artículos científico
Autores Juan Godoy‐Navajas, María Paz Aguilar‐Caballos,
Agustina Gómez Hens
Título Automatic determination of polyphenols in wines
using laccase and terbium oxide nanoparticles
Revista Enviado a Food Chemistry
ISSN 0308‐8146
Tipo de publicación Artículos científico
Autores Juan Godoy‐Navajas, Terhi Riuttamäki, Tero
Soukka
Título Evaluation of different donor‐acceptor pairs for the
development of homogeneous bioaffinity assays
using up‐conversion luminescence resonance
energy transfer
Revista En redacción
Producción Científica
‐ 411 ‐
CONTRIBUCIONES A CONGRESOS
Autores Juan Godoy‐Navajas, María Paz Aguilar‐Caballos,
Agustina Gómez‐Hens
Título Synthesis of nile blue‐ and cresyl violet‐doped silica
nanoparticles for their potential use as labels
Tipo de participación Comunicación oral
Congreso XIII International Symposium of Luminiscence
Spectrometry
Lugar y fecha
de celebración
Bologna (Italy), del 7 al 11 de Septiembre de 2008
Autores Juan Godoy‐Navajas, María Paz Aguilar‐Caballos,
Agustina Gómez‐Hens
Título Development and assessment of new luminescent
silica nanoparticles as labels in long‐wavelength
fluoroimmunoassays
Tipo de participación Póster
Congreso 12ª Jornadas de Análisis Instrumental
Lugar y fecha
de celebración
Barcelona (España), del 21 al 23 de Octubre de 2008
Autores Juan Godoy‐Navajas, María Paz Aguilar‐Caballos,
Agustina Gómez‐Hens
Título Long wavelength dye‐doped silica nanoparticles as
potential labels
Tipo de participación Póster
Congreso I Encuentro sobre Nanociencia y Nanotecnología de
investigadores y tecnólogos de la Universidad de
Córdoba (I Nano‐UCO)
Lugar y fecha
de celebración
Córdoba (España), 12 de Diciembre de 2008
Anexo
‐ 412 ‐
Autores Juan Godoy‐Navajas
Título Investigación del potencial analítico de nuevos
nanomateriales luminiscentes a larga longitud de
onda
Tipo de participación Póster
Congreso VII Jornadas Doctorales Andaluzas
Lugar y fecha
de celebración
Carmona (Sevilla, España), del 28 de Junio al 3 de
Julio (2009)
Autores Juan Godoy‐Navajas
Título Nuevas metodologías en análisis de alimentos y
ambiental con el uso de nanopartículas
Tipo de participación Comunicación Oral
Congreso I Congreso Científico de Investigadores en
Formación
Lugar y fecha
de celebración
Córdoba (España), 15 y 16 de Octubre de 2009
Autores Juan Godoy‐Navajas, María Paz Aguilar‐Caballos,
Agustina Gómez‐Hens
Título Long‐wavelength homogeneous
fluoroimmunoassay for the veterinary antibiotic
monensin using doped silica nanoparticles
Tipo de participación Póster
Congreso II Encuentro sobre Nanociencia y Nanotecnología de
Investigadores y Tecnólogos de la Unversidad de
Córdoba (II Nano‐UCO)
Lugar y fecha
de celebración
Córdoba (España), 15 de Enero de 2010
Producción Científica
‐ 413 ‐
Autores Juan Godoy‐Navajas, María Paz Aguilar‐Caballos,
Agustina Gómez‐Hens
Título Determinación de proteínas de soja mediante
fluoroinmunoensayo a larga longitude de onda
utilizando nanopartículas de sílice dopadas con
azul nilo como marcador
Tipo de participación Comunicación Oral
Congreso XII Reunión del grupo regional andaluz de la
Sociedad Española de Química Analítica
Lugar y fecha
de celebración
Córdoba (España), 10 y 11 de Junio de 2010
Autores Juan Godoy‐Navajas, María Paz Aguilar‐Caballos,
Agustina Gómez‐Hens
Título Determinación fluorimétrica a larga longitud de
onda de la actividad antioxidante de muestras de
alimentos con azul nilo como reactivo
Tipo de participación Póster
Congreso XII Reunión del grupo regional andaluz de la
Sociedad Española de Química Analítica
Lugar y fecha
de celebración
Córdoba (España), 10 y 11 de Junio de 2010
Autores T. Riuttamäki (née Rantanen), J. Godoy‐Navajas, E.
Harju, J. Hölsa, T. Soukka
Título Resonance energy transfer from upconverting
phosphors doped with different lanthanide ions
Tipo de participación Póster
Congreso International Conference on Luminiscence of
Lanthanides (ICLL)
Lugar y fecha
de celebración
Odessa (Ukraine), del 5 al 9 de Septiembre de 2010
Anexo
‐ 414 ‐
Autores Juan Godoy‐Navajas, María Paz Aguilar‐Caballos,
Agustina Gómez‐Hens
Título Use of nile blue‐doped silica nanoparticles as labels
in heterogeneous immunoassay for antibiotic
determination
Tipo de participación Póster
Congreso III Encuentro sobre Nanociencia y Nanotecnología de
Investigadores Andaluces (III Nano‐UCO)
Lugar y fecha
de celebración
Córdoba (España), 10 y 11 de febrero de 2011
Autores Juan Godoy‐Navajas, María Paz Aguilar‐Caballos,
Agustina Gómez‐Hens
Título Front‐surface long‐wavelength fluorescence
immunoassay for monensin determination
Tipo de participación Póster
Congreso 12th International Conference on Methods and
Applications of Fluorescence
Lugar y fecha
de celebración
Strasbourg (France), del 11 al 14 de Septiembre de
2011
Autores Juan Godoy‐Navajas
Título Nuevas metodologías analíticas en análisis de
alimentos y ambiental con el uso de nanopartículas
Tipo de participación Comunicación Oral
Congreso I Congreso Científico de Investigadores en
Formación en Agroalimentación de la eidA3 y II
Congreso Científico de Investigadores en Formación
de la Universidad de Córdoba
Lugar y fecha
de celebración
Córdoba (España), 8 y 9 de mayo de 2012
Producción Científica
‐ 415 ‐
Autores Juan Godoy‐Navajas, María Paz Aguilar‐Caballos,
Agustina Gómez‐Hens
Título Utilidad Analítica del uso combinado de
nanopartículas de Tb4O7 para la determinación de
antioxidantes en alimentos
Tipo de participación Póster
Congreso IV Encuentro sobre Nanociencia y Nanotecnología
de Investigadores y Tecnólogos Andaluces (IV
Nano‐UCO)
Lugar y fecha
de celebración
Córdoba (España), 7 y 8 de febrero de 2013
Autores Juan Godoy‐Navajas, María Paz Aguilar‐Caballos,
Agustina Gómez‐Hens
Título Analytical usefulness of the combined use of
Tb4O7 nanoparticles and laccase enzyme for the
determination of antioxidants in food samples
Tipo de participación Póster
Congreso Trends in Nanotechnology
Lugar y fecha
de celebración
Sevilla (España), del 9 al 13 de septiembre de 2013
Anexo
‐ 416 ‐
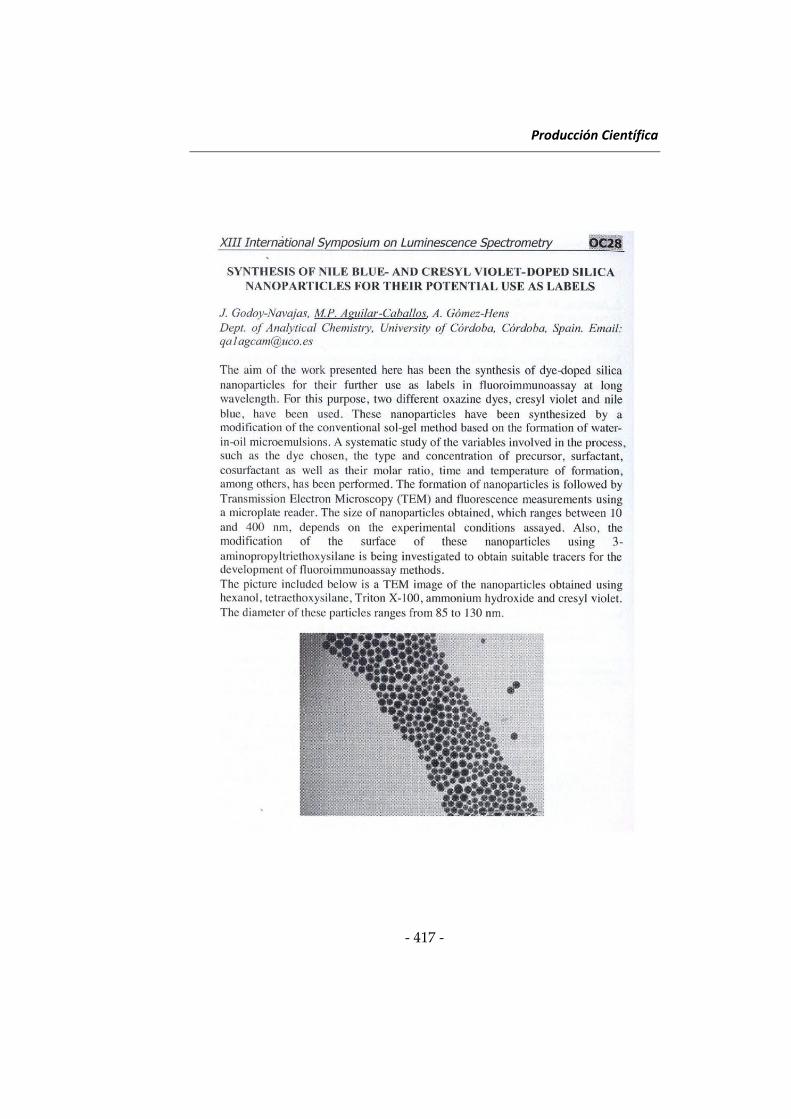
Producción Científica
‐ 417 ‐
Anexo
‐ 418 ‐
Producción Científica
‐ 419 ‐
Anexo
‐ 420 ‐
Producción Científica
‐ 421 ‐
Anexo
‐ 422 ‐
Producción Científica
‐ 423 ‐
Anexo
‐ 424 ‐
Producción Científica
‐ 425 ‐
Anexo
‐ 426 ‐
Producción Científica
‐ 427 ‐

Anexo
‐ 428 ‐
Producción Científica
‐ 429 ‐

Anexo
‐ 430 ‐
Producción Científica
‐ 431 ‐
Anexo
‐ 432 ‐
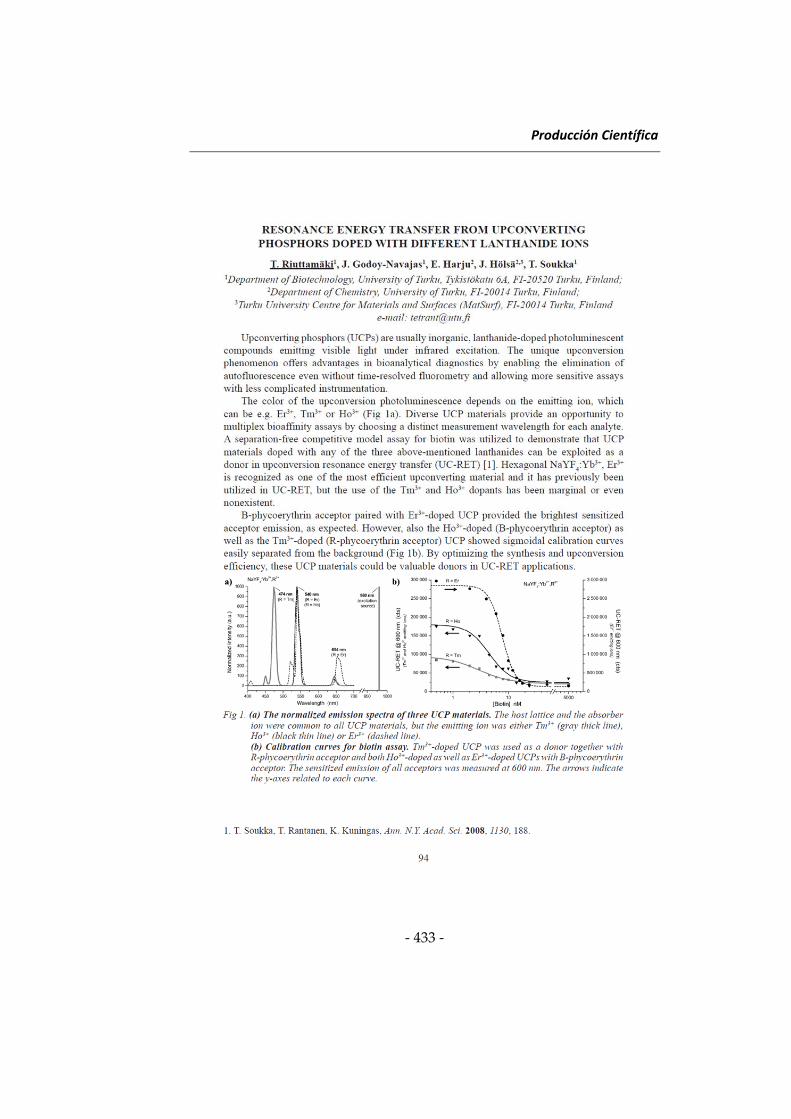
Producción Científica
‐ 433 ‐
Anexo
‐ 434 ‐
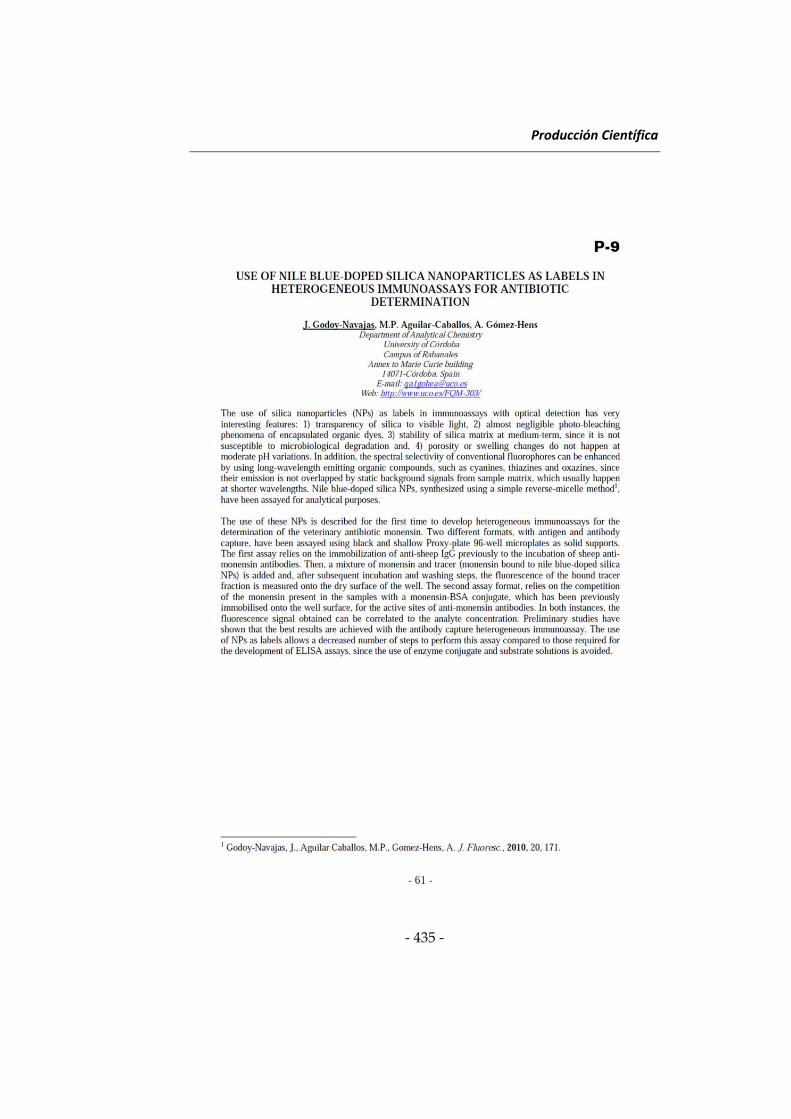
Producción Científica
‐ 435 ‐

Anexo
‐ 436 ‐
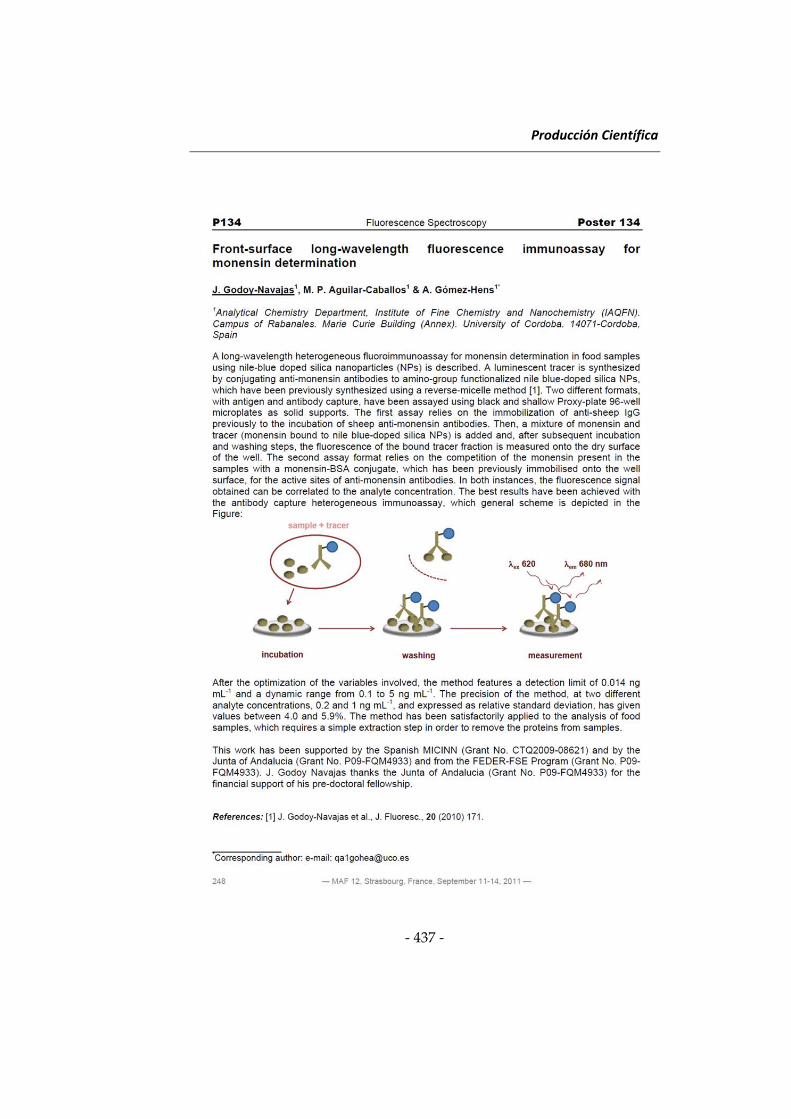
Producción Científica
‐ 437 ‐

Anexo
‐ 438 ‐
Producción Científica
‐ 439 ‐
Anexo
‐ 440 ‐
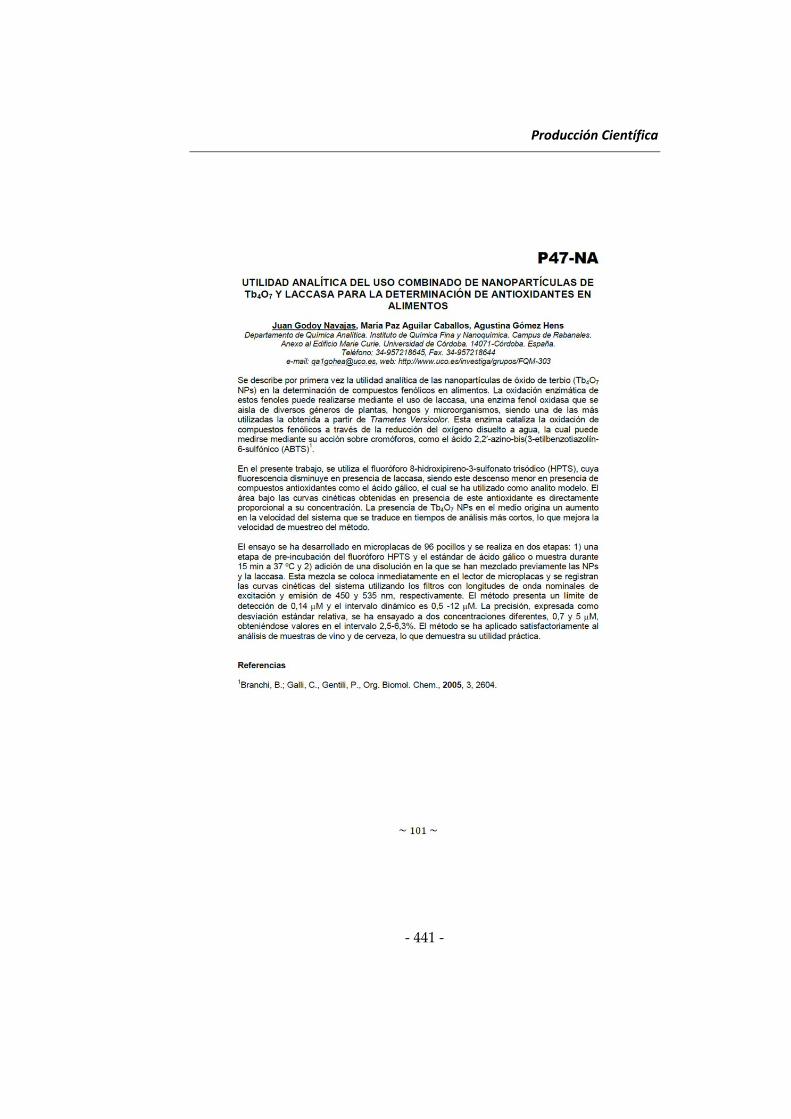
Producción Científica
‐ 441 ‐
Anexo
‐ 442 ‐
Producción Científica
‐ 443 ‐