Embed Size (px)
Citation preview

Now That You Know, What Do You Do?
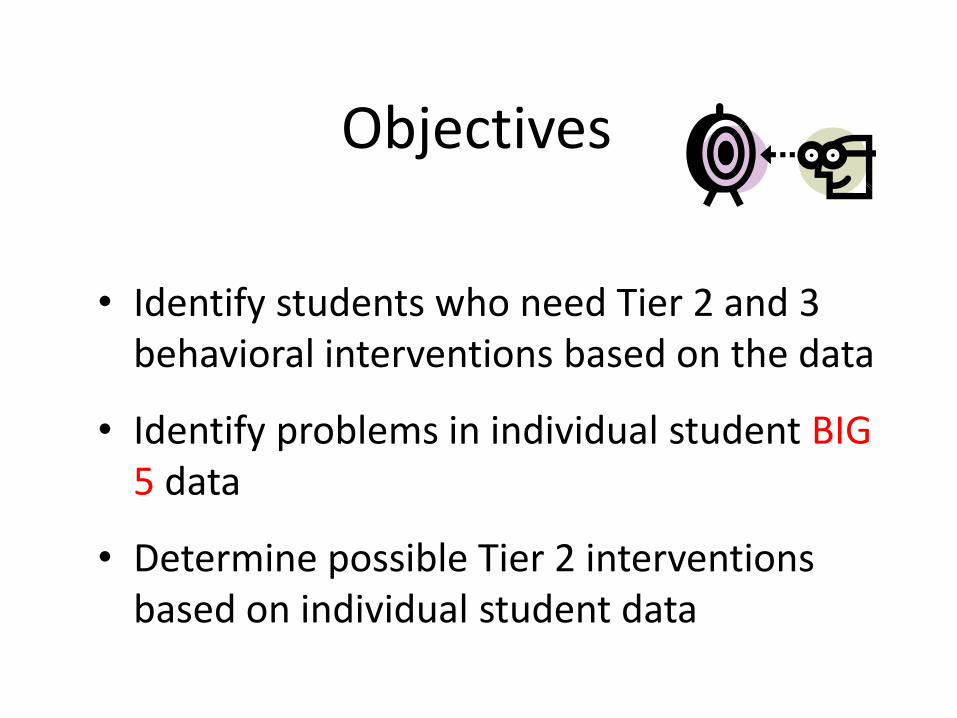
Objectives
• Identify students who need Tier 2 and 3 behavioral interventions based on the data
• Identify problems in individual student BIG 5 data
• Determine possible Tier 2 interventions based on individual student data
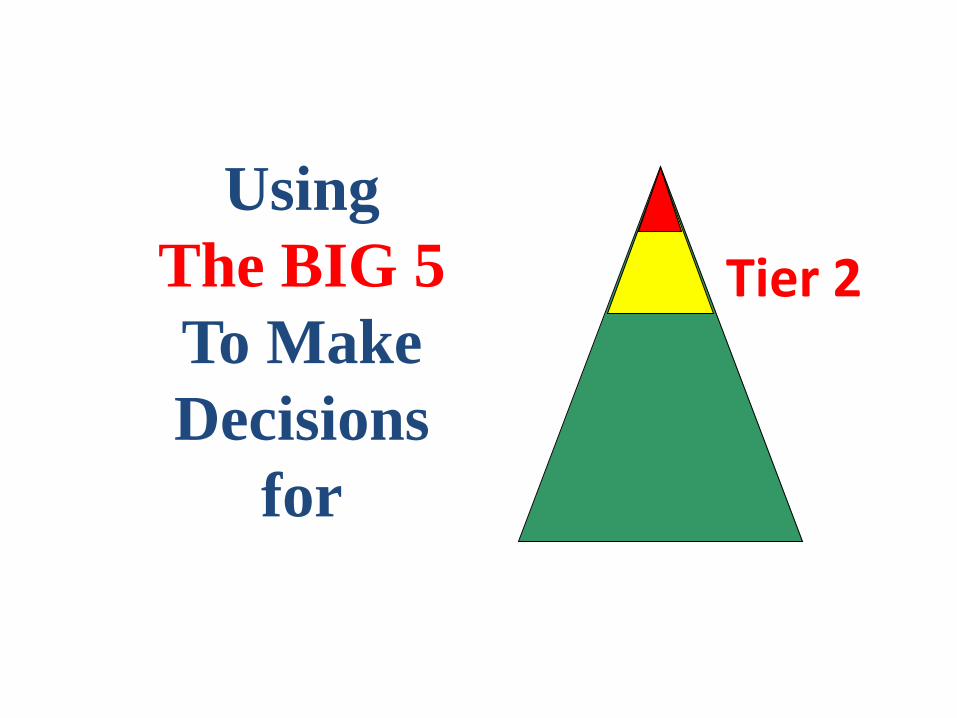
Using
The BIG 5
To Make
Decisions
for
Tier 2

First place to start?
WHO
(Referrals by Student)
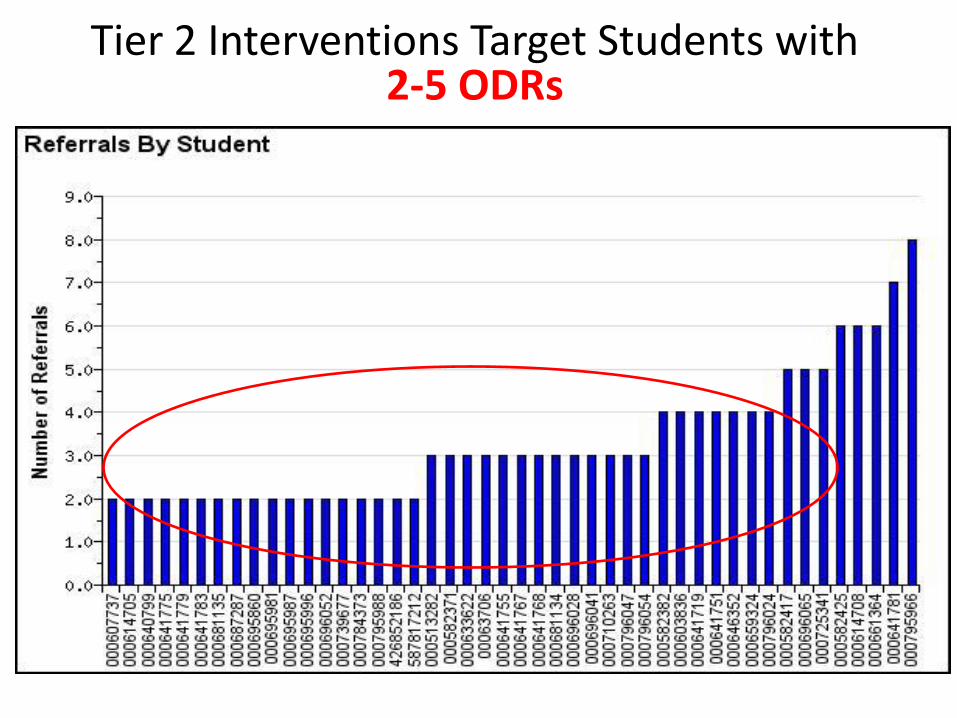
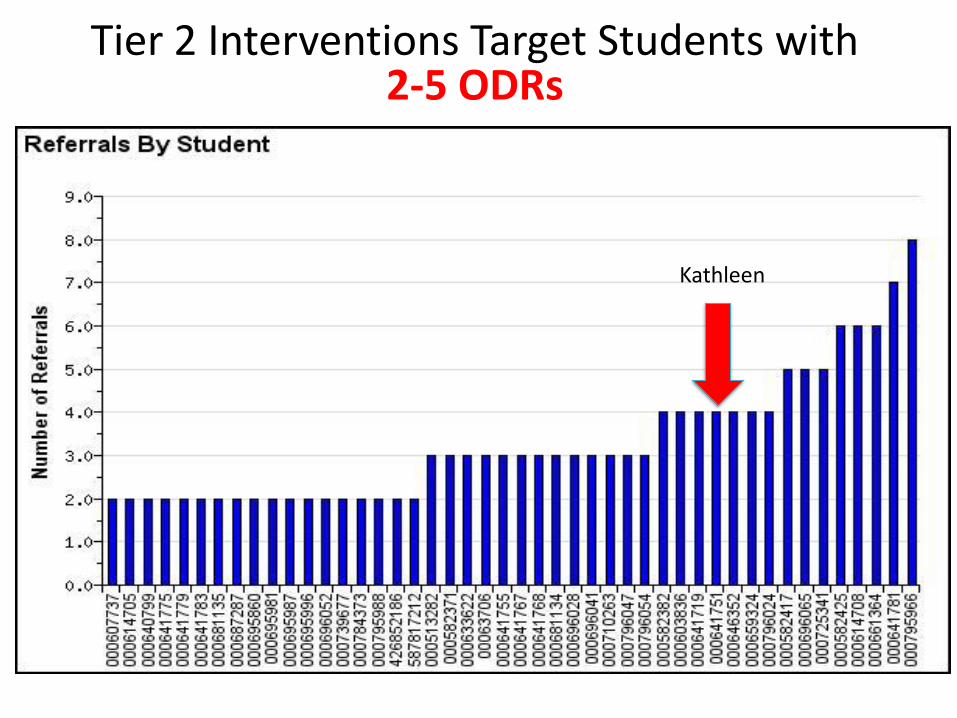
Tier 2 Interventions Target Students with 2-5 ODRs
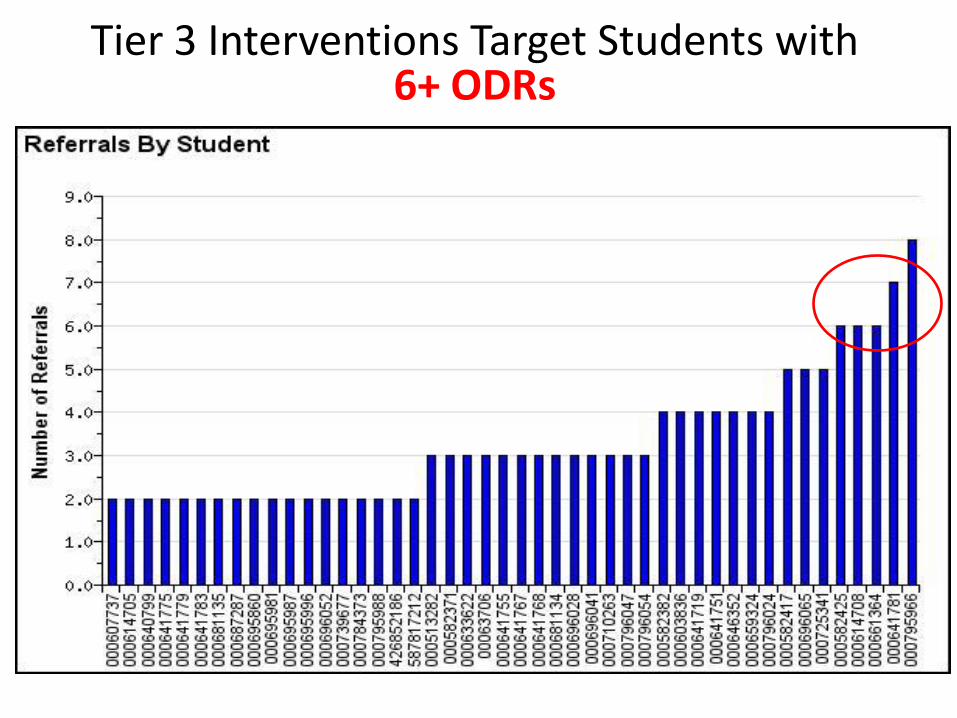
Tier 3 Interventions Target Students with 6+ ODRs
After you identify the students who need additional
behavior support…

Get more specific…
Look at the
BIG 5 for each student
How
Much
What Where When
Who

Kathleen
Tier 2 Interventions Target Students with 2-5 ODRs
Kathleen
0
0.02
0.04
0.06
0.08
0.1
0.12
Aug Sept Oct Nov Dec Jan Feb Mar Apr May Jun Jul
Avg
. OD
Rs
Months
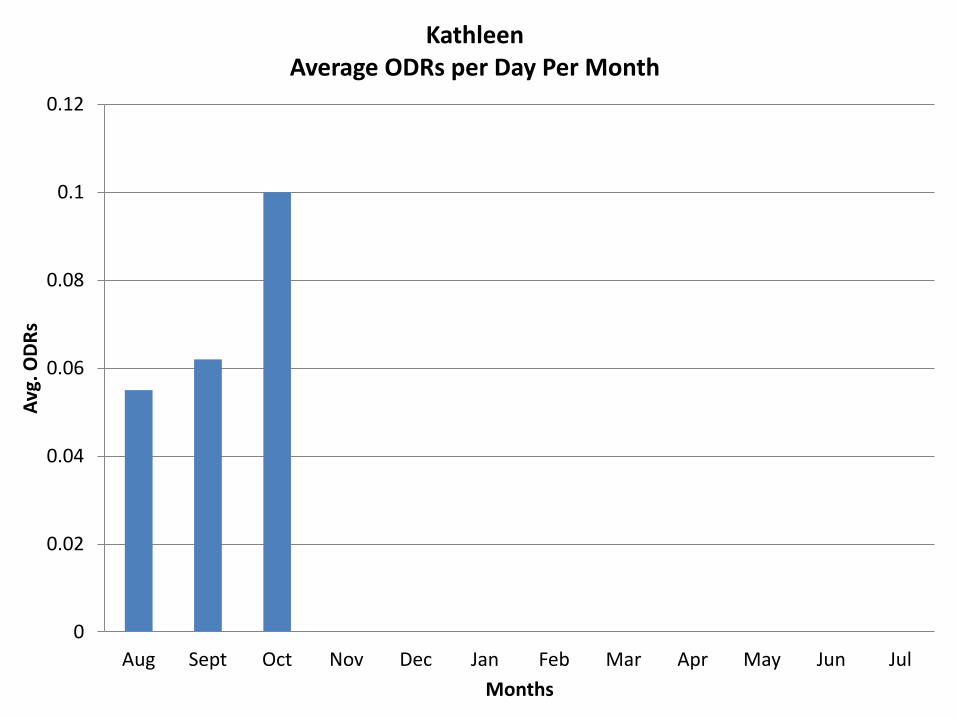
Kathleen Average ODRs per Day Per Month
0
0.5
1
1.5
2
2.5
OD
Rs
Times
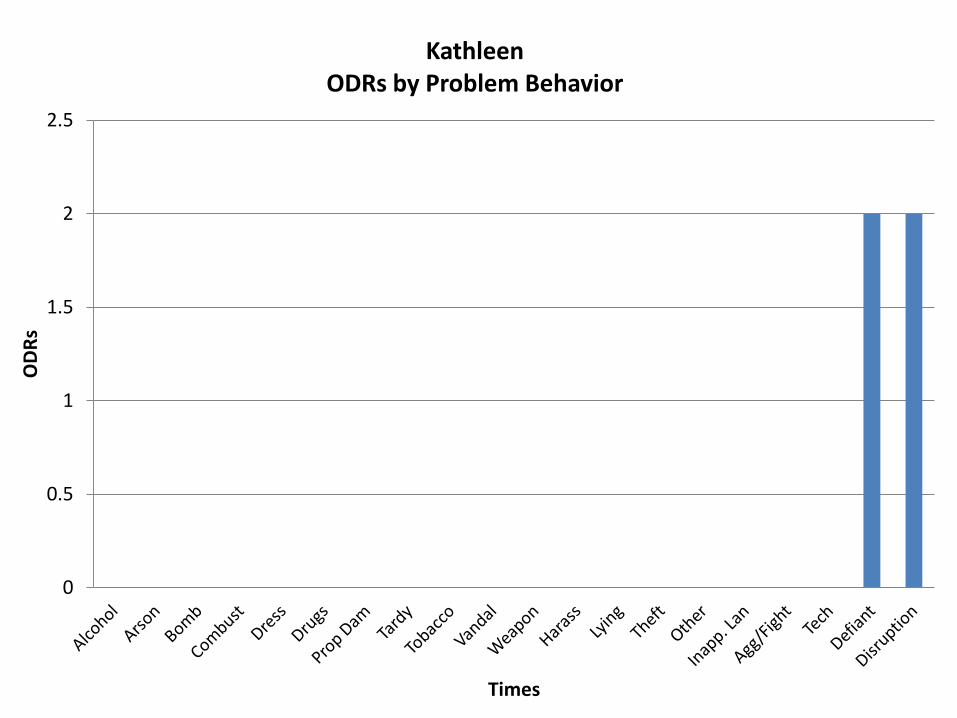
Kathleen ODRs by Problem Behavior
0
0.2
0.4
0.6
0.8
1
1.2 7
:00
AM
:15
:30
:45
8:0
0 A
M
:15
:30
:45
9:0
0 A
M
:15
:30
:45
10
:00
AM
:15
:30
:45
11
:00
AM
:15
:30
:45
12
:00
PM
:15
:30
:45
1:0
0 P
M
:15
:30
:45
2:0
0 P
M
:15
:30
:45
3:0
0 P
M
:15
:30
:45
4:0
0 P
M
OD
Rs
Times
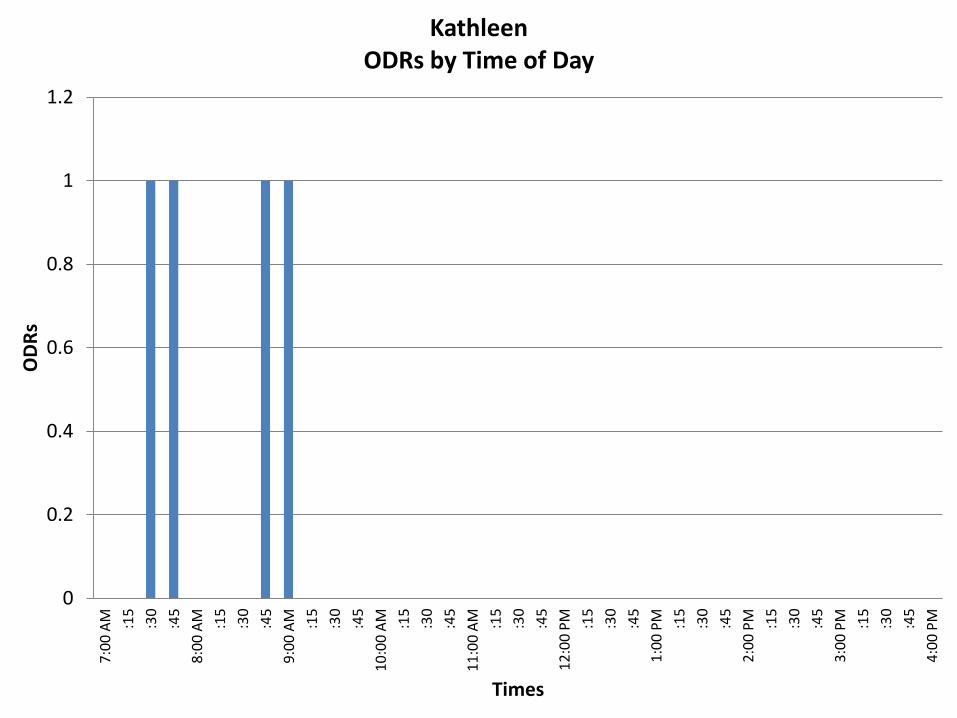
Kathleen ODRs by Time of Day
0
0.5
1
1.5
2
2.5
OD
Rs
Locations
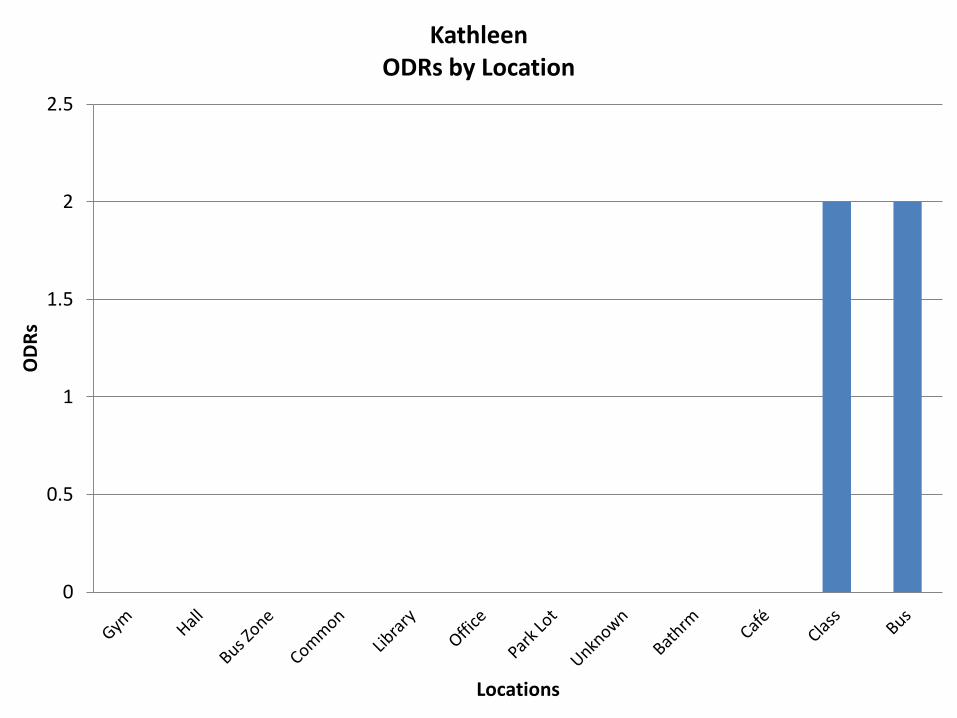
Kathleen ODRs by Location
Another piece of data that is extremely helpful is…
Possible Motivation
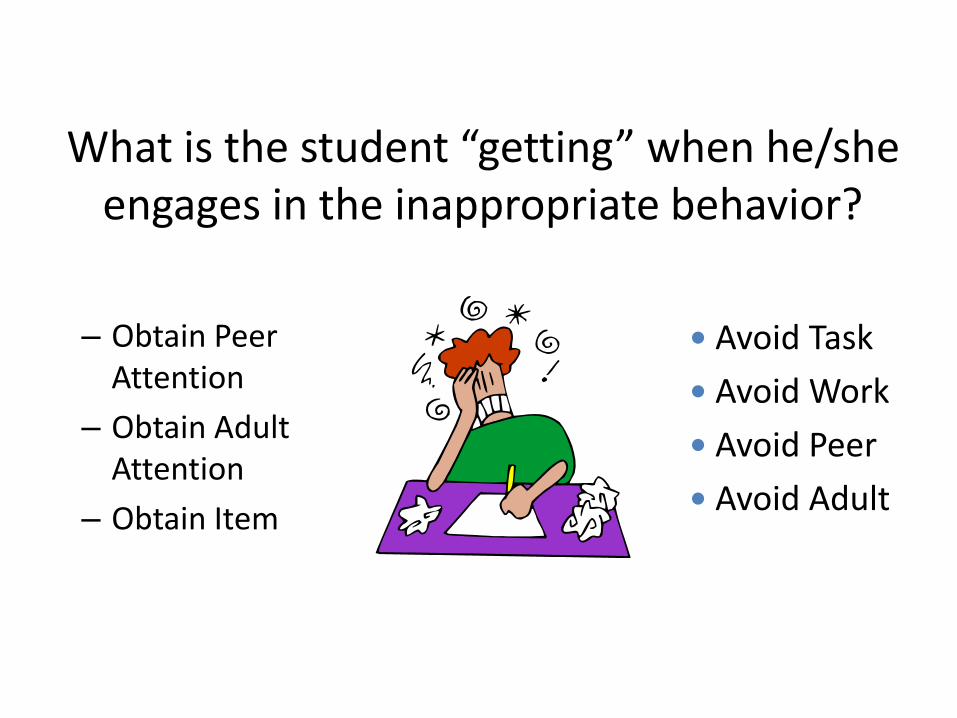
What is the student “getting” when he/she engages in the inappropriate behavior?
– Obtain Peer Attention
– Obtain Adult Attention
– Obtain Item
Avoid Task
Avoid Work
Avoid Peer
Avoid Adult
0
0.5
1
1.5
2
2.5
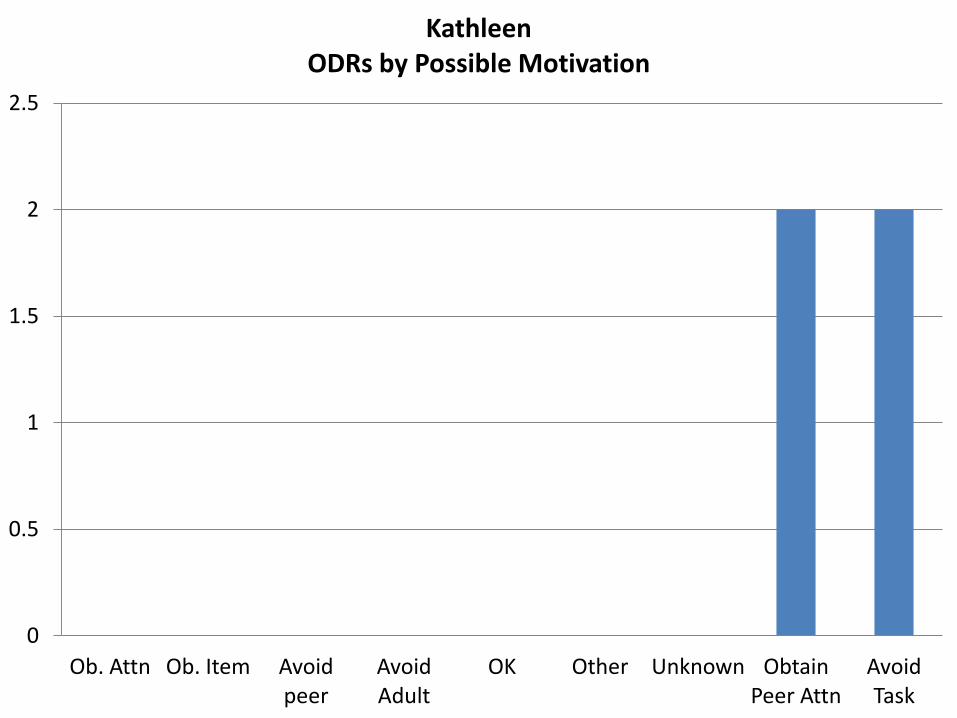
Ob. Attn Ob. Item Avoid peer
Avoid Adult
OK Other Unknown Obtain Peer Attn
Avoid Task
Kathleen ODRs by Possible Motivation
Based on the Data, the Behavior Support Team
Develops a Hypothesis…
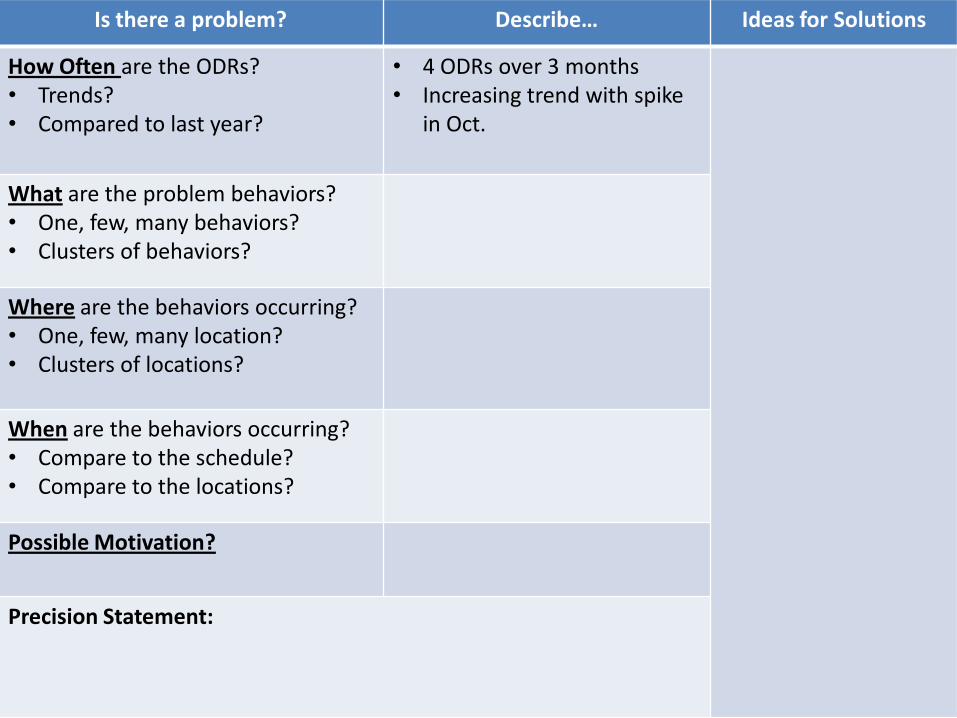
Is there a problem? Describe… Ideas for Solutions
How Often are the ODRs? • Trends? • Compared to last year?
• 4 ODRs over 3 months • Increasing trend with spike
in Oct.
What are the problem behaviors? • One, few, many behaviors? • Clusters of behaviors?
Where are the behaviors occurring? • One, few, many location? • Clusters of locations?
When are the behaviors occurring? • Compare to the schedule? • Compare to the locations?
Possible Motivation?
Precision Statement:

Your Turn…..
David
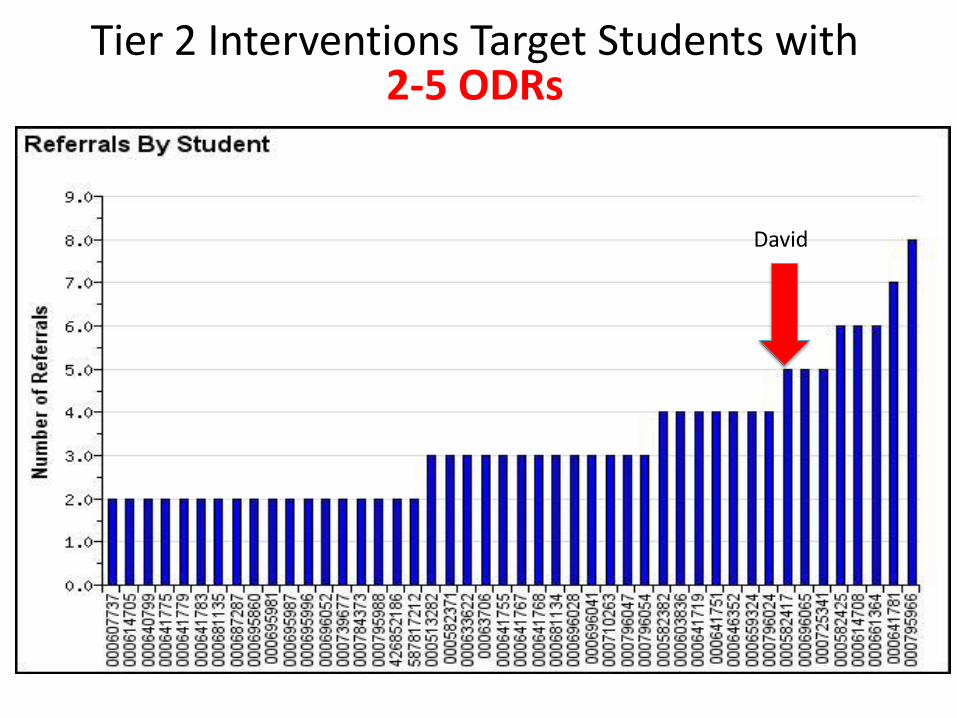
Tier 2 Interventions Target Students with 2-5 ODRs
David
0
0.02
0.04
0.06
0.08
0.1
0.12
Aug Sept Oct Nov Dec Jan Feb Mar Apr May Jun Jul
Avg
. OD
Rs
Months
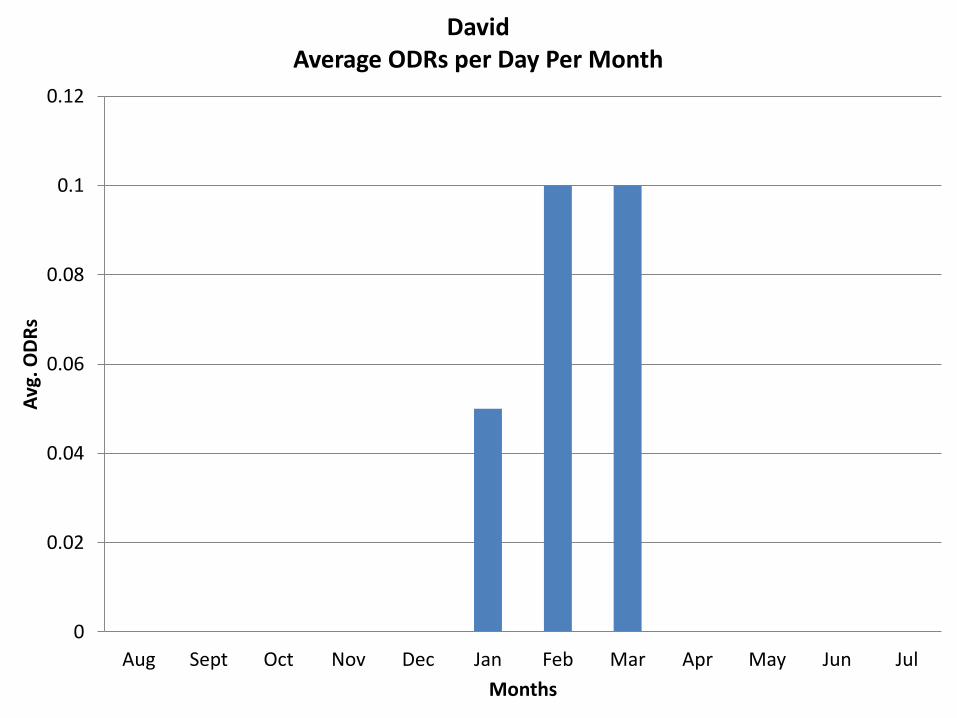
David Average ODRs per Day Per Month
0
1
2
3
4
5
6
OD
Rs
Behaviors
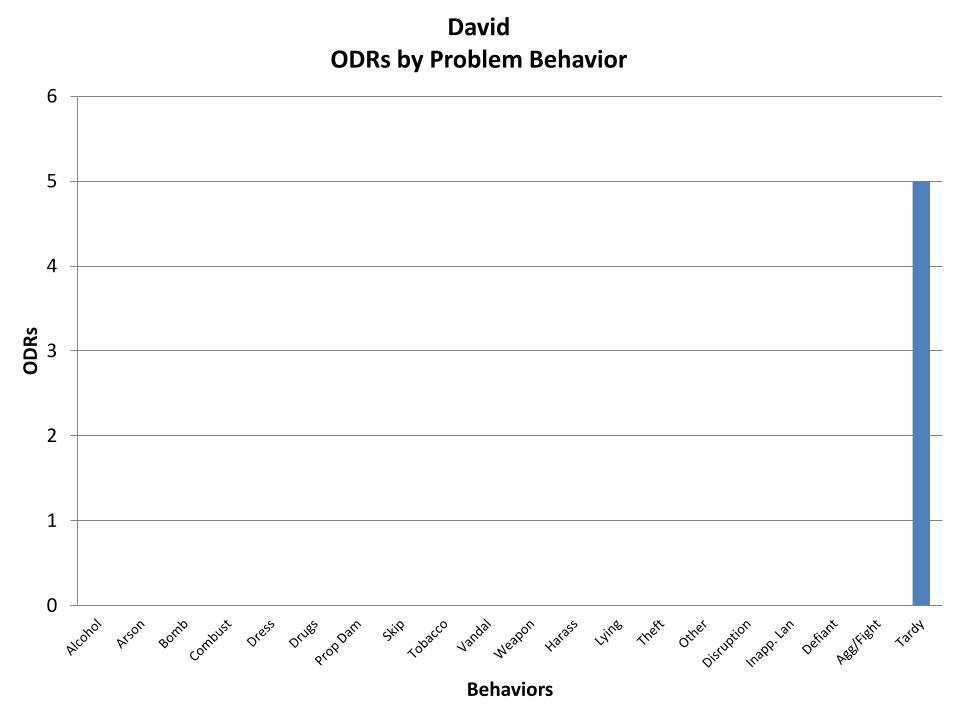
David ODRs by Problem Behavior
0
1
2
3
4
5
6
OD
Rs
Locations
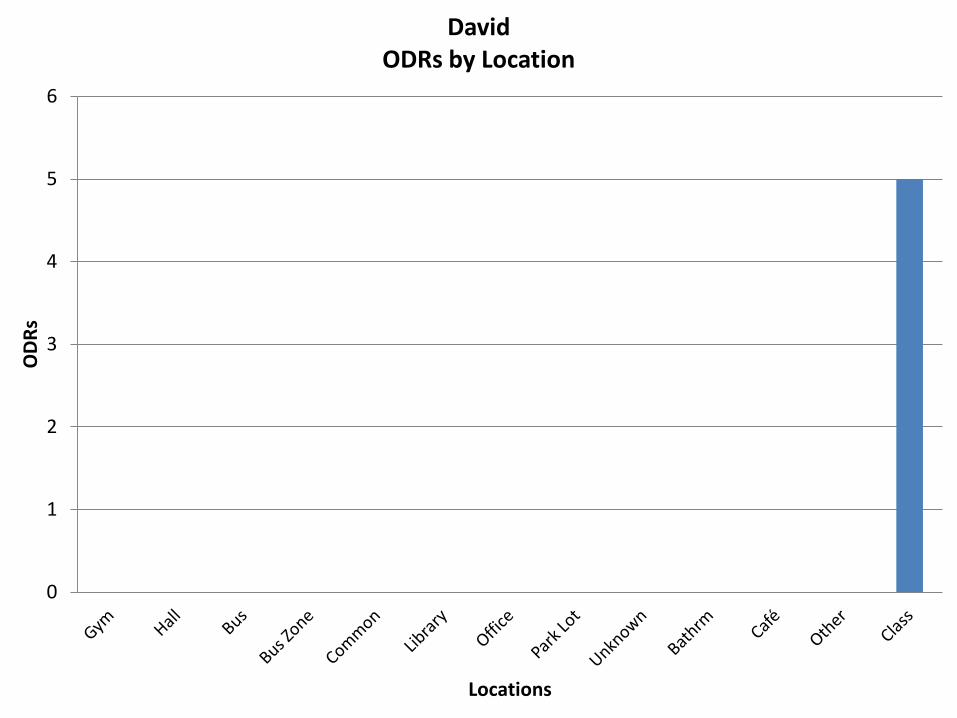
David ODRs by Location
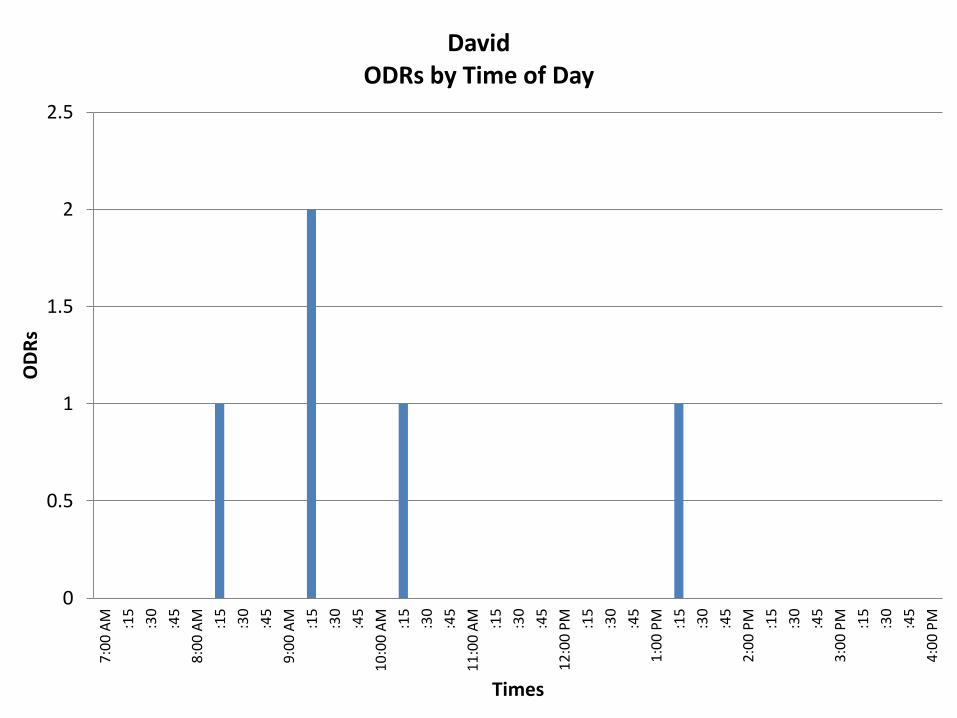
0
0.5
1
1.5
2
2.5 7
:00
AM
:15
:30
:45
8:0
0 A
M
:15
:30
:45
9:0
0 A
M
:15
:30
:45
10
:00
AM
:15
:30
:45
11
:00
AM
:15
:30
:45
12
:00
PM
:15
:30
:45
1:0
0 P
M
:15
:30
:45
2:0
0 P
M
:15
:30
:45
3:0
0 P
M
:15
:30
:45
4:0
0 P
M
OD
Rs
Times
David ODRs by Time of Day
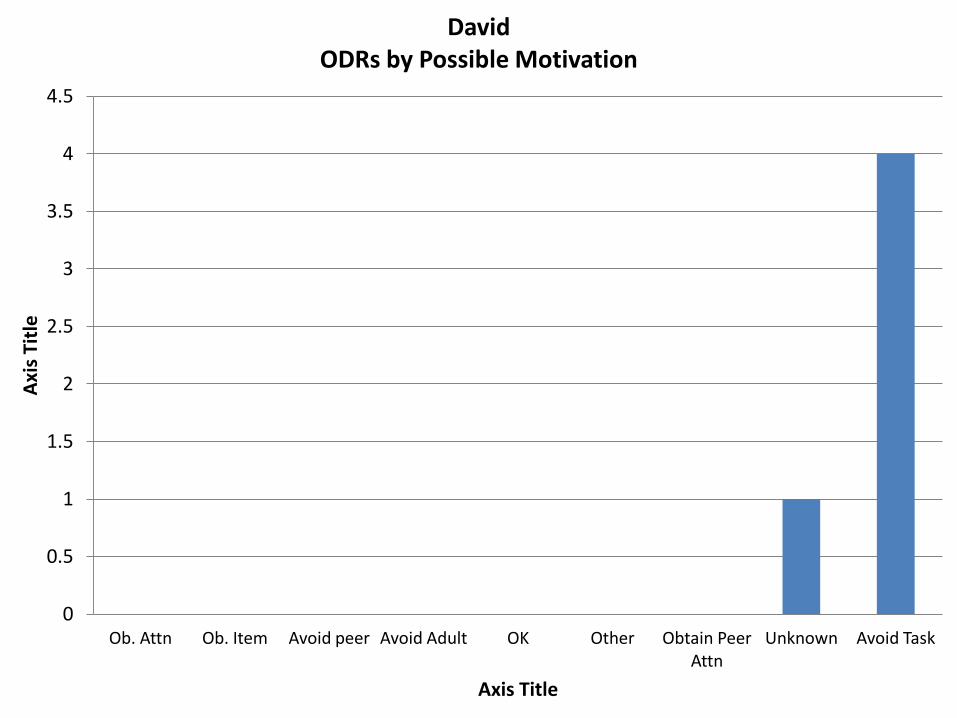
0
0.5
1
1.5
2
2.5
3
3.5
4
4.5
Ob. Attn Ob. Item Avoid peer Avoid Adult OK Other Obtain Peer Attn
Unknown Avoid Task
Axi
s Ti
tle
Axis Title
David ODRs by Possible Motivation
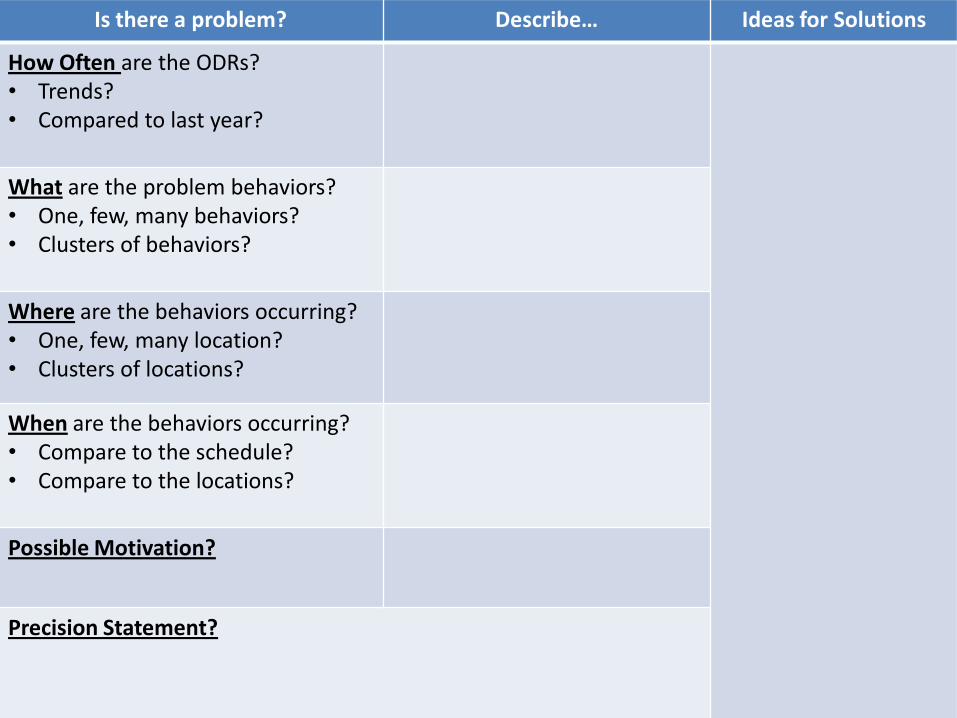
Is there a problem? Describe… Ideas for Solutions
How Often are the ODRs? • Trends? • Compared to last year?
What are the problem behaviors? • One, few, many behaviors? • Clusters of behaviors?
Where are the behaviors occurring? • One, few, many location? • Clusters of locations?
When are the behaviors occurring? • Compare to the schedule? • Compare to the locations?
Possible Motivation?
Precision Statement?
Samantha
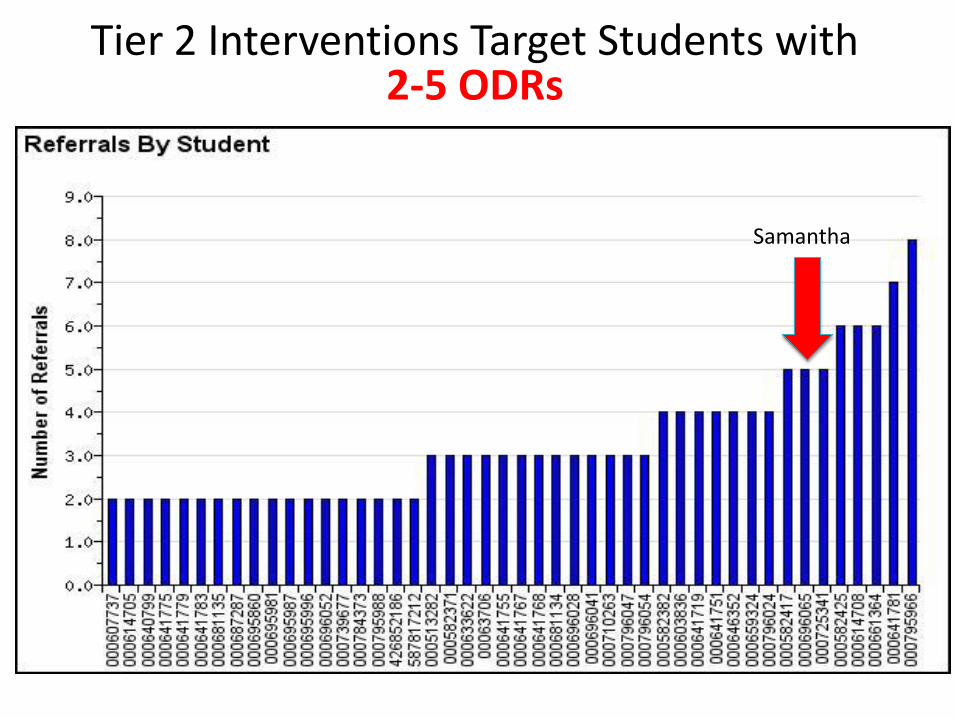
Tier 2 Interventions Target Students with 2-5 ODRs
Samantha
0
0.05
0.1
0.15
0.2
0.25
0.3
Aug Sept Oct Nov Dec Jan Feb Mar Apr May Jun Jul
Avg
. OD
Rs
Months
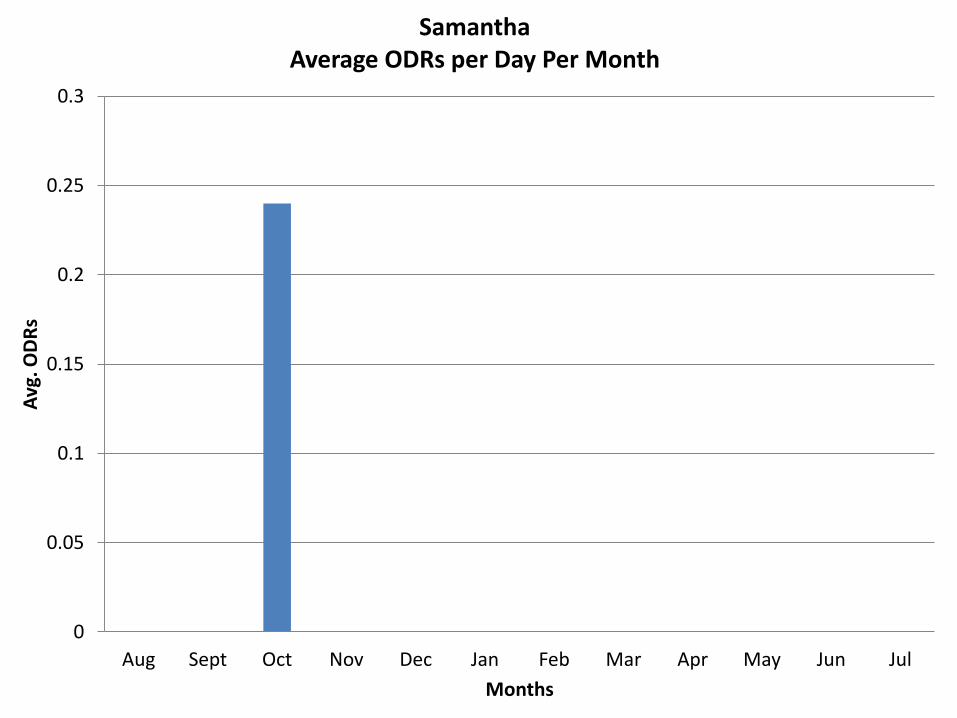
Samantha Average ODRs per Day Per Month
0
0.5
1
1.5
2
2.5
OD
Rs
Behaviors
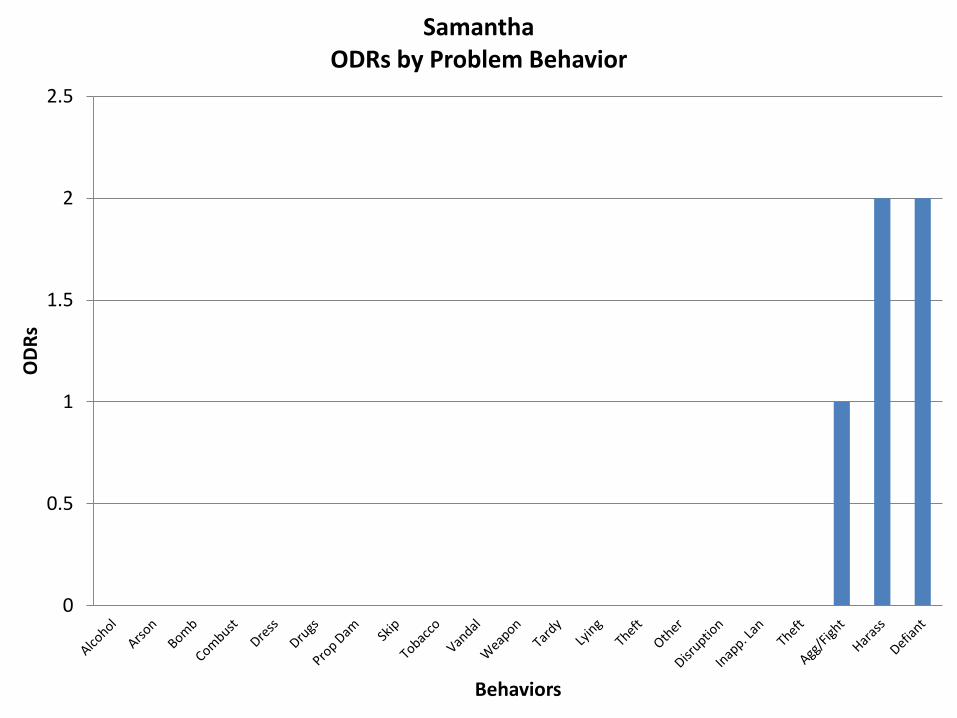
Samantha ODRs by Problem Behavior
0
0.5
1
1.5
2
2.5
OD
Rs
Locations
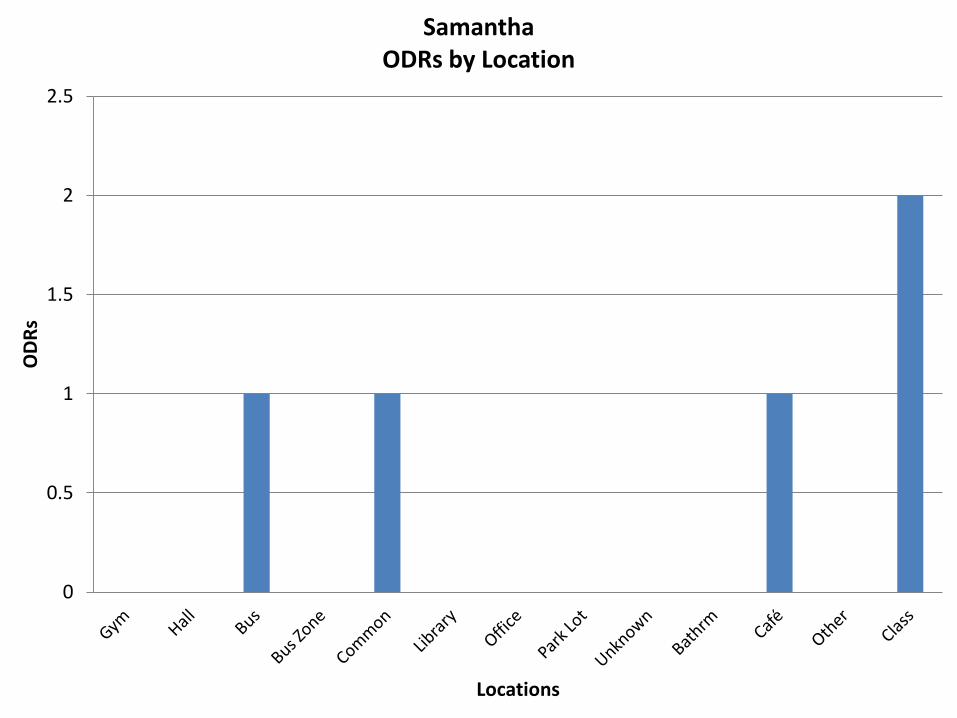
Samantha ODRs by Location
0
0.5
1
1.5
2
2.5 7
:00
AM
:15
:30
:45
8:0
0 A
M
:15
:30
:45
9:0
0 A
M
:15
:30
:45
10
:00
AM
:15
:30
:45
11
:00
AM
:15
:30
:45
12
:00
PM
:15
:30
:45
1:0
0 P
M
:15
:30
:45
2:0
0 P
M
:15
:30
:45
3:0
0 P
M
:15
:30
:45
4:0
0 P
M
OD
Rs
Times
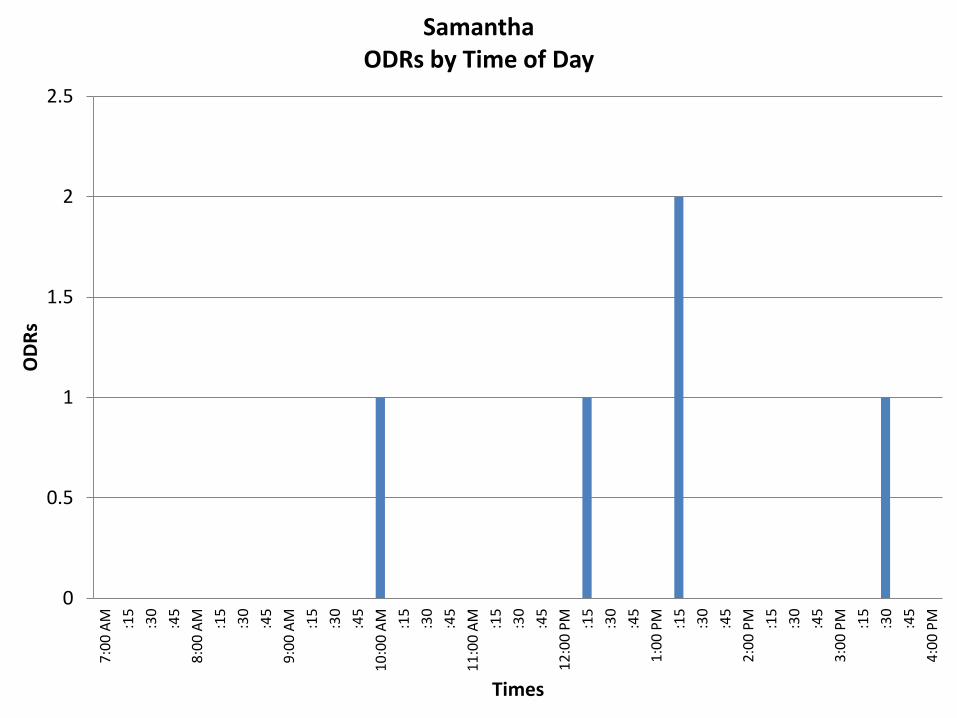
Samantha ODRs by Time of Day
0
0.5
1
1.5
2
2.5
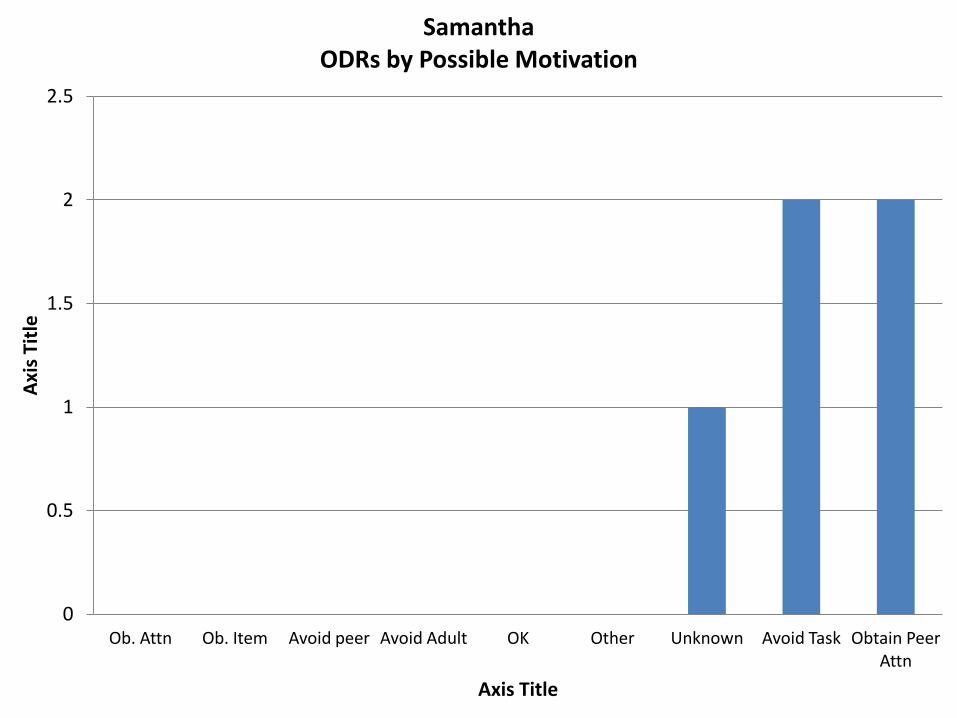
Ob. Attn Ob. Item Avoid peer Avoid Adult OK Other Unknown Avoid Task Obtain Peer Attn
Axi
s Ti
tle
Axis Title
Samantha ODRs by Possible Motivation
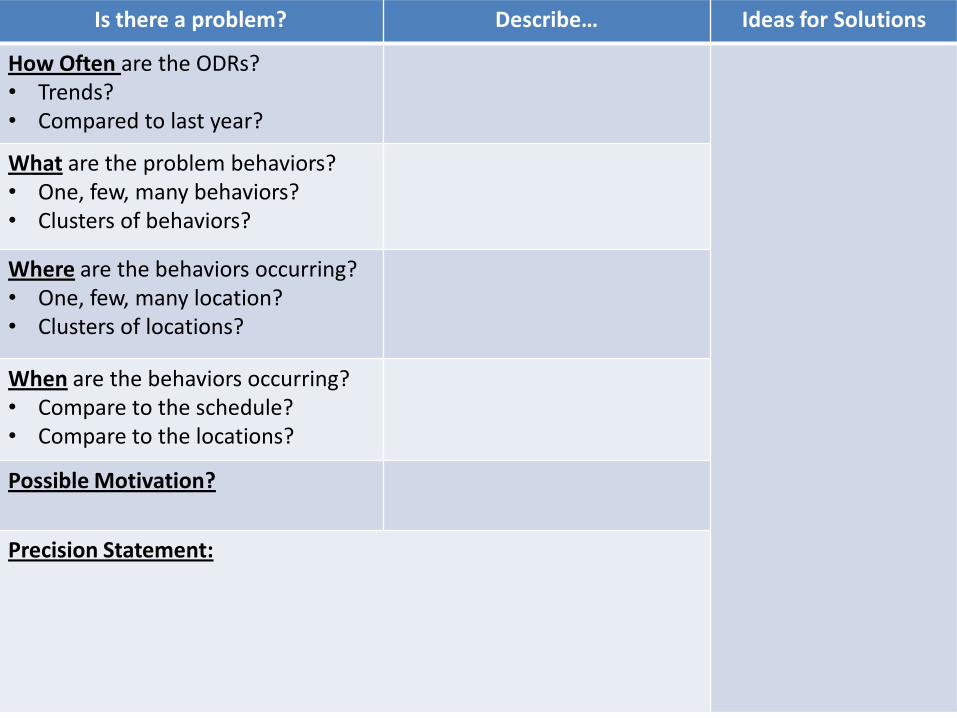
Is there a problem? Describe… Ideas for Solutions
How Often are the ODRs? • Trends? • Compared to last year?
What are the problem behaviors? • One, few, many behaviors? • Clusters of behaviors?
Where are the behaviors occurring? • One, few, many location? • Clusters of locations?
When are the behaviors occurring? • Compare to the schedule? • Compare to the locations?
Possible Motivation?
Precision Statement:
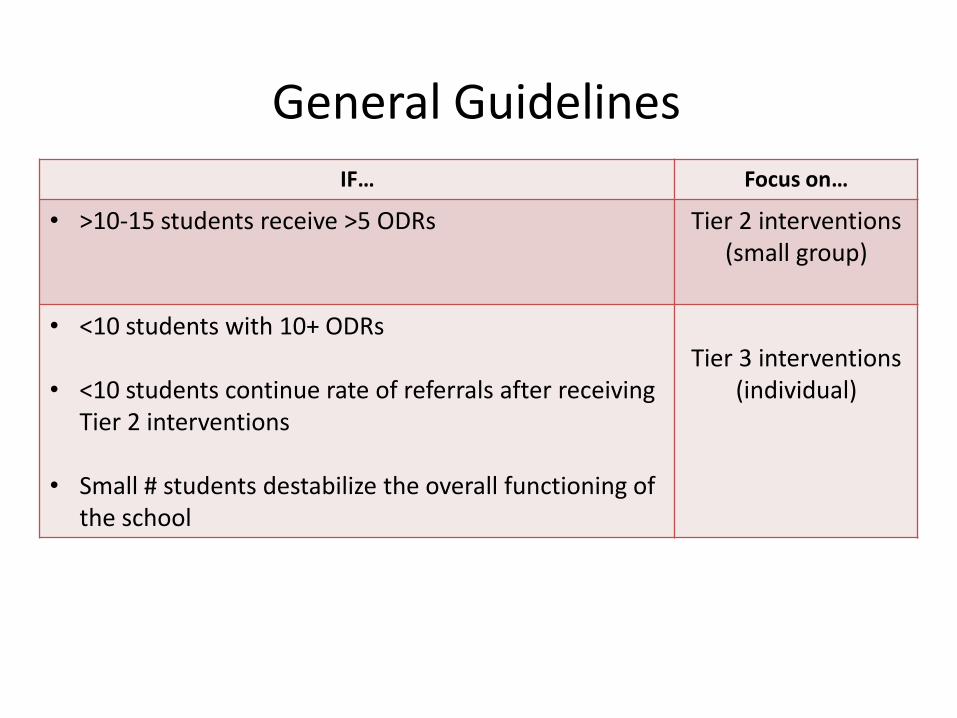
General Guidelines
IF… Focus on…
• >10-15 students receive >5 ODRs Tier 2 interventions (small group)
• <10 students with 10+ ODRs
• <10 students continue rate of referrals after receiving Tier 2 interventions
• Small # students destabilize the overall functioning of
the school
Tier 3 interventions
(individual)