Embed Size (px)
Citation preview

Notes From The Seventh International Swe-SAT Conference
Umeå, June 3 –5, 1999
Christina Stage

2
The SweSAT has by now been in existence for more than 20 years andhas become an integrated and generally accepted part of the Swedisheducational system. The International Scientific Advisory Board,which was constituted in 1992, was meeting for the seventh time inUmeå in June 1999.
This report is a summary of the seventh meeting. The main topics forthe meeting were: test validity, composition and scoring of SweSAT,and test fairness regarding immigrants. The program for the conferen-ce as well as a list of participants are enclosed.
The SweSAT Program since April 1998Christina Stage
During the last year the number of testtakers has decreased by 7000 inspring and by 5000 in fall. The reason for this decrease is mainly thatthe number of young people in the proper ages has decreased, but alsothat the labour market has improved so it is easier for young people toget jobs.
Fall 1998 I was working on a research grant from the Swedish Councilfor Research in the Humanities and Social Sciences. Gunilla Ögrenthen took over the project leadership and I am only scientific leader.
The new pretesting procedure which was introduced in 1996 on a twoyears trial basis, and then prolonged for one year, has now been pro-longed for another period of two years.
The cooperation with Twente university has resulted in a master thesison IRT equating of SweSAT results. We now use the method as acomplement to the usual way of equating. What is needed, however, isa better design for composition of the subtests, which takes into ac-count the need for common items which have not been changed bet-ween pretest and regular test. We also need more information abouthow many common items that are needed for the IRT equating.
An issue which has been discussed a lot during the last year is chea-ting on the test. We still have not solved the problem how to handletesttakers who are suspected cheaters. This year a student has beenaccepted to medical studies (the most competitive education in Swe-den) who is not able to read and write Swedish properly. He had gottop results on the test on his third test occasion, but when checked by a

3
legal graphologist there are with great certainty three different personswho have performed the test in the same name. This is the first casewhich is going to trial and we are eagerly waiting for the outcome.
Admittance to higher education in Sweden is centralized with thesame rules for all universities and colleges. The main rule is that youare qualified for higher education on the basis of grades from uppersecondary school. Among those who are qualified selection is made onthe basis of average grades OR test results.
It is possible, however, for educations to get permission to do selec-tion by other means. They have to apply to the National Agency forHigher Education and if the arguments for special selection are goodenough, permission is granted. So far it is mainly medical and journa-listic educations who have their own means of selection. These areboth educations with many applicants and good reasources.
The SweSAT, however, has got an increasing importance for admit-tance to higher education. Since the grading system has been changedfrom norm related to criterion related, it is less suitable for selection,which in turn means that the importance of the test increases.
This increased importance makes heavy demands on the test. As youalready know we have big problems in examining the predictive vali-dity of SweSAT, mainly because of problems with the criterion. Thisis a topic of great concern since it is claimed that the test is of no usefor technical educations since the subtests measuring quantitative abi-lities are too few and too easy. On the other hand advocates of the fa-culty of arts claim that the test is unfavourable to their students.
The increased importance of the test as selection instrument has alsoinitiated a discussion on changes/improvements of the compositionand the scoring of the test. The National Agency for Higher Educationhas established an Advisory Board on matters having to do with tests.This Board in turn has appointed a group which should recommendnecessary changes of the test. Jan-Eric and I are both members of thisgroup.
Sweden used to be a very homogenous society with one language andthe same education for all. This is not true any more, since Sweden hasbeen the recipient of a lot of refugees and immigrants. This group isunderrepresented in higher education and the test among other thingsis probably a hindrance in this regard since it is adapted to people with

4
Swedish language and Swedish cultural experiences. This is a vey newproblem and so far we do not even know how big the problem is, andstill less about how to handle it. At present the problem is mainly inupper secondary school, since a big proportion of these groups neverfinishes upper secondary school with a proper examination. The pro-blem will soon reach us, however, and we would like to be preparedhow to handle it.
Various Admission Models and their Pros and Cons.Michal BellerDistributing Rare resources:
• Free market• Equal probablity (e.g., lottery)• Ranking by seniority (e.g., waiting time)• Meritocratic approach
Selection to Higher Education: Models
No quota- Open admissions- Setting qualitative minimal cut-off points pre studies• A pre set quota- equal probability - lottery- merit – setting quantitative cut-off points
- during studies- pre studies
Pre set quota: Merit approach
• During studiesRanking on the basis of FGPA (fierce competition among stu-dents)
• Pre-studies- HSR- Special achievement tests- General scholastic aptitude test- Specific departmental admissions tests- Previous experience- Personality inventories

5
- Interviews- Combination of the above
The Israeli Admissions Policy
- Meritocratic Approach
- Based mainly on:- HSR (Bagrut)- Scholastic aptitude test (PET)- Adm = Bagrut + PET (50-50; 40-60; 60-40)
- Reasons for using a composite score (Adm):
- more valid- compensatory model- gender/group ”equalizer”
Evaluation of the system- Reliability- Validity (construct, predictive, face, consequential)- Culture fairness (group and gender bias)- Utility – cost-effectiveness

6
Establishing the Validity of Admission Tests1
Ronald Hambleton
The Graduate Record Examination:
What is the Validity Evidence?Number of Graduate/Professional School Predicitve Validity Studies(in the last 10 years)
1566 + 1 = 1567
Topics
1. Methodological Difficulties
2. GRE Predictive Validity Evidence
3. Additional Validity Evidence
4. Future Research
1. Methodological Difficulties With Predictive Validity (PV)Studies
a. PV Studies Are Rarely Conducted on the Population (or Sample)of Interest – Range Restriction Results.
b. Range Restriction on the Criterion
c. Unreliability of Criterion Scores
d. Inadequacy of the Criterion Variable
e. Use of a Second Predictor Variable or More (Use of a Compen-satory Selection Model)
f. Generally Small Samples
1 Reproduction of trancparancies used for the presentation of a paperby R.K. Hambleton & K. Meara.

7
Table 1. r = .20. Correlations, Standard Deviations, and Positive Hits
Percent of Students Selected
Stat 100% 80% 50% 20% 10%
R .20 .14 .12 .10 .09
Sd 158 119 94 71 61
Phs .84 .86 .88 .90 .93

8
Table 2. r = .40. Correlations, Standard deviations, and Positive Hits.
Percent of Students Selected
Stat 100% 80% 50% 20% 10%
R .40 .31 .25 .18 .16
Sd 159 121 95 74 61
Phs .83 .88 .91 .95 .96

9
2. Graduate School Predictive Validity Results
Despite the methodological difficulties, what are the predictive vali-dity study results?
Analyzed the recent PVs for the five admission tests to gradua-te/professional US schools: GRE, GRE Subject, LSAT, GMAT, andMCAT.
- More than 1566 studies.
- Omitted SAT PVs.
Test Number of PV studiesGRE 1038GRE Subject 283LSAT 46GMAT 145MCAT 54
GRE Predicitive Validity Studies:Type of Department GRE GRE + GNatural Science .31 .44Engineering .30 .44Social Sciences .37 .48Human/Arts .34 .46Education .36 .47Business .31 .47
3. Additional Validity Evidence
a. Construct Validity Evidence: the GRE measures Verbal, Quantita-tive, and Analytical Reasoning (Factor analysis)
b. Threats to Validity such as format, speededness, test wiseness havebeen minimized (if not eliminated).

10
Future Research Studiesa. Enhanced score reporting for candidates
b. Writing assessments
c. Computer-based formats
Conclusions
1. Predictive validity results are difficult to interpret because of manyserious methodological problems that influence the findings.
2. GRE predicitve validity correlations are sizeable (and with UG-GPA), the GRE appears to have considerable utility in the admis-sions process.
3. The case for the validity of the GRE is seen when other validityevidence is considered – constructs are relevant for success in gra-duate/professional schools.
4. Several promising directions of research – including writing as-sessment, advanced mathematical reasoning, and enhanced scorereporting (for the benefit of candidates).
Finally – On questions about the validity of the GRE,
- a PV study from a private university with
(1) a very well-qualified applicant pool and a strict admissions pro-cess, and
(2) methodological shortcomings, and no corrections for these short-comings in the interpretation of results, is NOT a study that shouldinfluence admissions policy and practices.
There appears to be substantial evidence to support continued use ofthe GRE.
At the same time, a strong GRE research program – both by GRE andothers, should be encouraged.

11
The Predicitve Validity of SweSATAllan Svensson
We are planning a study, the aim of which is to look at the predictivevalidity of the SweSAT in higher technical education. We have juststarted the planning which means that we have not got any results andcannot yet present a detailed design. However, we do hope we can getcomments and advise of great value from you.
The ETF projectI want to start by giving you some information about a project - a lon-gitudinal project - which is going on in Göteborg. It is called EVA-LUATION THROUGH FOLLOW-UP (ETF). Its main purpose is:
To make follow-up studies of large and nationally representativesamples of students, to ascertain in what way geographic, social andpsychological factors affect educational and vocational careers and todiscover what changes the Swedish educational reforms have broughtabout in these respects.
Within this project seven follow-up studies have started. Each sampleincludes about 10 000 individuals. An overwiev of the project is pre-sented in figure 1. Detailed information may be found in Härnqvist(1998).

12
Figure 1. The cohorts included in the Evaluation Through Follow-up project.
There are three main categories of information collected:
A. Basic data.
Administrative data from the schools, such as grade and school marks.Father's and mother's education and occupation.Scores from intelligence tests and questionnaire responses on schooladjustment, interests, educational plans.
B. Follow-up data within the school system.
Administrative data from the schools, similar to the basic data (year-ly).
Questionnaire responses from pupils when they are in upper secondaryeducation.
C. Follow-up data from outside the school system.
Excerpts from the records on study finance and from the register ofhigher education.Excerpts from the census and income register.
Based on data from the ETF-project a great number of books, articlesand reports have been published. Many of them have focused on edu-cational equality, educational reforms and the importance of financial

13
aid (Svensson, 1980; Reuterberg & Svensson, 1983, 1987, 1994;Härnqvist 1989, 1990).
Data from the ETF-project have also been used for investigations ofthe SweSAT. For instance socioeconomic and gender differences onthe test and differential selection to the test have been studied (Mäki-talo & Reuterberg, 1996; Reuterberg 1997; 1998).
The ETF-R projectIs it possible to use the ETF-data for studying the predictive validity ofthe SweSAT?
I am afraid that the answer must be "no". These data are not very use-ful in this field of research. Among other things they suffer from twoserious shortcomings:
1. Certainly, the sizes of the samples are quite large - almost 10 000persons in each - but higher education in Sweden is very differen-tiated. There are hundreds of different programmes and courses.This means that there will be rather few students in our samplesfound within the same programme in higher education. In otherwords the samples in the ETF-project are too small for these kindof investigations.
2. Some of the data we have obtained from Statistics Sweden concernwhether the students have completed a degree or not, but we knownothing about how they have succeeded in different courses andhow many credits they have earned during each semester. I think itis necessary to have access to this kind of more detailed data forstudying the predictive validity of the SweSAT.
What is to be done? One suggestion may be to extend the sizes of thesamples - and this has already been done We have created a new anda bigger project called ETF-R, where R stands for "register". This newproject includes all Swedes born during the period 1972 - 1977, in allmore than 800.000 persons - among them the individuals in oursamples born 1972 and 1977.
The ETF-R project does not contain so many different data as theETF-project. It only contains register data. Nevertheless, I will assureyou that this project too, contains a huge amount of data, hundreds ofvariables for each individual included. Among other things we havegot the following data:

14
- Background variables - sex, social background, ethnic background.- Information on compulsory schooling.- Information on secondary education including all study programs.- All application alternatives to higher education.- Enrolment in higher education.- SweSAT scores for all test occasions from 1991 to 1996.
During this spring these data have been supplemented by informationon success in higher education. This information includes among otherthings every course finished.
Some of this information is very detailed, which means that a lot ofediting has to be done in order to make the data accessible for analy-ses. This applies particularly to the application data for upper seconda-ry education, the corresponding data for higher education and the in-formation on courses finished in higher education. This work is inprogress at present. When this editing work is finished - hopefully atthe end of this summer - it will be possible to use the ETF-R data forpredictive studies of the SweSAT.
Why study the predictive validity of the SweSAT in higher techni-cal education?In the near future there will be a shortage of people with higher tech-nical education in Sweden, and therefore, the provision of education inthis domain has been strongly expanded during recent years. However,perhaps not surprisingly this expansion has not solved the problem ofshortage because there are:
1. Recruitment problems2. Graduation problems
The recruitment problems have been thoroughly discussed in a studyby Svensson and Reuterberg (1998). Let us now look at the graduationproblems. Up to 1975 about 90 per cent of all admitted students inhigher technical studies also got their degree, but later on the discre-pancy between the numbers of admitted and graduated students beganto be great (IVA, 1992). I don't think that there are any causal rela-tions but we can establish that the graduation rate started to fall whenthe SweSAT was introduced. I am sure that there are lots of causes forthe decreasing examination, but nevertheless people may begin to besuspicious of the SweSAT. I hope that our research will eliminate allkinds of such suspicions.

15
There are recruitment problems to higher technical education, that'strue, but these problems are not so large that we don't get enoughnumbers of applicants (see table 1). There are almost twice as manyapplicants (about 12 000) as the number of students admitted (about 6000).
Table 1. Number of first choice applicants to institutes of technologyand number of admitted in 1997.
Number ofapplicants
Number ofAdmitted
Admitted in relationto applicants
Males 9 566 4 860 2.0
Females 2 926 1 942 1.5
Total 12 492 6 802 1.8
In spite of the rather hard selection process the picture of graduation isnot a beautiful one. I just mentioned that the graduation rate hasstrongly decreased during the last decades and the present situation isshown in table 2. Here you can observe the graduation rate withineight programmes. The rate is reported within five and seven yearsafter the students entered the programmes. Within seven years the gra-duation rate varies between 44 and 69 percent with an average around60 percent - somewhat higher for women than for men. When youread these figure, you need to have in mind that the stipulated time fortaking a technical degree is four and a half years.

16
Table 2. Graduation rate among students in some technical studyprogrammes. Followed through from 1989/90 to 1995/96.
Graduation ratewithin 5 years
Graduation ratewithin 7 years
M F Tot M F Tot
Computer science 17 10 17 45 31 44
Electrical engineering 22 25 22 57 62 58
Industrial management 36 34 35 67 63 66
Chemical engineering 23 24 24 61 65 63
Mechanical engineering 30 41 31 68 76 69
Engineering physics 19 13 18 52 60 53
Civil engineering 27 35 29 61 72 64
One reason for the low graduation rate may be that it is not the mostable students who have been admitted. One indication of this is theunequal recruitment to the technical programmes (table 3).

17
Table 3. Proportions of admitted students in technical study pro-grammes among men and women from different socio-economicgroups up to the age of 22. (Individuals born in 1972).
Socio-economic group
1 2 3 Total
Males 9.2 3.5 1.1 3.6
Females 3.7 1.0 0.3 0.9
All 5.6 2.3 0.7 2.3
There are four times as many male as female students - 3.6 % of all 22year old men have started a higher technical education as compared toonly 0.9 % among the women of the same age. And there are almosteight times as many students from upper middle class homes (group 1)as from working class homes (group 3). Indeed if you compare menfrom group 1 with women from group 3, there is nearly 30 times asmany from the first mentioned group.
The figures presented in table 3 may justify the following question. Isit possible that the SweSAT selects wrong students? Oh, what a hor-rible thought! But if the predictive validity is very low, this conditionmay be one of the reasons of the low graduation rate. Therefore, Ithink it is very important to investigate how successful the SweSATfunctions in this connection.
Previous researchThere is not much previous research in Sweden concerning the pre-dictive validity of different selection instruments for success in highertechnical education. However, in an investigation conducted by Hen-rysson et al. (1985) there are two study programmes in higher techni-cal education included - Mechanical engineering and Electrical engi-neering. In all there are 200 students in the Mechanical engineeringprogramme and 400 in the Electrical engineering programme. Thestudents started their studies between 1977 and 1979 and their perfor-mances were observed for five years.

18
As predictors Grade Point Average (GPA) from upper secondaryschool as well as the mean of the grades in mathematics, physics andchemistry were used. Another predictor was additional scores for workexperience. As measures of academic success scores on all coursesgiven during the three first years at the technical institutes were used.The results were:
The correlation between GPA and the number of scores awarded inthe technical programmes was about 0.40, but the correlation with themean of the grades in mathematics, physics and chemistry from uppersecondary school was somewhat stronger. Additional scores for workexperience has a weak negative correlation with success in higher edu-cation.
Unfortunately no SweSAT data were included in the analyses, so fromthis study we cannot get information if the SweSAT is as good as thegrades from upper secondary school as a predictor for higher technicalstudies.
However, there is another study from which we can get some infor-mation about this topic (Henriksson & Wolming, 1998). One of thefour samples in this investigation consists of 120 students in the engi-neering physics programme. Their performances were observed for aperiod of three years.
The students were divided into three groups, according to the groundson which they had been admitted to the programme. The first group ofstudents had been admitted on the basis of their earlier academic achi-evement (GPA), the second group on the basis of their SweSAT scoresand the third group on the basis of their SweSAT scores with additio-nal scores for work experience. The first group consisted of 80 stu-dents and the other two of 20 each.
Academic performance was defined in two ways:
a) The number of credits achieved after each semesterb) The number of dropouts in each group.
The main result was that the students admitted on the basis of theirGPA were somewhat more successful than the other two groups. Butthe differences were rather small. The GPA group had acquired anaverage of 109 credits after six semesters, the other two groups 101

19
and 100 respectively. There were no differences at all in drop out ra-tes.
The results of the study give us valuable and important information.They tell us that the SweSAT as a selection instrument is almost asgood as the grades from upper secondary school. But there is someinformation we cannot get. In the study it was not possible to estimatethe correlations between the scores on the SweSAT and the criterionsbecause the few students admitted on the basis of their SweSAT sco-res makes it impossible to get reliable values. Among other things thisis what we want to get information on in our planned study.
The planned studyBased on the huge amount of data collected in the ETF-R project, weaim to answer the following questions:
1. What is the predictive validity of the SweSAT in different studyprogrammes in higher technical education? Success in higher edu-cation will be measured by number of credits achieved after eachsemester. Failure by the number of drop outs.
2. Does the predictive validity vary between different subtests in theSweSAT and from one programme to another?
3. Are there significant differences concerning the predictive validityof the SweSAT between male and female students, between stu-dents from various socio-economic groups and between studentswith different ethnic backgrounds?
4. Are the relationships of equal size at all universities?
The analyses will start at the end of this summer and we hope that wewill be able to report the first result during the autumn 1999.
Before I finish I will inform you that this is only the first step in amuch bigger investigation. The Bank of Sweden Tercentenary Foun-dation has promised to give our department - in corporation with theUmeå department - resources to plan a more extensive research pro-gramme, which will give much more information about the predictivevalidity of the SweSAT.

20
ReferencesHenriksson, W., & Wolming, S. (1998). Academic performance infour study programmes. A comparison of students admitted on thebasis of GPA and SweSAT scores, with and without credits for workexperience. Scandinavian Journal of Educational Research, 42, 135-150.
Henrysson, S., Kriström, M., & Lexelius, A. (1985). Evaluation ofmerits and academic performance. Studies of the effects of selectionregulations. Arbetsrapporter från Pedagogiska institutionen, Umeåuniversitet. Nr 21.
Härnqvist, K. (1989). Comprehensives and social equality. I S. J.Ball,. & S. Larsson, (Red). The Struggle for Democratic Education,(18-31). New York: The Falmer Press.
Härnqvist, K. (1990). Long-term effects of education. I K. Härnqvist.,& N-E, Svensson, (Red). Swedish Research in a Changing Society,(323-338). Hedemora: Gidlunds bokförlag.
Härnqvist, K. (1998). A longitudinal program for studying educationand career development. Report from Department of Education andEducational Research, Göteborg University, 1.
IVA. Ingenjörer inför 2000-talet. (1992). Stockholm: Ingenjörsveten-skapsakademin.
Mäkitalo, Å., & Reuterberg, S-E. (1996). Who takes the SwedishScholastic Aptitude Test? A study of differential selection to the Swe-SAT in relation to gender and ability. Report from Department ofEducation and Educational Research, Göteborg University, 3.
Reuterberg, S-E. (1997). Gender differences on the Swedish Scholas-tic Aptitude Test. Report from Department of Education and Educa-tional Research, Göteborg University, 2.
Reuterberg, S-E. (1998). On differential selection in the SwedishScholastic Aptitude Test. Scandinavian Journal of Educational Rese-arch, Vol. 42, No. 1,. 81-97.
Reuterberg, S-E,. & Svensson, A. (1983). The importance of financialaid. Higher education, 12, 89-100.

21
Reuterberg, S-E,. & Svensson, A. (1987). Student financial aid andparticipation in Swedish higher education. Scandinavian Journal ofEducational Research, 31, 139-162, 987.
Reuterberg, S-E,. & Svensson, A. (1994). Financial aid and recruit-ment to higher education in Sweden. Studies in Higher Education, 19,33-45.
Svensson, A. (1980). On equality and university education in Sweden.Scandinavian Journal of Educational Research, 24, 79-92.
Svensson, A., & Reuterberg, S-E. (1998). How to get more students toscience and technical programmes in higher education. Paper presen-ted at the International Conference on Science, Technology and Soci-ety. Tokyo, March 16-22.
Simpson´s Paradox and Culture-Fair SelectionWim van der Linden
Examples of Simpson´s Paradox:
• Sex bias in graduate admission at Berkely (1975)• SAT scores decline and grades rise (1998)• Modern languages in Dutch secondary education (1991)• Subscription renewals (1979)• Income tax returns in the US (1982)
Conditional Probabilities
P(A B) < P(A B )
P(A B∩C) > P(A B ∩C)
P(A B∩ C ) > P(A B ∩ C )

22
ExplanationThe reason of Simpson´s paradox is the existence of a third variablethat correlates with both variables.This additional variable may be unmeasured.
Other manifestations of Simpson´s paradox:
• Correlation analysis: Spurious correlation• Table analysis: Collapsibility problem• Experimental design: Unbalanced design or confounded factors• Multiple regression: Multicollinearity
Spurious correlation
rxy > 0
rxy.z < 0
Collapsibility ProblemUnder what condition is it possible to collapse a higher dimensionaltable into a lower dimensional table?
Unbalanced design
B1 B2 B3A1 10 15 20A2 4 6 8
B1 B2 B3A1 10 15 20A2 4 6 10

23
MulticollinearityMulticollinearity exists in multiple regression if the predictors corre-late.The correlated predictor may be an unmeasured variableMulticollinearity has two consequences:1. Confounding of effects2. Instability of parameter estimates
Possible Remedies:Use techniques for experimental control:• Randomization• Matching• Balanced design
Culture fair selection
• Never forget any variable that correlates with group membershipvariable and selection results (e.g., curriculum attended)
• Analyze conditional rather than marginal probabilities of selectionresults.
SweSAT and Immigrants – Some Preliminary ResultsSven-Eric Reuterberg
Introduction
During the last decade the number of immigrants in Sweden has incre-ased very much. Many of them have already taken the SweSAT butthere are reasons to expect that the number of immigrant SweSATtakers will increase successively. However, little is known about towhat extent the immigrants use the SweSAT as a means for admittan-ce into higher education and about their test scores. One reason forthat is the fact that no information has been available on these matters.Now, this kind of information is available within the longitudinal data

24
base called “Evaluation Through Follow-up – Register” ((ETF-R).This data base, which is presented by Svensson in his article, includesmore 840.000 persons born during the period 1972 –1979 and forthem we know birth country and nationality. The same is also knownfor their parents. Furthermore, we have data about their SweSAT ta-king from every test occasion from 1991 through 1996 and these dataare on item level which means that we have opportunities for detailedanalyses of their test performance when the data based has beencompletely established. Today, this work is in progress, and therefore,the aim of this article is to present some preliminary results. Moreprecisely, the aims of this article are:
• To study whether there are any differences between Swedes andimmigrants, and between different groups of immigrants, in Swe-SAT taking.
• To study whether there are any differences in SweSAT scores bet-ween Swedish and immigrants and between different groups ofimmigrant test takers.
SweSAT takingOf the total number of persons in the data base nearly 240.000 havetaken the SweSAT at least once, and this number corresponds to morethan 25 per cent of the total population. Their distribution on age co-hort and test occasion is shown in Table 1. In this table the test occa-sions are coded as the year (91 – 96) and as the test occasion for eachyear (A: spring test occasion and B: autumn test occasion).
The table shows some regular trends. There is a tendency of an increa-sing total number of test takers from 1991 through 1996. The numberof test takers is larger in spring as compared to the autumn test occa-sion and the most common age for taking the test is 18 years.
The table also shows that the number of test takers on each test occa-sion is so large that it permits analyses for each age cohort over seve-ral subsequent test occasions. In the same way the data base makespossible comparisons between different age groups on one and thesame test occasion.

25
Table 1. Total number of test takers in relation to age cohort and testoccasion.
Birth
year
91A 91B 92A 92B 93A 93B 94A 94B 95A 95B 96A 96B
1972 14901 7323 11603 5224 8018 4822 6163 3881 4438 2694 3998 2460
1973 3931 12618 19934 6368 9432 5149 7343 4687 5681 3252 4779 2723
1974 132 2347 8130 12538 17475 7090 9595 5652 7278 4137 6110 3418
1975 2 62 226 1787 4718 12952 18913 7399 9288 4935 7709 4247
1976 1 3 10 41 172 1348 4759 13608 18865 6834 974 4835
1977 1 7 64 246 1158 4796 14223 19317 6338
1978 1 2 8 56 277 1367 7021 16177
1979 1 3 15 91 403 1643
ALL 18967 22353 39904 25958 39824 31427 47029 36444 50638 37533 58411 41841
The categorization of birth country is to a large extent determined byStatistics Sweden which has provided most of the data included inETF-R. Therefore, we have had only limited possibilities get moredetailed information on this variable than that shown in Table 2. In afew isolated cases, however, countries with very few test takers havebeen put together to one category.
26
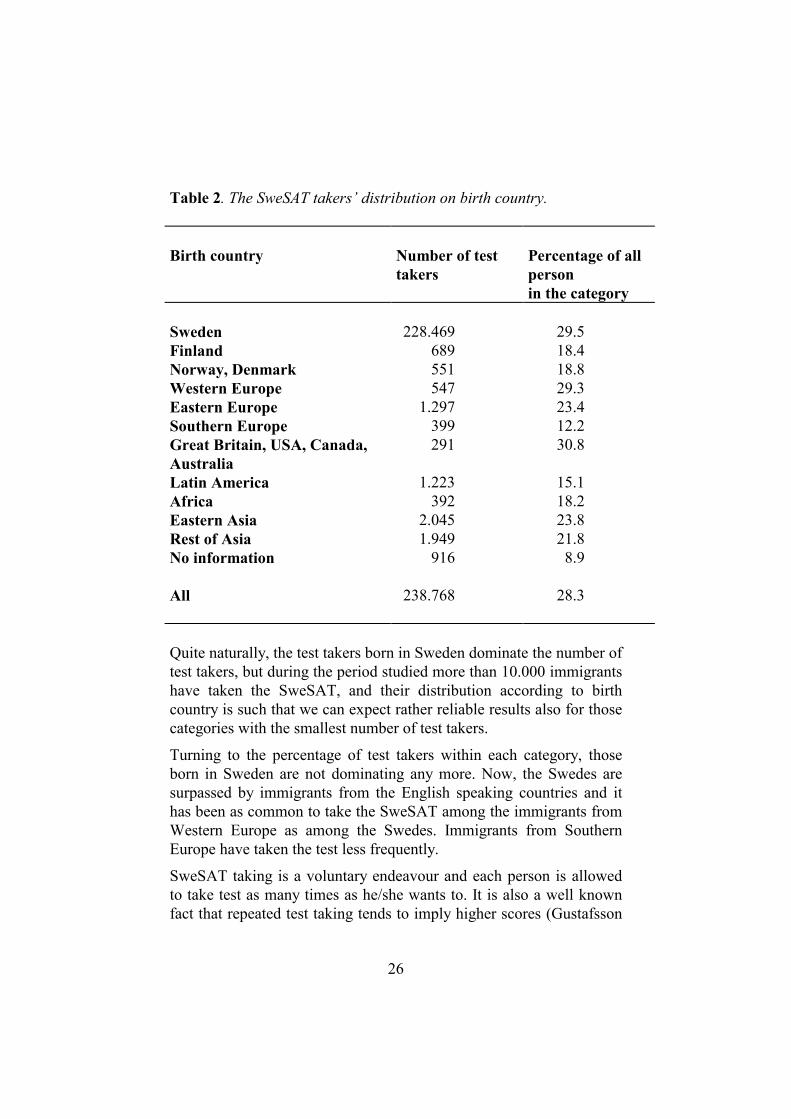
Table 2. The SweSAT takers’ distribution on birth country.
Birth country Number of testtakers
Percentage of allpersonin the category
Sweden 228.469 29.5Finland 689 18.4Norway, Denmark 551 18.8Western Europe 547 29.3Eastern Europe 1.297 23.4Southern Europe 399 12.2Great Britain, USA, Canada,Australia
291 30.8
Latin America 1.223 15.1Africa 392 18.2Eastern Asia 2.045 23.8Rest of Asia 1.949 21.8No information 916 8.9
All 238.768 28.3
Quite naturally, the test takers born in Sweden dominate the number oftest takers, but during the period studied more than 10.000 immigrantshave taken the SweSAT, and their distribution according to birthcountry is such that we can expect rather reliable results also for thosecategories with the smallest number of test takers.
Turning to the percentage of test takers within each category, thoseborn in Sweden are not dominating any more. Now, the Swedes aresurpassed by immigrants from the English speaking countries and ithas been as common to take the SweSAT among the immigrants fromWestern Europe as among the Swedes. Immigrants from SouthernEurope have taken the test less frequently.
SweSAT taking is a voluntary endeavour and each person is allowedto take test as many times as he/she wants to. It is also a well knownfact that repeated test taking tends to imply higher scores (Gustafsson

27
& Benjegård, 1996). Therefore, it is interesting to know whether repe-ated test taking is more common within some groups than in others.
In order not to be too extensive the results will be shown for only threeage cohorts, those born in 1972, 1975 and 1978, respectively.
Table 3. Number of test occasions within the different groups. Meansamong those who have taken the SweSAT.
Birth country Born in1972
Born in1975
Born in1978
Sweden 2.03 1.95 1.29Finland 1.83 1.86 1.31Norway, Denmark 2.01 2.01 1.41Western Europé 1.93 1.76 1.33Eastern Europé 2.01 1.95 1.39Southern Europé 1.81 2.05 1.41Great Britain, USA, Canada,Australia
1.87 1.60 1.43
Latin America 1.95 1.75 1.24Africa 1.99 1.78 1..23Eastern Asia 2.07 1.95 1.21Rest of Asia 1.77 1.77 1.23
ALL 2.02 1.94 1.29
First of all, we can see that the number of test occasions decreasesfrom the oldest to the youngest group. This, of course, is due to thefact that the older groups have had more opportunities to take the test.
However, comparing persons with different birth countries, it is obvi-ous that the Swedes are not outstanding. Within each age group thereare immigrant groups that have repeated their test takings more timesthan the Swedes. On the whole, the table shows rather small differen-ces between the different groups.
To sum up we can say that there are some differences between thegroups concerning the utilisation of the SweSAT as a means for en-

28
trance into higher education, but among those who have taken the testthere are only small differences concerning repeated test taking.
SweSAT scoresSince SweSAT can be taken more than once and an applicant is giventhe highest score that he/she has obtained during the last five years,test scores from different test occasions have to be comparable. There-fore, the raw score obtained is transferred to a normed score rangingfrom 0.0 to 2.0. The results shown in Table 4 are based on the maxi-mum normed score that the test takers have obtained during the totalperiod studied. This score has been multiplied by a constant of 10.
Table 4. Maximum normed SweSAT score i relation to birth country.The normed scores are multiplied by 10.
Birth country Born in 1972 Born in 1975 Born in 1978
Mean Rank Mean Rank Mean Rank
Sweden 10.16 3 9.41 3 9.26 4Finland 9.58 4 9.71 2 9.04 6Norway/Denmark 10.79 1 9.85 1 12.03 1Western Europe 9.55 5 8.81 5 9.75 2Eastern Europe 8.45 7 8.06 6 9.20 5GB/USA/Can./Austr
10.17 2 9.15 4 9.47 3
Southern Europe 6.77 10 4.79 11 7.08 8Latin America 7.50 8 6.44 9 5.80 10Africa 7.19 9 8.03 7 6.00 9East Asia 8.86 6 6.68 8 7.29 7Rest of Asia 5.26 11 4.94 10 4.48 11
ALL 10.09 9.32 9.18

29
The maximum normed scores show a substantial variation. In all agecohorts the test takers from Norway and Denmark have obtained thehighest scores. Quite high scores have been obtained also by test ta-kers born in the English speaking countries, Sweden and Finland.Groups that have obtained rather low SweSAT scores are those bornin the Rest of Asia, Southern Europe and Latin America.
In this connection it must be said that we know nothing about the rea-sons for the differences shown in Table 4. It may well be that diffe-rential selection effects to the SweSAT play an important role in thisconnection. There may also be quite large differences as to the socialcomposition of the groups. Another important factor is the fact that Ihave not been able to take into account the point of time for immigra-tion to Sweden. This information was not available when these analy-ses were accomplished, but it will be included in the data base within avery near future.
A special problem in this connection is adoption. Within the data basethere is a number of persons, who are born abroad but who have beenadopted by Swedish parents and they have spent most of their lives inSweden, often in middle class families.
When the data base has become complete it will contain informationwhich will make us able to control for the factors mentioned above.
Finally, I have made some preliminary analyses of the differencesbetween the Swedish test takers and the immigrant test takers concer-ning their subtest scores. These differences are shown in Table 5 andthey are expressed as standardised beta coefficients in order to makethe differences comparable over the various subtests. Since these coef-ficients are quite abstract, I have supplemented the information bygiving the differences expressed in raw scores.
As shown by the table the test takers’ age has been kept constant bychoosing different test occasions for each age cohort. Throughout thedifferences refer to the spring test occasion when the test takers were19 years old.

30
Table 5. Differences in subtest scores between Swedes and immigranttest takers. Standardised beta coefficients.
Subtest Born197392A
Born197392A
Born197392A
Born197392A
Born197392A
Range inraw scores
ERC .029 .023 .020 .033 .033 0.57 – 0.80WORD .059 .032 .054 .069 .081 0.87 – 2.75DS .063 .075 .080 .082 .090 1.34 – 2.32READ .056 .058 .061 .082 .090 1.06 – 1.30GI .047 .047 .049 .065 ---* 0.97 – 1.41DTM .092 .094 .091 .091 .097 1.64 – 1.83
* GI was excluded from the SweSAT
All coefficients are positive which means that those born in Swedenhave obtained higher scores than the immigrants. However, the diffe-rences vary quite substantially between the various subtests. Just ascould be expected they are rather small on the English Reading Com-prehension test (ERC). In this case the beta coefficients range from0.20 to 0.30 and this corresponds to raw score differences of 0.60 to0.80. This result seems quite natural taking into consideration thatsome immigrants have had English as their first language and thatmany of them have learnt English during their previous schooling inthe same way as the Swedes.
The other subtest differences may be more surprising. In my opinionthe most verbal tests, WORD and READ, ought to give greater groupdifferences than the two quantitative subtests Data Sufficency (DS)and Diagram Tables and Maps (DTM), but this was not the case. In-stead the largest differences are found for DTM.
I have no firm explanation for that, but I have two tentative hypothe-ses:
1) Diagram, tables and maps are used more often in Swedish compul-sory schools and upper secondary schools than in the correspon-ding foreign schools and therefore the Swedish SweSAT takers aremore accustomed to that kind of material.
31
2) The material selected for the DTM items is normally taken fromSwedish publications and it normally refers to Swedish conditions.Furthermore, the maps, tables and diagrams often contain technicalterms that may be more difficult for immigrants to understand ascompared to the normal every day language which predominate theitems in the other subtests.
Concluding remarksThe results presented here are preliminary, and they should not beused for any far-reaching conclusions. In the same way, the explana-tions for the results are tentative, since I have not had data enough athand to make all the controls that ought to be done. However, we areworking on making the data more complete, and in a near future thedata will reach such a degree of refinement that much more firmconclusions may be drawn. However, I think the problem of im-migrants and their SweSAT taking is such an important issue that itmust be put forward as soon as possible.
ReferenceGustafsson, J-E. & Benjegård, M. (1996). Högskoleprovet, social bak-grund och upprepad provtagning. In Högskoleprovet. Genom elvaforskares ögon. Stockholm:
The Swedish Scholastic Aptitude TestChristina Stage
The SweSAT was introduced in 1977 in connection with a reform ofthe universities and colleges. It was felt that an admission test wouldprovide a possible solution to two basic problems (1) how to find amethod of selection which could be used for applicants without formalqualifications; and (2) how to reduce the decisive role played by marksin the selection process. When the test was first introduced it was,however, only made available for a relatively small group of appli-cants (those who were at least 25 years old and had at least four yearsof work experience). Only since 1991 has the test been used for allapplicants.

32
When the use of the SweSAT was restricted to the above-mentionedgroup the number of persons taking the test was approximately 10 000each year; 6 000 in the spring and 4 000 in the autumn. Since 1990 thenumber of examinees has increased dramatically to around 140 000 per-sons each year; 75 - 80 000 in spring and 55 - 60 000 in autumn.
Since 1996 the test consists of 122 multiple choice questions distributedon five subtests. The test is administered twice a year, once in springand once in autumn. Students are allowed to take the test as many timesas they wish and for those who have several results the best one is usedfor application. In principle it is optional to take the test; in reality,however, it is compulsory, since only applicants with top marks dare torefrain from taking the test. The content of the test is shown in Table 1.
Table 1. SweSAT
Subtest Abbreviated No of items timeVocabulary WORD 40 15 min
Data Sufficiency DS 22 50 min
Swedish ReadingComprehension READ 20 50 min
Interpretation of Dia-grams, Tables and Maps DTM 20 50 min
English ReadingComprehension ERC 20 35 min
Total test 122 3h 20min
Vocabulary (WORD) measures understanding of words and concepts,and consists of items where the task is to identify which of fivepresented words has the same meaning as a given word. Both Swedishand foreign words are included in the subtest.
Data Sufficiency (DS) aims at measuring numerical reasoning ability. Ineach item a problem is presented, and the task is to decide whether theinformation presented is sufficient to allow solution of the problem. Theresponse format is fixed, so each item presents the same fivealternatives. The subtest is designed to put as little premium as possibleon mathematical knowledge and skills in favour of problem-solving andreasoning.

33
Reading Comprehension (READ) measures Swedish readingcomprehension in a wide sense. The examinees are presented with fivetexts and four multiple choice questions in relation to each text. Eachtext comprises about one printed page. Some items ask about particularpieces of information but most items are designed to requireunderstanding of larger parts of the text or the text in its entirety.
Interpretation of Diagrams, Tables and Maps (DTM) consists of 10collections of tables, diagrams and/or maps which present informationabout a topic, with two multiple choice questions in relation to eachcollection. The degree of complexity of the items varies from simplyreading off a presented graph, to some where information from differentsources must be combined.
English Reading Comprehension (ERC) is of the same general type asthe subtest READ. However, in this subtest there is more variability asto both the texts and item formats used. The test consists of 8 to 10 textsof different lengths. Most texts are followed by one or more multiplechoice questions with four alternatives. In one of the texts, some wordsare omitted, and the examinee is supposed to select the omitted wordfrom four alternatives presented alongside the text.
The SweSAT is supposed to measure acquired (developed) abilitiesand it makes use of the kind of verbal and mathematical skills thatdevelop over the years, both in and out of school. The content of thetest does not reflect any specific curriculum, although it is designed tobe consistent with school based learning.
The test is designed for selection to different types of university pro-grammes and therefore it is intended to measure the students' generalaptitude for studies. Since the test is a selection test it is supposed torank the applicants as fairly as possible according to their expectedacademic success. Other requirements on the test are:
• The test should be in line with the aims and content of highereducation.
• The test must not have negative effects on the education inupper secondary school.
• It should be possible to score the test fast, cheaply and ob-jectively.
• It should not be possible for an individual to improve his/hertest result by means of mechanical exercises or by learningspecial principles for problem solving.

34
• The examinees should experience the test as meaningful andsuitable.
• The demand for unbiased recruitment should be observed.No group should be discriminated against because of genderor social class.
The test should also be varied and cover many different content areas.It is possible to find the answers to roughly half of the questions in thematerial provided. In order to answer the remaining questions somebackground knowledge is necessary.
Test characteristicsIn Table 2 the subtests are described by different statistics, which areaverages for the tests given from spring 1996 till fall 1998.
Table 2 Some characteristics of the subtests: means, standard de-viations, reliability coefficients, ceiling effects and gender differences.
Subtest Mean Std.dev KR20 Ceil eff. dWORD 24.4 6.8 .83 0.1 % -.01DS 12.9 4.4 .78 0.9 % .58READ 12.2 3.5 .67 0.7 % .08DTM 11.2 3.8 .73 0.5 % .59ERC 12.7 4.2 .80 3.7 % .24Total test 72.1 17.5 .92 0.0 % .00
In Table 3 the intercorrelations between the subtests are given.

35
Table 3. Intercorrelations between subtests (reliability coefficientsin the diagonal).
WORD DS READ DTM ERC Tot
WORD .83DS .30 .78READ .58 .45 .67DTM . .35 .66 .48 .73ERC .60 .55 .61 .46 .80
Tot .57 .55 .69 .59 .69 .92
The reliability (KR20 ) for the subtests DS and DTM together is r =.87, for the combination of WORD, READ and ERC the reliability is r= .90, and for READ and ERC together it is r = .83.
In Table 4 the attenuated intercorrelations between the subtests aregiven.
Table 4. Attenuated intercorrelations between subtests.
WORD DS READ DTM ERC Tot
WORD .83DS .37 .78READ .78 .62 .67DTM .45 .87 .69 .73ERC .74 .70 .83 .60 .80
Tot .65 .65 .88 .72 .80 .92
A factor analysis on subtest level resulted in one factor with an eigen-value of 2.94, explaining 58.7 percent of the test variance, the secondfactor had an eigenvalue of 0.94 and the third 0.43.
A factor analysis on item level, however, resulted in one factor with aneigenvalue of 12.44, explaining only 10.2 percent of the variance, asecond factor with an eigenvalue of 4.63, a third factor with an eigen-value of 2 23 and another 33 factors with eigenvalues between 1.6 and1.0.

36
Equating of different test versionsAll correct answers are given one point, the points are added and thesum is tranferred to a normed scale from 0.0 to 2.0, where 2.0 is thehighest result.
The purpose of transferring the raw score to a normed score is to makeresults from different test administrations comparable. It should al-ways be as easy or as diffucult to get a specific normed score, inde-pendent of the difficulty level of the test and independent of the otherexaminees on a specific test administration.
The procedure used for transferring raw scores to normed scores isequipercentile equating in three different groups: the total group oftestees, the testees who are 19 years old and still in upper secondaryschool, and testees chosen by stratified sampling so that the distributionsof sex, age and education are always the same.
We now use IRT as a complement to the usual way of equating. Whatis needed, however, is a better design for composition of the subtests,which takes into account the need for common items which have notbeen changed between pretest and regular test. Table 3 shows how theitems in the last test were distributed on different pretest occasions.
Table 3. The items of SweSAT 99:A distributed on pretest occasions
Pretested 96:A 96:B 97:A 97:B 98:A
WORD 3 1 2 7 8DS 4 4 3 3 -READ - 2 6 1 -DTM - 5 3 1 -ERC 1 - - 2 -
We also need more information about how many items that are neededto do the IRT equating properly.
Important questions
• What kind of subtests should be added?
• Which subtests should be changed?
• Which subtests should be removed?

37
How should the scoring be done?
1. As it is done now, supposing there is one underlying ability in thetest.
2. One verbal and one quantitative score, supposing there are twounderlying abilities
3. Weighting of the subtests in different ways for different educations
Problems and complaintsThe WORD subtest takes only 15 minutes (7.5 percent of the totaltesting time) and gives 35 per cent of the total score.
Technical educations complain that there are too few and too easyquantitative subtests.
Educations of Art (Humanities) complain that the test is unfair againsttheir students.
The test gives rise to gender differences in results and we know thatfemales, when admitted, are as successful as males once they are ac-cepted.
DiscussionFor changes of the test, the construct validity should be the startingpoint; you should start with the criteria and find out what subtests areneeded.
In the present test there is too much time per item, which gives toolittle information. 2.5 min per item is too much 1 – 1.5 min is moreappropriate for multiple-choice items. The reliabilities are too lowespecially on the READ subtest. Very long texts – probably not mea-suring reading comprehension but skimming skills. One possibilitymight be to use partial weighting of the distractors. Another might beto collapse the WORD and READ subtests and measure vocabulary inthe READ subtest.
Against measuring reasoning ability by means of figures or symbols isthe face validity but also that such subtests are highly correlated withquantitative reasoning; an advantage would be (with regard to im-migrant testtakers) that such tests are language free.

38
Verbal production tests has not been very successfull, they are expen-sive and time consuming and contributes nothing but face validity.
If the subtests can stand for it, i.e. if the reliabilities are high enough itwould be prefereable to give the results in two separate scores, weigh-ting, however, puts dubious demands and a lot of validity data.
Since, statistically, two traits are measured by the test two scores wo-uld give more information to the testtakers as well as to the schools ifthe subtests are reliable enough. The schools can do the weighting asthey want, by logical or regression procedures.
It is important to distinguish between the admission system and selec-tion test; is the aim to optimize the admission system or to optimizethe test. A weigthed composite score of the test and average gradesgives a more valid admission decision, it is also compensatory since itworks as gender equalizer.
Some comments on the SweSAT from the point of view ofresearch on the structure of intelligenceJan-Eric Gustafsson
As has been shown in previous research (Gustafsson, Westerlund, &Wedman, 1992; see also Stages contribution at this meeting) theSweSAT is multidimensional. One way to get insights into themeasurement properties of the current test thus is to identify the natureof these dimensions. Discussion about further developments of the testalso may be stimulated by information about the dimensional structureof the test.
During the last couple of decades some progress has been made inresearch on models of the structure of human cognitive abilities. Thisresearch is primarily based on other kinds of measures than selectiontests for higher education, but may still provide useful theoreticalinsights and suggestions for further developments (see, e. g., Carroll,1993). One model that has a strong basis in current research, as well asin previous research, is the hierarchical model (see, e. g., Carroll,1993; Gustafsson & Undheim, 1996). According to this modeldimensions of cognitive abilities may be identified which vary indegree of generality, from a general intellectual ability, over a set ofbroad abilities, down to very specific abilities. Tests such as the

39
SweSAT may from the point of view of such a model be seen asmeasuring a mixture of different abilities.
Some studies have been conducted with the purpose of studying theSweSAT from such a perspective (Gustafsson, Westerlund, &Wedman, 1992; Gustafsson, 1994). One main result from these studiesis that the SweSAT measures two broad dimensions, along withseveral specific abilities. One dimension may be identified as"crystallized intelligence" (Gc), and is a dimension of verbalknowledge and skills. The other broad dimension is "fluidintelligence" (Gf), which is an analytic, problem-solving, ability.Among the subtests in the SweSAT WORD, READ and ERC arestrongly related to Gc, while DTM and DS are strongly related to Gf.In all subtests there also are specific abilities.
Out of the five subtests in the SweSAT three may thus be classified asmeasuring primarily Gc, while two primarily measure Gf. One sourceof potential problems, however, is that both the Gf-tests arenumerical/quantitative which implies that the measurement of Gf isconfounded with specific abilities of a numerical kind. The broadability Gf, which also has been shown to be identical with generalintellectual ability, can and should, however, be measured withdifferent kinds of content, such as figures, symbols, letters and words.Psychometric research has not shown any gender difference in Gf, atleast not in favor of males (Rosén, 1998), but the large performancedifference for males on the SweSAT is primarily due to the subtestsDTM and DS. This is explained by the finding that the only kind ofitem content for which Gf-tasks yield gender differences inperformance are numerical items (Willingham & Cole, 1997), whileother kinds of Gf-items do not give gender differences. From the pointof view of gender differences it thus seems unfortunate that the onlyGf-tests in the SweSAT are numerical. There may, however, also beother problems associated with the choice of numerical Gf-tests. Thereis reason to suspect that the numerical content of DTM and DS maketest-takers who primarily are focussed upon a "non-numerical"domain, such as law, perform poorly on these tests because they haveless experience and/or interest in working with numerical problemsolving tasks. If that is the case there is also a risc that the predictivepower of the tests is negatively influenced by the numerical content.

40
All the verbal subtests in the SweSAT are Gc-tests, which measureknowledge and skills which the test-takers have acquired before takingthe test. However, it follows from the line of reasoning above thatthere is good reason to include also verbal reasoning items in theSweSAT. One reason for this is that such an addition would probablyimprove the SweSAT as a measure of Gf for a large group of test-takers. But there also are reasons to reduce the strong Gc-dominanceof the SweSAT. Such tests are thus to a somewhat greater extentinfluenced by social background than are Gf-tests (Gustafsson &Westerlund, 1994). Another problem with Gc-tests is that performanceincreases with age, which is not the case for Gf-tests.
One conclusion from this scrutiny of the SweSAT from apsychometric perspective is thus that it should be investigated if it ispossible to reduce the current dominance of Gc in the SweSAT, infavor of a larger proportion of Gf-items, and in particular Gf-itemswith a non-numerical content.
The fact that the SweSAT is dominated by two dimensions also makesit important to consider if the current practice of reporting one totalscore should not be replaced with a reporting of two separate scores,or, alternatively with a different weighting of the subtests for selectionto different educations.
ReferencesCarroll, J. B. (1993). Human cognitive abilities. Cambridge: Cambrid-ge University Press.
Gustafsson, J.-E. (1994). Dimensions of ability determining perfor-mance on the Swedish Scholastic Aptitude Test. Paper presented at theAnnual Meeting of the American Educational Research Association,New Orleans, 1994
Gustafsson, J. E., & Undheim, J. O. (1996). Individual differences incognitive functions. In D. Berliner, & R. Calfee (Eds.), Handbook ofEducational Psychology, New York: Macmillan.
Gustafsson, J.-E., Wedman, I., & Westerlund, A. (1992). The dimen-sionality of the Swedish Scholastic Aptitude Test. Scandinavian Jour-nal of Educational Research, 36, 21-39.

41
Gustafsson, J.-E. & Westerlund A. (1994). Socialgruppsskillnader iprestationer på Högskoleprovet. I: R. Erikson & J. O. Jonsson (Red.).Sorteringen i skolan. Studier av snedrekrytering och utbildningenskonsekvenser. Stockholm: Carlsson Bokförlag.
Rosén, M. (1998b). Gender differences in patterns of knowledge. Gö-teborg: Acta Universitatis Gothoburgensis.
Willingham, W., & Cole, N. (1997). Gender and fair assessment.Mahwah, New Jersey: Lawrence Erlbaum.
Educational Measurement in an International Perspective
Professor Ronald Hambleton told us that in the US the interest formeasurement has increased during the nineties. In the eighties therewas an antitesting movement with less IQ testing and less school-testing, but now the direction has changed and there is a lack of psy-chometricians. There is also an increased interest in internationaltesting.
The interest is focused on three areas especially, and they are: test ac-commodation, computer-based testing and standard setting.
Regarding test accommodation there are two aspects. One is accom-modation for people with handicaps who demand longer testing time,and the problem is to enhance the validity. Are the test scores compa-rable when the time is prolonged and is the construct the same? Theother aspect is measuring in another language than English. The disa-bilities act has impact on all issues and the more important the test isthe harder they push the language preference (test translation) or alter-native assessment. Sometimes the accommodated test is not remotelyequivalent to the original test.
As for the second area at present the number of computer-based testsis especially great in the credential field, i.e. GMAT, GRE, TOEFL areall computer-based. The positive thing is the immediate feed-back.The negative thing is the enormous demand on items, since moreitems are exposed and it is unclear how many items are rememberedand passed on to others.

42
The third area, which is of personal interest is standard setting andscore reporting; much more information should be given in connectionwith score reporting but there is little research done.
There is also an interest in large scale assessment and internationalcomparisons. A national goal is that the US should be number one inthe world in math and science in year 2000. NAEP and state to statecomparisons is also a great issue. Important political decisions arebased on the state ranking and also on ranking of districts within sta-tes.
Professor Michal Beller told us that several private colleges havebeen established in Israel in the last years, offering studies in highlyselective areas such as business and law. This causes loss of studentsfor the nonselective university areas.
The selection procedure does not elicit much public discussion at pre-sent. PET is still a paper and pencil test. A full version of computer-based test was prepared and circulated among all test registrants as apreparation material. The English section of PET, when administeredseparately for placement purposes, can be taken in a computerizedadaptive manner, using laptop computers provided by NITE. There arealso computerized versions available for people who need special testaccommodation.
NITE has also developed and administered an advanced mathematicsachievement test for engineering schools, and there is a big amd highquality item bank available (which could be used internationally).
The Israeli NAEP has been very successful psychometriaclly but hasnot had much impact. The only impact was that in some cases the Mi-nistry of Education was forced to rethink the curriculum. At the mo-ment, however, there is no new contract for NAEP.
Professor Wim Van der Linden told us that in the Netherlands thereis a big difference between school based testing and credential testing.Regarding school based testing there were no real news. Two yearsago a reform had taken place and the new test was now being imple-mented. The lottery system for admittance to higher education hasbeen replaced by a system where above a certain GPA students havegarantueed admission and below that GPA lottery still applies. Alsouniversities will receive the right to select a certain proportion of thecandidates themselves.
43
Regarding credential testing there is an increased interest in testingand psychometricians are in great demand. It is still is difficult to rec-ruit students to the field, however.
CITO became a private organization in January and has undergone areorganization; at present the top people do not know anything abouteducational measurements. Still most of test theory research in thenetherlands is performed either at CITO or at the Department of Edu-cational Measurement and Data Analysis, University of Twente.
44
Conference Participants
Michal Beller, IsraelRonald, K. Hambleton, USAWim van der Linden, The Netherlands
Inger Rydén Bergendahl, The National Agency of Higher Education
Jan-Eric Gustafsson, GothenburgSven-Eric Reuterberg, GothenburgAllan Svensson, Gothenburg
Ewa Andersson, UmeåKerstin Andersson, UmeåStig Eriksson, UmeåWidar Henriksson, UmeåAnders Lexelius, UmeåChristina Stage, UmeåGunilla Ögren, Umeå
45
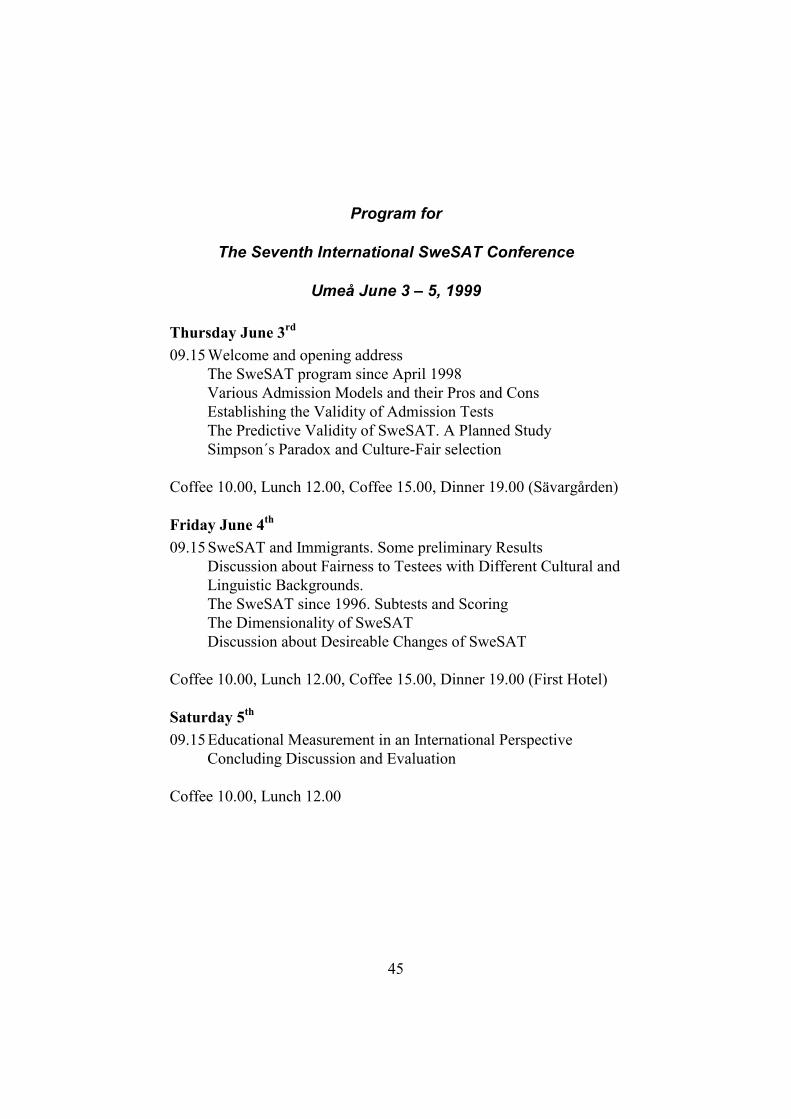
Program for
The Seventh International SweSAT Conference
Umeå June 3 – 5, 1999
Thursday June 3rd
09.15 Welcome and opening addressThe SweSAT program since April 1998Various Admission Models and their Pros and ConsEstablishing the Validity of Admission TestsThe Predictive Validity of SweSAT. A Planned StudySimpson´s Paradox and Culture-Fair selection
Coffee 10.00, Lunch 12.00, Coffee 15.00, Dinner 19.00 (Sävargården)
Friday June 4th
09.15 SweSAT and Immigrants. Some preliminary ResultsDiscussion about Fairness to Testees with Different Cultural andLinguistic Backgrounds.The SweSAT since 1996. Subtests and ScoringThe Dimensionality of SweSATDiscussion about Desireable Changes of SweSAT
Coffee 10.00, Lunch 12.00, Coffee 15.00, Dinner 19.00 (First Hotel)
Saturday 5th
09.15 Educational Measurement in an International PerspectiveConcluding Discussion and Evaluation
Coffee 10.00, Lunch 12.00