Embed Size (px)
Citation preview

northwest hydraulic consultants
2NDNATURE
Geosyntec Consultants
September 11, 2007
Urban Upland / Groundwater Source Category Group (UGSCG)
Overview Presentation

Purpose and Background
• Inform pollutant load reduction estimates for urban storm water runoff, including infiltration to groundwater
• Watershed Model simulations use UGSCG input to estimate pollutant load reductions for surface water
• Groundwater estimates conducted independent of Watershed Model simulations
Overview Presentation
UGSCGSeptember 11, 2007

Key Steps in Approach(Surface Runoff)
Step 1: PCO Evaluation
Step 2: Site-Scale Analysis Define Urban Upland Settings Develop Treatment Tiers by Setting
Step 3: Basin-Wide Analysis Provide input to Watershed Model Watershed Model simulations estimate
pollutant load reductionsOverview Presentation
UGSCGSeptember 11, 2007

PCO Considerations
• Large number of BMPs are applicable to urban uplands and groundwater
• BMPs are typically applied in various combinations, configurations, and sizes depending on site conditions
• Potentially creates an unmanageable number of alternatives
Overview Presentation
UGSCGSeptember 11, 2007

PCO Development
Overview Presentation
UGSCGSeptember 11, 2007
A single PCO represents multiple BMPs having similar function and process
Infiltration Trench
Drip Line Trench
Retention Basin
Rain Barrel
Permeable Pavement
Multiple BMPs PCO
Etc.
HSC-3
Function - Private BMPs that detain and infiltrate runoff

PCO Performance Estimates
• PCOs categorized to estimate performance
Overview Presentation
UGSCGSeptember 11, 2007
Hydrology
Pollutant Load Generation
Storm Water Treatment
Pollutant Load
Source Controls
HSC
PSC
SWT
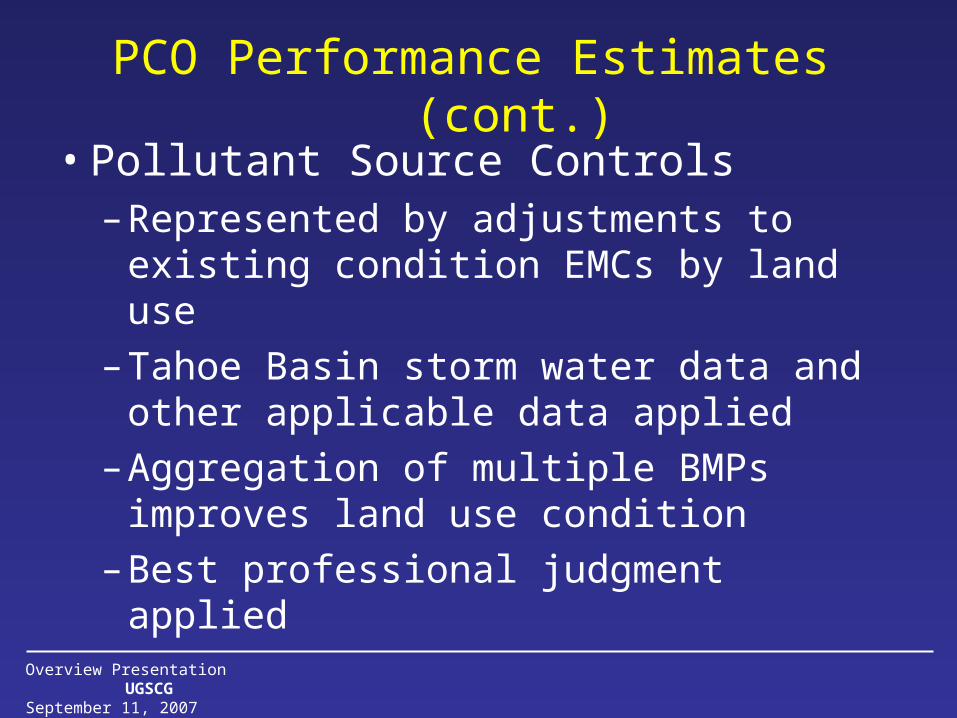
PCO Performance Estimates (cont.)
• Pollutant Source Controls– Represented by adjustments to existing
condition EMCs by land use
– Tahoe Basin storm water data and other applicable data applied
– Aggregation of multiple BMPs improves land use condition
– Best professional judgment applied
Overview Presentation
UGSCGSeptember 11, 2007
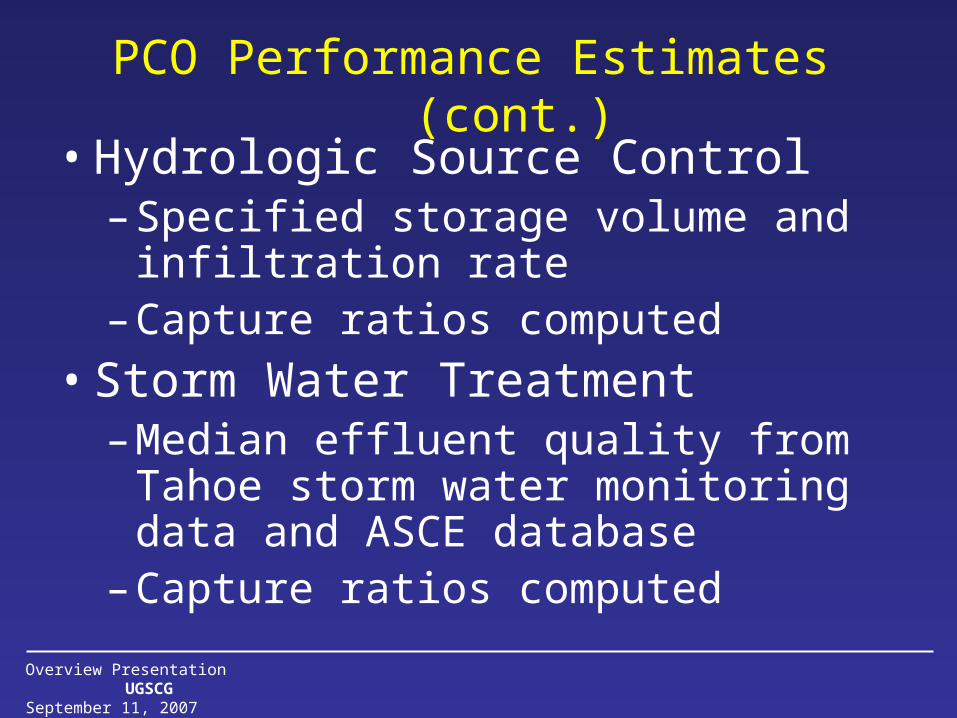
PCO Performance Estimates (cont.)
• Hydrologic Source Control– Specified storage volume and infiltration
rate– Capture ratios computed
• Storm Water Treatment– Median effluent quality from Tahoe
storm water monitoring data and ASCE database
– Capture ratios computed
Overview Presentation
UGSCGSeptember 11, 2007

Urban Upland Settings
• Settings classify subwatersheds to guide potential PCO applications
• Settings based on two key physiographic characteristics – Impervious area configuration– Average slope of urban area
• Many other performance factors captured by Watershed Model (e.g., meteorology, land use, soils, etc.)
Overview Presentation
UGSCGSeptember 11, 2007

Urban Upland Settings
• 4 Settings defined – Concentrated-Steep– Concentrated-Moderate– Dispersed-Steep– Dispersed-Moderate
• Settings recognized to not represent project implementation scale
Overview Presentation
UGSCGSeptember 11, 2007

Treatment Tiers
• Conceptual combinations of PCOs applicable to a particular Setting
• Two standard Treatment Tiers defined
• Represent steps or levels in expected water quality performance and cost– Tier 1: Similar to existing practice– Tier 2: Tier 1 plus increased spatial scale of
PCO implementation and more advanced PCOs applied
Overview Presentation
UGSCGSeptember 11, 2007

Treatment Tier Example
Overview Presentation
UGSCGSeptember 11, 2007
Tier 1 Tier 2 Tier 1 Teir 2
PSC-1A
Road drainage system stabilization; distributed collection of pollutants; Road abrasives application reductions, maintenance and
operations
50% 0%
Road shoulders parallel to slope stabilized; road shoulders perpendicular to slope not stabilized
Not applied
PSC-1BPSC1A plus increased maintenance and
operations; Use of alternative deicers; Use of advanced road abrasive collection technology
0% 100% Not appliedStandard assumption for
Tier 2 treatment tier
HSC-2Decrease runoff reaching outlet in steep sloped
catchments 15% 30%
Select opportunities to disperse runoff while considering physical
constraints
Tier 1 plus additional drainage infrastructure
to disconnect and disperse runoff
HSC-3Private BMP implementation to detain and
infiltrate runoff50% 100%
Standard assumption for Tier 1
Standard assumption for Tier 2
SWT-2A Mechanical separation 40% 0%Slopes limit
opportunities for runoff capture
Not applied
SWT-2B Mechanical separation with media filtration 0% 100% Not appliedExtensive subsurface
construction for treatment
PCO Description of PCO FunctionSpatial Scale of
ApplicationRationale for Spatial Scale of PCO Application
and Key Assumptions

Pump and Treat Tier
• Developed specialized treatment tier
• Collection and pumping of storm water to a regional treatment plant
• Applied in concentrated settings
Overview Presentation
UGSCGSeptember 11, 2007

PCO Performance Informing Watershed Model Simulations
Overview Presentation
UGSCGSeptember 11, 2007
Application
In-SituRecovery
Natural retention
Empiricalrelationship
EM
C
Available for runoff
Pollutant Source Control
Application Surface
Available for runoff Hydrologic
Source Control
Hydrologic Source Control
Runoff volume: V(in)
RevisedLand UseEMCs
RED= Information to Watershed Model
Discharge
F-table and sizing parameters (in/acre)
F-table and sizing parameters (in/acre)
Storm Water Treatment
Storm WaterTreatment
Treated
Untreated
Revised EMCs for pollutants of concern in treated volumes
Infiltration 2
GW Treatment
Infiltration 1
Groundwater Streams/Lake
Streams/Lake
GW Treated
Runoff Processes
Natural retention
In-SituRecovery/ Retention
ErosionSurface
Available for runoff
Soil Filtration

Preliminary Results (Surface Water)
Overview Presentation
UGSCGSeptember 11, 2007
Estimated Average Annual Load Reduction (Metric Tons)
Setting Pollutant of Concern Tier 1 Tier 2 Pump & treat
Fines < 63 µm 520 1,200 1,100Total Nitrogen 5.6 13 6.9Total Phosphorus 1.3 2.1 2Fines < 63 µm 310 760 670Total Nitrogen 2.3 6.2 3.7Total Phosphorus 0.8 0.7 1.2Fines < 63 µm 160 400 n/a Total Nitrogen 1.6 5.2 n/a Total Phosphorus 0.4 1 n/a Fines < 63 µm 200 520 n/a Total Nitrogen 1.2 4.8 n/a Total Phosphorus 0.5 1.1 n/a
Concentrated-moderate
Concentrated-steep
Dispersed-moderate
Dispersed-steep

Groundwater Background
• Key question: – What is the impact of urban storm water
infiltration on groundwater nutrient loading to the Lake?
• Estimated changes to groundwater loads independent of Watershed Model
• Baseline conditions assumed from Groundwater Framework Study for Lake Tahoe (ACOE 2003)
• Mass balance approach used
Overview Presentation
UGSCGSeptember 11, 2007

Key Steps in Approach(Groundwater)
1. SWMM used to quantify infiltrated volumes
2. Compared and related SWMM results to ACOE (2003) for baseline conditions
3. Used SWMM to estimate changes in infiltrated volumes for Tier 1 and Tier 2 implementation
4. Applied estimates of Tier 1 and Tier 2 characteristic runoff quality infiltrated
5. Developed estimates of pollutant loads to groundwater
Overview Presentation
UGSCGSeptember 11, 2007

Preliminary Results (Groundwater)
Overview Presentation
UGSCGSeptember 11, 2007
2007 Nutrient Budget DN (MT/yr) DP (MT/yr) Groundwater contribution 35.7 4.9
% of total annual load to Lake Tahoe 17% 36%
Treatment tier DN load reduction
(MT/yr) DP load reduction
(MT/yr) Urban Upland Storm Water PCOs
Tier 1 (0.1) 0.2 Tier 2 2 0.87
Sewage System Maintenance
Tier 1 0.3 0.03 Tier 2 0.6 0.06
In-situ Groundwater Treatment
Tier 2 not evaluated 0.28 Text in parenthesis indicates an estimated increase in annual load


![Sediment Management - Geosyntec · Sediment Management 4UBUFNFOUPG2VBMJmDBUJPOT] About Geosyntec Section 1 About Geosyntec Technical Excellence, Teamwork and A Generous Spirit Recognized](https://img.pdfslide.us/doc/110x75/5d5dcc7788c993a30e8b8011/sediment-management-sediment-management-4ubufnfoupg2vbmjmdbujpot-about-geosyntec.jpg)