Embed Size (px)
Citation preview

HANK WATKINS Sean Murphy
PRESIDENT, LLOYD’S North AMERICA PRESIDENT, LLOYD’S CANADA
May 2013
Market Presentation North America
> www.lloyds.com/marketpresentations
> www.lloyds.com/countryprofiles

© Lloyd’s
Co
nt
en
t
LLOYD’S CANADA
LLOYD’S AMERICA • Hank Watkins
President, Lloyd’s North America
• Sean Murphy
President, Lloyd’s Canada
1
2
2

© Lloyd’s
Lloyd’s CANADA
• Canadian Economy Overview
• (Re)Insurance Market
• Lloyd’s Business Profile
• Operations
• Events
1
3
© Lloyd’s
Canada is a country where nothing
seems ever to happen. ….Clean…..
Dull….
Carol Shield

© Lloyd’s
ECONOMY
• Canadian economy projected to remain sub-par for a second consecutive year.
• Most major commodity prices suffered setbacks in 2012
• Canada economic fortunes are tied to the US – comprise for 75% of total exports
• Western provinces will grow faster than the national average, with the exception of
Newfoundland.
Lloyd’s > Canadian Economic Outlook Gross Domestic Product (GDP) (nominal GDP levels in billion US$; Real GDP change)

© Lloyd’s
Market data: The ‘Big Four’ Canadian Provinces
ON BC AB QC
2012 Premium
($000)
$488 $427 $321 $279
Market Share% 2% 6% 4% 4%
GDP%
13/14 real
1.4/2.5 1.6/2.6 2.5/3.3 1.4/2.3
GDP - nominal $ 655 bn $ 218 bn $ 295 bn $ 345 bn
Population
(2012)
14 m 5 m 4 m 8 m
Sources: RBC Economic Research – Provincial Outlook
TD Economics – Provincial Forecast
Insurance Market > Overview

© Lloyd’s
2013 Forecast Lead Provinces – Real GDP Growth
NF SK AB MB
2012 Premium
($1000)
$20 $38 $321 $43
Market Share % 3% 2% 4% 5%
GDP % 13/14
real
3.4/1.1 2.3/3.2 2.5/3.3 1.6/2.4
GDP nominal $33.6 bn $ 74.7 bn $295 bn $55 bn
Population 513 k 1 m 3.8 m 1.2 m
Economic Drivers Oil
Gas
Mining
Oil
Gas
Mining
Oil
Gas
Agriculture
Manufacturing
Mining
Sources: RBC Economic Research – Provincial Outlook
TD Economics – Provincial Forecast
Insurance Market > Overview

© Lloyd’s
Insurance Market > Overview
INSURANCE
New entrant activity:
Starr and Ironshore
Recent push by the Ontario government to reduce personal lines auto
premiums by 15%.
Rates in property and casualty remain generally flat
EQ hardening in BC and some parts of Quebec
reinsurance
Written Premiums dropped by 1%
9% improvement in combined LR
Little CAT activity in 2012
Source: Economy: Market Intelligence based on IHS Global Insight and other economic reports; May 2012; Insurance and Reinsurance: based on local intelligence from Lloyd’s Canada.
2
8

© Lloyd’s Source: Market Intelligence calculations based on P&C Canada 2012 Market Share Report - MSA Research Inc. www.msaresearch.com
* Please note: This figure does not include Reinsurance premiums.
insurance Market > Market Share
Total 2012
Canada Market
$49.9bn
2012 Direct Premiums by Class of Business in CAD m
Total 2012
Lloyd’s Canada
$1.7bn
Personal Lines business dominates the Canadian insurance market. Lloyd’s is not a
serious player in this segment.
1

© Lloyd’s
Top Five Canadian Catastrophes of 2012
Source: As published in the Top Canadian Insurance Brokers’ “The Claims Issue”
When What and Where Insured Loss
August 12 Hailstorm Calgary Alberta
$ 520 million
May 26 - 29 Series of Heavy Storms, Tornadoes Ontario and Quebec
$ 245 million
October 29 - 31 Remnants of Super-storm Sandy Ontario and Quebec
$ 100 million
July 11 - 12 Thunderstorm Edmonton, Alberta
$ 100 million
July 22 - 23 Wind and Rainstorms Hamilton / Ottawa corridor
$ 85 million
Insurance Market > Overview 1

© Lloyd’s
Lloyd’s > Provincial Share Lloyd’s Canadian Premium Written By Province
Ontario 33%
BC 22%
Alberta 16%
Quebec 15%
Other 14%
BC
CH – 91
OMC - 40
QC
CH – 61
OMC - 51
AB
CH – 31
OMC - 35
ON
CH – 116
OMC - 86
0
10
20
30
40
50
60
2009 2010 2011 2012 2013
Coverholders
Open Market Correspondents
Distribution
• Lloyd’s Coverholders - 333
• Open Market Correspondents - 251
New CH and OMC applications processed
Ontario,
47%
BC,
17%
Alberta,
16%
Quebec,
16%
Others,
4%
Canadian Market Premium Written by Province

© Lloyd’s
Positive industry result – 96% combined loss ratio
Double digit ROE – 11%. 3% top line growth.
Exclusive C/L insurer experience a 4.7% decrease
in direct premium
Avg 90% combined loss ratio for exclusive
C/L insurers.
insurance Market > Market Size
2009-2012 Loss Ratios for Total Market:
in % KEY FEATURES
2009-2012 Direct Premiums for Total Market:
in billion CAD
Source: Market Intelligence calculation based on: MSA Market Share Report Property & Casualty, Canada 2013
2
12
43.9 46.4
48.6 49.9
1.5 1.7 1.9 1.7 0
10
20
30
40
50
2009 2010 2011 2012
Market Lloyd's
71.1 70.7 70.5 64.6
51.7
62.7 62.1
50.8
0
10
20
30
40
50
60
70
80
2009 2010 2011 2012
Market Lloyd's
Total
Premium
$2.1bn
Direct Written
Premium, $1.7bn
Reinsurance,
$0.3bn
2012 Total Lloyd’s Canadian Premiums
in billion CAD

© Lloyd’s
insurance Market > Competitor Ranking
2012 Market Leaders in CAD m
Excluding Auto & Personal Property
2012
Loss
Ratio
50%
51%
60%
55%
33%
55%
88%
50%
35%
Source: Market Intelligence calculation based on: MSA Market Share Report Property & Casualty, Canada 2013
1
Lloyd’s Underwriters has lost it’s number 1 status
13
956
879
871
757
644
584
560
497
Lloyd’s
Intact
Aviva
Royal & Sun All.
Chartis
Zurich
Genworth
Co-operators
Economical Mutual
Northbridge
61%
1,615
1,714

© Lloyd’s
Major lines of business breakdown 2012 * (in million CAD)
Source: Market Intelligence calculations based on P&C Canada 2013 Market Share Report - MSA Research Inc. www.msaresearch.com
* Please note: This figure does not include Reinsurance premiums. (this needs to be checked)
DWP 11
DWP 10
Loss Ratio
2012*
50%
58%
45%
46%
50%
DWP 12
Marine
Aviation
Personal
Property
Other
Commercial
Property
Liability
Premiums
2012*
827
595
110
110
62
Lloyd’s > Classes of business 2
Lloyd’s Underwriters DWP decreased by 7% - underwriting profitability
increased
14
40
-20%

© Lloyd’s
insurance Market > Liability 2009-2012 Premiums for Liability:
in million CAD
2012 Top 5 Companies in Liability:
prems in CAD / loss ratios in %
Lloyd’s 827.5m 58
Intact 569.3m 39
Aviva 352.4m 69
Chartis 341.5m 43
Zurich 304.8m 39
Premiums Loss Ratio
Source: Market Intelligence calculation based on: MSA Market Share Report Property & Casualty, Canada 2013
1
KEY CHARACTERISTICS
Commercial liability continues to attract capacity due
to its relative profitability
Pricing for Professional Liability and D+O will continue
to be under pressure due to surplus capacity
Cyber liability is relatively new and there appears to
be much capacity but at lower limits.
OUTLOOK
15
4,908 5,041 5,204 5,161
671 723 855 827
0
1000
2000
3000
4000
5000
6000
2009 2010 2011 2012
Market Lloyd's

© Lloyd’s
Private new dwelling construction has slowed down in
most parts of Canada. There is many insurers
competing for fewer projects.
Smaller mining operations are seeing flat to small price
reductions to the availability of capacity mostly from
local domestics
insurance Market > Commercial Property
2012 Top 5 Companies in Com. Property:
prems in CAD / loss ratios in %
2009-2012 DWP for Commercial Property:
in million CAD KEY CHARACTERISTICS
OUTLOOK 2012/2013
Intact 946.7m 63
Lloyd’s 595.3m
50
Aviva 504.3m 61
Royal & Sun
Alliance 420.0m 62
Zurich 382.6m 74
Premiums Loss Ratio
Source: Market Intelligence calculation based on: MSA Market Share Report Property & Casualty, Canada 2013
1
16
5,617 5,958
6,262 6,455
646 555 634 595
0
1000
2000
3000
4000
5000
6000
7000
2009 2010 2011 2012
Market Lloyd's

© Lloyd’s
Lloyd’s > Distribution
Source: Market Intelligence calculation based on: Xchanging data
2012 Top 10 Brokers by Premiums
CA
D m
illio
ns
2
The largest 10 London brokers accounted for 61% of business into Lloyd’s
17
0
50
100
150
200
250
300
BR1 BR2 BR3 BR4 BR5 BR6 BR7 BR8 BR9 BR10
Accident & Health Aviation Casualty Casualty Treaty Energy
Marine Overseas Motor Property (D&F) Property Treaty

© Lloyd’s
● OSFI Revised B-9 Guideline
● OSFI newly introduced draft ORSA Guideline
● Renewed Lloyd’s OSFI Prudential agreement
● OSFI Corporate Governance Guideline
insurance Market > Regulatory changes 2
18

© Lloyd’s
Operational Activity
19
Year Direct Reinsurance
2012 22,424 851
2013 9053 518
Bound contracts through ASPS from
January 2012 up to end April 2013 Lineage Growth in Premium 2007-2012
Lineage 2010 2011 2012
Training Sessions 44 71 72
In 2013, Lloyd’s Canada have made provisions for 15 webinar sessions. The main scope behind these
sessions is to provide sufficient knowledge for effective and efficient use of the main features of Lineage to
our stakeholders

© Lloyd’s
Lloyd’s > Raising Your Profile
Raising Awareness Associations
3
2013 Sponsorships
Photo courtesy of Canadian Insurance Top Broker – Copyright 2013
© Lloyd’s
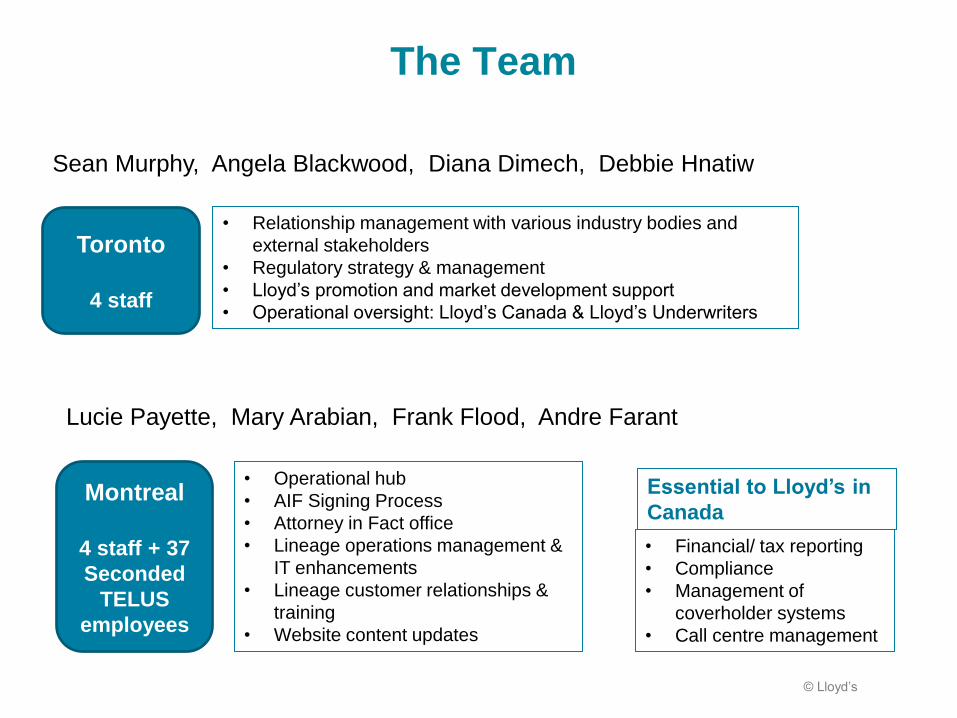
The Team
Sean Murphy, Angela Blackwood, Diana Dimech, Debbie Hnatiw
Toronto
Toronto
4 staff
Montreal
4 staff + 37
Seconded
TELUS
employees
• Relationship management with various industry bodies and
external stakeholders
• Regulatory strategy & management
• Lloyd’s promotion and market development support
• Operational oversight: Lloyd’s Canada & Lloyd’s Underwriters
• Operational hub
• AIF Signing Process
• Attorney in Fact office
• Lineage operations management &
IT enhancements
• Lineage customer relationships &
training
• Website content updates
• Financial/ tax reporting
• Compliance
• Management of
coverholder systems
• Call centre management
Essential to Lloyd’s in
Canada
Lucie Payette, Mary Arabian, Frank Flood, Andre Farant
Montreal

© Lloyd’s 22 22