Embed Size (px)
Citation preview
2010 Minerals Yearbook
U.S. Department of the Interior U.S. Geological Survey
LATIN AMERICA AND CANADA
July 2012
Latin america and canada—2010 1.1
The Mineral indusTries of laTin aMerica and canada
By Susan Wacaster, Philip m. mobbs, david r. Wilburn, Glenn J. Wallace, Steven t. anderson, Omayra Bermúdez-Lugo,
alfredo c. Gurmendi, and alberto alexander Perez
the Latin america and canada region reported upon in this volume is composed of about 50 countries and dependencies. these countries and dependencies have a combined population of approximately 624 million people and a land area of 30.5 million square kilometers. the netherlands antilles, which had been an autonomous country of the Kingdom of the netherlands composed of Bonaire, curacao, Sint maarten, Saba, and Sint eustatius, was dissolved in 2010 (aruba had seceded from the netherlands antilles in 1986). as a result of the dissolution of the netherlands antilles, curacao and Sint maarten joined aruba and the netherlands as autonomous countries within the Kingdom of the netherlands and Bonaire, Saba, and Sint eustatius became special municipalities of the netherlands (table 2).
in 2010, Brazil, canada, and chile maintained their positions as leaders in the global mineral industry. Brazil was the world’s leading producer of niobium and tantalum, the third ranked producer of iron ore (gross weight), and the regional leader in the production of bauxite and crude steel. canada was the world’s leading producer of potash, the second ranked producer of niobium, and the regional leader in the production of aluminum, palladium, platinum, and tellurium. chile was the world’s leading producer of copper (mine output and refined metal), iodine, and lithium; the second ranked producer of arsenic; and the third ranked producer of boron. argentina, Bolivia, mexico, and Peru were also among the world’s leading producers of base and precious metals and industrial minerals. argentina was the world’s second ranked producer of boron, and Bolivia was the second ranked producer of antimony. mexico was the second ranked producer of fluorspar and the fifth ranked producer of lead. Peru was the world’s leading producer of silver, the second ranked producer of bismuth and copper, the fourth ranked producer of lead, and the region’s leading producer of tin (mine and metal production) (tables 4–6, 8–14, 16, 18; angulo, 2011a, b; Brooks, 2011a, b; carlin, 2011a, b; edelstein, 2011; Jaskula, 2011b; Jorgenson, 2011; miller, 2011; Papp, 2011).
in the caribbean area, aruba was not a mining nation, but the Aruba oil refinery (owned by Valero Energy Corp. of Texas), which had been a regional supplier of petroleum derivatives, restarted operations in January 2011 after being idled in 2009. Jamaica was estimated to be the world’s sixth ranked producer of bauxite. the republic of trinidad and tobago was a crude oil and natural gas producer, and its economy was dependent upon the hydrocarbon sector. the dominican republic’s nickel production, which was usually ranked about 11th globally, was insignificant in 2010 because of a shutdown between
august 2008 and October 2010 at Xstrata nickel of the United Kingdom’s Falconbridge dominicana c. por a. (Falcondo) operation in Bonao. the company had halted operations at the facility because of a combination of high energy costs and diminished market conditions.
Acknowledgments
the U.S. Geological Survey (USGS) acknowledges and thanks the following organizations for providing mineral production statistics, basic economic data, and exploration and mineral-related information:
• Argentina—Dirección Nacional de Minería;• The Bahamas—Department of Statistics;• Belize—Geology and Petroleum Department;• Bolivia—Viceministerio de Minería y Metalurgia, Instituto
Nacional de Estadistíca (INE), Asociación Nacional de Mineros medianos;
• Brazil—Departamento Nacional de Produção Mineral;• Canada—Natural Resources Canada;• Chile—Comisión Chilena de Cobre and Servicio Nacional
de Geología y Minería;• Colombia—Unidad de Planeación Minero Energética and
Instituto Colombiano de Geología y Minería;• Costa Rica—Dirección de Geología y Minas;• Dominican Republic—Dirección General de Minería, and
Servicio Geologico nacional;• Guatemala—Ministerio de Energía y Minas, Dirección
General de Minería, and Departamento de Desarrollo Minero;• Guyana—Guyana Geology and Mines Commission;• Jamaica—Mines and Geology Division of the Ministry of
agriculture and Lands;• Mexico—Servicio Geológico Mexicano and Secretaría de
Economía;• Nicaragua—Administració de Recursos Geológicos and
Dirección de Minas;• Peru—Ministerio de Energía y Minas; and• Trinidad and Tobago—Ministry of Energy and Energy
affairs.
General Economic Conditions
canada’s economy, expressed in terms of the real gross domestic product (GdP), was estimated to have grown by 3.2% in 2010 compared with a 2.8% decrease in 2009. the country withstood the global economic crisis of 2008-9 relatively well despite a high degree of exposure to the United States’ sluggish
1.2 U.S. GEOLOGICAL SURVEY MINERALS YEARBOOK—2010
post-recession economy, canada’s troubled automobile and housing sectors, and declining prices for mineral commodities worldwide. the Organisation for economic co-operation and development (Oecd) attributed canada’s economic resilience to a relatively sound banking system, a less-leveraged corporate sector (industrial companies with more than one-third of their capitalization in the form of debt, as opposed to equity, are generally considered highly leveraged), and a relatively strong fiscal position with respect to that of the United States (table 2; Organization for economic co-operation and development, 2012, p. 8, 20).
A 2011 sovereign fiscal responsibility index ranked Canada 11 out of 34 emerging and advanced countries based on fiscal space (amount of debt, as a percentage of the GDP, that a country could issue before reaching fiscal crisis), fiscal path (projection of the country’s future level of debt), and fiscal governance (value based on a country’s fiscal rules, transparency, and enforceability) (comeback america initiative, the, 2011).
the Government of canada kept domestic demand high by implementing a stimulus program equal to 2% of the GdP per year in 2009–10, which was targeted at the credit, housing, and labor markets. despite a slowdown in the third quarter of 2010, economic growth increased during the final months of the year owing partially to an increase in exports, which was attributed in part to recovery in the U.S. economy (international monetary Fund, 2011, p. 11–12).
according to the economic commission for Latin america and the caribbean, the GdP of the region increased by about 6% in 2010, which continued a trend of economic recovery that began in many of the region’s countries in the second half of 2009. the GdP decreased by at least 5.4% in Haiti as a result of the January 2010 earthquake and by about 1.5% in Venezuela owing to decreased domestic demand, decreased oil exports, and electricity rationing during a drought in the first half of the year (table 2; economic commission for Latin america and the caribbean, 2011, p. 41).
the Latin america and the caribbean region’s growth was attributed to increased private consumption, expanded private sector credit, low interest rates, increased real wages (with the exception of Venezuela), and domestic production levels that were quickly increased because of the large amount of idle installed capacity that had been easily brought back into production. consumption also increased in countries that relied upon emigrant remittances as a source of financing for domestic demand (table 2; economic commission for Latin america and the caribbean, 2011, p. 41–42).
according to the international monetary Fund, emerging economies, including those in Latin america, generally grew faster than advanced economies in 2010 as the global economy continued to expand (albeit unevenly within regions). Latin america’s relatively rapid rebound was attributed in part to China’s influence on international business cycles. A 2011 global macroeconomic modeling study by the inter-american development Bank reported that china’s share of trade with the Latin american countries investigated (argentina, Brazil, chile, mexico, and Peru) had increased by nearly threefold since about 1995 and that china’s growth affected Latin america’s business
cycle mostly through china’s demand for mineral commodities (economic commission for Latin america and the caribbean, 2011, p. 9; international monetary Fund, 2011, p. vii, 3).
the study indicated that a decade-long commodity price boom (prior to 2008) might have inflated bilateral trade shares between china and Latin american countries and that china’s exchange rate regime might have played a role in directing more chinese business to Latin america. the conclusion, however, was that the long-run effect of a potential reduction in the GdP of china on the economies of Latin american countries had also increased by threefold since the mid-1990s whereas the long-run effect on Latin america of a reduction in the GdP of the United States had decreased by one-half during the same period (economic commission for Latin america and the caribbean, 2011, p. 41–42).
the study further concluded that the effect on other countries of a reduction of GdP originating in Latin america (or the rest of emerging asia, excluding china and india) had not changed during the same period and that the effect of a reduction of china’s GdP on Latin america would owe as much to indirect effects associated with stronger trade linkages between china and Latin america’s leading trade partners (the United States and the euro area) as to direct effects that stemmed from tighter trade linkages between china and Latin america (cesa–Bianchi and others, 2011, p. 1–6, 18–22).
in most Latin american countries, the highest rates of year-on-year GDP growth were in the first half of 2010. In most countries, excluding Chile and Venezuela, economies continued to grow during the second half of 2010 but at a slower rate. in Chile, slower growth in the first half of the year was primarily owing to the economic effect of the February 2010 earthquake that paralyzed many industries in the affected area and resulted in a decrease in the volume of exported goods. chile’s economy picked up during the second half of the year as some of the affected industries rebuilt and resumed activity, and the improvement was expected to continue into 2011. In Venezuela, the rate of economic growth increased in the second half of the year as the average price for the country’s crude oil rose, which increased Government revenue and fiscal spending, and as the supply of electricity returned to normal (economic commission for Latin america and the caribbean, 2011, p. 41–42).
Investment Data and Political Risk
From the start of 2010, the countries external to the region of Latin america and the caribbean generally had increased liquidity compared with that of 2009. this widespread increase in liquidity was attributable in part to the programs in the United States to expand its liquidity during the second half of the year. that fact, combined with decreased risk levels (measured in terms of the premiums on 5-year credit-default swap contracts) of selected Latin american countries, including Brazil, chile, colombia, mexico, Panama, and Peru, enhanced the attraction to the region as an investment destination. the region received somewhat increased net inflows of external financing, which included both foreign direct investment (FDI) and portfolio investment inflows (plus growth in the external resources raised by private-sector corporations), from 1.6% of
Latin america and canada—2010 1.3
the regional GdP in 2009 to 1.8% of the regional GdP in 2010. Most of the increased inflow of investment in the region went to countries that were more integrated into external financial markets and were bond issuers, including Brazil, chile, mexico, Peru and, to a lesser extent, colombia. the external account balances of some central american and caribbean countries, which had used Fdi as a primary source for persistent current account deficit financing, revealed the continued economic fragility of certain countries owing to both external factors and domestic difficulties (Economic Commission for Latin America and the caribbean, 2011, p. 56).
In Latin America, gross fixed capital investment increased by 9.9% in 2010 compared with that of 2009 owing to increased investment in machinery and equipment (primarily imported), national currency appreciation, widely available credit, and higher capacity utilization rates along with greatly increasing demand. Gross fixed capital as a percentage of the GDP increased in 2010 compared with that of 2009 in argentina, Bolivia, Brazil, chile, the dominican republic, ecuador, Haiti, Honduras, Panama, Paraguay, Peru, and Uruguay. the investment rate in some of the countries of Latin america exceeded 25%, but that of the majority of countries was between about 15% and 25%.
the chilean copper Study center (ceScO) projected that investments in the Latin american mineral industry will total $327 billion in the period between 2011 and 2020. investment values (including all investments in mining, but excluding investments in energy and exploration) were estimated to be distributed as $75 billion in chile, $58 billion in Brazil, $56 billion in Peru, $22 billion in colombia, $13 billion in mexico, $10 billion in argentina, $7 billion in ecuador, and $4 billion in Panama, with the remainder presumably distributed among other nations of Latin america. the outlook was attributed in part to the rise of the emerging countries’ share of the world GdP, which had risen from about 20% in 2003 to about 30% in 2010 and was projected to reach about 40% by 2016 (centro de estudios del cobre y la mineria, 2011, p. 5; Henriquez, 2011).
as a result of increased domestic demand, the import volume of goods and services increased by about 21% for the region, but the volume of net exports decreased. exports had increased in terms of value in the region’s mineral exporting countries (and some hydrocarbon-exporting countries), but this was primarily owing to higher export prices rather than export volumes. exports from Brazil, however, rose because of an increase in the export volume of commodities in general and manufactured goods. The export volume decreased in Venezuela because of declining oil production (economic commission for Latin america and the caribbean, 2011, p. 43).
rising international prices for raw materials led to a significant increase in national revenue for net mineral commodity exporting countries compared with revenue in 2009, but that worsened the terms of trade for the countries that were net importers of fuel, such as some central american countries. emigrant remittances were recovering in several countries and increased in the dominican republic and el Salvador compared with those of 2009.
chinese investment in Latin america increased in 2010 as chinese companies secured interests in some large late-stage
mineral projects. china was the third ranked investor in Latin america in 2010 and invested greater than $15 billion (or about 9% of china’s total Fdi) in the region, more than 90% of which was directed to the extractive industries. more than one-half of china’s investment in natural resources had been directed to Latin america and was concentrated on more than 30 projects, primarily in South america. For the period 2003–11, Brazil (24%) and Peru (10%) were the first and fourth ranked global destinations for chinese investment, respectively (of those countries for which data were available). in terms of the value of china’s investment in the mineral industries of the countries of Latin america, Brazil was by far the leading recipient with about $11.5 billion, followed by Peru ($4.9 billion), Guyana ($1 billion), Argentina ($47 million), Venezuela ($15 million), colombia ($10 million), and Bolivia ($2 million). For that same period, 59% of chinese Fdi in South america was accounted for by metals and 4% was accounted for by coal, crude oil, and natural gas combined (Kotschwar and others, 2012, p. 22).
the Government of china had loaned greater than $32 billion to the Government of Venezuela since 2007 for infrastructure and oil projects in the Orinoco tar sand; Venezuela planned to pay off its debt in oil at cut-rate prices. the Orinoco tar sand was estimated to contain greater than 500 billion barrels of recoverable heavy crude and could represent the world’s largest oil petroleum reserve. It was reported that Venezuela sent about 460,000 barrels per day (about 20% of its oil exports) to china in recent years and that there were concerns that the arrangement could drive Venezuela into bankruptcy. The loans (some $23 million of which had gone unaccounted for) were criticized by some as reflecting poor management, and the legality of the loans had been brought into question. in 2010, the chinese Government along with the china development Bank (cdB) loaned $1 billion to the ecuadorian Government in exchange for petroleum deliveries just 2 months after the ecuadorian Government and the export import Bank of china signed a $1.7 billion deal to finance a hydroelectric project in ecuador. Because of previous defaults on international debt by Ecuador and Venezuela, gaining access to such large amounts of capital would have been extremely difficult had they not been able to obtain financing from China, because virtually no lending opportunities would have been available elsewhere (Jacob, 2010; Hearn, 2012; Kotschwar and others, 2012, p. 3, 21).
the international monetary Fund outlook for 2011 predicted that the canadian economy would grow by 2.8%, but risks to that growth included the increase in domestic household debt (much of which had been incurred during the stimulus period) and a slow recovery of the U.S. economy. the risk of higher international prices for crude oil in 2011 was a concern globally but was expected to be potentially beneficial for Canada in the short term because the country was a net oil exporter; the short-term benefit could be offset by the negative effect of higher oil prices on global economic growth and, therefore, the canadian dollar. concern regarding the possibility of a worsening european sovereign debt crisis, which began to unfold in 2009 and intensified in 2010, was also seen as a potential source of weakened external demand that could slow economic growth in canada in 2011 (international monetary Fund, 2011, p. vii, 3, 11–12).
1.4 U.S. GEOLOGICAL SURVEY MINERALS YEARBOOK—2010
the deteriorating sovereign debt situation in europe had not been a significant problem for Latin America through 2010. it was thought, however, that if the situation continued to devolve in 2011, that lending from banks in the euro area, which accounted, on average, for one-quarter of the banking assets in the larger Latin american countries, could be diminished and trigger a credit crunch in Latin america (eyzaguirre, 2012).
High inflation rates and excess production capacity were risks in some emerging economies owing to favorable external financial conditions, macroeconomic stimulus policies in some countries that had not been normalized after the economic crisis of 2008–9 and were thus still in effect, and improving terms of trade for some countries. Global economic growth risks that were a concern for 2011 in Latin america included uncertainty in petroleum supply and high petroleum prices that could force prices for other mineral commodities exported from Latin america to decline (economic commission for Latin america and the caribbean, 2011, p. 9; international monetary Fund, 2011, p. vii, 3).
Legislation
argentine lawmakers approved a law in 2010 that restricts mining and industrial activity on Andean glacial fields. A similar law was approved in 2008 but was vetoed by the President, who had indicated she would not veto the 2010 legislation. Barrick Gold corp. of canada, which was developing the Pascua Lama gold-silver-copper project at an elevation above 3,800 meters in the andes mountains between argentina and chile, indicated that the legislation would not affect development of the project (Hill, 2010).
Both houses of the chilean legislature had approved a bill to increase the mining royalty rates from the current rate of 4% to 5% of product revenue. the bill initially set a royalty of between 4% and 9% of product revenue on a sliding scale through 2012, returning to the current rate of 4% to 5% from 2013 through 2017, and then moving to a sliding scale of 5% to 14% from 2018 through 2023. the bill needed to be signed into law before the legislation could become effective (russo, 2010).
in 2010, much of canada’s legislation was aimed at stimulating the country’s economy. the 2010 Federal budget extended the temporary 15% mineral exploration tax credit for another year to march 2011 as a means of maintaining revenues generated by the high level of mineral exploration investment in the country. the program applied to preliminary exploration activities conducted at or above the ground surface. the canadian Government allocated about $12 million during a 2-year period to renew the targeted Geoscience initiative, with a focus on developing new methods for exploring deep mineral deposits. the budget provided about $11 million to streamline the review process for resource projects and decrease the regulatory burden (Kosich, 2010b).
at the Provincial level in canada, the government of British columbia announced a ban on mining and development activities in the Flathead Valley. In February 2010, the governor of montana and the premier of British columbia signed a memorandum of understanding (mOU) prohibiting future development of coal, gold, and oil and gas in southeastern British columbia, north of Glacier national Park. the mOU
also halted ongoing exploration in the area by several mining companies. tax revenue-sharing agreements were signed during 2010 between the Provincial government and First nations entities. the Quebec government implemented changes to the Province’s mining tax. the new tax plan as reported in the 2010 Provincial budget in march increased the tax rate from 12% to 14% for the remainder of 2010, 15% for 2011, and 16% for 2012. For tax purposes, mine operators are now required to compute annual profit separately for each mine (Kosich, 2010a; Suarez, 2010; testa, 2010).
Several central american countries were restricting new mining projects. costa rican lawmakers voted in november 2010 to ban all new open pit mining projects. the costa rican President was expected to sign the bill into law, as she had previously placed a moratorium on mining after taking office in may 2010. the President of el Salvador had not approved new mining permits since 2008, and expressed interest in banning precious metal mining. Guatemala and Honduras were temporarily restricting new exploration and mining permits until new mining legislation has been passed (Josephs, 2010; thomson reuters, 2010).
Exploration
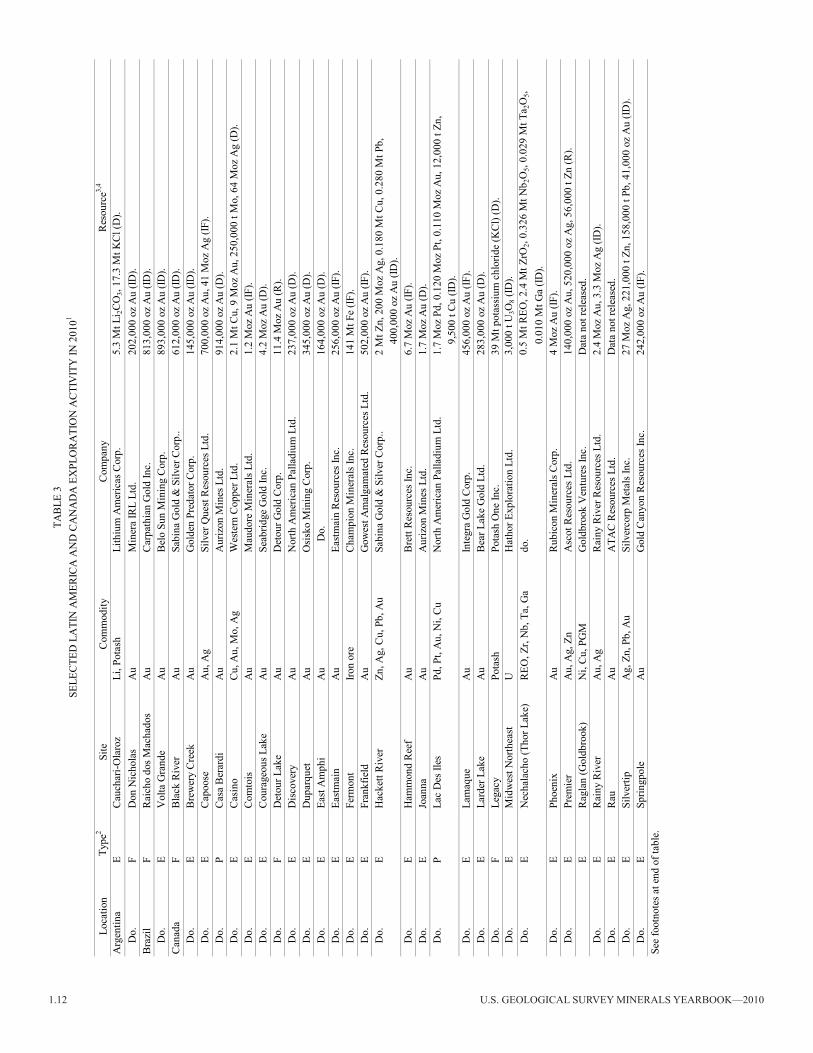
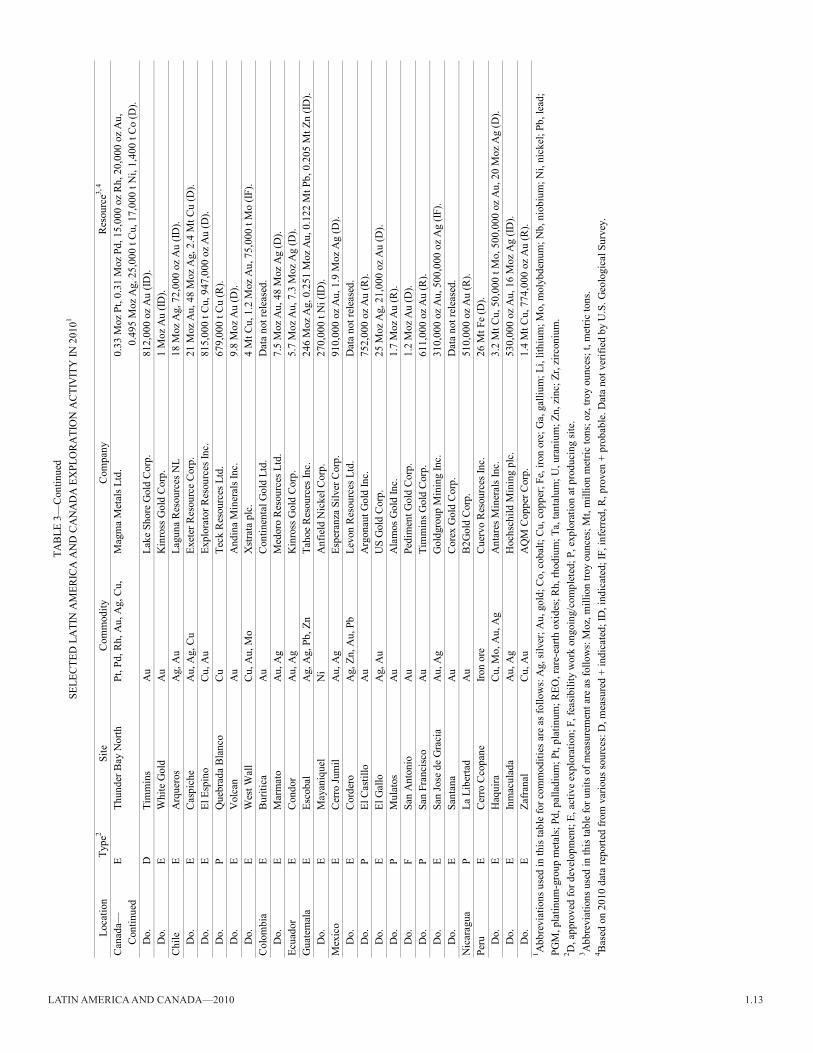
the estimated exploration budget for Latin america in 2010 [as determined by the metals economics Group (meG) of canada for nonferrous and nonfuel minerals, and excluding most industrial minerals] was about $2.9 billion (based on data from 2,213 companies), which accounted for about 27% of the estimated total world exploration budget. recent discoveries in argentina and chile had directed exploration into areas where exploration costs are relatively high because of the remoteness of the area. argentina, Brazil, chile, mexico, and Peru were included on the meG’s list of top 10 countries for anticipated exploration spending in 2010. On the basis of data compiled for this report, Latin american countries with the greatest exploration activity were, in descending order by number of sites for which data were compiled, mexico, Brazil, Peru, argentina, chile, and colombia. Gold attracted about 38% of total exploration activity; base metals, 29%; and silver, about 13%. Investment in 2010 was primarily used to further define early-stage resources (70%), conduct exploration at a producing site (14%), conduct feasibility studies of promising discoveries (11%), and further explore for resources of deposits under development (5%) (metals economics Group, 2010a, c).
exploration activity in mexico has focused on precious metal, base-metal, and polymetallic deposits. Gold is the primary product in about 61% of the currently active exploration projects in mexico, and silver is the primary product in 28% of the active projects. exploration for precious metal and polymetallic mineral deposits has increased as a result of the successful development and commissioning of the following four mines in mexico during 2009 and 2010: the Palmarejo precious metal mine operated by coeur d’alene mines corp. of the United States, the Penasquito polymetallic mine operated by Goldcorp inc. of canada, the Pinos altos precious metals mine operated by agnico eagle mines Ltd. of canada, and the San Francisco gold mine operated by timmins Gold corp. of canada.
Latin america and canada—2010 1.5
canadian Government statistics on canadian mineral exploration released by natural resources canada as of december 2010 show revised 2010 exploration spending projections through the feasibility level at can$2.8 billion (US$2.7 billion). Of this total, gold and silver were projected to account for about can$1.5 billion; base metals, can$499 million; uranium, can$200 million, and diamond, can$153 million. the december projections were 27% higher than the group’s march 2010 estimate of can$2.2 billion (US$2.1 billion), although these adjusted figures may reflect increased exploration costs rather than a greater amount of exploration activity. in contrast, the meG reported budgeted exploration spending in canada for 2010 at US$2.0 billion, which amounted to about 19% of the estimated overall worldwide exploration budget (metals economics Group, 2010). canadian Government statistics as presented by natural resources canada, however, included planned exploration expenditures for a wider variety of minerals and materials than were included in the meG estimates. When the canadian Government’s exploration statistics are reconfigured to make them comparable with the meG statistics, the planned exploration budgets as reported in december 2010 by natural resources canada would be can$2.35 billion (US$2.28 billion), or about 17% higher than the initial budget estimate reported by the meG (natural resources canada, 2010, 2011).
company exploration budgets for 2010 as reported by the canadian Government as of december 2010 were greatest in the Provinces of Ontario (29% of the total exploration and deposit appraisal spending intention for canada), Quebec (20%), British columbia (12.5%), and Saskatchewan (11%), and in nunavut territory (10%). the canadian Provinces and territories with a 50% or more increase in exploration activity in 2010 compared with that of 2009 were new Brunswick (241% increase, primarily as a result of increased base- and precious-metal exploration), nova Scotia (161% increase, primarily as a result of increased exploration for base and precious metals, as well as other metals and nonmetals), northwest territories (124% increase, primarily as a result of increased exploration for base and precious metals and diamond), alberta (102% increase, primarily as a result of increased exploration for industrial minerals and coal), Yukon territory (73% increase, primarily as a result of increased exploration for gold and base metals), British columbia (63% increase, primarily as a result of increased exploration for base and precious metals, as well as other metals and nonmetals), Ontario (54% increase, primarily as a result of increased exploration for diamond and precious metals), Quebec (52% increase, primarily as a result of increased exploration for base and precious metals, lithium, and rare-earth elements), and nunavut territory (50% increase, primarily as a result of increased exploration for base metals, diamond, and iron ore) (natural resources canada, 2011).
canadian Provinces and territories with a decrease in exploration activity in 2010 from 2009 were manitoba (12% decrease, primarily as a result of decreased exploration for precious metals) and Saskatchewan (3% decrease, primarily as a result of decreased exploration for coal and uranium). Junior exploration companies accounted for about 53% of total
expenditures in 2010 compared with 61% in 2005, 65% in 2006, 67% in 2007, 65% in 2008, and 57% in 2009. in terms of mineral commodities being sought countrywide, precious metals received the largest exploration budget (53%), followed by base metals (18%), uranium and nonmetals (7%), and diamond (5%). coal, iron ore, and other minerals made up the remaining 17% (natural resources canada, 2011).
Based on meG statistics, canada’s share of the world nonfuel minerals exploration budget was about 19%. in 2010, about 53% of all companies exploring in canada were considered junior companies. the canadian Provinces and territories with the greatest exploration activity were, in descending order by number of active sites in 2010, Ontario, Quebec, British Columbia, Saskatchewan, Yukon Territory, Newfoundland, nunavut territory, manitoba, northwest territories, nova Scotia, new Brunswick, and alberta. Based on the site data, exploration for gold accounted for approximately 46% of canadian exploration in 2010; copper, about 14%; nickel and uranium, 6% each; lead and zinc combined and platinum-group metals, 4% each; and diamond, 3%. exploration for lithium, potash, and rare-earth elements increased significantly in 2010.
approximately 83% of all reported exploration sites were considered early-stage sites. Gold exploration in canada (based on the number of active sites reporting activity in 2010) was focused on British Columbia, Ontario, Quebec, and Yukon territory, and base-metal exploration was focused primarily on British columbia, manitoba, and Ontario. Uranium exploration took place primarily in Saskatchewan. exploration for rare-earth elements took place primarily in British columbia, newfoundland, northwest territories, and Quebec. Potash exploration took place in Quebec and Saskatchewan. exploration for lithium deposits took place in nova Scotia, Ontario, and Quebec (natural resources canada, 2011).
Commodity Overview
Metals
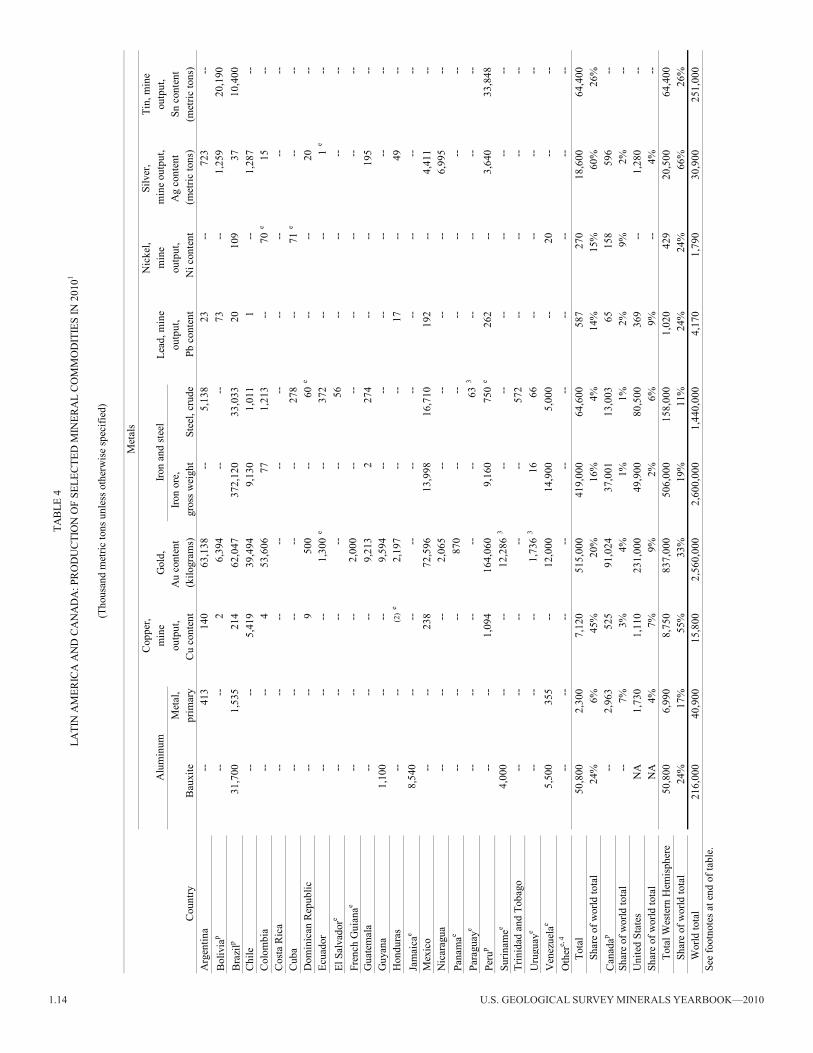
Aluminum and Bauxite and Alumina.—Aluminum.—World primary aluminum production increased by about 11% in 2010 compared with that of 2009. canada was the leading producer of primary aluminum in the region, accounting for about 7% of the world’s production. Latin america (primarily Brazil, but also including Argentina and Venezuela) accounted for about 6% of the world’s primary aluminum metal production. aluminum production was expected to increase in 2011, but demand and prices could affect production levels, depending on global economic trends as well as potentially rising fuel costs because aluminum production is energy intensive (tables 4, 6).
Statistical data from the international aluminium institute of the United Kingdom indicated that the average number of kilowatthours (kWh) required to produce 1 metric ton (t) of primary aluminum (that is, the power used for electrolysis and normal smelter auxiliaries up to the point where the liquid aluminum is tapped from the pots) had decreased from 16,951 kWh in 1980 to 16,093 kWh in 1990 and to 15,365 kWh in 2000; it was somewhat erratic in the 2000s (especially since 2005), and was at 15,496 kWh in 2010.
1.6 U.S. GEOLOGICAL SURVEY MINERALS YEARBOOK—2010
the energy sources used for production since 1980 have included coal, hydroelectric, natural gas, nuclear, and petroleum products. Hydroelectric power supplied between about 50% and 60% of the energy requirement for global primary aluminum production in 1980, 1990, and 2000, and about 65% by 2010. coal supplied 25%, 34%, and 32% of the energy needed for global primary aluminum production in 1980, 1990, and 2000, respectively, but this percentage had decreased to 23% in 2010. in South america only, hydroelectric power supplied about 94% of the energy requirement for aluminum production in 1980, 97% in 1990, 92% in 2000, and 84% in 2010. coal was not used as a power source in South america from 1980 through 2010, whereas the share of natural gas, which supplied 1.8% of that region’s energy requirement for primary aluminum production in 1980, increased to 16% by 2010. the use of petroleum products for primary aluminum production decreased sharply both globally and in South america from about 10% of the global share in 1980 to 0.1% in 2010 and from about 4.5% of South america’s share in 1980 to zero in 2010 (international aluminium institute, 2012).
Bauxite and Alumina.—Latin america accounted for about 24% of the world’s production of bauxite in 2010, of which Brazil accounted for about 15%. Brazil was the leading regional producer, accounting for about 62% of the regional production. Other bauxite producing countries in the region included Guyana (less than 1% of world production), Jamaica (4%), Suriname (1.9%), and Venezuela (2.6%). An estimated 6% increase in global bauxite production in 2010 was attributed to reopened, new, and (or) expanded mines in the world, including in Brazil and Jamaica. Global alumina production increased by 14%. South america and the caribbean were estimated to have 21% of the world’s bauxite resources (table 4; Bray, 2011).
Copper.—Ore.—Production of copper ore in Latin america and canada accounted for about 48% of the world output in 2010. the region was expected to increase its copper ore production capacity by about 18% by 2017 as production increases at existing operations and (or) new projects are commissioned in argentina, chile, colombia, ecuador, mexico, and Peru. in 2010, however, chile accounted for about 34% of global copper mine production [followed by Peru (7%) and canada (3%)], and chile’s escondida copper mine remained the world’s leading copper producer. Production at escondida mine (majority owned by BHP Billiton plc of the United Kingdom) decreased slightly in 2010 to 1.09 million metric tons (mt) of copper from 1.1 mt in 2009 after maintenance work at its electrowinning plants caused a reduction in copper cathode production. Brazil was expected to increase its copper output by about 2015 with the commissioning of several projects, primarily in the State of Para where production increases could be about 250,000 metric tons per year (t/yr). recent assessments of copper resources indicated 1.3 billion metric tons (Gt) of copper in discovered, mined, and undiscovered resources in the andes mountains of South america (tables 4, 8; cunningham and others, 2008; edelstein, 2011; Soto, 2011).
Refined Copper.—chile was the world’s leading producer of primary refined copper, and the country outpaced other producers in the region (including Bolivia, Brazil, canada, mexico, and Peru), accounting for 72% of the region’s output.
In 2010, Vale S.A. of Brazil, which had a 36% share of the refined copper market in Brazil, announced its intention to buy Paranapanema S.a., which was Brazil’s leading copper refining company and its second ranked producer of copper semimanufactures. Vale failed to win a majority share in the company and withdrew from the deal. Upon announcing its intention to acquire a majority share of Paranapanema, however, Vale reported that one of its midterm objectives was to become a leading world copper producing company (it was already the world’s leading iron ore producer). the company was developing two copper projects with startups scheduled in 2011; they were the Salobo project in carajas, Brazil, with a production capacity of 100,000 t/yr, and the Tres Valles project in chile, with a production capacity of 18,000 t/yr (tables 4, 9; engineering and mining Journal, 2010; murphy, 2010).
Gold.—Latin america and canada accounted for about 23% of the world’s production of gold in 2010. Peru and canada were the first and second ranked producers, respectively, in the region and together accounted for about 42% of regional production. canada’s production had declined since at least 2000, but was projected to increase by 2013 and to continue to do so for the foreseeable future thereafter, presuming the country’s economy recovers sufficiently to allow for operations that were suspended during the global economic crisis to resume production and (or) new projects come online (tables 4, 10).
Peru’s gold production decreased by about 13% in 2010 compared with that of 2009, primarily owing to lower grades being mined at the country’s largest gold mine, Yanacocha [which was jointly owned by operator newmont mining corp. of the United States (51.35%), compania de minas Buenaventura S.a.a. of Peru (43.65%), and the international Finance corp. (5%)]. Buenaventura’s most recent production unit, La Zanja [which was jointly owned by Buenaventura (53%) and newmont (47%)] started production in September 2010 and was expected to produce about 3,000 kilograms per year of gold. Buenaventura also held a 40% interest in the tanahuatay gold and silver project that was expected to produce about another 3,000 kilograms (kg) of gold and about 13,000 kg of silver annually (engineering and mining Journal, 2011).
Peru’s second largest gold mine was Barrick Lagunas norte mine, which produced about 25,000 kg of gold in 2010. Barrick’s other operation in Peru, Pierina mine, had been expected to shut down in 2009, but operations were extended until 2014. Gold Fields Ltd. of South africa operated the cerro corona gold-copper mine in cajamarca. the operation reached full production in 2009 and produced about 500 kg of gold and 43,000 t of copper in 2010. Gold production from artisanal and small miners in the madre de dios area of southeastern Peru accounted for about 19,000 kg in 2010 (engineering and mining Journal, 2011).
Iron Ore and Iron and Steel.—Iron Ore.—Latin america and canada accounted for about 16% of the world’s iron ore output in terms of gross weight. in terms of iron content, Brazil continued to be the leading producer in the region, accounting for about 81% of the region’s production of iron. in 2010, Brazil’s iron ore reserves were increased following the discovery of a significant iron ore deposit in the southwestern State of mato Grosso, which was reported to consist of an
Latin america and canada—2010 1.7
estimated 11.5 Gt of iron ore (grading 41% iron content) plus about 430 mt of phosphates. the newly discovered deposit would reportedly dwarf the country’s carajas mine, but the carajas mine had a higher grade ore (about 66% iron content). development of the mato Grosso discovery could cost hundreds of millions of dollars as the site is located in the interior of the country where there was no infrastructure for getting processed ores and products to the nearest ports (tables 4, 11; United Press international, 2010).
the government of mato Grosso committed to provide financial assistance with infrastructure developments for mato Grosso, and Brazil already had potential backers for other iron ore development projects, including the Government of china. china currently buys about 25 million metric tons per month of Brazilian iron ore (most of it from Vale, which was the world’s leading iron ore exporter), and Brazil earned about $12.4 billion from iron ore and concentrates exports in the first 7 months of 2010 (United Press international, 2010).
Steel.—in 2010, Latin america and canada accounted for 5% of the world’s production of crude steel. regionally, Brazil was the leading producer, accounting for 43% of the region’s production, followed by mexico (22%) and canada (17%). By august 2010, steel mills globally were increasing their stockpiles of iron ore in anticipation of increased demand in late 2010 and into 2011 as the global recession appeared to be easing. apparent world steel consumption increased by 13% in 2010.
interest in canada’s iron ore supply was increasing among some steel producers that sought a competitive alternative to the three companies that controlled about two-thirds of the global iron ore trade market—Vale, Rio Tinto Group of the United Kingdom, and BHP Billiton. in 2010, those three global leaders ended their practice of annual price-setting of iron ore supplies in favor of a quarterly price-setting system that could cause significant variability in the price of iron ore, which is a steel producer’s greatest expense.
Some industry analysts reported that steel companies would need to begin to invest in their own iron ore development projects to obtain a competitive edge in the iron ore market, and canada, although ranked only 8th among global iron ore producers, was attracting investment to its large deposits of iron ore. tata Steel of india, which was the world’s seventh ranked steel producer, announced that it had exercised an option to acquire 80% interest in a joint venture with canada’s new millennium capital corp. tata Steel proposed to make a nearly $300 million investment that would allow the joint venture to develop the dSO Project (a direct-shipping ore project). tata also was expected to evaluate investment in other lower grade iron ore (taconite) projects in canada.
Platinum-Group Metals.—canada and colombia were the only countries to produce any platinum-group metals (PGm) in the region in 2010. canada was the only palladium producer in the region, and it accounted for 78% of regional platinum production. the Lac des isles palladium and platinum mine in canada (owned by north american Palladium Ltd. of toronto, Ontario) reopened in april 2010 after having been placed on care-and-maintenance status in October 2008 owing to low metal prices. canada’s production of both commodities had decreased by about 50% since that time. Other producers of
PGM in Canada were Xstrata plc of Switzerland and Vale Ltd. of canada. Both companies produced PGm as byproducts from their nickel mining operations in Sudbury (tables 4, 14).
Tin.—in 2010, Peru was the leading tin mine producer in the region, accounting for about 14% of the world production of tin ore, followed by Bolivia (8%) and Brazil (4%). canada was not a tin producing country, but there were tin exploration projects underway in the country (tables 4, 15).
Zinc.—Peru was the leading zinc mine producer in the Latin america and canada region in 2010, accounting for about 43% of regional production and 12% of total world production. Other producers in the region included argentina, Bolivia, Brazil, canada, chile, Honduras, and mexico. Peru’s leading zinc mine, antamina, which is a copper zinc mine, was jointly owned by BHP Billiton Ltd. of australia, Xstrata, teck resources Ltd. of canada, and mitsubishi corp. of Japan. in 2010, the owners announced a $1.2 billion expansion that would extend the life of the mine to at least 2029 and increase output by up to 40% once the expansion was concluded. Yukon Zinc Corp. of Canada commissioned the mill at its Wolverine zinc mine in 2010 and was expected to reach design capacity of 1,700 metric tons per day (t/d) in 2012. the current mine life was 9.5 years based on a 5.2 mt deposit, and the operation was expected to produce, in order of volume, zinc, copper, and lead concentrates (table 4; Velez, 2009; Compania Minera Antamina, S.A., 2012; Yukon Zinc Corp., 2012).
Industrial Minerals
Diamond.—Canada was the only significant diamond mine producer in the Latin america and canada region in 2010, accounting for 98% of the regional total. Other countries in the region that were minor producers included Brazil, Guyana, and Venezuela. Globally, Canada was the world’s fourth ranked producer in terms of volume after russia, Botswana, and congo (Kinshasa), and was ranked third in terms of the value of production after Botswana and russia. canada’s diamond mine production was expected to increase starting in 2011 until at least 2017 as the Jericho mine, which had been on care-and-maintenance status since 2008, was expected to be restarted under new ownership, and as several new early-stage projects come online in 2013–16. the projected production would result in several additional thousand carats per year to the regional and global production totals (table 17; Kimberley Process, 2011).
Lithium.—in 2010, global production of lithium increased by 44% compared with that of 2009. the Latin america and canada region accounted for about 70% of world production. chile was the leading producer in the region, accounting for about 58% of the regional total, followed by argentina (39%) and Brazil (3%) (table 18).
argentina was the world’s fourth ranked producer of lithium, and the country’s Puna Plateau in northwestern argentina was estimated to contain more than 80% of the world’s lithium brine reserves. these evaporite brines, which are commonly referred to as salars, are an economical and plentiful source of lithium in aqueous solution that is pumped from aquifers (as well as being a source of commercially important boron and potassium) (Houston and others, 2011; Jaskula, 2011b).
1.8 U.S. GEOLOGICAL SURVEY MINERALS YEARBOOK—2010
the world’s largest tonnages of lithium and potassium in brines are located in the andes mountains of argentina, Bolivia, and chile, and in western china and tibet [Xizang] autonomous region. recent developments in the automotive industry and other industries that use lithium in manufacturing led to an exploration boom within the salars of the central andes, primarily because the brine bodies in china and tibet have a more complex chemistry that makes recovery of the contained elements more difficult and less economical (Houston and others, 2011).
in 2010, at least a dozen brine projects were at various stages of development in argentina. in december 2010, rincon Lithium Ltd. (owned by the Sentient Group of the United Kingdom) commenced its operation at the Salar del Rincón. the company was expected to produce 10,000 t/yr of lithium carbonate, 4,000 t/yr of lithium hydroxide, and 3,000 t/yr of lithium chloride. Orocobre Ltd. of australia entered into a joint-venture agreement with toyota tsusho corp. of Japan, which was a key supplier to toyota motor corp., Panasonic corp., and Sanyo electric co. Ltd.; the aim was to secure low-cost lithium to supply their partners in the automotive and battery industries. regional production was expected to increase by about 40% by 2017 (table 18; Houston and others, 2011; Jaskula, 2011a).
Mineral Fuels and Related Materials
Coal.—colombia was the regional leader in coal production in 2010 (followed by Canada, Mexico, Venezuela, and Brazil); it accounted for about 40% of regional production and 1% of global production. the colombian Government planned to seek up to $6.8 billion in private investment to expand production and increase the country’s output of coal to about 150 mt by 2020. the country was estimated to have about 24 Gt of coal reserves. Port capacity was expected to be increased to 151 million metric tons per year (mt/yr) in 2019 from 80.6 mt/yr. at yearend 2010, the total proven global reserves of coal were estimated to be about 860 Gt, of which the region composed of South and central america accounted for just 1.5%, and almost all of which was anthracite and bituminous coal from colombia. canada accounted for about 0.8% of global coal reserves composed of about equal amounts of (1) anthracite and bituminous and (2) subbituminous and lignite (tables 4, 19; BP p.l.c., 2012, p. 30).
Uranium.—in 2010, canada was the world’s second ranked producer of uranium, accounting for about 18% of total global output. the country had 17 nuclear reactors connected to its power grid, and its deuterium reactors supplied about 15% of the country’s electricity. France, which used about 12,000 t/yr of uranium oxide concentrate (10,500 t/yr of U), obtained about 4,500 t/yr of that supply from canada. cameco corp. was canada’s top uranium producer, and most of the company’s uranium came from the athabasca basin in northern Saskatchewan and alberta, which was the source of the world’s highest grade uranium (Gordon, 2012; natural resources canada, 2012; Organisation for economic co-operation and development, 2012; World nuclear association, 2012).
References Cited
angulo, m.a., 2011a, Boron: U.S. Geological Survey mineral commodity Summaries 2011, p. 32–33.
angulo, m.a., 2011b, iodine: U.S. Geological Survey mineral commodity Summaries 2011, p. 76–77.
BP p.l.c., 2012, Statistical review of world energy: London, United Kingdom, BP p.l.c., June, 49 p.
Bray, e.L. 2011, Bauxite and alumina: U.S. Geological Survey mineral commodity Summaries 2011, p. 26–27.
Brooks, W.e., 2011a, arsenic: U.S. Geological Survey mineral commodity Summaries 2011, p. 20–21.
Brooks, W.e., 2011b, Silver: U.S. Geological Survey mineral commodity Summaries 2011, p. 146–147.
carlin, J.F., Jr., 2011a, antimony: U.S. Geological Survey mineral commodity Summaries 2011, p. 17–19,
carlin, J.F., Jr., 2011b, Bismuth: U.S. Geological Survey mineral commodity Summaries 2011, p. 30–31.
centro de estudios del cobre y la mineria, 2011, copper supply and market outlook: centro de estudios del cobre y la mineria, may, 41 p. (accessed april 9, 2012, at http://cesco.cl/assets/docs/estudios-y-presentaciones/2011_cesco_copper_Supply_and_market_Outlook.pdf.)
cesa-Bianchi, ambrogio, Hashem Pesaran, m., rebucci alessandro, and Xu, t.t., 2011, china’s emergence in the world economy and business cycles in Latin america: Washington, dc, inter-american development Bank, September, 67 p.
comeback america initiative, the, 2011, comeback america initiative—Stanford University masters students announce sovereign fiscal responsibility index: comeback america initiative, the, march 23. (accessed april 1, 2012, at http://dzwired.com/testarea/cai/PdFs/032111_SFri_release_FinaL.pdf.)
compania minera antamina, S.a., 2012, cuatro empresas Peruanas inician labores en programa de expansion de antamina: compania minera antamina, S.a. (accessed april 4, 2012, at http://www.antamina.com/en/content.php?571/news_and_publications/cuatro_empresas_peruanas_inician_labores_programa_expansion_antamina.html.)
Cunningham, C.G., Zappettini, E.O., Vivallo S., Waldo, Celada, C.M., Quispe, Jorge, Singer, d.a., Briskey, J.a., Sutphin, d.m., Gajardo m., mariano, diaz, Alejandro, Portigliati, Carlos, Berger, V.I., Carrasco, Rodrigo, and Schulz, K.J., 2008, Quantitative mineral resource assessment of copper, molybdenum, gold, and silver in undiscovered porphyry copper deposits in the andes mountains of South america: U.S. Geological Survey Open-File report 2008–1253, 282 p. (accessed april 4, 2012, at http://pubs.usgs.gov/of/2008/1253/.)
economic commission for Latin america and the caribbean, 2011, Preliminary overview of the economies of Latin America and the Caribbean: New York, New York, United Nations, January, 157 p.
edelstein, d.L., 2011, copper: U.S. Geological Survey mineral commodity Summaries 2011, p. 48–49.
Engineering and Mining Journal, 2010, Vale bids for Paranapanema copper smelter/refinery: Engineering and Mining Journal, September 14. (accessed march 30, 2012, at http://www.e-mj.com/index.php/news/latin-america/494-vale-bids-for-paranapanema-copper-smelterrefinery.html.)
engineering and mining Journal, 2011, Peru’s large precious metals and copper producer: mining and engineering Journal, v. 212, no. 2, p. 66–73.
eyzaguirre, nicolas, 2012, Latin america—What’s ahead in 2012?: international monetary Fund. (accessed april 2, 2012, at http://idbdocs.iadb.org/wsdocs/getdocument.aspx?docnum=36397788.)
Gordon, Julie, 2012, top global producers of uranium: thomson reuters, march 14. (accessed march 6, 2012, at http://www.reuters.com/article/2011/03/14/japan-quake-uranium-idUSn1418047020110314.)
Hearn, Kelly, 2012, Chinese loans put Venezuela over barrel: The Washington times, February 21. (accessed april 8, 2012, at http://www.washingtontimes.com/news/2012/feb/21/chinese-loans-put-venezuela-over-barrel/?page=1.)
Henriquez, Victor, 2011, Investment in Latin America to reach US$327bn in 2010-2011: Business news americas. (accessed april 7, 2012, at http://www.bnamericas.com/news/mining/investment-in-latin-america-to-reach-us327bn-in-2011-20.)
Hill, Liezel, 2010, argentina approves glacier protection law: creamer media’s mining Weekly, October 29. (accessed november 1, 2010, at http://www.miningweekly.com/print-version/india-has-lofty-goals-with-new-mining-law-2010-10-29.html.)
Latin america and canada—2010 1.9
Houston, John, Butcher, andrew, ehren, Peter, evans, Keith, and Godfrey, Linda, 2011, the evaluation of brine prospects and the requirement for modifications to filing standards: Economic Geology, v. 106, p. 1225–1239.
international aluminium institute, 2012, Historical iai statistics: international aluminium institute. (accessed april 6, 2012, at https://stats.world-aluminium.org/iai/stats_new/index.asp.)
international monetary Fund, 2011, regional economic outlook—Western Hemisphere: international monetary Fund, april, 96 p.
Jacob, Jijo, 2010, ecuador, china sign $1 billion cash-for-crude loan deal: international Business times. (accessed april 9, 2012, at http://www.ibtimes.com/articles/48140/20100901/ecuador-china-energy-crude-latin-america-petrochina-petroecuador-opec-loan.htm.)
Jaskula, B.W., 2011a, Lithium, in metals and minerals: U.S. Geological Survey Minerals Yearbook 2010, v. I, p. 44.1–44.11. (Accessed april 9, 2012, at http://minerals.usgs.gov/minerals/pubs/commodity/lithium/myb1-2010-lithi.pdf.)
Jaskula, B.W., 2011b, Lithium: U.S. Geological Survey mineral commodity Summaries 2011, p. 94–95.
Jorgenson, J.d., 2011, iron ore: U.S. Geological Survey mineral commodity Summaries 2011, p. 84–85.
Josephs, Leslie, 2010, Some central american countries put breaks [sic] on mining: thomson reuters, June 2. (accessed February 18, 2011, at http://www.reuters.com/assets/print?aid=USn0213554520100602.)
Kimberley Process, 2011, annual global summary—2010 production, imports, exports and KPc counts: Kimberley Process, 1 p. (accessed april 5, 2012, at https://kimberleyprocessstatistics.org/static/pdfs/public_statistics/2010/2010GlobalSummary.pdf.)
Kosich, dorothy, 2010a, B.c. Government, First nations sign historic mining tax agreements: mineweb, august 26. (accessed april 28, 2010, via http://www.mineweb.com/mineweb/view/mineweb/en/ page68?oid=110303&sn=detail&pid=92730.)
Kosich, dorothy, 2010b, canadian mining associations praise federal budget mining initiatives: mineweb, march 5. (accessed march 5, 2010, via http://www.mineweb.com/mineweb/view/mineweb/en/ page72068?oid=100097&sn=detail&pid=65.)
Kotschwar, Barbara, moran, t.H., muir, Julia, 2012, chinese investment in Latin american resources—the good, the bad, and the ugly: Washington, dc, Peterson institute for international economics, February, 36 p.
metals economics Group, 2010, Overview of 2010 worldwide exploration budgets—Locations, targets, and stages of development: Strategic report, v. 21, no. 6, november/december, p. 7–15.
metals economics Group, 2010a, trends in worldwide exploration budgets: Strategic report, v. 23, no. 6, november/december, p. 1–4.
metals economics Group, 2010b, Overview of trends among surveyed companies: Strategic report, v. 23, no. 6, november/december, p. 5–10.
miller, m.m., 2011, Fluorspar: U.S. Geological Survey mineral commodity Summaries 2011, p. 56–57.
murphy, Peter, 2010, Brazil copper output to surge by 2014: thompson reuters. (accessed april 1, 2012, at http://uk.reuters.com/article/2010/10/04/idUKn0424006520101004.)
natural resources canada, 2010, canadian mineral exploration and deposit appraisal expenditures slump in 2009, optimism for 2010: natural resources canada information Bulletin, march, 2 p. (accessed February 16, 2011, at http://www.rncan-nrcan.gc.ca./smm-mms/busi-indu/pdf/exploration10eweb.pdf.)
natural resources canada, 2011, mineral exploration: natural resources canada. (accessed February 6, 2011, at http://mmsd.mms.nrcan.gc.ca/stat-stat/expl-expl/sta-sta-eng.aspx.)
natural resources canada, 2012, Uranium: natural resources canada. (accessed march 16, 2012, at http://www.nrcan.gc.ca/energy/sources/uranium-nuclear/1190.)
Organisation for economic co-operation and development, 2012, nuclear energy generation and nuclear power plants: Organisation for economic co-operation and development. (accessed march 16, 2012, at http://www.oecd-ilibrary.org/nuclear-energy/nuclear-energy-generation-and-nuclear-power-plants_20758413-table1.)
Papp, J.F., 2011, niobium (columbium): U.S. Geological Survey mineral commodity Summaries 2011, p. 110–111.
russo, camila, 2010, chile set to slide in global mining ranking on tax increase, Fraser says: Bloomberg L.P. (accessed October 18, 2010, at http://www.bloomsberg.com/news/print/2010-10-15/chile-set-to-slide-in-global-mining-ranking-on-tax-increase-fraser-says.html.)
Soto, alonso, 2011, escondida’s copper output down sligthly [sic] in 2010: thomson reuters, February 14. (accessed april 2, 2012, at http://www.reuters.com/article/2011/02/14/chile-escondida-output-idUSn1425785420110214.)
Suarez, Steve, 2010, 2010 Quebec budget changes to mining tax regime: infomine, 3 p. (accessed december 10, 2010, at http://www.infomine.com/publications/docs/2010quebec.pdf.)
testa, dan, 2010, Schweitzer—B.c. Premier resignation won’t impact north Fork deal: Flathead Beacon [Kalispell, montana], december 13. (accessed December 14, 2010, at http://www.flatheadbeacon.com/articles/article/schweitzer_b.c._premier_resignation_wont_impact_north_fork_deal/20606.)
thomson reuters, 2010, Japan in pact for rare earth exploration in namibia: thomson reuters, July 30. (accessed august 2, 2010, at http://af.reuters.com/article/topnews/idaFJOe66t06520100730.)
United Press international, 2010, Brazil iron ore reserved keep multiplying: United Press international, September. (accessed march 29, 2012, at http://www.upi.com/Business_news/energy-resources/2010/09/02/Brazil-iron-ore-reserves-keep-multiplying/UPi-43901283439202/0.)
Velez, Patricia, 2009, Update 1—Antamina says $1.2 bln expansion nearly approved: thomson reuters. (accessed april 1, 2012, at http://af.reuters.com/article/metalsnews/idaFn2919562820091229.)
World nuclear association, 2012, nuclear power in France: World nuclear association. (accessed march 16, 2012, at http://www.world-nuclear.org/info/inf40.html).
Yukon Zinc Corp., 2012, Wolverine Mine: Yukon Zinc Corp. (Accessed april 5, 2012, at http://yukonzinc.com/en/operations_index.cfm.)
1.10 U.S. GEOLOGICAL SURVEY MINERALS YEARBOOK—2010
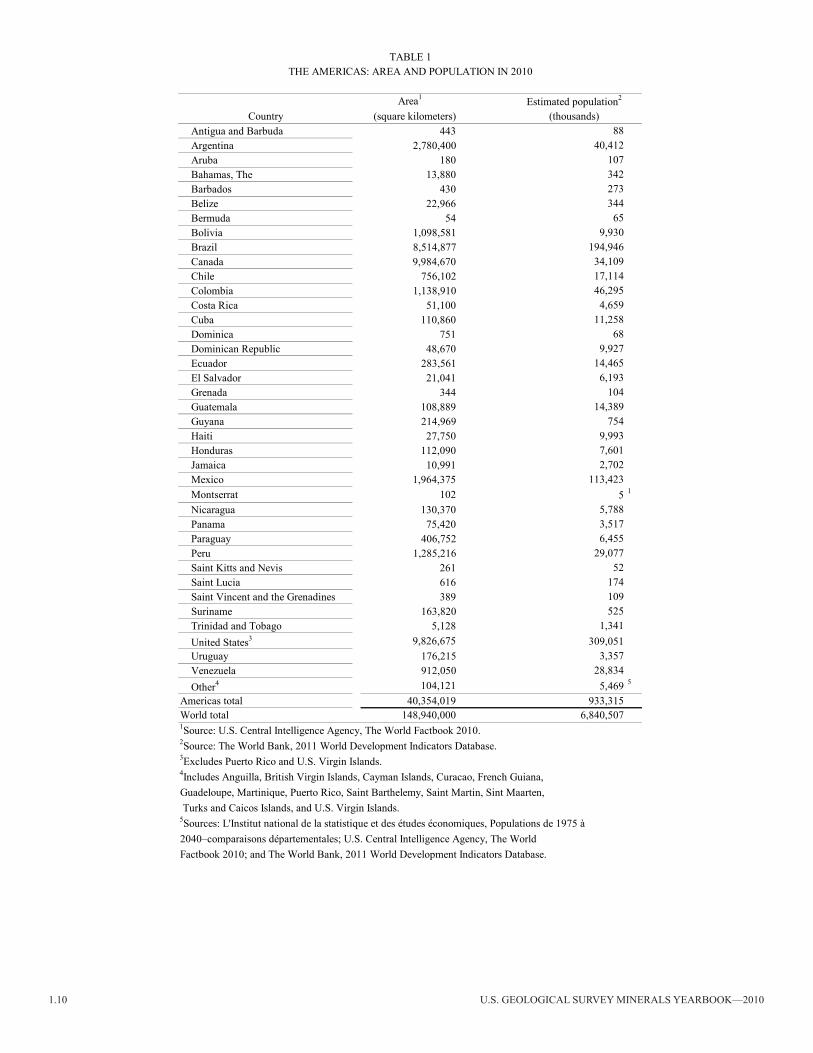
area1
country (square kilometers)antigua and Barbuda 443 88argentina 2,780,400 40,412aruba 180 107Bahamas, the 13,880 342Barbados 430 273Belize 22,966 344Bermuda 54 65Bolivia 1,098,581 9,930Brazil 8,514,877 194,946canada 9,984,670 34,109chile 756,102 17,114colombia 1,138,910 46,295costa rica 51,100 4,659cuba 110,860 11,258dominica 751 68dominican republic 48,670 9,927ecuador 283,561 14,465el Salvador 21,041 6,193Grenada 344 104Guatemala 108,889 14,389Guyana 214,969 754Haiti 27,750 9,993Honduras 112,090 7,601Jamaica 10,991 2,702mexico 1,964,375 113,423montserrat 102 5 1
nicaragua 130,370 5,788Panama 75,420 3,517Paraguay 406,752 6,455Peru 1,285,216 29,077Saint Kitts and nevis 261 52Saint Lucia 616 174Saint Vincent and the Grenadines 389 109Suriname 163,820 525trinidad and tobago 5,128 1,341United States3 9,826,675 309,051Uruguay 176,215 3,357Venezuela 912,050 28,834Other4 104,121 5,469 5
americas total 40,354,019 933,315World total 148,940,000 6,840,507
(thousands)
taBLe 1tHe americaS: area and POPULatiOn in 2010
estimated population2
5Sources: L'Institut national de la statistique et des études économiques, Populations de 1975 à 2040–comparaisons départementales; U.S. Central Intelligence Agency, The WorldFactbook 2010; and the World Bank, 2011 World development indicators database.
1Source: U.S. central intelligence agency, the World Factbook 2010.2Source: the World Bank, 2011 World development indicators database.3Excludes Puerto Rico and U.S. Virgin Islands.4Includes Anguilla, British Virgin Islands, Cayman Islands, Curacao, French Guiana, Guadeloupe, martinique, Puerto rico, Saint Barthelemy, Saint martin, Sint maarten, Turks and Caicos Islands, and U.S. Virgin Islands.
Latin america and canada—2010 1.11
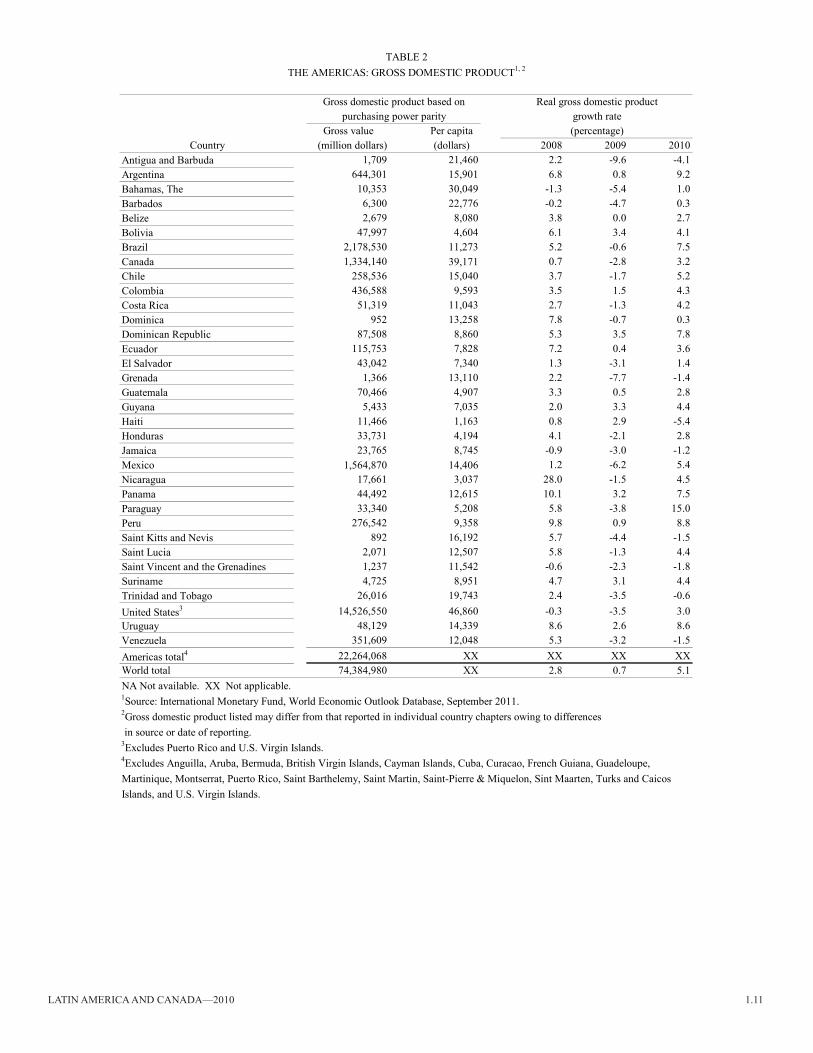
Gross value Per capitacountry (million dollars) (dollars) 2008 2009 2010
antigua and Barbuda 1,709 21,460 2.2 -9.6 -4.1argentina 644,301 15,901 6.8 0.8 9.2Bahamas, the 10,353 30,049 -1.3 -5.4 1.0Barbados 6,300 22,776 -0.2 -4.7 0.3Belize 2,679 8,080 3.8 0.0 2.7Bolivia 47,997 4,604 6.1 3.4 4.1Brazil 2,178,530 11,273 5.2 -0.6 7.5canada 1,334,140 39,171 0.7 -2.8 3.2chile 258,536 15,040 3.7 -1.7 5.2colombia 436,588 9,593 3.5 1.5 4.3costa rica 51,319 11,043 2.7 -1.3 4.2dominica 952 13,258 7.8 -0.7 0.3dominican republic 87,508 8,860 5.3 3.5 7.8ecuador 115,753 7,828 7.2 0.4 3.6el Salvador 43,042 7,340 1.3 -3.1 1.4Grenada 1,366 13,110 2.2 -7.7 -1.4Guatemala 70,466 4,907 3.3 0.5 2.8Guyana 5,433 7,035 2.0 3.3 4.4Haiti 11,466 1,163 0.8 2.9 -5.4Honduras 33,731 4,194 4.1 -2.1 2.8Jamaica 23,765 8,745 -0.9 -3.0 -1.2mexico 1,564,870 14,406 1.2 -6.2 5.4nicaragua 17,661 3,037 28.0 -1.5 4.5Panama 44,492 12,615 10.1 3.2 7.5Paraguay 33,340 5,208 5.8 -3.8 15.0Peru 276,542 9,358 9.8 0.9 8.8Saint Kitts and nevis 892 16,192 5.7 -4.4 -1.5Saint Lucia 2,071 12,507 5.8 -1.3 4.4Saint Vincent and the Grenadines 1,237 11,542 -0.6 -2.3 -1.8Suriname 4,725 8,951 4.7 3.1 4.4trinidad and tobago 26,016 19,743 2.4 -3.5 -0.6United States3 14,526,550 46,860 -0.3 -3.5 3.0Uruguay 48,129 14,339 8.6 2.6 8.6Venezuela 351,609 12,048 5.3 -3.2 -1.5americas total4 22,264,068 XX XX XX XXWorld total 74,384,980 XX 2.8 0.7 5.1
4Excludes Anguilla, Aruba, Bermuda, British Virgin Islands, Cayman Islands, Cuba, Curacao, French Guiana, Guadeloupe,
growth rate
Islands, and U.S. Virgin Islands.
na not available. XX not applicable. 1Source: international monetary Fund, World economic Outlook database, September 2011.2Gross domestic product listed may differ from that reported in individual country chapters owing to differences in source or date of reporting.
martinique, montserrat, Puerto rico, Saint Barthelemy, Saint martin, Saint-Pierre & miquelon, Sint maarten, turks and caicos
purchasing power parity
3Excludes Puerto Rico and U.S. Virgin Islands.
(percentage)
taBLe 2tHe americaS: GrOSS dOmeStic PrOdUct1, 2
Gross domestic product based on real gross domestic product
1.12 U.S. GEOLOGICAL SURVEY MINERALS YEARBOOK—2010
Loca
tion
type
2Si
tec
omm
odity
com
pany
res
ourc
e3,4
arg
entin
ae
cau
char
i-Ola
roz
Li, P
otas
hLi
thiu
m a
mer
icas
cor
p.5.
3 m
t Li 2c
O3,
17.3
mt K
cl (
d).
do.
Fd
on n
icho
las
au
min
era
irL
Ltd.
202,
000
oz a
u (id
).B
razi
lF
rai
cho
dos m
acha
dos
au
car
path
ian
Gol
d in
c.81
3,00
0 oz
au
(id).
do.
eV
olta
Gra
nde
au
Bel
o Su
n m
inin
g c
orp.
893,
000
oz a
u (id
).c
anad
aF
Bla
ck r
iver
au
Sabi
na G
old
& S
ilver
cor
p..
612,
000
oz a
u (id
).d
o.e
Bre
wer
y c
reek
au
Gol
den
Pred
ator
cor
p.14
5,00
0 oz
au
(id).
do.
ec
apoo
sea
u, a
gSi
lver
Que
st r
esou
rces
Ltd
.70
0,00
0 oz
au,
41
moz
ag
(iF).
do.
Pc
asa
Ber
ardi
au
aur
izon
min
es L
td.
914,
000
oz a
u (d
).d
o.e
cas
ino
cu,
au,
mo,
ag
Wes
tern
cop
per L
td.
2.1
mt c
u, 9
moz
au,
250
,000
t m
o, 6
4 m
oz a
g (d
).d
o.e
com
tois
au
mau
dore
min
eral
s Ltd
.1.
2 m
oz a
u (iF
).d
o.e
cou
rage
ous L
ake
au
Seab
ridge
Gol
d in
c.4.
2 m
oz a
u (d
).d
o.F
det
our L
ake
au
det
our G
old
cor
p.11
.4 m
oz a
u (r
).d
o.e
dis
cove
rya
un
orth
am
eric
an P
alla
dium
Ltd
.23
7,00
0 oz
au
(d).
do.
ed
upar
quet
au
Osi
sko
min
ing
cor
p.34
5,00
0 oz
au
(d).
do.
eea
st a
mph
ia
ud
o.16
4,00
0 oz
au
(d).
do.
eea
stm
ain
au
east
mai
n r
esou
rces
inc.
256,
000
oz a
u (iF
).d
o.e
Ferm
ont
iron
ore
cha
mpi
on m
iner
als i
nc.
141
mt F
e (iF
).d
o.e
Fran
kfie
lda
uG
owes
t am
alga
mat
ed r
esou
rces
Ltd
.50
2,00
0 oz
au
(iF).
do.
eH
acke
tt r
iver
Zn, a
g, c
u, P
b, a
uSa
bina
Gol
d &
Silv
er c
orp.
.2
mt Z
n, 2
00 m
oz a
g, 0
.180
mt c
u, 0
.280
mt P
b,
400,
000
oz a
u (id
).d
o.e
Ham
mon
d r
eef
au
Bre
tt r
esou
rces
inc.
6.7
moz
au
(iF).
do.
eJo
anna
au
aur
izon
min
es L
td.
1.7
moz
au
(d).
do.
PLa
c d
es il
esPd
, Pt,
au,
ni,
cu
nor
th a
mer
ican
Pal
ladi
um L
td.
1.7
moz
Pd,
0.1
20 m
oz P
t, 0.
110
moz
au,
12,
000
t Zn,
9,
500
t cu
(id).
do.
eLa
maq
uea
uin
tegr
a G
old
cor
p.45
6,00
0 oz
au
(iF).
do.
eLa
rder
Lak
ea
uB
ear L
ake
Gol
d Lt
d.28
3,00
0 oz
au
(d).
do.
FLe
gacy
Pota
shPo
tash
One
inc.
39 m
t pot
assi
um c
hlor
ide
(Kc
l) (d
).d
o.e
mid
wes
t nor
thea
stU
Hat
hor e
xplo
ratio
n Lt
d.3,
000
t U3O
8 (id
).d
o.e
nec
hala
cho
(tho
r Lak
e)r
eO, Z
r, n
b, t
a, G
ado
.0.
5 m
t reO
, 2.4
mt Z
rO2,
0.32
6 m
t nb 2
O5,
0.02
9 m
t ta 2
O5,
0.01
0 m
t Ga
(id).
do.
ePh
oeni
xa
ur
ubic
on m
iner
als c
orp.
4 m
oz a
u (iF
).d
o.e
Prem
ier
au,
ag,
Zn
asc
ot r
esou
rces
Ltd
.14
0,00
0 oz
au,
520
,000
oz
ag,
56,
000
t Zn
(r).
er
agla
n (G
oldb
rook
)n
i, c
u, P
Gm
Gol
dbro
ok V
entu
res I
nc.
dat
a no
t rel
ease
d.d
o.e
rai
ny r
iver
au,
ag
rai
ny r
iver
res
ourc
es L
td.
2.4
moz
au,
3.3
moz
ag
(id).
do.
er
aua
ua
tac
res
ourc
es L
td.
dat
a no
t rel
ease
d.d
o.e
Silv
ertip
ag,
Zn,
Pb,
au
Silv
erco
rp m
etal
s inc
.27
moz
ag,
221
,000
t Zn
, 158
,000
t Pb
, 41,
000
oz a
u (id
).d
o.e
Sprin
gpol
ea
uG
old
can
yon
res
ourc
es in
c.24
2,00
0 oz
au
(iF).
taB
Le 3
SELE
CTE
D L
ATI
N A
MER
ICA
AN
D C
AN
AD
A E
XPL
OR
ATI
ON
AC
TIV
ITY
IN 2
0101
See
foot
note
s at e
nd o
f tab
le.
Latin america and canada—2010 1.13
Loca
tion
type
2Si
tec
omm
odity
com
pany
res
ourc
e3, 4
can
ada—
eth
unde
r Bay
nor
thPt
, Pd,
rh,
au,
ag,
cu,
m
agm
a m
etal
s Ltd
.0.
33 m
oz P
t, 0.
31 m
oz P
d, 1
5,00
0 oz
rh,
20,
000
oz a
u,
con
tinue
d0.
495
moz
ag,
25,
000
t cu,
17,
000
t ni,
1,40
0 t c
o (d
).d
o.d
tim
min
sa
uLa
ke S
hore
Gol
d c
orp.
812,
000
oz a
u (id
).d
o.e
Whi
te G
old
au
Kin
ross
Gol
d c
orp.
1 m
oz a
u (id
).c
hile
ea
rque
ros
ag,
au
Lagu
na r
esou
rces
nL
18 m
oz a
g, 7
2,00
0 oz
au
(id).
do.
ec
aspi
che
au,
ag,
cu
exet
er r
esou
rce
cor
p.21
moz
au,
48
moz
ag,
2.4
mt c
u (d
).d
o.e
el e
spin
oc
u, a
uex
plor
ator
res
ourc
es in
c.81
5,00
0 t c
u, 9
47,0
00 o
z a
u (d
).d
o.P
Que
brad
a B
lanc
oc
ute
ck r
esou
rces
Ltd
.67
9,00
0 t c
u (r
).d
o.e
Vol
can
au
and
ina
min
eral
s inc
.9.
8 m
oz a
u (d
).d
o.e
Wes
t Wal
lc
u, a
u, m
oX
stra
ta p
lc.
4 m
t cu,
1.2
moz
au,
75,
000
t mo
(iF).
col
ombi
ae
Bur
itica
au
con
tinen
tal G
old
Ltd.
dat
a no
t rel
ease
d.d
o.e
mar
mat
oa
u, a
gm
edor
o r
esou
rces
Ltd
.7.
5 m
oz a
u, 4
8 m
oz a
g (d
).ec
uado
re
con
dor
au,
ag
Kin
ross
Gol
d c
orp.
5.7
moz
au,
7.3
moz
ag
(d).
Gua
tem
ala
ees
coba
la
g, a
g, P
b, Z
nta
hoe
res
ourc
es in
c.24
6 m
oz a
g, 0
.251
moz
au,
0.1
22 m
t Pb,
0.2
05 m
t Zn
(id).
do.
em
ayan
ique
ln
ia
nfie
ld n
icke
l cor
p.27
0,00
0 t n
i (id
).m
exic
oe
cer
ro Ju
mil
au,
ag
espe
ranz
a Si
lver
cor
p.91
0,00
0 oz
au,
1.9
moz
ag
(d).
do.
ec
orde
roa
g, Z
n, a
u, P
bLe
von
res
ourc
es L
td.
dat
a no
t rel
ease
d.d
o.P
el c
astil
loa
ua
rgon
aut G
old
inc.
752,
000
oz a
u (r
).d
o.e
el G
allo
ag,
au
US
Gol
d c
orp.
25 m
oz a
g, 2
1,00
0 oz
au
(d).
do.
Pm
ulat
osa
ua
lam
os G
old
inc.
1.7
moz
au
(r).
do.
FSa
n a
nton
ioa
uPe
dim
ent G
old
cor
p.1.
2 m
oz a
u (d
).d
o.P
San
Fran
cisc
oa
uti
mm
ins G
old
cor
p.61
1,00
0 oz
au
(r).
do.
eSa
n Jo
se d
e G
raci
aa
u, a
gG
oldg
roup
min
ing
inc.
310,
000
oz a
u, 5
00,0
00 o
z a
g (iF
).d
o.e
Sant
ana
au
cor
ex G
old
cor
p.d
ata
not r
elea
sed.
nic
arag
uaP
La L
iber
tad
au
B2G
old
cor
p.51
0,00
0 oz
au
(r).
Peru
ec
erro
cco
pane
iron
ore
cue
rvo
res
ourc
es in
c.26
mt F
e (d
).d
o.e
Haq
uira
cu,
mo,
au,
ag
ant
ares
min
eral
s inc
.3.
2 m
t cu,
50,
000
t mo,
500
,000
oz
au,
20
moz
ag
(d).
do.
ein
mac
ulad
aa
u, a
gH
ochs
child
min
ing
plc.
530,
000
oz a
u, 1
6 m
oz a
g (id
).d
o.e
Zafra
nal
cu,
au
aQ
m c
oppe
r cor
p.1.
4 m
t cu,
774
,000
oz
au
(r).
SELE
CTE
D L
ATI
N A
MER
ICA
AN
D C
AN
AD
A E
XPL
OR
ATI
ON
AC
TIV
ITY
IN 2
0101
taB
Le 3
—c
ontin
ued
3 abb
revi
atio
ns u
sed
in th
is ta
ble
for u
nits
of m
easu
rem
ent a
re a
s fol
low
s: m
oz, m
illio
n tro
y ou
nces
; mt,
mill
ion
met
ric to
ns; o
z, tr
oy o
unce
s; t,
met
ric to
ns.
4 Bas
ed o
n 20
10 d
ata
repo
rted
from
var
ious
sour
ces:
d, m
easu
red
+ in
dica
ted;
id, i
ndic
ated
; iF,
infe
rred,
r, p
rove
n +
prob
able
. dat
a no
t ver
ified
by
U.S
. Geo
logi
cal S
urve
y.
1 abb
revi
atio
ns u
sed
in th
is ta
ble
for c
omm
oditi
es a
re a
s fol
low
s: a
g, si
lver
; au,
gol
d; c
o, c
obal
t; c
u, c
oppe
r; Fe
, iro
n or
e; G
a, g
alliu
m; L
i, lit
hium
; mo,
mol
ybde
num
; nb,
nio
bium
; ni,
nick
el; P
b, le
ad;
PGm
, pla
tinum
-gro
up m
etal
s; P
d, p
alla
dium
; Pt,
plat
inum
; reO
, rar
e-ea
rth o
xide
s; r
h, rh
odiu
m; t
a, ta
ntal
um; U
, ura
nium
; Zn,
zin
c; Z
r, zi
rcon
ium
.2 d
, app
rove
d fo
r dev
elop
men
t; e,
act
ive
expl
orat
ion;
F, f
easi
bilit
y w
ork
ongo
ing/
com
plet
ed; P
, exp
lora
tion
at p
rodu
cing
site
.
1.14 U.S. GEOLOGICAL SURVEY MINERALS YEARBOOK—2010
c
oppe
r,
nic
kel,
Silv
er,
ti
n, m
ine
m
ine
Gol
d,
Lead
, min
e
min
em
ine
outp
ut,
ou
tput
,
m
etal
,
out
put,
au
cont
ent
iron
ore,
ou
tput
,
outp
ut,
ag
cont
ent
Sn
con
tent
cou
ntry
Bau
xite
prim
ary
cu
cont
ent
(kilo
gram
s)gr
oss w
eigh
tSt
eel,
crud
ePb
con
tent
ni c
onte
nt(m
etric
tons
)(m
etric
tons
)a
rgen
tina
--41
314
063
,138
--5,
138
23--
723
--B
oliv
iap
----
26,
394
----
73--
1,25
920
,190
Bra
zilp
31,7
001,
535
214
62,0
4737
2,12
033
,033
2010
937
10,4
00c
hile
----
5,41
939
,494
9,13
01,
011
1--
1,28
7--
col
ombi
a--
--4
53,6
0677
1,21
3--
70e
15--
cos
ta r
ica
----
----
----
----
----
cub
a--
----
----
278
--71
e--
--d
omin
ican
rep
ublic
----
950
0--
60e
----
20--
ecua
dor
----
--1,
300
e--
372
----
1e
--el
Sal
vado
re--
----
----
56--
----
--Fr
ench
Gui
anae
----
--2,
000
----
----
----
Gua
tem
ala
----
--9,
213
227
4--
--19
5--
Guy
ana
1,10
0--
--9,
594
----
----
----
Hon
dura
s--
--(2
)e
2,19
7--
--17
--49
--Ja
mai
cae
8,54
0--
----
----
----
----
mex
ico
----
238
72,5
9613
,998
16,7
1019
2--
4,41
1--
nic
arag
ua--
----
2,06
5--
----
--6,
995
--Pa
nam
ae--
----
870
----
----
----
Para
guay
e--
----
----
633
----
----
Peru
p--
--1,
094
164,
060
9,16
075
0e
262
--3,
640
33,8
48Su
rinam
ee4,
000
----
12,2
863
----
----
----
trin
idad
and
tob
ago
----
----
--57
2--
----
--U
rugu
aye
----
--1,
736
316
66--
----
--V
enez
uela
e5,
500
355
--12
,000
14,9
005,
000
--20
----
Oth
ere,
4--
----
----
----
----
--to
tal
50,8
002,
300
7,12
051
5,00
041
9,00
064
,600
587
270
18,6
0064
,400
Shar
e of
wor
ld to
tal
24%
6%45
%20
%16
%4%
14%
15%
60%
26%
can
adap
--2,
963
525
91,0
2437
,001
13,0
0365
158
596
--Sh
are
of w
orld
tota
l--
7%3%
4%1%
1%2%
9%2%
--U
nite
d St
ates
na
1,73
01,
110
231,
000
49,9
0080
,500
369
--1,
280
--Sh
are
of w
orld
tota
ln
a4%
7%9%
2%6%
9%--
4%--
tota
l Wes
tern
Hem
isph
ere
50,8
006,
990
8,75
083
7,00
050
6,00
015
8,00
01,
020
429
20,5
0064
,400
Shar
e of
wor
ld to
tal
24%
17%
55%
33%
19%
11%
24%
24%
66%
26%
Wor
ld to
tal
216,
000
40,9
0015
,800
2,56
0,00
02,
600,
000
1,44
0,00
04,
170
1,79
030
,900
251,
000
taB
Le 4
Lati
n a
mer
ica
an
d c
an
ad
a: P
rO
dU
cti
On
OF
SeLe
cte
d m
iner
aL
cO
mm
Od
itie
S in
201
01
(tho
usan
d m
etric
tons
unl
ess o
ther
wis
e sp
ecifi
ed)
alu
min
umiro
n an
d st
eel
met
als
See
foot
note
s at e
nd o
f tab
le.
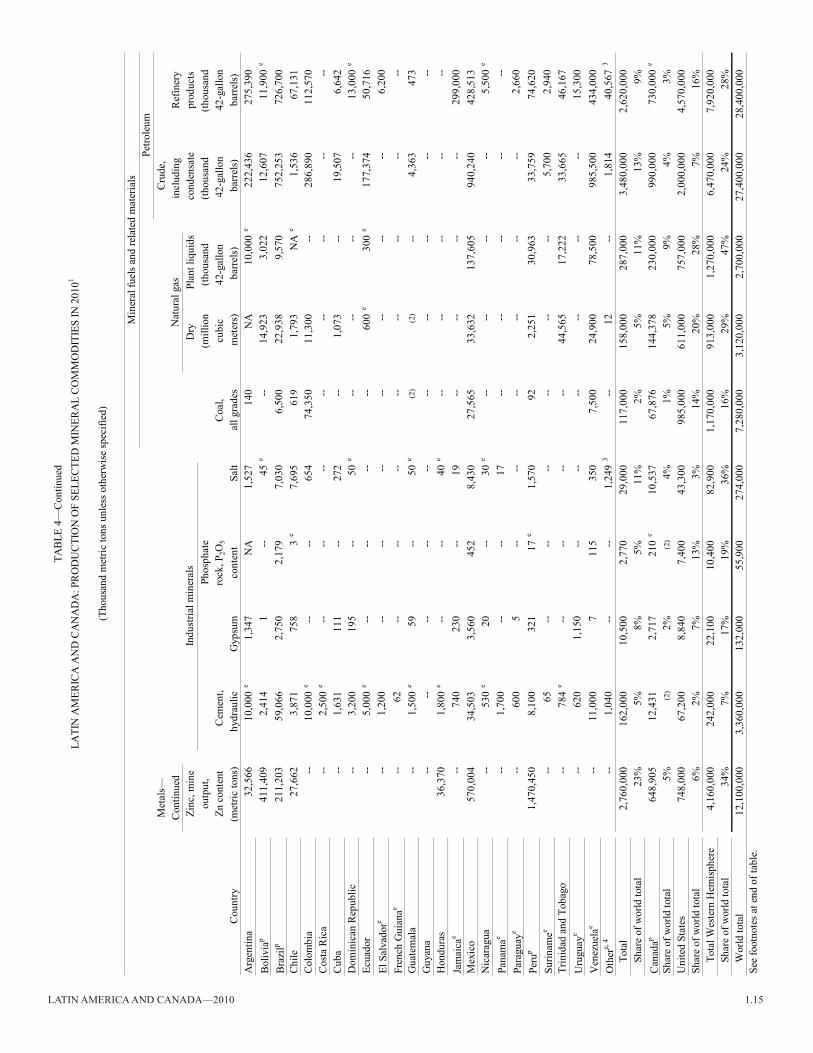
Latin america and canada—2010 1.15
met
als—
cru
de,
con
tinue
d
incl
udin
g
r
efin
ery
Zi
nc, m
ine
dry
Plan
t liq
uids
cond
ensa
te
p
rodu
cts
ou
tput
,Ph
osph
ate
(mill
ion
(thou
sand
(t
hous
and
(thou
sand
Zn
con
tent
cem
ent,
rock
, P2O
5
coa
l,
c
ubic
42-g
allo
n
42-
gallo
n42
-gal
lon
cou
ntry
(met
ric to
ns)
hydr
aulic
Gyp
sum
c
onte
ntSa
ltal
l gra
des
met
ers)
bar
rels)
barre
ls)
b
arre
ls)a
rgen
tina
32,5
6610
,000
e1,
347
na
1,52
714
0n
a10
,000
e22
2,43
627
5,39
0B
oliv
iap
411,
409
2,41
41
--45
e--
14,9
233,
022
12,6
0711
,900
e
Bra
zilp
211,
203
59,0
662,
750
2,17
97,
030
6,50
022
,938
9,57
075
2,25
372
6,70
0c
hile
27,6
623,
871
758
3e
7,69
561
91,
793
na
e1,
536
67,1
31c
olom
bia
--10
,000
e--
--65
474
,350
11,3
00--
286,
890
112,
570
cos
ta r
ica
--2,
500
e--
----
----
----
--c
uba
--1,
631
111
--27
2--
1,07
3--
19,5
076,
642
dom
inic
an r
epub
lic--
3,20
019
5--
50e
----
----
13,0
00e
ecua
dor
--5,
000
e--
----
--60
0e
300
e17
7,37
450
,716
el S
alva
dore
--1,
200
----
----
----
--6,
200
Fren
ch G
uian
ae--
62--
----
----
----
--G
uate
mal
a--
1,50
0e
59--
50e
(2)
(2)
--4,
363
473
Guy
ana
----
----
----
----
----
Hon
dura
s36
,370
1,80
0e
----
40e
----
----
--Ja
mai
cae
--74
023
0--
19--
----
--29
9,00
0m
exic
o57
0,00
434
,503
3,56
045
28,
430
27,5
6533
,632
137,
605
940,
240
428,
513
nic
arag
ua--
530
e20
--30
e--
----
--5,
500
e
Pana
mae
--1,
700
----
17--
----
----
Para
guay
e--
600
5--
----
----
--2,
660
Peru
p1,
470,
450
8,10
032
117
e1,
570
922,
251
30,9
6333
,759
74,6
20Su
rinam
ee--
65--
----
----
--5,
700
2,94
0tr
inid
ad a
nd t
obag
o--
784
e--
----
--44
,565
17,2
2233
,665
46,1
67U
rugu
aye
--62
01,
150
----
----
----
15,3
00V
enez
uela
e--
11,0
007
115
350
7,50
024
,900
78,5
0098
5,50
043
4,00
0O
ther
e, 4
--1,
040
----
1,24
93
--12
--1,
814
40,5
673
tota
l2,
760,
000
162,
000
10,5
002,
770
29,0
0011
7,00
015
8,00
028
7,00
03,
480,
000
2,62
0,00
0Sh
are
of w
orld
tota
l23
%5%
8%5%
11%
2%5%
11%
13%
9%c
anad
ap64
8,90
512
,431
2,71
721
0e
10,5
3767
,876
144,
378
230,
000
990,
000
730,
000
e
Shar
e of
wor
ld to
tal
5%(2
)2%
(2)
4%1%
5%9%
4%3%
Uni
ted
Stat
es74
8,00
067
,200
8,84
07,
400
43,3
0098
5,00
061
1,00
075
7,00
02,
000,
000
4,57
0,00
0Sh
are
of w
orld
tota
l6%
2%7%
13%
3%14
%20
%28
%7%
16%
tota
l Wes
tern
Hem
isph
ere
4,16
0,00
024
2,00
022
,100
10,4
0082
,900
1,17
0,00
091
3,00
01,
270,
000
6,47
0,00
07,
920,
000
Shar
e of
wor
ld to
tal
34%
7%17
%19
%36
%16
%29
%47
%24
%28
%W
orld
tota
l12
,100
,000
3,36
0,00
013
2,00
055
,900
274,
000
7,28
0,00
03,
120,
000
2,70
0,00
027
,400
,000
28,4
00,0
00
Lati
n a
mer
ica
an
d c
an
ad
a: P
rO
dU
cti
On
OF
SeLe
cte
d m
iner
aL
cO
mm
Od
itie
S in
201
01
taB
Le 4
—c
ontin
ued
indu
stria
l min
eral
s
(tho
usan
d m
etric
tons
unl
ess o
ther
wis
e sp
ecifi
ed)
min
eral
fuel
s and
rela
ted
mat
eria
lsPe
trole
um
nat
ural
gas
See
foot
note
s at e
nd o
f tab
le.
1.16 U.S. GEOLOGICAL SURVEY MINERALS YEARBOOK—2010
2 Less
than
1/2
uni
t.
4 incl
udes
aru
ba, B
arba
dos,
Bel
ize,
cur
acao
, Gua
delo
upe,
Hai
ti, m
artin
ique
, Sab
a, S
int e
usta
tius,
and
Sint
maa
rten.
e estim
ated
; est
imat
ed d
ata,
U.S
. dat
a, a
nd w
orld
tota
ls ar
e ro
unde
d to
no
mor
e th
an th
ree
sign
ifica
nt d
igits
. p Pr
elim
inar
y. n
a n
ot a
vaila
ble.
-- Z
ero
or z
ero
perc
ent.
1 tota
ls m
ay n
ot a
dd d
ue to
inde
pend
ent r
ound
ing.
Per
cent
ages
are
cal
cula
ted
on u
nrou
nded
dat
a. t
able
incl
udes
dat
a av
aila
ble
as o
f Feb
ruar
y 3,
201
2.
taB
Le 4
—c
ontin
ued
Lati
n a
mer
ica
an
d c
an
ad
a: P
rO
dU
cti
On
OF
SeLe
cte
d m
iner
aL
cO
mm
Od
itie
S in
201
01
3 rep
orte
d fig
ure.
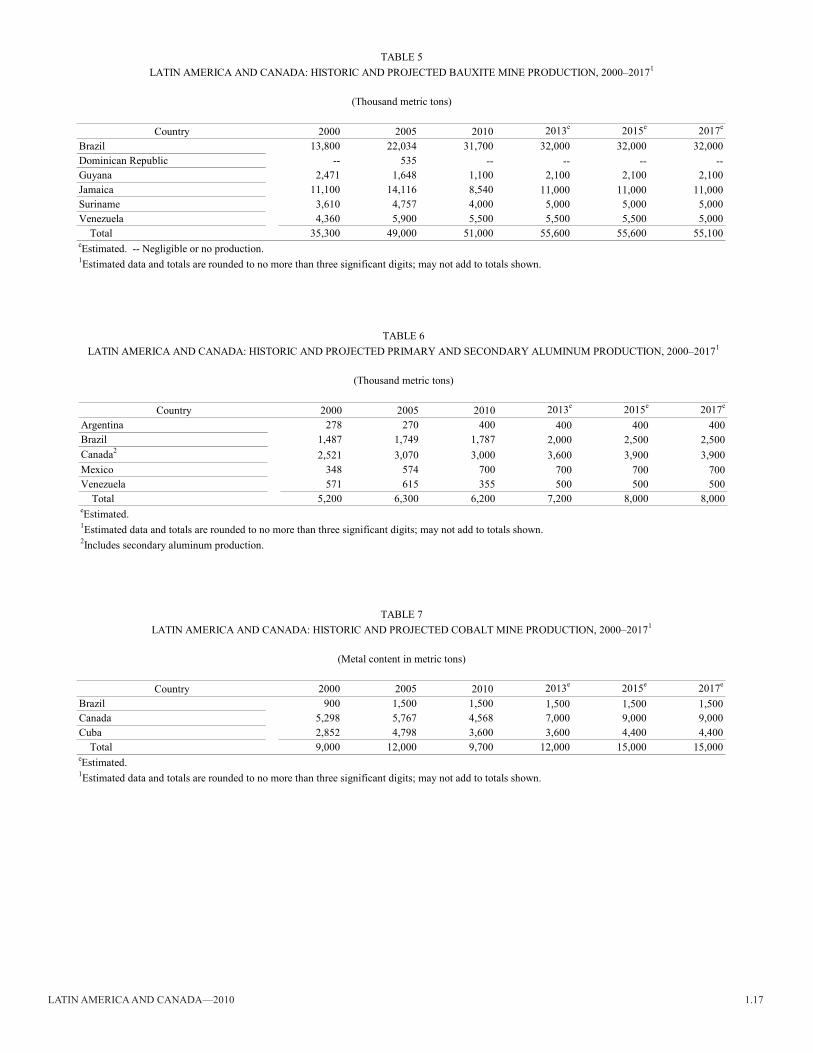
Latin america and canada—2010 1.17
country 2000 2005 2010 2013e 2015e 2017e
Brazil 13,800 22,034 31,700 32,000 32,000 32,000dominican republic -- 535 -- -- -- --Guyana 2,471 1,648 1,100 2,100 2,100 2,100Jamaica 11,100 14,116 8,540 11,000 11,000 11,000Suriname 3,610 4,757 4,000 5,000 5,000 5,000Venezuela 4,360 5,900 5,500 5,500 5,500 5,000
total 35,300 49,000 51,000 55,600 55,600 55,100
1estimated data and totals are rounded to no more than three significant digits; may not add to totals shown.
taBLe 5Latin america and canada: HiStOric and PrOJected BaUXite mine PrOdUctiOn, 2000–20171
(thousand metric tons)
eestimated. -- negligible or no production.
country 2000 2005 2010 2013e 2015e 2017e
argentina 278 270 400 400 400 400Brazil 1,487 1,749 1,787 2,000 2,500 2,500canada2 2,521 3,070 3,000 3,600 3,900 3,900mexico 348 574 700 700 700 700Venezuela 571 615 355 500 500 500
total 5,200 6,300 6,200 7,200 8,000 8,000eestimated. 1estimated data and totals are rounded to no more than three significant digits; may not add to totals shown. 2includes secondary aluminum production.
taBLe 6LATIN AMERICA AND CANADA: HISTORIC AND PROJECTED PRIMARY AND SECONDARY ALUMINUM PRODUCTION, 2000–20171
(thousand metric tons)
country 2000 2005 2010 2013e 2015e 2017e
Brazil 900 1,500 1,500 1,500 1,500 1,500canada 5,298 5,767 4,568 7,000 9,000 9,000cuba 2,852 4,798 3,600 3,600 4,400 4,400
total 9,000 12,000 9,700 12,000 15,000 15,000
1estimated data and totals are rounded to no more than three significant digits; may not add to totals shown.
taBLe 7Latin america and canada: HiStOric and PrOJected cOBaLt mine PrOdUctiOn, 2000–20171
(metal content in metric tons)
eestimated.
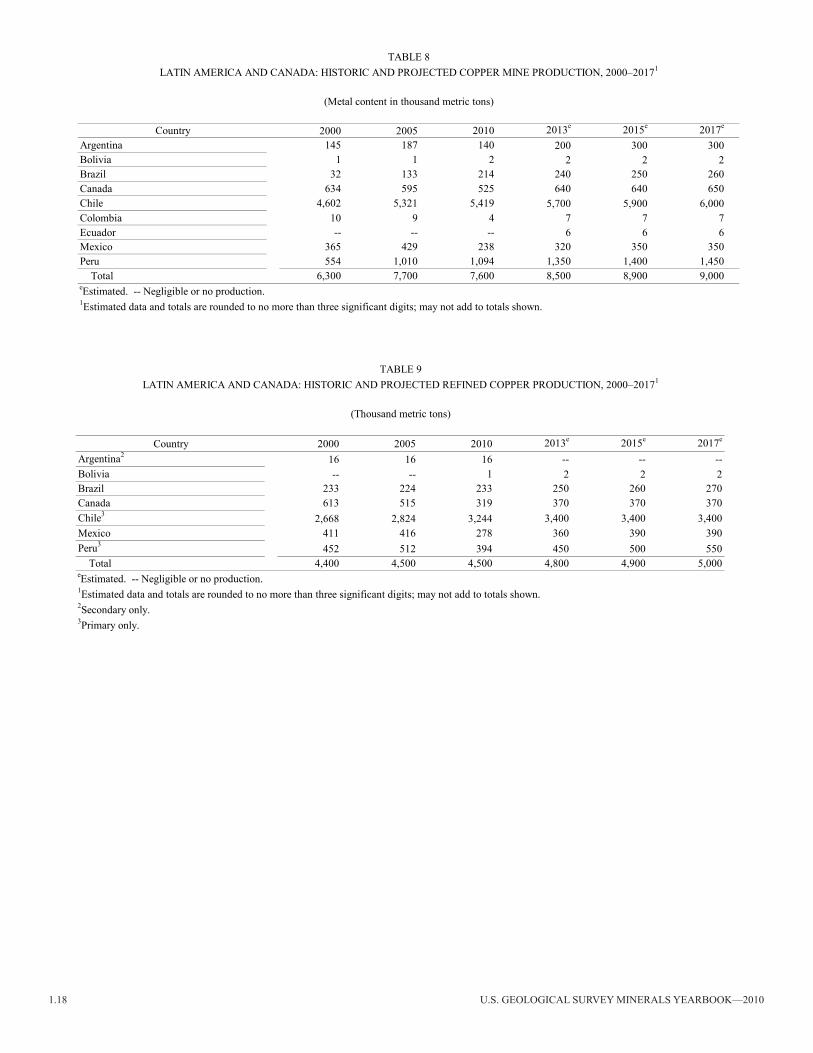
1.18 U.S. GEOLOGICAL SURVEY MINERALS YEARBOOK—2010
country 2000 2005 2010 2013e 2015e 2017e
argentina 145 187 140 200 300 300Bolivia 1 1 2 2 2 2Brazil 32 133 214 240 250 260canada 634 595 525 640 640 650chile 4,602 5,321 5,419 5,700 5,900 6,000colombia 10 9 4 7 7 7ecuador -- -- -- 6 6 6mexico 365 429 238 320 350 350Peru 554 1,010 1,094 1,350 1,400 1,450
total 6,300 7,700 7,600 8,500 8,900 9,000
1estimated data and totals are rounded to no more than three significant digits; may not add to totals shown.
taBLe 8Latin america and canada: HiStOric and PrOJected cOPPer mine PrOdUctiOn, 2000–20171
(metal content in thousand metric tons)
eestimated. -- negligible or no production.
country 2000 2005 2010 2013e 2015e 2017e
argentina2 16 16 16 -- -- --Bolivia -- -- 1 2 2 2Brazil 233 224 233 250 260 270canada 613 515 319 370 370 370chile3 2,668 2,824 3,244 3,400 3,400 3,400mexico 411 416 278 360 390 390Peru3 452 512 394 450 500 550
total 4,400 4,500 4,500 4,800 4,900 5,000
1estimated data and totals are rounded to no more than three significant digits; may not add to totals shown. 2Secondary only.3Primary only.
taBLe 9Latin america and canada: HiStOric and PrOJected reFined cOPPer PrOdUctiOn, 2000–20171
(thousand metric tons)
eestimated. -- negligible or no production.
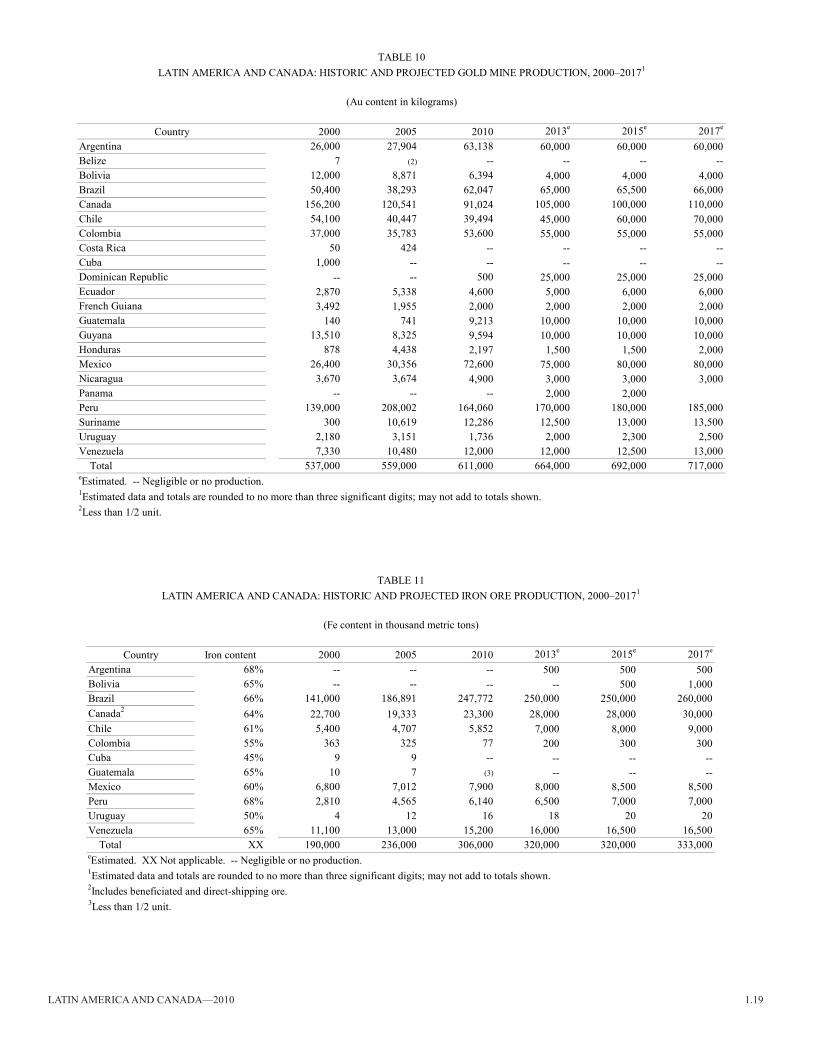
Latin america and canada—2010 1.19
country 2000 2005 2010 2013e 2015e 2017e
argentina 26,000 27,904 63,138 60,000 60,000 60,000Belize 7 (2) -- -- -- --Bolivia 12,000 8,871 6,394 4,000 4,000 4,000Brazil 50,400 38,293 62,047 65,000 65,500 66,000canada 156,200 120,541 91,024 105,000 100,000 110,000chile 54,100 40,447 39,494 45,000 60,000 70,000colombia 37,000 35,783 53,600 55,000 55,000 55,000costa rica 50 424 -- -- -- --cuba 1,000 -- -- -- -- --dominican republic -- -- 500 25,000 25,000 25,000ecuador 2,870 5,338 4,600 5,000 6,000 6,000French Guiana 3,492 1,955 2,000 2,000 2,000 2,000Guatemala 140 741 9,213 10,000 10,000 10,000Guyana 13,510 8,325 9,594 10,000 10,000 10,000Honduras 878 4,438 2,197 1,500 1,500 2,000mexico 26,400 30,356 72,600 75,000 80,000 80,000nicaragua 3,670 3,674 4,900 3,000 3,000 3,000Panama -- -- -- 2,000 2,000Peru 139,000 208,002 164,060 170,000 180,000 185,000Suriname 300 10,619 12,286 12,500 13,000 13,500Uruguay 2,180 3,151 1,736 2,000 2,300 2,500Venezuela 7,330 10,480 12,000 12,000 12,500 13,000
total 537,000 559,000 611,000 664,000 692,000 717,000
taBLe 10Latin america and canada: HiStOric and PrOJected GOLd mine PrOdUctiOn, 2000–20171
(au content in kilograms)
eestimated. -- negligible or no production. 1estimated data and totals are rounded to no more than three significant digits; may not add to totals shown. 2Less than 1/2 unit.
country iron content 2000 2005 2010 2013e 2015e 2017e
argentina 68% -- -- -- 500 500 500Bolivia 65% -- -- -- -- 500 1,000Brazil 66% 141,000 186,891 247,772 250,000 250,000 260,000canada2 64% 22,700 19,333 23,300 28,000 28,000 30,000chile 61% 5,400 4,707 5,852 7,000 8,000 9,000colombia 55% 363 325 77 200 300 300cuba 45% 9 9 -- -- -- --Guatemala 65% 10 7 (3) -- -- --mexico 60% 6,800 7,012 7,900 8,000 8,500 8,500Peru 68% 2,810 4,565 6,140 6,500 7,000 7,000Uruguay 50% 4 12 16 18 20 20Venezuela 65% 11,100 13,000 15,200 16,000 16,500 16,500
total XX 190,000 236,000 306,000 320,000 320,000 333,000
3Less than 1/2 unit.
1estimated data and totals are rounded to no more than three significant digits; may not add to totals shown.2includes beneficiated and direct-shipping ore.
taBLe 11Latin america and canada: HiStOric and PrOJected irOn Ore PrOdUctiOn, 2000–20171
(Fe content in thousand metric tons)
eestimated. XX not applicable. -- negligible or no production.
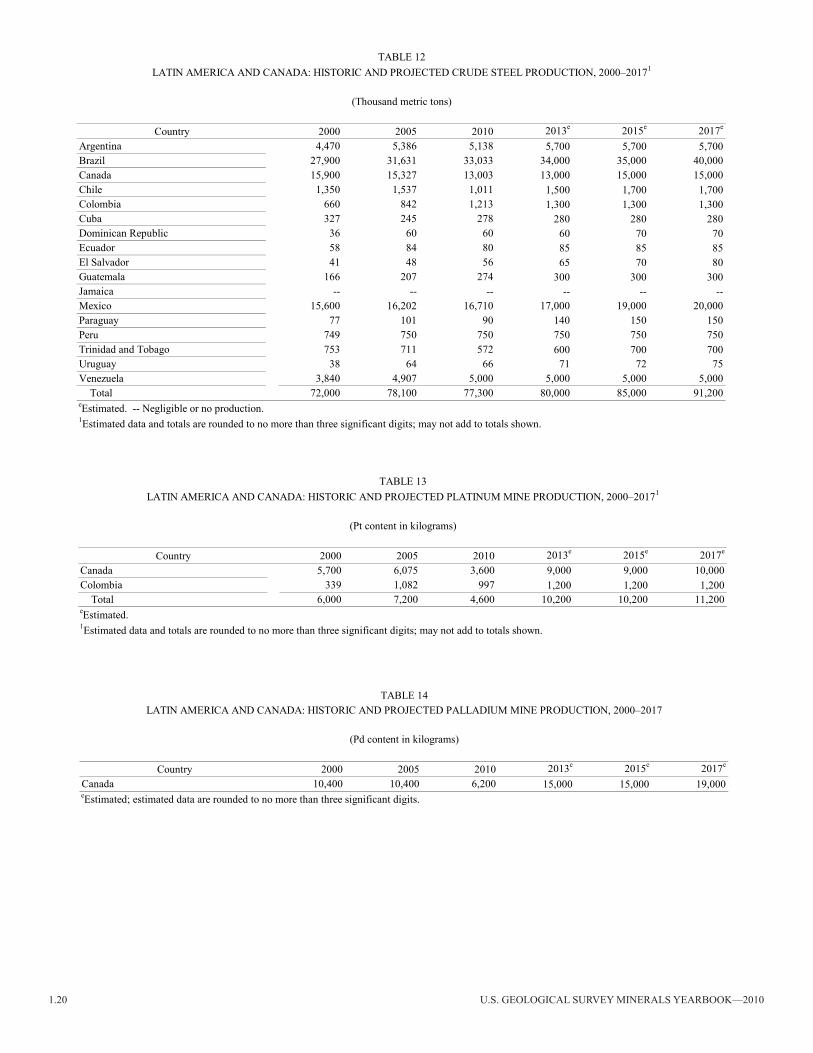
1.20 U.S. GEOLOGICAL SURVEY MINERALS YEARBOOK—2010
country 2000 2005 2010 2013e 2015e 2017e
argentina 4,470 5,386 5,138 5,700 5,700 5,700Brazil 27,900 31,631 33,033 34,000 35,000 40,000canada 15,900 15,327 13,003 13,000 15,000 15,000chile 1,350 1,537 1,011 1,500 1,700 1,700colombia 660 842 1,213 1,300 1,300 1,300cuba 327 245 278 280 280 280dominican republic 36 60 60 60 70 70ecuador 58 84 80 85 85 85el Salvador 41 48 56 65 70 80Guatemala 166 207 274 300 300 300Jamaica -- -- -- -- -- --mexico 15,600 16,202 16,710 17,000 19,000 20,000Paraguay 77 101 90 140 150 150Peru 749 750 750 750 750 750trinidad and tobago 753 711 572 600 700 700Uruguay 38 64 66 71 72 75Venezuela 3,840 4,907 5,000 5,000 5,000 5,000
total 72,000 78,100 77,300 80,000 85,000 91,200
1estimated data and totals are rounded to no more than three significant digits; may not add to totals shown.
taBLe 12Latin america and canada: HiStOric and PrOJected crUde SteeL PrOdUctiOn, 2000–20171
(thousand metric tons)
eestimated. -- negligible or no production.
country 2000 2005 2010 2013e 2015e 2017e
canada 5,700 6,075 3,600 9,000 9,000 10,000colombia 339 1,082 997 1,200 1,200 1,200
total 6,000 7,200 4,600 10,200 10,200 11,200
1estimated data and totals are rounded to no more than three significant digits; may not add to totals shown.
taBLe 13Latin america and canada: HiStOric and PrOJected PLatinUm mine PrOdUctiOn, 2000–20171
(Pt content in kilograms)
eestimated.
country 2000 2005 2010 2013e 2015e 2017e
canada 10,400 10,400 6,200 15,000 15,000 19,000eestimated; estimated data are rounded to no more than three significant digits.
taBLe 14Latin america and canada: HiStOric and PrOJected PaLLadiUm mine PrOdUctiOn, 2000–2017
(Pd content in kilograms)
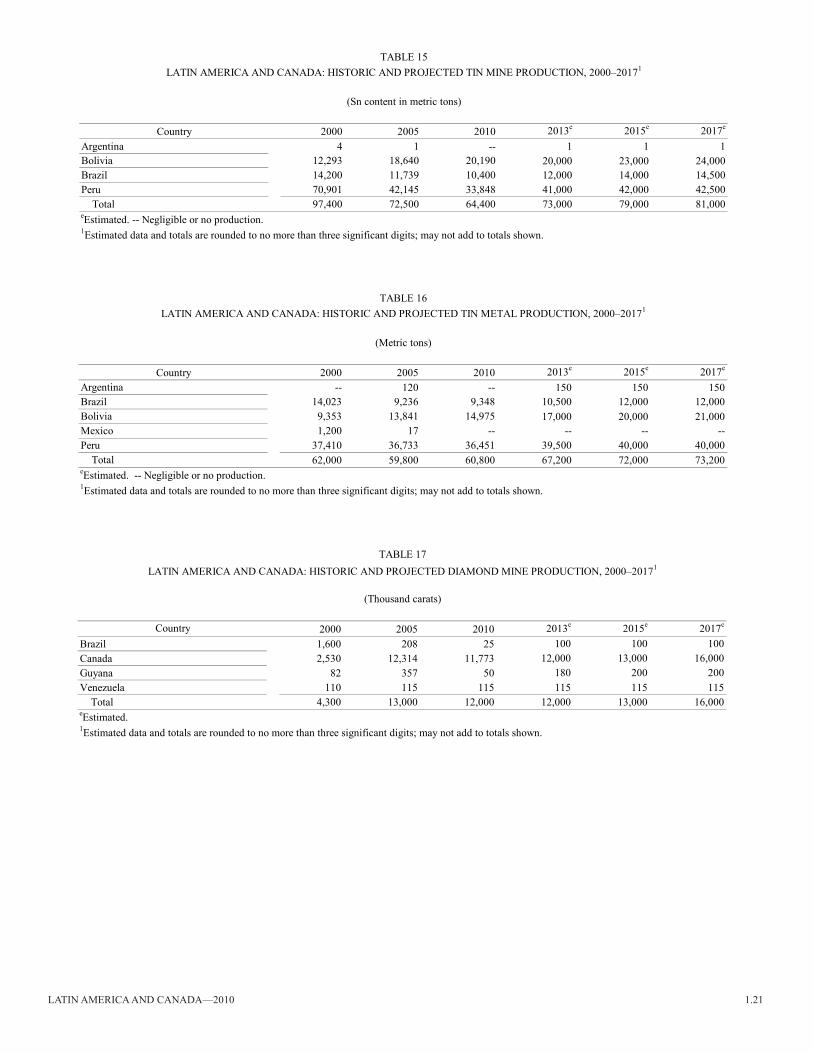
Latin america and canada—2010 1.21
country 2000 2005 2010 2013e 2015e 2017e
argentina 4 1 -- 1 1 1Bolivia 12,293 18,640 20,190 20,000 23,000 24,000Brazil 14,200 11,739 10,400 12,000 14,000 14,500Peru 70,901 42,145 33,848 41,000 42,000 42,500
total 97,400 72,500 64,400 73,000 79,000 81,000
1estimated data and totals are rounded to no more than three significant digits; may not add to totals shown.
taBLe 15Latin america and canada: HiStOric and PrOJected tin mine PrOdUctiOn, 2000–20171
(Sn content in metric tons)
eestimated. -- negligible or no production.
country 2000 2005 2010 2013e 2015e 2017e
argentina -- 120 -- 150 150 150Brazil 14,023 9,236 9,348 10,500 12,000 12,000Bolivia 9,353 13,841 14,975 17,000 20,000 21,000mexico 1,200 17 -- -- -- --Peru 37,410 36,733 36,451 39,500 40,000 40,000
total 62,000 59,800 60,800 67,200 72,000 73,200
1estimated data and totals are rounded to no more than three significant digits; may not add to totals shown.
taBLe 16Latin america and canada: HiStOric and PrOJected tin metaL PrOdUctiOn, 2000–20171
(metric tons)
eestimated. -- negligible or no production.
country 2000 2005 2010 2013e 2015e 2017e
Brazil 1,600 208 25 100 100 100canada 2,530 12,314 11,773 12,000 13,000 16,000Guyana 82 357 50 180 200 200Venezuela 110 115 115 115 115 115
total 4,300 13,000 12,000 12,000 13,000 16,000
1estimated data and totals are rounded to no more than three significant digits; may not add to totals shown.
taBLe 17Latin america and canada: HiStOric and PrOJected diamOnd mine PrOdUctiOn, 2000–20171
(thousand carats)
eestimated.
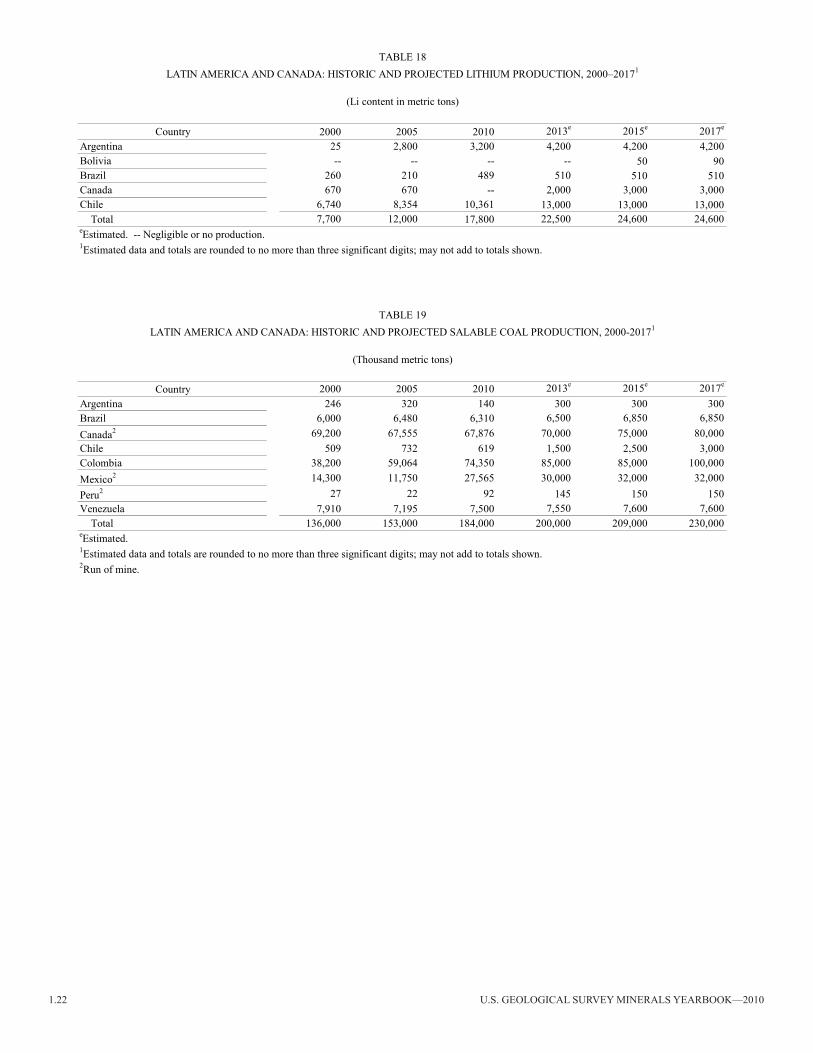
1.22 U.S. GEOLOGICAL SURVEY MINERALS YEARBOOK—2010
country 2000 2005 2010 2013e 2015e 2017e
argentina 246 320 140 300 300 300Brazil 6,000 6,480 6,310 6,500 6,850 6,850canada2 69,200 67,555 67,876 70,000 75,000 80,000chile 509 732 619 1,500 2,500 3,000colombia 38,200 59,064 74,350 85,000 85,000 100,000mexico2 14,300 11,750 27,565 30,000 32,000 32,000Peru2 27 22 92 145 150 150Venezuela 7,910 7,195 7,500 7,550 7,600 7,600
total 136,000 153,000 184,000 200,000 209,000 230,000
1estimated data and totals are rounded to no more than three significant digits; may not add to totals shown. 2run of mine.
taBLe 19Latin america and canada: HiStOric and PrOJected SaLaBLe cOaL PrOdUctiOn, 2000-20171
(thousand metric tons)
eestimated.
country 2000 2005 2010 2013e 2015e 2017e
argentina 25 2,800 3,200 4,200 4,200 4,200Bolivia -- -- -- -- 50 90Brazil 260 210 489 510 510 510canada 670 670 -- 2,000 3,000 3,000chile 6,740 8,354 10,361 13,000 13,000 13,000
total 7,700 12,000 17,800 22,500 24,600 24,600
1estimated data and totals are rounded to no more than three significant digits; may not add to totals shown.
taBLe 18Latin america and canada: HiStOric and PrOJected LitHiUm PrOdUctiOn, 2000–20171
(Li content in metric tons)
eestimated. -- negligible or no production.