Embed Size (px)
Citation preview
Aon Benfield
Analytics | Market Analysis
Risk. Reinsurance. Human Resources.
Lloyd’s Update June 2015
2 Lloyd’s Update – June 2015
Table of Contents
Executive Summary .......................................................................................................... 3
Lloyd’s Market in 2015 ..................................................................................................... 4
2015 Capacity .................................................................................................................... 4
Top 10 Lloyd’s Managing Agents ....................................................................................... 4
Top 10 Syndicates .............................................................................................................. 4
New Entrants and Departures ............................................................................................ 4
Mergers & Acquisitions ...................................................................................................... 5
Syndicate News.................................................................................................................. 5
Financial Strength Ratings .................................................................................................. 6
Vision 2025 ........................................................................................................................ 6
2014 Results ..................................................................................................................... 7
Premium Income ................................................................................................................ 7
Underwriting Performance ................................................................................................. 8
Investment Return .............................................................................................................. 8
Pre-Tax Results ................................................................................................................... 9
Balance Sheet at December 31, 2014 ............................................................................. 10
Investments ..................................................................................................................... 10
Technical Reserves ........................................................................................................... 11
Capital ............................................................................................................................. 11
Appendix 1 – Lloyd’s Ten Year Segmental Results .......................................................... 14
Appendix 2 – Reinsurance Segment ............................................................................... 16
Lloyd’s Reinsurers – Syndicate Peer Study ........................................................................ 17
Appendix 3: Active Syndicate Listing .............................................................................. 19
Aon Benfield Analytics | Market Analysis 3
Executive Summary The Lloyd’s market began 2015 with 92 active syndicates and slightly reduced underwriting
capacity of GBP26.0 billion.
This includes over GBP0.5 billion of ‘sidecar’ quota share capacity provided by 14 Special Purpose Syndicates (SPSs).
Eight Lloyd’s managing agents now oversee more than GBP1.0 billion of capacity, namely Catlin, Tokio Marine Kiln, Beazley, Hiscox, Amlin, QBE, Brit and Liberty.
Including sidecar support, the capacity of the ten largest syndicates aggregates to GBP11.1 billion in 2015, or 42% of the total market. Average syndicate capacity stands at GBP331 million.
China Re Syndicate 2088, a former SPS, now operates on a standalone basis and April 1, 2015 saw the launch of a new operation, Syndicate 1884, backed by The Standard Club.
SPSs continue to be a popular entry route for new and existing investors, with four new vehicles established so far in 2015. Backers include Credit Suisse Asset Management and Korean Re.
Four Lloyd’s operations gained new owners in the first half of 2015 (Ariel Re, Brit, Catlin and Sportscover) and three further deals await customary approvals (Pembroke, Montpelier and HCC).
Gross premiums written totalled GBP25.3 billion in 2014, up 2% at constant exchange rates. Reinsurance volumes fell by 10% to GBP8.5 billion, driven by lower property catastrophe pricing.
Underwriting profit of GBP2.3 billion (2013: GBP2.6 billion) equated to a combined ratio of 88.1% (86.8%). Prior year reserve releases were stable at GBP1.6 billion, providing 8.0pp of benefit.
The total investment return rose by 25% to just over GBP1.0 billion in 2014, a yield of 2.0% (2013: 1.6%), driven by unrealized gains on longer duration bonds.
Overall operating performance remains strong. Pre-tax profit was almost unchanged at GBP3.2 billion in 2014, representing a return on capital employed of 14.7% (2013: 16.2%).
Overall net resources (capital, reserves and subordinated liabilities) grew by 11% to a record level of GBP23.5 billion at December 31, 2014.
Lloyd’s has been liaising closely with the UK regulators over its preparations for the implementation of the Solvency II regime and these are nearing completion.
4 Lloyd’s Update – June 2015
Lloyd’s Market in 2015 Lloyd’s began 2015 with 92 active syndicates and slightly reduced underwriting capacity of GBP26.0 billion. M&A
activity has been dominating headlines within the reinsurance market in recent months and Lloyd’s is no exception,
with a number of deals involving Lloyd’s businesses in progress or already completed.
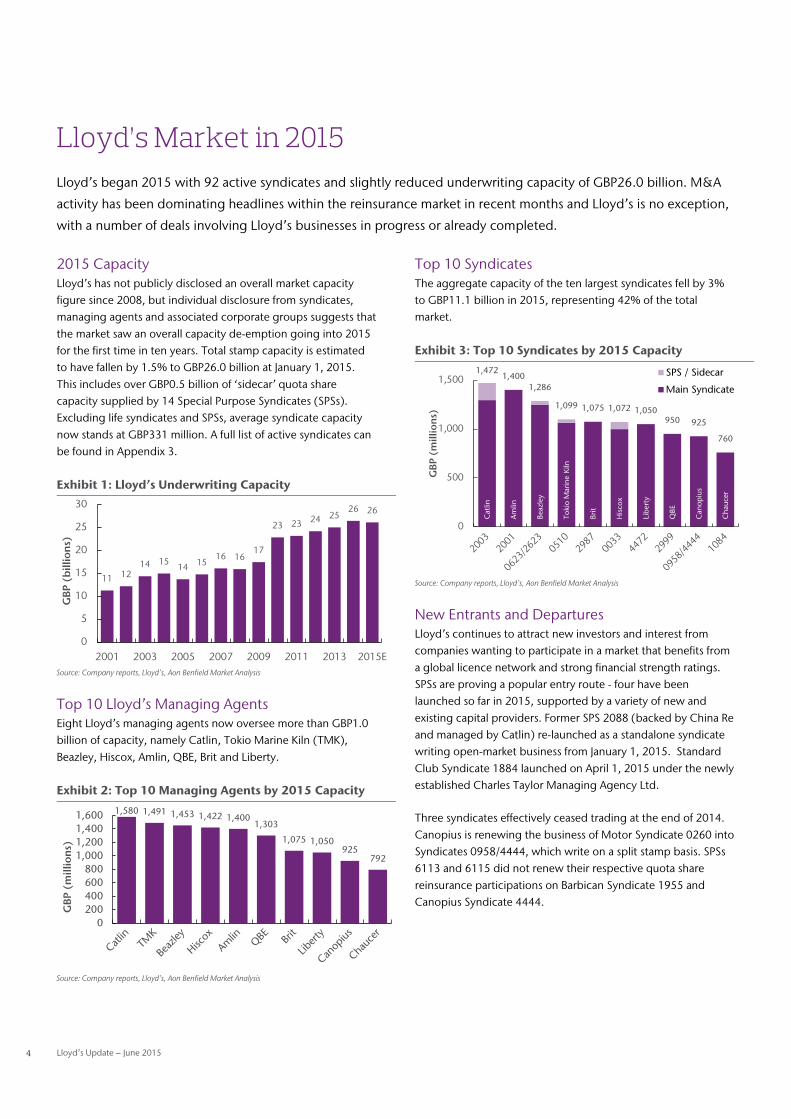
2015 Capacity Lloyd’s has not publicly disclosed an overall market capacity figure since 2008, but individual disclosure from syndicates, managing agents and associated corporate groups suggests that the market saw an overall capacity de-emption going into 2015 for the first time in ten years. Total stamp capacity is estimated to have fallen by 1.5% to GBP26.0 billion at January 1, 2015. This includes over GBP0.5 billion of ‘sidecar’ quota share capacity supplied by 14 Special Purpose Syndicates (SPSs). Excluding life syndicates and SPSs, average syndicate capacity now stands at GBP331 million. A full list of active syndicates can be found in Appendix 3.
Exhibit 1: Lloyd’s Underwriting Capacity
Source: Company reports, Lloyd’s, Aon Benfield Market Analysis
Top 10 Lloyd’s Managing Agents Eight Lloyd’s managing agents now oversee more than GBP1.0 billion of capacity, namely Catlin, Tokio Marine Kiln (TMK), Beazley, Hiscox, Amlin, QBE, Brit and Liberty.
Exhibit 2: Top 10 Managing Agents by 2015 Capacity
Source: Company reports, Lloyd’s, Aon Benfield Market Analysis
Top 10 Syndicates The aggregate capacity of the ten largest syndicates fell by 3% to GBP11.1 billion in 2015, representing 42% of the total market.
Exhibit 3: Top 10 Syndicates by 2015 Capacity
Source: Company reports, Lloyd’s, Aon Benfield Market Analysis
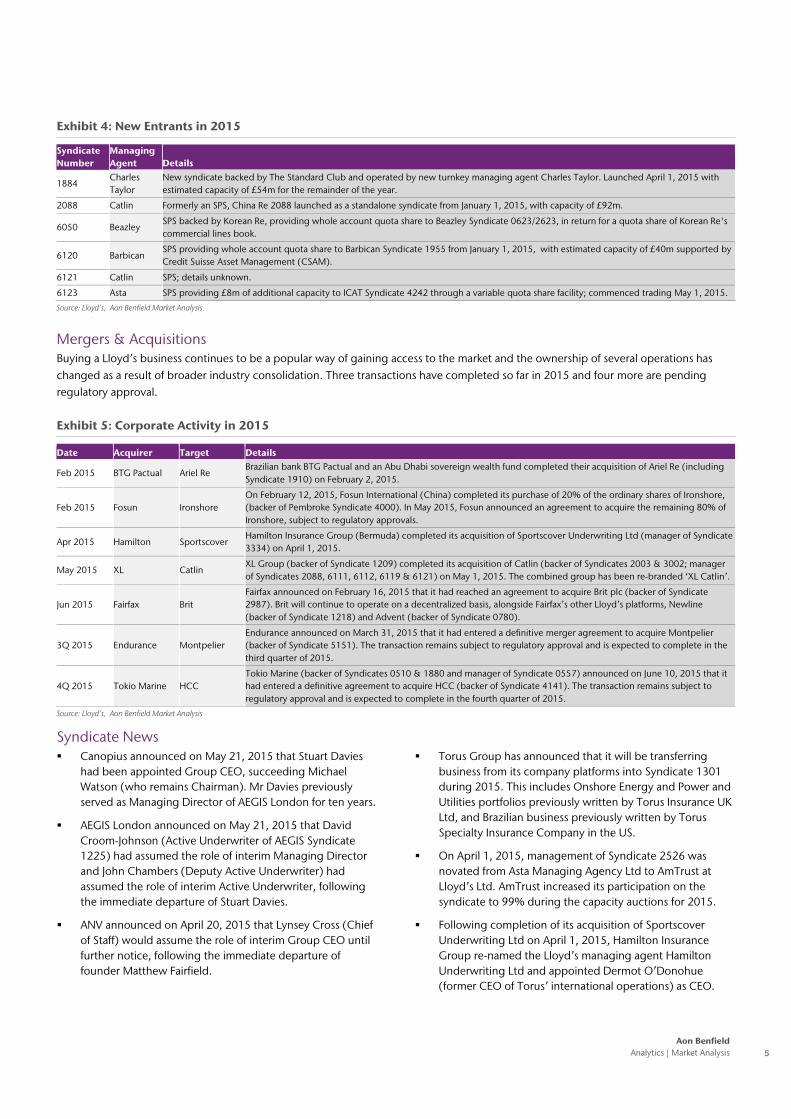
New Entrants and Departures Lloyd’s continues to attract new investors and interest from companies wanting to participate in a market that benefits from a global licence network and strong financial strength ratings. SPSs are proving a popular entry route - four have been launched so far in 2015, supported by a variety of new and existing capital providers. Former SPS 2088 (backed by China Re and managed by Catlin) re-launched as a standalone syndicate writing open-market business from January 1, 2015. Standard Club Syndicate 1884 launched on April 1, 2015 under the newly established Charles Taylor Managing Agency Ltd.
Three syndicates effectively ceased trading at the end of 2014. Canopius is renewing the business of Motor Syndicate 0260 into Syndicates 0958/4444, which write on a split stamp basis. SPSs 6113 and 6115 did not renew their respective quota share reinsurance participations on Barbican Syndicate 1955 and Canopius Syndicate 4444.
11 1214 15
14 1516 16
17
23 23 24 2526 26
0
5
10
15
20
25
30
2001 2003 2005 2007 2009 2011 2013 2015E
GBP
(b
illio
ns)
1,580 1,491 1,453 1,422 1,4001,303
1,075 1,050925
792
0200400600800
1,0001,2001,4001,600
GBP
(m
illio
ns)
Cat
lin
Am
lin
Beaz
ley
Toki
o M
arin
e K
iln
Brit
His
cox
Lib
erty
QBE
Can
opiu
s
Cha
ucer
1,4721,400
1,286
1,099 1,075 1,072 1,050950 925
760
0
500
1,000
1,500
GBP
(m
illio
ns)
SPS / Sidecar
Main Syndicate
Aon Benfield Analytics | Market Analysis 5
Exhibit 4: New Entrants in 2015
Syndicate Number
Managing Agent Details
1884 Charles Taylor
New syndicate backed by The Standard Club and operated by new turnkey managing agent Charles Taylor. Launched April 1, 2015 with estimated capacity of £54m for the remainder of the year.
2088 Catlin Formerly an SPS, China Re 2088 launched as a standalone syndicate from January 1, 2015, with capacity of £92m.
6050 Beazley SPS backed by Korean Re, providing whole account quota share to Beazley Syndicate 0623/2623, in return for a quota share of Korean Re's commercial lines book.
6120 Barbican SPS providing whole account quota share to Barbican Syndicate 1955 from January 1, 2015, with estimated capacity of £40m supported by Credit Suisse Asset Management (CSAM).
6121 Catlin SPS; details unknown.
6123 Asta SPS providing £8m of additional capacity to ICAT Syndicate 4242 through a variable quota share facility; commenced trading May 1, 2015.
Source: Lloyd’s, Aon Benfield Market Analysis
Mergers & Acquisitions Buying a Lloyd’s business continues to be a popular way of gaining access to the market and the ownership of several operations has changed as a result of broader industry consolidation. Three transactions have completed so far in 2015 and four more are pending regulatory approval.
Exhibit 5: Corporate Activity in 2015
Date Acquirer Target Details
Feb 2015 BTG Pactual Ariel Re Brazilian bank BTG Pactual and an Abu Dhabi sovereign wealth fund completed their acquisition of Ariel Re (including Syndicate 1910) on February 2, 2015.
Feb 2015 Fosun Ironshore On February 12, 2015, Fosun International (China) completed its purchase of 20% of the ordinary shares of Ironshore, (backer of Pembroke Syndicate 4000). In May 2015, Fosun announced an agreement to acquire the remaining 80% of Ironshore, subject to regulatory approvals.
Apr 2015 Hamilton Sportscover Hamilton Insurance Group (Bermuda) completed its acquisition of Sportscover Underwriting Ltd (manager of Syndicate 3334) on April 1, 2015.
May 2015 XL Catlin XL Group (backer of Syndicate 1209) completed its acquisition of Catlin (backer of Syndicates 2003 & 3002; manager of Syndicates 2088, 6111, 6112, 6119 & 6121) on May 1, 2015. The combined group has been re-branded ‘XL Catlin’.
Jun 2015 Fairfax Brit Fairfax announced on February 16, 2015 that it had reached an agreement to acquire Brit plc (backer of Syndicate 2987). Brit will continue to operate on a decentralized basis, alongside Fairfax’s other Lloyd’s platforms, Newline (backer of Syndicate 1218) and Advent (backer of Syndicate 0780).
3Q 2015 Endurance Montpelier Endurance announced on March 31, 2015 that it had entered a definitive merger agreement to acquire Montpelier (backer of Syndicate 5151). The transaction remains subject to regulatory approval and is expected to complete in the third quarter of 2015.
4Q 2015 Tokio Marine HCC Tokio Marine (backer of Syndicates 0510 & 1880 and manager of Syndicate 0557) announced on June 10, 2015 that it had entered a definitive agreement to acquire HCC (backer of Syndicate 4141). The transaction remains subject to regulatory approval and is expected to complete in the fourth quarter of 2015.
Source: Lloyd’s, Aon Benfield Market Analysis
Syndicate News Canopius announced on May 21, 2015 that Stuart Davies
had been appointed Group CEO, succeeding Michael Watson (who remains Chairman). Mr Davies previously served as Managing Director of AEGIS London for ten years.
AEGIS London announced on May 21, 2015 that David Croom-Johnson (Active Underwriter of AEGIS Syndicate 1225) had assumed the role of interim Managing Director and John Chambers (Deputy Active Underwriter) had assumed the role of interim Active Underwriter, following the immediate departure of Stuart Davies.
ANV announced on April 20, 2015 that Lynsey Cross (Chief of Staff) would assume the role of interim Group CEO until further notice, following the immediate departure of founder Matthew Fairfield.
Torus Group has announced that it will be transferring business from its company platforms into Syndicate 1301 during 2015. This includes Onshore Energy and Power and Utilities portfolios previously written by Torus Insurance UK Ltd, and Brazilian business previously written by Torus Specialty Insurance Company in the US.
On April 1, 2015, management of Syndicate 2526 was novated from Asta Managing Agency Ltd to AmTrust at Lloyd’s Ltd. AmTrust increased its participation on the syndicate to 99% during the capacity auctions for 2015.
Following completion of its acquisition of Sportscover Underwriting Ltd on April 1, 2015, Hamilton Insurance Group re-named the Lloyd’s managing agent Hamilton Underwriting Ltd and appointed Dermot O’Donohue (former CEO of Torus’ international operations) as CEO.
6 Lloyd’s Update – June 2015
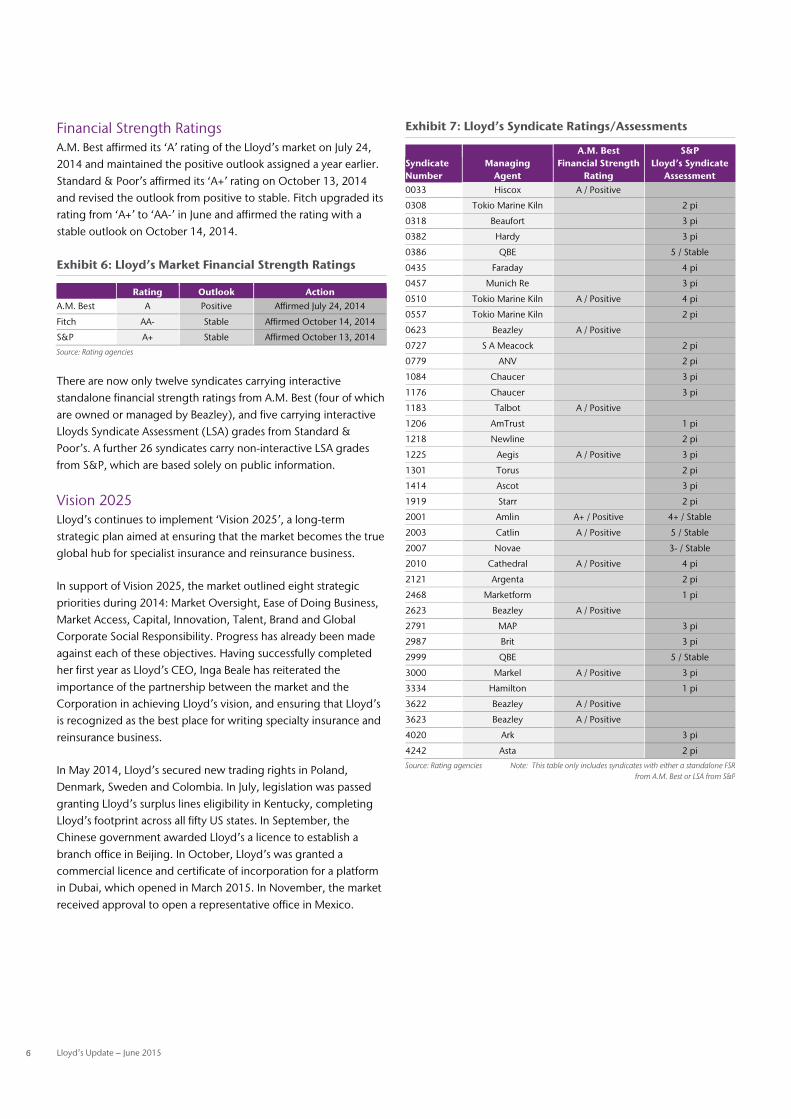
Financial Strength Ratings A.M. Best affirmed its ‘A’ rating of the Lloyd’s market on July 24, 2014 and maintained the positive outlook assigned a year earlier. Standard & Poor’s affirmed its ‘A+’ rating on October 13, 2014 and revised the outlook from positive to stable. Fitch upgraded its rating from ‘A+’ to ‘AA-’ in June and affirmed the rating with a stable outlook on October 14, 2014.
Exhibit 6: Lloyd’s Market Financial Strength Ratings
Rating Outlook Action A.M. Best A Positive Affirmed July 24, 2014
Fitch AA- Stable Affirmed October 14, 2014
S&P A+ Stable Affirmed October 13, 2014
Source: Rating agencies
There are now only twelve syndicates carrying interactive standalone financial strength ratings from A.M. Best (four of which are owned or managed by Beazley), and five carrying interactive Lloyds Syndicate Assessment (LSA) grades from Standard & Poor’s. A further 26 syndicates carry non-interactive LSA grades from S&P, which are based solely on public information.
Vision 2025 Lloyd’s continues to implement ‘Vision 2025’, a long-term strategic plan aimed at ensuring that the market becomes the true global hub for specialist insurance and reinsurance business.
In support of Vision 2025, the market outlined eight strategic priorities during 2014: Market Oversight, Ease of Doing Business, Market Access, Capital, Innovation, Talent, Brand and Global Corporate Social Responsibility. Progress has already been made against each of these objectives. Having successfully completed her first year as Lloyd’s CEO, Inga Beale has reiterated the importance of the partnership between the market and the Corporation in achieving Lloyd’s vision, and ensuring that Lloyd’s is recognized as the best place for writing specialty insurance and reinsurance business.
In May 2014, Lloyd’s secured new trading rights in Poland, Denmark, Sweden and Colombia. In July, legislation was passed granting Lloyd’s surplus lines eligibility in Kentucky, completing Lloyd’s footprint across all fifty US states. In September, the Chinese government awarded Lloyd’s a licence to establish a branch office in Beijing. In October, Lloyd’s was granted a commercial licence and certificate of incorporation for a platform in Dubai, which opened in March 2015. In November, the market received approval to open a representative office in Mexico.
Exhibit 7: Lloyd’s Syndicate Ratings/Assessments
Syndicate Number
Managing Agent
A.M. Best Financial Strength
Rating
S&P Lloyd’s Syndicate
Assessment 0033 Hiscox A / Positive
0308 Tokio Marine Kiln 2 pi
0318 Beaufort 3 pi
0382 Hardy 3 pi
0386 QBE 5 / Stable
0435 Faraday 4 pi
0457 Munich Re 3 pi
0510 Tokio Marine Kiln A / Positive 4 pi
0557 Tokio Marine Kiln 2 pi
0623 Beazley A / Positive
0727 S A Meacock 2 pi
0779 ANV 2 pi
1084 Chaucer 3 pi
1176 Chaucer 3 pi
1183 Talbot A / Positive
1206 AmTrust 1 pi
1218 Newline 2 pi
1225 Aegis A / Positive 3 pi
1301 Torus 2 pi
1414 Ascot 3 pi
1919 Starr 2 pi
2001 Amlin A+ / Positive 4+ / Stable
2003 Catlin A / Positive 5 / Stable
2007 Novae 3- / Stable
2010 Cathedral A / Positive 4 pi
2121 Argenta 2 pi
2468 Marketform 1 pi
2623 Beazley A / Positive
2791 MAP 3 pi
2987 Brit 3 pi
2999 QBE 5 / Stable
3000 Markel A / Positive 3 pi
3334 Hamilton 1 pi
3622 Beazley A / Positive
3623 Beazley A / Positive
4020 Ark 3 pi
4242 Asta 2 pi
Source: Rating agencies Note: This table only includes syndicates with either a standalone FSR from A.M. Best or LSA from S&P
Aon Benfield Analytics | Market Analysis 7
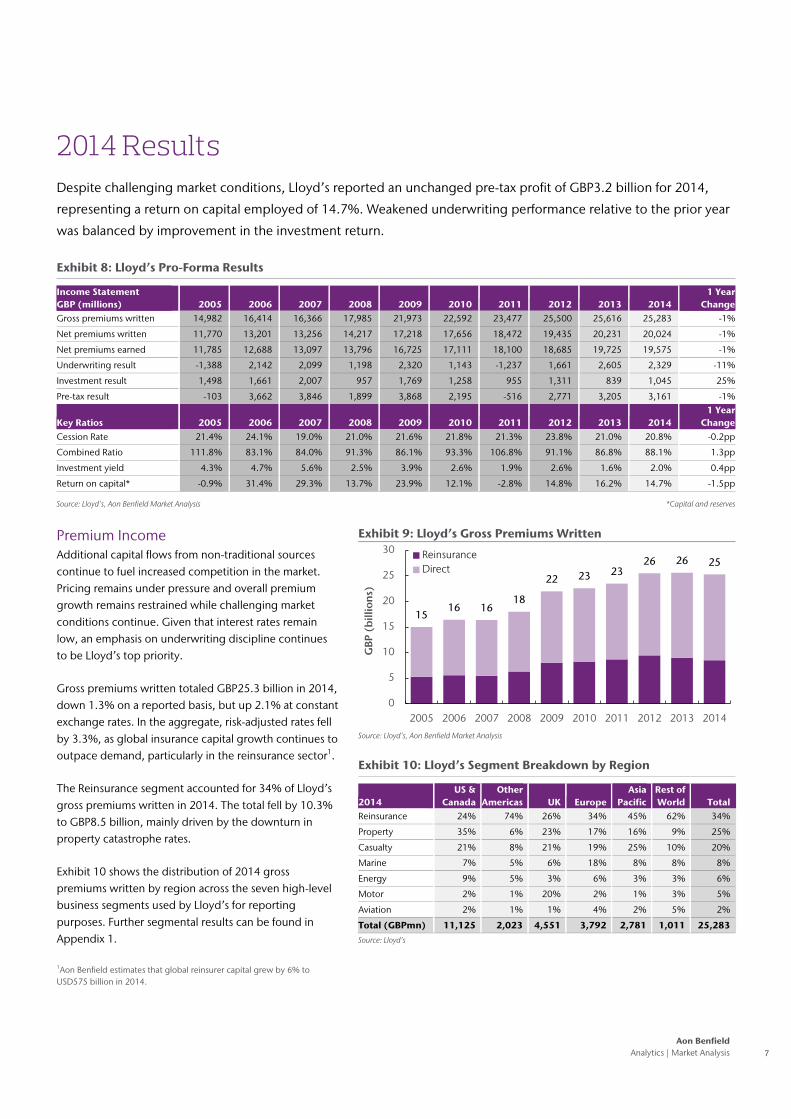
2014 Results Despite challenging market conditions, Lloyd’s reported an unchanged pre-tax profit of GBP3.2 billion for 2014,
representing a return on capital employed of 14.7%. Weakened underwriting performance relative to the prior year
was balanced by improvement in the investment return.
Exhibit 8: Lloyd’s Pro-Forma Results
Income Statement GBP (millions) 2005 2006 2007 2008 2009 2010 2011 2012 2013 2014
1 Year Change
Gross premiums written 14,982 16,414 16,366 17,985 21,973 22,592 23,477 25,500 25,616 25,283 -1%
Net premiums written 11,770 13,201 13,256 14,217 17,218 17,656 18,472 19,435 20,231 20,024 -1%
Net premiums earned 11,785 12,688 13,097 13,796 16,725 17,111 18,100 18,685 19,725 19,575 -1%
Underwriting result -1,388 2,142 2,099 1,198 2,320 1,143 -1,237 1,661 2,605 2,329 -11%
Investment result 1,498 1,661 2,007 957 1,769 1,258 955 1,311 839 1,045 25%
Pre-tax result -103 3,662 3,846 1,899 3,868 2,195 -516 2,771 3,205 3,161 -1%
Key Ratios 2005 2006 2007 2008 2009 2010 2011 2012 2013 2014 1 Year
Change Cession Rate 21.4% 24.1% 19.0% 21.0% 21.6% 21.8% 21.3% 23.8% 21.0% 20.8% -0.2pp
Combined Ratio 111.8% 83.1% 84.0% 91.3% 86.1% 93.3% 106.8% 91.1% 86.8% 88.1% 1.3pp
Investment yield 4.3% 4.7% 5.6% 2.5% 3.9% 2.6% 1.9% 2.6% 1.6% 2.0% 0.4pp
Return on capital* -0.9% 31.4% 29.3% 13.7% 23.9% 12.1% -2.8% 14.8% 16.2% 14.7% -1.5pp
Source: Lloyd’s, Aon Benfield Market Analysis *Capital and reserves
Premium Income Additional capital flows from non-traditional sources continue to fuel increased competition in the market. Pricing remains under pressure and overall premium growth remains restrained while challenging market conditions continue. Given that interest rates remain low, an emphasis on underwriting discipline continues to be Lloyd’s top priority.
Gross premiums written totaled GBP25.3 billion in 2014, down 1.3% on a reported basis, but up 2.1% at constant exchange rates. In the aggregate, risk-adjusted rates fell by 3.3%, as global insurance capital growth continues to outpace demand, particularly in the reinsurance sector1.
The Reinsurance segment accounted for 34% of Lloyd’s gross premiums written in 2014. The total fell by 10.3% to GBP8.5 billion, mainly driven by the downturn in property catastrophe rates.
Exhibit 10 shows the distribution of 2014 gross premiums written by region across the seven high-level business segments used by Lloyd’s for reporting purposes. Further segmental results can be found in Appendix 1.
1Aon Benfield estimates that global reinsurer capital grew by 6% to USD575 billion in 2014.
Exhibit 9: Lloyd’s Gross Premiums Written
Source: Lloyd’s, Aon Benfield Market Analysis
Exhibit 10: Lloyd’s Segment Breakdown by Region
2014 US &
Canada Other
Americas UK Europe Asia
Pacific Rest of World Total
Reinsurance 24% 74% 26% 34% 45% 62% 34%
Property 35% 6% 23% 17% 16% 9% 25%
Casualty 21% 8% 21% 19% 25% 10% 20%
Marine 7% 5% 6% 18% 8% 8% 8%
Energy 9% 5% 3% 6% 3% 3% 6%
Motor 2% 1% 20% 2% 1% 3% 5%
Aviation 2% 1% 1% 4% 2% 5% 2%
Total (GBPmn) 11,125 2,023 4,551 3,792 2,781 1,011 25,283
Source: Lloyd’s
1516 16
18
22 23 2326 26 25
0
5
10
15
20
25
30
2005 2006 2007 2008 2009 2010 2011 2012 2013 2014
GBP
(b
illio
ns)
ReinsuranceDirect
8 Lloyd’s Update – June 2015
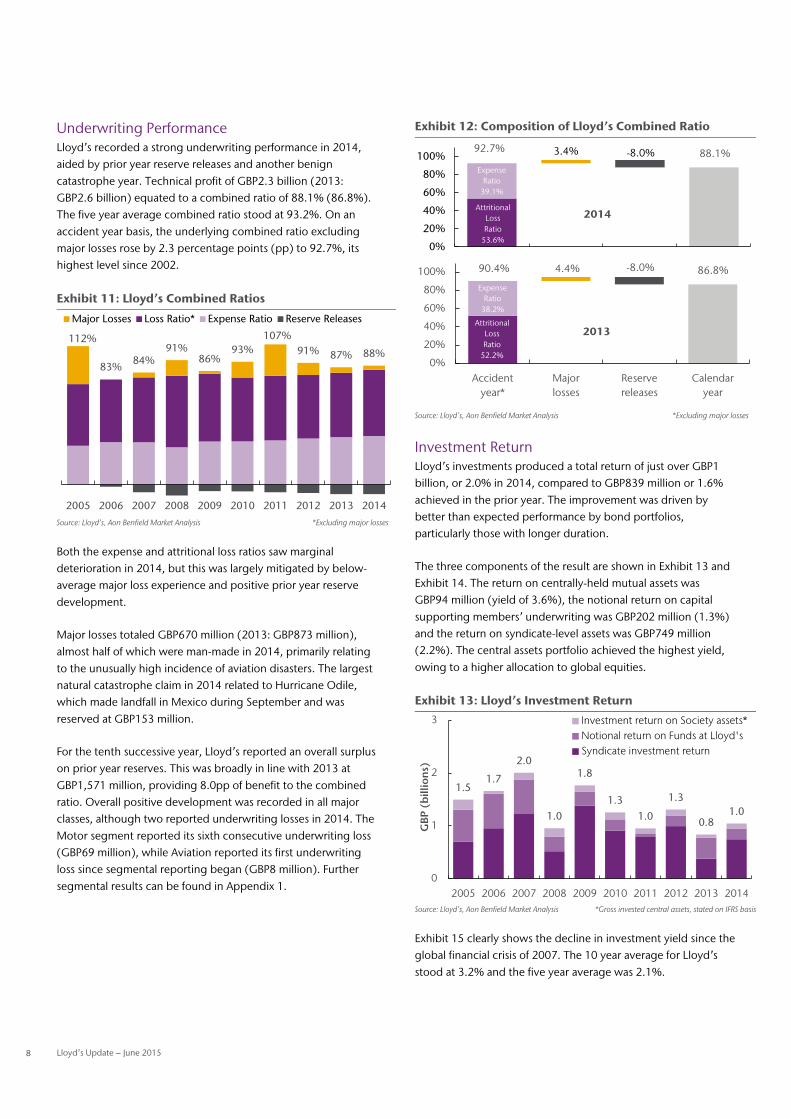
Underwriting Performance Lloyd’s recorded a strong underwriting performance in 2014, aided by prior year reserve releases and another benign catastrophe year. Technical profit of GBP2.3 billion (2013: GBP2.6 billion) equated to a combined ratio of 88.1% (86.8%). The five year average combined ratio stood at 93.2%. On an accident year basis, the underlying combined ratio excluding major losses rose by 2.3 percentage points (pp) to 92.7%, its highest level since 2002.
Exhibit 11: Lloyd’s Combined Ratios
Source: Lloyd’s, Aon Benfield Market Analysis *Excluding major losses
Both the expense and attritional loss ratios saw marginal deterioration in 2014, but this was largely mitigated by below-average major loss experience and positive prior year reserve development.
Major losses totaled GBP670 million (2013: GBP873 million), almost half of which were man-made in 2014, primarily relating to the unusually high incidence of aviation disasters. The largest natural catastrophe claim in 2014 related to Hurricane Odile, which made landfall in Mexico during September and was reserved at GBP153 million.
For the tenth successive year, Lloyd’s reported an overall surplus on prior year reserves. This was broadly in line with 2013 at GBP1,571 million, providing 8.0pp of benefit to the combined ratio. Overall positive development was recorded in all major classes, although two reported underwriting losses in 2014. The Motor segment reported its sixth consecutive underwriting loss (GBP69 million), while Aviation reported its first underwriting loss since segmental reporting began (GBP8 million). Further segmental results can be found in Appendix 1.
Exhibit 12: Composition of Lloyd’s Combined Ratio
Source: Lloyd’s, Aon Benfield Market Analysis *Excluding major losses
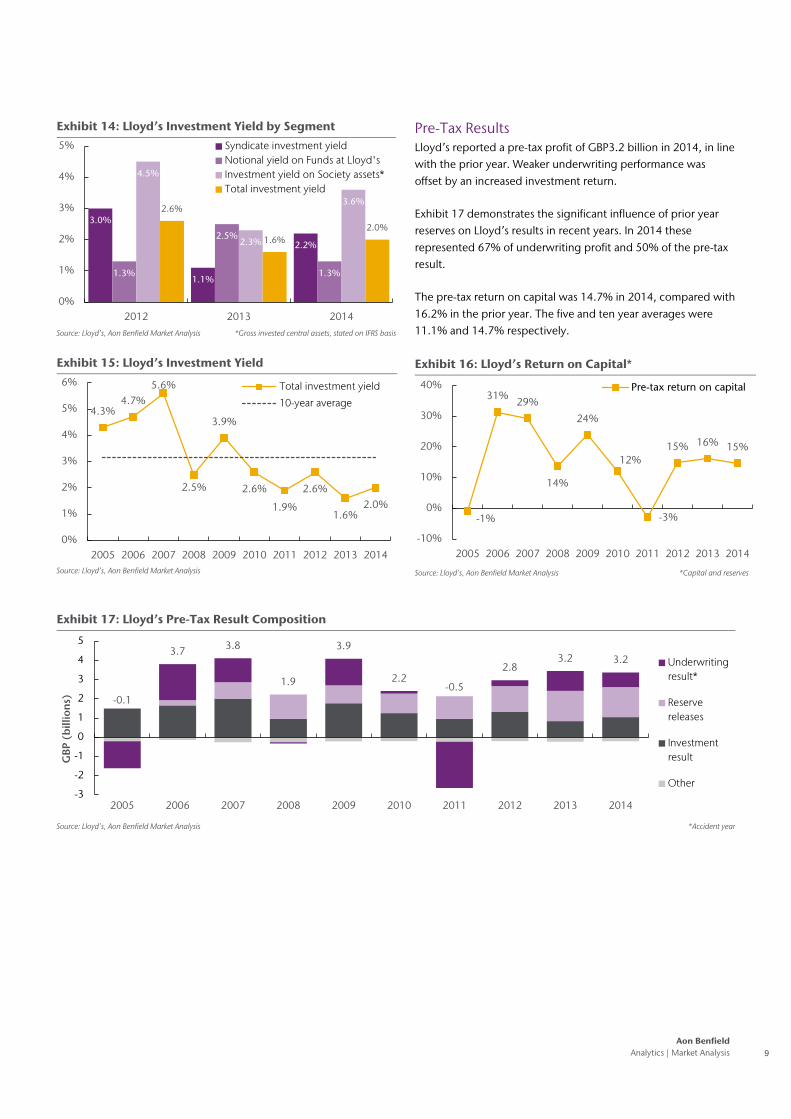
Investment Return Lloyd’s investments produced a total return of just over GBP1 billion, or 2.0% in 2014, compared to GBP839 million or 1.6% achieved in the prior year. The improvement was driven by better than expected performance by bond portfolios, particularly those with longer duration.
The three components of the result are shown in Exhibit 13 and Exhibit 14. The return on centrally-held mutual assets was GBP94 million (yield of 3.6%), the notional return on capital supporting members’ underwriting was GBP202 million (1.3%) and the return on syndicate-level assets was GBP749 million (2.2%). The central assets portfolio achieved the highest yield, owing to a higher allocation to global equities.
Exhibit 13: Lloyd’s Investment Return
Source: Lloyd’s, Aon Benfield Market Analysis *Gross invested central assets, stated on IFRS basis
Exhibit 15 clearly shows the decline in investment yield since the global financial crisis of 2007. The 10 year average for Lloyd’s stood at 3.2% and the five year average was 2.1%.
112%
83%84%
91%86%
93%107%
91% 87% 88%
2005 2006 2007 2008 2009 2010 2011 2012 2013 2014
Major Losses Loss Ratio* Expense Ratio Reserve Releases
AttritionalLossRatio
53.6%
92.7% 88.1%Expense
Ratio39.1%
3.4% -8.0%
0%
20%
40%
60%
80%
100%
Accidentyear*
Majorlosses
Reservereleases
Calendaryear
2014
AttritionalLossRatio
52.2%
90.4% 86.8%
Expense Ratio
38.2%
4.4% -8.0%
0%
20%
40%
60%
80%
100%
Accidentyear*
Majorlosses
Reservereleases
Calendaryear
2013
1.51.7
2.0
1.0
1.8
1.31.0
1.3
0.81.0
0
1
2
3
2005 2006 2007 2008 2009 2010 2011 2012 2013 2014
GBP
(b
illio
ns)
Investment return on Society assets*Notional return on Funds at Lloyd'sSyndicate investment return
Aon Benfield Analytics | Market Analysis 9
Exhibit 14: Lloyd’s Investment Yield by Segment
Source: Lloyd’s, Aon Benfield Market Analysis *Gross invested central assets, stated on IFRS basis
Exhibit 15: Lloyd’s Investment Yield
Source: Lloyd’s, Aon Benfield Market Analysis
Pre-Tax Results Lloyd’s reported a pre-tax profit of GBP3.2 billion in 2014, in line with the prior year. Weaker underwriting performance was offset by an increased investment return.
Exhibit 17 demonstrates the significant influence of prior year reserves on Lloyd’s results in recent years. In 2014 these represented 67% of underwriting profit and 50% of the pre-tax result.
The pre-tax return on capital was 14.7% in 2014, compared with 16.2% in the prior year. The five and ten year averages were 11.1% and 14.7% respectively.
Exhibit 16: Lloyd’s Return on Capital*
Source: Lloyd’s, Aon Benfield Market Analysis *Capital and reserves
Exhibit 17: Lloyd’s Pre-Tax Result Composition
Source: Lloyd’s, Aon Benfield Market Analysis *Accident year
3.0%
1.1%
2.2%
1.3%
2.5%
1.3%
4.5%
2.3%
3.6%2.6%
1.6%2.0%
0%
1%
2%
3%
4%
5%
2012 2013 2014
Syndicate investment yieldNotional yield on Funds at Lloyd'sInvestment yield on Society assets*Total investment yield
4.3%4.7%
5.6%
2.5%
3.9%
2.6%
1.9%
2.6%
1.6%2.0%
0%
1%
2%
3%
4%
5%
6%
2005 2006 2007 2008 2009 2010 2011 2012 2013 2014
Total investment yield
10-year average
-1%
31% 29%
14%
24%
12%
-3%
15% 16% 15%
-10%
0%
10%
20%
30%
40%
2005 2006 2007 2008 2009 2010 2011 2012 2013 2014
Pre-tax return on capital
-0.1
3.7 3.8
1.9
3.9
2.2-0.5
2.83.2 3.2
-3
-2
-1
0
1
2
3
4
5
2005 2006 2007 2008 2009 2010 2011 2012 2013 2014
GBP
(b
illio
ns)
Underwritingresult*
Reservereleases
Investmentresult
Other
10 Lloyd’s Update – June 2015
Balance Sheet at December 31, 2014 Lloyd’s balance sheet strength has been recognized by the leading rating agencies. Overall investment allocation
remains relatively conservative, capital resources are at record levels and legacy issues appear contained. The
Corporation has been liaising closely with the UK regulators in order to gain all necessary approvals for the
implementation of Solvency II in January 2016.
Exhibit 18: Summary Lloyd’s Balance Sheet
Balance Sheet GBP (millions) 2005 2006 2007 2008 2009 2010 2011 2012 2013 2014
1 Year Change
Cash and investments 35,012 35,091 36,981 44,370 46,254 48,483 51,415 51,767 51,494 54,860 6.5%
Gross technical provisions 44,548 37,401 36,253 47,463 43,544 46,428 51,918 51,517 49,277 50,696 2.9%
Reinsurers’ share 15,146 10,030 8,290 11,671 9,931 10,237 12,153 12,439 10,922 10,746 -1.6%
Net technical provisions 29,402 27,371 27,963 35,792 33,613 36,191 39,765 39,078 38,355 39,950 4.2%
Net resources* 10,992 13,333 14,461 15,264 19,121 19,121 19,114 20,193 21,107 23,471 11.2%
Source: Lloyd’s, Aon Benfield Market Analysis *Capital, reserves, subordinated loan notes and securities
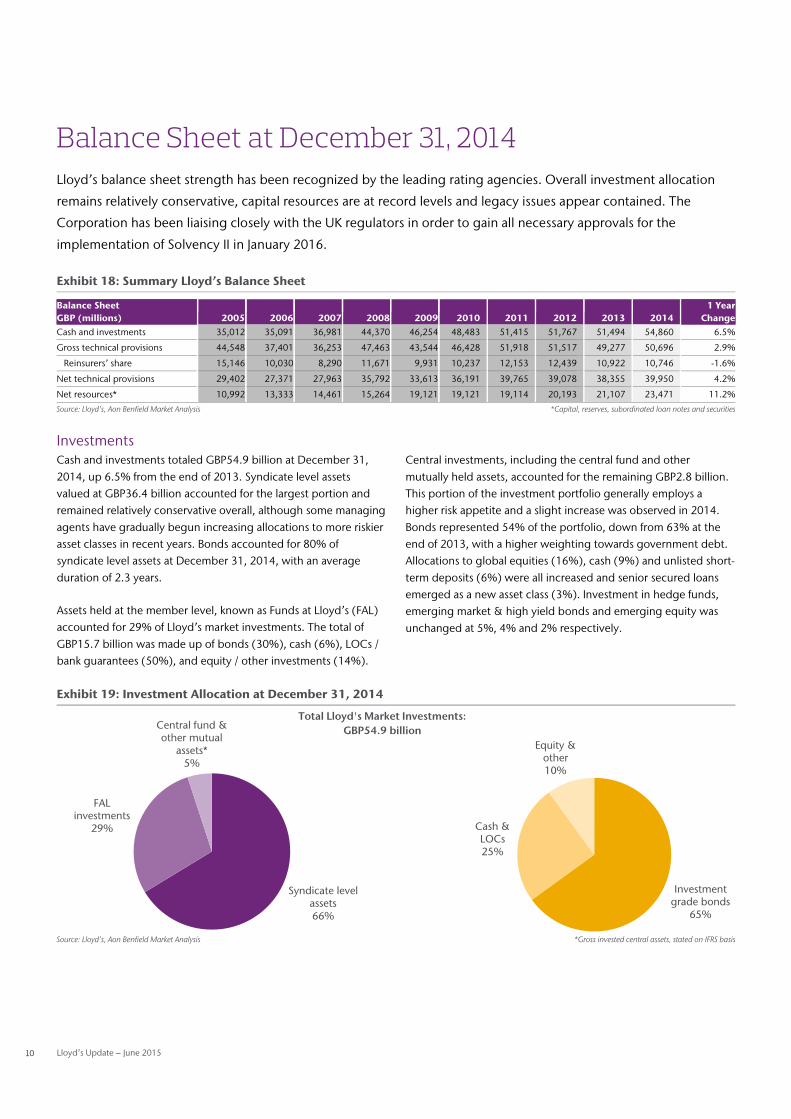
Investments Cash and investments totaled GBP54.9 billion at December 31, 2014, up 6.5% from the end of 2013. Syndicate level assets valued at GBP36.4 billion accounted for the largest portion and remained relatively conservative overall, although some managing agents have gradually begun increasing allocations to more riskier asset classes in recent years. Bonds accounted for 80% of syndicate level assets at December 31, 2014, with an average duration of 2.3 years.
Assets held at the member level, known as Funds at Lloyd’s (FAL) accounted for 29% of Lloyd’s market investments. The total of GBP15.7 billion was made up of bonds (30%), cash (6%), LOCs / bank guarantees (50%), and equity / other investments (14%).
Central investments, including the central fund and other mutually held assets, accounted for the remaining GBP2.8 billion. This portion of the investment portfolio generally employs a higher risk appetite and a slight increase was observed in 2014. Bonds represented 54% of the portfolio, down from 63% at the end of 2013, with a higher weighting towards government debt. Allocations to global equities (16%), cash (9%) and unlisted short-term deposits (6%) were all increased and senior secured loans emerged as a new asset class (3%). Investment in hedge funds, emerging market & high yield bonds and emerging equity was unchanged at 5%, 4% and 2% respectively.
Exhibit 19: Investment Allocation at December 31, 2014
Source: Lloyd’s, Aon Benfield Market Analysis *Gross invested central assets, stated on IFRS basis
Investment grade bonds
65%
Cash & LOCs25%
Equity & other10%
Syndicate level assets66%
FAL investments
29%
Central fund & other mutual
assets*5%
Total Lloyd's Market Investments: GBP54.9 billion
Aon Benfield Analytics | Market Analysis 11
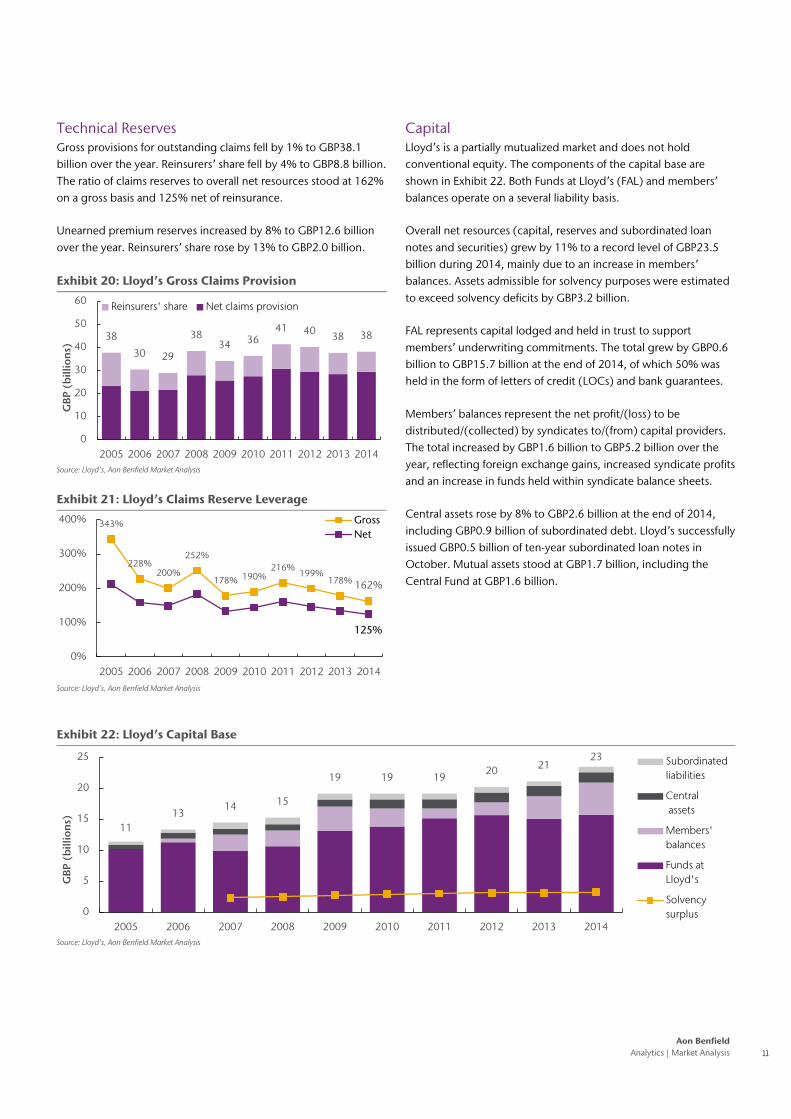
Technical Reserves Gross provisions for outstanding claims fell by 1% to GBP38.1 billion over the year. Reinsurers’ share fell by 4% to GBP8.8 billion. The ratio of claims reserves to overall net resources stood at 162% on a gross basis and 125% net of reinsurance.
Unearned premium reserves increased by 8% to GBP12.6 billion over the year. Reinsurers’ share rose by 13% to GBP2.0 billion.
Exhibit 20: Lloyd’s Gross Claims Provision
Source: Lloyd’s, Aon Benfield Market Analysis
Exhibit 21: Lloyd’s Claims Reserve Leverage
Source: Lloyd’s, Aon Benfield Market Analysis
Capital Lloyd’s is a partially mutualized market and does not hold conventional equity. The components of the capital base are shown in Exhibit 22. Both Funds at Lloyd’s (FAL) and members’ balances operate on a several liability basis.
Overall net resources (capital, reserves and subordinated loan notes and securities) grew by 11% to a record level of GBP23.5 billion during 2014, mainly due to an increase in members’ balances. Assets admissible for solvency purposes were estimated to exceed solvency deficits by GBP3.2 billion.
FAL represents capital lodged and held in trust to support members’ underwriting commitments. The total grew by GBP0.6 billion to GBP15.7 billion at the end of 2014, of which 50% was held in the form of letters of credit (LOCs) and bank guarantees.
Members’ balances represent the net profit/(loss) to be distributed/(collected) by syndicates to/(from) capital providers. The total increased by GBP1.6 billion to GBP5.2 billion over the year, reflecting foreign exchange gains, increased syndicate profits and an increase in funds held within syndicate balance sheets.
Central assets rose by 8% to GBP2.6 billion at the end of 2014, including GBP0.9 billion of subordinated debt. Lloyd’s successfully issued GBP0.5 billion of ten-year subordinated loan notes in October. Mutual assets stood at GBP1.7 billion, including the Central Fund at GBP1.6 billion.
Exhibit 22: Lloyd’s Capital Base
Source: Lloyd’s, Aon Benfield Market Analysis
38
30 29
3834 36
41 40 38 38
0
10
20
30
40
50
60
2005 2006 2007 2008 2009 2010 2011 2012 2013 2014
GBP
(b
illio
ns)
Reinsurers' share Net claims provision
343%
228%200%
252%
178% 190%216%
199%178% 162%
125%
0%
100%
200%
300%
400%
2005 2006 2007 2008 2009 2010 2011 2012 2013 2014
GrossNet
1113
14 15
19 19 1920 21
23
0
5
10
15
20
25
2005 2006 2007 2008 2009 2010 2011 2012 2013 2014
GBP
(b
illio
ns)
Subordinatedliabilities
Central assets
Members'balances
Funds atLloyd's
Solvencysurplus
12 Lloyd’s Update – June 2015
The Chain of Security
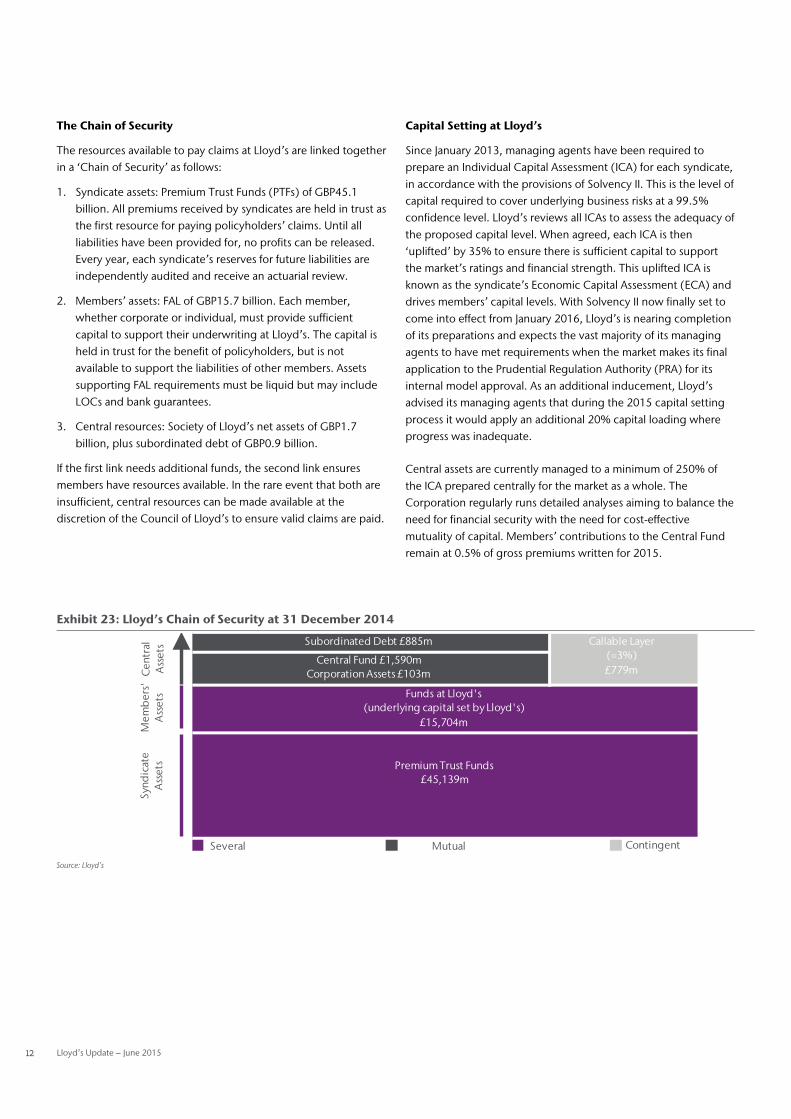
The resources available to pay claims at Lloyd’s are linked together in a ‘Chain of Security’ as follows:
1. Syndicate assets: Premium Trust Funds (PTFs) of GBP45.1 billion. All premiums received by syndicates are held in trust as the first resource for paying policyholders’ claims. Until all liabilities have been provided for, no profits can be released. Every year, each syndicate’s reserves for future liabilities are independently audited and receive an actuarial review.
2. Members’ assets: FAL of GBP15.7 billion. Each member, whether corporate or individual, must provide sufficient capital to support their underwriting at Lloyd’s. The capital is held in trust for the benefit of policyholders, but is not available to support the liabilities of other members. Assets supporting FAL requirements must be liquid but may include LOCs and bank guarantees.
3. Central resources: Society of Lloyd’s net assets of GBP1.7 billion, plus subordinated debt of GBP0.9 billion.
If the first link needs additional funds, the second link ensures members have resources available. In the rare event that both are insufficient, central resources can be made available at the discretion of the Council of Lloyd’s to ensure valid claims are paid.
Capital Setting at Lloyd’s
Since January 2013, managing agents have been required to prepare an Individual Capital Assessment (ICA) for each syndicate, in accordance with the provisions of Solvency II. This is the level of capital required to cover underlying business risks at a 99.5% confidence level. Lloyd’s reviews all ICAs to assess the adequacy of the proposed capital level. When agreed, each ICA is then ‘uplifted’ by 35% to ensure there is sufficient capital to support the market’s ratings and financial strength. This uplifted ICA is known as the syndicate’s Economic Capital Assessment (ECA) and drives members’ capital levels. With Solvency II now finally set to come into effect from January 2016, Lloyd’s is nearing completion of its preparations and expects the vast majority of its managing agents to have met requirements when the market makes its final application to the Prudential Regulation Authority (PRA) for its internal model approval. As an additional inducement, Lloyd’s advised its managing agents that during the 2015 capital setting process it would apply an additional 20% capital loading where progress was inadequate.
Central assets are currently managed to a minimum of 250% of the ICA prepared centrally for the market as a whole. The Corporation regularly runs detailed analyses aiming to balance the need for financial security with the need for cost-effective mutuality of capital. Members’ contributions to the Central Fund remain at 0.5% of gross premiums written for 2015.
Exhibit 23: Lloyd’s Chain of Security at 31 December 2014
Source: Lloyd’s
Cen
tral
A
sset
sM
emb
ers'
Ass
ets
Several Mutual Contingent
Synd
icat
eA
sset
s
Subordinated Debt £885m Callable Layer (=3%)£779m
Central Fund £1,590mCorporation Assets £103m
Funds at Lloyd's (underlying capital set by Lloyd's)
£15,704m
Premium Trust Funds£45,139m

Aon Benfield Analytics | Market Analysis 13
Appendices
14 Lloyd’s Update – June 2015
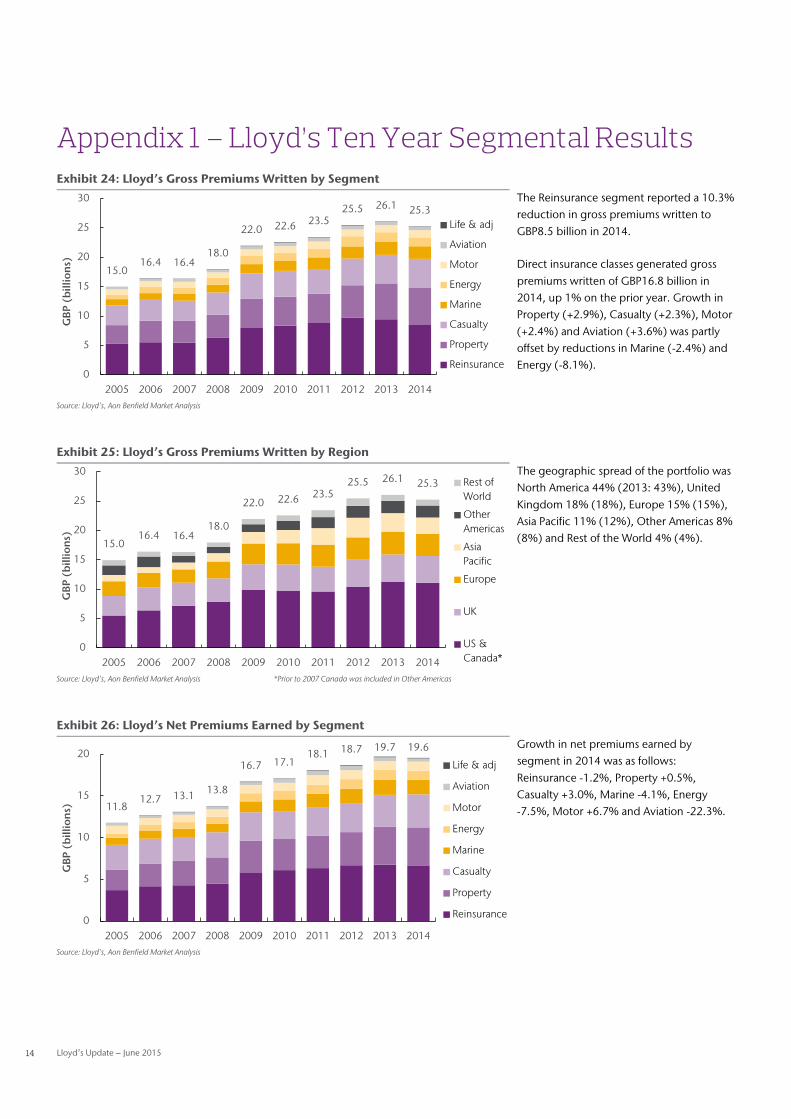
Appendix 1 – Lloyd’s Ten Year Segmental Results Exhibit 24: Lloyd’s Gross Premiums Written by Segment
The Reinsurance segment reported a 10.3% reduction in gross premiums written to GBP8.5 billion in 2014.
Direct insurance classes generated gross premiums written of GBP16.8 billion in 2014, up 1% on the prior year. Growth in Property (+2.9%), Casualty (+2.3%), Motor (+2.4%) and Aviation (+3.6%) was partly offset by reductions in Marine (-2.4%) and Energy (-8.1%).
Source: Lloyd’s, Aon Benfield Market Analysis
Exhibit 25: Lloyd’s Gross Premiums Written by Region
The geographic spread of the portfolio was North America 44% (2013: 43%), United Kingdom 18% (18%), Europe 15% (15%), Asia Pacific 11% (12%), Other Americas 8% (8%) and Rest of the World 4% (4%).
Source: Lloyd’s, Aon Benfield Market Analysis *Prior to 2007 Canada was included in Other Americas
Exhibit 26: Lloyd’s Net Premiums Earned by Segment
Growth in net premiums earned by segment in 2014 was as follows: Reinsurance -1.2%, Property +0.5%, Casualty +3.0%, Marine -4.1%, Energy -7.5%, Motor +6.7% and Aviation -22.3%.
Source: Lloyd’s, Aon Benfield Market Analysis
15.016.4 16.4
18.0
22.0 22.6 23.525.5 26.1 25.3
0
5
10
15
20
25
30
2005 2006 2007 2008 2009 2010 2011 2012 2013 2014
GBP
(b
illio
ns)
Life & adj
Aviation
Motor
Energy
Marine
Casualty
Property
Reinsurance
15.016.4 16.4
18.0
22.0 22.6 23.525.5 26.1 25.3
0
5
10
15
20
25
30
2005 2006 2007 2008 2009 2010 2011 2012 2013 2014
GBP
(b
illio
ns)
Rest ofWorld
OtherAmericas
AsiaPacific
Europe
UK
US &Canada*
11.812.7 13.1 13.8
16.7 17.118.1 18.7 19.7 19.6
0
5
10
15
20
2005 2006 2007 2008 2009 2010 2011 2012 2013 2014
GBP
(b
illio
ns)
Life & adj
Aviation
Motor
Energy
Marine
Casualty
Property
Reinsurance
Aon Benfield Analytics | Market Analysis 15
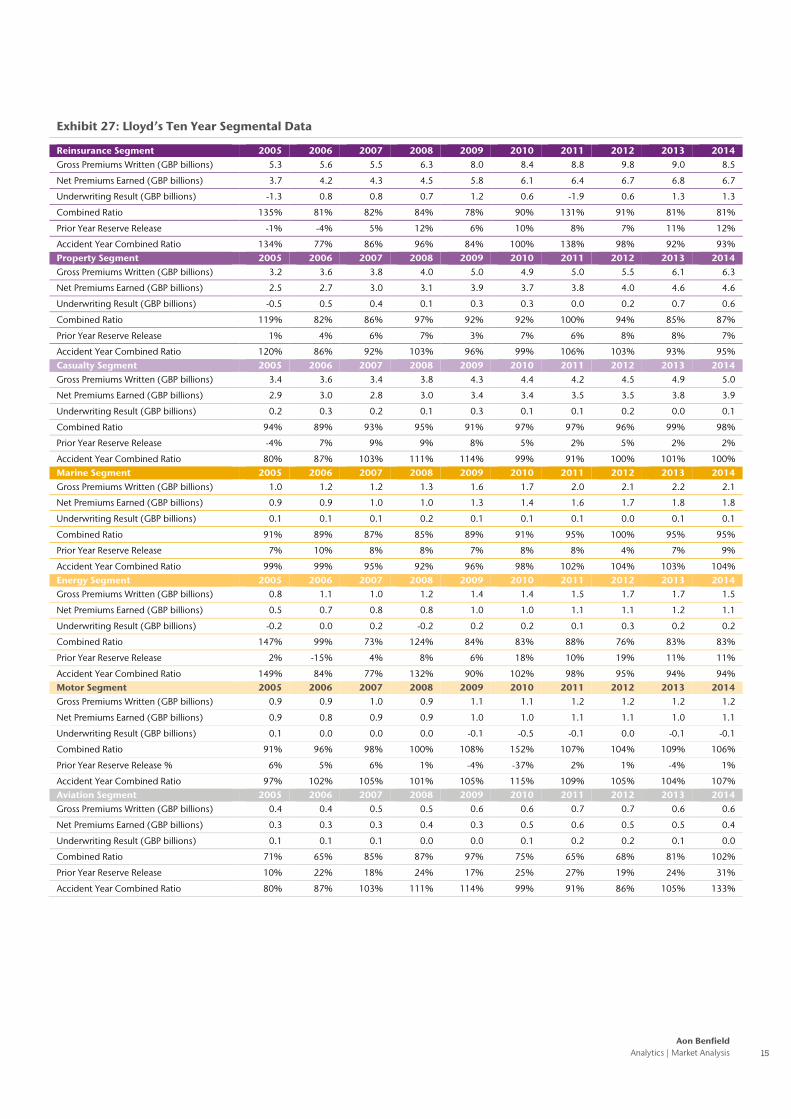
Exhibit 27: Lloyd’s Ten Year Segmental Data
Reinsurance Segment 2005 2006 2007 2008 2009 2010 2011 2012 2013 2014 Gross Premiums Written (GBP billions) 5.3 5.6 5.5 6.3 8.0 8.4 8.8 9.8 9.0 8.5
Net Premiums Earned (GBP billions) 3.7 4.2 4.3 4.5 5.8 6.1 6.4 6.7 6.8 6.7
Underwriting Result (GBP billions) -1.3 0.8 0.8 0.7 1.2 0.6 -1.9 0.6 1.3 1.3
Combined Ratio 135% 81% 82% 84% 78% 90% 131% 91% 81% 81%
Prior Year Reserve Release -1% -4% 5% 12% 6% 10% 8% 7% 11% 12%
Accident Year Combined Ratio 134% 77% 86% 96% 84% 100% 138% 98% 92% 93% Property Segment 2005 2006 2007 2008 2009 2010 2011 2012 2013 2014 Gross Premiums Written (GBP billions) 3.2 3.6 3.8 4.0 5.0 4.9 5.0 5.5 6.1 6.3
Net Premiums Earned (GBP billions) 2.5 2.7 3.0 3.1 3.9 3.7 3.8 4.0 4.6 4.6
Underwriting Result (GBP billions) -0.5 0.5 0.4 0.1 0.3 0.3 0.0 0.2 0.7 0.6
Combined Ratio 119% 82% 86% 97% 92% 92% 100% 94% 85% 87%
Prior Year Reserve Release 1% 4% 6% 7% 3% 7% 6% 8% 8% 7%
Accident Year Combined Ratio 120% 86% 92% 103% 96% 99% 106% 103% 93% 95% Casualty Segment 2005 2006 2007 2008 2009 2010 2011 2012 2013 2014 Gross Premiums Written (GBP billions) 3.4 3.6 3.4 3.8 4.3 4.4 4.2 4.5 4.9 5.0
Net Premiums Earned (GBP billions) 2.9 3.0 2.8 3.0 3.4 3.4 3.5 3.5 3.8 3.9
Underwriting Result (GBP billions) 0.2 0.3 0.2 0.1 0.3 0.1 0.1 0.2 0.0 0.1
Combined Ratio 94% 89% 93% 95% 91% 97% 97% 96% 99% 98%
Prior Year Reserve Release -4% 7% 9% 9% 8% 5% 2% 5% 2% 2%
Accident Year Combined Ratio 80% 87% 103% 111% 114% 99% 91% 100% 101% 100% Marine Segment 2005 2006 2007 2008 2009 2010 2011 2012 2013 2014 Gross Premiums Written (GBP billions) 1.0 1.2 1.2 1.3 1.6 1.7 2.0 2.1 2.2 2.1
Net Premiums Earned (GBP billions) 0.9 0.9 1.0 1.0 1.3 1.4 1.6 1.7 1.8 1.8
Underwriting Result (GBP billions) 0.1 0.1 0.1 0.2 0.1 0.1 0.1 0.0 0.1 0.1
Combined Ratio 91% 89% 87% 85% 89% 91% 95% 100% 95% 95%
Prior Year Reserve Release 7% 10% 8% 8% 7% 8% 8% 4% 7% 9%
Accident Year Combined Ratio 99% 99% 95% 92% 96% 98% 102% 104% 103% 104% Energy Segment 2005 2006 2007 2008 2009 2010 2011 2012 2013 2014 Gross Premiums Written (GBP billions) 0.8 1.1 1.0 1.2 1.4 1.4 1.5 1.7 1.7 1.5
Net Premiums Earned (GBP billions) 0.5 0.7 0.8 0.8 1.0 1.0 1.1 1.1 1.2 1.1
Underwriting Result (GBP billions) -0.2 0.0 0.2 -0.2 0.2 0.2 0.1 0.3 0.2 0.2
Combined Ratio 147% 99% 73% 124% 84% 83% 88% 76% 83% 83%
Prior Year Reserve Release 2% -15% 4% 8% 6% 18% 10% 19% 11% 11%
Accident Year Combined Ratio 149% 84% 77% 132% 90% 102% 98% 95% 94% 94% Motor Segment 2005 2006 2007 2008 2009 2010 2011 2012 2013 2014 Gross Premiums Written (GBP billions) 0.9 0.9 1.0 0.9 1.1 1.1 1.2 1.2 1.2 1.2
Net Premiums Earned (GBP billions) 0.9 0.8 0.9 0.9 1.0 1.0 1.1 1.1 1.0 1.1
Underwriting Result (GBP billions) 0.1 0.0 0.0 0.0 -0.1 -0.5 -0.1 0.0 -0.1 -0.1
Combined Ratio 91% 96% 98% 100% 108% 152% 107% 104% 109% 106%
Prior Year Reserve Release % 6% 5% 6% 1% -4% -37% 2% 1% -4% 1%
Accident Year Combined Ratio 97% 102% 105% 101% 105% 115% 109% 105% 104% 107% Aviation Segment 2005 2006 2007 2008 2009 2010 2011 2012 2013 2014 Gross Premiums Written (GBP billions) 0.4 0.4 0.5 0.5 0.6 0.6 0.7 0.7 0.6 0.6
Net Premiums Earned (GBP billions) 0.3 0.3 0.3 0.4 0.3 0.5 0.6 0.5 0.5 0.4
Underwriting Result (GBP billions) 0.1 0.1 0.1 0.0 0.0 0.1 0.2 0.2 0.1 0.0
Combined Ratio 71% 65% 85% 87% 97% 75% 65% 68% 81% 102%
Prior Year Reserve Release 10% 22% 18% 24% 17% 25% 27% 19% 24% 31%
Accident Year Combined Ratio 80% 87% 103% 111% 114% 99% 91% 86% 105% 133%
16 Lloyd’s Update – June 2015
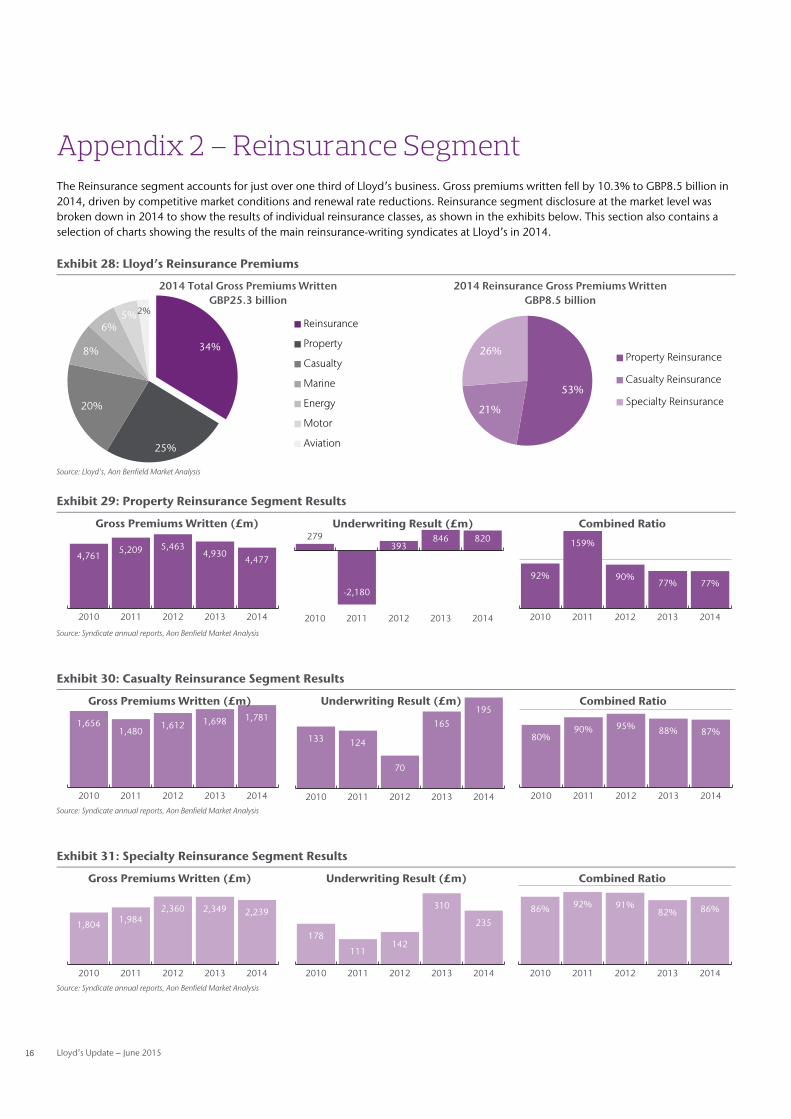
Appendix 2 – Reinsurance Segment The Reinsurance segment accounts for just over one third of Lloyd’s business. Gross premiums written fell by 10.3% to GBP8.5 billion in 2014, driven by competitive market conditions and renewal rate reductions. Reinsurance segment disclosure at the market level was broken down in 2014 to show the results of individual reinsurance classes, as shown in the exhibits below. This section also contains a selection of charts showing the results of the main reinsurance-writing syndicates at Lloyd’s in 2014.
Exhibit 28: Lloyd’s Reinsurance Premiums
Source: Lloyd’s, Aon Benfield Market Analysis
Exhibit 29: Property Reinsurance Segment Results
Source: Syndicate annual reports, Aon Benfield Market Analysis
Exhibit 30: Casualty Reinsurance Segment Results
Source: Syndicate annual reports, Aon Benfield Market Analysis
Exhibit 31: Specialty Reinsurance Segment Results
Source: Syndicate annual reports, Aon Benfield Market Analysis
34%
25%
20%
8%
6%5%2%
2014 Total Gross Premiums Written GBP25.3 billion
Reinsurance
Property
Casualty
Marine
Energy
Motor
Aviation
53%
21%
26%
2014 Reinsurance Gross Premiums Written GBP8.5 billion
Property Reinsurance
Casualty Reinsurance
Specialty Reinsurance
4,7615,209 5,463
4,9304,477
2010 2011 2012 2013 2014
Gross Premiums Written (£m)
92%
159%
90%77% 77%
2010 2011 2012 2013 2014
Combined Ratio279
-2,180
393846 820
2010 2011 2012 2013 2014
Underwriting Result (£m)
1,6561,480
1,612 1,698 1,781
2010 2011 2012 2013 2014
Gross Premiums Written (£m)
80%90% 95% 88% 87%
2010 2011 2012 2013 2014
Combined Ratio
133 124
70
165
195
2010 2011 2012 2013 2014
Underwriting Result (£m)
1,804 1,9842,360 2,349 2,239
2010 2011 2012 2013 2014
Gross Premiums Written (£m)
86% 92% 91%82% 86%
2010 2011 2012 2013 2014
Combined Ratio
178
111142
310
235
2010 2011 2012 2013 2014
Underwriting Result (£m)
Aon Benfield Analytics | Market Analysis 17
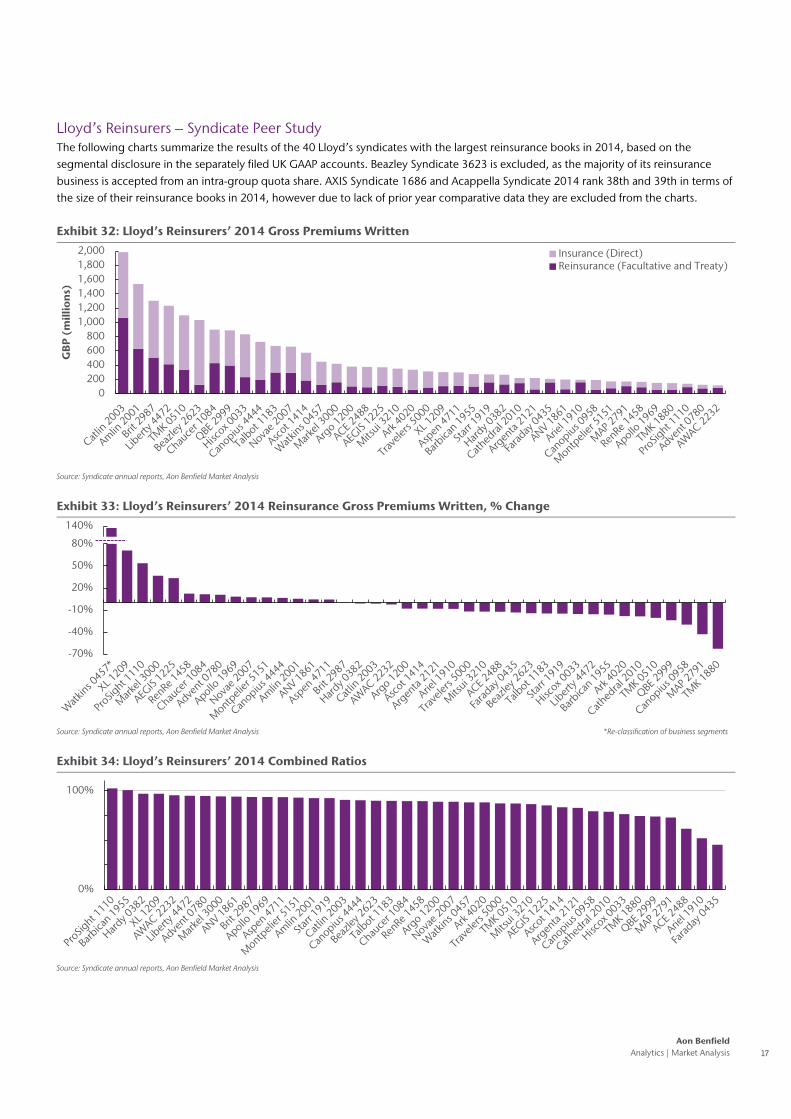
Lloyd’s Reinsurers – Syndicate Peer Study The following charts summarize the results of the 40 Lloyd’s syndicates with the largest reinsurance books in 2014, based on the segmental disclosure in the separately filed UK GAAP accounts. Beazley Syndicate 3623 is excluded, as the majority of its reinsurance business is accepted from an intra-group quota share. AXIS Syndicate 1686 and Acappella Syndicate 2014 rank 38th and 39th in terms of the size of their reinsurance books in 2014, however due to lack of prior year comparative data they are excluded from the charts.
Exhibit 32: Lloyd’s Reinsurers’ 2014 Gross Premiums Written
Source: Syndicate annual reports, Aon Benfield Market Analysis
Exhibit 33: Lloyd’s Reinsurers’ 2014 Reinsurance Gross Premiums Written, % Change
Source: Syndicate annual reports, Aon Benfield Market Analysis *Re-classification of business segments
Exhibit 34: Lloyd’s Reinsurers’ 2014 Combined Ratios
Source: Syndicate annual reports, Aon Benfield Market Analysis
0200400600800
1,0001,2001,4001,6001,8002,000
GB
P (
mill
ion
s)
Insurance (Direct)Reinsurance (Facultative and Treaty)
-70%-40%-10%20%50%80%
110%140%
-70%
-40%
-10%
20%
50%
80%
0%
100%
18 Lloyd’s Update – June 2015
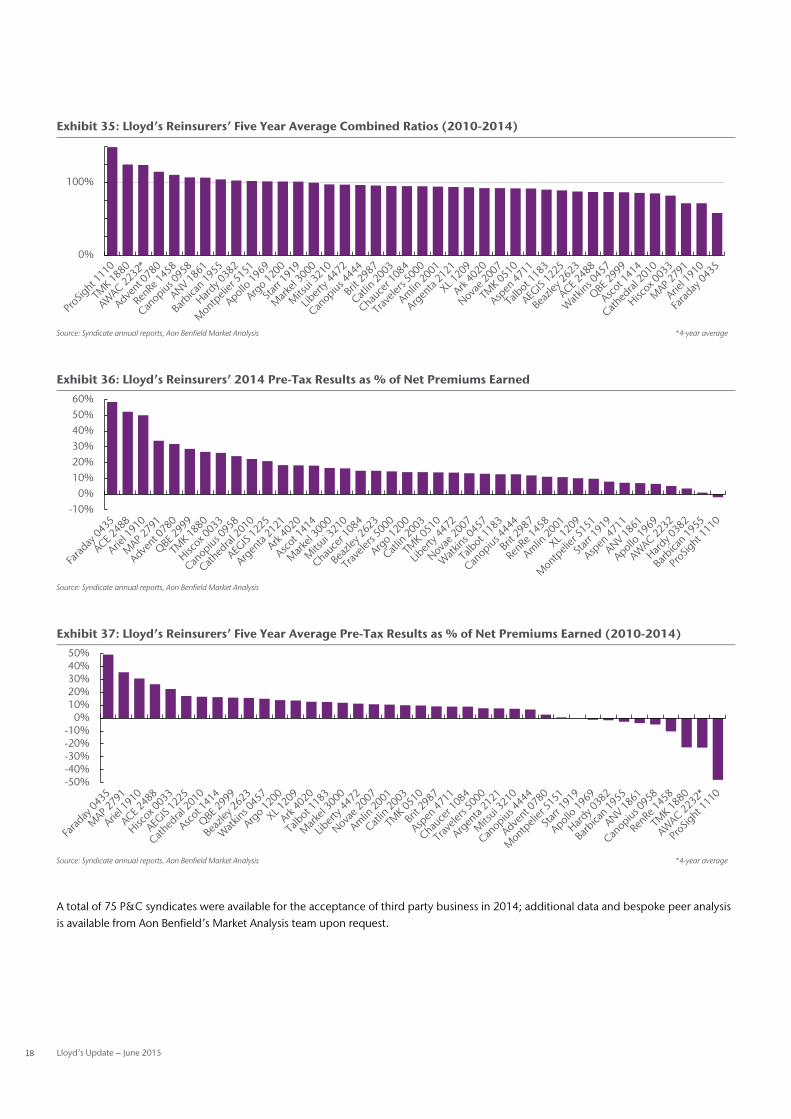
Exhibit 35: Lloyd’s Reinsurers’ Five Year Average Combined Ratios (2010-2014)
Source: Syndicate annual reports, Aon Benfield Market Analysis *4-year average
Exhibit 36: Lloyd’s Reinsurers’ 2014 Pre-Tax Results as % of Net Premiums Earned
Source: Syndicate annual reports, Aon Benfield Market Analysis
Exhibit 37: Lloyd’s Reinsurers’ Five Year Average Pre-Tax Results as % of Net Premiums Earned (2010-2014)
Source: Syndicate annual reports, Aon Benfield Market Analysis *4-year average
A total of 75 P&C syndicates were available for the acceptance of third party business in 2014; additional data and bespoke peer analysis is available from Aon Benfield’s Market Analysis team upon request.
0%
100%
-10%0%
10%20%30%40%50%60%
-50%-40%-30%-20%-10%
0%10%20%30%40%50%
Aon Benfield Analytics | Market Analysis 19
Appendix 3: Active Syndicate Listing
20 Lloyd’s Update – June 2015
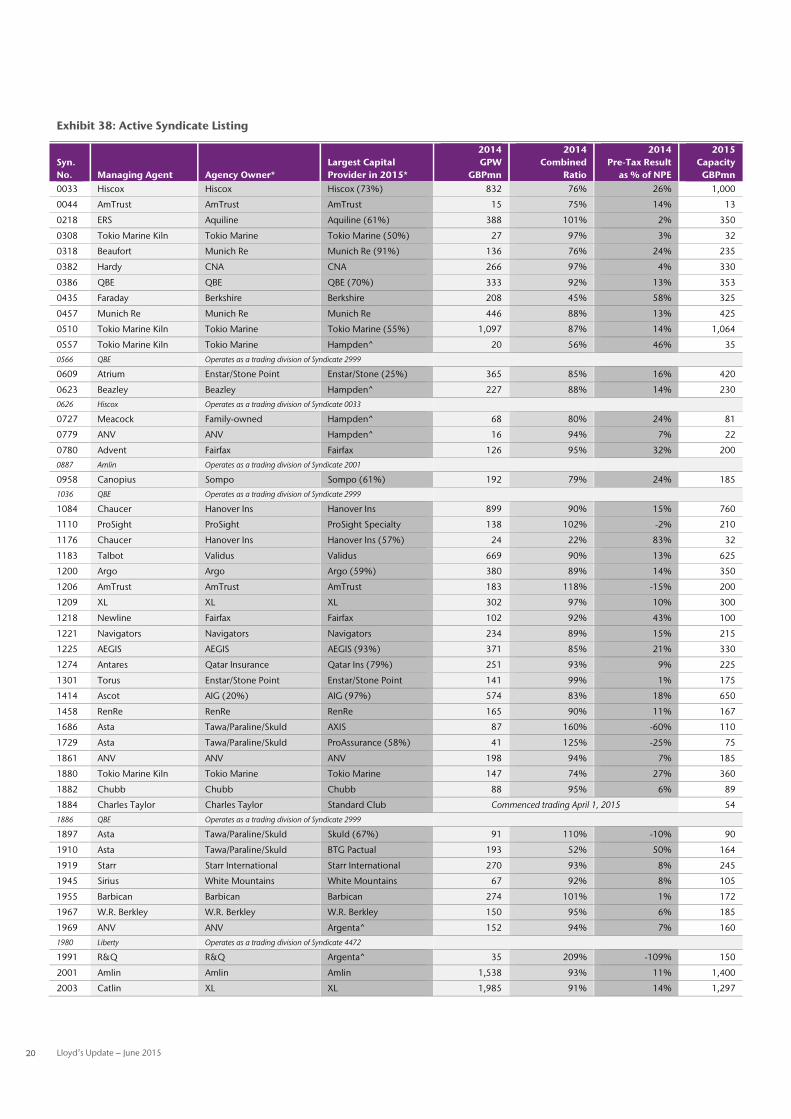
Exhibit 38: Active Syndicate Listing
Syn. No. Managing Agent Agency Owner*
Largest Capital Provider in 2015*
2014 GPW
GBPmn
2014 Combined
Ratio
2014 Pre-Tax Result
as % of NPE
2015 Capacity
GBPmn 0033 Hiscox Hiscox Hiscox (73%) 832 76% 26% 1,000
0044 AmTrust AmTrust AmTrust 15 75% 14% 13
0218 ERS Aquiline Aquiline (61%) 388 101% 2% 350
0308 Tokio Marine Kiln Tokio Marine Tokio Marine (50%) 27 97% 3% 32
0318 Beaufort Munich Re Munich Re (91%) 136 76% 24% 235
0382 Hardy CNA CNA 266 97% 4% 330
0386 QBE QBE QBE (70%) 333 92% 13% 353
0435 Faraday Berkshire Berkshire 208 45% 58% 325
0457 Munich Re Munich Re Munich Re 446 88% 13% 425
0510 Tokio Marine Kiln Tokio Marine Tokio Marine (55%) 1,097 87% 14% 1,064
0557 Tokio Marine Kiln Tokio Marine Hampden^ 20 56% 46% 35
0566 QBE Operates as a trading division of Syndicate 2999
0609 Atrium Enstar/Stone Point Enstar/Stone (25%) 365 85% 16% 420
0623 Beazley Beazley Hampden^ 227 88% 14% 230
0626 Hiscox Operates as a trading division of Syndicate 0033
0727 Meacock Family-owned Hampden^ 68 80% 24% 81
0779 ANV ANV Hampden^ 16 94% 7% 22
0780 Advent Fairfax Fairfax 126 95% 32% 200
0887 Amlin Operates as a trading division of Syndicate 2001
0958 Canopius Sompo Sompo (61%) 192 79% 24% 185
1036 QBE Operates as a trading division of Syndicate 2999
1084 Chaucer Hanover Ins Hanover Ins 899 90% 15% 760
1110 ProSight ProSight ProSight Specialty 138 102% -2% 210
1176 Chaucer Hanover Ins Hanover Ins (57%) 24 22% 83% 32
1183 Talbot Validus Validus 669 90% 13% 625
1200 Argo Argo Argo (59%) 380 89% 14% 350
1206 AmTrust AmTrust AmTrust 183 118% -15% 200
1209 XL XL XL 302 97% 10% 300
1218 Newline Fairfax Fairfax 102 92% 43% 100
1221 Navigators Navigators Navigators 234 89% 15% 215
1225 AEGIS AEGIS AEGIS (93%) 371 85% 21% 330
1274 Antares Qatar Insurance Qatar Ins (79%) 251 93% 9% 225
1301 Torus Enstar/Stone Point Enstar/Stone Point 141 99% 1% 175
1414 Ascot AIG (20%) AIG (97%) 574 83% 18% 650
1458 RenRe RenRe RenRe 165 90% 11% 167
1686 Asta Tawa/Paraline/Skuld AXIS 87 160% -60% 110
1729 Asta Tawa/Paraline/Skuld ProAssurance (58%) 41 125% -25% 75
1861 ANV ANV ANV 198 94% 7% 185
1880 Tokio Marine Kiln Tokio Marine Tokio Marine 147 74% 27% 360
1882 Chubb Chubb Chubb 88 95% 6% 89
1884 Charles Taylor Charles Taylor Standard Club Commenced trading April 1, 2015 54
1886 QBE Operates as a trading division of Syndicate 2999
1897 Asta Tawa/Paraline/Skuld Skuld (67%) 91 110% -10% 90
1910 Asta Tawa/Paraline/Skuld BTG Pactual 193 52% 50% 164
1919 Starr Starr International Starr International 270 93% 8% 245
1945 Sirius White Mountains White Mountains 67 92% 8% 105
1955 Barbican Barbican Barbican 274 101% 1% 172
1967 W.R. Berkley W.R. Berkley W.R. Berkley 150 95% 6% 185
1969 ANV ANV Argenta^ 152 94% 7% 160
1980 Liberty Operates as a trading division of Syndicate 4472
1991 R&Q R&Q Argenta^ 35 209% -109% 150
2001 Amlin Amlin Amlin 1,538 93% 11% 1,400
2003 Catlin XL XL 1,985 91% 14% 1,297
Aon Benfield Analytics | Market Analysis 21
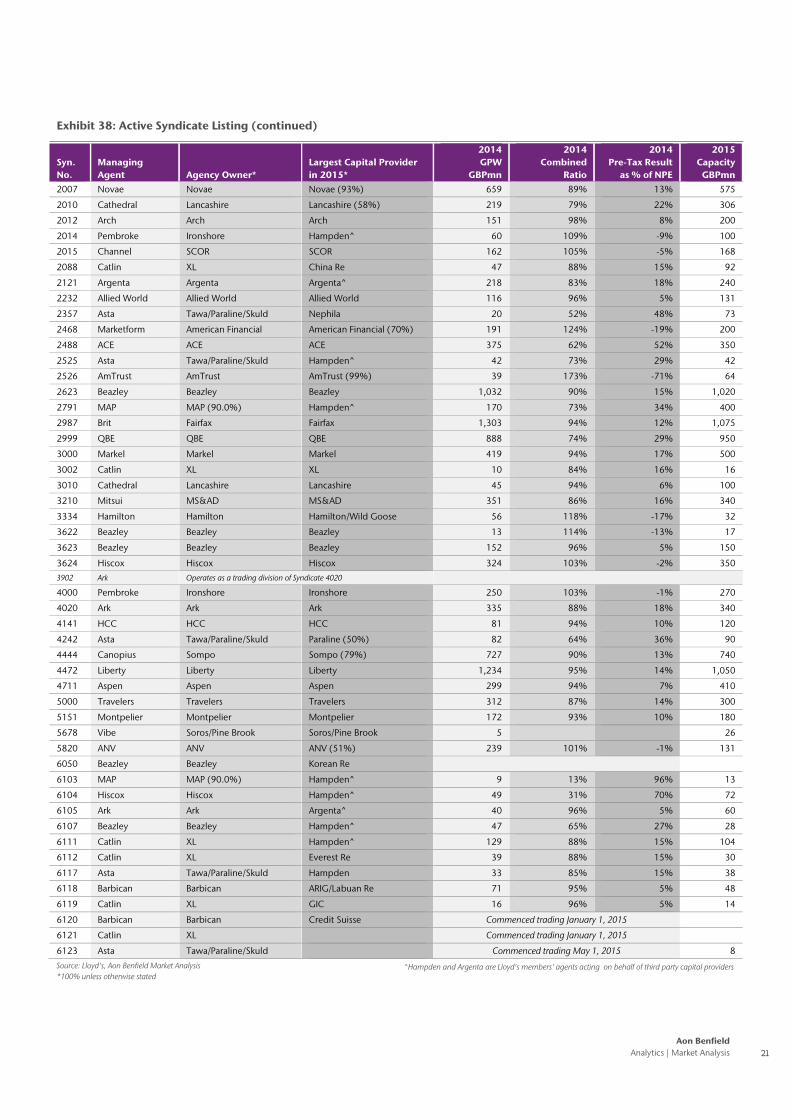
Exhibit 38: Active Syndicate Listing (continued)
Syn. No.
Managing Agent Agency Owner*
Largest Capital Provider in 2015*
2014 GPW
GBPmn
2014 Combined
Ratio
2014 Pre-Tax Result
as % of NPE
2015 Capacity
GBPmn
2007 Novae Novae Novae (93%) 659 89% 13% 575
2010 Cathedral Lancashire Lancashire (58%) 219 79% 22% 306
2012 Arch Arch Arch 151 98% 8% 200
2014 Pembroke Ironshore Hampden^ 60 109% -9% 100
2015 Channel SCOR SCOR 162 105% -5% 168
2088 Catlin XL China Re 47 88% 15% 92
2121 Argenta Argenta Argenta^ 218 83% 18% 240
2232 Allied World Allied World Allied World 116 96% 5% 131
2357 Asta Tawa/Paraline/Skuld Nephila 20 52% 48% 73
2468 Marketform American Financial American Financial (70%) 191 124% -19% 200
2488 ACE ACE ACE 375 62% 52% 350
2525 Asta Tawa/Paraline/Skuld Hampden^ 42 73% 29% 42
2526 AmTrust AmTrust AmTrust (99%) 39 173% -71% 64
2623 Beazley Beazley Beazley 1,032 90% 15% 1,020
2791 MAP MAP (90.0%) Hampden^ 170 73% 34% 400
2987 Brit Fairfax Fairfax 1,303 94% 12% 1,075
2999 QBE QBE QBE 888 74% 29% 950
3000 Markel Markel Markel 419 94% 17% 500
3002 Catlin XL XL 10 84% 16% 16
3010 Cathedral Lancashire Lancashire 45 94% 6% 100
3210 Mitsui MS&AD MS&AD 351 86% 16% 340
3334 Hamilton Hamilton Hamilton/Wild Goose 56 118% -17% 32
3622 Beazley Beazley Beazley 13 114% -13% 17
3623 Beazley Beazley Beazley 152 96% 5% 150
3624 Hiscox Hiscox Hiscox 324 103% -2% 350
3902 Ark Operates as a trading division of Syndicate 4020
4000 Pembroke Ironshore Ironshore 250 103% -1% 270
4020 Ark Ark Ark 335 88% 18% 340
4141 HCC HCC HCC 81 94% 10% 120
4242 Asta Tawa/Paraline/Skuld Paraline (50%) 82 64% 36% 90
4444 Canopius Sompo Sompo (79%) 727 90% 13% 740
4472 Liberty Liberty Liberty 1,234 95% 14% 1,050
4711 Aspen Aspen Aspen 299 94% 7% 410
5000 Travelers Travelers Travelers 312 87% 14% 300
5151 Montpelier Montpelier Montpelier 172 93% 10% 180
5678 Vibe Soros/Pine Brook Soros/Pine Brook 5 26
5820 ANV ANV ANV (51%) 239 101% -1% 131
6050 Beazley Beazley Korean Re
6103 MAP MAP (90.0%) Hampden^ 9 13% 96% 13
6104 Hiscox Hiscox Hampden^ 49 31% 70% 72
6105 Ark Ark Argenta^ 40 96% 5% 60
6107 Beazley Beazley Hampden^ 47 65% 27% 28
6111 Catlin XL Hampden^ 129 88% 15% 104
6112 Catlin XL Everest Re 39 88% 15% 30
6117 Asta Tawa/Paraline/Skuld Hampden 33 85% 15% 38
6118 Barbican Barbican ARIG/Labuan Re 71 95% 5% 48
6119 Catlin XL GIC 16 96% 5% 14
6120 Barbican Barbican Credit Suisse Commenced trading January 1, 2015
6121 Catlin XL Commenced trading January 1, 2015
6123 Asta Tawa/Paraline/Skuld Commenced trading May 1, 2015 8
Source: Lloyd's, Aon Benfield Market Analysis *100% unless otherwise stated
^Hampden and Argenta are Lloyd's members' agents acting on behalf of third party capital providers
22 Lloyd’s Update – June 2015
Contacts
Mike Van Slooten
Head of Market Analysis - International Aon Benfield Analytics +44.207.7522.8106 [email protected]
Mike McClane
Head of Market Analysis - Americas Aon Benfield Analytics +1.215.751.1596 [email protected]
Eleanore Obst
Analyst Market Analysis - International Aon Benfield Analytics +44.207.7522.3823 [email protected]
Kathryn Moyse
Analyst Market Analysis - International Aon Benfield Analytics +44.207.7522.8173 [email protected]
About Aon Benfield
Aon Benfield, a division of Aon plc (NYSE: AON), is the world‘s leading reinsurance intermediary and full-service capital advisor. We empower our clients to better understand, manage and transfer risk through innovative solutions and personalized access to all forms of global reinsurance capital across treaty, facultative and capital markets. As a trusted advocate, we deliver local reach to the world‘s markets, an unparalleled investment in innovative analytics, including catastrophe
management, actuarial and rating agency advisory. Through our professionals’ expertise and experience, we advise clients in making optimal capital choices that will empower results and improve operational effectiveness for their business. With more than 80 offices in 50 countries, our worldwide client base has access to the broadest portfolio of integrated capital solutions and services. To learn how Aon Benfield helps empower results, please visit aonbenfield.com.
Aon UK Limited trading as Aon Benfield (for itself and on behalf of each subsidiary company of Aon Plc) (“Aon Benfield”) reserves all rights to the content of this report. This document is intended as a courtesy to the recipient for general information and marketing purposes only and should not be construed as giving advice or opinions of any kind (including but not limited to insurance, tax, regulatory or legal advice). The contents of this document are based on publicly available information and/or third party sources in respect of which Aon Benfield has no control and which have not necessarily been verified. The content of this document is made available without warranty of any kind and without any other assurance whatsoever as to its completeness or accuracy. Aon Benfield disclaims any legal or other liability to any person or organization or any other recipient of this document (together a "Recipient") for loss or damage caused by or resulting from any reliance placed on this document or its contents by such Recipient.
Best's Credit Ratings are under continuous review and subject to change and/or affirmation. For the latest Best’s Credit Ratings and Best’s Credit Reports (which include Best’s Credit Ratings), visit the A.M. Best website at http://www.ambest.com. See Guide to Best’s Credit Ratings for explanation of use and charges. Best's Credit Ratings reproduced herein appear under license from A.M. Best and do not constitute, either expressly or impliedly, an endorsement of (Licensee's publication or service) or its recommendations, formulas, criteria or comparisons to any other ratings, rating scales or rating organizations which are published or referenced herein. A.M. Best is not responsible for transcription errors made in presenting Best's Credit Ratings. Best’s Credit Ratings are proprietary and may not be reproduced or distributed without the express written permission of A.M. Best Company. A Best’s Financial Strength Rating opinion addresses the relative ability of an insurer to meet its ongoing insurance obligations. It is not a warranty of a company’s financial strength and ability to meet its obligations to policyholders. View our Important Notice: Best's Credit Ratings for a disclaimer notice and complete details at http://www.ambest.com/ratings/notice.

Aon Benfield Analytics | Market Analysis 23
Risk. Reinsurance. Human Resources.
About Aon Aon plc (NYSE:AON) is the leading global provider of risk management, insurance and reinsurance brokerage, and human resources solutions and outsourcing services. Through its more than 66,000 colleagues worldwide, Aon unites to empower results for clients in over 120 countries via innovative and effective risk and people solutions and through industry-leading global resources and technical expertise. Aon has been named repeatedly as the world’s best broker, best insurance intermediary, best reinsurance intermediary, best captives manager, and best employee benefits consulting firm by multiple industry sources. Visit aon.com for more information on Aon and aon.com/ manchesterunited to learn about Aon’s global partnership with Manchester United.
© Aon plc 2014. All rights reserved.
The information contained herein and the statements expressed are of a general nature and are not intended to address the circumstances of any particular individual or entity. Although we endeavor to provide accurate and timely information and use sources we consider reliable, there can be no guarantee that such information is accurate as of the date it is received or that it will continue to be accurate in the future. No one should act on such information without appropriate professional advice after a thorough examination of the particular situation.