Embed Size (px)
Citation preview
NPS-DHS Project/Product Overview Playbook #: RSC-04B
i
NOAA Night Lights/Power And Fire Detections
Naval Postgraduate School (NPS) Earthquake Response Project
Playbook #: RSC-04B
Revised – 10/15/2013
Approved for public release; distribution is unlimited
NPS-DHS Project/Product Overview Playbook #: RSC-04B
ii
Playbook Table of Contents
Executive Summary……………….……………………………………… iii Overview……………….…………………………………………………… 1 Purpose/Objectives……………….……………………………………… 1 VIIRS Data Overview…….………………………………………………. 1 Software Required……………….………………………………………. 2 Product Formats………………………………………………………….. 3 Instructions……………….……………………………………………….. 4 Playbook Directory………………………………………………………. 12 Scientific Background and Additional Notes………………………… 13 References……….………………………………………….……………… 29
NPS-DHS Project/Product Overview Playbook #: RSC-04B
iii
Executive Summary Sponsored by the Department of Homeland Security (DHS) Science & Technology Directorate, the Remote Sensing Center (RSC) at the Naval Postgraduate School (NPS) has developed a series of instructional playbooks designed to assist 1st responders and emergency managers with the use of remote sensing technology for improving earthquake response. This playbook (Playbook #: RSC-04B) describes two satellite-derived data products developed by the NOAA NGDC as part of the NPS/DHS Earthquake Response Project to provide remote-sensing-based products for improved earthquake response. The two data products are combustion source (fire detection) and power outage detection. These are available from NOAA through a dedicated web page and as email or RSS feeds. Power outages are detected as losses in “Visible Infrared Imaging Radiometer Suite” (VIIRS) satellite observed lighting in areas that are known to have lighting present under normal conditions. The location and spatial extent of power outages can be visually assessed using color images that are automatically generated by NOAA. In addition, an automated system analyzes the locations of lights and clouds to outline power outages and estimate the affected population. Fires are detected based on radiant emissions in the infrared. In addition to night lights, VIIRS has some ability to detect fires during the daytime pass in two spectral bands. At night, fires can be detected in six spectral bands, making it possible to estimate both temperature and radiant output. The NOAA VIIRS-derived products are available at a dedicated www page: http://ngdc.noaa.gov/eog/viirs/monterey_fire.html From this page it is possible to subscribe to automated RSS feeds or email messages. The Scientific Background and Additional Notes section at the end of this document gives an overview of and additional information about products resulting from this research and some aspects of practical implementation. The Playbook Directory near the end of this document shows the NPS Earthquake Response Playbook sequence to help put this Playbook into perspective. The content of each Playbook is briefly described; however, users are referred to the specific named and numbered Playbooks for full product descriptions. These provide additional detailed product information, instructions on how to separately utilize the individual products, and how to combine them into an integrated system for improved earthquake response.
NPS-DHS Project/Product Overview Playbook #: RSC-04B
1
Overview Sponsored by the Department of Homeland Security (DHS) Science & Technology Directorate, the Remote Sensing Center (RSC) at the Naval Postgraduate School (NPS) has developed a series of instructional playbooks designed to assist 1st responders and emergency managers with the use of remote sensing technology for improving earthquake response.
This playbook (Playbook #: RSC-04B) describes the combustion source (fire detection) and power outage detection data products produced by NOAA-NGDC.
Purpose/Objectives The objective of this playbook is to describe the content and access mechanisms for the nighttime combustion source and power outage detection data products produced by NGDC from satellite data collected by the VIIRS instrument.
VIIRS Data Overview The “Visible Infrared Imaging Radiometer Suite” (VIIRS) is a well-calibrated imaging instrument in a polar orbit. Image data is collected in 22 separate wavelength regions, commonly referred to as spectral bands. The images are collected as 3000 km wide swaths acquired while the satellite flies in a circle passing over both the north and south pole. A complete set of day and night images are acquired in a day. The global data are downloaded at receiving stations near the north and south poles. The delay for NGDC’s receipt of the global data is 6-7 hours. To reduce the time delay for the delivery of data products, NGDC processes VIIRS data collected at a line-of-site ground station operated by the University of Wisconsin. The station receives the data being collected while the satellite is in line-of-site contact. Figure 5 in the Background shows the reception circle for the station. NGDC processes the nighttime VIIRS data to detect combustion sources and disruptions in nocturnal lighting that indicate power outages. Combustion sources include open flames from burning vegetation, gas flares, or burning structures. For both products the affected population is tallied using the U.S. Department of Energy LandScan database.
NPS-DHS Project/Product Overview Playbook #: RSC-04B
2
Software Required
NOAA/NGDC products are available via (1) dedicated webpage, (2) push mail, (3) GeoRSS feed, (4) KMZ files, and (5) CSV files. The dedicated webpage provides access for subscribing to push mail/GeoRSS feeds and for downloading KMZ files, with visualization of most recent results on an embedded Google Map. The following lists some software options. Note that the use of specific software or brand names in this Playbook and other Playbooks does not imply endorsement of specific products by the Naval Postgraduate School or the US Government. Browsers
IE 7.0+ (Windows) *
Firefox 3.0+ (Windows, Mac OS X, Linux)
Safari 4+ (Mac OS X, iOS)
Chrome (Windows, Mac OS X, Linux) Push mail notification service can be subscribed by filling the subscribing form on the webpage. General mailing software or web-based cloud mailing service can be used. Mail Service/Software
Google Gmail (Windows, Mac OS X, iOS, Android, Linux)
Microsoft Outlook (Windows)
Thunderbird (Windows, Mac OS X, Linux)
Mail (Max OS X) To subscribe to the GeoRSS feed, general RSS readers can be used to display and update text/image messages. RSS Reader Service/Software
Aol Reader (Windows, Mac OS X, iOS, Android, Linux)
Firefox 3.0+ (Windows, Mac OS X, Linux)
Mail (Max OS X) KMZ files contain text information, location, boundary, supporting image of each detections; and can be shown on the map with specific software. Recommended KMZ Reader
Google Earth (Windows, Mac OS X, Linux)
ArcGIS 9.2+ (Windows, Max OS X) CSV files contain raw data of all detected pixels, allowing user to conduct further analysis. CSV Reader
Microsoft Excel (Windows, Mac OS X)
Apple Numbers (Mac OS X)
OpenOffice Calc (Windows, Mac OS X, Linux)
NPS-DHS Project/Product Overview Playbook #: RSC-04B
3
Product Formats
[FIRE][POWER]: Availability in detection types. [WEB][RSS][Mail][KMZ][CSV]: Availability in file types
Delivery File types
GeoRSS RSS (Rich Site Summary) is designed as a means to publish frequently updated
works such as news, blogs, weather, etc. GeoRSS is an extension of ordinary RSS feeds with the ability to provide spatial information for each item, such as associated points and vectors. Currently this product follows the Atom 1.0 standard.
Push mail Push mail is an e-mail service in which information is actively sent (pushed) from the
provider. CSV (Comma-Separated Values) files CSV files store data in plain-text forms (i.e. not binary), with each value separated
by a comma. KML(Keyhole Markup Language)/KMZ files KML files are originally designed to be used in Google Earth. They can store
geographic information in XML notation. They can be zipped as archives along with associated archive files and are then called KMZ files.
Data types
Google Map Baselayer [FIRE][POWER][WEB]
The products are shown on an embedded Google Map in the webpage. This provides both satellite and map image base layers beneath fire/power outage detection products for better interpretation in the context of surrounding environments
Power Outage Detection Intermediate Image [POWER][WEB][RSS]
Power outage detection is performed by comparing the current image with the annual average image. Pixels that are dark in the current image but bright in the annual average will be labeled as power outages. During this process, an intermediate image will be derived, showing both lightedand power outage areas.
Image of Planck Curve Fitting Result [FIRE][WEB][RSS][KMZ]
Fire temperature and radiant heat intensity are determined by fitting radiance from different spectral bands to the Planck Curve. This image displays the fitted Planck curve and radiance from different spectral bands. Vector of Occurrence Outline Boundary [FIRE][POWER][WEB][KMZ]
Vector of occurrence outline boundary depicts the affected area of each incidence. Point of Occurrence Location [FIRE][POWER][WEB][RSS][Mail][CSV][KMZ]
This points out the location of each occurence. For fire detection, it is the brightest pixel within the burning area. For power outage detection, it is the center of concentration of the power outage area.
NPS-DHS Project/Product Overview Playbook #: RSC-04B
4
Tally of affected population [FIRE][POWER][WEB][RSS][Mail][CSV][KMZ]
The tally of affected population is calculated by summing up pixel values in Land Scan dataset corresponding to the vector of occurrence outline boundary. Land Scan is a dataset developed by Oak Ridge National Laboratory mapping the global population distribution in a 30 arc seconds grid.
Temperature [FIRE] [WEB][RSS][Mail][CSV][KMZ]
Fire temperature is derived by fitting Planck Curves to radiances of different spectral bands. Temperature is reported in Kelvin (degree K).
Radiant Heat Intensity (RHI)/ Radiant Heat (RH) [FIRE] [WEB][RSS][Mail][CSV][KMZ]
Radiant heat intensity is derived from fire temperature using Stefan-Boltzmann’s law, which is reported in watts/m2. Radiant heat is derived by integrating RHI with the total burning area, which is reported in watts.
KML/KMZ Pushpin Place Mark [FIRE][POWER][WEB][KMZ]
The size and color of pushpin place marks defined in KML/KMZ files are decided by the temperature and radiant heat of the fire.
Google Static Map [FIRE][POWER][Mail]
Google Static Map is a service that generates static images of designated areas from parameters given in the URL. Unlike Google Map, Google Static Map does not provide any interaction with the user. Google Static Map links are generated for each point of occurrence location for both fire and power outage detection. This enables the user to easily understand the actual location of the occurrences and save precious bandwidth in emergency circumstances.
Detection Time [FIRE][POWER] [WEB][RSS][Mail][CSV][KMZ]
The detection time is taken from the time that the satellite overpasses the detection site recorded in UTC. Sun-synchronized polar orbiting satellites have a nominal orbiting time of 1.5 hour and a defined local overpass time at the equator, which is 1:30 am for NPP Suomi. With a swath of 3,000km, California has a higher chance to be scanned by VIIRS (i.e 1-2 times), and the detection time will be 1:30 am ± 1.5 hour.
Instructions
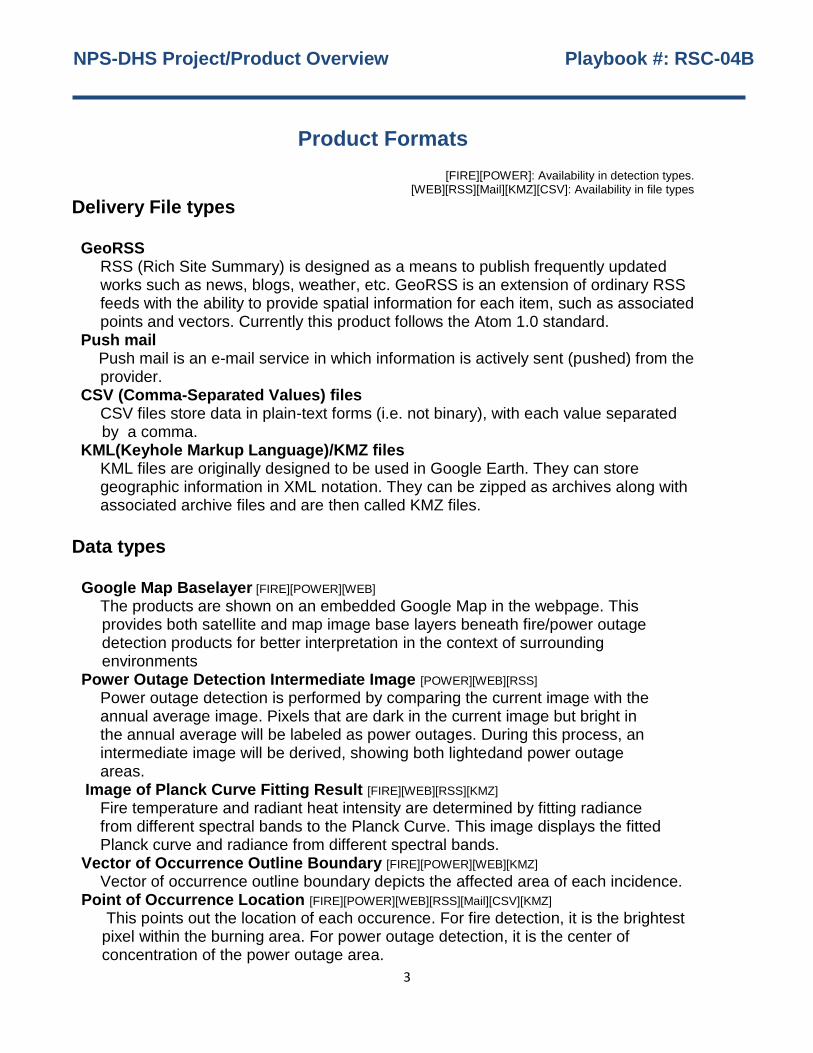
General Two access mechanisms have been established for the VIIRS fire and power outage products for live update: GeoRSS feed and Push Mail Notification. Power outage and fire detections are displayed both graphically and as text messages. To access the NOAA site, using your preferred web browser, open the main webpage:
http://ngdc.noaa.gov/eog/viirs/monterey_fire.html The webpage labeled “Fire and Power Outage Detection for Monterey County” will appear, showing subscription information and an image map indicating the latest detections of fires and power outages (Figure 1).
NPS-DHS Project/Product Overview Playbook #: RSC-04B
5
Figure 1. Main NOAA Fire and Power Outage Detection Webpage
NPS-DHS Project/Product Overview Playbook #: RSC-04B
6
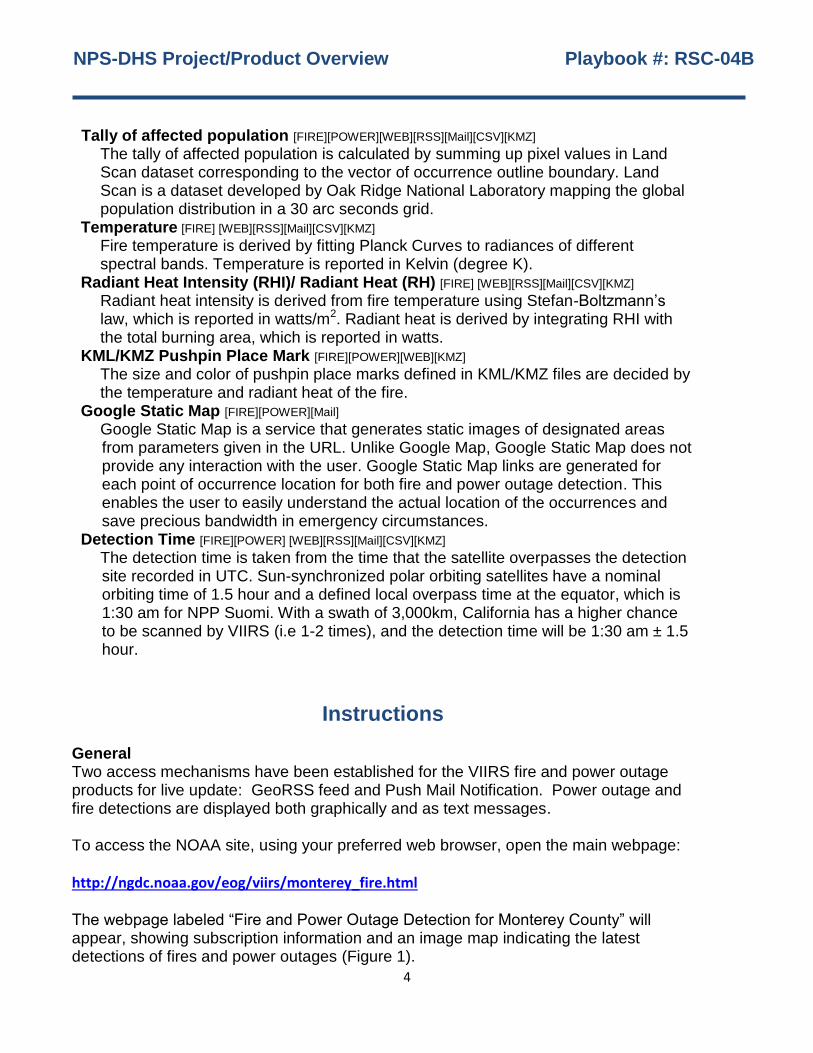
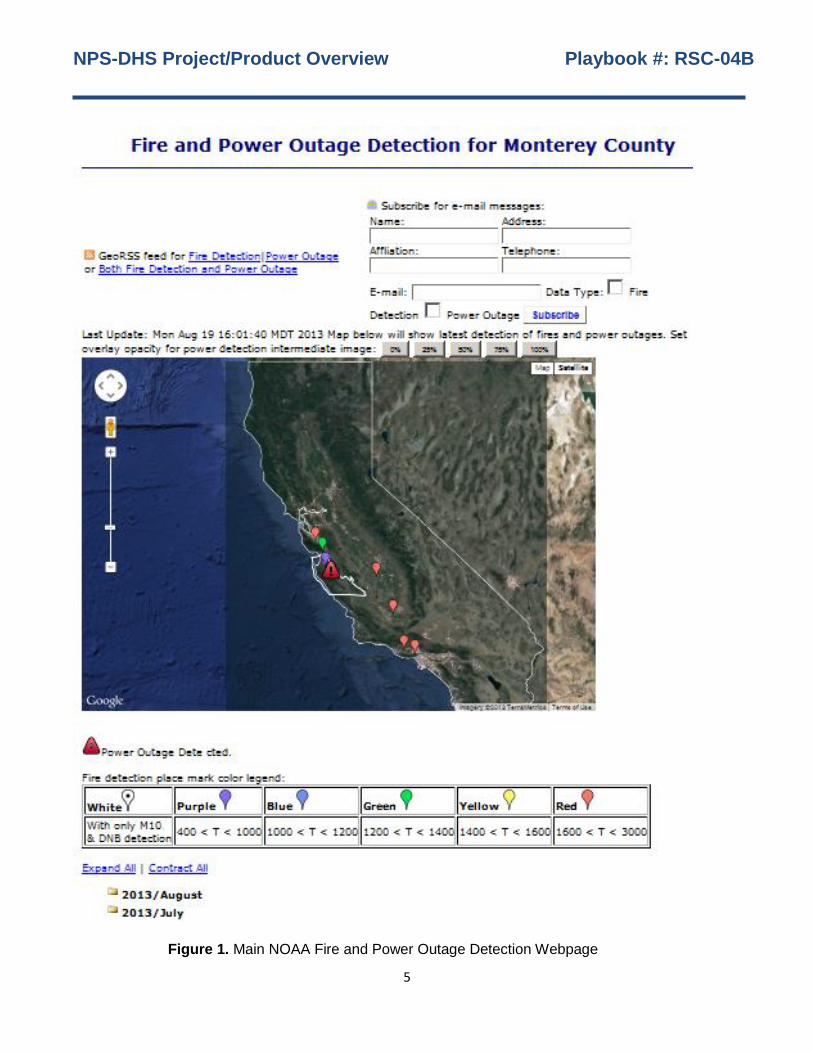
How to Subscribe to the GeoRSS Feed For Firefox 3.0 and newer versions, after opening the main webpage, select the hyperlinks next to the “GeoRSS feed for” option at the top of the webpage as outlined in the red box in Figure 2. Click on the desired subscription mode “Fire detection only feed”, “Power outage detection only feed”, or “Both fire and power outage detection feed”. In the resulting page (Figure 3) choose the preferred “Subscribe to this feed using” option, and then click the “Subscribe Now” button. Figure 3 also shows the sample result of subscribing to GeoRSS feed with Firefox 3.0.
Figure 2. Hyperlinks to GeoRSS feeds
Figure 3. Subscribe to GeoRSS feeds with Firefox and the result.
NPS-DHS Project/Product Overview Playbook #: RSC-04B
7
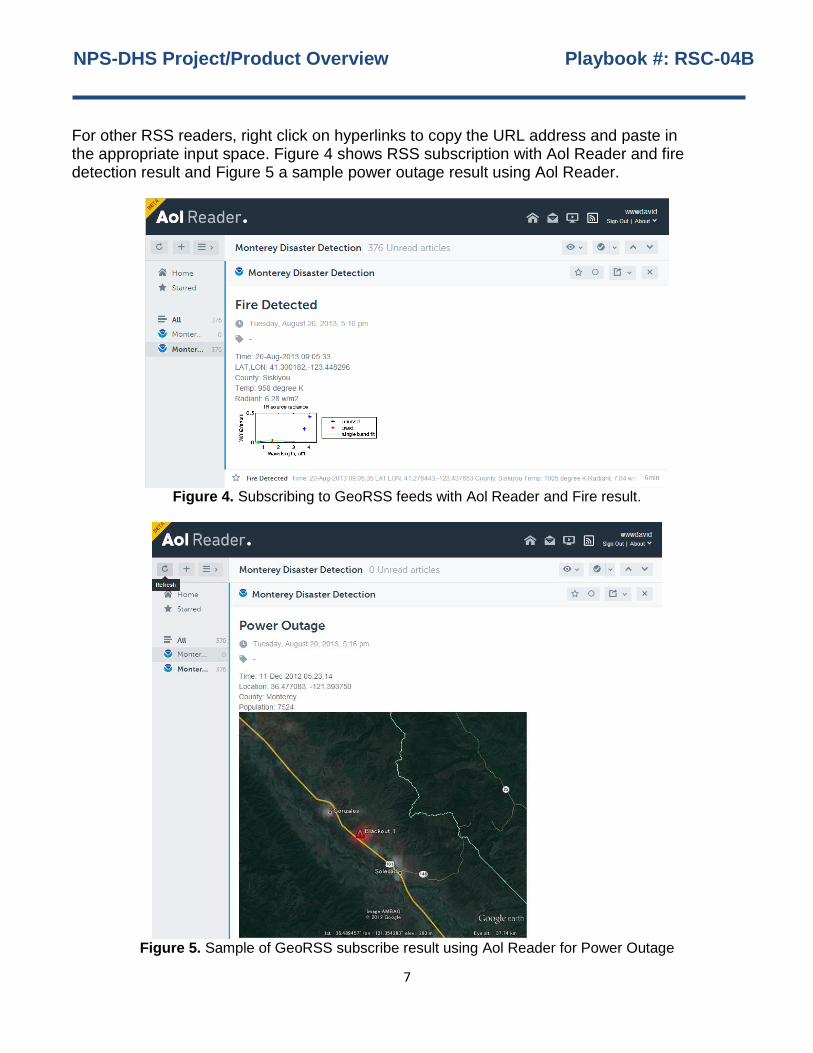
For other RSS readers, right click on hyperlinks to copy the URL address and paste in the appropriate input space. Figure 4 shows RSS subscription with Aol Reader and fire detection result and Figure 5 a sample power outage result using Aol Reader.
Figure 4. Subscribing to GeoRSS feeds with Aol Reader and Fire result.
Figure 5. Sample of GeoRSS subscribe result using Aol Reader for Power Outage
NPS-DHS Project/Product Overview Playbook #: RSC-04B
8
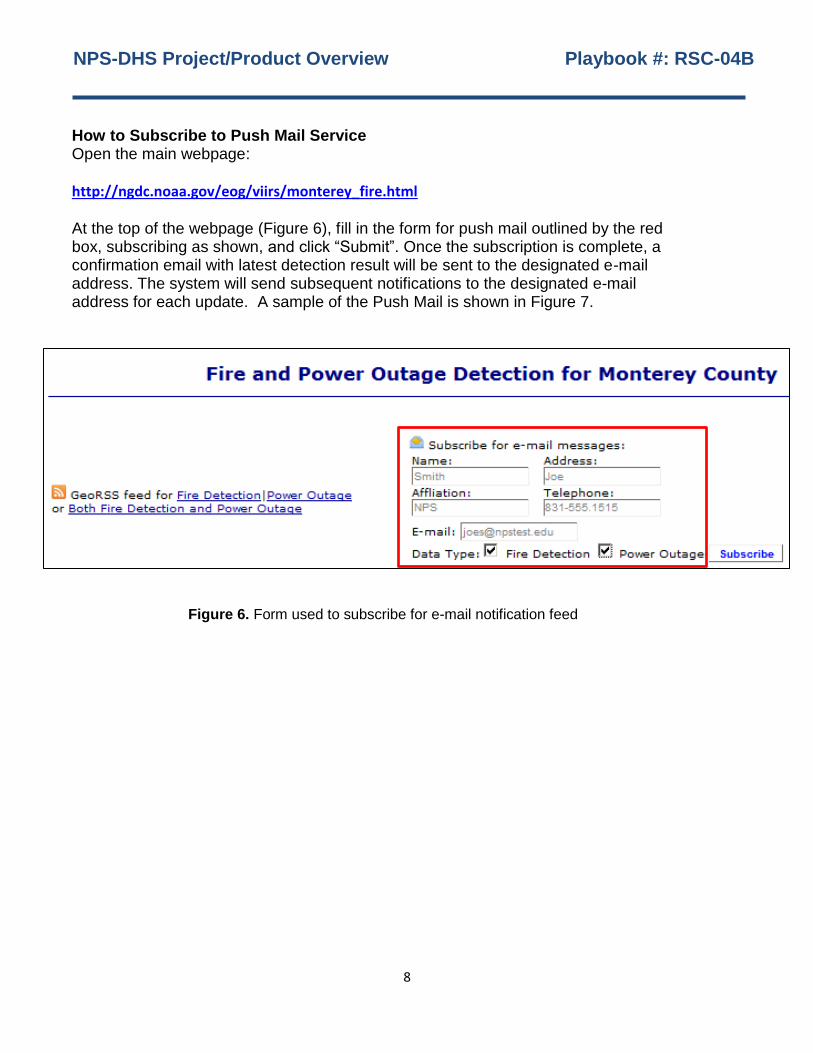
How to Subscribe to Push Mail Service
Open the main webpage:
http://ngdc.noaa.gov/eog/viirs/monterey_fire.html At the top of the webpage (Figure 6), fill in the form for push mail outlined by the red box, subscribing as shown, and click “Submit”. Once the subscription is complete, a confirmation email with latest detection result will be sent to the designated e-mail address. The system will send subsequent notifications to the designated e-mail address for each update. A sample of the Push Mail is shown in Figure 7.
Figure 6. Form used to subscribe for e-mail notification feed
NPS-DHS Project/Product Overview Playbook #: RSC-04B
9
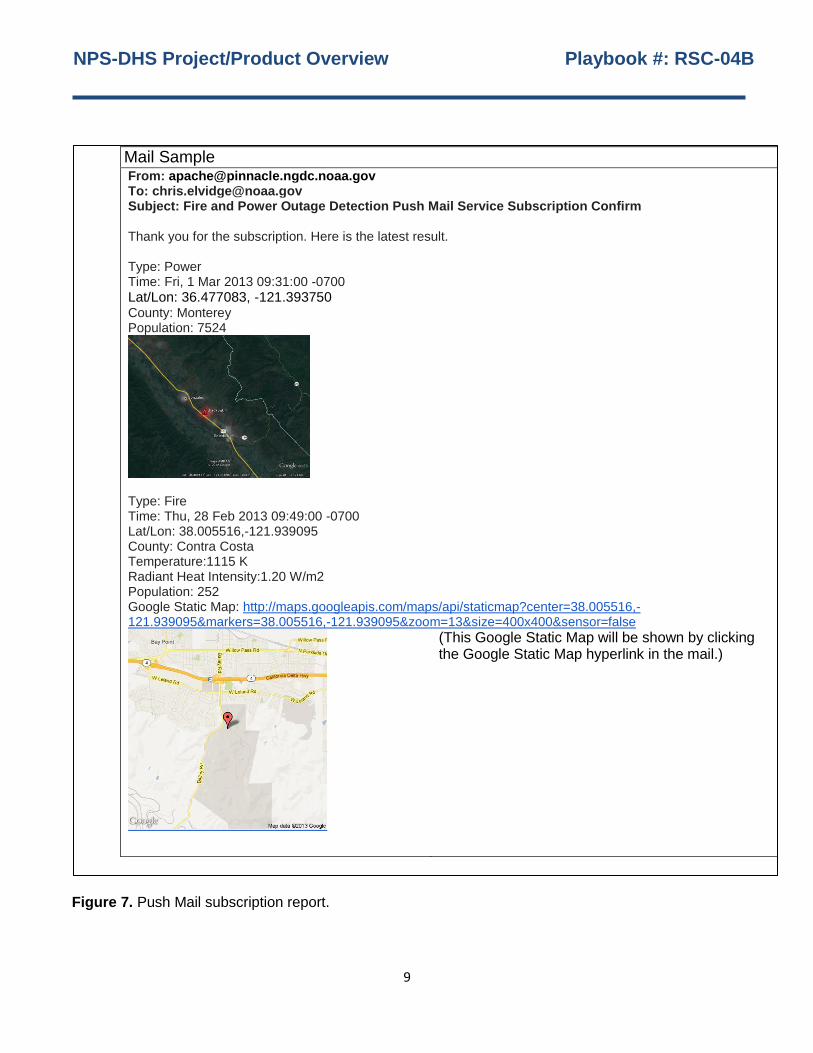
Figure 7. Push Mail subscription report.
Push Mail Sample From: [email protected] To: [email protected] Subject: Fire and Power Outage Detection Push Mail Service Subscription Confirm Thank you for the subscription. Here is the latest result. Type: Power Time: Fri, 1 Mar 2013 09:31:00 -0700 Lat/Lon: 36.477083, -121.393750
County: Monterey Population: 7524
Type: Fire Time: Thu, 28 Feb 2013 09:49:00 -0700 Lat/Lon: 38.005516,-121.939095 County: Contra Costa Temperature:1115 K Radiant Heat Intensity:1.20 W/m2 Population: 252 Google Static Map: http://maps.googleapis.com/maps/api/staticmap?center=38.005516,-121.939095&markers=38.005516,-121.939095&zoom=13&size=400x400&sensor=false
(This Google Static Map will be shown by clicking the Google Static Map hyperlink in the mail.)
NPS-DHS Project/Product Overview Playbook #: RSC-04B
10
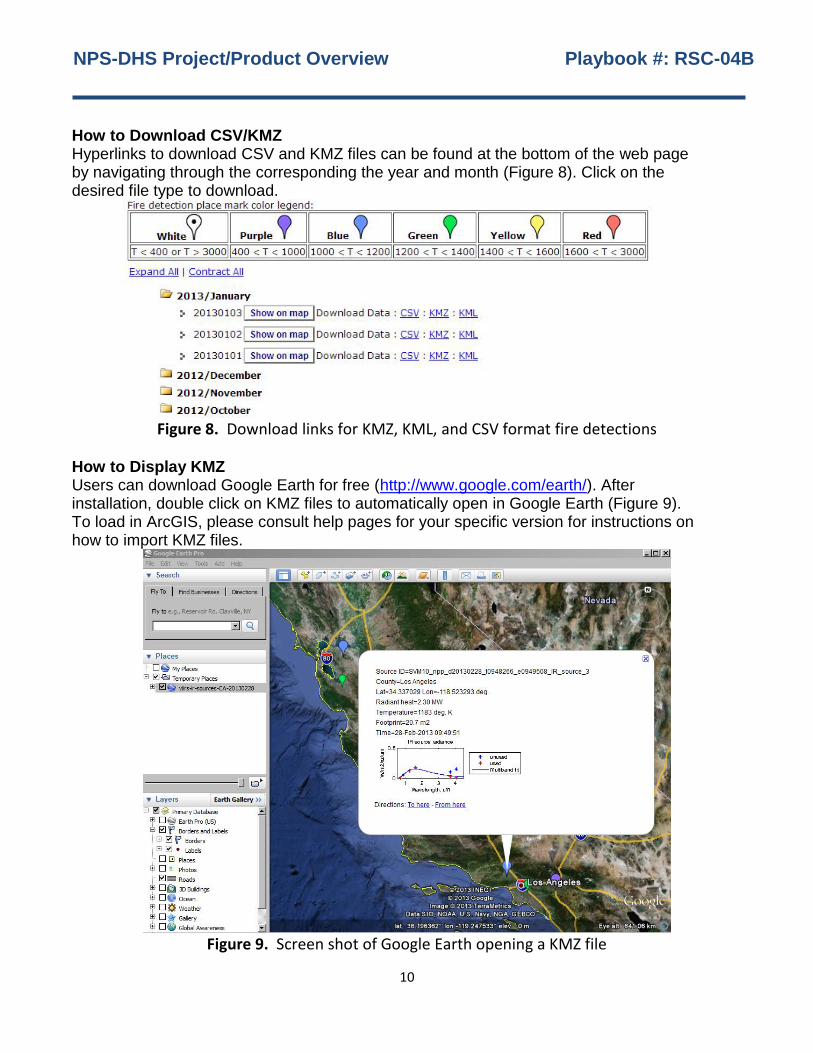
How to Download CSV/KMZ Hyperlinks to download CSV and KMZ files can be found at the bottom of the web page by navigating through the corresponding the year and month (Figure 8). Click on the desired file type to download.
Figure 8. Download links for KMZ, KML, and CSV format fire detections
How to Display KMZ Users can download Google Earth for free (http://www.google.com/earth/). After installation, double click on KMZ files to automatically open in Google Earth (Figure 9). To load in ArcGIS, please consult help pages for your specific version for instructions on how to import KMZ files.
Figure 9. Screen shot of Google Earth opening a KMZ file
NPS-DHS Project/Product Overview Playbook #: RSC-04B
11
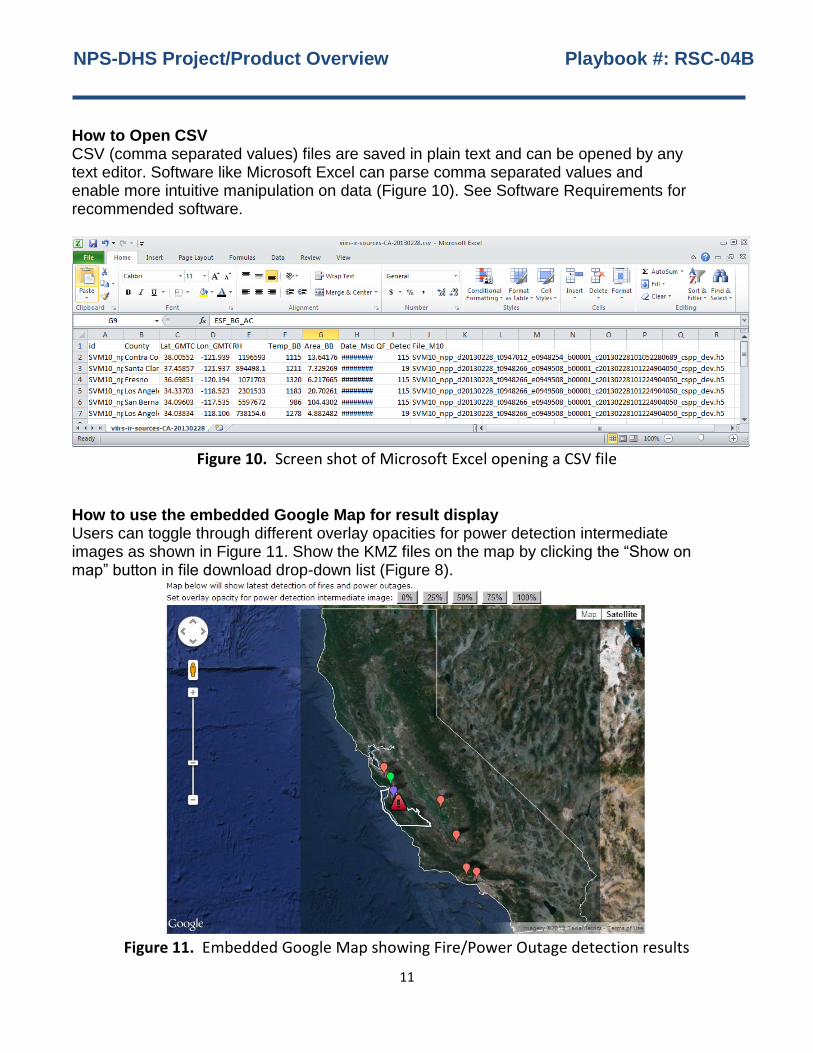
How to Open CSV CSV (comma separated values) files are saved in plain text and can be opened by any text editor. Software like Microsoft Excel can parse comma separated values and enable more intuitive manipulation on data (Figure 10). See Software Requirements for recommended software.
Figure 10. Screen shot of Microsoft Excel opening a CSV file
How to use the embedded Google Map for result display Users can toggle through different overlay opacities for power detection intermediate images as shown in Figure 11. Show the KMZ files on the map by clicking the “Show on map” button in file download drop-down list (Figure 8).
Figure 11. Embedded Google Map showing Fire/Power Outage detection results

NPS-DHS Project/Product Overview Playbook #: RSC-04B
12
Playbook Directory This Playbook is one of a series of Playbooks designed to cover the technical breadth of the NPS-DHS Earthquake Response Project. Each Playbook describes one series of products and its use. These Playbooks can be printed, transmitted electronically as Portable Document Format (PDF) documents, or stored locally on existing emergency management networks, workstations, or mobile devices. The following summarizes the individual Playbooks developed as part of this project and available to emergency responders. See the listed Playbook for specifics and details.
Playbook#RSC-01: NPS-DHS Remote Sensing Project/Products Overview
Playbook documenting project and scope and big picture for other Playbooks
Playbook#RSC-02: Monterey County Baseline Products and Pre-Event Data Processing
Playbook documenting baseline data, preprocessing, use/analysis of basic products
Playbook#RSC-03: Monterey (City) Infrastructure Products
Critical Infrastructure data (location, description, pre-event photos, and metadata)
Playbook#RSC-04A: Airborne Imagery Change Detection Products (SDSU) Monterey baseline imagery of critical infrastructure, Camp Roberts imagery, and selected
change detection example products. Full-Resolution NEOS imagery
Playbook#RSC-04B: NOAA Night Lights/Power Change Detection and Fire Detection Products Night lights/power and fire detections (NOAA)
Playbook#RSC-05A: Social Networking Products (Ushahidi)
Ushahidi implementation and instructions for Monterey City/County
Playbook#RSC-05B: Social Networking Products (Twitter)
Twitter implementation and instructions for Monterey City/County
Playbook#RSC-06: Mobile Application Damage Assessment Product Lighthouse damage assessment application download, install, configure, execute
Playbook#RSC-07: Post Event Processing Scenarios Products
Lidar DEM, DSM, derived products, NAIP/WV-2 Change Detection Examples
Playbook#RSC-08: Soft and Hardcopy Output Products and Distribution
GeoPDF Products, Monterey Map Books, w/National Grid Index, PDF and Printed
Playbook#RSC-09: Common Operating Picture (COP) Products
Sensor Island Common Operating Picture, UICDS to WebEOC Link
Playbook#RSC-10: Systems Integration, Transition, and Training
Hardware/Software Installation Details and Coordination
NPS-DHS Project/Product Overview Playbook #: RSC-04B
13
Scientific Background and Additional Notes
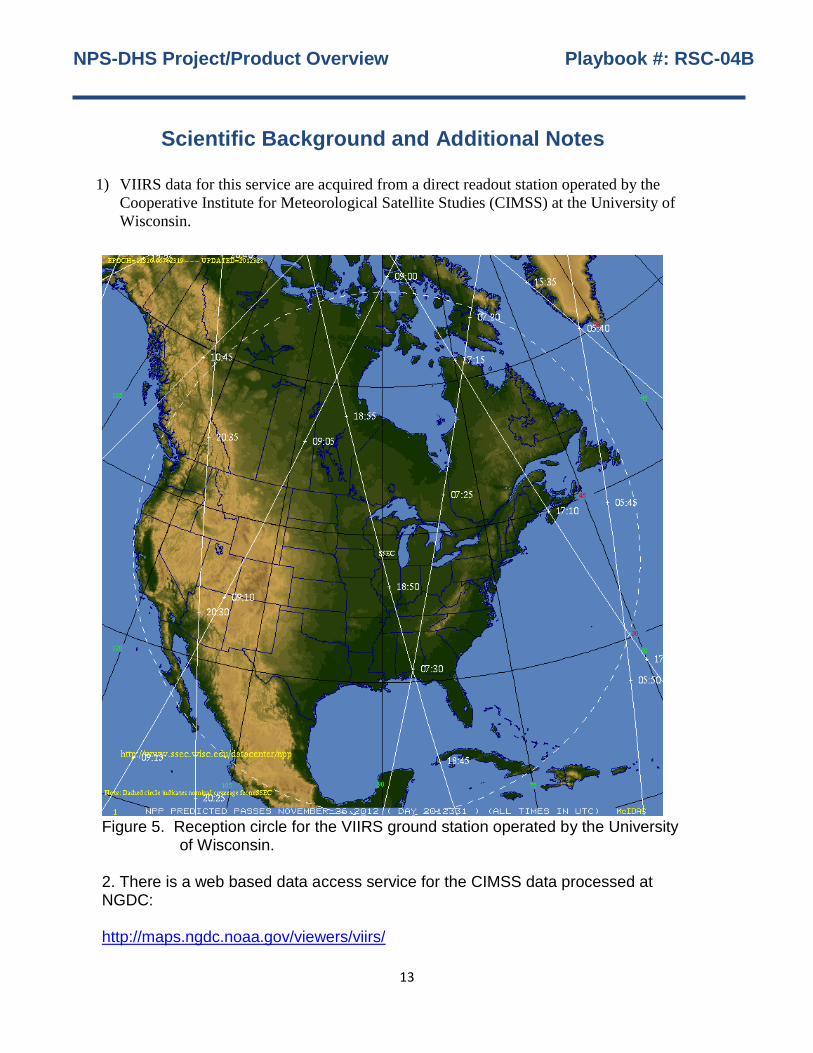
1) VIIRS data for this service are acquired from a direct readout station operated by the
Cooperative Institute for Meteorological Satellite Studies (CIMSS) at the University of
Wisconsin.
Figure 5. Reception circle for the VIIRS ground station operated by the University
of Wisconsin. 2. There is a web based data access service for the CIMSS data processed at NGDC: http://maps.ngdc.noaa.gov/viewers/viirs/
NPS-DHS Project/Product Overview Playbook #: RSC-04B
14
3. Details on the fire detections are described in the paper on the following pages. Proceedings of the Asia-Pacific Advanced Network 2013 v. 35, p. xx-zz. http://dx.doi.org/10.7125/APAN.35.x
ISSN 2227-3026
Using the Short-Wave Infrared for Nocturnal Detection of
Combustion Sources in VIIRS Data Mikhail Zhizhin
1*, Chris Elvidge
2, Feng-Chi Hsu
1 and Kim Baugh
1
1 CIRES, University of Colorado
325 Broadway E/GC2
Boulder, Colorado
2 National Geophysical Data Center NOAA
325 Broadway E/GC2
Boulder, Colorado
E-mail: [email protected], [email protected], [email protected],
* Author to whom correspondence should be addressed; Tel.: +1-303-497-6385
Abstract:
Night-time images from the NPP satellite VIIRS scanning radiometer in visible and infrared spectral
bands provide invaluable data for real-time detection of natural and technological combustion sources
on the surface of the Earth, such as forest fires, gas flares, steel mills or active volcanoes. Point sources
detected at night in 1.6 micron near-infrared M10 channel are most likely to be large fires or gas flares.
Their temperature and radiant heat intensity can be estimated by fitting of the Planck black-body
spectral curve to the observed radiances of all VIIRS infrared M-channels. VIIRS instrument is sensitive
to the IR sources with temperature range from 600 to 3000 degrees K. This method can discriminate low
temperature sources such as volcanoes and forest fires from the high temperature gas flares with 300 m
average location error. Global near real-time mapping of the IR sources on the Earth requires correction
of the M-channels for bow tie effect and filtering of the false detections resulting from sensor
bombardment by the cosmic rays, especially at the aurora rings and at the South Atlantic anomaly. False
detections can be removed by correlating of the observed bright spots in M10 channel with other
infrared and the visible day-night band. After geometry correction and denoising, the IR point sources
are mapped on Google Earth and listed in a table. NGDC NOAA provides global daily detection
products for thousands of IR sources as KML vector maps and as CSV tables.
Keywords: remote sensing, nocturnal detection, infrared combustion sources, gas flares,
biomass burning, active volcanoes.
NPS-DHS Project/Product Overview Playbook #: RSC-04B
15
1. Introduction
Detection of the infrared combustion sources on the Earth surface from satellites is important to study of
biomass and gas flare burning which result in greenhouse gas emissions volumes large enough to affect
ecology and global climate change [1,2]. Although it is possible to see from satellite some of the
combustion at daytime, the nocturnal detection of high temperature flares is more sensitive because it is
not contaminated by reflections of sunlight.
Detection of hot sources on the Earth had been developed since 1980s. Thermal channels originally
designed to identify cloud-contaminated pixels and evaluate the radiant contribution from water vapor
also showed the ability to detect pixels with high temperature sources. Dozier et al. proposed that taking
the difference of radiative brightness temperature of NOAA AVHRR channels 3 (MIR) and 4 (TIR)
whose wavelength centered at 4um and 11um respectively, it is possible to determine the temperature of
heat source and its portion of the pixel[3,4]. This method had been developed since then, and is now
taken as the theoretical basis of fire detection algorithm of widely used MODIS Fire Product [5].
However, such bi-spectral approach proposed by Dozier et al. is sensitive to any interchannel FOV
spatial mis-registration or point spread function (PSF) differences, which the portion of pixel from
different channel could vary and thus invalidate the assumption of that being consistent across channels
(Langaas, 1993, Oertel 2003, Zhukov 2005a,b). Furthermore, pixels having sources with lower
temperature or smaller portion of pixel are hard to discriminate especially for TIR channel, which makes
it difficult to quantify the ambient background radiance from neighboring pixels to acquire the
background temperature needed to solve the dual wave band equation [1]. And lower resolution further
address this uncertainty by making the radiance increase due to fires be interpreted into smaller signal
change in TIR channel, which can often be of a magnitude of variation of ambient temperature change
or even sensor noise (Giglio and Kendall, 2011, Wooster 2003). Having very large uncertainties in
retrieving temperature, portion of pixel and fire radiative power (FRP, W/m2) from bi-spectral approach,
current MODIS Fire Product tried to use single-spectral approach to estimate FRP only. The single
spectral approach relies only on signals in MIR channel from “fire pixels” and neighboring “non-fire
pixels” with nonlinear regressed equation [1, 5].
With well-placed sensors and advanced terrain-correction, along with its high resolution, VIIRS
overcame the difficulties for bi-spectral approach. Moreover, multiple thermal bands which operates at
night not only avoids contamination of solar reflection, but also make it possible for more accurate
estimation on temperature and the portion of pixel for heat sources such as forest fires, gas flares, steel
mills or active volcanoes. In this paper we present a novel multi-spectral method for detection of
nocturnal IR sources on the Earth and determine their temperature, portion of pixel, rediant heat
intensity and radiant heat using thermal and visible bands from the VIIRS radiometer.
2. Method
The set of VIIRS radiometer moderate resolution infrared channels providing data at night is shown in
Table 1. It is different from the daytime data set because some of the channels at night are turned off to
save satellite communications bandwidth. However, comparing the available channel bandwidths with a
Planck black body radiation curve of the burning methane with the temperature 2223 K (Figure 1)
NPS-DHS Project/Product Overview Playbook #: RSC-04B
16
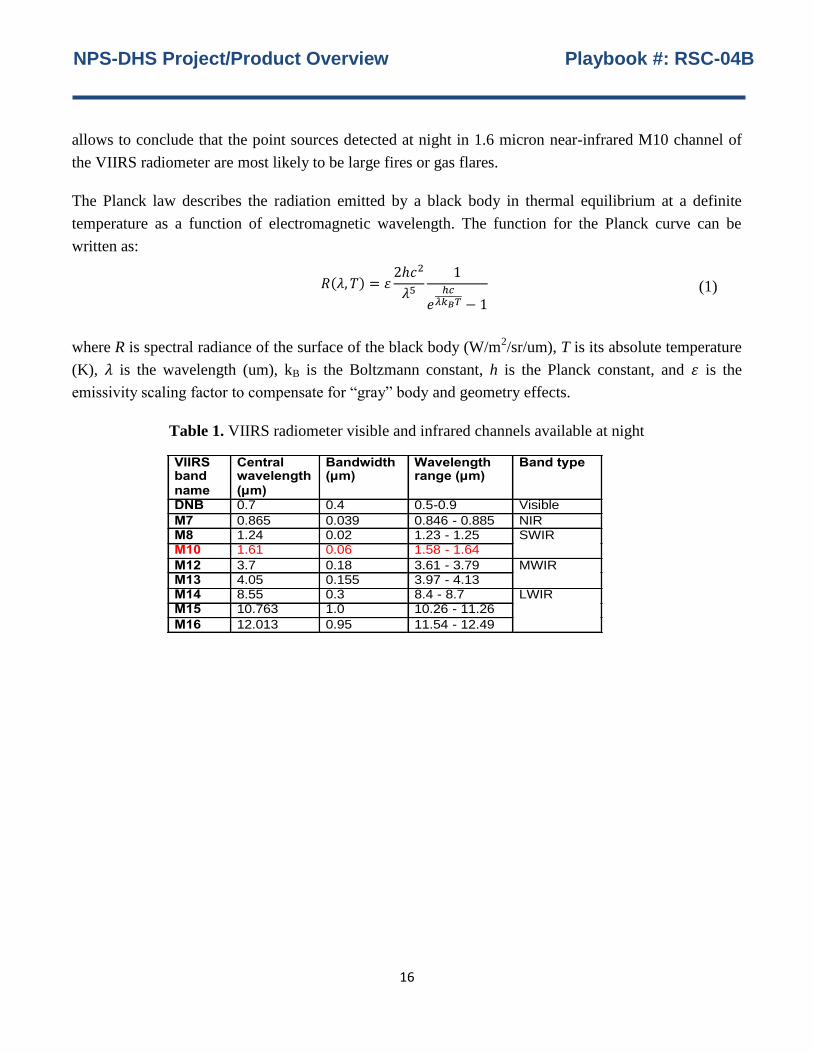
allows to conclude that the point sources detected at night in 1.6 micron near-infrared M10 channel of
the VIIRS radiometer are most likely to be large fires or gas flares.
The Planck law describes the radiation emitted by a black body in thermal equilibrium at a definite
temperature as a function of electromagnetic wavelength. The function for the Planck curve can be
written as:
( )
(1)
where R is spectral radiance of the surface of the black body (W/m2/sr/um), T is its absolute temperature
(K), is the wavelength (um), kB is the Boltzmann constant, h is the Planck constant, and is the
emissivity scaling factor to compensate for “gray” body and geometry effects.
Table 1. VIIRS radiometer visible and infrared channels available at night
VIIRS band name
Central wavelength (µm)
Bandwidth (µm)
Wavelength range (µm)
Band type
DNB 0.7 0.4 0.5-0.9 Visible
M7 0.865 0.039 0.846 - 0.885 NIR M8 1.24 0.02 1.23 - 1.25 SWIR M10 1.61 0.06 1.58 - 1.64
M12 3.7 0.18 3.61 - 3.79 MWIR M13 4.05 0.155 3.97 - 4.13 M14 8.55 0.3 8.4 - 8.7 LWIR M15 10.763 1.0 10.26 - 11.26
M16 12.013 0.95 11.54 - 12.49
NPS-DHS Project/Product Overview Playbook #: RSC-04B
17
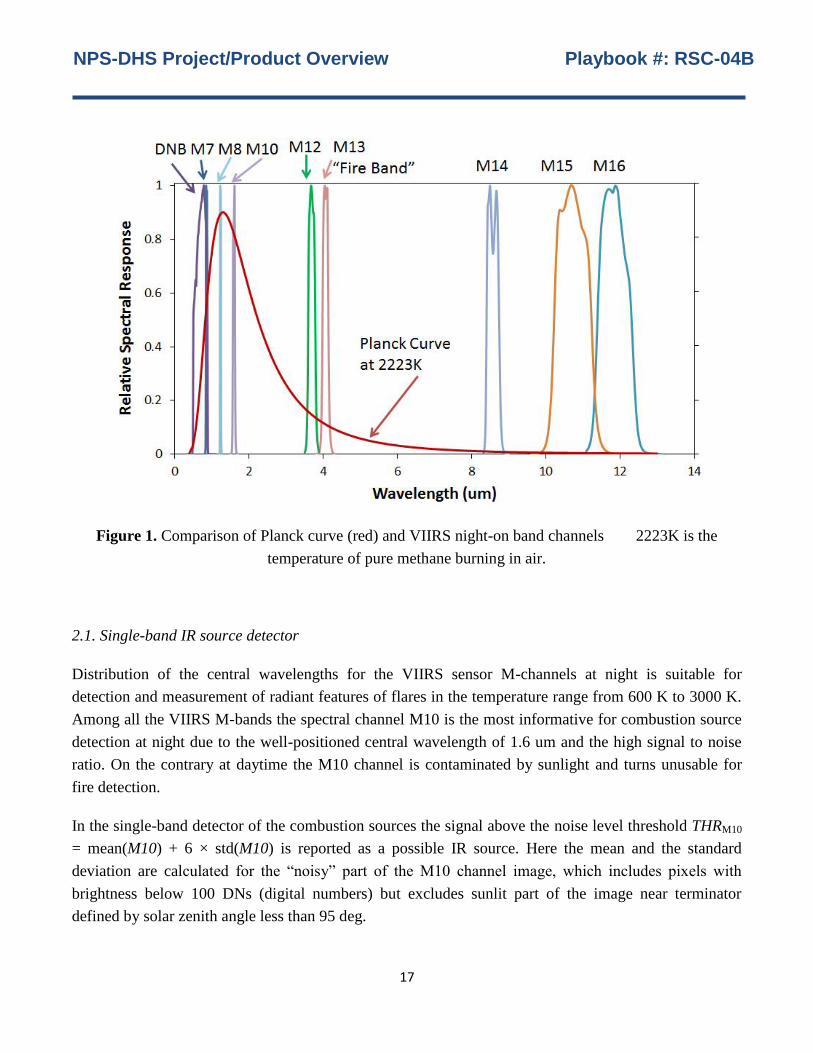
Figure 1. Comparison of Planck curve (red) and VIIRS night-on band channels 2223K is the
temperature of pure methane burning in air.
2.1. Single-band IR source detector
Distribution of the central wavelengths for the VIIRS sensor M-channels at night is suitable for
detection and measurement of radiant features of flares in the temperature range from 600 K to 3000 K.
Among all the VIIRS M-bands the spectral channel M10 is the most informative for combustion source
detection at night due to the well-positioned central wavelength of 1.6 um and the high signal to noise
ratio. On the contrary at daytime the M10 channel is contaminated by sunlight and turns unusable for
fire detection.
In the single-band detector of the combustion sources the signal above the noise level threshold THRM10
= mean(M10) + 6 × std(M10) is reported as a possible IR source. Here the mean and the standard
deviation are calculated for the “noisy” part of the M10 channel image, which includes pixels with
brightness below 100 DNs (digital numbers) but excludes sunlit part of the image near terminator
defined by solar zenith angle less than 95 deg.
NPS-DHS Project/Product Overview Playbook #: RSC-04B
18
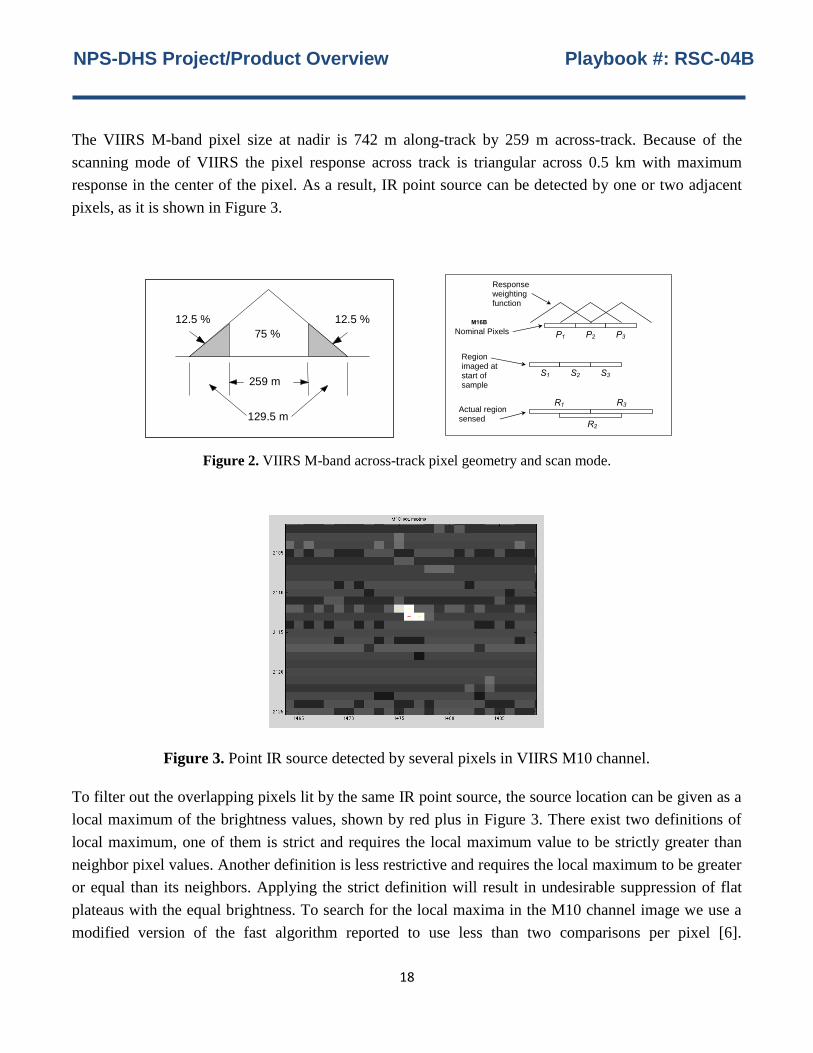
The VIIRS M-band pixel size at nadir is 742 m along-track by 259 m across-track. Because of the
scanning mode of VIIRS the pixel response across track is triangular across 0.5 km with maximum
response in the center of the pixel. As a result, IR point source can be detected by one or two adjacent
pixels, as it is shown in Figure 3.
Figure 2. VIIRS M-band across-track pixel geometry and scan mode.
Figure 3. Point IR source detected by several pixels in VIIRS M10 channel.
To filter out the overlapping pixels lit by the same IR point source, the source location can be given as a
local maximum of the brightness values, shown by red plus in Figure 3. There exist two definitions of
local maximum, one of them is strict and requires the local maximum value to be strictly greater than
neighbor pixel values. Another definition is less restrictive and requires the local maximum to be greater
or equal than its neighbors. Applying the strict definition will result in undesirable suppression of flat
plateaus with the equal brightness. To search for the local maxima in the M10 channel image we use a
modified version of the fast algorithm reported to use less than two comparisons per pixel [6].
D43776_D Page 18
Figure 2.2-10: 75% of Signal is Collected from Nominal Pixel (see Footnote 6)
2.2.1.2. Location of Pixel
The location of a pixel is associated with the center of the spatial response function for an ideal moderate resolution band detector. From Figure 2.2-9 it can be seen that the peak of the response function corresponds to the location of the detector trailing edge at the end of the sampling interval. Each frame of VIIRS data contains all of the observations from all of the bands corresponding to sixteen moderate resolution band ground locations along-track. There are thus sixteen pixels associated with each data frame.
The effective pixel center must be adjusted to account for along-scan aggregation. In the three-sample aggregation region the center of the pixel is associated with the location of the middle of the three aggregated samples. In the two-sample aggregation region the pixel location is associated with the average of the two aggregated sample locations.
2.2.2. Scan Geometry
The second characteristic of the VIIRS instrument of particular importance for Earth location is the behavior of the cross-track RTA. For the nominal scan rate (see Figure 2.2-2), the RTA sweeps out a 112.13° Earth field of view in each scan, effectively moving the instrument's sixteen pixels over a swath of the Earth approximately 11.9 km wide at nadir. This scan width increases to 25.9 km at the end of scan due to the panoramic "bow tie" effect (Figure 2.2-11). This effect leads to scan-to-scan overlap at scan angles greater than approximately 19 degrees (Figure 2.2-12). On the other hand, the scan gap at nadir is nominally zero.
259 m
129.5 m
75 %
12.5 % 12.5 %
D43776_D Page 17
Figure 2.2-8: Triangular Response Function from the Effective Time Weighting6
Figure 2.2-9: Series of Triangular Weighted Pixels (see Footnote 6)
6 Note as discussed in the text, the VIIRS resonse is trapezoidal vs. triangular.
P1 P2 P3
S1 S2 S3
R1
R2
R3
M16B
Response weighting function
Nominal Pixels
Region imaged at start of sample
Actual region sensed
Actual region of
Earth sensed
Response weighting
functionNominal pixel
location
Detector at start of sample
Detector at end of sample
NPS-DHS Project/Product Overview Playbook #: RSC-04B
19
Modifications of the algorithm include change from the strict to non-strict local maxima definition and
correction for the satellite projection geometry called bow-tie effect.
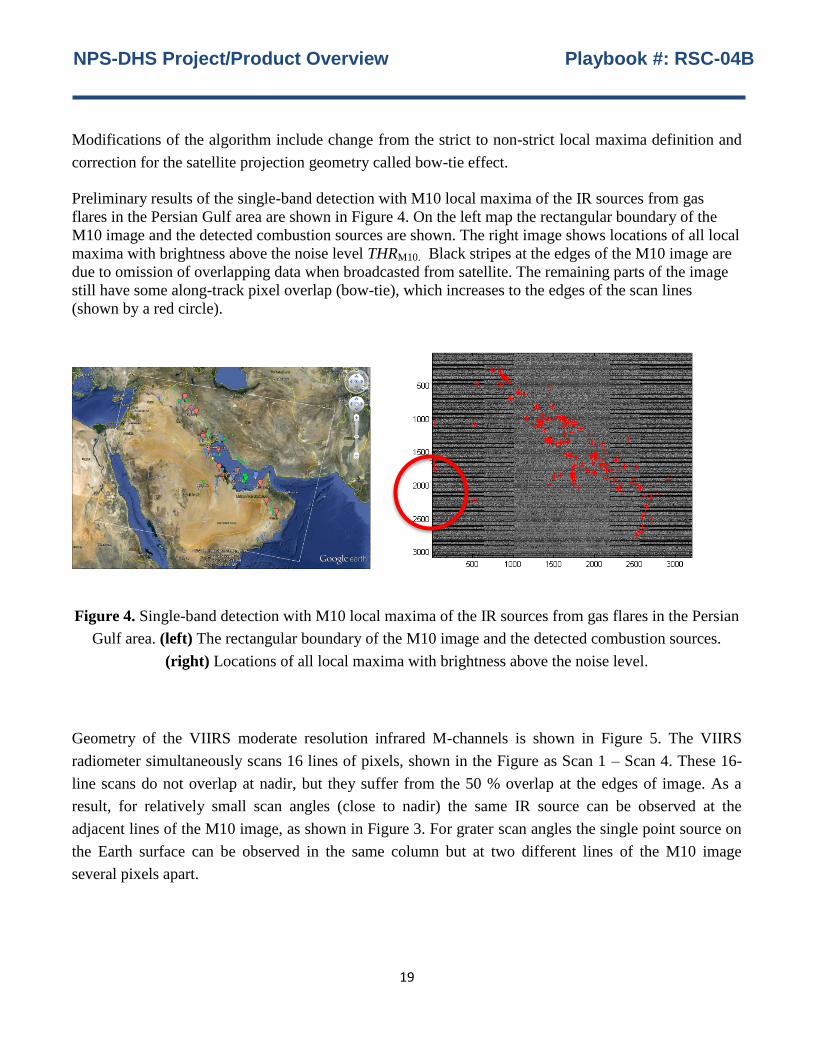
Preliminary results of the single-band detection with M10 local maxima of the IR sources from gas
flares in the Persian Gulf area are shown in Figure 4. On the left map the rectangular boundary of the
M10 image and the detected combustion sources are shown. The right image shows locations of all local
maxima with brightness above the noise level THRM10. Black stripes at the edges of the M10 image are
due to omission of overlapping data when broadcasted from satellite. The remaining parts of the image
still have some along-track pixel overlap (bow-tie), which increases to the edges of the scan lines
(shown by a red circle).
Figure 4. Single-band detection with M10 local maxima of the IR sources from gas flares in the Persian
Gulf area. (left) The rectangular boundary of the M10 image and the detected combustion sources.
(right) Locations of all local maxima with brightness above the noise level.
Geometry of the VIIRS moderate resolution infrared M-channels is shown in Figure 5. The VIIRS
radiometer simultaneously scans 16 lines of pixels, shown in the Figure as Scan 1 – Scan 4. These 16-
line scans do not overlap at nadir, but they suffer from the 50 % overlap at the edges of image. As a
result, for relatively small scan angles (close to nadir) the same IR source can be observed at the
adjacent lines of the M10 image, as shown in Figure 3. For grater scan angles the single point source on
the Earth surface can be observed in the same column but at two different lines of the M10 image
several pixels apart.
NPS-DHS Project/Product Overview Playbook #: RSC-04B
20
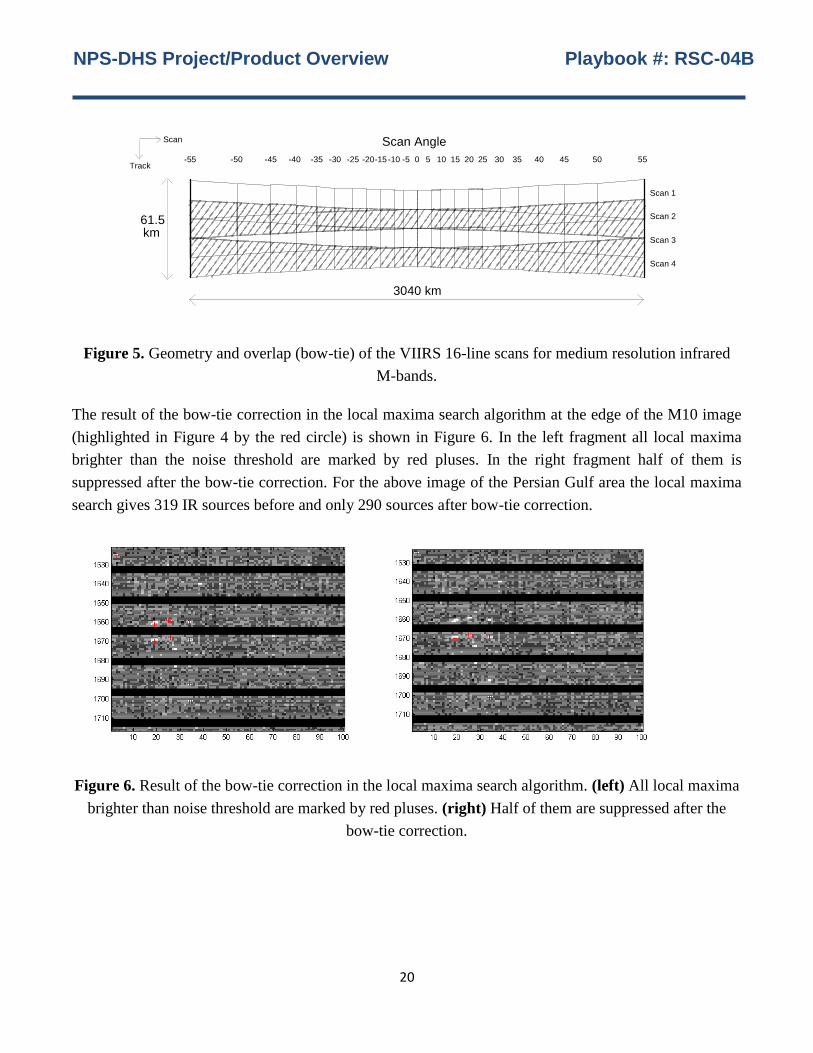
Figure 5. Geometry and overlap (bow-tie) of the VIIRS 16-line scans for medium resolution infrared
M-bands.
The result of the bow-tie correction in the local maxima search algorithm at the edge of the M10 image
(highlighted in Figure 4 by the red circle) is shown in Figure 6. In the left fragment all local maxima
brighter than the noise threshold are marked by red pluses. In the right fragment half of them is
suppressed after the bow-tie correction. For the above image of the Persian Gulf area the local maxima
search gives 319 IR sources before and only 290 sources after bow-tie correction.
Figure 6. Result of the bow-tie correction in the local maxima search algorithm. (left) All local maxima
brighter than noise threshold are marked by red pluses. (right) Half of them are suppressed after the
bow-tie correction.
D43776_D Page 19
0 5 10 15 20 25 30 35 -5-10-15-20-25-30 -35 -55 -50 -45 -40 40 45 50 55
61.5 km
3040 km
Scan 1
Scan 2
Scan 3
Scan 4
Scan
Track
Scan Angle
Figure 2.2-11: Panoramic Bow Tie Effect
A feature of the VIIRS flight software that trims the ‘M’ band and ‘I’ band data in the along-track direction as a function of along-scan aggregation zone will be enabled. This will result in some of the samples in the overlap area to be excluded from the data that are delivered to the ground. The VIIRS Command, Telemetry, Science and Engineering Data Description [EDD154640-101] describes this “bow-tie deletion” feature, which is illustrated in Figure 2.2-13.
The RTA (and HAM) along-scan motion is measured and down-linked in the instrument data stream. These measurements are explicitly used by the Earth location algorithm to determine the instrument pointing. RTA and HAM motion linearity is not assumed.
NPS-DHS Project/Product Overview Playbook #: RSC-04B
21
2.2. Multiband IR source detector
After M10 nighttime image thresholding and bow-tie correction, the remaining local maxima are
considered as candidate locations for detected IR sources. However, additional information from the
other VIIRS M-bands is needed for two reasons:
Possibility to analyze combustion source spectra and to measure its temperature and size (power,
volume of burned material…).
Sophisticated reduction of false detections.
False single-band detections may occur in the energetic particle precipitation regions, when a detector
has been hit by cosmic rays from above, in addition to the electromagnetic waves radiated from IR
sources on the Earth surface coming from below the satellite. The most frequently false detections are
observed in the South Atlantic Anomaly region and in the North and South Aurora belts. Probability of
false detections depends on the space weather, rising during magnetic storms.
Due to the VIIRS sensor design it is very improbable that the same particle will hit pixels at several
sensor bands. Thus simultaneous observation of hot spots at several infrared M-bands and visible DNB
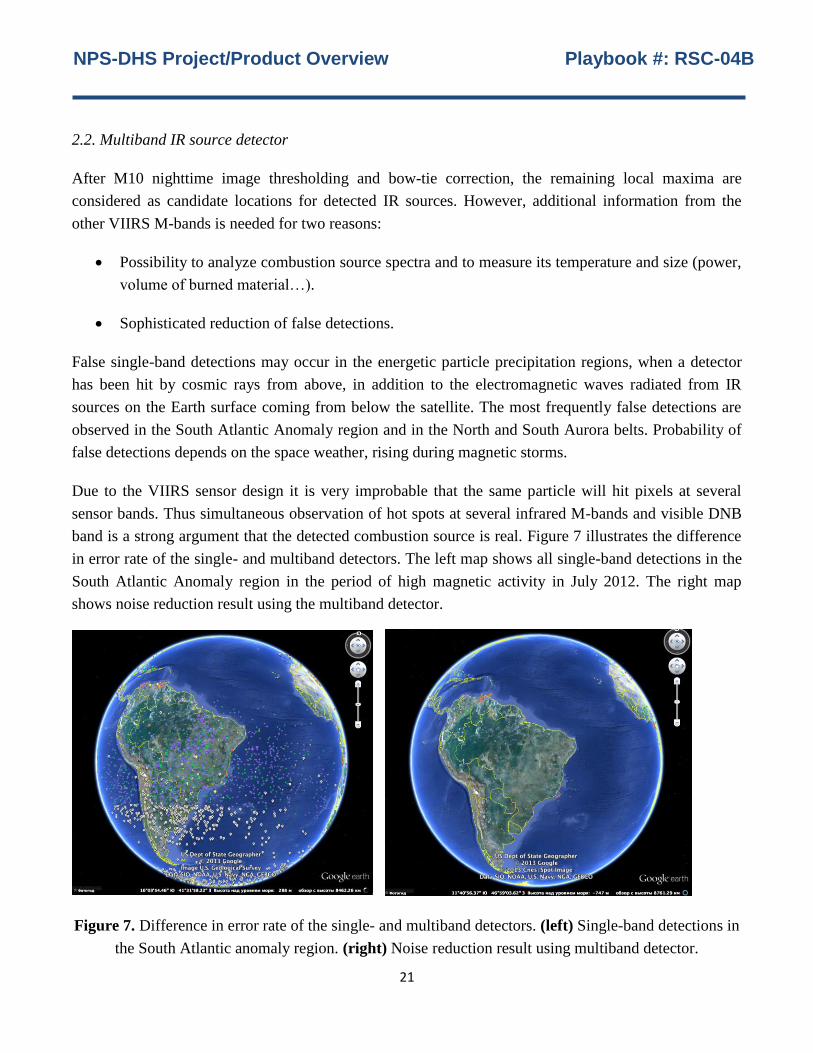
band is a strong argument that the detected combustion source is real. Figure 7 illustrates the difference
in error rate of the single- and multiband detectors. The left map shows all single-band detections in the
South Atlantic Anomaly region in the period of high magnetic activity in July 2012. The right map
shows noise reduction result using the multiband detector.
Figure 7. Difference in error rate of the single- and multiband detectors. (left) Single-band detections in
the South Atlantic anomaly region. (right) Noise reduction result using multiband detector.
NPS-DHS Project/Product Overview Playbook #: RSC-04B
22
In the multiband detector independent thresholds are used for all M-bands to detect IR signal above
noise level. For bands M7, M8 and M10 the thresholds are based on N-sigma rule for average and
standard deviations calculated over the whole image, similar to calculation of the THRM10 threshold.
For bands M12 and M13 the detection threshold is dynamically updated in a moving window 11x11
pixels centered at each M10 local maximum. In that case the M12 and M13 background signal statistics
are estimated only for pixels inside the moving window with radiance below the noise level in the M10
band (with brightness < THRM10). Difference between the observed M12 and M13 radiances for the
detected IR source and the mean values of the M12 and M13 signal in the noisy part of the moving
window serves as an estimate of the IR source brightness in this spectral bands and it will be used later
for the Planck black body curve fitting.
To match the hot spots detected in the M10 band with the bright night time lights observed in the visible
DNB band, we have to take into account difference in the M10 and DNB image geometry. First, we
search for a DNB pixel in the same scan line, as the M10 hot spot, using geolocation data (latitudes and
longitudes of pixel centers) for both images. Then we search for the local maxima in a square 11x11
pixel window centered at that DNB pixel. Finally, we assign to the M10 hot spot the nearest DNB local
maximum found in that window (if any).
Local maximum observed above detection threshold in band M10 is considered to be a real IR source if
and only if it detected above the noise level at least in one more spectral band.
2.3. Fitting Planck curve to multispectral observations
Temperature and radiant heat intensity of the detected IR sources can be estimated by simultaneous
fitting of the Planck black body spectral curve (1) to the observed radiances of all VIIRS infrared M-
channels, which are above noise level. Here we assume that spectra of the high-temperature flares at
night are ideal black body. Under this assumption the emissivity scaling factor in the Planck formula
(1) becomes a proxy for the IR source geometry and can be used to estimate the fractional size of the
flaring area with subpixel resolution.
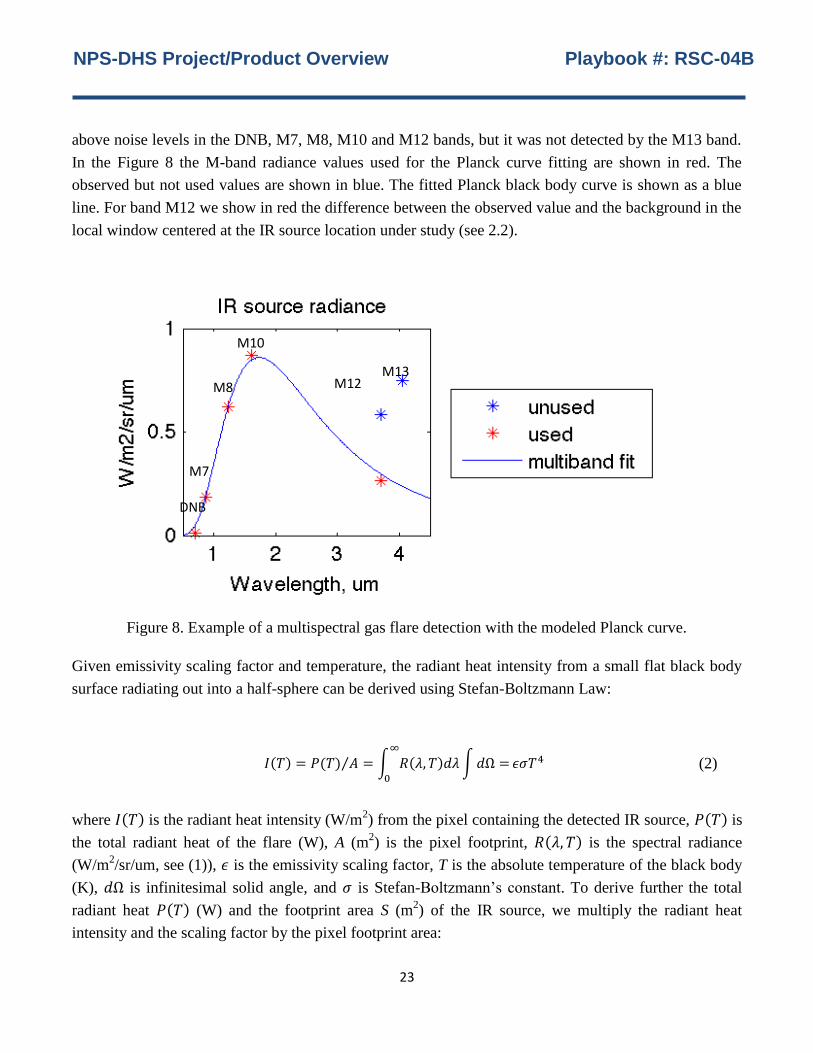
Figure 8 illustrates the fit of the Planck curve formula (1) to the observed radiances of one the flares. A
non-linear fitting algorithm searches for the optimal values of the flare temperature T and emissivity
scaling factor to minimize the sum of square differences between the model and the observed
radiances at the central wavelengths of the M-bands. In that particular case the IR source emits signal
NPS-DHS Project/Product Overview Playbook #: RSC-04B
23
above noise levels in the DNB, M7, M8, M10 and M12 bands, but it was not detected by the M13 band.
In the Figure 8 the M-band radiance values used for the Planck curve fitting are shown in red. The
observed but not used values are shown in blue. The fitted Planck black body curve is shown as a blue
line. For band M12 we show in red the difference between the observed value and the background in the
local window centered at the IR source location under study (see 2.2).
Figure 8. Example of a multispectral gas flare detection with the modeled Planck curve.
Given emissivity scaling factor and temperature, the radiant heat intensity from a small flat black body
surface radiating out into a half-sphere can be derived using Stefan-Boltzmann Law:
( ) ( ) ⁄ ∫ ( )
∫ (2)
where ( ) is the radiant heat intensity (W/m2) from the pixel containing the detected IR source, ( ) is
the total radiant heat of the flare (W), A (m2) is the pixel footprint, ( ) is the spectral radiance
(W/m2/sr/um, see (1)), is the emissivity scaling factor, T is the absolute temperature of the black body
(K), is infinitesimal solid angle, and is Stefan-Boltzmann’s constant. To derive further the total
radiant heat ( ) (W) and the footprint area S (m2) of the IR source, we multiply the radiant heat
intensity and the scaling factor by the pixel footprint area:
DNB
M10
M8 M12 22
M13
M7
NPS-DHS Project/Product Overview Playbook #: RSC-04B
24
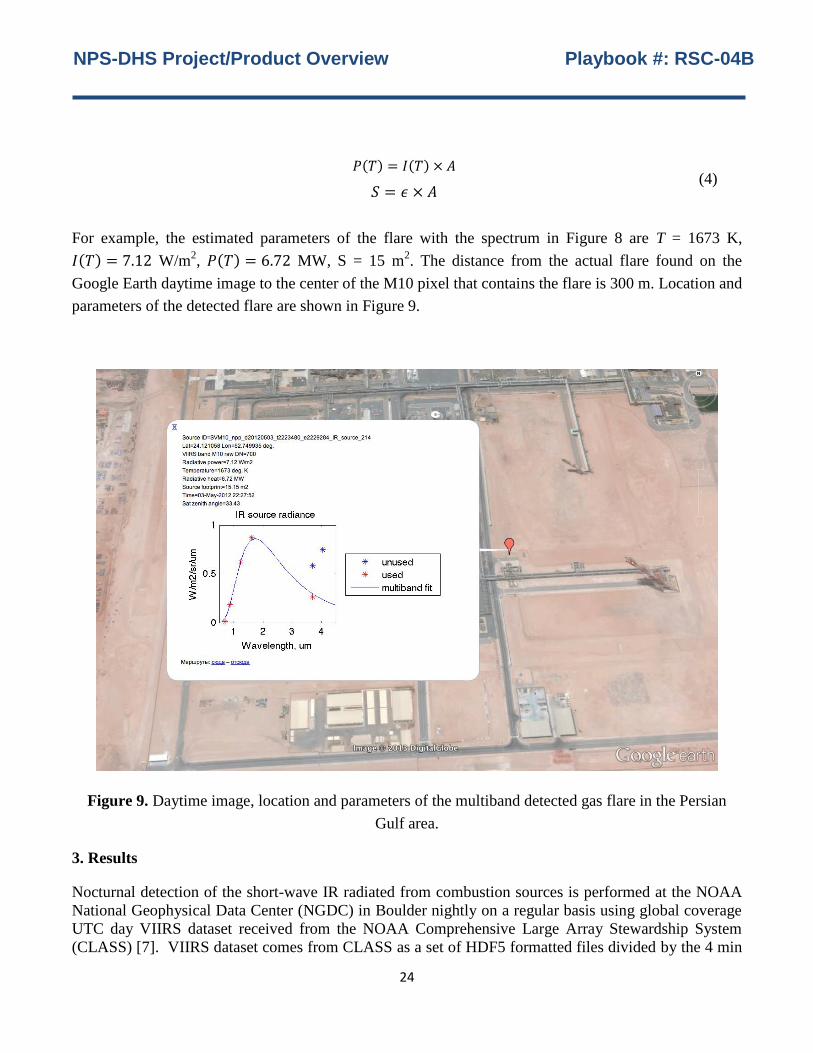
( ) ( )
(4)
For example, the estimated parameters of the flare with the spectrum in Figure 8 are T = 1673 K,
( ) W/m2, ( ) MW, S = 15 m
2. The distance from the actual flare found on the
Google Earth daytime image to the center of the M10 pixel that contains the flare is 300 m. Location and
parameters of the detected flare are shown in Figure 9.
Figure 9. Daytime image, location and parameters of the multiband detected gas flare in the Persian
Gulf area.
3. Results
Nocturnal detection of the short-wave IR radiated from combustion sources is performed at the NOAA
National Geophysical Data Center (NGDC) in Boulder nightly on a regular basis using global coverage
UTC day VIIRS dataset received from the NOAA Comprehensive Large Array Stewardship System
(CLASS) [7]. VIIRS dataset comes from CLASS as a set of HDF5 formatted files divided by the 4 min
NPS-DHS Project/Product Overview Playbook #: RSC-04B
25
of the satellite flight time for each satellite band. Multiband IR source detection first is performed
separately for each of the 4 min flight time data aggregates. At the last step of the procedure detection
the results for all the 4 min aggregates are merged together into a single table containing a global set of
the nocturnal short-wave IR combustion sources for the given UTC day. Typical number of IR source
detections per night is around 15,000.
Detection results are presented to the end user in two forms: as a CSV formatted table and as a KML
formatted vector map. The CSV table has entries for all the M10 pixels with radiance above the noise
level THRM10 such as IR source location and time stamp, M-channel radiances, satellite position, cloud
coverage, etc. The KML map shows locations of all the multiband detections, i.e. the M10 image local
maxima collocated with a hot spot in another M or DNB band. Using the KML file, the combustion
sources can be shown on the Google Earth (or Maps) with the “balloon” type placemarks of different
size and color. The color and size legend for the Google Earth display of the detection vector map is
presented in Table 2. The Google Earth screenshot with the global detections map for 29 January 2013 is
shown in Figures 10.
Table 2. Color and size legend for Google Earth display of the IR sources
Size legend Color legend
Size Radiant heat Color Temperature
large P(T) > 10 MW red T > 1600 K
medium 1 MW < P(T) < 10 MW yellow 1400 K < T < 1600 K
small P(T) < 1 MW green 1200 K < T < 1400 K
blue 1000 K < T < 1200 K
purple T < 1000 K
NPS-DHS Project/Product Overview Playbook #: RSC-04B
26
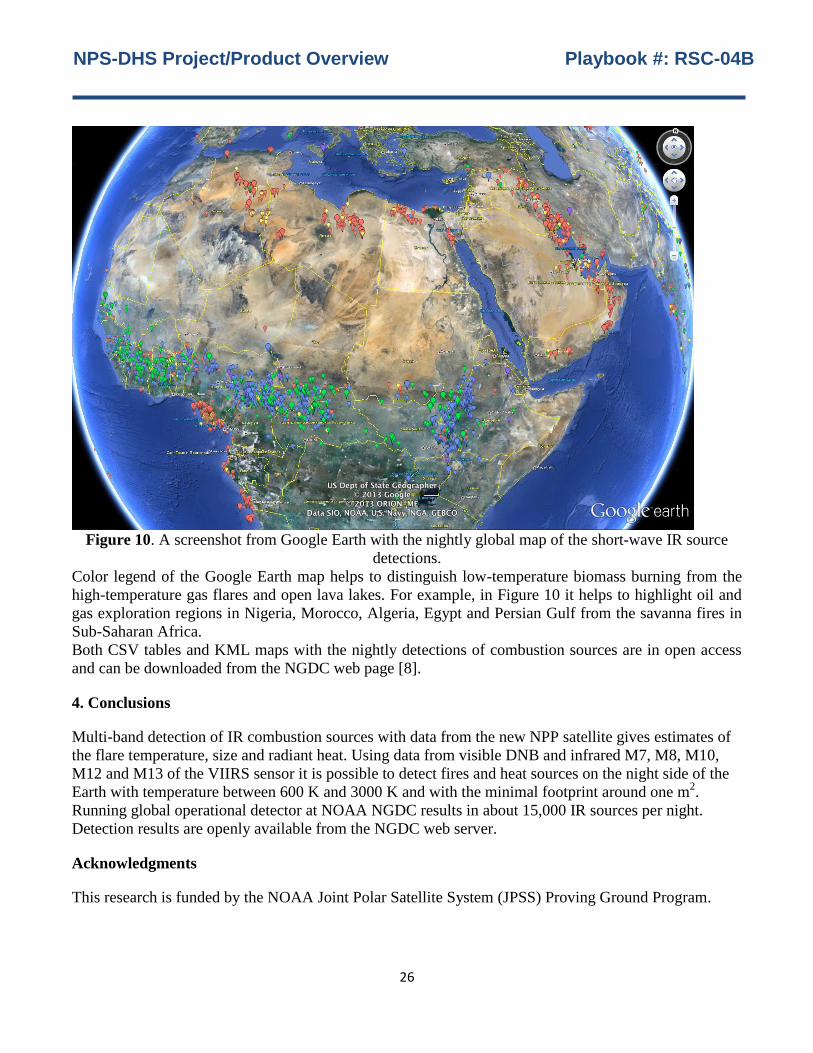
Figure 10. A screenshot from Google Earth with the nightly global map of the short-wave IR source
detections.
Color legend of the Google Earth map helps to distinguish low-temperature biomass burning from the
high-temperature gas flares and open lava lakes. For example, in Figure 10 it helps to highlight oil and
gas exploration regions in Nigeria, Morocco, Algeria, Egypt and Persian Gulf from the savanna fires in
Sub-Saharan Africa.
Both CSV tables and KML maps with the nightly detections of combustion sources are in open access
and can be downloaded from the NGDC web page [8].
4. Conclusions
Multi-band detection of IR combustion sources with data from the new NPP satellite gives estimates of
the flare temperature, size and radiant heat. Using data from visible DNB and infrared M7, M8, M10,
M12 and M13 of the VIIRS sensor it is possible to detect fires and heat sources on the night side of the
Earth with temperature between 600 K and 3000 K and with the minimal footprint around one m2.
Running global operational detector at NOAA NGDC results in about 15,000 IR sources per night.
Detection results are openly available from the NGDC web server.
Acknowledgments
This research is funded by the NOAA Joint Polar Satellite System (JPSS) Proving Ground Program.
NPS-DHS Project/Product Overview Playbook #: RSC-04B
27
References and Notes
1. Wooster, M.J.; Roberts. G.; Perry, G.L.W.; Kaufman, Y.J. Retrieval of biomass combustion rates
and totals from fire radiative power observations: FRP derivation and calibration relationships
between biomass consumption and fire radiative energy release. JGR, 2005, D24311
2. Elvidge, C.D.; Ziskin, D.; Baugh, K.E.; Tuttle, B.T.; Ghosh, T.; Pack, D.W.; Erwin, E.H.; Zhizhin,
M. A Fifteen Year Record of Global Natural Gas Flaring Derived from Satellite Data. Energies,
2009, 2(3), 595-622
3. Dozier, J. A Method for Satellite Identification of Surface Temperature Fields of Subpixel
Resolution. REMOTE SENSING OF Environment, 1981, 11, 221-229
4. Matson, M.; Dozier, J. Identification of Subresolution High Temperature Sources Using a Thermal
IR Sensor. Photogrammetric Engineering and Remote Sensing, 1981, 47, pp. 1311-1318
5 Justice, C.; Giglio, L.; Boschetti, L.; Roy, D.; Csiszar, I.; Morisette, J.; Kaufman, Y. MODIS Fire
Products (Version 2.3, 1 October 2006). Algorithm Technical Background Document
6. Pham, Tuan Q.. Non-maximum Suppression Using Fewer than Two Comparisons per Pixel. 12th
International Conference, ACIVS 2010, Sydney, Australia, December 13-16, 2010, Proceedings,
Part I, pp. 438-451.
7. NOAA Comprehensive Large Array Stewardship System (CLASS). URL
http://www.class.ngdc.noaa.gov (accessed on 29 January 2013)
8. NOAA NGDC web page with the nightly global IR source detection results. URL
http://www.ngdc.noaa.gov/eog/data/viirs_fire/viirs_html/download_viirs_fire.html (accessed on 29
January 2013)
© 2013 by the authors; licensee Asia Pacific Advanced Network. This article is an open-access article distributed under the
terms and conditions of the Creative Commons Attribution license (http://creativecommons.org/licenses/by/3.0/).
NPS-DHS Project/Product Overview Playbook #: RSC-04B
28
References Elvidge, C.D., Baugh, K.E., Hobson, V.R., Kihn, E.A., Kroehl, H.W., 1998, "Detection of Fires and Power Outages Using DMSP-OLS Data - Chapter 8", Remote Sensing Change Detection: Environmental Monitoring Methods and Applications, Ed. Lunetta, R.S. and Elvidge, C.D., Ann Arbor Press, 123-135. De Souza Filho, C.R., Zullo, J. Jr., Elvidge, C., 2004, "Brazil's 2001 energy crisis monitored from space", International Journal of Remote Sensing, 25(12), 2475-2482. Zhizhin, M., Elvidge, C., Hsu, F-C., Baugh, K., 2013, Using the Short-Wave Infrared for Nocturnal Detection of Combustion Sources in VIIRS Data, Proceedings of the Asia-Pacific Advanced Network 2013 v. 35, p. xx-zz. http://dx.doi.org/10.7125/APAN.35.x

![SITE DATA - DJUSD...• T8 lights throughout • No site pole lights • No preferred lighting and controls venders Fire Alarm Category [-] • Manual pull stations • Smoke detectors](https://img.pdfslide.us/doc/110x75/601256c8b4963d408267c6bf/site-data-djusd-a-t8-lights-throughout-a-no-site-pole-lights-a-no-preferred.jpg)