Embed Size (px)
Citation preview
NOAA National Weather ServiceLos Angeles/Oxnard
Fire Weather Decision Support
Where are We Going?
What is the Threat? What is the Threat? …Trends? What is the Threat? …Trends?
Why is the threat so high in SoCal?
What is the Threat? …Trends?
Why is the threat so high in SoCal?
What are the Critical Criteria?
What is the Threat? …Trends?
Why is the threat so high in SoCal?
What are the Critical Criteria?
How do we provide Decision Support?
Wild Fires ~ What is the Threat?
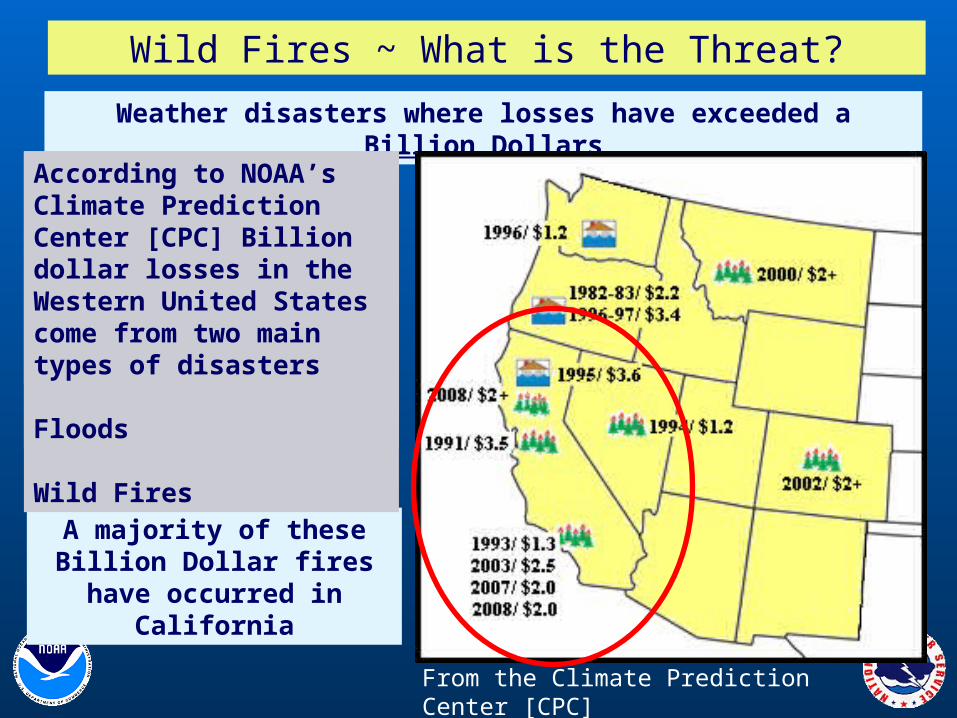
Weather disasters where losses have exceeded a Billion Dollars
A majority of these Billion Dollar fires have occurred in California
According to NOAA’s Climate Prediction Center [CPC] Billion dollar losses in the Western United States come from two main types of disasters
According to NOAA’s Climate Prediction Center [CPC] Billion dollar losses in the Western United States come from two main types of disasters
Floods
According to NOAA’s Climate Prediction Center [CPC] Billion dollar losses in the Western United States come from two main types of disasters
Floods
Wild Fires
From the Climate Prediction Center [CPC]
Wild Fires ~ What are the Trends?
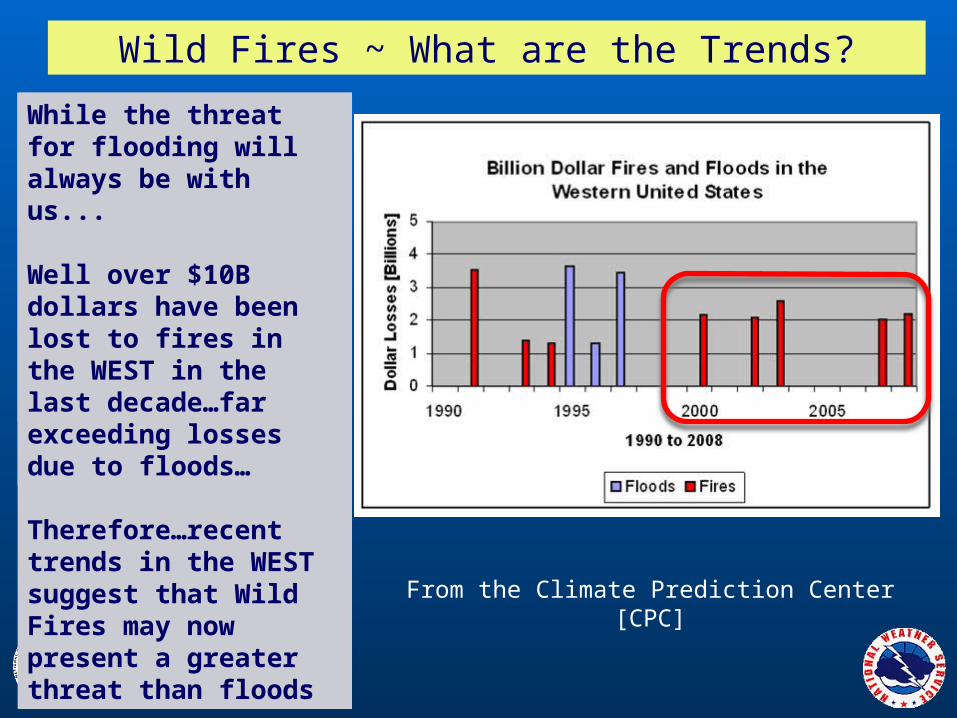
From the Climate Prediction Center [CPC]
While the threat for flooding will always be with us...
While the threat for flooding will always be with us...
Well over $10B dollars have been lost to fires in the WEST in the last decade…
While the threat for flooding will always be with us...
Well over $10B dollars have been lost to fires in the WEST in the last decade…far exceeding losses due to floods…
While the threat for flooding will always be with us...
Well over $10B dollars have been lost to fires in the WEST in the last decade…far exceeding losses due to floods…
Therefore…recent trends in the WEST suggest that Wild Fires may now present a greater threat than floods
Wild Fires ~ What are the Trends?
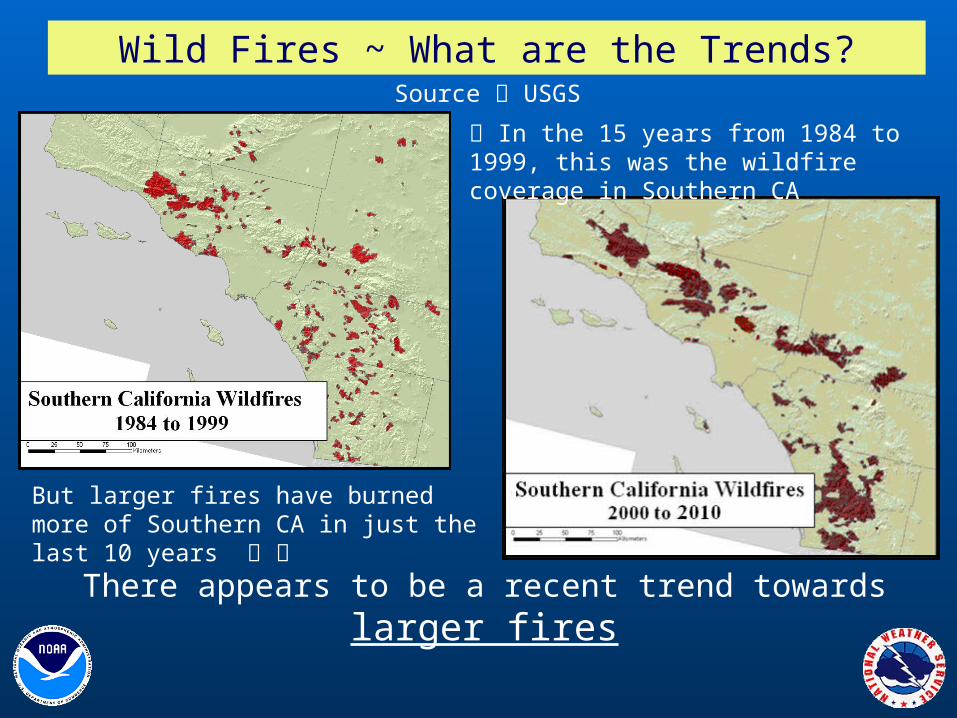
There appears to be a recent trend towards larger fires
Source USGS
In the 15 years from 1984 to 1999, this was the wildfire coverage in Southern CA
But larger fires have burned more of Southern CA in just the last 10 years
Why is the Threat so Great in Southern California?
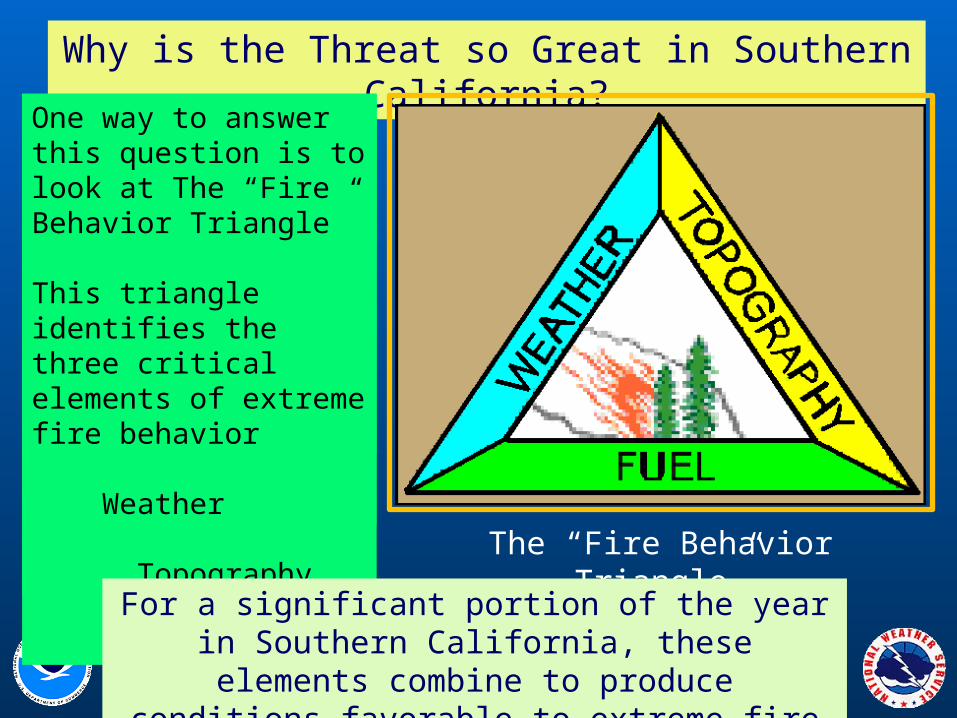
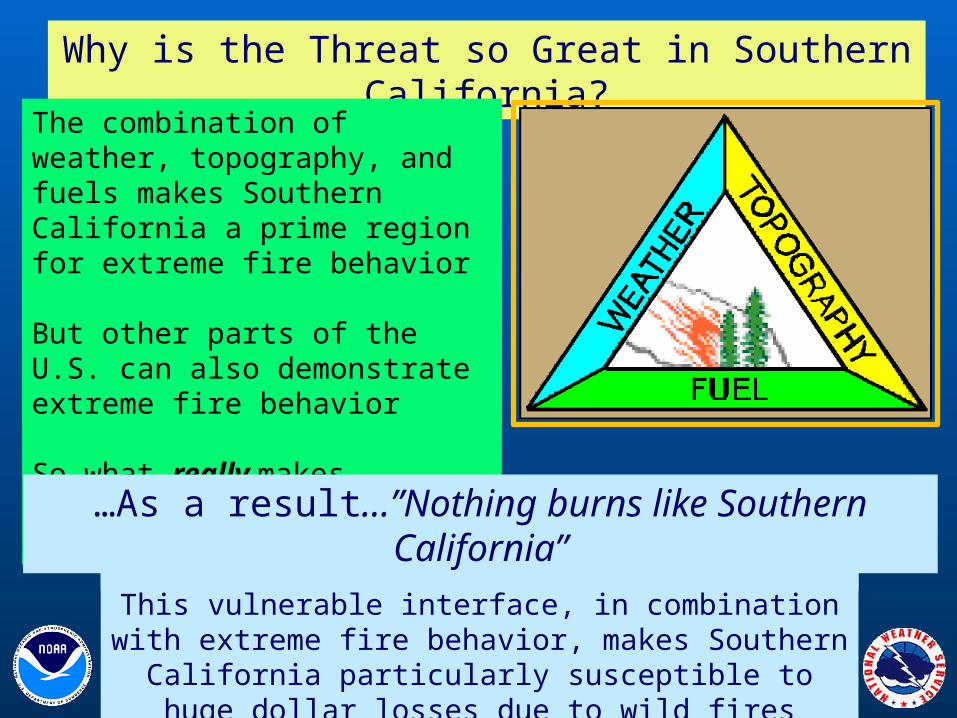
One way to answer this question is to look at The “Fire Behavior Triangle”
The “Fire Behavior Triangle”
One way to answer this question is to look at The “Fire Behavior Triangle”
This triangle identifies the three critical elements of extreme fire behavior
One way to answer this question is to look at The “Fire Behavior Triangle”
This triangle identifies the three critical elements of extreme fire behavior
Weather
One way to answer this question is to look at The “Fire Behavior Triangle”
This triangle identifies the three critical elements of extreme fire behavior
Weather
Topography
One way to answer this question is to look at The “Fire Behavior Triangle”
This triangle identifies the three critical elements of extreme fire behavior
Weather
Topography
FuelFor a significant portion of the year in Southern California, these elements combine to produce conditions favorable to extreme
fire behavior
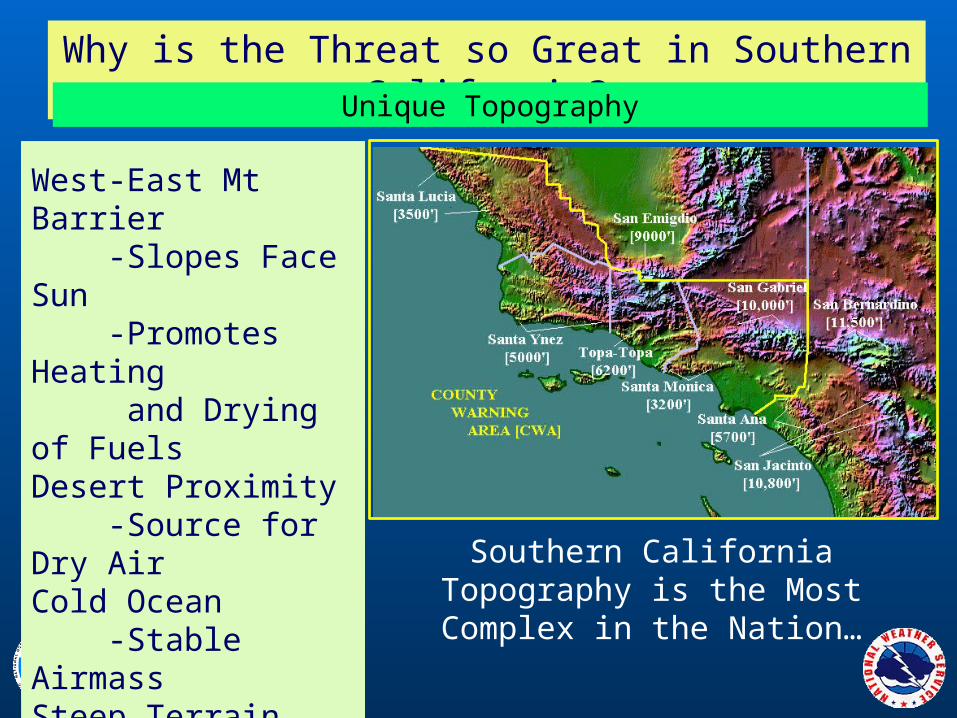
Why is the Threat so Great in Southern California?Unique Topography
West-East Mt Barrier
Southern California Topography is the Most Complex in the Nation…
West-East Mt Barrier -Slopes Face Sun
West-East Mt Barrier -Slopes Face Sun -Promotes Heating and Drying of Fuels
West-East Mt Barrier -Slopes Face Sun -Promotes Heating and Drying of FuelsDesert Proximity
West-East Mt Barrier -Slopes Face Sun -Promotes Heating and Drying of FuelsDesert Proximity -Source for Dry Air
West-East Mt Barrier -Slopes Face Sun -Promotes Heating and Drying of FuelsDesert Proximity -Source for Dry AirCold Ocean
West-East Mt Barrier -Slopes Face Sun -Promotes Heating and Drying of FuelsDesert Proximity -Source for Dry AirCold Ocean -Stable Airmass
West-East Mt Barrier -Slopes Face Sun -Promotes Heating and Drying of FuelsDesert Proximity -Source for Dry AirCold Ocean -Stable AirmassSteep Terrain
West-East Mt Barrier -Slopes Face Sun -Promotes Heating and Drying of FuelsDesert Proximity -Source for Dry AirCold Ocean -Stable AirmassSteep Terrain -Adiabatic warming
West-East Mt Barrier -Slopes Face Sun -Promotes Heating and Drying of FuelsDesert Proximity -Source for Dry AirCold Ocean -Stable AirmassSteep Terrain -Adiabatic warming -Terrain-driven fires
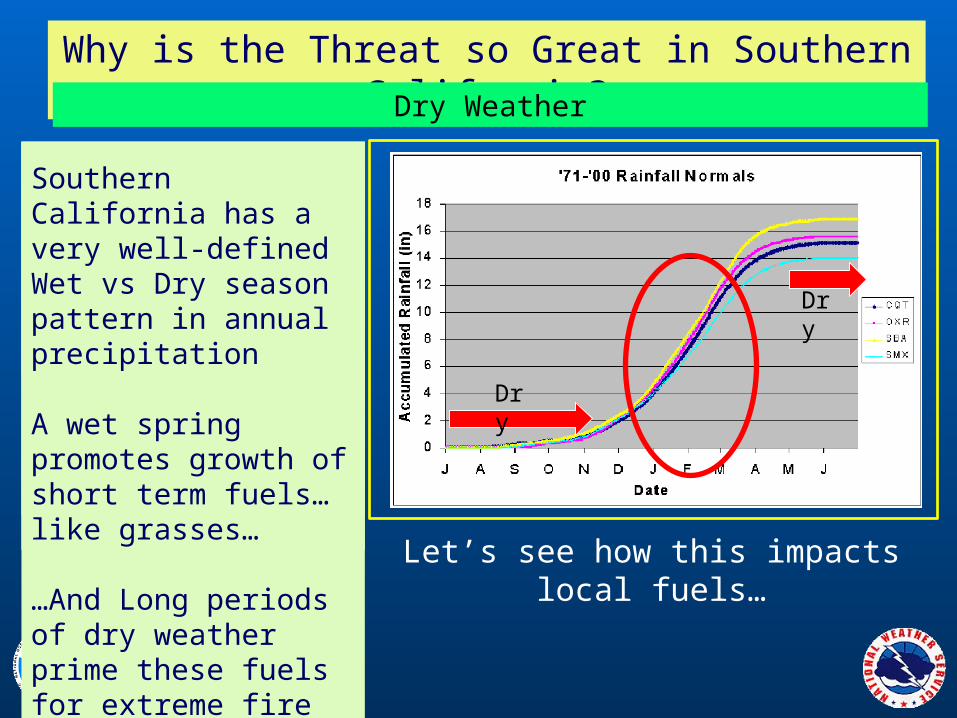
Why is the Threat so Great in Southern California?Dry Weather
Southern California has a very well-defined Wet vs Dry season pattern in annual precipitation
Let’s see how this impacts local fuels…
Dry
Dry
Southern California has a very well-defined Wet vs Dry season pattern in annual precipitation
A wet spring promotes growth of short term fuels…
Southern California has a very well-defined Wet vs Dry season pattern in annual precipitation
A wet spring promotes growth of short term fuels…like grasses…
Southern California has a very well-defined Wet vs Dry season pattern in annual precipitation
A wet spring promotes growth of short term fuels…like grasses…
…And Long periods of dry weather prime these fuels for extreme fire behavior
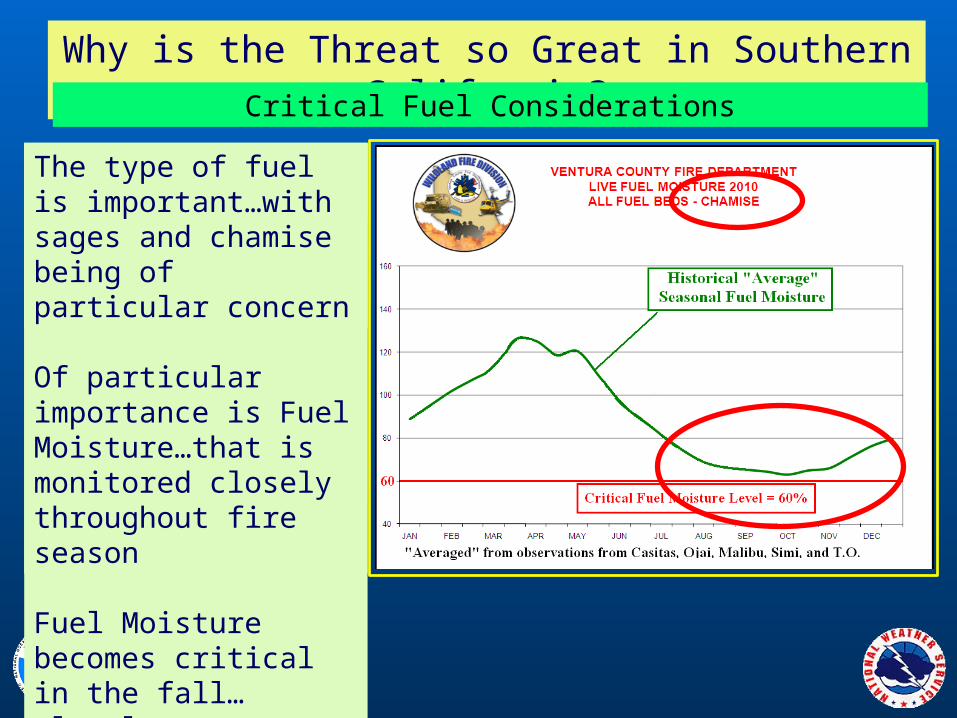
Why is the Threat so Great in Southern California?Critical Fuel Considerations
The type of fuel is important…The type of fuel is important…with sages and chamise being of particular concern
The type of fuel is important…with sages and chamise being of particular concern
Of particular importance is Fuel Moisture…that is monitored closely throughout fire season
The type of fuel is important…with sages and chamise being of particular concern
Of particular importance is Fuel Moisture…that is monitored closely throughout fire season
Fuel Moisture becomes critical in the fall…closely paralleling the local rainfall pattern
Why is the Threat so Great in Southern California?
The combination of weather, topography, and fuels makes Southern California a prime region for extreme fire behavior
The combination of weather, topography, and fuels makes Southern California a prime region for extreme fire behavior
But other parts of the U.S. can also demonstrate extreme fire behavior
The combination of weather, topography, and fuels makes Southern California a prime region for extreme fire behavior
But other parts of the U.S. can also demonstrate extreme fire behavior
So what really makes Southern California so uniquely vulnerable?
Southern California is home to the largest urban/wildland interface in the Nation
Southern California is home to the largest urban/wildland interface in the Nation
This vulnerable interface, in combination with extreme fire behavior, makes Southern California particularly susceptible to huge dollar losses due
to wild fires
…As a result…”Nothing burns like Southern California”
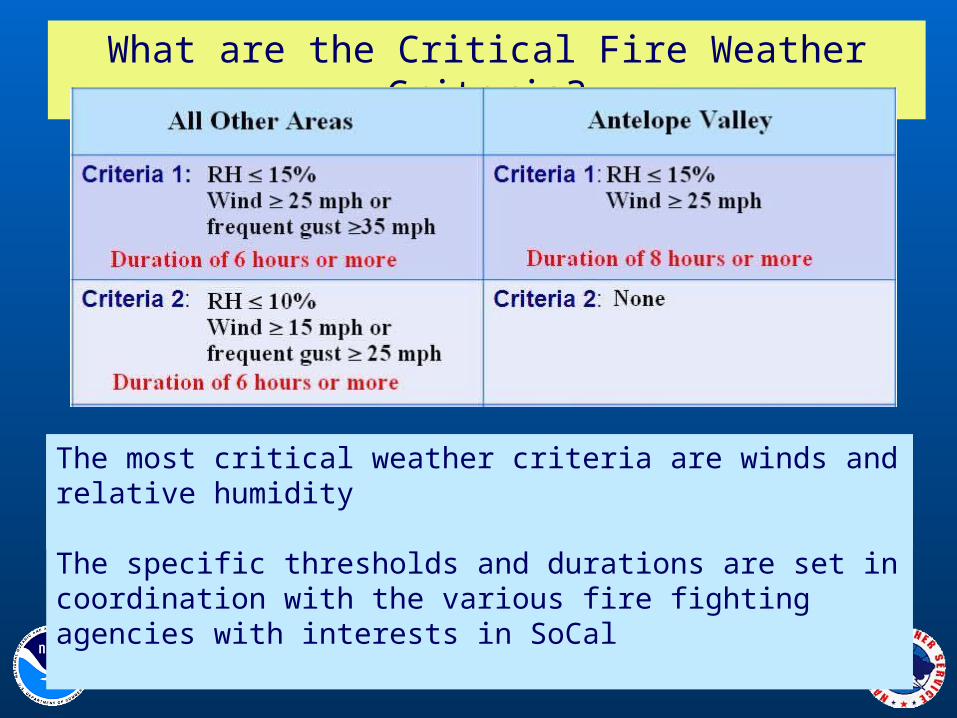
What are the Critical Fire Weather Criteria?
The most critical weather criteria are winds and relative humidityThe most critical weather criteria are winds and relative humidity
The specific thresholds and durations are set in coordination with the various fire fighting agencies with interests in SoCal
What are the Critical Fire Weather Criteria?
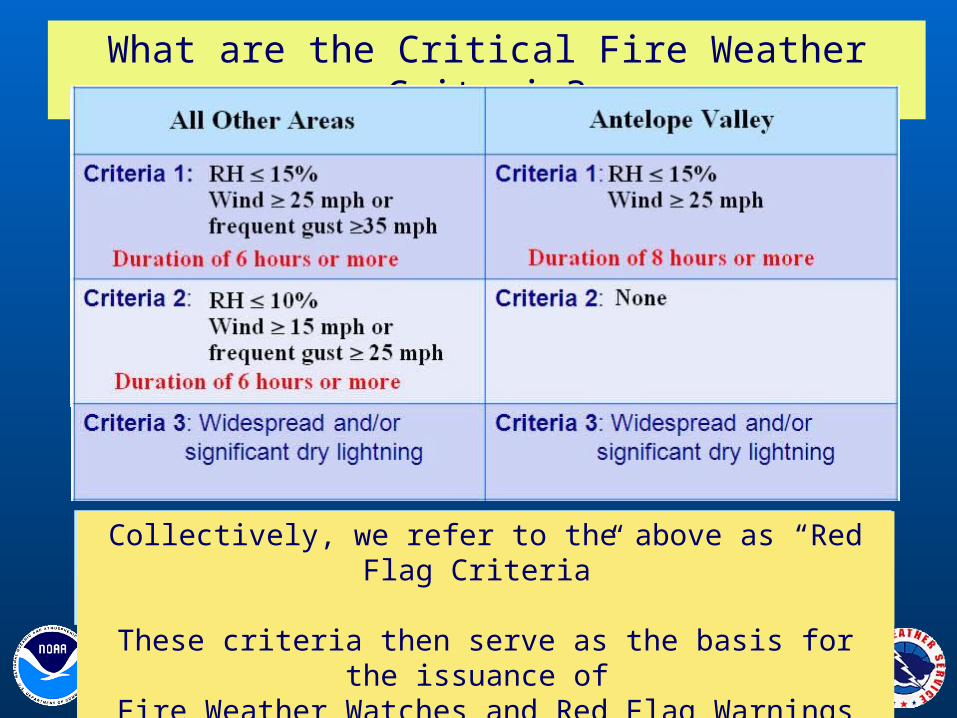
An additional criteria covers those situations with significant levels of dry lighting
Collectively, we refer to the above as “Red Flag Criteria”
Collectively, we refer to the above as “Red Flag Criteria”
These criteria then serve as the basis for the issuance of
Fire Weather Watches and Red Flag Warnings
What are the Critical Fire Weather Criteria?
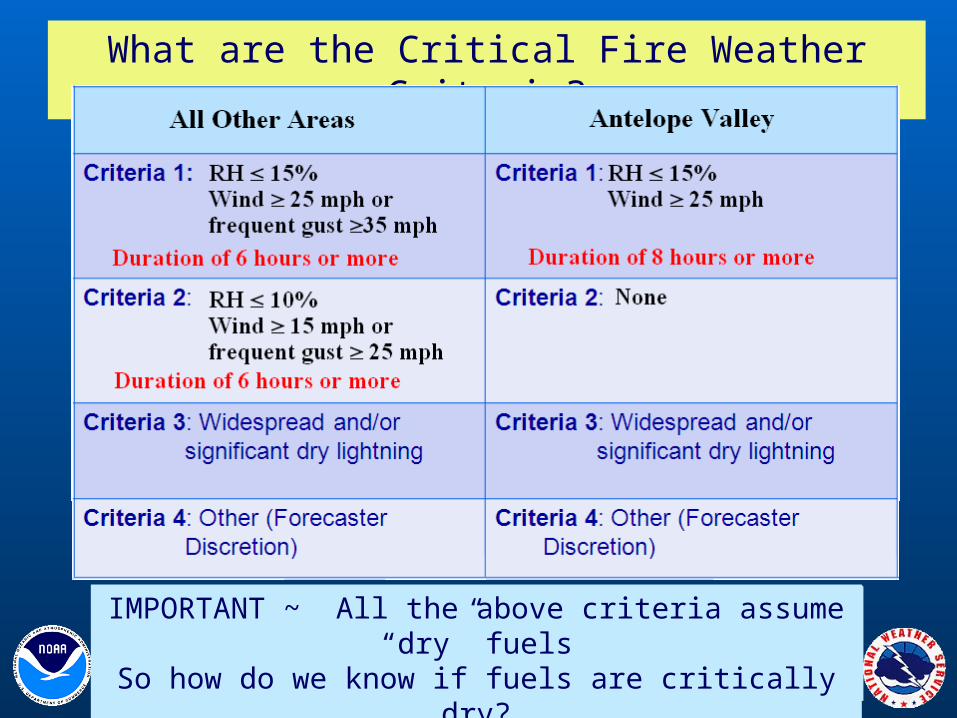
Finally…there is a “catch-all” criteria that allows forecaster discretion for an event that does not quite fit RFW criteria
IMPORTANT ~ All the above criteria assume “dry” fuels
IMPORTANT ~ All the above criteria assume “dry” fuels
So how do we know if fuels are critically dry?
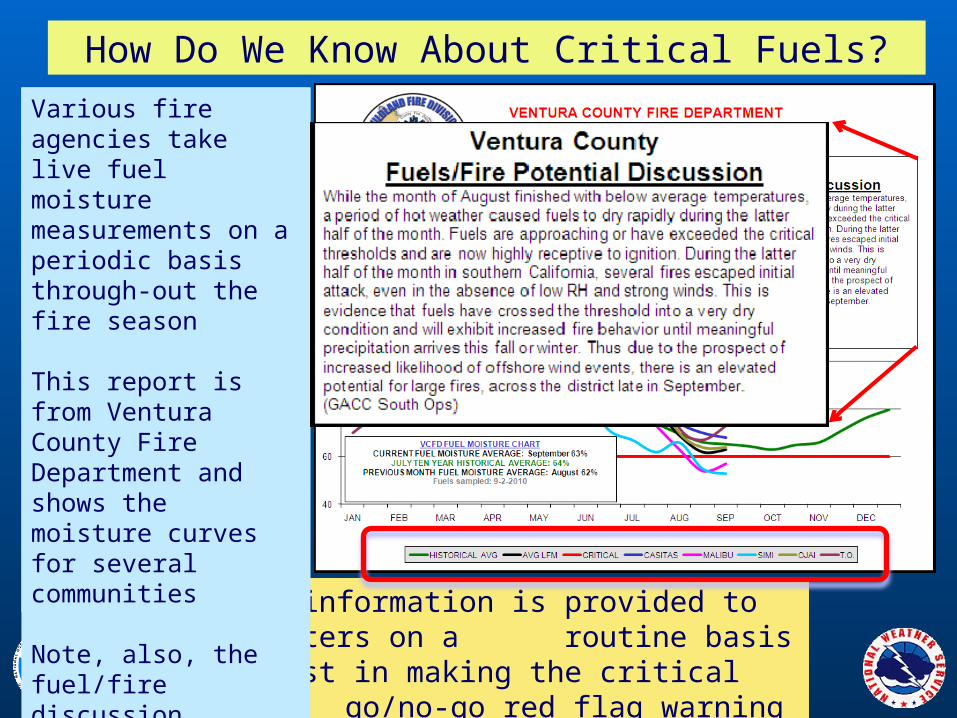
How Do We Know About Critical Fuels?
This information is provided to forecasters on a routine basis to assist in making
the critical go/no-go red flag warning decisions
Various fire agencies take live fuel moisture measurements on a periodic basis through-out the fire season
Various fire agencies take live fuel moisture measurements on a periodic basis through-out the fire season
This report is from Ventura County Fire Department and shows the moisture curves for several communities
Various fire agencies take live fuel moisture measurements on a periodic basis through-out the fire season
This report is from Ventura County Fire Department and shows the moisture curves for several communities
Note, also, the fuel/fire discussion included in the report
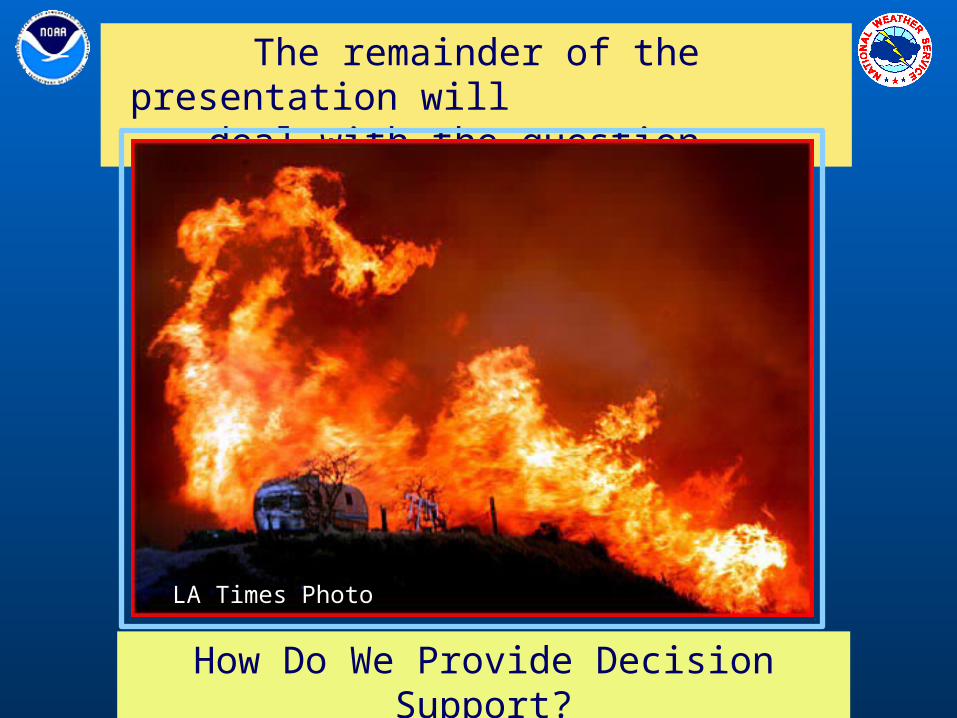
How Do We Provide Decision Support?
The remainder of the presentation will deal with the question…
LA Times Photo
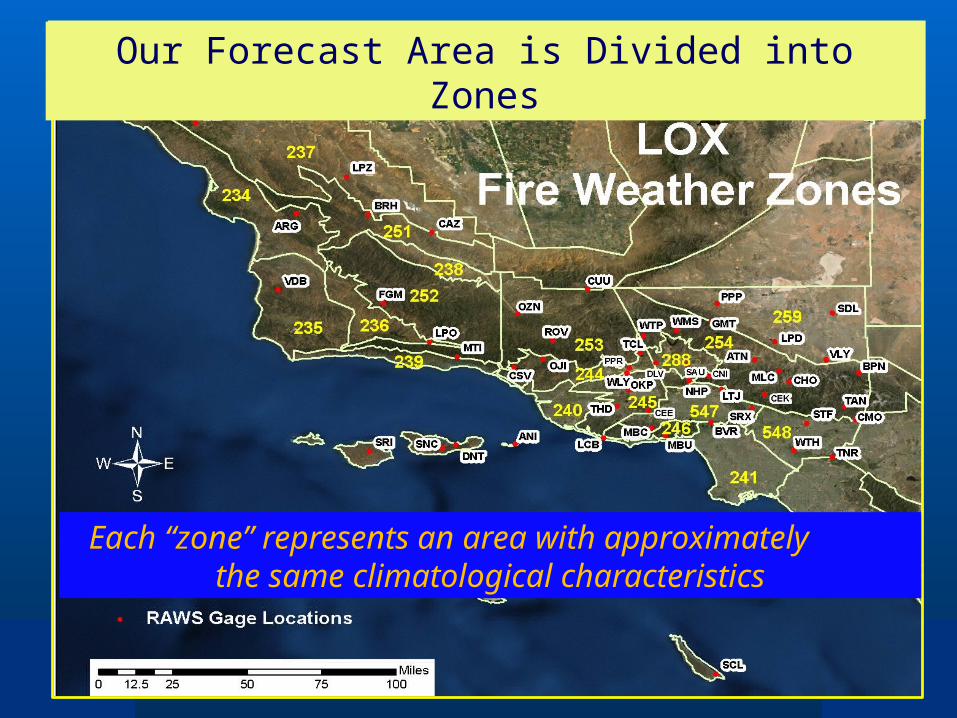
We are only Responsible for Part of Southern CA
Each “zone” represents an area with approximately the same climatological characteristics
Our Forecast Area is Divided into Zones
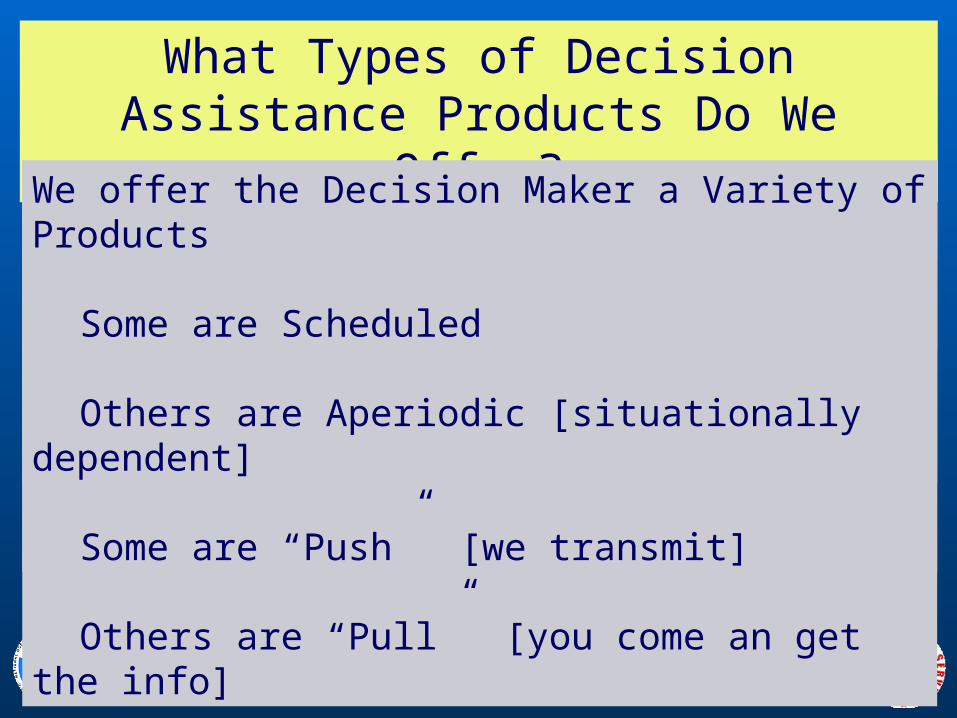
What Types of Decision Assistance Products Do We Offer?
We offer the Decision Maker a Variety of ProductsWe offer the Decision Maker a Variety of Products
Some are Scheduled
We offer the Decision Maker a Variety of Products
Some are Scheduled
Others are Aperiodic [situationally dependent]
We offer the Decision Maker a Variety of Products
Some are Scheduled
Others are Aperiodic [situationally dependent]
Some are “Push” [we transmit]
We offer the Decision Maker a Variety of Products
Some are Scheduled
Others are Aperiodic [situationally dependent]
Some are “Push” [we transmit]
Others are “Pull” [you come an get the info]
Fire Weather Products
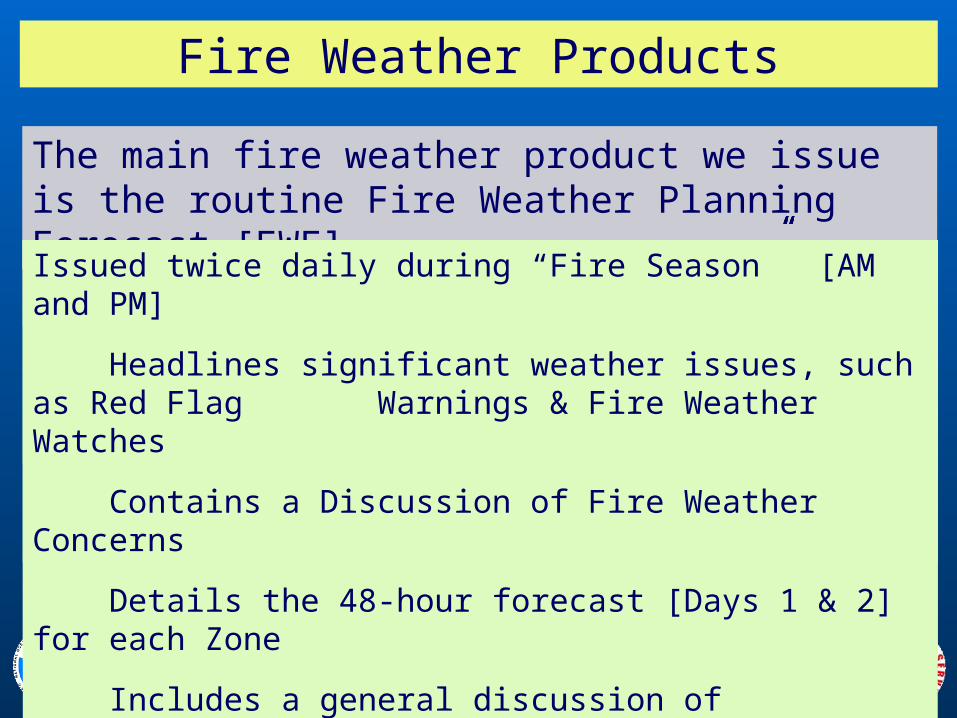
The main fire weather product we issue is the routine Fire Weather Planning Forecast [FWF]
Issued twice daily during “Fire Season” [AM and PM]Issued twice daily during “Fire Season” [AM and PM]
Headlines significant weather issues, such as Red Flag Warnings & Fire Weather Watches
Issued twice daily during “Fire Season” [AM and PM]
Headlines significant weather issues, such as Red Flag Warnings & Fire Weather Watches
Contains a Discussion of Fire Weather Concerns
Issued twice daily during “Fire Season” [AM and PM]
Headlines significant weather issues, such as Red Flag Warnings & Fire Weather Watches
Contains a Discussion of Fire Weather Concerns
Details the 48-hour forecast [Days 1 & 2] for each Zone
Issued twice daily during “Fire Season” [AM and PM]
Headlines significant weather issues, such as Red Flag Warnings & Fire Weather Watches
Contains a Discussion of Fire Weather Concerns
Details the 48-hour forecast [Days 1 & 2] for each Zone
Includes a general discussion of conditions for days 3 thru 5
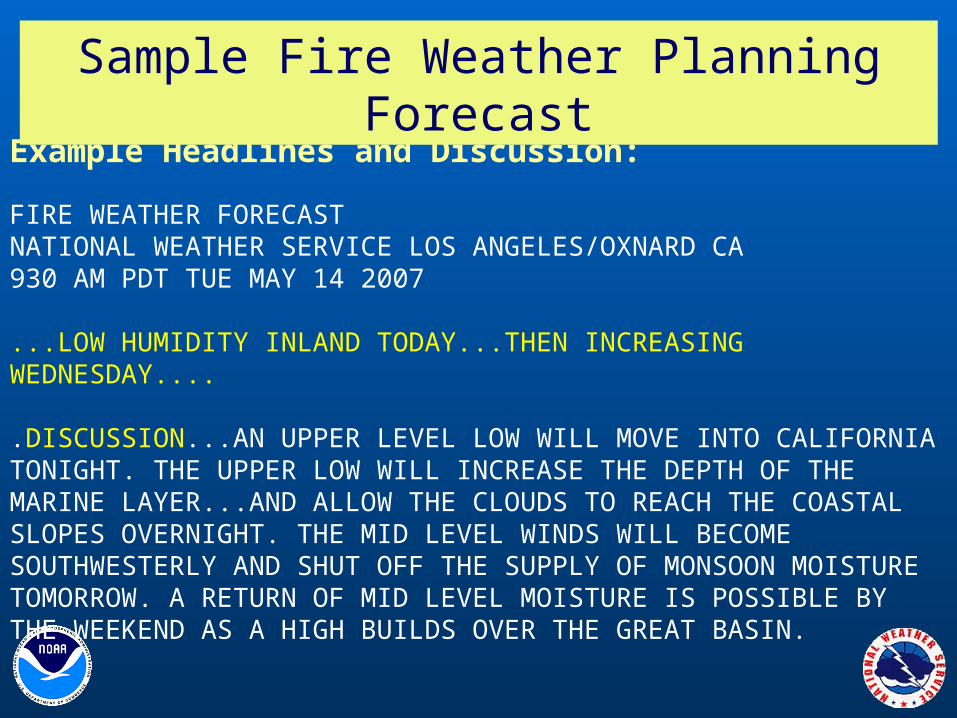
Example Headlines and Discussion:
FIRE WEATHER FORECAST NATIONAL WEATHER SERVICE LOS ANGELES/OXNARD CA 930 AM PDT TUE MAY 14 2007 ...LOW HUMIDITY INLAND TODAY...THEN INCREASING WEDNESDAY....
.DISCUSSION...AN UPPER LEVEL LOW WILL MOVE INTO CALIFORNIA TONIGHT. THE UPPER LOW WILL INCREASE THE DEPTH OF THE MARINE LAYER...AND ALLOW THE CLOUDS TO REACH THE COASTAL SLOPES OVERNIGHT. THE MID LEVEL WINDS WILL BECOME SOUTHWESTERLY AND SHUT OFF THE SUPPLY OF MONSOON MOISTURE TOMORROW. A RETURN OF MID LEVEL MOISTURE IS POSSIBLE BY THE WEEKEND AS A HIGH BUILDS OVER THE GREAT BASIN.
Sample Fire Weather Planning Forecast
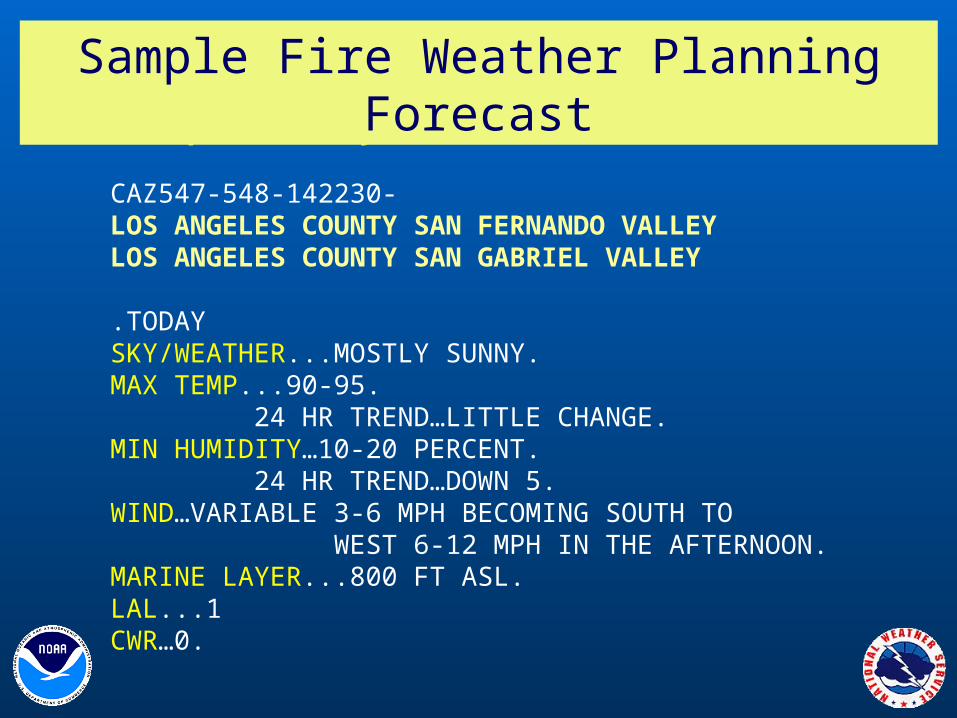
Example Valley Zone Forecast
CAZ547-548-142230- LOS ANGELES COUNTY SAN FERNANDO VALLEY LOS ANGELES COUNTY SAN GABRIEL VALLEY .TODAY SKY/WEATHER...MOSTLY SUNNY. MAX TEMP...90-95. 24 HR TREND…LITTLE CHANGE. MIN HUMIDITY…10-20 PERCENT. 24 HR TREND…DOWN 5. WIND…VARIABLE 3-6 MPH BECOMING SOUTH TO WEST 6-12 MPH IN THE AFTERNOON.MARINE LAYER...800 FT ASL.LAL...1 CWR…0.
Sample Fire Weather Planning Forecast
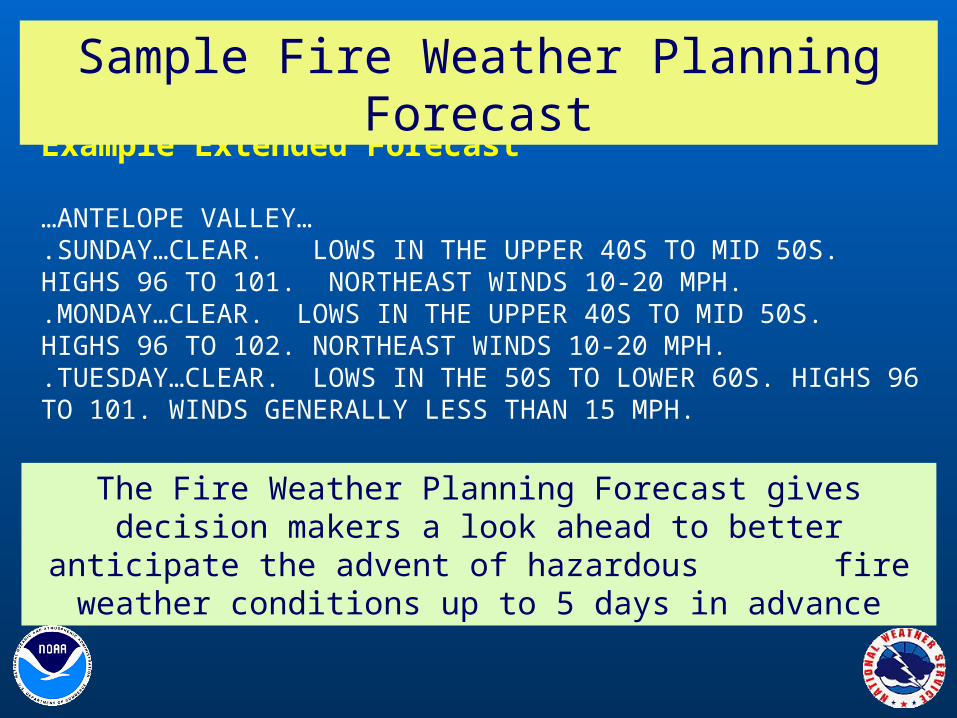
Example Extended Forecast
…ANTELOPE VALLEY….SUNDAY…CLEAR. LOWS IN THE UPPER 40S TO MID 50S. HIGHS 96 TO 101. NORTHEAST WINDS 10-20 MPH..MONDAY…CLEAR. LOWS IN THE UPPER 40S TO MID 50S. HIGHS 96 TO 102. NORTHEAST WINDS 10-20 MPH..TUESDAY…CLEAR. LOWS IN THE 50S TO LOWER 60S. HIGHS 96 TO 101. WINDS GENERALLY LESS THAN 15 MPH.
The Fire Weather Planning Forecast gives decision makers a look ahead to better anticipate the advent of hazardous fire weather conditions up to 5 days in
advance
Sample Fire Weather Planning Forecast
NATIONAL FIRE DANGER RATING SYSTEM TREND FORECAST [NFDRS]
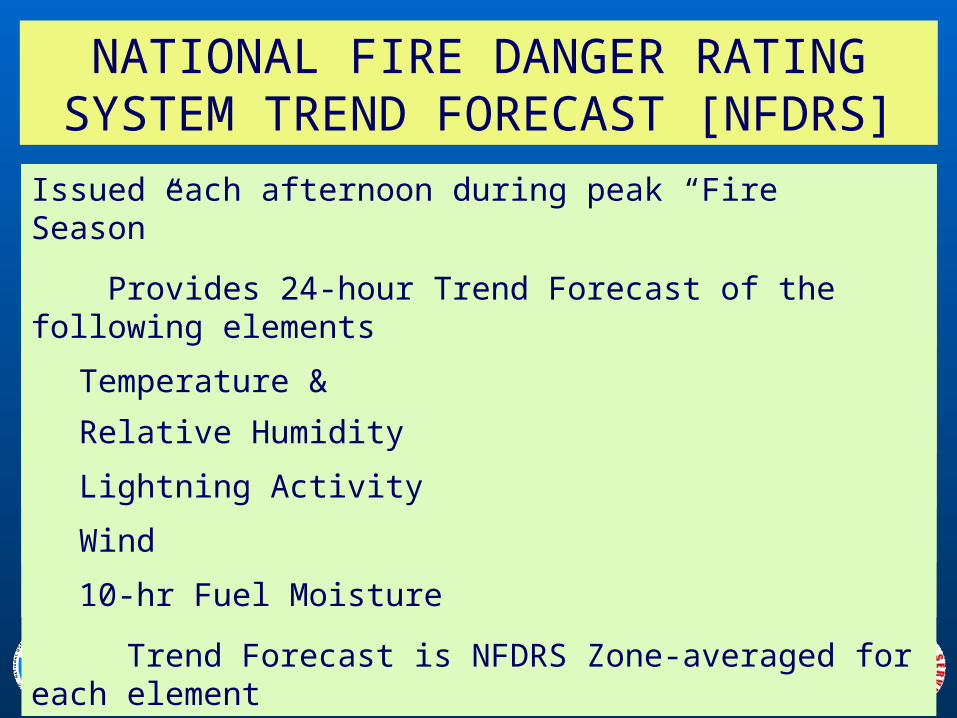
Issued each afternoon during peak “Fire Season”Issued each afternoon during peak “Fire Season”
Provides 24-hour Trend Forecast of the following elements
Issued each afternoon during peak “Fire Season”
Provides 24-hour Trend Forecast of the following elements
Temperature &
Relative Humidity
Issued each afternoon during peak “Fire Season”
Provides 24-hour Trend Forecast of the following elements
Temperature &
Relative Humidity
Lightning Activity
Issued each afternoon during peak “Fire Season”
Provides 24-hour Trend Forecast of the following elements
Temperature &
Relative Humidity
Lightning Activity
Wind
Issued each afternoon during peak “Fire Season”
Provides 24-hour Trend Forecast of the following elements
Temperature &
Relative Humidity
Lightning Activity
Wind
10-hr Fuel Moisture
Issued each afternoon during peak “Fire Season”
Provides 24-hour Trend Forecast of the following elements
Temperature &
Relative Humidity
Lightning Activity
Wind
10-hr Fuel Moisture
Trend Forecast is NFDRS Zone-averaged for each element
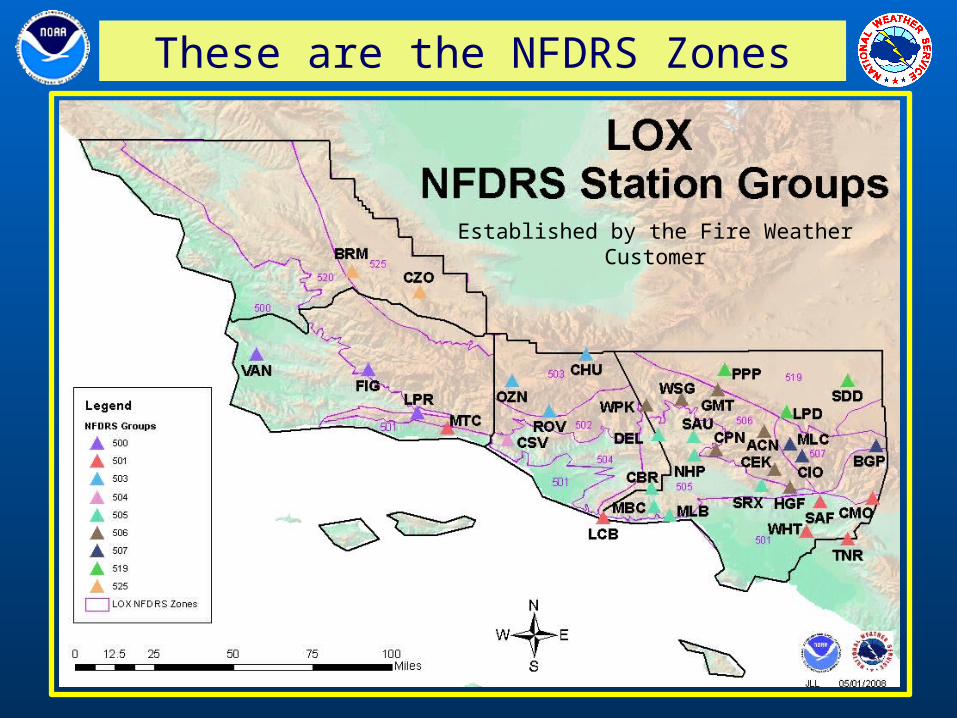
These are the NFDRS Zones
Established by the Fire Weather Customer
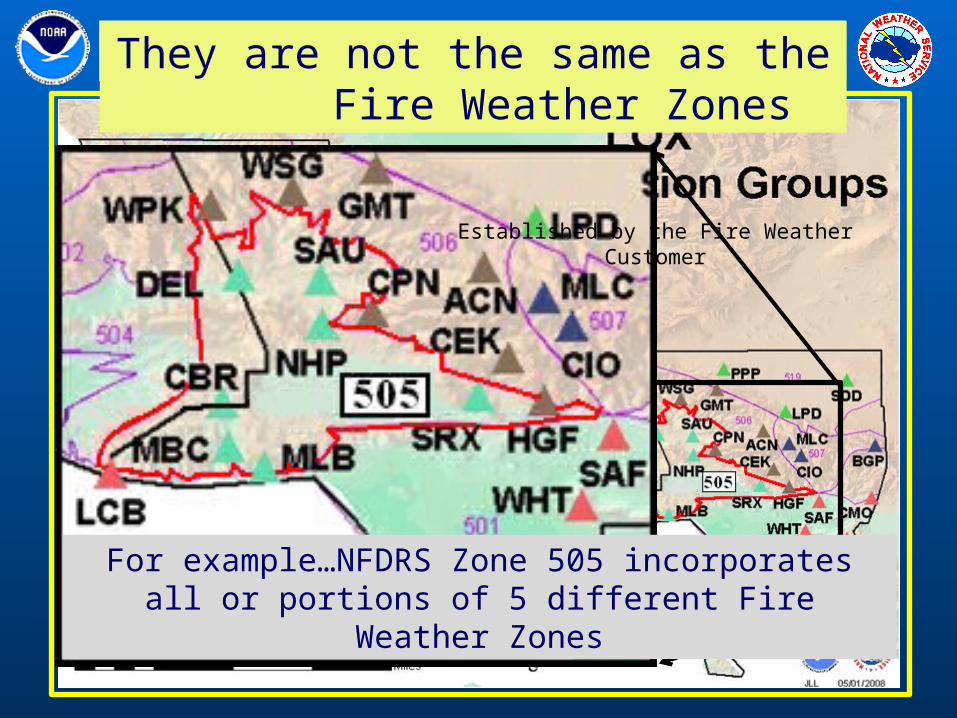
These are the NFDRS ZonesThey are not the same as the Fire Weather Zones
For example…NFDRS Zone 505 incorporates all or portions of 5 different Fire Weather Zones
Established by the Fire Weather Customer

Sample NFDRS Trend Forecast
The end product of the NFDRS Trend Forecast is a table called the Fire Weather Matrix [FWM]
The end product of the NFDRS Trend Forecast is a table called the Fire Weather Matrix [FWM]
The Fire Weather Matrix is used as the primary input to models that forecast fire weather danger for the next day
The output of the Fire Danger Rating Model is used by fire agencies to make manning and
deployment decisions to address the forecast fire threat
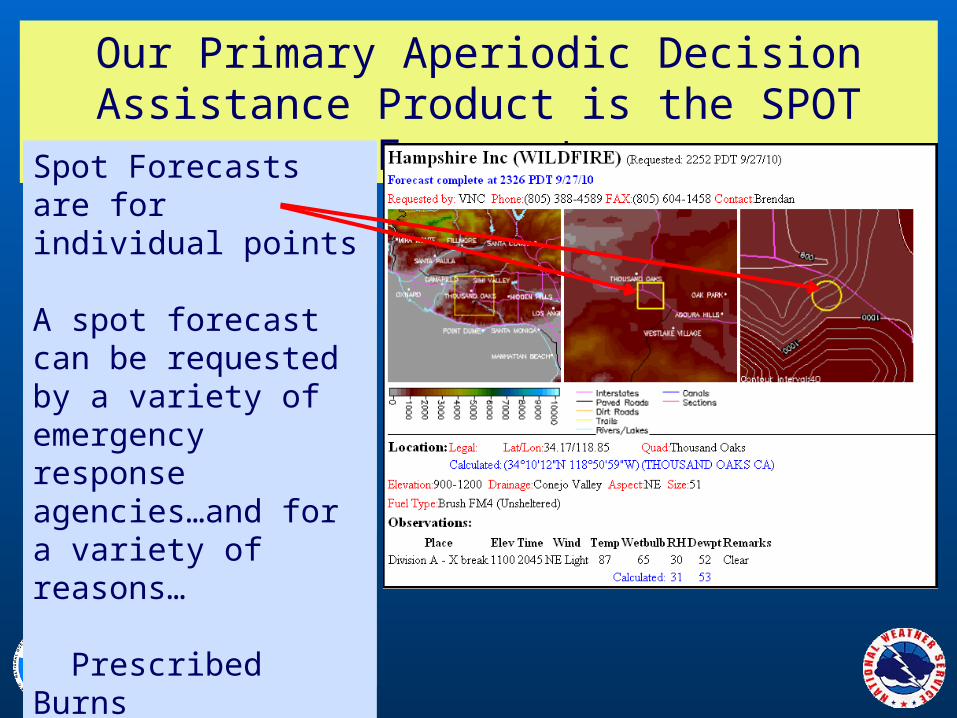
Our Primary Aperiodic Decision Assistance Product is the SPOT Forecast
Spot Forecasts are for individual pointsSpot Forecasts are for individual points
A spot forecast can be requested by a variety of emergency response agencies
Spot Forecasts are for individual points
A spot forecast can be requested by a variety of emergency response agencies…and for a variety of reasons…
Spot Forecasts are for individual points
A spot forecast can be requested by a variety of emergency response agencies…and for a variety of reasons…
Prescribed Burns
Spot Forecasts are for individual points
A spot forecast can be requested by a variety of emergency response agencies…and for a variety of reasons…
Prescribed Burns Wildfires
Spot Forecasts are for individual points
A spot forecast can be requested by a variety of emergency response agencies…and for a variety of reasons…
Prescribed Burns Wildfires Hazardous Spills
Spot Forecasts are for individual points
A spot forecast can be requested by a variety of emergency response agencies…and for a variety of reasons…
Prescribed Burns Wildfires Hazardous Spills Search & Rescue
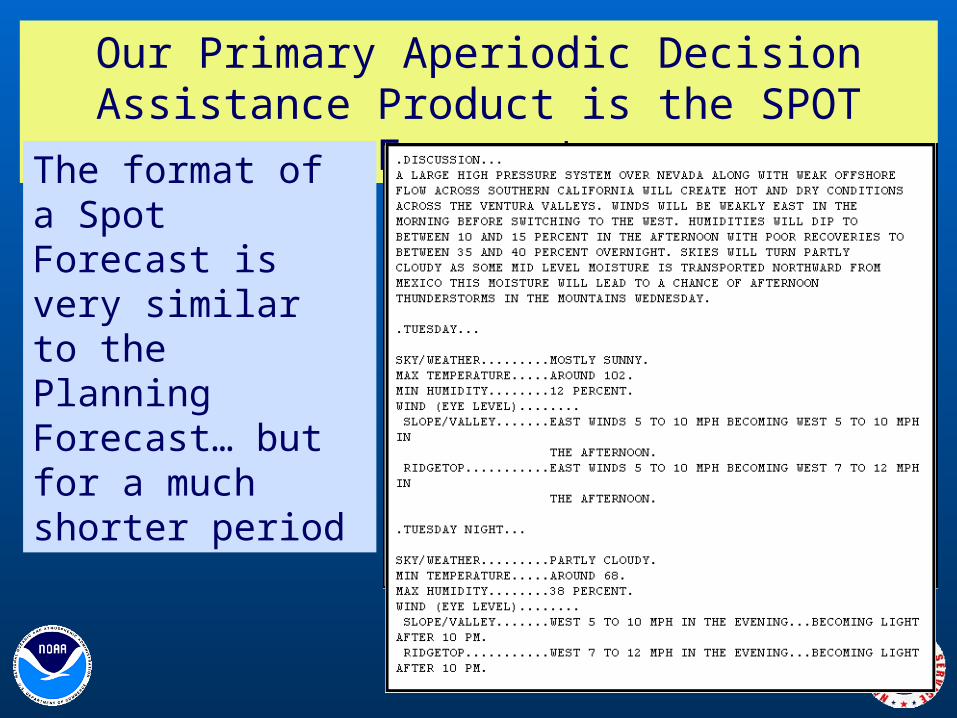
Our Primary Aperiodic Decision Assistance Product is the SPOT Forecast
The format of a Spot Forecast is very similar to the Planning Forecast… but for a much shorter period
We Also Issue Fire Weather Watches and Red Flag Warnings…as Needed
Recall the earlier discussion on Red Flag CriteriaRecall the earlier discussion on Red Flag CriteriaWinds, RH, lightning, dry fuels
Recall the earlier discussion on Red Flag CriteriaWinds, RH, lightning, dry fuelsDuration
Recall the earlier discussion on Red Flag CriteriaWinds, RH, lightning, dry fuelsDuration
Fire Weather Watches are issued when there is reasonable confidence that “red flag criteria” will occur within 24 to 72 hours
Recall the earlier discussion on Red Flag CriteriaWinds, RH, lightning, dry fuelsDuration
Fire Weather Watches are issued when there is reasonable confidence that “red flag criteria” will occur within 24 to 72 hours
A Red Flag Warning is issued when there is a high degree of confidence that “red flag criteria” will be met within 24 hours, or when red flag conditions are occurring
These are issued in coordination with the local fire fighting agencies…and are issued by fire weather zone…
We Also Provide “On-the-Spot” Decision Assistance with Our IMET Program
IMETs, or Incident Meteorologists, provide on-site support for the following…
IMETs, or Incident Meteorologists, provide on-site support for the following…WildfiresHazmat [Hazardous Materials Spills]Large Burn Area Debris Flow SupportDisaster Recovery [ex. oil spill, earthquake,
tornado]
IMETs, or Incident Meteorologists, provide on-site support for the following…WildfiresHazmat [Hazardous Materials Spills]Large Burn Area Debris Flow SupportDisaster Recovery [ex. oil spill, earthquake,
tornado] IMET coordinates with the local NWS forecast
office and provides finer detailed forecast information tailored to the particular emergency scenario
At NWS Oxnard, Rich Thompson is the IMET
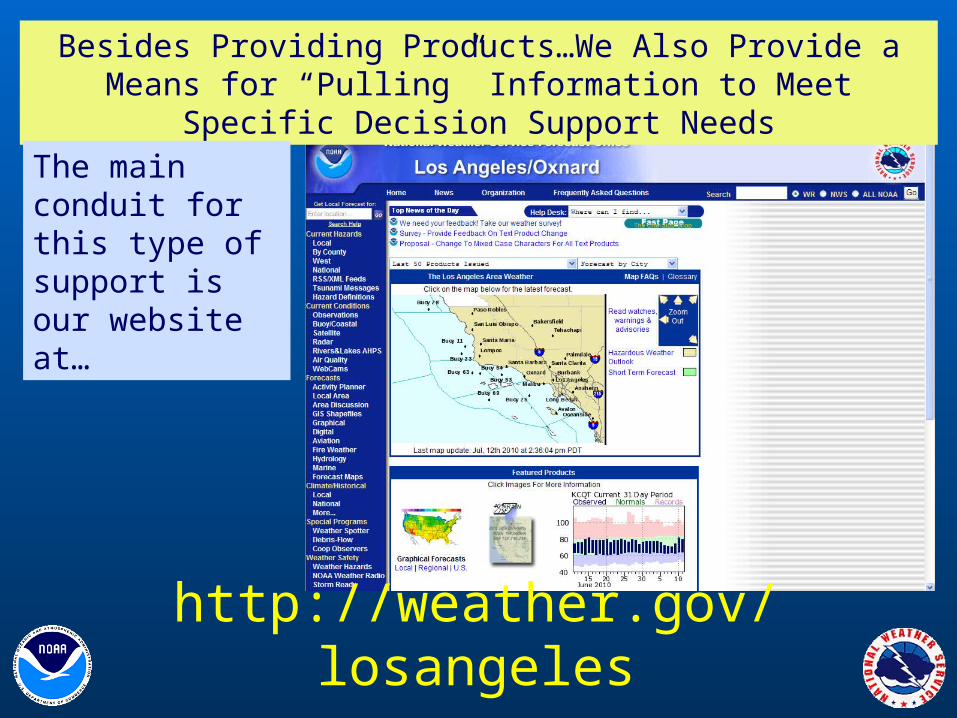
Besides Providing Products…We Also Provide a Means for “Pulling” Information to Meet Specific Decision
Support NeedsThe main conduit for this type of support is our website at…
http://weather.gov/losangeles
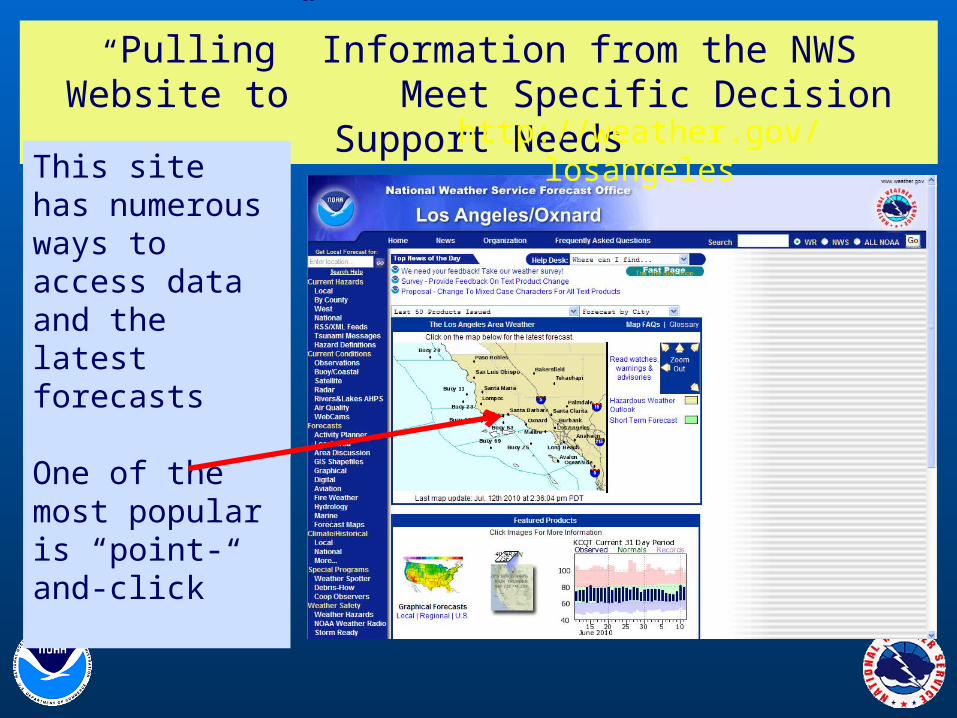
“Pulling” Information from the NWS Website to Meet Specific Decision Support Needs
This site has numerous ways to access data and the latest forecasts
http://weather.gov/losangelesThis site has numerous ways to access data and the latest forecasts
One of the most popular is “point- and-click”
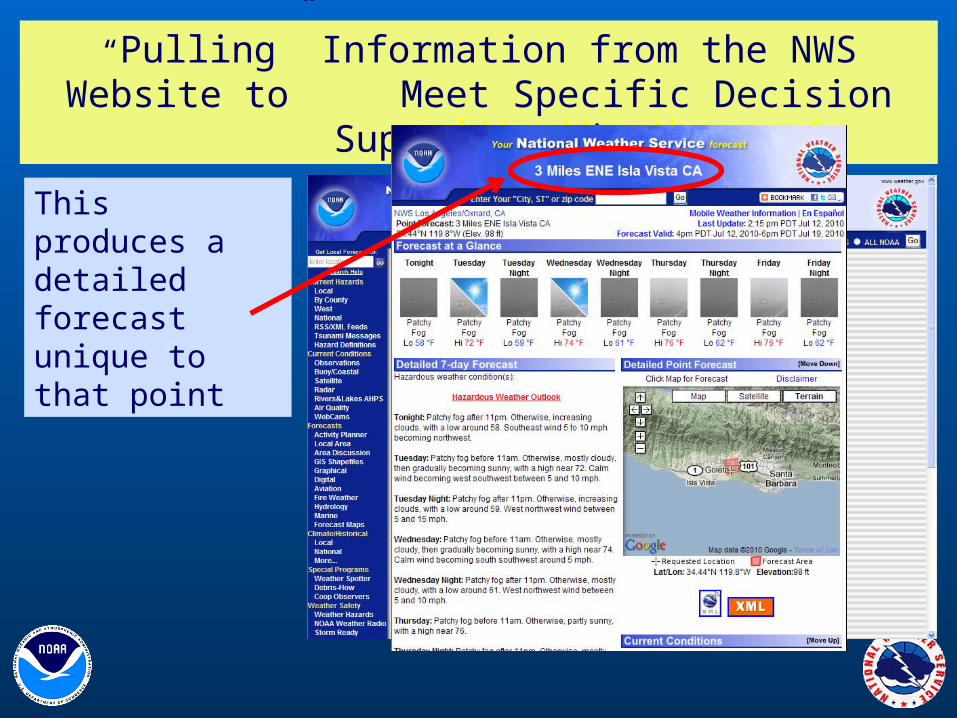
“Pulling” Information from the NWS Website to Meet Specific Decision Support Needs
http://weather.gov/losangeles
This produces a detailed forecast unique to that point
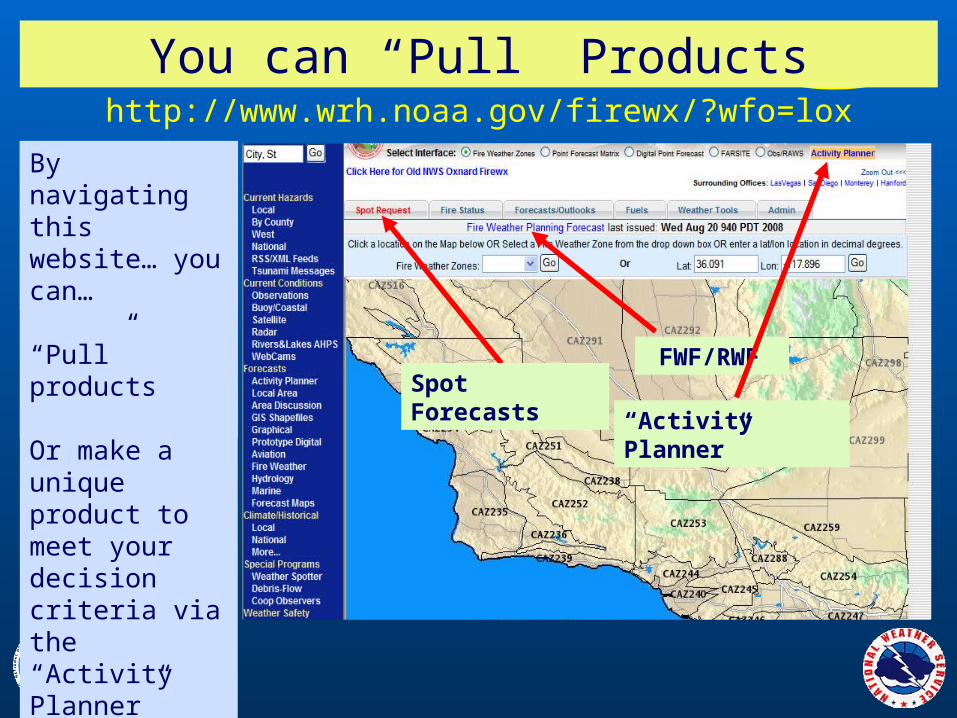
http://www.wrh.noaa.gov/firewx/?wfo=lox
You can “Pull” Products
By navigating this website… you can…
Spot Forecasts
FWF/RWF
By navigating this website… you can…
“Pull” products
By navigating this website… you can…
“Pull” products
Or make a unique product to meet your decision criteria via the “Activity Planner”
“Activity Planner”
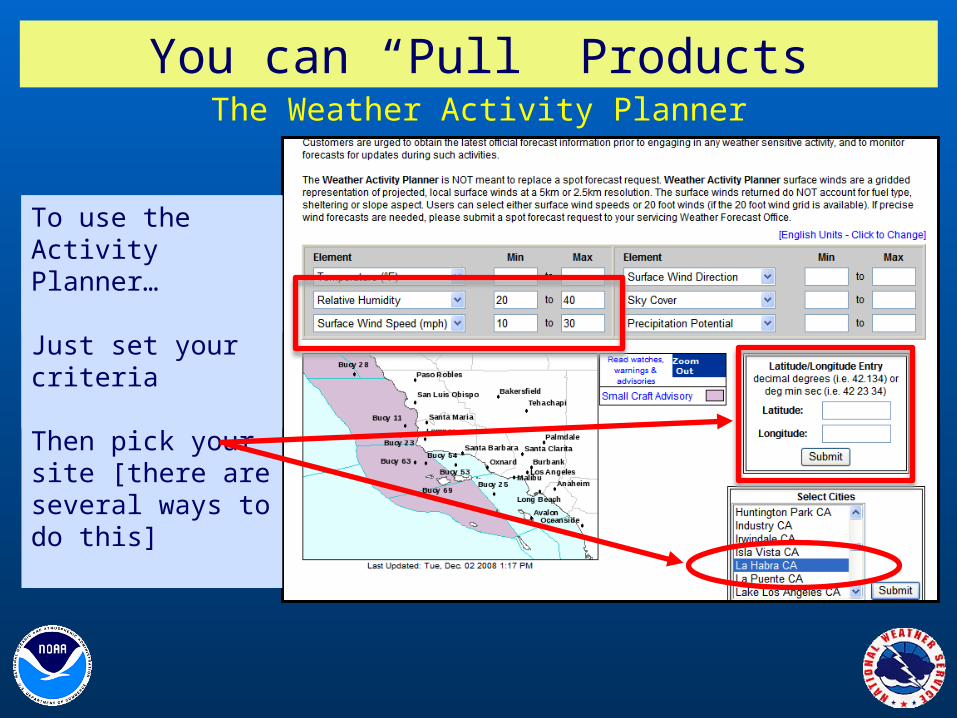
The Weather Activity Planner
You can “Pull” Products
To use the Activity Planner…To use the Activity Planner…
Just set your criteria
To use the Activity Planner…
Just set your criteria
Then pick your site [there are several ways to do this]
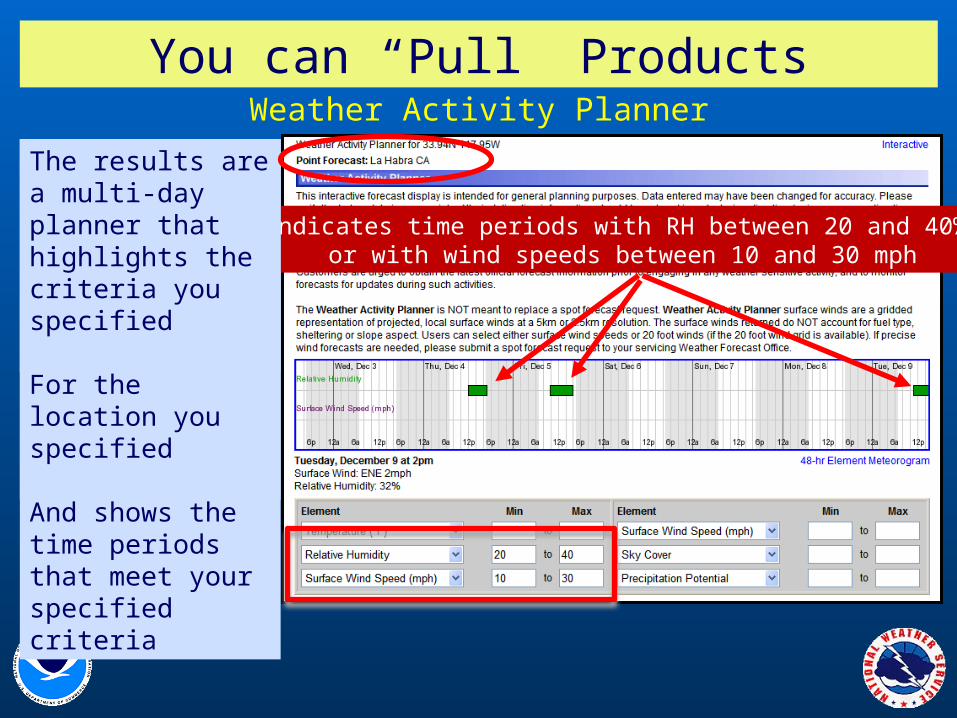
Weather Activity Planner
You can “Pull” Products
The results are a multi-day planner that highlights the criteria you specified
Indicates time periods with RH between 20 and 40% or with wind speeds between 10 and 30 mph
The results are a multi-day planner that highlights the criteria you specified
For the location you specified
The results are a multi-day planner that highlights the criteria you specified
For the location you specified
And shows the time periods that meet your specified criteria
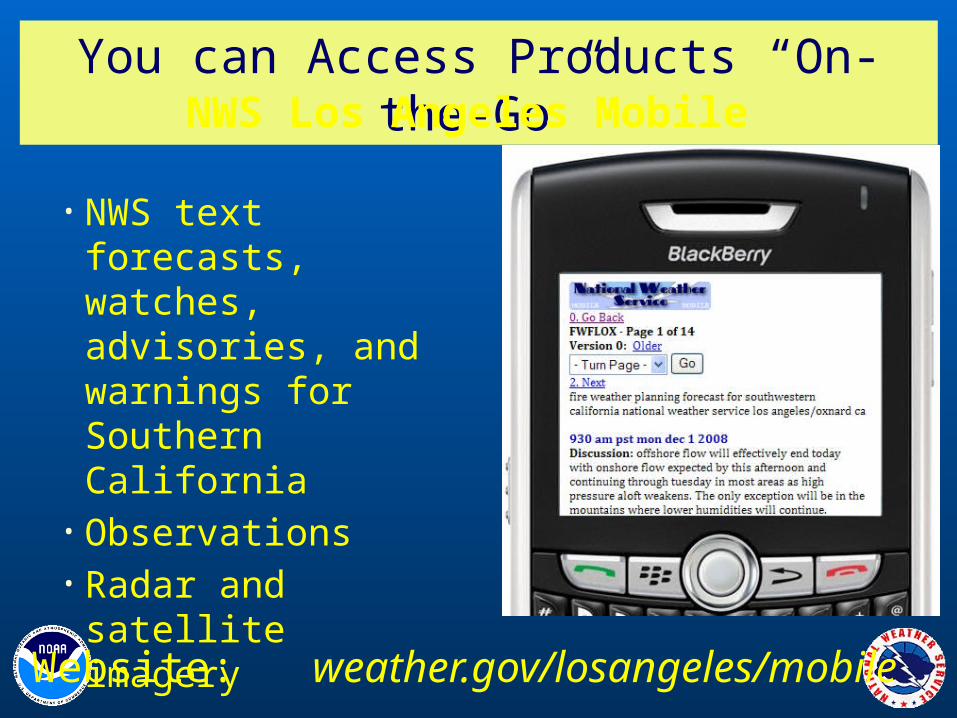
You can Access Products “On-the-Go”NWS Los Angeles Mobile
Website: weather.gov/losangeles/mobile
• NWS text forecasts, watches, advisories, and warnings for Southern California
• Observations• Radar and satellite
imagery
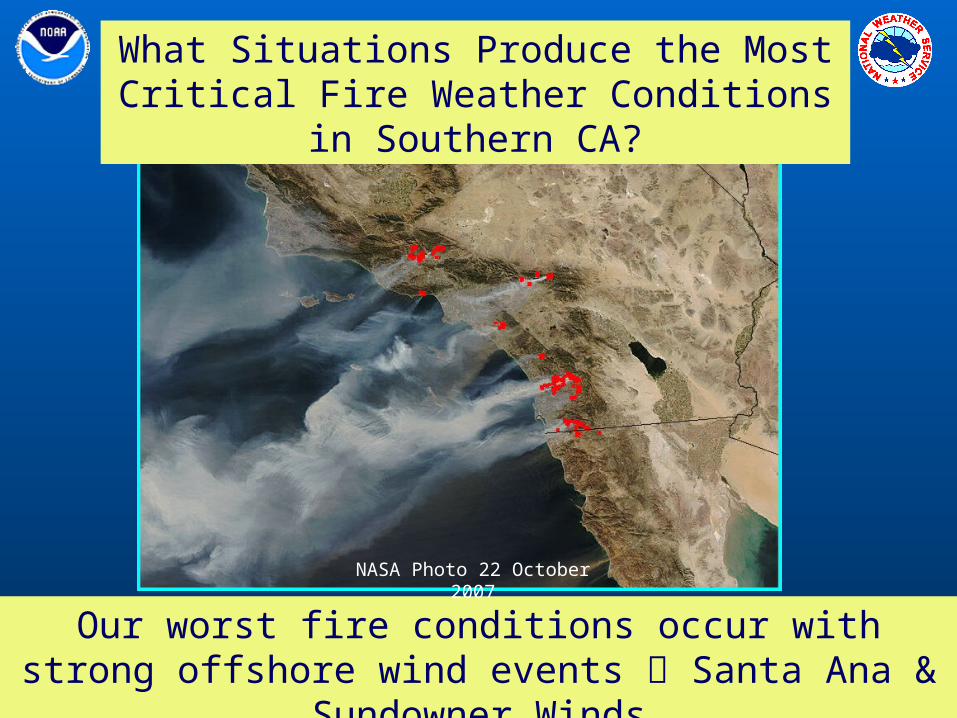
What Situations Produce the Most Critical Fire Weather Conditions in
Southern CA?
Our worst fire conditions occur with strong offshore wind events Santa Ana & Sundowner
Winds
NASA Photo 22 October 2007
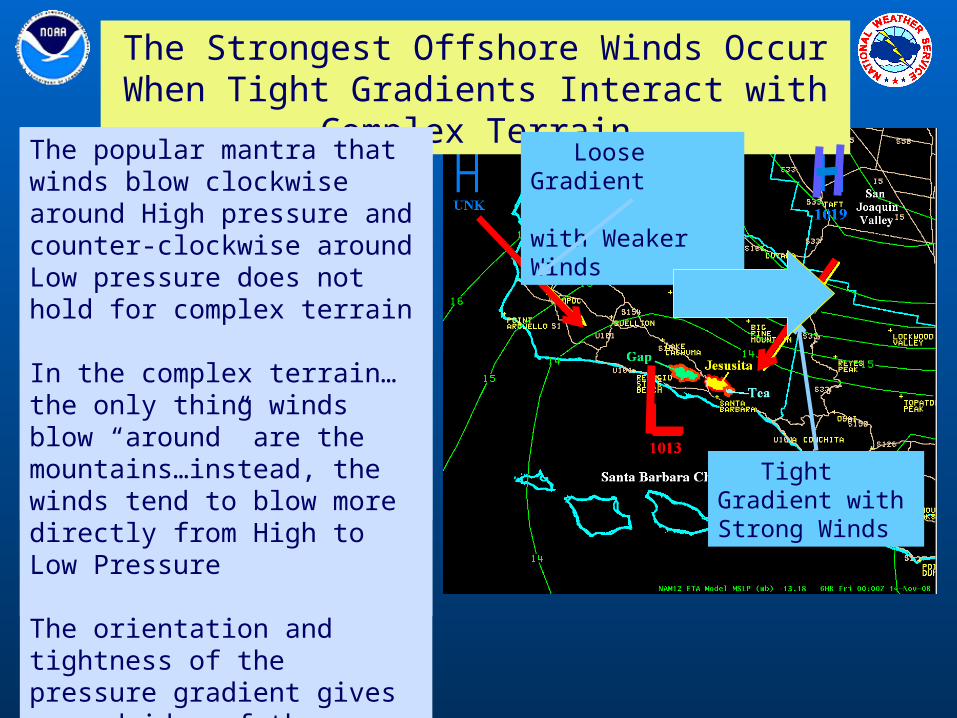
The Strongest Offshore Winds Occur When Tight Gradients Interact with
Complex TerrainThe popular mantra that winds blow clockwise around High pressure and counter-clockwise around Low pressure does not hold for complex terrain
Tight Gradient with Strong Winds
Loose Gradient with Weaker Winds
The popular mantra that winds blow clockwise around High pressure and counter-clockwise around Low pressure does not hold for complex terrain
In the complex terrain…the only thing winds blow “around” are the mountains
The popular mantra that winds blow clockwise around High pressure and counter-clockwise around Low pressure does not hold for complex terrain
In the complex terrain…the only thing winds blow “around” are the mountains…instead, the winds tend to blow more directly from High to Low Pressure
The popular mantra that winds blow clockwise around High pressure and counter-clockwise around Low pressure does not hold for complex terrain
In the complex terrain…the only thing winds blow “around” are the mountains…instead, the winds tend to blow more directly from High to Low Pressure
The orientation and tightness of the pressure gradient gives a good idea of the strength and direction of the low level winds
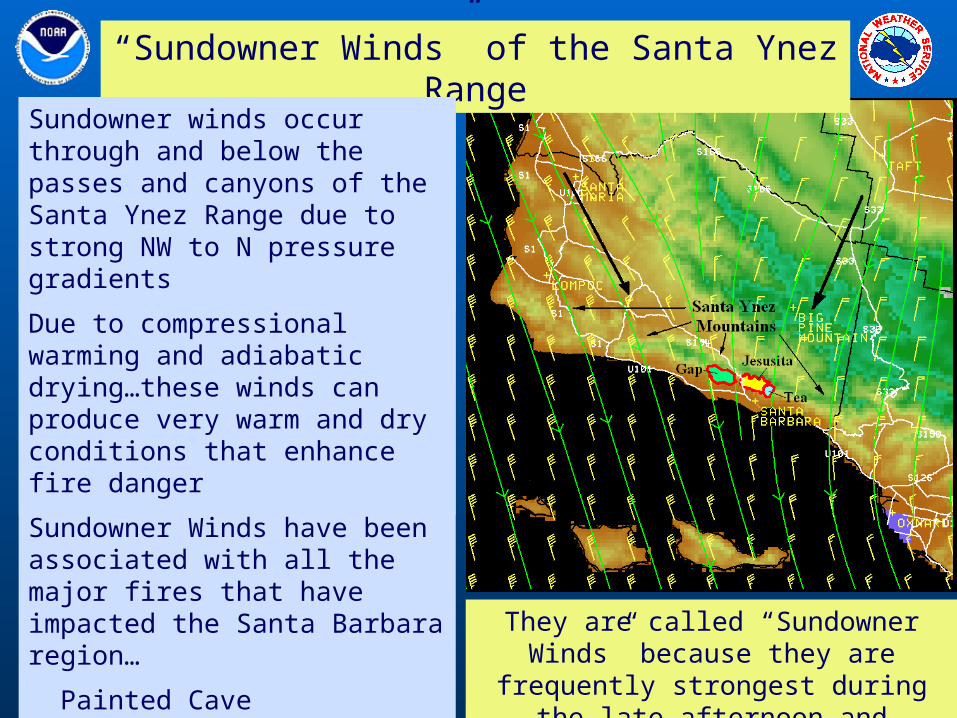
“Sundowner Winds” of the Santa Ynez Range
Sundowner winds occur through and below the passes and canyons of the Santa Ynez Range due to strong NW to N pressure gradients
Sundowner winds occur through and below the passes and canyons of the Santa Ynez Range due to strong NW to N pressure gradients
Due to compressional warming and adiabatic drying…these winds can produce very warm and dry conditions that enhance fire danger
Sundowner winds occur through and below the passes and canyons of the Santa Ynez Range due to strong NW to N pressure gradients
Due to compressional warming and adiabatic drying…these winds can produce very warm and dry conditions that enhance fire danger
Sundowner Winds have been associated with all the major fires that have impacted the Santa Barbara region…
Painted Cave Gap Jesusita and Tea Fires
They are called “Sundowner Winds” because they are
frequently strongest during the late afternoon and evening
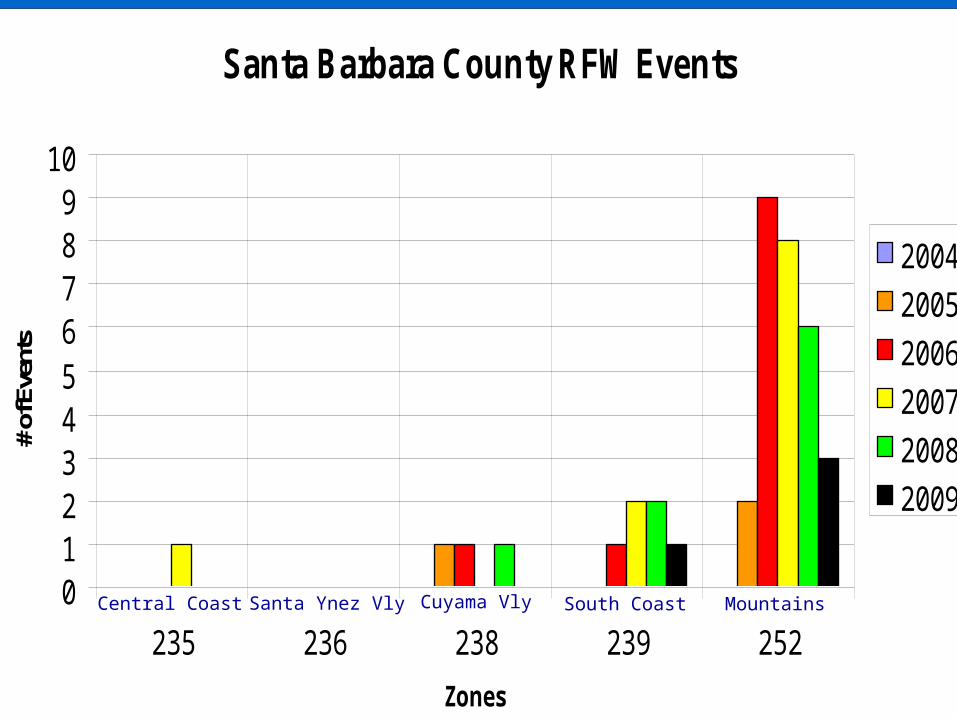
Santa Barbara County RFW Events
0123456789
10
235 236 238 239 252
Zones
# of
Eve
nts
2004
2005
2006
2007
2008
2009
South Coast MountainsCuyama VlySanta Ynez VlyCentral Coast
0
10
20
30
40
50
60
235 236 238 239 252
# of D
ays
Zones
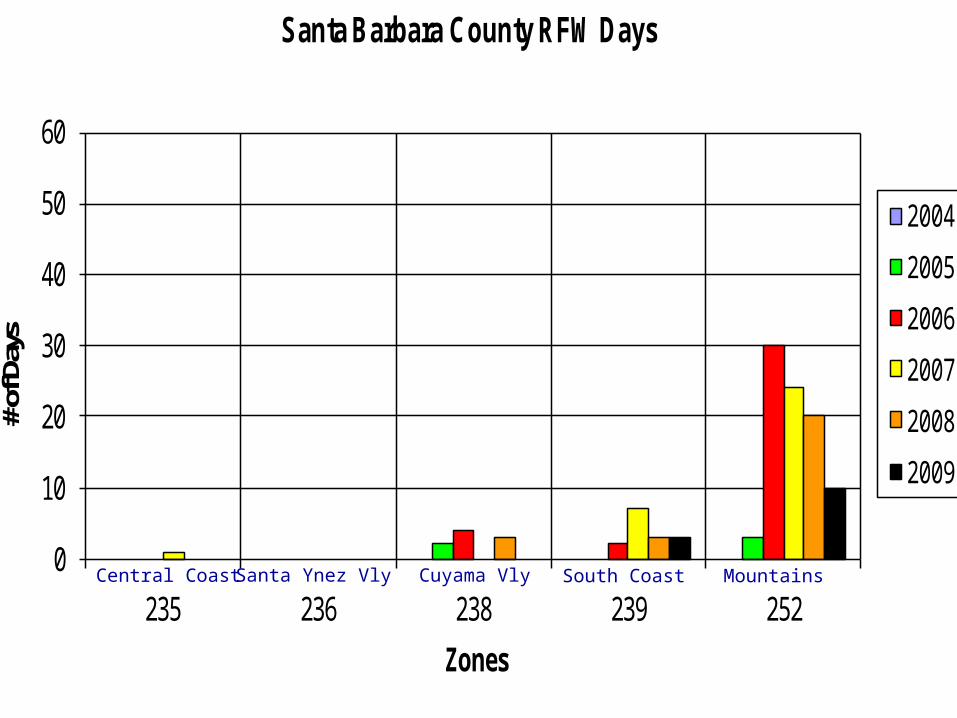
Santa Barbara County RFW Days
2004
2005
2006
2007
2008
2009
South Coast MountainsCuyama VlySanta Ynez VlyCentral Coast
11/13/08 12:00 AM 11/13/08 6:00 AM 11/13/08 12:00 PM 11/13/08 6:00 PM 11/14/08 12:00 AM0
10
20
30
40
50
60
70
80
90
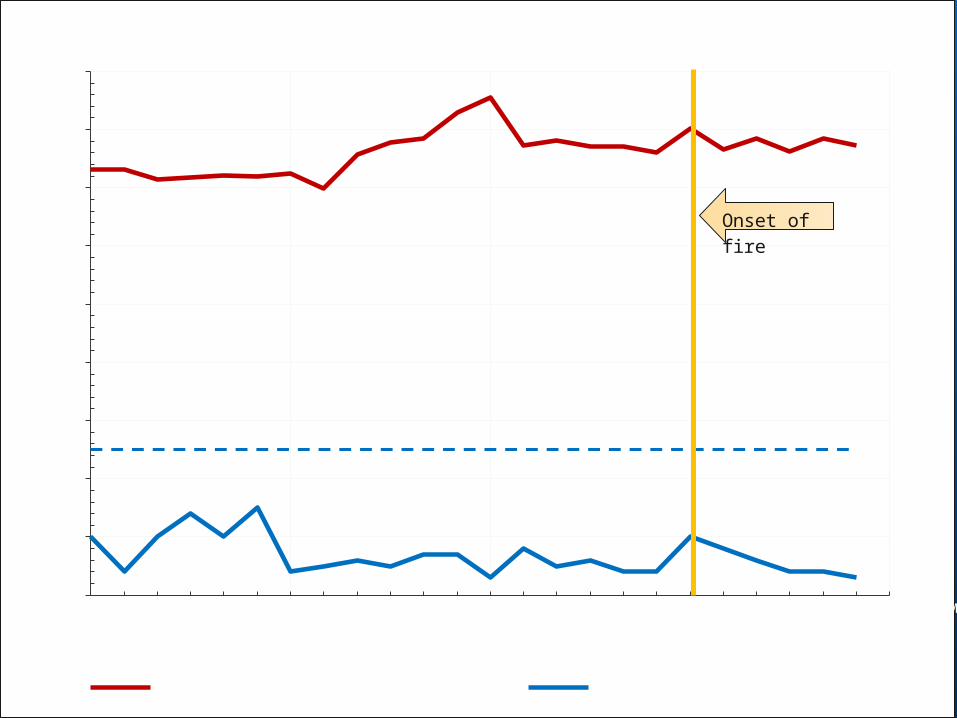
Tea Fire- November 13, 2008 Las Flores Canyon APCD
Temperature (° F) Sustained Wind Speed (mph) Sustained Wind Threshold (mph)
Date
Tem
pera
ture
(° F
) Su
stai
ned
Win
d Sp
eed
(mph
)
Onset of fire
11/13/08 12:00 AM 11/13/08 6:00 AM 11/13/08 12:00 PM 11/13/08 6:00 PM 11/14/08 12:00 AM0
10
20
30
40
50
60
70
80
90
100
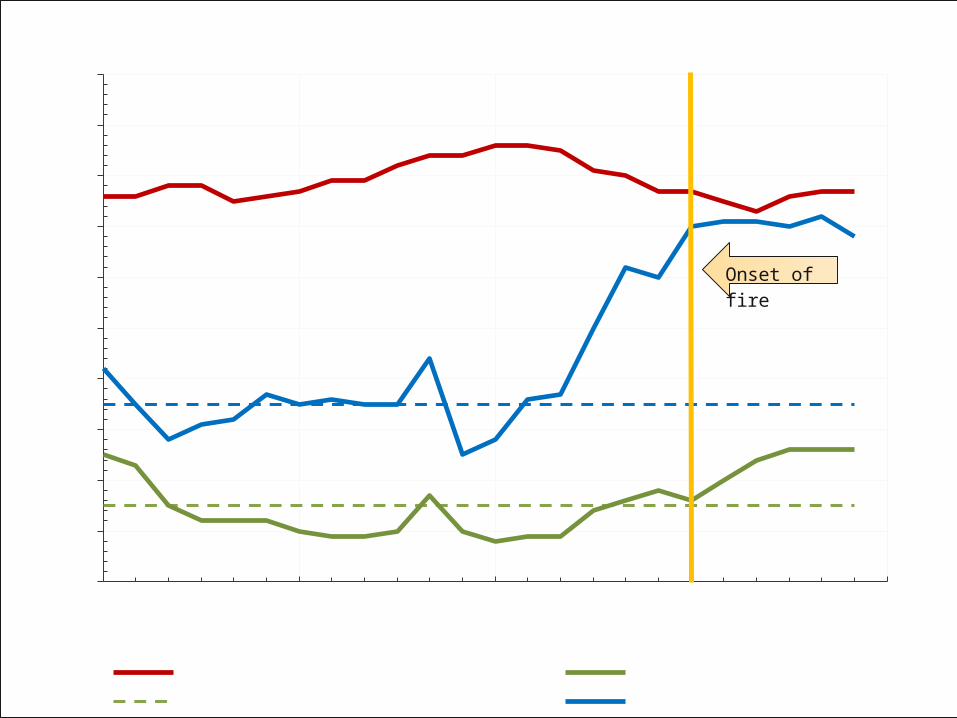
Tea Fire- November 13, 2008 Santa Barbara Airport ASOS
Temperature (° F) Relative Humidity (%) Critical RH Threshold (%)Sustained Wind Speed (mph) Sustained Wind Threshold (mph)
Date
Tem
pera
ture
(° F
) RH
(%) S
usta
ined
Win
d Sp
eed
(mph
)
Onset of fire
11/13/08 12:00 AM 11/13/08 6:00 AM 11/13/08 12:00 PM 11/13/08 6:00 PM 11/14/08 12:00 AM0
10
20
30
40
50
60
70
80
90
100
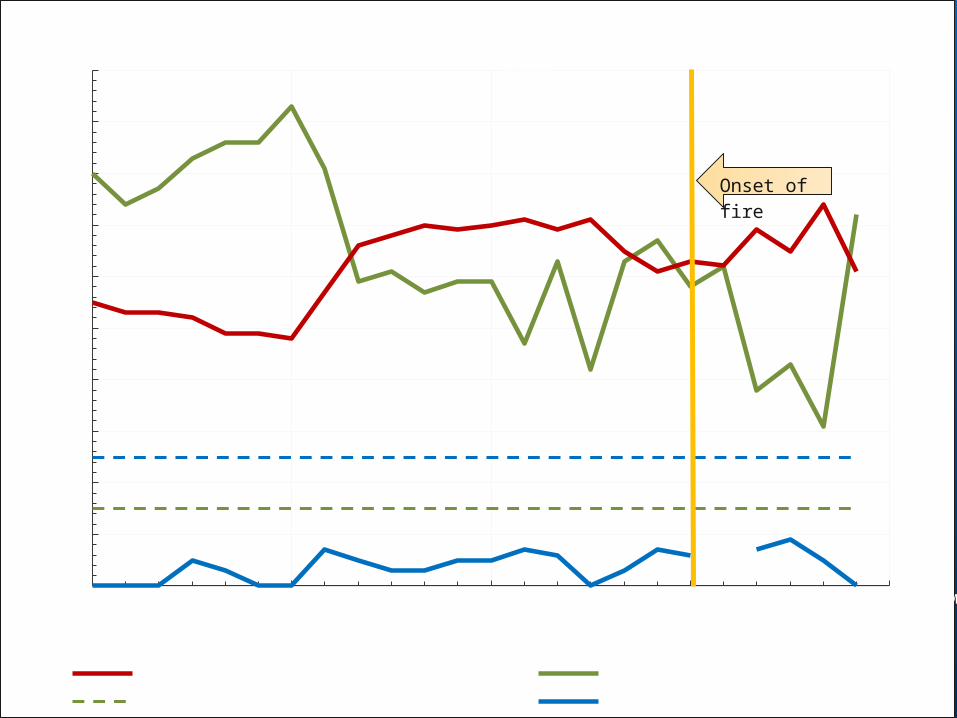
Tea Fire-November 13, 2008 Montecito Hills RAWS
Temperature (° F) Relative Humidity (%) Critical RH Threshold (%)Wind Gust (mph) Wind Gust Threshold (mph)
Date
Tem
pera
ture
(° F
) RH
(%) W
ind
Gus
t Sp
eed
(mph
)
Onset of fire
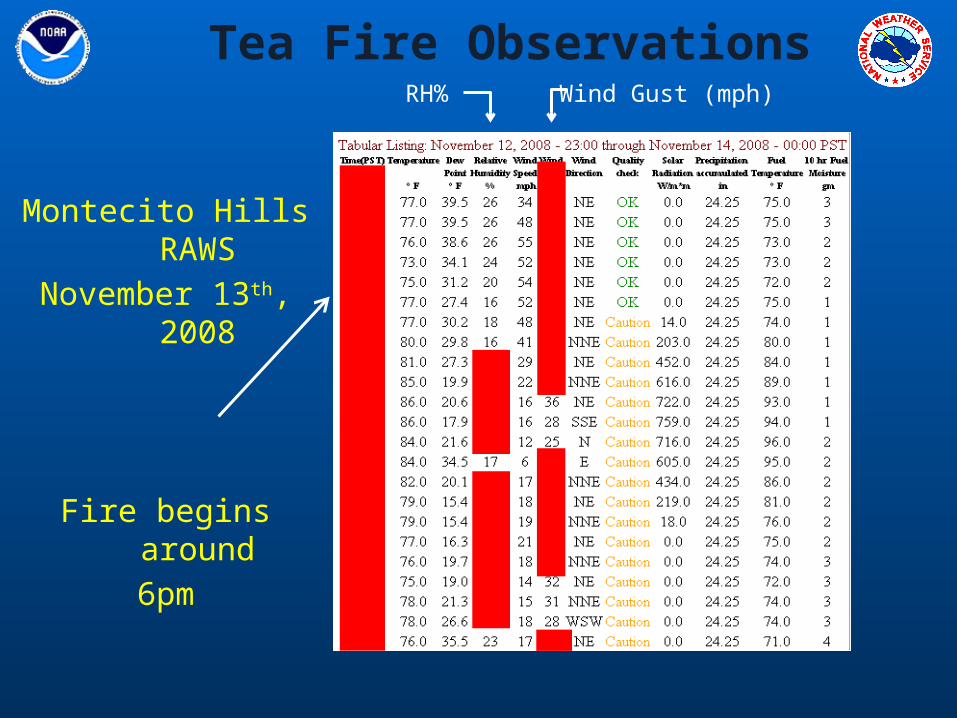
Tea Fire Observations
Montecito Hills RAWS
November 13th, 2008
Fire begins around6pm
RH% Wind Gust (mph)
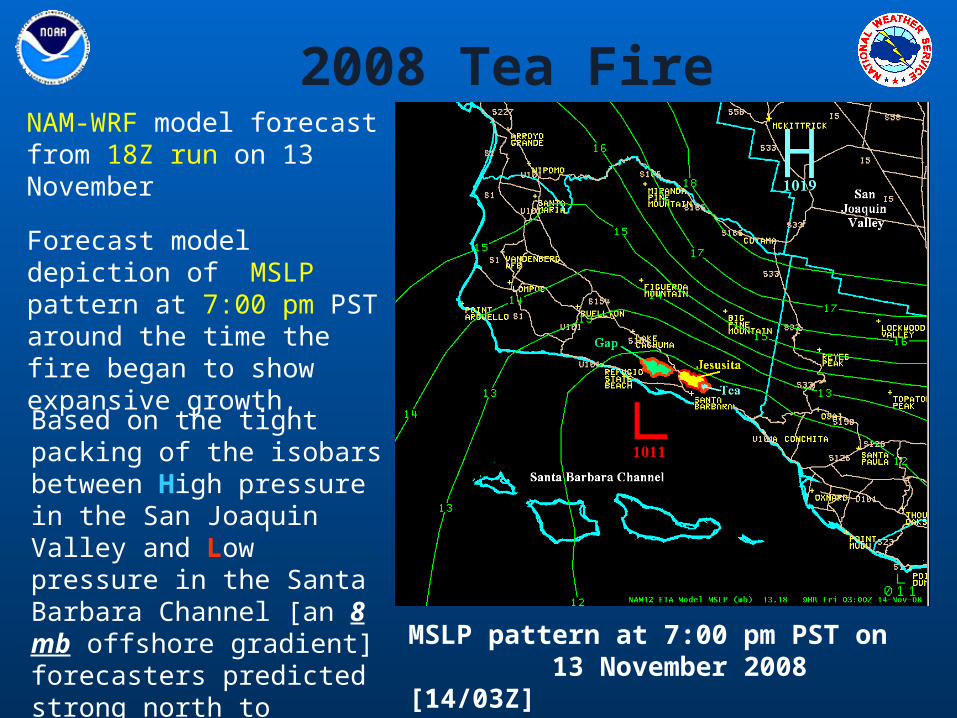
2008 Tea Fire
MSLP pattern at 7:00 pm PST on 13 November 2008 [14/03Z]
Based on the tight packing of the isobars between High pressure in the San Joaquin Valley and Low pressure in the Santa Barbara Channel [an 8 mb offshore gradient] forecasters predicted strong north to northeast winds over the Tea Fire.
Forecast model depiction of MSLP pattern at 7:00 pm PST around the time the fire began to show expansive growth.
NAM-WRF model forecast from 18Z run on 13 November
2008 Tea Fire
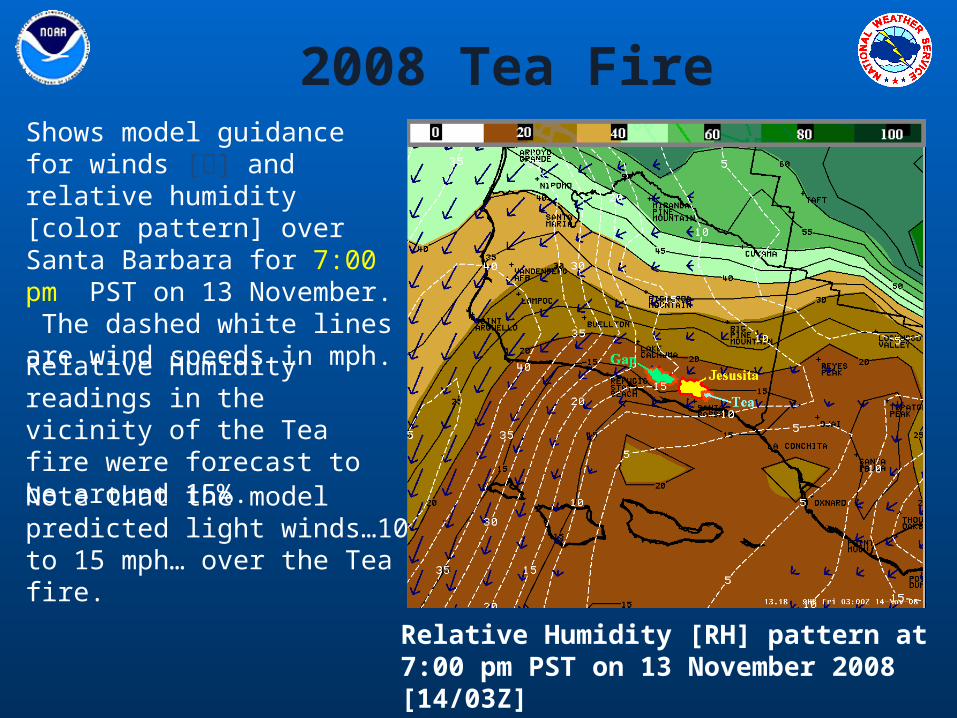
Relative Humidity readings in the vicinity of the Tea fire were forecast to be around 15%.
Shows model guidance for winds [] and relative humidity [color pattern] over Santa Barbara for 7:00 pm PST on 13 November. The dashed white lines are wind speeds in mph.
Relative Humidity [RH] pattern at 7:00 pm PST on 13 November 2008 [14/03Z]
Note that the model predicted light winds…10 to 15 mph… over the Tea fire.
2008 Tea Fire
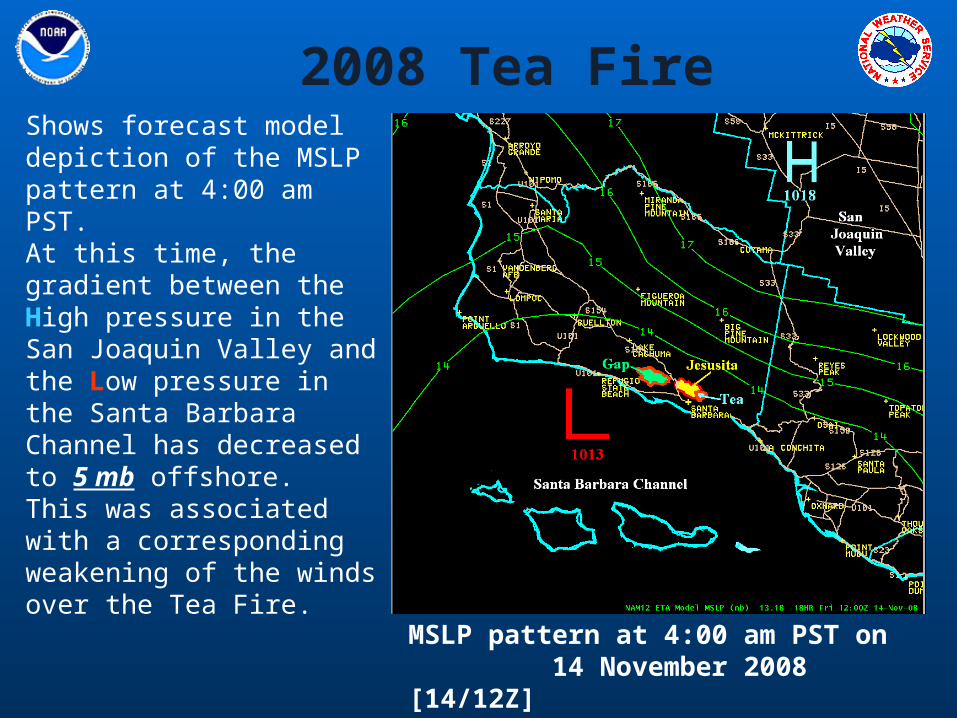
MSLP pattern at 4:00 am PST on 14 November 2008 [14/12Z]
At this time, the gradient between the High pressure in the San Joaquin Valley and the Low pressure in the Santa Barbara Channel has decreased to 5 mb offshore. This was associated with a corresponding weakening of the winds over the Tea Fire.
Shows forecast model depiction of the MSLP pattern at 4:00 am PST.
2008 Tea Fire
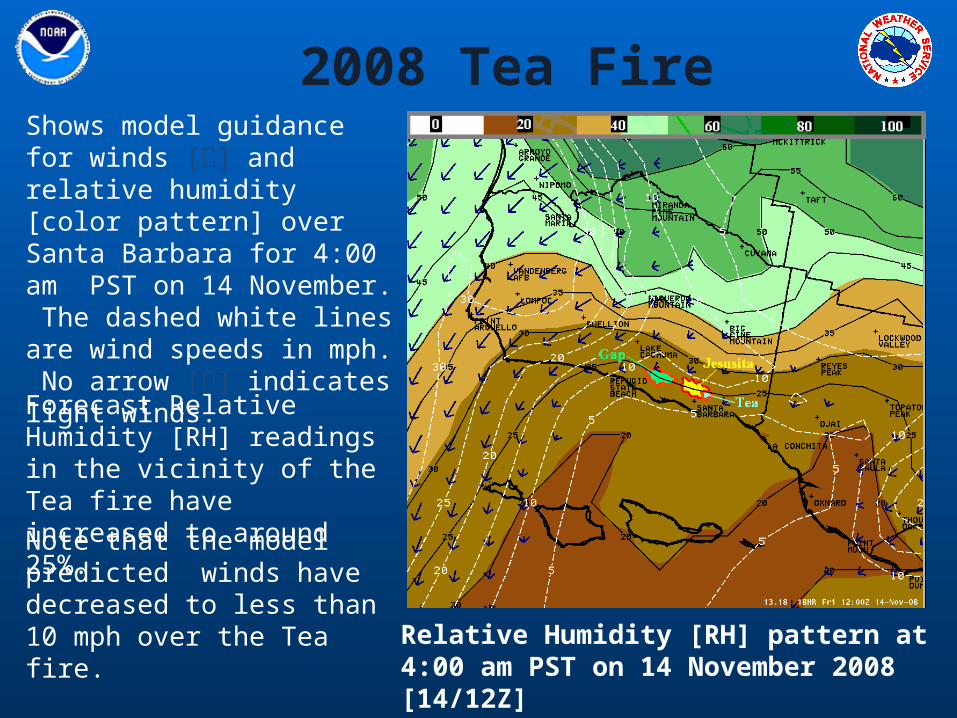
Forecast Relative Humidity [RH] readings in the vicinity of the Tea fire have increased to around 25%.
Shows model guidance for winds [] and relative humidity [color pattern] over Santa Barbara for 4:00 am PST on 14 November. The dashed white lines are wind speeds in mph. No arrow [] indicates light winds.
Relative Humidity [RH] pattern at 4:00 am PST on 14 November 2008 [14/12Z]
Note that the model predicted winds have decreased to less than 10 mph over the Tea fire.
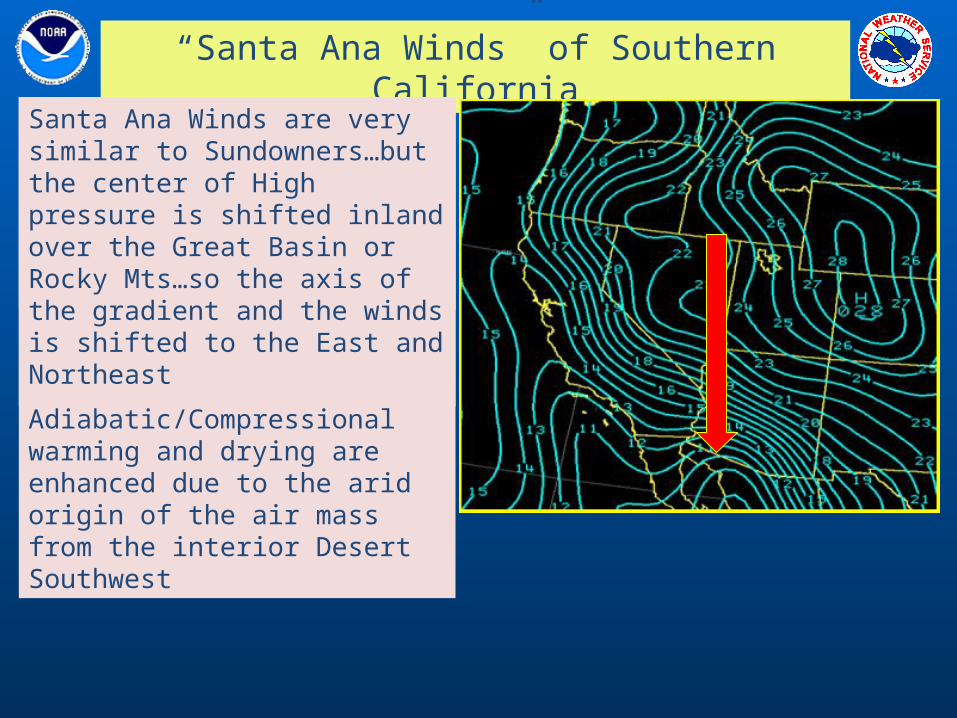
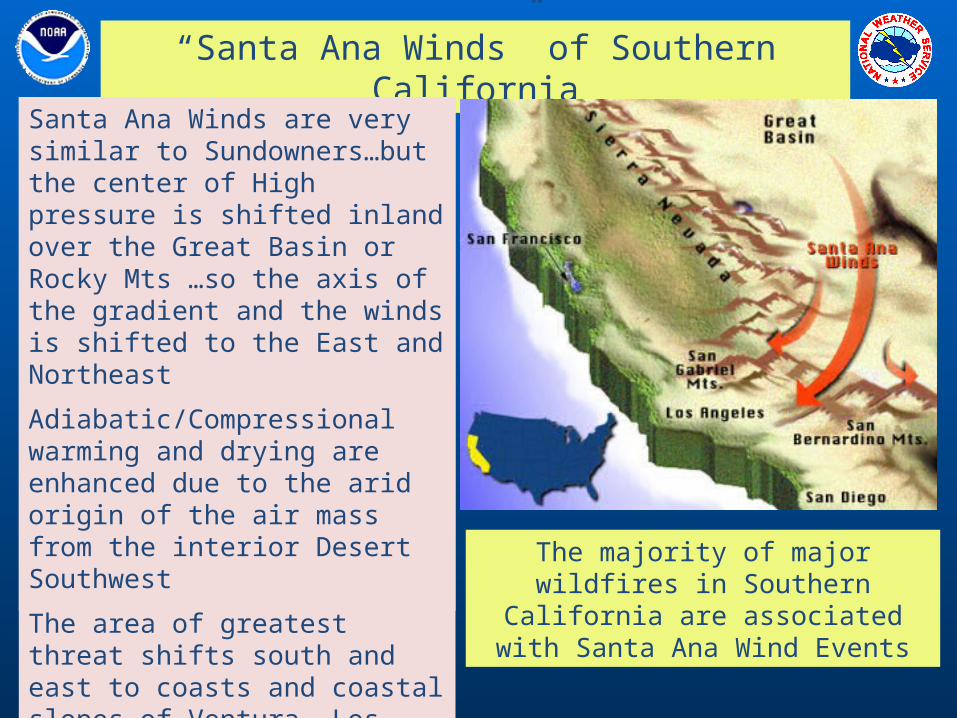
“Santa Ana Winds” of Southern California
Santa Ana Winds are very similar to Sundowners…but the center of High pressure is shifted inland over the Great Basin or Rocky Mts
Santa Ana Winds are very similar to Sundowners…but the center of High pressure is shifted inland over the Great Basin or Rocky Mts…so the axis of the gradient and the winds is shifted to the East and Northeast
Santa Ana Winds are very similar to Sundowners…but the center of High pressure is shifted inland over the Great Basin or Rocky Mts…so the axis of the gradient and the winds is shifted to the East and Northeast
Adiabatic/Compressional warming and drying are enhanced due to the arid origin of the air mass from the interior Desert Southwest
“Santa Ana Winds” of Southern California
The majority of major wildfires in Southern California are
associated with Santa Ana Wind Events
Santa Ana Winds are very similar to Sundowners…but the center of High pressure is shifted inland over the Great Basin or Rocky Mts …so the axis of the gradient and the winds is shifted to the East and Northeast
Adiabatic/Compressional warming and drying are enhanced due to the arid origin of the air mass from the interior Desert Southwest
The area of greatest threat shifts south and east to coasts and coastal slopes of Ventura, Los Angeles, and Orange Counties as well as the Inland Empire
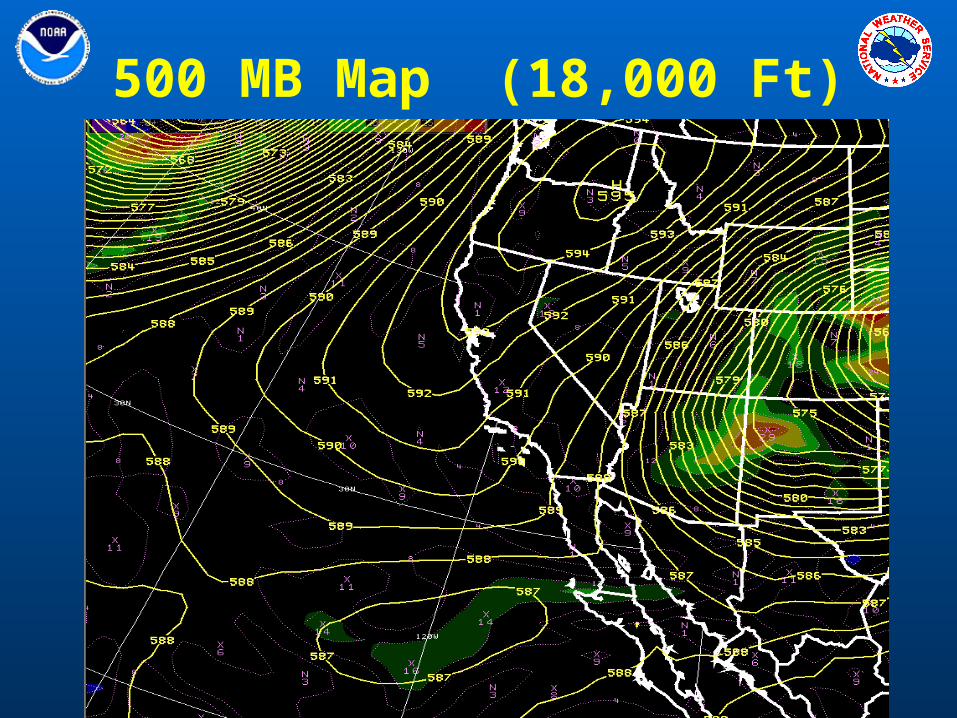
500 MB Map (18,000 Ft)
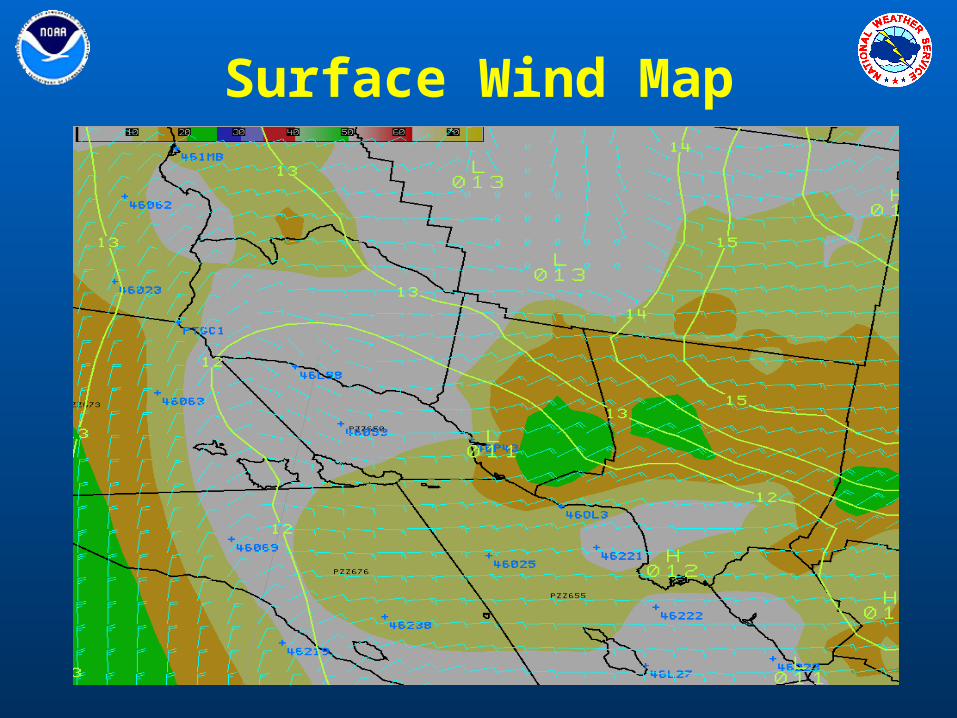
Surface Wind Map
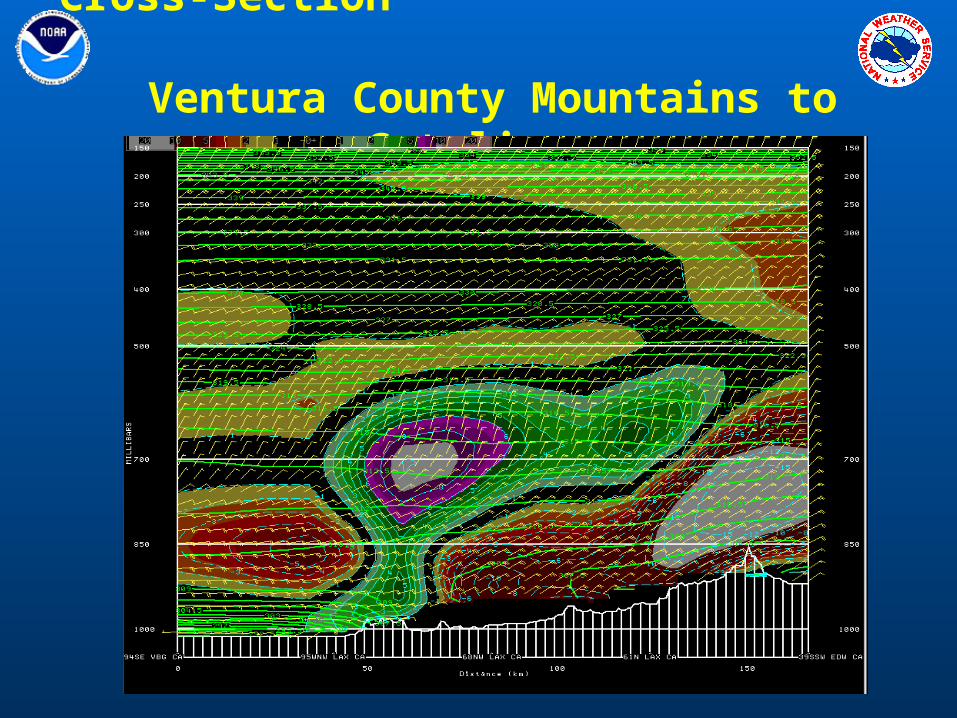
Cross-Section Ventura County Mountains to
Catalina
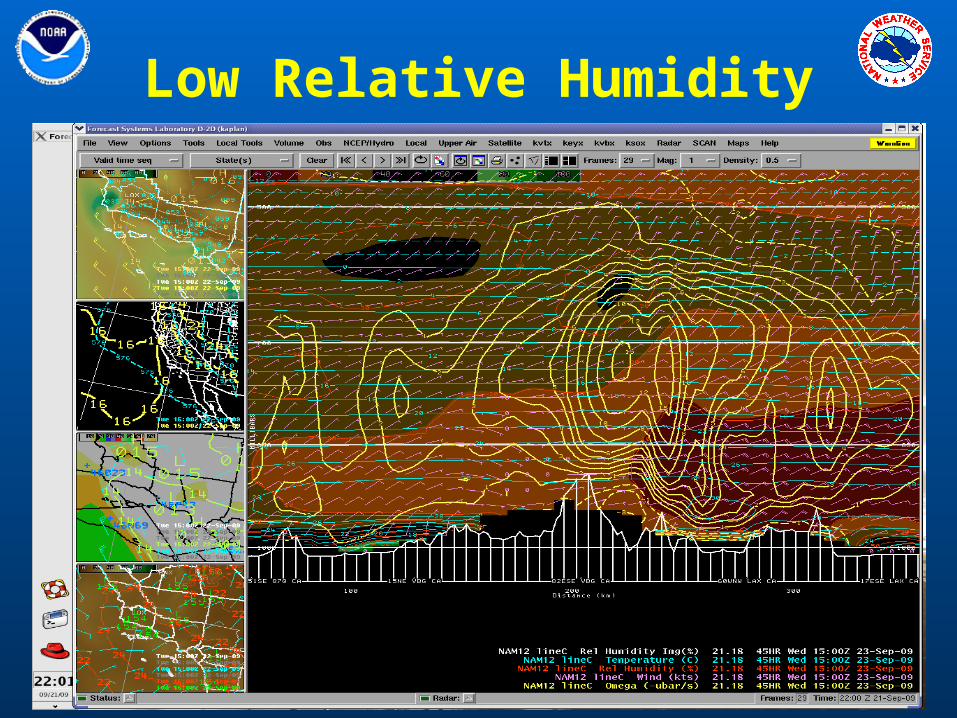
Low Relative Humidity
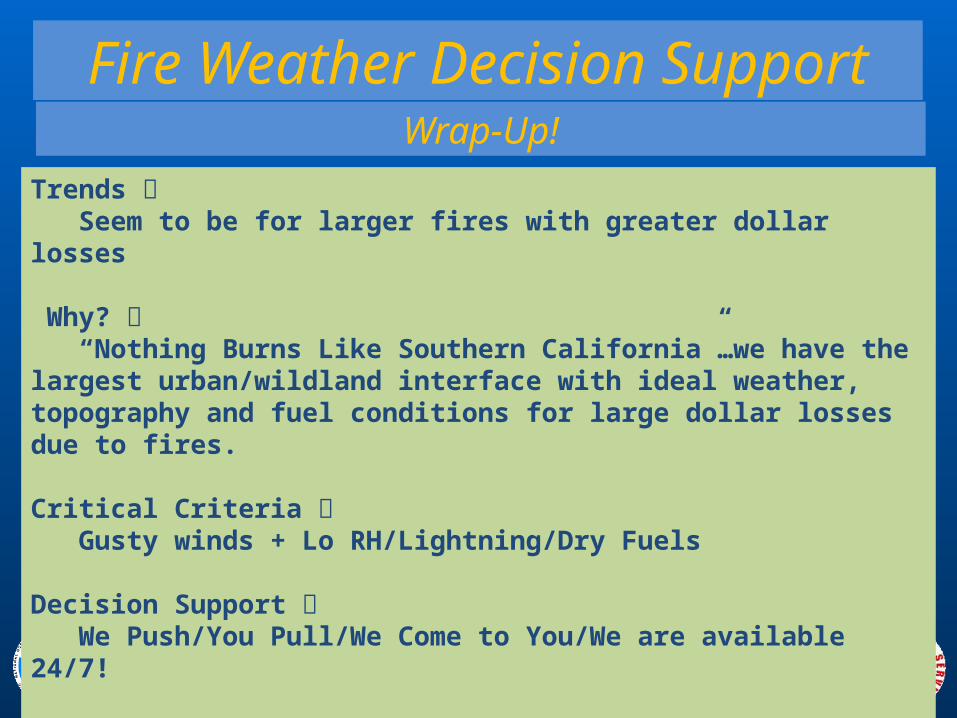
Trends Seem to be for larger fires with greater dollar losses
Why? “Nothing Burns Like Southern California”…we have
the largest urban/wildland interface with ideal weather, topography and fuel conditions for large dollar losses due to fires.
Critical Criteria Gusty winds + Lo RH/Lightning/Dry Fuels
Decision Support We Push/You Pull/We Come to You/We are available
24/7!
Fire Weather Decision SupportWrap-Up!