Embed Size (px)
Citation preview
New models for estimating the carbon sink capacity of Spanish
softwood species
R. Ruiz-Peinado1,2*, M. del Rio1,2 and G. Montero1,2
1 Departamento de Selvicultura y Gestión de Sistemas Forestales. CIFOR-INIA.
Ctra. A Coruña, km 7,5. 28040 Madrid. Spain2 Instituto Universitario de Investigación en Gestión Forestal Sostenible. Universidad de Valladolid-INIA
Abstract
Quantifying the carbon balance in forests is one of the main challenges in forest management. Forest carbon stocksare usually estimated indirectly through biomass equations applied to forest inventories, frequently considering differenttree biomass components. The aim of this study is to develop systems of equations for predicting tree biomasscomponents for the main forest softwood species in Spain: Abies alba Mill., A. pinsapo Boiss., Juniperus thurifera
L., Pinus canariensis Sweet ex Spreng., P. halepensis Mill., P. nigra Arn., P. pinaster Ait., P. pinea L., P. sylvestris L.,P. uncinata Mill. For each species, a system of additive biomass models was fitted using seemingly unrelated regression.Diameter at the breast height and total height were used as independent variables. Diameter appears in all componentmodels, while tree height was included in the stem component model of all species and in some branch componentequations. Total height was included in order to improve biomass estimations at different sites. These biomass modelswere compared to previously available equations in order to test their accuracy and it was found that they yielded betterfitting statistics in all cases. Moreover, the models fulfil the additivity property.
We also developed root:shoot ratios in order to determine the partitioning into aboveground and belowgroundbiomass. A number of differences were found between species, with a minimum of 0.183 for A. alba and a maximumof 0.385 for P. uncinata. The mean value for the softwood species studied was 0.265.
Since the Spanish National Forest Inventory (NFI) records species, tree diameter and height of sample trees, thesebiomass models and ratios can be used to accurately estimate carbon stocks from NFI data.
Key words: aboveground biomass; belowground biomass; carbon sequestration; root:shoot ratio; softwood species.
Resumen
Nuevos modelos para estimar la capacidad de fijación de carbono de las coníferas españolas
Conocer el balance de carbono en los bosques es uno de los principales retos dentro de la gestión forestal. Habi-tualmente, la estimación de carbono en los bosques se realiza de manera indirecta, mediante la aplicación de mode-los de diferentes fracciones de biomasa a los datos de inventario forestal. Para ello, en este estudio se han desarrolla-do sistemas de ecuaciones para estimar la biomasa forestal de las principales coníferas de los bosques de España:Abies alba Mill., A. pinsapo Boiss., Juniperus thurifera L., Pinus canariensis Sweet ex Spreng., P. halepensis Mill.,P. nigra Arn., P. pinaster Ait., P. pinea L., P. sylvestris L., P. uncinata Mill. Se ha usado la metodología de mínimoscuadrados generalizados conjuntos, para el cumplimiento de la aditividad entre componentes. Como variables inde-pendientes se utilizaron el diámetro normal y la altura total del árbol. El diámetro aparece en todas las ecuaciones co-mo variable significativa, mientras que la altura aparece también en todos los modelos para la biomasa de fuste y enalgunos modelos para las ramas. Con la inclusión de la altura total se mejoran las estimaciones de los modelos en di-ferentes sitios. Los modelos ajustados fueron comparados con otras ecuaciones publicadas para comprobar la preci-sión, presentando mejores estadísticos en todos los casos. Mediante el uso de esta metodología, las ecuaciones cum-plen la propiedad aditiva.
Además, se han desarrollado relaciones específ icas entre la parte radical y parte aérea, para conocer como serealiza el reparto de biomasa. Se han encontrado diferencias entre especies, alcanzándose un mínimo de 0,183 pa-ra A. alba y un máximo de 0,385 para P. uncinata, siendo el valor medio para estas especies de coníferas estudia-das de 0,265.
* Corresponding author: [email protected]
Received: 09-11-10; Accepted: 14-02-11.
Instituto Nacional de Investigación y Tecnología Agraria y Alimentaria (INIA) Forest Systems 2011 20(1), 176-188
Available online at www.inia.es/forestsystems ISSN: 1131-7965
eISSN: 2171-9845
Introduction
Southern European forests are characterised by a
distinctive set of features. They support high levels of
biological diversity (both plant and animal) as a result
of the survival of many species in southern European
refuges during the glacial periods. Furthermore, they
have a harsh, unpredictable climate, diff icult socio-
economic conditions and have suffered a long history
of over-exploitation accompanied by landscape trans-
formations since ancient times. In these forests, the
non-marketable products and services they provide are
usually more valuable than their direct yields, espe-
cially timber production (Scarascia-Mugnozza et al.,
2000). Soil and watershed protection, biodiversity,
scenic beauty and, increasingly, recreational use, are
the main functions covered by these stands, to which
carbon sequestration has recently been added in accor-
dance with international agreements on climatic change
mitigation (Kyoto Protocol, UNFCCC, EU Forestry
Strategy, Ministerial Conference on the Protection of
Forests in Europe).
Hence, in the context of this function as mitigators
of the effects of climate change, it is important to esti-
mate the quantity of biomass present in forests, to
understand the way in which the biomass accumulates
and how it is distributed among the different fractions
of the tree. This information will provide a basis for
further nutrient studies and facilitate research on the
use of biomass in energy production (Schlamadinger
and Marland, 1996; Clark et al., 2001). The use of forest
inventories as a data source allows us to estimate the
quantity of carbon fixed in living vegetation. However,
depending on the quality and the amount of informa-
tion provided by the forest inventory, the accuracy of
these estimations will vary. National Forest Inventories
have provided the basis for several regional and natio-
nal-level carbon budgets (Dixon et al., 1994; Goodale
et al., 2002).
Indirect approaches such as biomass expansion factors
(BEF’s) or biomass equations applied to forest inventory
data (Brown, 2002) are usually used to quantify carbon
sequestration in forests. BEF’s convert stem volume
or stand volume directly into biomass weight estimates,
although they vary depending on growth conditions and
stand development, particularly on stand age (Lehtonen
et al., 2004, 2007), stand timber volume (Fang et al.,
2001) or tree height (Levy et al., 2004). Therefore,
more complex biomass models can provide more accu-
rate estimations than BEF’s, hence, are more commonly
used to obtain forest biomass estimations (IPCC, 2003).
Biomass models are built using destructive, highly costly
sampling procedures and relate the dry weight of bio-
mass to dendrometric characteristics; in most cases,
the diameter at breast height (d) and/or the total height
(h) of the tree (Crow and Laidly, 1980; Pardé, 1980).
Softwood species play an important role in the Me-
diterranean Basin forests due to their widespread
distribution and their ecological and socio-economic
value. The most important softwood species in Spain
include: Abies alba Mill. (silver fir), A. pinsapo Boiss.
(pinsapo fir), Juniperus thurifera L. (Spanish juniper),
Pinus canariensis Sweet ex Spreng. (Canary Islands
pine), P. halepensis Mill. (Aleppo pine), P. nigra Arn.
(black pine), P. pinaster Ait. (maritime pine), P. pinea
L. (stone pine), P. sylvestris L. (Scots pine) and P. unci-
nata Mill. (mountain pine). These softwood species
occupy more than 9.9 million ha in Spain, of which 6.4
million are pure forests (MARM, 2008).
The information available for estimating forest
biomass varies from one species to another. A number
of studies have dealt with biomass estimation in
P. sylvestris and P. pinaster, although much of this
relates to Northern Europe in the case of the former
(Marklund, 1988; Lehtonen et al., 2004; Muukkonen,
2007) or to the Atlantic range of the species in the case
of Pinus pinaster (Lemoine et al., 1986; Montero et
al., 1999; Porte et al., 2002; Balboa-Murias et al.,
2006). However, less research has been undertaken
with regard to P. nigra (Neirynck et al., 1998; Fattorini
et al., 2004), P. pinea (Cabanettes and Rapp, 1978;
Correia et al., 2010) or P. halepensis (Grunzweig et
al., 2007). J. thurifera was studied in Morocco for
biomass production using non-destructive methods due
to its ecological importance (Montes et al., 2000, 2002).
As far as the other softwood species are concerned
(A. alba, A. pinsapo, P. canariensis and P. uncinata),
biomass production has not been studied in any depth
Biomass models for the main softwood species in Spain 177
Como el Inventario Forestal Nacional (IFN) identifica para todas las especies medidas el diámetro normal y la al-tura total de todos los árboles inventariados, estos modelos y relaciones ajustadas pueden ser aplicados con precisiónen la estimación de cantidades de carbono a partir de aquellos datos.
Palabras clave: biomasa aérea; biomasa radical; fijación de carbono; relación parte aérea y parte radical; coníferas.
due to their limited distribution, so scarce information
exists in this regard. Recently, Montero et al. (2005)
fitted a set of biomass models for the main forest spe-
cies in Spain (including those mentioned above), which
allow us to quantify the biomass and carbon seques-
tration in forest ecosystems. These allometric biomass
equations relate different tree biomass components
(stem, different size branches, foliage, total above-
ground biomass and root system) to tree diameter,
although additivity among the component equations
was not considered and each component was indepen-
dently fitted.
Although allometric equations based on dbh provide
one of the easiest and most accurate ways to estimate
root biomass from forest measurements (Drexhage and
Colin, 2001; Le Goff and Ottorini, 2001), it can be useful
to determine the root:shoot partitioning of biomass for
the purposes of ecological studies or carbon accoun-
ting. These ratios can be applied to individual plants
or stands at local, regional or landscape level (Mokany
et al., 2006). Moreover, National Greenhouse Gas In-
ventories under the IPCC, generally employ root:shoot
ratios to estimate root biomass and specific values are
often unavailable.
In order to improve the existing biomass estimations
and to offer more precise information on carbon accu-
mulation in Spanish forests, new biomass equations
for conifer species have been developed in this study.
The use of methods that guarantee the additivity pro-
perty among tree biomass components provides consis-
tency between total tree and tree component biomass
and also ensures greater statistical efficiency (Parresol,
1999, 2001). Furthermore, the inclusion of tree height
in biomass equations as an additional predictor varia-
ble, could improve the accuracy of the biomass estima-
tions (Ketterings et al., 2001). The objectives of this
study were: i) to determine the extent to which the use
of additive methods and the inclusion of tree height as
an independent variable improve biomass estimations
in the studied species; and ii) to analyse the root:shoot
partitioning of biomass for the main softwood species
in Spain.
Material and methods
Study area
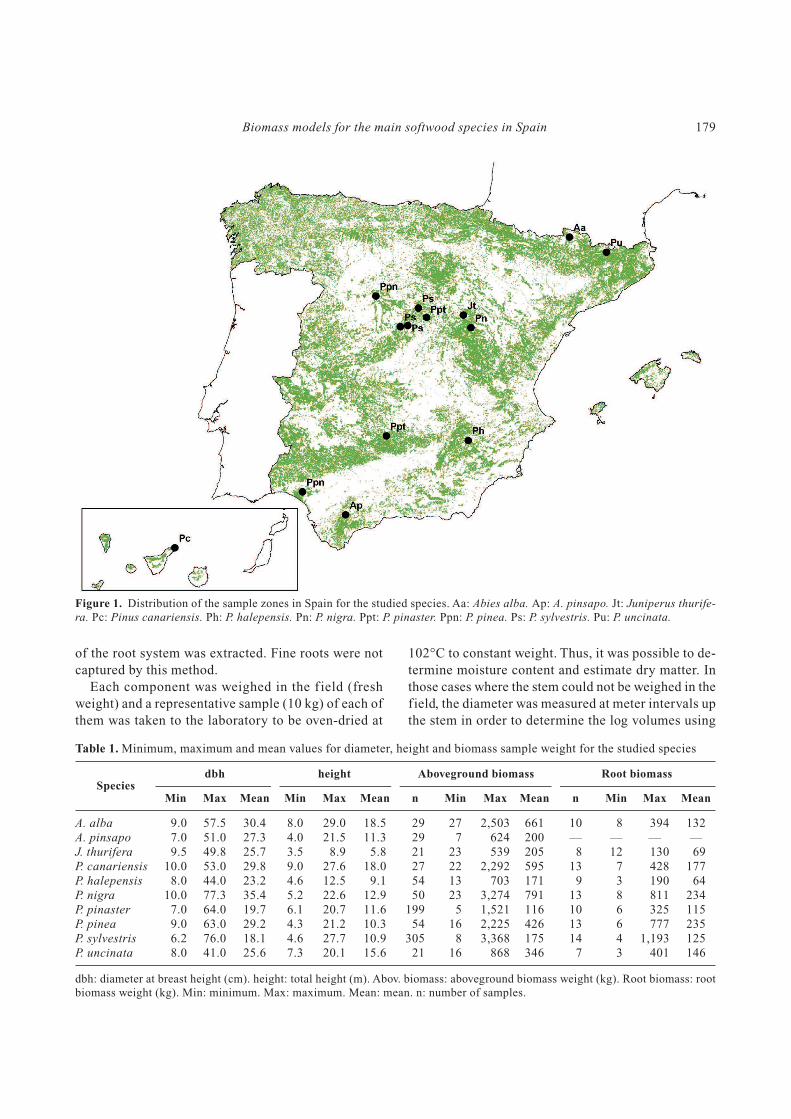
Individual tree biomass data were collected in repre-
sentative regions across the natural range of the studied
species in Spain. Data for Abies alba were collected
in the Pyrenean Mountain Range; for A. pinsapo in the
Sierra de Grazalema and Sierra de las Nieves (Southern
Spain); for Juniperus thurifera in Guadalajara (Central
Spain); Pinus canariensis on the island of Tenerife
(Canary Islands); P. halepensis was sampled in the
Segura Mountain Range (South East Spain); P. nigra
in the Iberian Mountain Range; P. pinaster in the
Central Mountain Range (Guadalajara, Central Spain)
and the Sierra Morena Mountain Range (Ciudad Real,
Southern Spain); P. pinea in the Northern Plateau (Cen-
tral Spain) and Huelva (South-West Spain); P. sylves-
tris in the Central Range (Madrid and Segovia, Central
Spain) and P. uncinata in the Pyrenean Mountain
Range (Fig. 1).
Data
For each species, stands were selected in medium
quality sites (medium site index) distributed according
to age classes. Average trees and growing conditions
were chosen for the destructive sample. Because
A. pinsapo is a protected species, the sample trees were
not as representative as those of other species and it
was not possible to collect belowground samples. Trees
were sampled by 5 cm diameter classes, starting at
7.5 cm up to the maximum diameter found in the area.
The number of sample trees varied from a minimum
of 21 trees in the case of J. thurifera and P. uncinata to
a maximum of 305 trees for P. sylvestris. For each
sample tree, diameter at breast height (1.30 m) (d),
total height (h) and crown height (hc) were measured.
The minimum diameters sampled were between 6.2 for
P. sylvestris and 10.0 for P. canariensis and P. nigra.
The maximum diameters ranged from 41.0 cm for
P. uncinata to 77.3 cm for P. nigra (Table 1).
Sampled trees were felled and separated into biomass
components in the f ield. The biomass components
considered were: stem with bark (commercial volume,
up to a top diameter of 7 cm), thick branches (diameter
larger than 7 cm), medium branches (diameter between
2 and 7 cm), thin branches (branches with a diameter
smaller than 2 cm) and needles (Montero et al., 1999).
Estimation of root biomass was only undertaken on a
few trees per species and diameter class due to the
complexity and cost of the work involved (Table 1).
The root component was collected using a backhoe, by
digging a trench around the stump and extracting all
the roots inside this hole. Using this approach, most
178 R. Ruiz-Peinado et al. / Forest Systems (2011) 20(1), 176-188
of the root system was extracted. Fine roots were not
captured by this method.
Each component was weighed in the f ield (fresh
weight) and a representative sample (10 kg) of each of
them was taken to the laboratory to be oven-dried at
102°C to constant weight. Thus, it was possible to de-
termine moisture content and estimate dry matter. In
those cases where the stem could not be weighed in the
field, the diameter was measured at meter intervals up
the stem in order to determine the log volumes using
Biomass models for the main softwood species in Spain 179
Figure 1. Distribution of the sample zones in Spain for the studied species. Aa: Abies alba. Ap: A. pinsapo. Jt: Juniperus thurife-
ra. Pc: Pinus canariensis. Ph: P. halepensis. Pn: P. nigra. Ppt: P. pinaster. Ppn: P. pinea. Ps: P. sylvestris. Pu: P. uncinata.
Table 1. Minimum, maximum and mean values for diameter, height and biomass sample weight for the studied species
Speciesdbh height Aboveground biomass Root biomass
Min Max Mean Min Max Mean n Min Max Mean n Min Max Mean
A. alba 9.0 57.5 30.4 8.0 29.0 18.5 29 27 2,503 661 10 8 394 132A. pinsapo 7.0 51.0 27.3 4.0 21.5 11.3 29 7 624 200 — — — —J. thurifera 9.5 49.8 25.7 3.5 8.9 5.8 21 23 539 205 8 12 130 69P. canariensis 10.0 53.0 29.8 9.0 27.6 18.0 27 22 2,292 595 13 7 428 177P. halepensis 8.0 44.0 23.2 4.6 12.5 9.1 54 13 703 171 9 3 190 64P. nigra 10.0 77.3 35.4 5.2 22.6 12.9 50 23 3,274 791 13 8 811 234P. pinaster 7.0 64.0 19.7 6.1 20.7 11.6 199 5 1,521 116 10 6 325 115P. pinea 9.0 63.0 29.2 4.3 21.2 10.3 54 16 2,225 426 13 6 777 235P. sylvestris 6.2 76.0 18.1 4.6 27.7 10.9 305 8 3,368 175 14 4 1,193 125P. uncinata 8.0 41.0 25.6 7.3 20.1 15.6 21 16 868 346 7 3 401 146
dbh: diameter at breast height (cm). height: total height (m). Abov. biomass: aboveground biomass weight (kg). Root biomass: root
biomass weight (kg). Min: minimum. Max: maximum. Mean: mean. n: number of samples.
Smalian’s formula. Dry weight was calculated by
applying the basic wood density for the different spe-
cies (Gutiérrez Oliva and Plaza Pulgar, 1967). Needles
were totally separated and weighed in the case of small
trees, while a subsample of thin branches with foliage
was taken to estimate foliage mass in larger trees.
Maximum and minimum aboveground biomass for
the conifer species sampled ranged from 5 kg for
P. pinaster to 3,368 kg for P. sylvestris and belowground
biomass ranged from 3 kg (P. halepensis and P. unci-
nata) to 1,193 kg (P. sylvestris).
Biomass equations
Different linear and non-linear equations found in
biomass literature (Table 2) were tested for relating the
weight of the biomass components to tree variables for
each species using diameter at breast height (d) and
tree height (h) as independent variables.
In a first step, the best model for each component
and species was chosen, based on graphical analysis
of residuals and fitting statistics (bias and precision),
computing the mean residuals (MRES), root mean
square error (RMSE), model efficiency (MEF) (equa-
tions 1-3) (Gadow et al., 2001) and the Akaike infor-
mation criterion (AIC) (Akaike, 1974). The biological
behaviour of the model was also evaluated in order to
choose the best equations.
[1]
[2]
[3]
where yi is the observed value, yi is the estimated value,
yi is the mean observed value, n is the number of
observations and p is the number of parameters in the
model.
Afterwards, the best models selected were simulta-
neously f itted using joint generalized regression
(known as Seemingly Unrelated Regressions, SUR)
(Zellner, 1962) to make consistent estimates of the
different components with non-linear systems (Parresol,
2001; Bi et al., 2004) (system of equations 4). This
method takes into account cross-equation error corre-
lation in order to come up with the sum of total aerial
biomass components (additivity property). The em-
ployment of this technique guarantees that total above-
ground biomass will be the sum of the tree component
estimations.
W1 = ƒ1 (α1, β1) + ε1W2 = ƒ2 (α2, β2) + ε2
… [4]
Wk = ƒk (αk, βk) + εkWtotal = ƒtotal (α1, β2, … αk, β1, β2, … βk) + εtotal
Weighted regression was used to avoid heterosce-
dasticity, frequently present in biomass data. Each
observation was weighted by the inverse of its variance
to homogenize the variance of residuals. This weigh-
ting factor was estimated through a power function of
an independent variable as explained by Parresol (2001)
and Balboa-Murias et al. (2006).
The possible presence of multicollinearity was veri-
fied through the condition number (Myers, 1990). Mo-
del fits were performed using the MODEL procedure
in the SAS/ETS software (SAS Institute Inc., 2004).
In order to evaluate the predictive accuracy of the
system of equations, they were compared with the
equations previously proposed by Montero (2005) for
these Mediterranean species whose models were fitted
separately for each biomass component using log trans-
formed data and OLS regression. The RMSE and MEF
ratios (equations 5 and 6) obtained using both systems
MEF = 1 – i=1n∑ yi – yi( )ˆ 2
i=1n∑ yi – yi( )¯ 2
RMSE =n – p
i=1n∑ yi – yi( )ˆ 2
MRES =i=1
n
n∑ yi – yi( )ˆ180 R. Ruiz-Peinado et al. / Forest Systems (2011) 20(1), 176-188
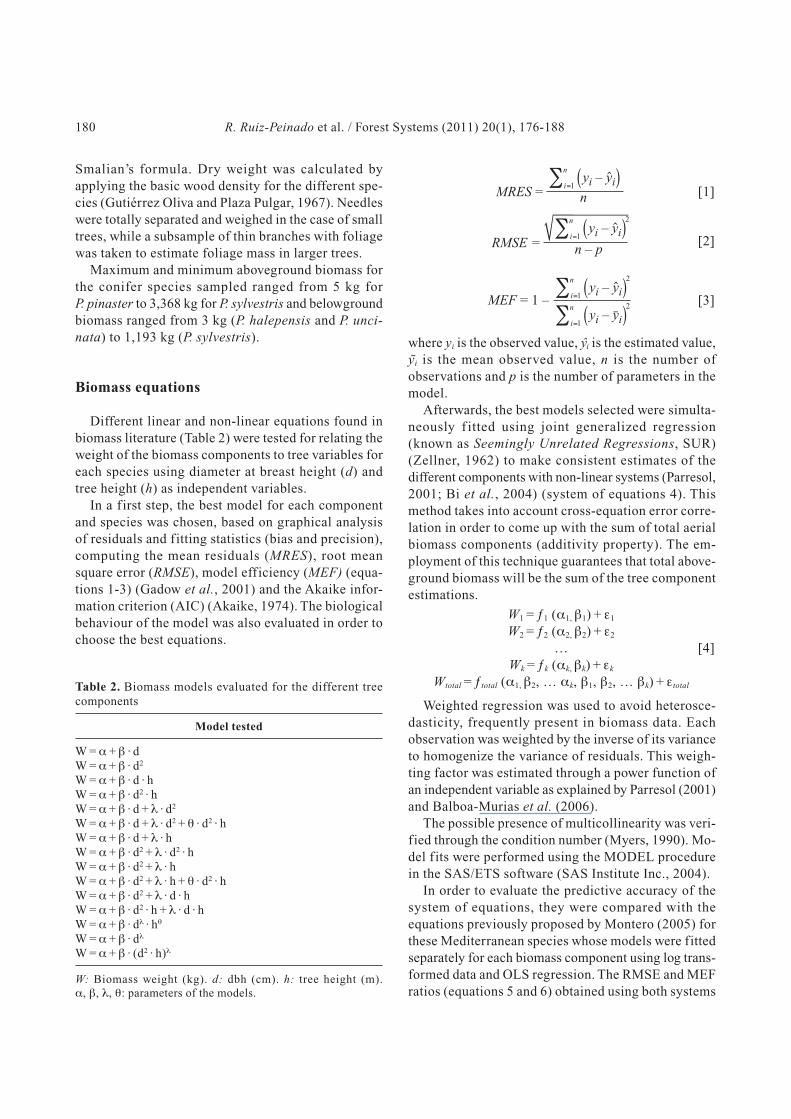
Table 2. Biomass models evaluated for the different treecomponents
Model tested
W = α + β · dW = α + β · d2
W = α + β · d · hW = α + β · d2 · h W = α + β · d + λ · d2
W = α + β · d + λ · d2 + θ · d2 · hW = α + β · d + λ · hW = α + β · d2 + λ · d2 · hW = α + β · d2 + λ · hW = α + β · d2 + λ · h + θ · d2 · hW = α + β · d2 + λ · d · hW = α + β · d2 · h + λ · d · hW = α + β · dλ · hθ
W = α + β · dλ
W = α + β · (d2 · h)λ
W: Biomass weight (kg). d: dbh (cm). h: tree height (m).
α, β, λ, θ: parameters of the models.
of equations were used in the comparison (Bi et al.,
2004).
RMSE (this study)RMSEratio = ——————————————— [5]
RMSE (Montero et al., 2005)
MEF (this study)MEFratio = ——————————————— [6]
MEF (Montero et al., 2005)
Root:shoot ratios
Root:shoot ratios were calculated as the dry mass
relationship between belowground and aboveground
biomass of a tree. Honestly Significant Difference tests
(HDS) suitable for multiple comparisons were applied
to the relationships in order to identify differences
between species.
Results
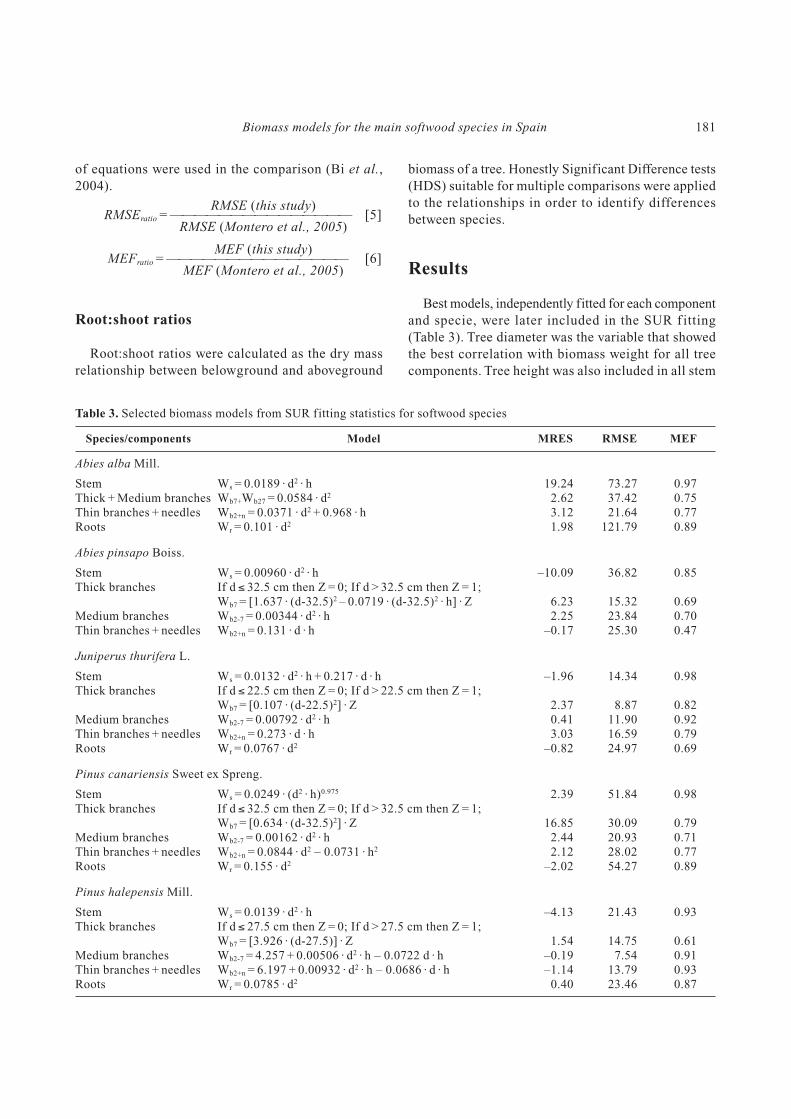
Best models, independently fitted for each component
and specie, were later included in the SUR f itting
(Table 3). Tree diameter was the variable that showed
the best correlation with biomass weight for all tree
components. Tree height was also included in all stem
Biomass models for the main softwood species in Spain 181
Table 3. Selected biomass models from SUR fitting statistics for softwood species
Species/components Model MRES RMSE MEF
Abies alba Mill.
Stem Ws = 0.0189 · d2 · h 19.24 73.27 0.97Thick + Medium branches Wb7+Wb27 = 0.0584 · d2 2.62 37.42 0.75Thin branches + needles Wb2+n = 0.0371 · d2 + 0.968 · h 3.12 21.64 0.77Roots Wr = 0.101 · d2 1.98 121.79 0.89
Abies pinsapo Boiss.
Stem Ws = 0.00960 · d2 · h –10.09 36.82 0.85Thick branches If d ≤ 32.5 cm then Z = 0; If d > 32.5 cm then Z = 1;
Wb7 = [1.637 · (d-32.5)2 – 0.0719 · (d-32.5)2 · h] · Z 6.23 15.32 0.69Medium branches Wb2-7 = 0.00344 · d2 · h 2.25 23.84 0.70Thin branches + needles Wb2+n = 0.131 · d · h –0.17 25.30 0.47
Juniperus thurifera L.
Stem Ws = 0.0132 · d2 · h + 0.217 · d · h –1.96 14.34 0.98Thick branches If d ≤ 22.5 cm then Z = 0; If d > 22.5 cm then Z = 1;
Wb7 = [0.107 · (d-22.5)2] · Z 2.37 8.87 0.82Medium branches Wb2-7 = 0.00792 · d2 · h 0.41 11.90 0.92Thin branches + needles Wb2+n = 0.273 · d · h 3.03 16.59 0.79Roots Wr = 0.0767 · d2 –0.82 24.97 0.69
Pinus canariensis Sweet ex Spreng.
Stem Ws = 0.0249 · (d2 · h)0.975 2.39 51.84 0.98Thick branches If d ≤ 32.5 cm then Z = 0; If d > 32.5 cm then Z = 1;
Wb7 = [0.634 · (d-32.5)2] · Z 16.85 30.09 0.79Medium branches Wb2-7 = 0.00162 · d2 · h 2.44 20.93 0.71Thin branches + needles Wb2+n = 0.0844 · d2 – 0.0731 · h2 2.12 28.02 0.77Roots Wr = 0.155 · d2 –2.02 54.27 0.89
Pinus halepensis Mill.
Stem Ws = 0.0139 · d2 · h –4.13 21.43 0.93Thick branches If d ≤ 27.5 cm then Z = 0; If d > 27.5 cm then Z = 1;
Wb7 = [3.926 · (d-27.5)] · Z 1.54 14.75 0.61Medium branches Wb2-7 = 4.257 + 0.00506 · d2 · h – 0.0722 d · h –0.19 7.54 0.91Thin branches + needles Wb2+n = 6.197 + 0.00932 · d2 · h – 0.0686 · d · h –1.14 13.79 0.93Roots Wr = 0.0785 · d2 0.40 23.46 0.87
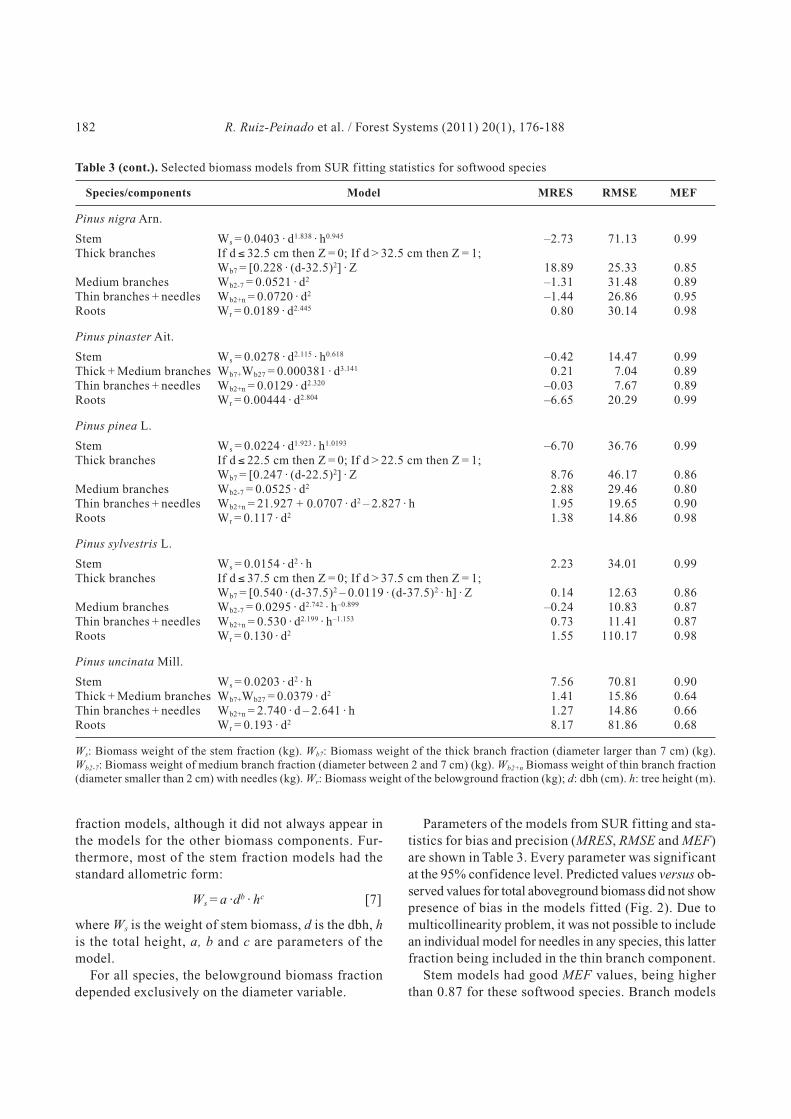
fraction models, although it did not always appear in
the models for the other biomass components. Fur-
thermore, most of the stem fraction models had the
standard allometric form:
Ws = a ·db · hc [7]
where Ws is the weight of stem biomass, d is the dbh, h
is the total height, a, b and c are parameters of the
model.
For all species, the belowground biomass fraction
depended exclusively on the diameter variable.
Parameters of the models from SUR fitting and sta-
tistics for bias and precision (MRES, RMSE and MEF)
are shown in Table 3. Every parameter was significant
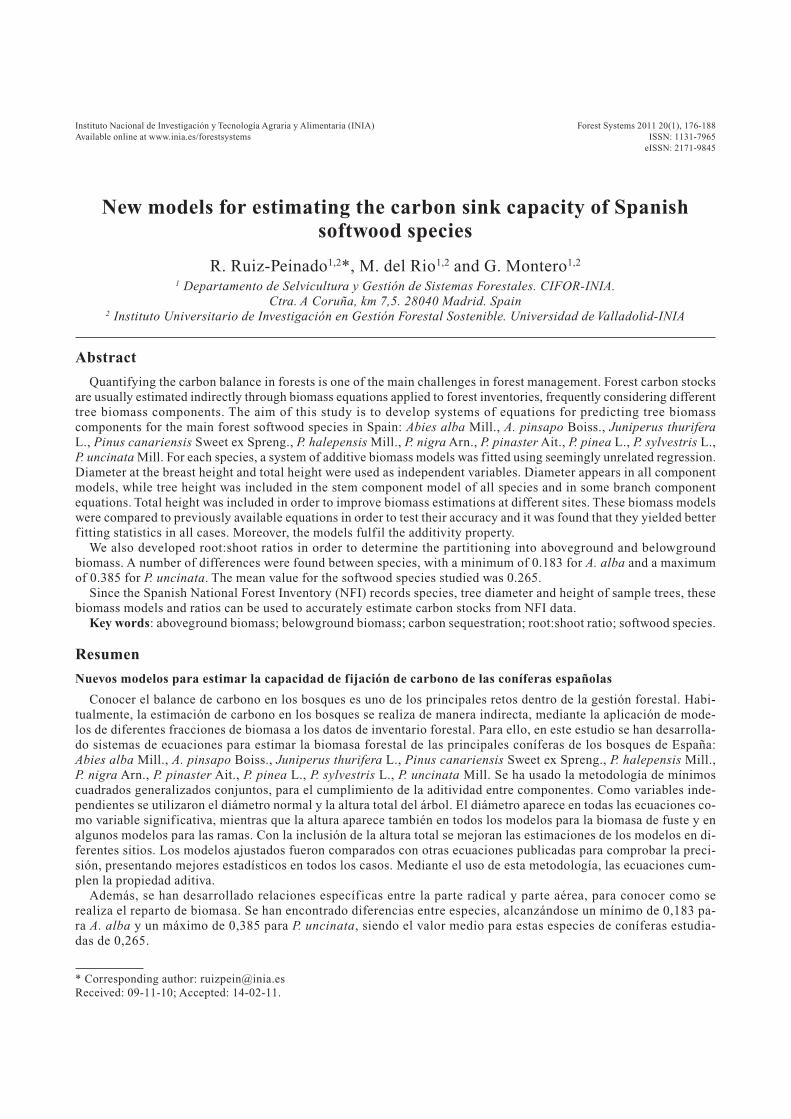
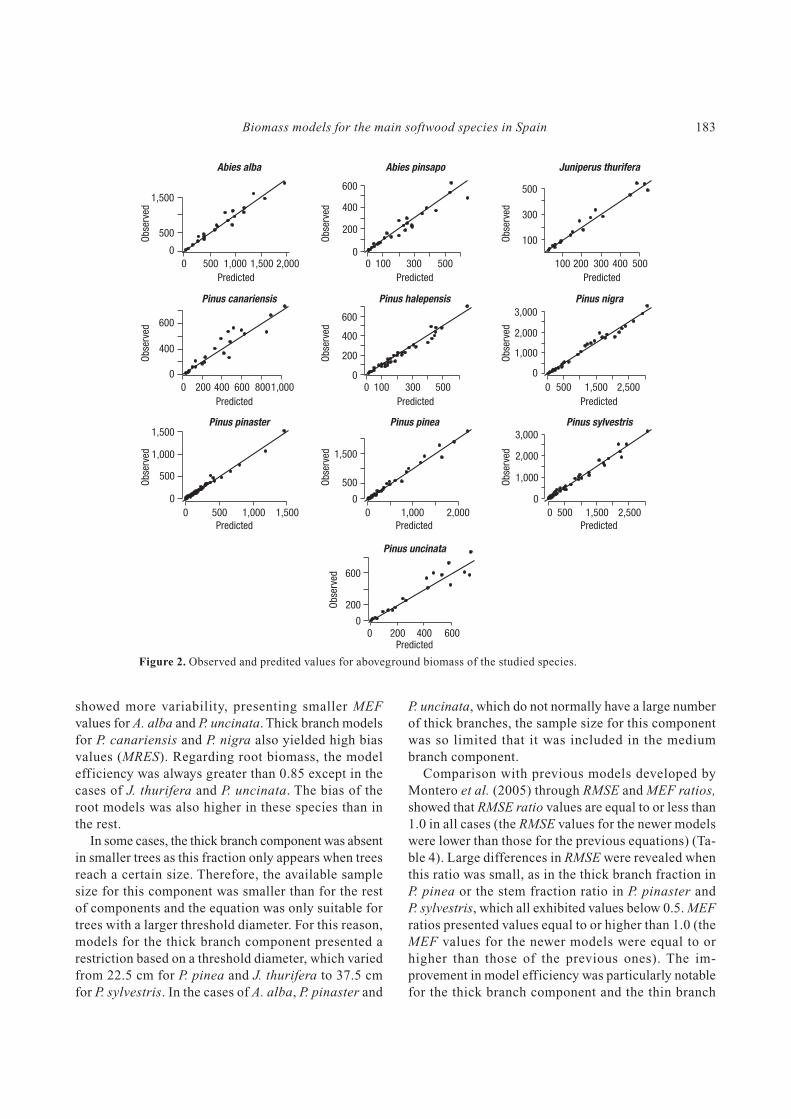
at the 95% confidence level. Predicted values versus ob-
served values for total aboveground biomass did not show
presence of bias in the models fitted (Fig. 2). Due to
multicollinearity problem, it was not possible to include
an individual model for needles in any species, this latter
fraction being included in the thin branch component.
Stem models had good MEF values, being higher
than 0.87 for these softwood species. Branch models
182 R. Ruiz-Peinado et al. / Forest Systems (2011) 20(1), 176-188
Table 3 (cont.). Selected biomass models from SUR fitting statistics for softwood species
Species/components Model MRES RMSE MEF
Pinus nigra Arn.
Stem Ws = 0.0403 · d1.838 · h0.945 –2.73 71.13 0.99Thick branches If d ≤ 32.5 cm then Z = 0; If d > 32.5 cm then Z = 1;
Wb7 = [0.228 · (d-32.5)2] · Z 18.89 25.33 0.85Medium branches Wb2-7 = 0.0521 · d2 –1.31 31.48 0.89Thin branches + needles Wb2+n = 0.0720 · d2 –1.44 26.86 0.95Roots Wr = 0.0189 · d2.445 0.80 30.14 0.98
Pinus pinaster Ait.
Stem Ws = 0.0278 · d2.115 · h0.618 –0.42 14.47 0.99Thick + Medium branches Wb7+Wb27 = 0.000381 · d3.141 0.21 7.04 0.89Thin branches + needles Wb2+n = 0.0129 · d2.320 –0.03 7.67 0.89Roots Wr = 0.00444 · d2.804 –6.65 20.29 0.99
Pinus pinea L.
Stem Ws = 0.0224 · d1.923 · h1.0193 –6.70 36.76 0.99Thick branches If d ≤ 22.5 cm then Z = 0; If d > 22.5 cm then Z = 1;
Wb7 = [0.247 · (d-22.5)2] · Z 8.76 46.17 0.86Medium branches Wb2-7 = 0.0525 · d2 2.88 29.46 0.80Thin branches + needles Wb2+n = 21.927 + 0.0707 · d2 – 2.827 · h 1.95 19.65 0.90Roots Wr = 0.117 · d2 1.38 14.86 0.98
Pinus sylvestris L.
Stem Ws = 0.0154 · d2 · h 2.23 34.01 0.99Thick branches If d ≤ 37.5 cm then Z = 0; If d > 37.5 cm then Z = 1;
Wb7 = [0.540 · (d-37.5)2 – 0.0119 · (d-37.5)2 · h] · Z 0.14 12.63 0.86Medium branches Wb2-7 = 0.0295 · d2.742 · h–0.899 –0.24 10.83 0.87Thin branches + needles Wb2+n = 0.530 · d2.199 · h–1.153 0.73 11.41 0.87Roots Wr = 0.130 · d2 1.55 110.17 0.98
Pinus uncinata Mill.
Stem Ws = 0.0203 · d2 · h 7.56 70.81 0.90Thick + Medium branches Wb7+Wb27 = 0.0379 · d2 1.41 15.86 0.64Thin branches + needles Wb2+n = 2.740 · d – 2.641 · h 1.27 14.86 0.66Roots Wr = 0.193 · d2 8.17 81.86 0.68
Ws: Biomass weight of the stem fraction (kg). Wb7: Biomass weight of the thick branch fraction (diameter larger than 7 cm) (kg).
Wb2-7: Biomass weight of medium branch fraction (diameter between 2 and 7 cm) (kg). Wb2+n Biomass weight of thin branch fraction
(diameter smaller than 2 cm) with needles (kg). Wr: Biomass weight of the belowground fraction (kg); d: dbh (cm). h: tree height (m).
showed more variability, presenting smaller MEF
values for A. alba and P. uncinata. Thick branch models
for P. canariensis and P. nigra also yielded high bias
values (MRES). Regarding root biomass, the model
efficiency was always greater than 0.85 except in the
cases of J. thurifera and P. uncinata. The bias of the
root models was also higher in these species than in
the rest.
In some cases, the thick branch component was absent
in smaller trees as this fraction only appears when trees
reach a certain size. Therefore, the available sample
size for this component was smaller than for the rest
of components and the equation was only suitable for
trees with a larger threshold diameter. For this reason,
models for the thick branch component presented a
restriction based on a threshold diameter, which varied
from 22.5 cm for P. pinea and J. thurifera to 37.5 cm
for P. sylvestris. In the cases of A. alba, P. pinaster and
P. uncinata, which do not normally have a large number
of thick branches, the sample size for this component
was so limited that it was included in the medium
branch component.
Comparison with previous models developed by
Montero et al. (2005) through RMSE and MEF ratios,
showed that RMSE ratio values are equal to or less than
1.0 in all cases (the RMSE values for the newer models
were lower than those for the previous equations) (Ta-
ble 4). Large differences in RMSE were revealed when
this ratio was small, as in the thick branch fraction in
P. pinea or the stem fraction ratio in P. pinaster and
P. sylvestris, which all exhibited values below 0.5. MEF
ratios presented values equal to or higher than 1.0 (the
MEF values for the newer models were equal to or
higher than those of the previous ones). The im-
provement in model efficiency was particularly notable
for the thick branch component and the thin branch
Biomass models for the main softwood species in Spain 183
0 500 1,000 1,500 2,000
Predicted
1,500
500
0
Obse
rved
Abies alba
100 200 300 400 500
Predicted
500
300
100Obse
rved
Juniperus thurifera
0 100 300 500
Predicted
600
400
200
0
Obse
rved
Abies pinsapo
0 200 400 600 8001,000
Predicted
600
400
0
Obse
rved
Pinus canariensis
0 500 1,500 2,500
Predicted
3,000
2,000
1,000
0
Obse
rved
Pinus nigra
0 100 300 500
Predicted
600
400
200
0
Obse
rved
Pinus halepensis
0 500 1,000 1,500
Predicted
1,500
1,000
500
0
Obse
rved
Pinus pinaster
0 500 1,500 2,500
Predicted
3,000
2,000
1,000
0O
bse
rved
Pinus sylvestris
0 1,000 2,000
Predicted
1,500
500
0
Obse
rved
Pinus pinea
0 200 400 600Predicted
600
200
0
Obse
rved
Pinus uncinata
Figure 2. Observed and predited values for aboveground biomass of the studied species.
(with needle) component in P. pinea, as well as for the
thick branch fraction in P. halepensis and the medium
branch component in P. nigra.
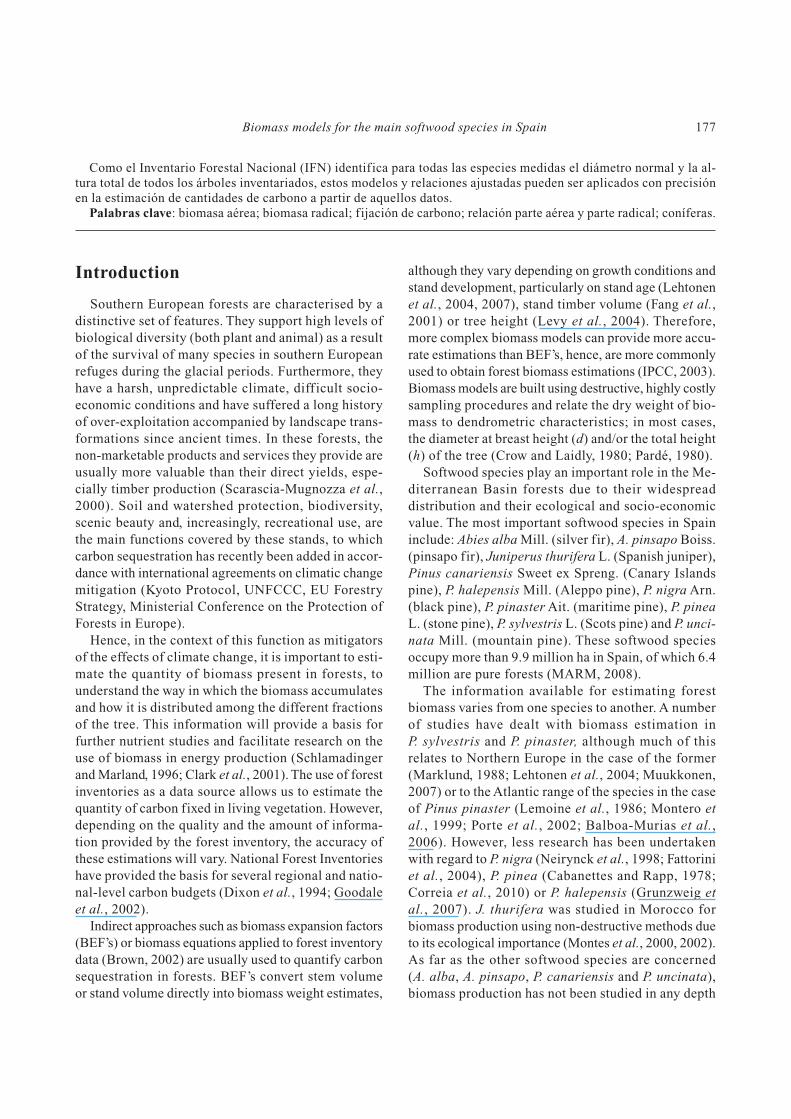
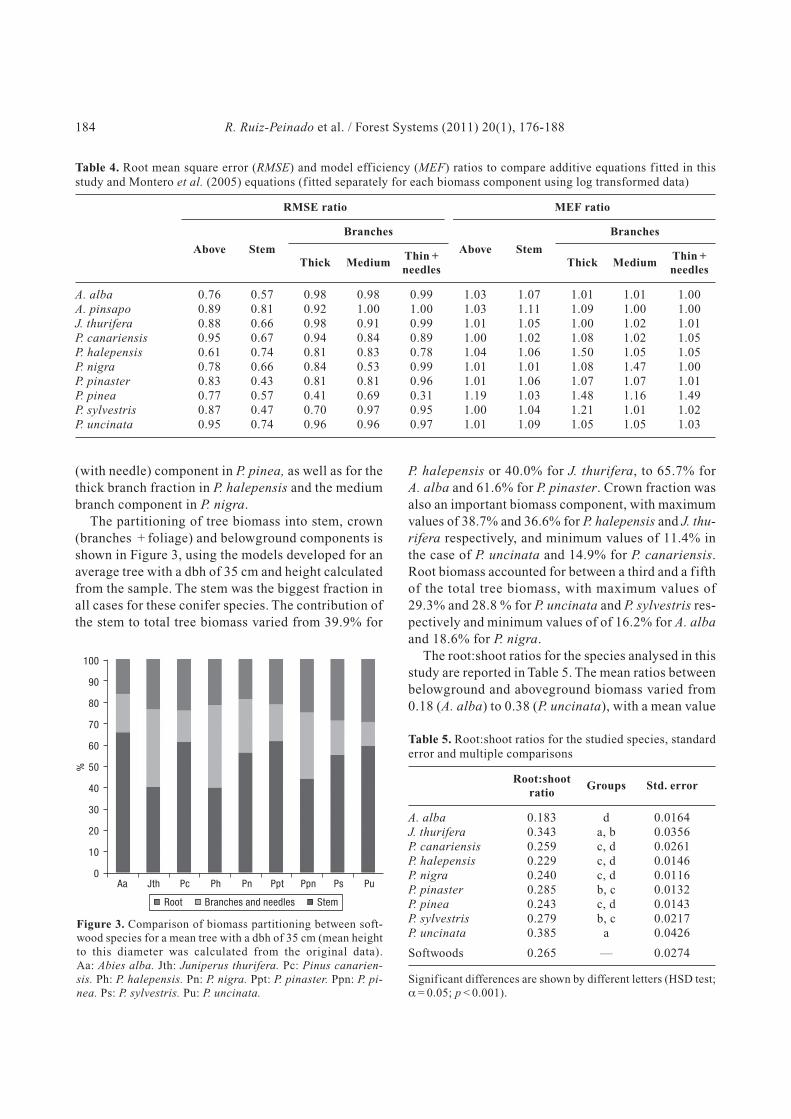
The partitioning of tree biomass into stem, crown
(branches + foliage) and belowground components is
shown in Figure 3, using the models developed for an
average tree with a dbh of 35 cm and height calculated
from the sample. The stem was the biggest fraction in
all cases for these conifer species. The contribution of
the stem to total tree biomass varied from 39.9% for
P. halepensis or 40.0% for J. thurifera, to 65.7% for
A. alba and 61.6% for P. pinaster. Crown fraction was
also an important biomass component, with maximum
values of 38.7% and 36.6% for P. halepensis and J. thu-
rifera respectively, and minimum values of 11.4% in
the case of P. uncinata and 14.9% for P. canariensis.
Root biomass accounted for between a third and a fifth
of the total tree biomass, with maximum values of
29.3% and 28.8 % for P. uncinata and P. sylvestris res-
pectively and minimum values of of 16.2% for A. alba
and 18.6% for P. nigra.
The root:shoot ratios for the species analysed in this
study are reported in Table 5. The mean ratios between
belowground and aboveground biomass varied from
0.18 (A. alba) to 0.38 (P. uncinata), with a mean value
184 R. Ruiz-Peinado et al. / Forest Systems (2011) 20(1), 176-188
Table 4. Root mean square error (RMSE) and model efficiency (MEF) ratios to compare additive equations fitted in thisstudy and Montero et al. (2005) equations (fitted separately for each biomass component using log transformed data)
RMSE ratio MEF ratio
Branches Branches
Above Stem
Thick MediumThin +
Above Stem
Thick MediumThin +
needles needles
A. alba 0.76 0.57 0.98 0.98 0.99 1.03 1.07 1.01 1.01 1.00A. pinsapo 0.89 0.81 0.92 1.00 1.00 1.03 1.11 1.09 1.00 1.00J. thurifera 0.88 0.66 0.98 0.91 0.99 1.01 1.05 1.00 1.02 1.01P. canariensis 0.95 0.67 0.94 0.84 0.89 1.00 1.02 1.08 1.02 1.05P. halepensis 0.61 0.74 0.81 0.83 0.78 1.04 1.06 1.50 1.05 1.05P. nigra 0.78 0.66 0.84 0.53 0.99 1.01 1.01 1.08 1.47 1.00P. pinaster 0.83 0.43 0.81 0.81 0.96 1.01 1.06 1.07 1.07 1.01P. pinea 0.77 0.57 0.41 0.69 0.31 1.19 1.03 1.48 1.16 1.49P. sylvestris 0.87 0.47 0.70 0.97 0.95 1.00 1.04 1.21 1.01 1.02P. uncinata 0.95 0.74 0.96 0.96 0.97 1.01 1.09 1.05 1.05 1.03
Figure 3. Comparison of biomass partitioning between soft-
wood species for a mean tree with a dbh of 35 cm (mean height
to this diameter was calculated from the original data).
Aa: Abies alba. Jth: Juniperus thurifera. Pc: Pinus canarien-
sis. Ph: P. halepensis. Pn: P. nigra. Ppt: P. pinaster. Ppn: P. pi-
nea. Ps: P. sylvestris. Pu: P. uncinata.
Root Branches and needles Stem
Aa Jth Pc Ph Pn Ppt Ppn Ps Pu
%
100
90
80
70
60
50
40
30
20
10
0
Table 5. Root:shoot ratios for the studied species, standarderror and multiple comparisons
Root:shootGroups Std. error
ratio
A. alba 0.183 d 0.0164J. thurifera 0.343 a, b 0.0356P. canariensis 0.259 c, d 0.0261P. halepensis 0.229 c, d 0.0146P. nigra 0.240 c, d 0.0116P. pinaster 0.285 b, c 0.0132P. pinea 0.243 c, d 0.0143P. sylvestris 0.279 b, c 0.0217P. uncinata 0.385 a 0.0426
Softwoods 0.265 — 0.0274
Significant differences are shown by different letters (HSD test;
α = 0.05; p < 0.001).
of 0.27 for the softwood species studied. Statistical
differences were found between species: A. alba pre-
sented the lowest value different from the rest of spe-
cies; the Pinus species showed similar values between
them and J. thurifera and P. uncinata exhibited a large
variability and presented similar values.
Discussion
The estimation of forest carbon stocks from forest
inventories requires the use of accurate and unbiased
biomass models. In this study, new biomass estimation
models for the main forest species in Spain have been
developed in order to improve on the performance of
previous models which did not consider the additivity
property (Montero et al., 2005); the latter being a desi-
rable attribute for a system of biomass component
equations. The use of the nonlinear seemingly unrela-
ted regressions (NSUR) method to f it the system of
equations guarantees this property, giving consistency
(Kozak, 1970) and reducing the confidence and predic-
tion intervals of the biomass estimations (Parresol,
1999, 2001).
The new models included tree height as an indepen-
dent variable in some components, resulting in impro-
ved model fit statistics. Other authors have also reported
improvements in biomass estimations where height and
diameter (rather than just diameter) dependent models
are used (Lambert et al., 2005; Cienciala et al., 2006).
By including tree height, information regarding the
competitive environment (stand age, site index, den-
sity...) is indirectly considered in the model (Wirth et
al., 2004). This fact makes the model more general and
permits the use of the equation for different sites
(Ketterings et al., 2001). Other independent variables
like crown length have been tested in other studies for
crown biomass estimation (Carvalho and Parresol,
2003; Antonio et al., 2007). However, in order to assure
the applicability of the models, we have not considered
this variable because it is not available in the Spanish
National Forest Inventory and is not usually measured
in forest inventories.
As a consequence of considering simultaneous fitting
and the use of tree height as a predictor variable, the
additive biomass equations presented in this study re-
present a considerable improvement on those propo-
sed by Montero et al. (2005) for the studied species.
The latter were fitted to the same data, but log transfor-
med data were used and each biomass component was
fitted separately, using ordinary least squares regression.
The improvement in model efficiency reached around
50% for the thick branch component of P. halepensis
and P. pinea as well as for the thin branch (with needles)
component of P. pinea (Table 4). For total aboveground
biomass, the greatest improvements were found for
P. pinea.
In the case of the stem biomass component, all the
models fitted were non-linear with an allometric ex-
pression including dbh and total height. This ex-
pression is very similar to those used for volume esti-
mations, yielding high model efficiency values. Many
authors have highlighted the suitability of this combi-
nation of variables for stem biomass predictions (Bi et
al., 2004; Antonio et al., 2007). For the other tree compo-
nents (branches of different diameter sizes), models
could be either linear or non-linear, with dbh and/or tree
height appearing by themselves with different parameters
or together in various different combinations. The coeffi-
cients related to dbh were in most cases positive numbers,
showing that biomass increases with diameter. Conver-
sely, coefficients related to tree height were sometimes
negative, particularly for crown fractions, indicating
that for the same diameter size, taller trees allocate less
biomass to the crown due to the processes involved in
competition for light (Lambert et al., 2005).
The ability of the model to predict biomass is lower
for branch components than for the stem (Table 3).
Branch and foliage biomass are more dependent than
bole biomass on tree competition and stand density,
hence they present greater variability (Cole and Ewel,
2006; Návar, 2009). The high variability in crown bio-mass displayed by P. pinea trees is due to frequent pru-ning for fruit and firewood production.
A number of authors have proposed the use of gene-ral equations to estimate aboveground biomass pergenus or group of species (Pastor et al., 1983/1984)(Schroeder et al., 1997). However, the variability foundin allometric ratios and in biomass component equa-tions among the studied species, suggests that separateequations for each species are essential to accuratelyestimate biomass per fraction of the tree. This informa-tion is required to estimate nutrient stocks, biomassamounts for f irewood after treatment or to considerdifferent management options in relation to the nutrientcycle and carbon stocks (Balboa-Murias et al., 2006;Cole and Ewel, 2006; Bravo et al., 2008).
Belowground biomass is not generally consideredin biomass studies because of the high-cost and diffi-culty involved in sampling, even though it makes up a
Biomass models for the main softwood species in Spain 185
significant part of the total tree biomass. In the caseof the species studied, the root weight model dependsexclusively on tree diameter, as determined by Drexhageand Colin (2001) or Le Goff and Ottorini (2001).
As regards the relationship between belowgroundand aboveground biomass (stem, branches and needles),Kurz et al. (1996) found differences in the relationshipsbetween softwood and hardwood species. However,Cannell (1982) and Cairns et al. (1997) found no sig-nificant differences between species groups and repor-ted general root:shoot ratio figures of 0.26 for conifersand 0.25 for deciduous. The figure for conifers in thepresent study is in accordance with this general value.Levy et al. (2004) found a mean root:shoot ratio forconifers in Great Britain of 0.359. This mean valuediffers from our result, although the f igures theypresent for P. sylvestris (0.301) and P. nigra (0.224)are similar to our figures for these species. Correia et
al. (2010) reported a root:shoot ratio for P. pinea of0.30 for trees at low densities. This value is slightlyhigher than ours, although our samples were collectedat higher densities so there may have been greater com-petition between trees. Although the root:shoot ratiocan vary depending on tree size and stand characte-ristics, these high observed values highlight the impor-tance of the root fraction in Mediterranean forests.
Although we took samples from a broad range ofdiameters, only a small number of root samples weretaken to evaluate belowground biomass and soil typeswere not checked as part of this study. Therefore,further research into belowground biomass in Medi-terranean forests may be necessary.
Conclusions
The use of seemingly unrelated regression and thelarge sample size employed to fit the models, result inaccurate additive biomass equations for the mainSpanish Mediterranean forest species and provide aconsiderable improvement on the existing equations.Given that the Spanish National Forest Inventory (NFI)identifies the forest species and records tree diameterand height of all sample trees per plot, the modelsdeveloped could be applied to NFI data, allowingecosystem-wide, regional and national carbon accounts.
Belowground biomass accounts for a signif icantproportion of total biomass in Mediterranean ecosys-tems, which must be considered and quantified in orderto obtain complete biomass and carbon estimations.
In Mediterranean forests, where wood productionis not the main function, these biomass estimates bycomponent are highly useful to define the best forestmanagement practices to be followed and to identifythe role of the forest as a carbon sink.
Acknowledgments
We would like to thank all those who participatedin the field work, especially M. Muñoz and E. Garriga,as well as S. Mutke for his comments on the manu-script. This study was partially financed by projectsOT-03-002 and PSS-310000-2009-22.
References
AKAIKE H., 1974. A new look at the statistical model iden-tification. IEEE Transactions on Automatic Control 19,716-723.
ANTONIO N., TOMÉ M., TOMÉ J., SOARES P., FONTESL., 2007. Effect of the tree, stand and site variables of theallometry of Eucalyptus globulus tree biomass. Can J ForRes 37, 895-906.
BALBOA-MURIAS M.A., RODRÍGUEZ-SOALLEIRO R.,MERINO A., ÁLVAREZ-GONZÁLEZ J.G., 2006. Tem-poral variations and distribution of carbon stocks inaboveground biomass of radiata pine and maritime pinepure stands under different silvicultural alternatives. ForEcol Manage 237, 29-38.
BI H.Q., TURNER J., LAMBERT M.J., 2004. Additive bio-mass equations for native eucalypt forest trees of tempe-rate Australia. Trees-Struct Funct 18, 467-479.
BRAVO F., BRAVO-OVIEDO A., DÍAZ BALTEIRO L.,2008. Carbon sequestration in Spanish Mediterraneanforest under two management alternatives: a modelingapproach. Eur J Forest Res 127, 225-234.
BROWN S., 2002. Measuring carbon in forests: currentstatus and future challenges. Environmental Pollution 116,363-372.
CABANETTES A., RAPP M., 1978. Biomass, nutrient dis-tribution and productivity in a Pinus pinea forest.1. Bio-mass. Oecologia Plantarum 13, 271-286.
CAIRNS M.A., BROWN S., HELMER E.H., BAUMGARDNERG.A., 1997. Root biomass allocation in the world’s uplandforests. Oecologia 111, 1-11.
CANNELL M.G.R., 1982. World forest biomass and primaryproduction data. Academic Press, London. 391 pp.
CARVALHO J.P., PARRESOL B.R., 2003. Additivity in treebiomass components of Pyrenean oak (Quercus pyrenaica
Willd.). For Ecol Manage 179, 269-276.CIENCIALA E., CERNY M., TATARINOV F., APLTAUER
J., EXNEROVA Z., 2006. Biomass functions applicableto Scots pine. Trees-Struct Funct 20, 483-495.
186 R. Ruiz-Peinado et al. / Forest Systems (2011) 20(1), 176-188
CLARK D.A., BROWN S., KICKLIGHTER D.W., CHAMBERSJ.Q., THOMLINSON J.R., NI J., 2001. Measuring netprimary production in forests: concepts and field methods.Ecological Applications 11, 356-370.
COLE T.G., EWEL J.J., 2006. Allometric equations for four valuable tropical tree species. For Ecol Manage 229,351-360.
CORREIA A.C., TOMÉ M., PACHECO C.A., FAIAS S.,DIAS A.C., FREIRE J., CARVALHO P.O., PEREIRA J.S.,2010. Biomass allometry and carbon factors for a Medi-terranean pine (Pinus pinea L.) in Portugal. Forest Sys-tems 19, 418-433.
CROW T.R., LAIDLY P.R., 1980. Alternative models for es-timating woody plant biomass. Can J For Res 10, 367-370.
DIXON R.K., BROWN S., HOUGHTON R.A., SOLOMONA.M., TREXLER M.C., WISNIEWSKI J., 1994. Carbonpools and flux of global forest ecosystem. Science 263,185-190.
DREXHAGE M., COLIN F., 2001. Estimating root sys-tem biomass from breast-height diameters. Forestry 74,491-497.
FANG J.Y., CHEN A.P., PENG C.H., ZHAO S.Q., CI L.,2001. Changes in forest biomass carbon storage in Chinabetween 1949 and 1998. Science 292, 2320-2322.
FATTORINI L., GASPARINI P., NOCETTI M., TABACCHIG., TO V., 2004. Above-ground tree phytomass predic-tion and preliminary shrub phytomass assessment in theforest stands of Trentino. Studi Trent. Sci Nat, Acta Biol81, 75-121.
GADOW K.V., REAL P., ÁLVAREZ GONZÁLEZ J.G. (eds),2001. Modelización del crecimiento y la evolución de bos-ques. IUFRO, Vienna.
GOODALE C.L., APPS M.J., BIRDSEY R.A., FIELD C.B.,HEATH L.S., HOUGHTON R.A., JENKINS J.C.,KOHLMAIER G.H., KURZ W., LIU S.R., NABUURSG.J., NILSSON S., SHVIDENKO A.Z., 2002. Forestcarbon sinks in the Northern Hemisphere. EcologicalApplications 12, 891-899.
GRUNZWEIG J.M., GELFAND I., FRIED Y., YAKIR D.,2007. Biogeochemical factors contributing to enhancedcarbon storage following afforestation of a semi-aridshrubland. Biogeosciences 4, 891-904.
GUTIÉRREZ OLIVA A., PLAZA PULGAR F., 1967. Carac-terísticas físico-mecánicas de las maderas españolas.Ministerio de Agricultura, Madrid. 103 pp.
IPCC, 2003. Good practice guidance for land use, land-usechange and forestry. Institute for Global EnvironmentalStrategies, Kanagawa, Japan.
KETTERINGS Q.M., COE R., VAN NOORDWIJK V.,AMBAGAU Y., PALM C.A., 2001. Reducing uncertaintyin the use of allometric biomass equations for predictingabove-ground tree biomass in mixed secondary forests.For Ecol Manage 146, 199-209.
KOZAK A., 1970. Methods for ensuring additivity of bio-mass components by regression analysis. Forestry Chro-nicle 46, 402-404.
KURZ W., BEUKEMA S., APPS M., 1996. Estimation of root biomass and dynamics for the carbon budget mo-
del of the Canadian forest sector Can J For Res 26, 1973-1979.
LAMBERT M.C., UNG C.H., RAULIER F., 2005. Canadiannational tree aboveground biomass equations. Can J ForRes 35, 1996-2018.
LE GOFF N., OTTORINI J.M., 2001. Root biomass andbiomass increment in a beech (Fagus sylvatica L.) standin North-East France. Ann For Sci 58, 1-13.
LEHTONEN A., CIENCIALA E., TATARINOV F., MAKIPAAR., 2007. Uncertainty estimation of biomass expansionfactors for Norway spruce in the Czech Republic. Ann ForSci 64, 133-140.
LEHTONEN A., MAKIPAA R., HEIKKINEN J., SIEVANENR., LISKI J., 2004. Biomass expansion factors (BEFs) for Scots pine, Norway spruce and birch according to stand age for boreal forests. For Ecol Manage 188, 211-224.
LEMOINE B., GELPE J., RANGER J., NYS C., 1986. Bio-mass and growth of maritime pine - a study of variabilityin a 16 years old stand. Ann Sci For 43, 67-84.
LEVY P.E., HALE S.E., NICOLL B.C., 2004. Biomass ex-pansion factors and root:shoot ratios for coniferous treespecies in Great Britain. Forestry 77, 421-430.
MARKLUND L.G., 1988. Biomass functions for pine, spru-ce and birch in Sweden. Rapport-Sveriges Lantbruks-universitet, Institutionen foer Skogstaxering (Sweden).
MARM, 2008. Anuario de Estadísticas Forestales 2007[online]. Ministerio de Medio Ambiente y Medio Rural y Marino). Available in http://www.mma.es/portal/ secciones/biodiversidad/montes_politica_forestal [15July, 2010].
MOKANY K., RAISON R.J., PROKUSHKIN A.S., 2006.Critical analysis of root:shoot ratios in terrestrial biomes.Glob Change Biol 12, 84-96.
MONTERO G., ORTEGA C., CAÑELLAS I., BACHILLERA., 1999. Productividad aérea y dinámica de nutrientesen una población de Pinus pinaster Ait. sometida adistintos regímenes de claras. Invest Agrar: Sist Recur ForFuera de Serie, 175-206.
MONTERO G., RUIZ-PEINADO R., MUÑOZ M., 2005.Producción de biomasa y fijación de CO2 por los bosquesespañoles. Instituto Nacional de Investigación y Tecno-logía Agraria y Alimentaria, Ministerio de Educación yCiencia, Madrid. 270 pp.
MONTES N., BERTAUDIERE-MONTES V., BADRI W.,ZAOUI E.H., GAUQUELIN T., 2002. Biomass and nu-trient content of a semi-arid mountain ecosystem: theJuniperus thurifera L. woodland fo Azzaden Valley (Mo-rocco). For Ecol Manage 166, 35-43.
MONTES N., GAUQUELIN T., BADRI W., BERTAUDIEREV., ZAOUI E.H., 2000. A non-destructive method for esti-mating aboveground forest biomass in threatened wood-lands. For Ecol Manage 130, 37-46.
MUUKKONEN P., 2007. Generalized allometric volume andbiomass equations for some tree species in Europe. Eur JForest Res 126, 157-166.
MYERS R.H., 1990. Classical and modern regression withapplications. Duxbury Press Belmont, Calif. 488 pp.
Biomass models for the main softwood species in Spain 187
NÁVAR J., 2009. Allometric equations for tree species andcarbon stocks for forests of northwestern Mexico. ForEcol Manage. 257, 427-434.
NEIRYNCK J., MADDELEIN D., KEERSMAEKER L.D.,LUST N., MUYS B., 1998. Biomass and nutrient cyclingof a highly productive Corsican pine stand on formerheathland in northern Belgium. Ann For Sci 55, 389-405.
PARDÉ J., 1980. Forest biomass. Forestry Abstracts 41, 343-363.
PARRESOL B.R., 1999. Assessing tree and stand biomass:a review with examples and critical comparisons. For Sci45, 573-593.
PARRESOL B.R., 2001. Additivity of nonlinear biomassequations. Can J For Res 31, 865-878.
PASTOR J., ABER J.D., MELILLO J.M., 1983/1984. Biomassprediction using generalized allometric regressions forsome northeast tree species. For Ecol Manage 7, 265-274.
PORTE A., TRICHET P., BERT D., LOUSTAU D., 2002.Allometric relationships for branch and tree woody bio-mass of Maritime pine (Pinus pinaster Ait.). For Ecol Ma-nage 158, 71-83.
SAS INSTITUTE INC, 2004. SAS/ETS(R) 9.1 User’s guide.In SAS Institute Inc, Cary, NC.
SCARASCIA-MUGNOZZA G., OSWALD H., PIUSSI P.,RADOGLOU K., 2000. Forests of the Mediterraneanregion: gaps in knowledge and research needs. For EcolManage 132, 97-109.
SCHLAMADINGER B., MARLAND G., 1996. The role offorest and bioenergy strategies in the global carbon cycle.Biomass & Bioenergy 10, 275-300.
SCHROEDER P.E., BROWN S., MO J., BIRDSEY R.A.,CIESZEWSKI C., 1997. Biomass estimation for tempe-rate broadleaf forest of the United States using inventorydata. For Sci 43, 424-434.
WIRTH C., SCHUMACHER J., SCHULZE E.D., 2004.Generic biomass functions for Norway spruce in Cen-tral Europe - a meta-analysis approach toward pre-diction and uncertainty estimation. Tree Physiol 24, 121-139.
ZELLNER A., 1962. An eff icient method of estimatingseemingly unrelated regressions and tests for aggregationbias. J Am Stat Assoc, 348-368.
188 R. Ruiz-Peinado et al. / Forest Systems (2011) 20(1), 176-188