Embed Size (px)
Citation preview
November 2015
Environmental Impact Statement
Technical working paper: Flooding
Appendix P
New M5

WestConnex New M5 EISTechnical Working Paper: Flooding
WCXM5_Flooding_Rev 1.8_19112015.doc Page i Lyall & AssociatesNovember 2015 Rev. 1.8
TABLE OF CONTENTSPage No.
EXECUTIVE SUMMARY ........................................................................................................ 1
1 INTRODUCTION ........................................................................................................ 11.1 Overview of WestConnex ............................................................................... 11.2 Overview of the project .................................................................................. 21.3 Project location.............................................................................................. 41.4 Secretary’s Environmental Assessment Requirements ..................................... 41.5 Study area .................................................................................................... 41.6 Report structure ............................................................................................ 5
2 STATUTORY AND POLICY CONTEXT ....................................................................... 72.1 Relevant Government policies and industry guidelines ..................................... 72.2 Floodplain Development Manual ..................................................................... 82.3 State Government planning directions and guidelines ...................................... 82.4 State Government floodplain risk management guidelines ................................ 92.5 Flood related planning controls ..................................................................... 11
3 ASSESSMENT METHODOLOGY ............................................................................. 153.1 Key tasks .................................................................................................... 153.2 Definition of present day flooding behaviour .................................................. 153.3 Sensitivity analyses ..................................................................................... 163.4 Comparison with findings of previous studies ................................................ 163.5 Provisional flood hazard ............................................................................... 163.6 Impact of the project on flooding behaviour ................................................... 173.7 Impact of flooding on the project ................................................................... 173.8 Impact of a partial blockage of major hydraulic structures on flooding behaviour
.................................................................................................................. 173.9 Impact of future climate change on flooding behaviour ................................... 18
4 EXISTING ENVIRONMENT ...................................................................................... 194.1 Catchment description ................................................................................. 19
4.1.1 Cooks River ...................................................................................... 194.1.2 Upper Wolli Creek ............................................................................. 194.1.3 Sheas Creek / Alexandra Canal ......................................................... 19
4.2 Description of existing flood behaviour .......................................................... 194.2.1 Upper Wolli Creek floodplain ............................................................. 194.2.2 Lower Cooks River floodplain ............................................................ 21
5 FLOOD RISK ASSESSMENT ................................................................................... 235.1 Overview ..................................................................................................... 235.2 Impact of the Project on flood behaviour ....................................................... 23
5.2.1 Upper Wolli Creek floodplain ............................................................. 235.2.2 Lower Cooks River floodplain ............................................................ 24
5.3 Impact of flooding on the project ................................................................... 255.3.1 Upper Wolli Creek floodplain ............................................................. 255.3.2 Lower Cooks River floodplain ............................................................ 26
5.4 Impact of a partial blockage of major hydraulic structures on flood behaviour .. 265.5 Impact of future climate change on flood behaviour ....................................... 26
5.5.1 Potential increase in rainfall intensities ............................................... 265.5.2 Sea level rise .................................................................................... 27
WestConnex New M5 EISTechnical Working Paper: Flooding
WCXM5_Flooding_Rev 1.8_19112015.doc Page ii Lyall & AssociatesNovember 2015 Rev. 1.8
6 ASSESSMENT OF POTENTIAL FLOOD MITIGATION MEASURES .......................... 396.1 Proposed flood mitigation strategy ................................................................ 396.2 General flood mitigation requirements ........................................................... 396.3 Upper Wolli Creek floodplain ........................................................................ 41
6.3.1 Flooding in existing residential development ....................................... 416.3.2 Flooding in existing commercial/industrial development ....................... 41
6.4 Lower Cooks River floodplain ....................................................................... 416.4.1 Flooding in existing residential development ....................................... 416.4.2 Flooding in existing commercial/industrial development ....................... 426.4.3 Flooding in TransGrid’s Beaconsfield West Substation ........................ 42
7 REFERENCES ........................................................................................................ 43
APPENDICES
A. Background to Development of Wolli Creek Flood Models
B. Background to Development of Lower Cooks River Flood Models
C. Tables of Peak Flows
Job No: AM383File:/Reports/WCXM5_Flooding_Rev1.8_19112015.doc
Date: November 2015Rev No: 1.8
Principal: SABAuthor: SAB
WestConnex New M5 EISTechnical Working Paper: Flooding
WCXM5_Flooding_Rev 1.8_19112015.doc Page iii Lyall & AssociatesNovember 2015 Rev. 1.8
LIST OF FIGURES(BOUND AT THE END OF THIS TECHNICAL WORKING PAPER)
1.1 Location and Catchment Plan1.2 Key Features of Project on Upper Wolli Creek Floodplain (2 Sheets)1.3 Key Features of Project on Lower Cooks River Floodplain (2 Sheets)1.4 The New M5 project
4.1 Flooding Behaviour in Vicinity of Project - Upper Wolli Creek Floodplain – Present DayConditions – 20 year ARI (2 Sheets)
4.2 Flooding Behaviour in Vicinity of Project - Upper Wolli Creek Floodplain – Present DayConditions – 100 year ARI (2 Sheets)
4.3 Flooding Behaviour in Vicinity of Project - Upper Wolli Creek Floodplain – Present DayConditions – 200 year ARI (2 Sheets)
4.4 Flooding Behaviour in Vicinity of Project - Upper Wolli Creek Floodplain – Present DayConditions – PMF (2 Sheets)
4.5 Design Water Surface Profiles – Present Day Conditions – Upper Wolli Creek4.6 Provisional Flood Hazard in Vicinity of Project - Upper Wolli Creek Floodplain – Present
Day Conditions – 100 year ARI (2 Sheets)4.7 Flooding Behaviour in Vicinity of Project – Lower Cooks River Floodplain – Present Day
Conditions – 20 year ARI (2 Sheets)4.8 Flooding Behaviour in Vicinity of Project – Lower Cooks River Floodplain – Present Day
Conditions – 100 year ARI (2 Sheets)4.9 Flooding Behaviour in Vicinity of Project – Lower Cooks River Floodplain – Present Day
Conditions – 200 year ARI (2 Sheets)4.10 Flooding Behaviour in Vicinity of Project – Lower Cooks River Floodplain – Present Day
Conditions – PMF (2 Sheets)4.11 Design Water Surface Profiles – Present Day Conditions – Lower Cooks River4.12 Design Water Surface Profiles – Present Day Conditions - Alexandra Canal4.13 Provisional Flood Hazard in Vicinity of Project – Lower Cooks River Floodplain – Present
Day Conditions – 100 year ARI (2 Sheets)
5.1 Impact of Project on Flooding Behaviour – Upper Wolli Creek Floodplain - 20 year ARI(2 Sheets)
5.2 Impact of Project on Flooding Behaviour – Upper Wolli Creek Floodplain – 100 year ARI(2 Sheets)
5.3 Impact of Project on Flooding Behaviour – Upper Wolli Creek Floodplain – 200 year ARI(2 Sheets)
5.4 Impact of Project on Flooding Behaviour – Upper Wolli Creek Floodplain – PMF(2 Sheets)
5.5 Impact of Project on Flooding Behaviour – Lower Cooks River Floodplain – 20 year ARI(2 Sheets)
5.6 Impact of Project on Flooding Behaviour – Lower Cooks River Floodplain – 100 year ARI(2 Sheets)
5.7 Impact of Project on Flooding Behaviour – Lower Cooks River Floodplain – 200 year ARI(2 Sheets)
WestConnex New M5 EISTechnical Working Paper: Flooding
WCXM5_Flooding_Rev 1.8_19112015.doc Page iv Lyall & AssociatesNovember 2015 Rev. 1.8
LIST OF FIGURES (Cont’d)(BOUND AT THE END OF THIS TECHNICAL WORKING PAPER)
5.8 Impact of Project on Flooding Behaviour – Lower Cooks River Floodplain – PMF(2 Sheets)
5.9 Impact of a Partial Blockage of Major Hydraulic Structures on Flooding Behaviour underPost-Construction Conditions - Upper Wolli Creek Floodplain –100 year ARI (2 Sheets)
5.10 Impact of a Partial Blockage of Major Hydraulic Structures on Flooding under Post-Construction Conditions - Upper Wolli Creek Floodplain – PMF (2 Sheets)
5.11 Impact of a Partial Blockage of Major Hydraulic Structures on Flooding Behaviour underPost-Construction Conditions – Lower Cooks River Floodplain – 100 year ARI (2 Sheets)
5.12 Impact of a Partial Blockage of Major Hydraulic Structures on Flooding under Post-Construction Conditions – Lower Cooks River Floodplain – PMF (2 Sheets)
5.13 Impact of 10% Increase in Design Rainfall Intensities on Flooding Behaviour under Post-Construction Conditions - Upper Wolli Creek Floodplain – 100 year ARI (2 Sheets)
5.14 Impact of 10% Increase in Design Rainfall Intensities on Flooding Behaviour under Post-Construction Conditions – Lower Cooks River Floodplain – 100 year ARI (2 Sheets)
5.15 Impact of 2050 Sea Level Rise Conditions on Flooding Behaviour under Post-Construction Conditions – Lower Cooks River Floodplain – 100 year ARI (2 Sheets)
5.16 Impact of 2100 Sea Level Rise Conditions on Flooding Behaviour under Post-Construction Conditions – Lower Cooks River Floodplain – 100 year ARI (2 Sheets)
5.17 Impact of 2050 Sea Level Rise Conditions on Flooding Behaviour under Post-Construction Conditions – Lower Cooks River Floodplain – PMF (2 Sheets)
5.18 Impact of 2100 Sea Level Rise Conditions on Flooding Behaviour under Post-Construction Conditions – Lower Cooks River Floodplain – PMF (2 Sheets)
6.1 Impact of Assessed Flood Mitigation Works in Kogarah Golf Course on FloodingBehaviour – 100 year ARI
WestConnex New M5 EISTechnical Working Paper: Flooding
WCXM5_Flooding_Rev 1.8_19112015.doc Page v Lyall & AssociatesNovember 2015 Rev. 1.8
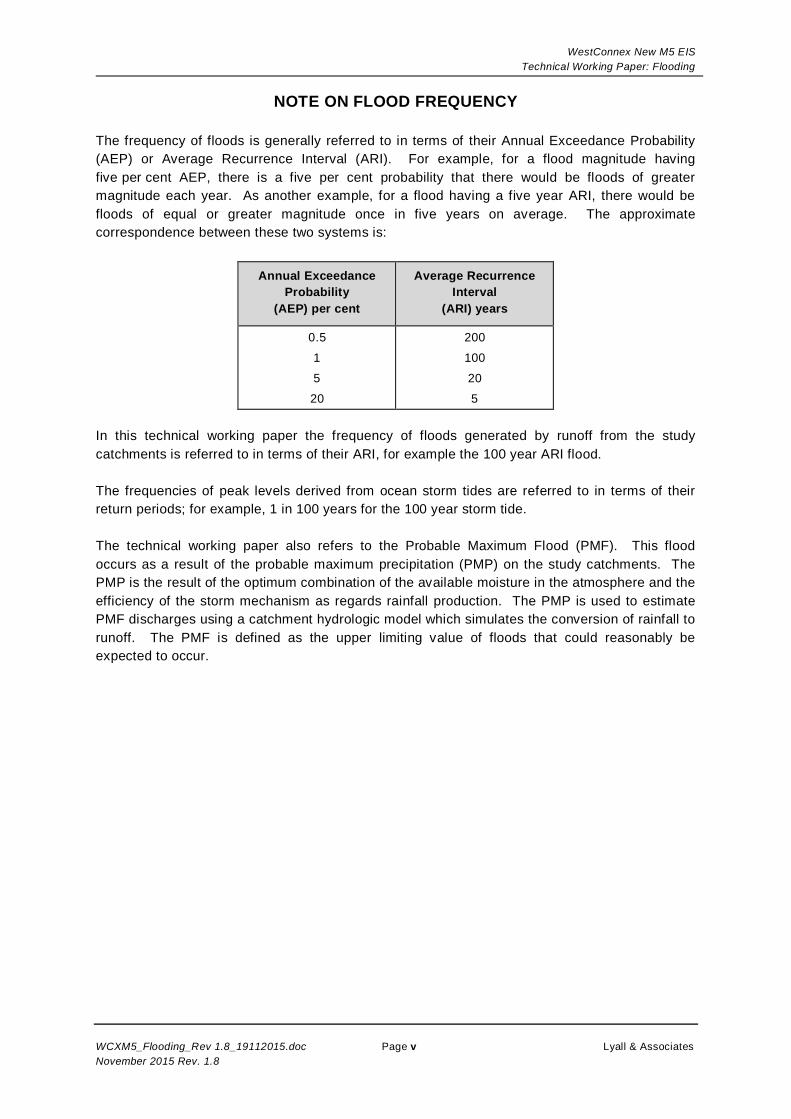
NOTE ON FLOOD FREQUENCY
The frequency of floods is generally referred to in terms of their Annual Exceedance Probability(AEP) or Average Recurrence Interval (ARI). For example, for a flood magnitude havingfive per cent AEP, there is a five per cent probability that there would be floods of greatermagnitude each year. As another example, for a flood having a five year ARI, there would befloods of equal or greater magnitude once in five years on average. The approximatecorrespondence between these two systems is:
Annual ExceedanceProbability
(AEP) per cent
Average RecurrenceInterval
(ARI) years
0.5
1
5
20
200
100
20
5
In this technical working paper the frequency of floods generated by runoff from the studycatchments is referred to in terms of their ARI, for example the 100 year ARI flood.
The frequencies of peak levels derived from ocean storm tides are referred to in terms of theirreturn periods; for example, 1 in 100 years for the 100 year storm tide.
The technical working paper also refers to the Probable Maximum Flood (PMF). This floodoccurs as a result of the probable maximum precipitation (PMP) on the study catchments. ThePMP is the result of the optimum combination of the available moisture in the atmosphere and theefficiency of the storm mechanism as regards rainfall production. The PMP is used to estimatePMF discharges using a catchment hydrologic model which simulates the conversion of rainfall torunoff. The PMF is defined as the upper limiting value of floods that could reasonably beexpected to occur.

WestConnex New M5 EISTechnical Working Paper: Flooding
WCXM5_Flooding_Rev 1.8_19112015.doc Page vi Lyall & AssociatesNovember 2015 Rev. 1.8
(blank page)
WestConnex New M5 EISTechnical Working Paper: Flooding
WCXM5_Flooding_Rev 1.8_19112015.doc Page vii Lyall & AssociatesNovember 2015 Rev. 1.8
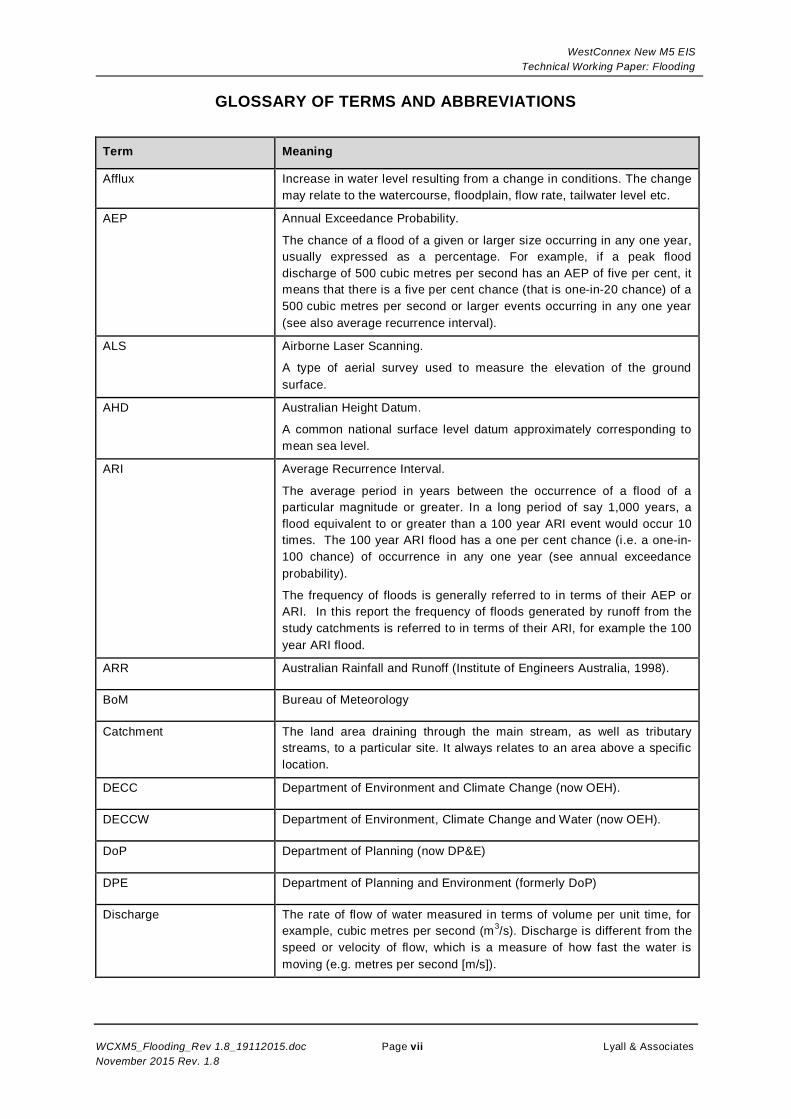
GLOSSARY OF TERMS AND ABBREVIATIONS
Term Meaning
Afflux Increase in water level resulting from a change in conditions. The changemay relate to the watercourse, floodplain, flow rate, tailwater level etc.
AEP Annual Exceedance Probability.
The chance of a flood of a given or larger size occurring in any one year,usually expressed as a percentage. For example, if a peak flooddischarge of 500 cubic metres per second has an AEP of five per cent, itmeans that there is a five per cent chance (that is one-in-20 chance) of a500 cubic metres per second or larger events occurring in any one year(see also average recurrence interval).
ALS Airborne Laser Scanning.
A type of aerial survey used to measure the elevation of the groundsurface.
AHD Australian Height Datum.
A common national surface level datum approximately corresponding tomean sea level.
ARI Average Recurrence Interval.
The average period in years between the occurrence of a flood of aparticular magnitude or greater. In a long period of say 1,000 years, aflood equivalent to or greater than a 100 year ARI event would occur 10times. The 100 year ARI flood has a one per cent chance (i.e. a one-in-100 chance) of occurrence in any one year (see annual exceedanceprobability).
The frequency of floods is generally referred to in terms of their AEP orARI. In this report the frequency of floods generated by runoff from thestudy catchments is referred to in terms of their ARI, for example the 100year ARI flood.
ARR Australian Rainfall and Runoff (Institute of Engineers Australia, 1998).
BoM Bureau of Meteorology
Catchment The land area draining through the main stream, as well as tributarystreams, to a particular site. It always relates to an area above a specificlocation.
DECC Department of Environment and Climate Change (now OEH).
DECCW Department of Environment, Climate Change and Water (now OEH).
DoP Department of Planning (now DP&E)
DPE Department of Planning and Environment (formerly DoP)
Discharge The rate of flow of water measured in terms of volume per unit time, forexample, cubic metres per second (m3/s). Discharge is different from thespeed or velocity of flow, which is a measure of how fast the water ismoving (e.g. metres per second [m/s]).
WestConnex New M5 EISTechnical Working Paper: Flooding
WCXM5_Flooding_Rev 1.8_19112015.doc Page viii Lyall & AssociatesNovember 2015 Rev. 1.8
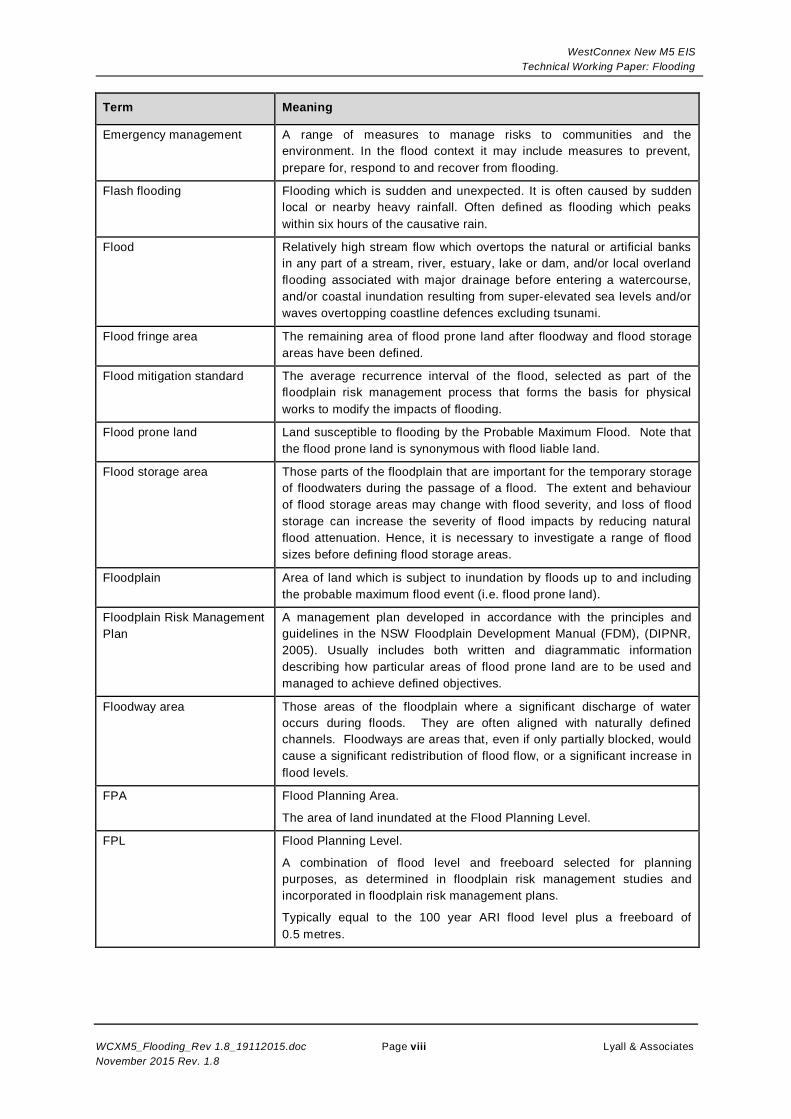
Term Meaning
Emergency management A range of measures to manage risks to communities and theenvironment. In the flood context it may include measures to prevent,prepare for, respond to and recover from flooding.
Flash flooding Flooding which is sudden and unexpected. It is often caused by suddenlocal or nearby heavy rainfall. Often defined as flooding which peakswithin six hours of the causative rain.
Flood Relatively high stream flow which overtops the natural or artificial banksin any part of a stream, river, estuary, lake or dam, and/or local overlandflooding associated with major drainage before entering a watercourse,and/or coastal inundation resulting from super-elevated sea levels and/orwaves overtopping coastline defences excluding tsunami.
Flood fringe area The remaining area of flood prone land after floodway and flood storageareas have been defined.
Flood mitigation standard The average recurrence interval of the flood, selected as part of thefloodplain risk management process that forms the basis for physicalworks to modify the impacts of flooding.
Flood prone land Land susceptible to flooding by the Probable Maximum Flood. Note thatthe flood prone land is synonymous with flood liable land.
Flood storage area Those parts of the floodplain that are important for the temporary storageof floodwaters during the passage of a flood. The extent and behaviourof flood storage areas may change with flood severity, and loss of floodstorage can increase the severity of flood impacts by reducing naturalflood attenuation. Hence, it is necessary to investigate a range of floodsizes before defining flood storage areas.
Floodplain Area of land which is subject to inundation by floods up to and includingthe probable maximum flood event (i.e. flood prone land).
Floodplain Risk ManagementPlan
A management plan developed in accordance with the principles andguidelines in the NSW Floodplain Development Manual (FDM), (DIPNR,2005). Usually includes both written and diagrammatic informationdescribing how particular areas of flood prone land are to be used andmanaged to achieve defined objectives.
Floodway area Those areas of the floodplain where a significant discharge of wateroccurs during floods. They are often aligned with naturally definedchannels. Floodways are areas that, even if only partially blocked, wouldcause a significant redistribution of flood flow, or a significant increase inflood levels.
FPA Flood Planning Area.
The area of land inundated at the Flood Planning Level.
FPL Flood Planning Level.
A combination of flood level and freeboard selected for planningpurposes, as determined in floodplain risk management studies andincorporated in floodplain risk management plans.
Typically equal to the 100 year ARI flood level plus a freeboard of0.5 metres.
WestConnex New M5 EISTechnical Working Paper: Flooding
WCXM5_Flooding_Rev 1.8_19112015.doc Page ix Lyall & AssociatesNovember 2015 Rev. 1.8
Term Meaning
Freeboard A factor of safety typically used in relation to the setting of floor levels,levee crest levels, etc. It is usually expressed as the difference in heightbetween the adopted Flood Planning Level and the peak height of theflood used to determine the flood planning level. Freeboard provides afactor of safety to compensate for uncertainties in the estimation of floodlevels across the floodplain, such as wave action, localised hydraulicbehaviour and impacts that are specific event related, such as levee andembankment settlement, and other effects such as “greenhouse” andclimate change. Freeboard is included in the Flood Planning Level.
GPT Gross pollutant trap.
A device designed to capture pollutants in stormwater runoff prior todischarge into the receiving system. GPT’s are typically designed tocapture litter and debris but may also capture hydrocarbons, suspendedsediments and particle bound pollutants such as nitrogen, phosphorusand heavy metals.
GSDM Generalised Short Duration Method.
A method for estimating the Probable Maximum Precipitation forcatchments up to 1,000 square kilometres in area.
HHWSS Highest High Water Solstice Spring.
The tide level reached on average once or twice per year.
Hazard A source of potential harm or a situation with a potential to cause loss. Inrelation to the NSW Floodplain Development Manual (FDM), (DIPNR,2005) the hazard is flooding which has the potential to cause damage tothe community.
Headwater The upper reaches of a drainage system.
Hydraulics The term given to the study of water flow in waterways, in particular theevaluation of flow parameters such as water level and velocity.
Hydrograph A graph which shows how the discharge or stage/flood level at anyparticular location varies with time during a flood.
Hydrology The term given to the study of the rainfall and runoff process; inparticular, the evaluation of peak flows, flow volumes and the derivationof hydrographs for a range of floods.
Mathematical/computermodels
The mathematical representation of the physical processes involved inrunoff generation and stream flow. These models are often run oncomputers due to the complexity of the mathematical relationshipsbetween runoff, stream flow and the distribution of flows across thefloodplain.
Merits based approach The merits based approach weighs social, economic, ecological andcultural impacts of land use options for different flood prone areastogether with flood damage, hazard and behaviour implications, andenvironmental protection and well-being of the State’s rivers andfloodplains.
OEH Office of Environment and Heritage (formerly DECCW)
Overland flooding Inundation by local runoff rather than overbank discharge from a stream,river, estuary, lake or dam.
Peak discharge The maximum discharge occurring during a flood event.
WestConnex New M5 EISTechnical Working Paper: Flooding
WCXM5_Flooding_Rev 1.8_19112015.doc Page x Lyall & AssociatesNovember 2015 Rev. 1.8
Term Meaning
Peak flood level The maximum water level occurring during a flood event.
PMF Probable Maximum Flood
The flood that occurs as a result of the Probable Maximum Precipitation(PMP) on a study catchment. The PMF is the largest flood that couldconceivably occur at a particular location, usually estimated fromprobable maximum precipitation coupled with the worst flood producingcatchment conditions. Generally, it is not physically or economicallypossible to provide complete protection against this event. The PMFdefines the extent of flood prone land (i.e. the floodplain).
PMP Probable Maximum Precipitation.
The PMP is the result of the optimum combination of the availablemoisture in the atmosphere and the efficiency of the storm mechanism asregards rainfall production. The PMP is used to estimate PMFdischarges using a catchment hydrologic model which simulates theconversion of rainfall to runoff.
PRM Probabilistic Rational Method
Probability A statistical measure of the expected chance of flooding (see annualexceedance probability).
RCBC Reinforced Concrete Box Culvert
RCP Reinforced Concrete Pipe
Risk Chance of something happening that will have an impact. It is measuredin terms of consequences and likelihood. In the context of the manual itis the likelihood of consequences arising from the interaction of floods,communities and the environment.
RL Reduced Level. The reduced level is the vertical distance between anelevation and an adopted datum plane such as the Australian HeightDatum (AHD).
Roads and Maritime NSW Roads and Maritime Services
Runoff The amount of rainfall which actually ends up as stream flow, also knownas rainfall excess.
Stage Equivalent to water level (both measured with reference to a specifieddatum)
SW Sydney Water
Flow Velocity A measure of how fast water is moving (e.g. metres per second [m/s]).
Water surface profile A graph showing the flood stage at any given location along awatercourse at a particular time.
WDA WestConnex Delivery Authority
WestConnex New M5 EISTechnical Working Paper: Flooding
WCXM5_Flooding_Rev 1.8_19112015.doc Page ES1 Lyall & AssociatesNovember 2015 Rev. 1.8
EXECUTIVE SUMMARY
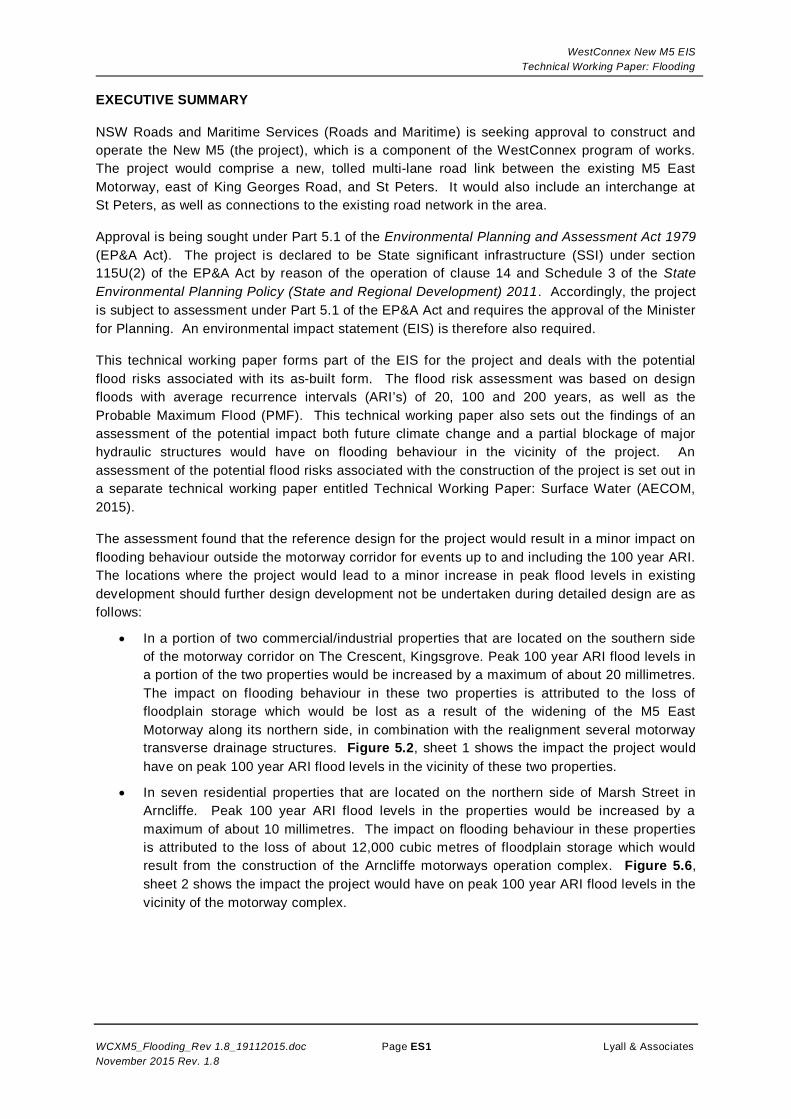
NSW Roads and Maritime Services (Roads and Maritime) is seeking approval to construct andoperate the New M5 (the project), which is a component of the WestConnex program of works.The project would comprise a new, tolled multi-lane road link between the existing M5 EastMotorway, east of King Georges Road, and St Peters. It would also include an interchange atSt Peters, as well as connections to the existing road network in the area.
Approval is being sought under Part 5.1 of the Environmental Planning and Assessment Act 1979(EP&A Act). The project is declared to be State significant infrastructure (SSI) under section115U(2) of the EP&A Act by reason of the operation of clause 14 and Schedule 3 of the StateEnvironmental Planning Policy (State and Regional Development) 2011. Accordingly, the projectis subject to assessment under Part 5.1 of the EP&A Act and requires the approval of the Ministerfor Planning. An environmental impact statement (EIS) is therefore also required.
This technical working paper forms part of the EIS for the project and deals with the potentialflood risks associated with its as-built form. The flood risk assessment was based on designfloods with average recurrence intervals (ARI’s) of 20, 100 and 200 years, as well as theProbable Maximum Flood (PMF). This technical working paper also sets out the findings of anassessment of the potential impact both future climate change and a partial blockage of majorhydraulic structures would have on flooding behaviour in the vicinity of the project. Anassessment of the potential flood risks associated with the construction of the project is set out ina separate technical working paper entitled Technical Working Paper: Surface Water (AECOM,2015).
The assessment found that the reference design for the project would result in a minor impact onflooding behaviour outside the motorway corridor for events up to and including the 100 year ARI.The locations where the project would lead to a minor increase in peak flood levels in existingdevelopment should further design development not be undertaken during detailed design are asfollows:
· In a portion of two commercial/industrial properties that are located on the southern sideof the motorway corridor on The Crescent, Kingsgrove. Peak 100 year ARI flood levels ina portion of the two properties would be increased by a maximum of about 20 millimetres.The impact on flooding behaviour in these two properties is attributed to the loss offloodplain storage which would be lost as a result of the widening of the M5 EastMotorway along its northern side, in combination with the realignment several motorwaytransverse drainage structures. Figure 5.2, sheet 1 shows the impact the project wouldhave on peak 100 year ARI flood levels in the vicinity of these two properties.
· In seven residential properties that are located on the northern side of Marsh Street inArncliffe. Peak 100 year ARI flood levels in the properties would be increased by amaximum of about 10 millimetres. The impact on flooding behaviour in these propertiesis attributed to the loss of about 12,000 cubic metres of floodplain storage which wouldresult from the construction of the Arncliffe motorways operation complex. Figure 5.6,sheet 2 shows the impact the project would have on peak 100 year ARI flood levels in thevicinity of the motorway complex.
WestConnex New M5 EISTechnical Working Paper: Flooding
WCXM5_Flooding_Rev 1.8_19112015.doc Page ES2 Lyall & AssociatesNovember 2015 Rev. 1.8
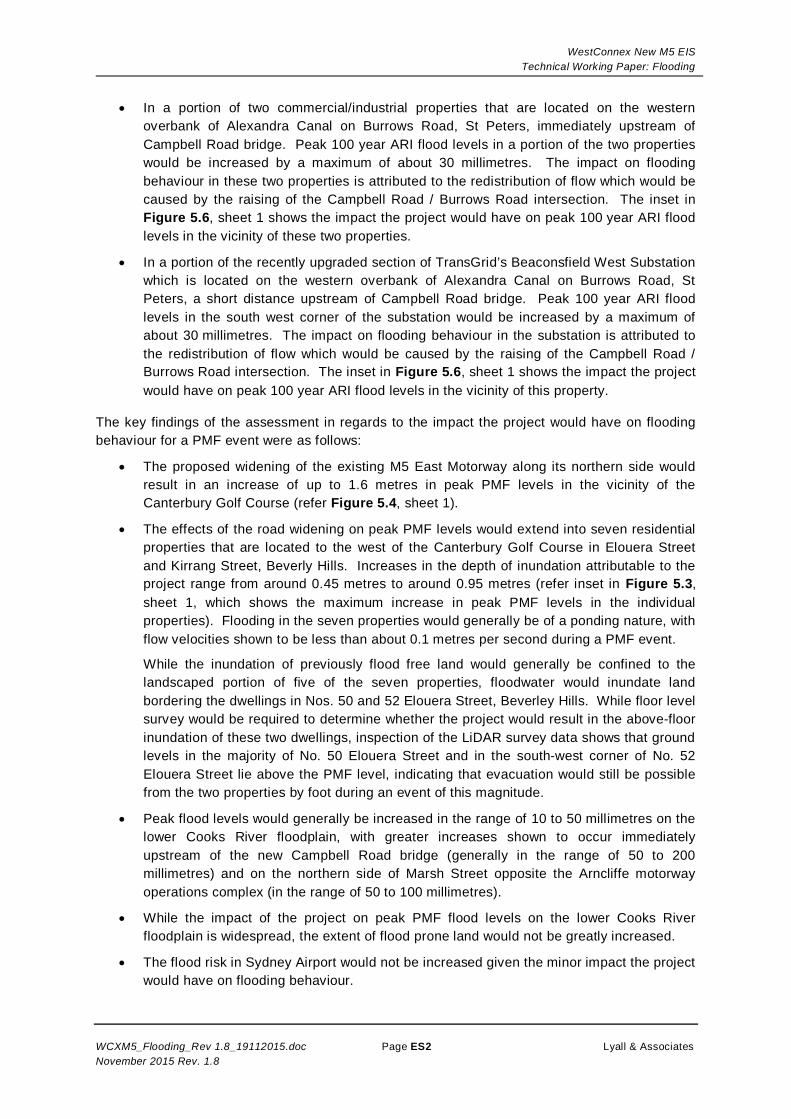
· In a portion of two commercial/industrial properties that are located on the westernoverbank of Alexandra Canal on Burrows Road, St Peters, immediately upstream ofCampbell Road bridge. Peak 100 year ARI flood levels in a portion of the two propertieswould be increased by a maximum of about 30 millimetres. The impact on floodingbehaviour in these two properties is attributed to the redistribution of flow which would becaused by the raising of the Campbell Road / Burrows Road intersection. The inset inFigure 5.6, sheet 1 shows the impact the project would have on peak 100 year ARI floodlevels in the vicinity of these two properties.
· In a portion of the recently upgraded section of TransGrid’s Beaconsfield West Substationwhich is located on the western overbank of Alexandra Canal on Burrows Road, StPeters, a short distance upstream of Campbell Road bridge. Peak 100 year ARI floodlevels in the south west corner of the substation would be increased by a maximum ofabout 30 millimetres. The impact on flooding behaviour in the substation is attributed tothe redistribution of flow which would be caused by the raising of the Campbell Road /Burrows Road intersection. The inset in Figure 5.6, sheet 1 shows the impact the projectwould have on peak 100 year ARI flood levels in the vicinity of this property.
The key findings of the assessment in regards to the impact the project would have on floodingbehaviour for a PMF event were as follows:
· The proposed widening of the existing M5 East Motorway along its northern side wouldresult in an increase of up to 1.6 metres in peak PMF levels in the vicinity of theCanterbury Golf Course (refer Figure 5.4, sheet 1).
· The effects of the road widening on peak PMF levels would extend into seven residentialproperties that are located to the west of the Canterbury Golf Course in Elouera Streetand Kirrang Street, Beverly Hills. Increases in the depth of inundation attributable to theproject range from around 0.45 metres to around 0.95 metres (refer inset in Figure 5.3,sheet 1, which shows the maximum increase in peak PMF levels in the individualproperties). Flooding in the seven properties would generally be of a ponding nature, withflow velocities shown to be less than about 0.1 metres per second during a PMF event.
While the inundation of previously flood free land would generally be confined to thelandscaped portion of five of the seven properties, floodwater would inundate landbordering the dwellings in Nos. 50 and 52 Elouera Street, Beverley Hills. While floor levelsurvey would be required to determine whether the project would result in the above-floorinundation of these two dwellings, inspection of the LiDAR survey data shows that groundlevels in the majority of No. 50 Elouera Street and in the south-west corner of No. 52Elouera Street lie above the PMF level, indicating that evacuation would still be possiblefrom the two properties by foot during an event of this magnitude.
· Peak flood levels would generally be increased in the range of 10 to 50 millimetres on thelower Cooks River floodplain, with greater increases shown to occur immediatelyupstream of the new Campbell Road bridge (generally in the range of 50 to 200millimetres) and on the northern side of Marsh Street opposite the Arncliffe motorwayoperations complex (in the range of 50 to 100 millimetres).
· While the impact of the project on peak PMF flood levels on the lower Cooks Riverfloodplain is widespread, the extent of flood prone land would not be greatly increased.
· The flood risk in Sydney Airport would not be increased given the minor impact the projectwould have on flooding behaviour.
WestConnex New M5 EISTechnical Working Paper: Flooding
WCXM5_Flooding_Rev 1.8_19112015.doc Page ES3 Lyall & AssociatesNovember 2015 Rev. 1.8
· The project would not impact existing evacuation routes.
· While the main carriageways of the project lie above peak 100 year ARI flood levels, it isrecommended that more detailed flood modelling be undertaken during detailed design toconfirm finished road levels and the heights of any flood walls which are required toprevent the ingress of floodwater to the road tunnels for events up to the PMF.
The investigation found that the project would not increase the duration of flooding for all eventsup to the PMF.
The impact of a partial blockage of major hydraulic structures on flooding behaviour on theproject would be limited to the Arncliffe motorway operations complex during a 100 year ARIevent (refer Figure 5.11, sheet 2), while increases in peak flood levels would occur in the vicinityof the Arncliffe, St Peters and Burrows Road motorway operations complexes, as well as the StPeters interchange during a PMF event (refer Figure 5.12). It is recommended that considerationbe given during detailed design to the effects a partial blockage of major hydraulic structureswould have on flooding behaviour when setting finished road level and flood wall heights.
The effects of future climate change on flooding behaviour have the potential to impact theproject where it crosses the lower Cooks River floodplain. For example, an increase in rainfallintensity would increase the frequency and depth of inundation in the vicinity of the Arncliffemotorway operations complex (refer Figure 5.14, sheet 2), while a rise in sea level would impactflooding behaviour in the vicinity of the Arncliffe, St Peters and Burrows Road motorwayoperations complexes, as well as the St Peters interchange (refer Figures 5.15 to 5.18). A moredetailed assessment would need to be undertaken during detailed design to determine theclimate change related flood risks to the project and to scope requirements for any managementmeasures. The assessment should be undertaken in accordance with the NSW Government’sPractical Considerations of Climate Change – Floodplain Risk Management Guideline(Department of Environment and Climate Change (DECC), 2007).
A flood management strategy (FMS) would be prepared prior to construction to minimise thepotential project impacts on existing flooding characteristics within its vicinity. The FMS wouldidentify appropriate design standards for managing the flood risk during the construction andoperational phases of the project. It would also include procedures aimed at reducing theflooding threat to human safety and infrastructure, as well as controls that are aimed at mitigatingthe impact of the project (during construction and operation) on flooding behaviour.
To mitigate the increase in flood risk to residential properties north of Marsh Street at Arncliffeduring a 100 year ARI flood, further investigations would be undertaken during detailed design toconfirm the floor levels of impacted properties and determine the final mitigation strategy. Anoption considered in this assessment is to lower ground levels in the northern part of the KogarahGolf Course adjacent to the Arncliffe motorway operations complex. An initial assessment foundthat it would be necessary to lower ground levels by an average of about 200 millimetres acrossthe construction footprint in order to recapture sufficient floodplain storage (estimated to be about8,000 cubic metres) so as not to impact peak flood levels in existing residential development.However, the final design solution and requirement (and extent) for compensatory flood storagewould be determined during detailed design.
WestConnex New M5 EISTechnical Working Paper: Flooding
WCXM5_Flooding_Rev 1.8_19112015.doc Page ES4 Lyall & AssociatesNovember 2015 Rev. 1.8
No measures are proposed which would be aimed at mitigating the impact of the project onflooding behaviour in the vicinity of the Canterbury Golf Course, where seven residentialproperties are affected by increases in peak PMF flood levels of up to around 0.95 metres. Thisis because the project would not affect the development potential of these properties forresidential purposes (i.e. because they lie above the residential Flood Planning Level (FPL),which in the Canterbury local government area is equal to the 100 year ARI flood level plus anallowance of 0.5 metres for freeboard) and self-evacuation would still be possible for all floods upto the PMF. The project would constrain the development potential for at least one residentialproperty in Elouera Street for vulnerable uses such as child or aged care.
Further investigations would be undertaken during detailed design to confirm the floor levels forthe four commercial/industrial properties and TransGrid’s Beaconsfield West Substation whichwould be impacted by the project, and to identify any additional measures that would need to beincorporated into the project design to mitigate the impact of the project on flooding conditions inthese properties.
WestConnex New M5 EISTechnical Working Paper: Flooding
WCXM5_Flooding_Rev 1.8_19112015.doc Page 1 Lyall & AssociatesNovember 2015 Rev. 1.8
1 INTRODUCTION
NSW Roads and Maritime Services (Roads and Maritime) is seeking approval to construct andoperate the New M5 (the project), which would comprise a new, tolled multi-lane road linkbetween the existing M5 East Motorway, east of King Georges Road, and St Peters. The projectwould also include an interchange at St Peters and connections to the existing road network. Theproject is shown in Figure 1.1.
Approval is being sought under Part 5.1 of the Environmental Planning and Assessment Act 1979(EP&A Act). The project is declared to be State significant infrastructure (SSI) under section115U(2) of the EP&A Act by reason of the operation of clause 14 and Schedule 3 of the StateEnvironmental Planning Policy (State and Regional Development) 2011. Accordingly, the projectis subject to assessment under Part 5.1 of the EP&A Act and requires the approval of the Ministerfor Planning. An environmental impact statement (EIS) is therefore also required.
Roads and Maritime is seeking the project to be declared by the Minister for Planning as Statesignificant infrastructure and critical State significant infrastructure under sections 115U(4) and115V of the EP&A Act.
On 11 August 2015, the Commonwealth Minister for the Environment determined that the projecthas the potential to significantly impact on a matter of national environmental significance and istherefore a ‘controlled action’. This means that approval of the project will be required from theCommonwealth Minister for the Environment in addition to environmental and planning approvalsrequired under State legislation.
Under the Bilateral Agreement relating to environmental assessment (February 2015) betweenthe Commonwealth Government and the NSW Government, this EIS has been adopted for thepurpose of meeting the assessment requirements of both the Commonwealth EPBC Act and theNSW EP&A Act.
This technical working paper forms part of the EIS for the project and deals with the potentialflood risks associated with its as-built form.
1.1 Overview of WestConnex
WestConnex is a 33 kilometre motorway that is intended to link Sydney’s west with the airportand the Port Botany precinct. The component projects of the WestConnex program of works are:
· M4 Widening – Pitt Street, Parramatta to Homebush Bay Drive, Homebush (planningapproval granted on 21 December 2014 and under construction)
· M4 East – Homebush Bay Drive, Homebush to Parramatta Road and City West Link(Wattle Street) at Haberfield (planning application lodged and subject to planningapproval)
· New M5 – (the subject of this EIS)
· King Georges Road Interchange Upgrade (planning approval granted on 3 March 2015and under construction)
· M4-M5 Link – Haberfield to St Peters (undergoing concept development and subject toplanning approval)
· Sydney Gateway (is the subject of further investigations by the NSW Government andwould be subject to separate planning approval).
WestConnex New M5 EISTechnical Working Paper: Flooding
WCXM5_Flooding_Rev 1.8_19112015.doc Page 2 Lyall & AssociatesNovember 2015 Rev. 1.8
Separate planning applications have or will be lodged for each component project. Each projectwill be assessed separately, but the impact of each project will also be considered in the contextof the wider WestConnex program of works.
A proposed Southern extension from Arncliffe to Kogarah is currently being investigated by theNSW Government, and would connect the New M5 to the southern and bayside suburbs ofSydney, and the proposed F6 motorway.
The WestConnex Delivery Authority (WDA) was established by the NSW Government to managethe delivery of the WestConnex series of projects for Roads and Maritime on behalf of the State.The WDA was a public subsidiary corporation of the Roads and Maritime. Following theachievement of early milestones for the WestConnex program of works, the NSW Governmenttook the opportunity to evolve this early governance model.
On 1 October 2015 the transfer of the project delivery functions of WDA to Sydney MotorwayCorporation (SMC) was finalised, forming a single decision-making entity to finance and deliverthe WestConnex program of works. SMC is a private corporation, the shareholders of which arethe Minister for Roads, Maritime and Freight and the Treasurer, with a majority independentboard of nine directors.
Roads and Maritime is the Government client agency for the WestConnex program of works. Inthat capacity Roads and Maritime will enter into contractual arrangements with SMC subsidiaryentities which will design, build, own and operate the motorway on behalf of Roads and Maritime.Roads and Maritime and SMC are working together to manage the planning approval process forthe project. However, for the purpose of the planning application for the project, Roads andMaritime is the proponent.
1.2 Overview of the project
Key components of the project would include:
· Twin motorway tunnels between the existing M5 East Motorway (between King GeorgesRoad and Bexley Road) and St Peters. The western portals along the M5 East Motorwaywould be located east of King Georges Road, and the eastern portals at St Peters wouldbe located in the vicinity of the Princes Highway and Canal Road. Each tunnel would beabout nine kilometres in length and would be configured as follows:
- Between the western portals and Arncliffe, the tunnels would be built to be threelanes but marked for two lanes as part of the project. Any change from two lanes tothree lanes would be subject to future environmental assessment and approval
- Between the Arncliffe and St Peters, the tunnels would be built to be five lanes butmarked for two lanes as part of the project. Any change from two lanes to any ofthree, four or five lanes would be subject to future environmental assessment andapproval
· The western portals along the M5 East Motorway would be located east of King GeorgesRoad, and the eastern portals at St Peters would be located in the vicinity of the PrincesHighway and Canal Road
· Tunnel stubs to allow for a potential future connection to the future M4-M5 Link and apotential future connection to southern Sydney
· Surface road widening works along the M5 East Motorway between east of King GeorgesRoad and the new tunnel portals

WestConnex New M5 EISTechnical Working Paper: Flooding
WCXM5_Flooding_Rev 1.8_19112015.doc Page 3 Lyall & AssociatesNovember 2015 Rev. 1.8
· A new road interchange at St Peters, which would initially provide road connections fromthe main alignment tunnels to Campbell Road and Euston Road, St Peters
· Two new road bridges across Alexandra Canal which would connect St Petersinterchange with Gardeners Road and Bourke Road, Mascot
· Closure and remediation of the Alexandria Landfill site, to enable the construction andoperation of the new St Peters interchange
· Works to enhance and upgrade local roads near the St Peters interchange
· Ancillary infrastructure and operational facilities for electronic tolling, signage (includingelectronic signage), ventilation structures and systems, fire and life safety systems, andemergency evacuation and smoke extraction infrastructure
· A motorway control centre that would include operation and maintenance facilities
· New service utilities and modifications to existing service utilities
· Temporary construction facilities and temporary works to facilitate the construction of theproject
· Infrastructure to introduce tolling on the existing M5 East Motorway
· Surface road upgrade works within the corridor of the M5 East Motorway.
Construction activities associated with the project would generally include:
· Commencement of enabling and temporary works, including construction power, watersupply, ancillary site establishment, demolition works, property and utility adjustmentsand public transport modifications (if required)
· Construction of the road tunnels, interchanges, intersections and roadside infrastructure
· Haulage of spoil generated during tunnelling and excavation activities
· Fitout of the road tunnels and support infrastructure, including ventilation and emergencyresponse systems
· Construction and fitout of the motorway control centre and ancillary operations buildings
· Upgrades to surface roads and construction of bridges
· Implementation of environmental management and pollution control facilities for theproject.
Subject to the project obtaining environmental planning approval, construction of the project isanticipated to commence around mid-2016 and is expected to take around three years tocomplete.
The M5 Motorway corridor (the M5 East Motorway and the M5 South West Motorway) is the mainpassenger, commercial and freight corridor between Port Botany, Sydney Airport and south-westSydney. Traffic demands on the M5 East Motorway currently exceed the design capacity of theroadway, and as a result, present a significant bottleneck to the M5 Motorway corridor withmotorists experiencing heavy congestion and unreliable journey times. The project is needed toprovide additional capacity along the M5 Motorway corridor, and would allow for a more robustand reliable transport network.
WestConnex New M5 EISTechnical Working Paper: Flooding
WCXM5_Flooding_Rev 1.8_19112015.doc Page 4 Lyall & AssociatesNovember 2015 Rev. 1.8
Figure 1.1 provides an overview of the location and catchment plan for the project. Figure 1.2and Figure 1.3 depict the key features of the project within the Upper Wolli Creek and LowerCooks River floodplains. Figure 1.4 provides an overview of the project that is the subject of thisapplication.
1.3 Project location
The project would be located within the Canterbury, Hurstville, Rockdale, Marrickville, Sydneyand Botany Bay local government areas. The project corridor is located from about five to twentykilometres to the south and south-west of the central business district of Sydney. The projectwould traverse the suburbs of Beverly Hills, Kingsgrove, Bexley North, Earlwood, Bardwell Park,Bardwell Valley, Arncliffe, Wolli Creek, Tempe, Sydenham, St Peters, Alexandria and Mascot.
1.4 Secretary’s Environmental Assessment Requirements
The Secretary’s Environmental Assessment Requirements (SEARS) for the project were issuedon 5 March 2015, and re-issued on 26 August 2015, by the Department of Planning andEnvironment (DPE). The requirements relevant to flooding are as follows:
“identification of potential impacts of the proposal on existing flood regimes, consistentwith the Floodplain Development Manual (Department of Natural Resources, 2005),including impacts to existing receivers and infrastructure and the future floodmitigation options for and development potential of affected land, demonstratingconsideration of the changes to rainfall frequency and/or intensity as a result ofclimate change on the proposal. The assessment must demonstrate that dueconsideration of flood risks during construction and in the proposal design;”
This technical working paper forms part of the EIS for the project and deals with the potentialflood risks associated with its as-built form. The findings of a similar assessment which wasundertaken into the potential flood risks associated with the construction phase of the project areset out in a separate technical working paper entitled Technical Working Paper: Surface Water(AECOM, 2015).
The key objectives of the flood risk assessment were to:
· Identify the flood risk to the project in its as-built form over the full range of potential floodevents.
· Identify the potential impacts of the project on flooding behaviour in areas outside theproject corridor.
· Identify measures aimed at reducing the flood risk to the project.
· Identify measures aimed at mitigating the impacts of the project on flooding behaviour inareas outside the project corridor.
1.5 Study area
The project is located in the Cooks River catchment, as shown on Figure 1.1. Works located inthe vicinity of the tunnel portals have the potential to impact flooding behaviour on the main armof the river near its outlet to Botany Bay, as well as two of its major tributaries, Wolli Creek andSheas Creek / Alexandra Canal. Figures 1.2 and 1.3 show the key features of the project on theupper Wolli Creek and lower Cooks River floodplains, respectively.
WestConnex New M5 EISTechnical Working Paper: Flooding
WCXM5_Flooding_Rev 1.8_19112015.doc Page 5 Lyall & AssociatesNovember 2015 Rev. 1.8
1.6 Report structure
Chapter 2 sets out the flood related statutory and policy context for the project, as well as severalindustry guidelines that are relevant to the flooding investigation. This chapter also sets out howthe relevant government policies and industry guidelines have been taken into account as part ofthe assessment.
Chapter 3 sets out the methodology that has been adopted in the definition of flooding behaviourin the vicinity of the project and also the impact the project would have on flooding behaviour.Also presented in this chapter of the technical working paper is the methodology which has beenadopted for assessing the impact a partial blockage of major hydraulic structures and also futureclimate change (both sea level rise and increases in rainfall intensity) would have on floodingbehaviour under post-construction conditions. The methodology adopted for assessing measuresaimed at mitigating the impact of the project on flooding and also the impact flooding has on theproject is also presented in this chapter of the technical working paper.
Chapter 4 contains a brief description of the Cooks River catchment within which the project islocated. This chapter of the technical working paper also provides a description of floodingbehaviour in the vicinity of the project under present day (i.e. pre-project) conditions.
Chapter 5 presents the findings of an assessment which was undertaken into the impact theproject would have on flooding behaviour. Also presented in this chapter of the report is anassessment of the impact flooding would have on the project and also the key findings of ananalysis which was undertaken to test the sensitivity of flooding behaviour to a partial blockage ofmajor hydraulic structures, as well as potential changes in rainfall intensity and a rise in sea levelassociated with future climate change.
Chapter 6 deals with the findings of a preliminary assessment of measures which are aimed atmitigating the impacts of the project on flooding conditions in adjacent development.
Chapter 7 contains a list of references cited in this technical working paper.
Appendices A and B of this technical working paper contain background to the development andtesting of the flood models that were used to define flooding behaviour on the upper Wolli Creekand lower Cooks River floodplains, respectively.
Appendix C contains a summary of peak flows in the drainage systems of both the upper WolliCreek and lower Cooks River floodplains.
The scales on figures referred to in this technical working paper are applicable when printed atA3 size. The figures referred to in the main body of this technical working paper are located afterChapter 7 of this report.

WestConnex New M5 EISTechnical Working Paper: Flooding
WCXM5_Flooding_Rev 1.8_19112015.doc Page 6 Lyall & AssociatesNovember 2015 Rev. 1.8
(blank page)
WestConnex New M5 EISTechnical Working Paper: Flooding
WCXM5_Flooding_Rev 1.8_19112015.doc Page 7 Lyall & AssociatesNovember 2015 Rev. 1.8
2 STATUTORY AND POLICY CONTEXT
2.1 Relevant Government policies and industry guidelines
Government policies and guidelines that have been considered as part of the current assessment(arranged in date order) include:
· Flood Prone Land Policy (NSW Government).
· Section 117(2) Local Planning Direction 4.3 Flood Prone Land (NSW Government).
· Planning circular PS 07-003 New guideline and changes to section 117 direction and(Environmental Planning and Assessment Regulation on flood prone land (NSWGovernment).
· Guideline on Development Controls on Low Flood Risk Areas (NSW Government).
· Sydney Regional Environmental Plan No.33 - Cooks Cove.
· Australian Rainfall and Runoff (AR&R) (Institution of Engineers Australia (IEAust), 1998).
· The Estimation of Probable Maximum Precipitation in Australia: Generalised Short-Duration Method (Bureau of Meteorology (BoM), 2003).
· Floodplain Development Manual (Department of Infrastructure, Planning and NaturalResources (DIPNR), 2005).
· Floodplain Risk Management Guideline – Practical Considerations of Climate Change(Department of Environment and Climate Change (DECC), 2007).
· Derivation of the NSW Government’s Sea Level Rise Planning Benchmarks. TechnicalNote (Department of Environment, Climate Change and Water (DECCW), 2009).
· Coastal Planning Guideline – Adapting to Sea Level Rise (Department of Planning (DoP),2010).
· Coastal Risk Management Guideline – Incorporating Sea Level Rise Benchmarks inCoastal Risk Assessments (DoP, 2010).
· Flood Risk Management Guide: Incorporating Sea Level Rise Benchmarks in Flood RiskAssessments (DECCW, 2010).
· Canterbury Local Environmental Plan 2012.
· Canterbury Development Control Plan 2012 (Canterbury City Council, 2012).
· Hurstville Local Environmental Plan 2012.
· Hurstville Development Control Plan 1- LGA Wide DCP (Hurstville City Council, 2012).
· Requirements for Overland Flow Studies – Fact Sheet (Hurstville City Council).
· Rockdale Local Environmental Plan 2011.
· Rockdale Development Control Plan 2011 (Rockdale City Council, 2011).
· Marrickville Local Environmental Plan 2011.
· Marrickville Development Control Plan 2011 (Marrickville City Council, 2011).
· Sydney Local Environmental Plan.
· Sydney Development Control Plan (City of Sydney Council, 2012).
· Botany Bay Local Environmental Plan 2013.
· Botany Bay City Council Development Control Plan 2013 (Botany Bay City Council,2013).
WestConnex New M5 EISTechnical Working Paper: Flooding
WCXM5_Flooding_Rev 1.8_19112015.doc Page 8 Lyall & AssociatesNovember 2015 Rev. 1.8
· Stormwater Management Technical Guidelines – December 2013 (Botany Bay CityCouncil, 2013).
· AR&R Revision Projects – Project 11 – Blockage of Hydraulic Structures (EngineersAustralia (EA), 2013).
2.2 Floodplain Development Manual
The Floodplain Development Manual (FDM) incorporates the NSW Government’s Flood ProneLand Policy, the primary objectives of which are to reduce the impact of flooding and flood liabilityon owners and occupiers of flood prone property and to reduce public and private losses resultingfrom floods, whilst also recognising the benefits of use, occupation and development of floodprone land.
The FDM forms the NSW Government’s primary technical guidance for the development ofsustainable strategies to support human occupation and use of the floodplain, and promotesstrategic consideration of key issues including safety to people, management of potential damageto property and infrastructure, and management of cumulative impacts of development.Importantly, the FDM promotes the concept that proposed developments be treated on their meritrather than through the imposition of rigid and prescriptive criteria.
Flood and floodplain risk management studies undertaken by local councils as part of the NSWGovernment’s Floodplain Management Program are carried out in accordance with the meritsbased approach promoted by the FDM. A similar merits based approach has been adopted in theassessment of the impacts the project would have on existing flood behaviour and also in thedevelopment of a range of potential measures which would be aimed at mitigating the impact ofthe project on the existing environment.
2.3 State Government planning directions and guidelines
In January 2007 the NSW Department of Planning (DOP) issued Planning circular PS 07-003"New guideline and changes to section 117 direction and (Environmental Planning andAssessment Regulation on flood prone land” which provided an overview of its new guideline tothe FDM titled Guideline on Development Controls on Low Flood Risk Areas and changes to theEnvironmental Planning and Assessment Regulation 2000 and section 117 Direction on floodprone land. More specifically, the circular provided advice on a package of changes concerningflood-related development controls on residential development on land above the 100 year ARIflood and up to the PMF. These areas are sometimes known as low flood risk areas.
Guideline on Development Controls on Low Flood Risk Areas confirmed that unless there areexceptional circumstances, councils should adopt the 100 year ARI flood as the basis for derivingthe Flood Planning Level (FPL) for residential development. In proposing a case for exceptionalcircumstances, a council would need to demonstrate that a different FPL was required for themanagement of residential development due to local flood behaviour, flood history, associatedflood hazards or a particular historic flood. The guideline also notes that, unless there areexceptional circumstances, councils should not impose flood related development controls onresidential development on land above the residential FPL (low flood risk areas). However, theguideline does acknowledge that controls may need to apply to critical infrastructure (such ashospitals) and consideration given to evacuation routes and vulnerable developments (likenursing homes) in areas above the 100 year ARI flood.
WestConnex New M5 EISTechnical Working Paper: Flooding
WCXM5_Flooding_Rev 1.8_19112015.doc Page 9 Lyall & AssociatesNovember 2015 Rev. 1.8
In July 2007 the NSW Government’s Minister for Planning issued a list of directions to localcouncils under section 117(2) of the Environmental Planning and Assessment Act 1979.Direction 4.3 - Flood Prone Land applies to all councils that contain flood prone land within theirLGA and requires that:
· A draft Local Environmental Plan (LEP) shall include provisions that give effect to and areconsistent with the NSW Flood Prone Land Policy and the principles of the FDM(including the Guideline on Development Controls on Low Flood Risk Areas).
· A draft LEP shall not rezone land within the flood planning areas from Special Use,Special Purpose, Recreation, Rural or Environmental Protection Zones to a Residential,Business, Industrial, Special Use or Special Purpose Zone.
· A draft LEP shall not contain provisions that apply to the flood planning areas which:
- permit development in floodway areas,
- permit development that will result in significant flood impacts to other properties,
- permit a significant increase in the development of that land,
- are likely to result in a substantially increased requirement for government spendingon flood mitigation measures, infrastructure or services, or
- permit development to be carried out without development consent except for thepurposes of agriculture (not including dams, drainage canals, levees, buildings orstructures in floodways or high hazard areas), roads or exempt development.
· A draft LEP must not impose flood related development controls above the residentialflood planning level for residential development on land, unless a council providesadequate justification for those controls to the satisfaction of the Director-General (or anofficer of the Department nominated by the Director-General).
· For the purposes of a draft LEP, a council must not determine a flood planning level thatis inconsistent with the FDM (including the Guideline on Development Controls on LowFlood Risk Areas) unless a council provides adequate justification for the proposeddeparture from that Manual to the satisfaction of the Director-General (or an officer of theDepartment nominated by the Director-General).
Based on the above requirements, the assessment of the impacts the project would have onexisting flood behaviour and also the future development potential of flood affected land outsidethe project corridor relates to all storms with ARI’s up to 100 years in the case of residential typedevelopment (and by default commercial and industrial type development) and for storms withARI’s greater than 100 years in the case of critical infrastructure (such as hospitals) andvulnerable developments (such as aged care facilities). The key findings of the assessment inthis regard are set out in Section 5.2.
2.4 State Government floodplain risk management guidelines
Scientific evidence shows that climate change would lead to sea level rise and potentiallyincrease flood producing rainfall intensities. The significance of these effects on flood behaviourwould vary depending on geographic location and local topographic conditions. Climate changeimpacts on flood producing rainfall events show a trend for larger scale storms and resultingdepths of rainfall to increase. Future impacts on sea levels are likely to result in a continuation ofthe rise which has been observed over the last 20 years.
WestConnex New M5 EISTechnical Working Paper: Flooding
WCXM5_Flooding_Rev 1.8_19112015.doc Page 10 Lyall & AssociatesNovember 2015 Rev. 1.8
The NSW Government’s Floodplain Risk Management Guideline: Practical Considerations ofClimate Change (DECC, 2007) recommends that until more work is completed in relation to theclimate change impacts on rainfall intensities, sensitivity analyses should be undertaken basedon increases in rainfall intensities ranging between 10 and 30 per cent. Under present dayclimatic conditions, increasing the 100 year ARI design rainfall intensities by 10 per cent wouldproduce about a 200 year ARI flood; and increasing those rainfalls by 30 per cent would produceabout a 500 year ARI flood. On current projections the increase in rainfalls within the design lifeof the project is likely to be around 10 per cent, with the higher value of 30 per cent representingan upper limit. Given that finished road levels for the project generally lie well above the upperenvelope of 100 year ARI flooding, only the impact a 10 per cent increase on 100 year ARIdesign rainfall intensities would have on flooding behaviour was assessed as part of thisinvestigation.
Climate Change 2007: The Physical Science Basis. Summary for Policymakers(Intergovernmental Panel on Climate Change (IPCC, 2007)) includes trends that indicate thataverage global sea level rise (not including ice flow melt) may be between 0.18 to 0.59 metres bybetween 2090 and 2100. Adding to this the ice flow melt uncertainty of up to 0.2 metres gives anadjusted global range of 0.18 to 0.79 metres.
IPCC, 2007 and recent CSIRO modelling (see for example Projected Changes in ClimatologicalForcing Conditions for Coastal Erosion in NSW (McInnes et al, 2007)) indicate that mean sealevels along the NSW coast are expected to rise by more than the global mean. Combining therelevant global and local information indicates that sea level rise on the NSW coast is expected tobe in the range of 0.18 to 0.91 metres by between 2090 and 2100.
In its Floodplain Risk Management Guideline: Practical Considerations of Climate Change(DECC, 2007), the NSW Government recommended sensitivity analyses be undertaken to assessthe potential impact of sea level rise in the range 0.18 to 0.91 metres, dependent on the relevantproject time horizon.
In 2009 the NSW Government released its Sea Level Rise Policy Statement (NSW Government,2009) which supported adaptation to projected sea level rise impacts. The policy statementincluded sea level rise planning benchmarks for use in assessing potential impacts of projectedsea level rise in coastal areas, including flood risk and coastal hazard assessment. Thesebenchmarks were a projected rise in sea level (relative to 1990 mean sea level) of 0.4 metres by2050 and 0.9 metres by 2100, based on work carried out by the Intergovernmental Panel onClimate Change and CSIRO. In its Flood Risk Management Guide: Incorporating Sea Level RiseBenchmarks in Flood Risk Assessments (DECCW, 2010), the NSW Government recommendedthat these benchmark rises should be used to assess the sensitivity of flood behaviour to futuresea level rise.
In 2012 the NSW Government announced its Stage 1 Coastal Management Reforms (NSWGovernment, 2012). As part of these reforms, the NSW Government no longer recommendsstate-wide sea level rise benchmarks, with local councils now having the flexibility to considerlocal conditions when determining local future hazards.
In the absence of a formal State Government policy on sea level rise benchmarks, the previouslyrecommended rises in sea level of 0.4 metres by 2050 and 0.9 metres by 2100 have beenadopted for assessing the impact future climate change could have on flooding conditions in thevicinity of the project. The key findings of the assessment in this regard are set out inSection 5.5.
WestConnex New M5 EISTechnical Working Paper: Flooding
WCXM5_Flooding_Rev 1.8_19112015.doc Page 11 Lyall & AssociatesNovember 2015 Rev. 1.8
The Floodplain Risk Management Guideline: Practical Considerations of Climate Change (DECC,2007) also contains guidance on strategies which are aimed at managing the impact of futureclimate change on both existing and proposed development. The guideline includes severalexamples on how to deal with the ramifications of future climate change which are dependent onlocation and the potential to effectively and practically manage its impact.
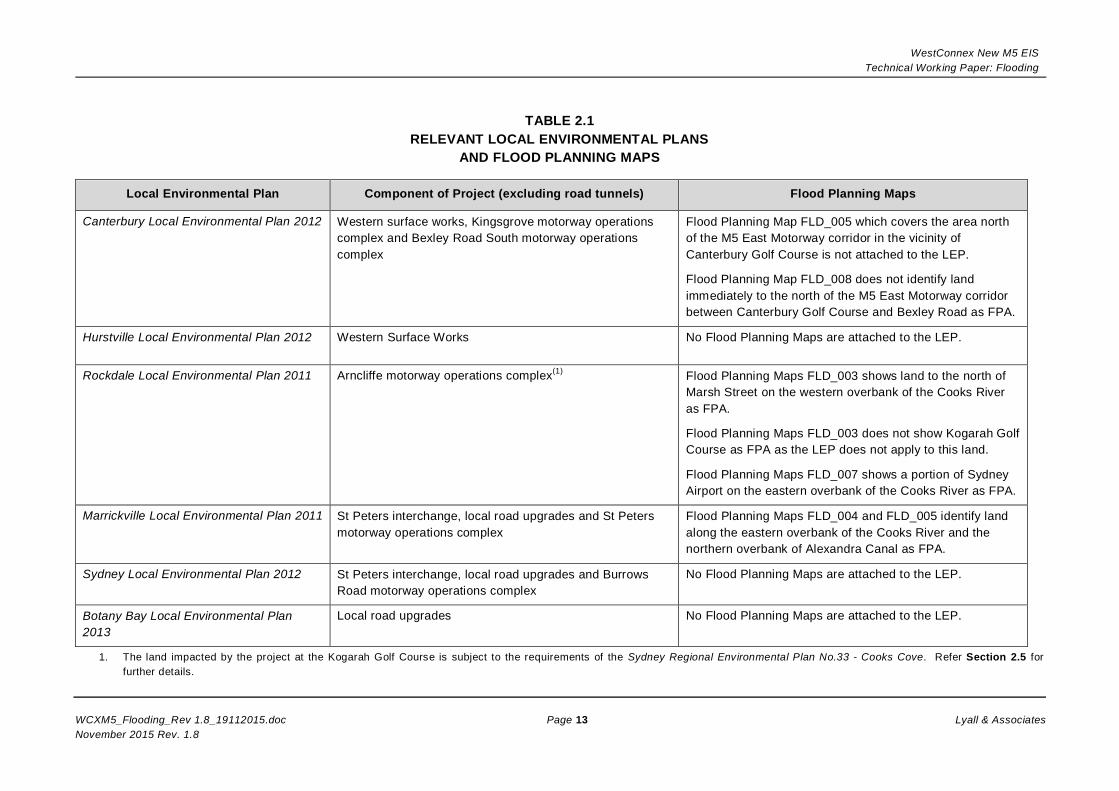
2.5 Flood related planning controls
The western end of the project is located in the local government areas (LGA’s) of Canterbury,Hurstville and Rockdale, while the eastern end of the project is located in the LGA’s of BotanyBay, Marrickville and Sydney. While the level of documentation differs between the variouscouncils, the Flood Planning Level (FPL) for residential development is in all cases equal to thepeak 100 year ARI flood level plus 0.5 metres for properties subject to main stream flooding.Botany Bay, Hurstville and Marrickville councils also incorporate a reduced freeboard allowanceof 0.3 metres in areas subject to overland flow.
The above approach is consistent with the NSW Government’s Guideline on DevelopmentControls on Low Flood Risk Areas which confirms that unless there are exceptionalcircumstances, councils should adopt the 100 year ARI flood as basis for deriving the FPL forresidential development. Table 2.1 over the page lists the LEP for each council and notes whichof these contains Flood Planning Maps showing the presence of flood affected land at thewestern and eastern ends of the project. Note that the Flood Planning Area (FPA) is defined asland which lies below the FPL.
While all councils require that site specific flood studies be undertaken in accordance with theFDM, City of Sydney Council includes the requirement that studies be undertaken in accordancewith the NSW Coastal Planning Guideline: Adapting to Sea Level Rise (DoP, 2010), the CoastalRisk Management Guideline: Incorporating Sea Level Rise Benchmarks in Coastal RiskAssessments (DoP, 2010) and the Flood Risk Management Guide: Incorporating Sea Level RiseBenchmarks in Flood Risk Assessments (DECCW, 2010).
It is noted that Kogarah Golf Course lies within the area covered by the Sydney RegionalEnvironmental Plan No 33 – Cooks Cove, a deemed State Environmental Planning Policy.Rockdale City Council is the consent authority for the purpose of this plan, except as providedotherwise by the EP&A Act. The following clauses set out in the plan relate to flooding:
Clause 18 titled “Environmental management – special requirements”
“(e) the proposed development will be carried out in a manner that minimises floodrisk to both people and property, but has due regard to environmental considerations,and
(f) changes in local flow regimes due to development will be minimised, …”
WestConnex New M5 EISTechnical Working Paper: Flooding
WCXM5_Flooding_Rev 1.8_19112015.doc Page 12 Lyall & AssociatesNovember 2015 Rev. 1.8
Clause 19 titled “Development of flood prone land”
“(1) This clause applies to land in the vicinity of the Cooks River and Muddy Creekdefined as flood prone land in the latest appropriate study adopted by the consentauthority for the purposes of this clause.
(2) Before granting consent for development of land to which this clause applies, theconsent authority must consider:
(a) the impact of the proposed development on flood flows and whether anycompensatory works should be provided, and
(b) if land filling is involved, whether any compensatory flood storage or otherflood mitigation works should be provided, and
(c) the impact of the development on the ecological significance of the CooksRiver and Muddy Creek and their wetlands and measures that can minimiseany adverse impact, such as the provision of compensatory wetland habitats.”
It is noted that flood prone land is defined in the Dictionary of the plan as:
“flood prone land means land that is susceptible to flooding by a 1% AnnualExceedance Probability flood event.”
This definition is not consistent with the FDM, which defines flood prone land as land susceptibleto flooding by the PMF event.
WestConnex New M5 EISTechnical Working Paper: Flooding
WCXM5_Flooding_Rev 1.8_19112015.doc Page 13 Lyall & AssociatesNovember 2015 Rev. 1.8
TABLE 2.1RELEVANT LOCAL ENVIRONMENTAL PLANS
AND FLOOD PLANNING MAPS
Local Environmental Plan Component of Project (excluding road tunnels) Flood Planning Maps
Canterbury Local Environmental Plan 2012 Western surface works, Kingsgrove motorway operationscomplex and Bexley Road South motorway operationscomplex
Flood Planning Map FLD_005 which covers the area northof the M5 East Motorway corridor in the vicinity ofCanterbury Golf Course is not attached to the LEP.
Flood Planning Map FLD_008 does not identify landimmediately to the north of the M5 East Motorway corridorbetween Canterbury Golf Course and Bexley Road as FPA.
Hurstville Local Environmental Plan 2012 Western Surface Works No Flood Planning Maps are attached to the LEP.
Rockdale Local Environmental Plan 2011 Arncliffe motorway operations complex(1) Flood Planning Maps FLD_003 shows land to the north ofMarsh Street on the western overbank of the Cooks Riveras FPA.
Flood Planning Maps FLD_003 does not show Kogarah GolfCourse as FPA as the LEP does not apply to this land.
Flood Planning Maps FLD_007 shows a portion of SydneyAirport on the eastern overbank of the Cooks River as FPA.
Marrickville Local Environmental Plan 2011 St Peters interchange, local road upgrades and St Petersmotorway operations complex
Flood Planning Maps FLD_004 and FLD_005 identify landalong the eastern overbank of the Cooks River and thenorthern overbank of Alexandra Canal as FPA.
Sydney Local Environmental Plan 2012 St Peters interchange, local road upgrades and BurrowsRoad motorway operations complex
No Flood Planning Maps are attached to the LEP.
Botany Bay Local Environmental Plan2013
Local road upgrades No Flood Planning Maps are attached to the LEP.
1. The land impacted by the project at the Kogarah Golf Course is subject to the requirements of the Sydney Regional Environmental Plan No.33 - Cooks Cove. Refer Section 2.5 forfurther details.

WestConnex New M5 EISTechnical Working Paper: Flooding
WCXM5_Flooding_Rev 1.8_19112015.doc Page 14 Lyall & AssociatesNovember 2015 Rev. 1.8
(blank page)
WestConnex New M5 EISTechnical Working Paper: Flooding
WCXM5_Flooding_Rev 1.8_19112015.doc Page 15 Lyall & AssociatesNovember 2015 Rev. 1.8
3 ASSESSMENT METHODOLOGY
3.1 Key tasks
The key tasks comprising the flooding investigation are broadly described below:
· Review and update several existing flood models that had previously been developedduring concept design development for the WestConnex project.
· Develop new flood models in areas not covered by the existing flood models referred toabove.
· Run the flood models and prepare exhibits showing flooding behaviour under present day(pre-project) conditions for the 20 year, 100 year and 200 year ARI events, as well as theProbable Maximum Flood (PMF).
· Assess the impact the project would have on flooding behaviour for the aforementioneddesign flood events.
· Assess the impact a partial blockage of major hydraulic structures would have on floodingbehaviour under post-construction conditions.
· Assess the impact future climate change would have on flooding behaviour under post-construction conditions.
The followings sections of this technical working paper set out the methodology which wasadopted in the assessment of flooding behaviour under present day and post-conditions. Furtherdiscussion on the assessment of measures which would be required to mitigate the impact of theproject on flooding behaviour is contained in Chapter 6 of this technical working paper.
The assessment has considered a worst case disturbance footprint at the Arncliffe motorwayoperation complex.
3.2 Definition of present day flooding behaviour
In order to define the nature of flooding in the vicinity of the project it was necessary to reviewand update, as well as develop a new set of computer based flood models. Both the RAFTS andDRAINS rainfall-runoff modelling software packages were used to generate design dischargehydrographs for input to the hydraulic models, while flooding patterns in the vicinity of the projectwere defined using the TUFLOW two-dimensional (in plan) hydraulic modelling software. TheHEC-RAS hydraulic modelling software was also used to define the upper envelope of flooding inthe vicinity of Bexley Road on the Upper Wolli Creek floodplain.
In regards the definition of flooding behaviour on the lower Cooks River floodplain, it wasnecessary to decide upon coincident catchment and ocean flooding conditions from which designflood envelopes could be derived.1 Site specific ocean level data were used to define peak stormtide levels for ocean floods ranging between one in five and one in 100 years (as opposed to theadoption of the default storm tide hydrographs recommended in OEH’s guideline Flood RiskManagement Guide: Incorporating Sea Level Rise Benchmarks in Flood Risk Assessments(DECCW, 2010)). An estimate of the peak storm tide level which would be reached for an
1 For each assessed ARI flood event, the highest peak flood level generated by an adopted set of coincidentcatchment and ocean floods was used to derive a single design flood envelope. The design flood envelopetherefore represents the highest peak flood level which could be reached by a flood of a given ARI, whetheras a result of a catchment or ocean flood event. Appendix B provides background to the derivation of thedesign flood envelopes presented in this technical working paper.
WestConnex New M5 EISTechnical Working Paper: Flooding
WCXM5_Flooding_Rev 1.8_19112015.doc Page 16 Lyall & AssociatesNovember 2015 Rev. 1.8
extreme ocean flood event was also derived by extrapolation of the site specific data. SectionB4.4 in Appendix B of this technical working paper contains further background to the derivationof storm tide hydrographs which were used for defining design flood levels on the lower CooksRiver floodplain.
Flooding behaviour in the vicinity of the project was defined for events with ARI’s of 20, 100 and200 years, as well as the PMF. A brief description of flooding behaviour in the vicinity of theproject under present day (pre-project) conditions is presented in Chapter 4 of this technicalworking paper.
3.3 Sensitivity analyses
The sensitivity of the hydraulic model was tested to variations in model parameters such ashydraulic roughness, and in the case of the lower Cooks River, to varying tailwater conditions.The main purpose of these studies was to give some guidance on the freeboard which might beadopted in the design of the project.
Runs of both of the hydraulic models were undertaken assuming a 20 per cent increase inhydraulic roughness (compared to the best estimate values given in Table B4.3 in Appendix B ofthis technical working paper). The findings of the sensitivity analysis in relation to the resultingchanges in flooding behaviour are presented in Section A3.4 in Appendix A (Upper Wolli Creekfloodplain) and Section B4.5.1 in Appendix B (Lower Cooks River floodplain) of this technicalworking paper.
Runs of the hydraulic model developed to define flooding behaviour on the lower Cooks Riverfloodplain were also undertaken to assess the sensitivity of flooding behaviour to variations in theadopted tailwater condition in Botany Bay. This included the testing of the hydraulic model usingboth normal tide and High High Water Solstice Spring (HHWSS) conditions, as well as the defaultstorm tide hydrographs recommended in Flood Risk Management Guide: Incorporating Sea LevelRise Benchmarks in Flood Risk Assessments (DECCW, 2010). Background to the derivation ofcoincident catchment and ocean flooding conditions which were adopted for model testingpurposes is contained in Section B4.4 of Appendix B, while a brief discussion on the findings ofthe sensitivity analysis are contained in Section B4.5.2 in Appendix B of this technical workingpaper.
3.4 Comparison with findings of previous studies
While no detailed investigations have been undertaken to define flooding behaviour in the upperreaches of Wolli Creek, several flood studies have been undertaken which deal with flooding onthe lower Cooks River floodplain in the vicinity of the project. Section B5.5 in Appendix B of thistechnical working paper provides a comparison of peak flow and flood level data which arepresented in these studies with those of this investigation.
3.5 Provisional flood hazard
Flood hazard categories may be assigned to flood affected areas in accordance with theprocedures outlined in the FDM. Flood prone areas may be provisionally categorised into LowHazard and High Hazard areas depending on the depth of inundation and flow velocity. Flooddepths as high as one metre, in the absence of any significant flow velocity, could be consideredto represent Low Hazard conditions. Similarly, areas of flow velocities up to two metres persecond, but with small flood depths could also represent Low Hazard conditions.
WestConnex New M5 EISTechnical Working Paper: Flooding
WCXM5_Flooding_Rev 1.8_19112015.doc Page 17 Lyall & AssociatesNovember 2015 Rev. 1.8
Provisional Flood Hazard diagrams for the 100 year ARI event based on Diagram L2 in the FDMhave been prepared as part of the current investigation (refer Section 4.2 for further details).
The Flood Hazard assessment presented herein is based on considerations of depth and velocityof flow and is provisional only. As noted in the FDM, other considerations such as the rate of riseof floodwaters and access to high ground for evacuation from the floodplain should also be takeninto consideration before a final determination of Flood Hazard can be made. These factors aregenerally taken into account during the preparation of a Floodplain Risk Management Study andPlan for an area.
3.6 Impact of the project on flooding behaviour
The structure of the Upper Wolli Creek and Lower Cooks River TUFLOW models was adjusted toincorporate details of the project. Background to the changes that were made to the structure ofthe hydraulic models that were used to assess the impact of the project on flooding behaviour onthe upper Wolli Creek and lower Cooks River floodplains is contained in Section A3.5 inAppendix A and Section B4.7 in Appendix B of this technical working paper, respectively,
The results of modelling the 20, 100 and 200 year ARI events, together with the PMF event wereused to prepare a series of afflux diagrams showing the impact the project would have onflooding behaviour.1 A discussion on the impact the project would have on flooding behaviour iscontained in Section 5.2 of this technical working paper.
3.7 Impact of flooding on the project
The results of the modelling described in Section 5.3 of this technical working paper were usedto assess the impact flooding would have on the project. This included a review of the freeboardwhich would be available to the tunnel portals and motorway ventilation infrastructure during aPMF event.
3.8 Impact of a partial blockage of major hydraulic structures on flooding behaviour
Engineers Australia’s guideline AR&R Revision projects – project 11 – Blockage of HydraulicStructures (EA, 2013) includes guidance on modes of blockage which are likely to beexperienced for different hydraulic structures. In regards bridge structures, those with clearopening heights less than three metres are said to be susceptible to blockage in streams wherelarge floating debris is conveyed by floodwater. The guideline also states that debris is likely towrap around the bridge piers, irrespective of the height of the clear opening
The impact an accumulation of debris on both existing and proposed bridge structures wasassessed given the potential for the New M5 tunnel portal to be flooded due to a rise in floodlevels in Alexandra Canal. The impact a one metre thick raft of debris lodged beneath theunderside of both existing and proposed bridge decks in combination with a four metre wide raftof debris lodged on the upstream side of each bridge pier over the full height of the clear openingwas assessed as part of the investigation.
In regards pipe and culvert structures, the guideline recommends the adoption of a 20 per centblockage factor where the height of a hydraulic structure is less than three metres or its width isless than five metres. The structure of the hydraulic model which was used to define flooding
1 In the context of this report, afflux is the difference in peak flood levels caused by changes to thefloodplain. For example, due to a change in hydraulic roughness or the construction of the project.
WestConnex New M5 EISTechnical Working Paper: Flooding
WCXM5_Flooding_Rev 1.8_19112015.doc Page 18 Lyall & AssociatesNovember 2015 Rev. 1.8
behaviour on the Upper Wolli Creek floodplain was adjusted to include a 20 per cent blockagefactor which was applied to all major hydraulic structures.
The findings of the blockage related impact assessment are contained in Section 5.4 of thistechnical working paper.
3.9 Impact of future climate change on flooding behaviour
Section 2.4 of this technical working paper provides background to the derivation of the adoptedsea level rise benchmarks and percentage increase in 100 year ARI design rainfall intensitieswhich were used to assess the potential impact of future climate change on flooding behaviour inthe vicinity of the project. Further details on the peak storm tide levels that have been adoptedfor assessing the impact of future sea level rise on flooding behaviour in the vicinity of the projectare contained in Section B4.4 of Appendix B of this technical working paper, while the findingsof the climate change impact assessment are contained in Section 5.5 of this technical workingpaper.
WestConnex New M5 EISTechnical Working Paper: Flooding
WCXM5_Flooding_Rev 1.8_19112015.doc Page 19 Lyall & AssociatesNovember 2015 Rev. 1.8
4 EXISTING ENVIRONMENT
4.1 Catchment description
4.1.1 Cooks River
The Cooks River drains a catchment of about 100 square kilometres in the southern suburbs ofSydney and discharges to Botany Bay at Tempe, adjacent to Sydney Airport. The catchment hasbeen extensively developed and the river channel highly modified. Almost the entire length of theriver is lined and the channel has been straightened and re-aligned in several locations.
The Cooks River has two major tributaries: Wolli Creek and Sheas Creek. Smaller tributariesinclude Muddy Creek and Cup and Saucer Creek. Figure 1.1 shows the extent of the CooksRiver catchment.
4.1.2 Upper Wolli Creek
The M5 East Motorway runs in a west to east direction through the upper portion of the WolliCreek catchment. The catchment is completely urbanised with a drainage system comprisingpiped and open channel reaches. Figure A2.1 in Appendix A of this technical working papershows the location of the M5 East Motorway and the division of the overall catchment into sub-areas which was used in catchment modelling (RAFTS) to determine discharge hydrographs. Onthe southern side of the M5 East Motorway, the main arm of the creek is channelised to the eastof Beverly Hills Park, where a concrete lined stormwater channel continues to Bexley Road.Immediately downstream of Bexley Road the creek enters a densely vegetated steep walledvalley which significantly restricts creek flows (ref. Figure 1.2, sheet 2). The catchment area atBexley Road is about 11.5 square kilometres.
The original design for the M5 East Motorway project and its drainage system includedmodifications to the open channel section of Wolli Creek between Kingsgrove Road and BexleyRoad, as well as the cross drainage lines which convey runoff into the creek from areas north ofthe road (ref. Figure 1.2, sheet 1). The motorway drainage system was designed to convey flowsup to the 100 year ARI magnitude. Several underpasses were also provided between KingGeorges Road and Bexley Road (including Kingsgrove Road itself) which provide additionalcapacity to convey flows greater than 100 year ARI magnitude.
4.1.3 Sheas Creek / Alexandra Canal
Sheas Creek is a major tributary of the Cooks River. The creek was widened in the late 1800’sover about a four kilometres length to form the Alexandra Canal. The size of the catchmentdraining to the canal increases from about 6.6 square kilometres at its northern (upstream) endnear Sydney Park Road, to about 17.7 square kilometres at its confluence with the Cooks River.Figure B3.1 in Appendix B of this technical working paper shows the extent of the catchmentwhich drains to Alexandra Canal upstream of its confluence with the Cooks River.
4.2 Description of existing flood behaviour
4.2.1 Upper Wolli Creek floodplain
Figures 4.1, 4.2, 4.3 and 4.4 (2 sheets each) respectively show present day flooding patternsalong Wolli Creek in the vicinity of the project for design floods of 20, 100 and 200 year ARI, aswell as the PMF. Figure 4.5 shows design water surface profiles along the main arm of WolliCreek and one of its tributaries extending from Kooemba Road to a location downstream of
WestConnex New M5 EISTechnical Working Paper: Flooding
WCXM5_Flooding_Rev 1.8_19112015.doc Page 20 Lyall & AssociatesNovember 2015 Rev. 1.8
Bexley Road. Peak flows at key locations in the drainage system are summarised in Table C1 inAppendix C.
Minor surcharge of transverse drainage structure XD1 would occur in a 100 year ARI event, whena peak flow of 1.7 cubic metres per second would discharge in an easterly direction toward theKindilan Street underpass. Floodwater which surcharges the inlet of transverse drainagestructure XD1 would pond along the northern side of the motorway before discharging to inlet pitslocated on cross drainage structures XD1A and XD2.
The concrete lined channel which runs to the south of the water quality pond located on thesouthern side of the motorway adjacent to Kirrang Street is surcharged by storms as frequent as20 year ARI event east (downstream) of Kooemba Road (refer Figure 4.2, sheet 1). As a result,two existing residential properties that are located on the southern side of the motorway corridoron Tallawalla Street are subject to flooding during a flood of this recurrence interval. Thepresence of colorbond fencing that extends from Tallawalla Street to the motorway boundarywould result in increased depths of inundation on the western (upstream) side of the two affectedproperties and divert flood flows into Tallawalla Street. Floodwater which surcharges the channelat this location flows in an easterly direction, where it does not fully re-enter the channel systemuntil it reaches a location opposite the Kindilan Street underpass.
Flooding would be experienced in commercial and industrial development which is locatedbetween Beverly Hills Park and Kingsgrove Road as a result of floodwater which surcharges themain arm of Wolli Creek for events as frequent as a 20 year ARI event. Depths of inundation inseveral properties would exceed one metre.
The transverse drainage structures which lie immediately to the east of the Kindilan Streetunderpass generally have sufficient capacity to convey peak 100 year ARI flows generated by thelocal catchments which drain from the north. However, it is noted that floodwater whichsurcharges the main arm of Wolli Creek at the Karingal Street and Kingsgrove Road underpassesdischarges in a northerly direction where it partially inundates a number of properties locatedalong the northern side of the elevated motorway.
Major ponding of floodwater would occur along the northern side of the motorway corridor in thevicinity of Canterbury Golf Course during a PMF event (refer Figure 4.3, sheet 1). Peak floodlevels along the northern side of the motorway fall from about RL 26.0 metres AHD adjacent tothe inlet of transverse drainage structure XD1 to about RL 25.2 metres AHD adjacent to thenorthern end of the Kindilan Street underpass.
It is noted that the elevation of the eastbound carriageway between the inlets of transversedrainage structures XD1 and XD1A lies below the level of the PMF and that it is only thepresence of a solid F-type barrier arrangement which presents floodwater from discharging ontothe surface of the motorway at this location. Included on Figure 4.5 is the energy grade line forthe PMF event which was generated by the Wolli Creek HEC-RAS model (refer Section A4 inAppendix A of this technical working paper for background to the development of the Wolli CreekHEC-RAS Model). The additional modelling was undertaken due to the Wolli Creek TUFLOWModel generating very high flow velocities (greater than eight metres per second) in the concretelined section of channel downstream of Kingsgrove Road and the concern that any obstruction inthe flow could cause a rapid rise in water surface levels adjacent to the motorway. The elevationof the energy grade line is considered to represent the upper limit of potential flooding along thereach of Wolli Creek downstream of Kingsgrove Road and should be used for setting criticallevels such as ingress points to the Bexley Road South motorway operations complex.
WestConnex New M5 EISTechnical Working Paper: Flooding
WCXM5_Flooding_Rev 1.8_19112015.doc Page 21 Lyall & AssociatesNovember 2015 Rev. 1.8
Figure 4.6 shows that high hazard flooding conditions are generally confined to the inbank areaof Wolli Creek and its tributaries at the 100 year ARI level of flooding. The major exception is inthe commercial and industrial development which lies to the south of the motorway corridor,where high hazard flooding conditions are present in a large number of properties.
4.2.2 Lower Cooks River floodplain
Figures 4.7, 4.8, 4.9 and 4.10 (2 sheets each) respectively show present day flooding patternsalong the lower reaches of the Cooks River and Alexandra Canal for design floods of 20, 100 and200 year ARI, together with the PMF, while Figures 4.11 and 4.12 respectively show the designwater surface profiles which were used to derive the flood envelopes along the lower Cooks Riverand Alexandra Canal for design floods of 20, 100 and 200 year ARI, together with the PMF. Peakflows at key locations in the drainage system are summarised in Table C2 in Appendix C.
In the lower reaches of the Cooks River downstream of the Southern and Western SuburbsOcean Outfall Sewer (SWSOOS) crossing, ocean flooding controls flood levels. Upstream of thatlocation there is a crossover in the water surface profiles and levels associated with catchmentflooding control. Catchment flooding controls the design flood levels along the length ofAlexandra Canal.
Kogarah Golf Course is inundated by floodwater for events as frequent as 20 year ARI (referFigure 4.7, sheet 2). Floodwater discharges to the golf course via Marsh Street and also due tosurcharge of the river bank immediately north of the SWSOOS.
The golf course principally acts as a temporary flood storage area for events up to 100 year ARI.For example, a ponding area forms in the northern portion of the golf course which is partiallyfilled by floodwater which discharges in a southerly direction across Marsh Street and in anortherly direction from the backwater which extends north from near the SWSOOS. Themagnitude of the inflows to the ponding area during a 100 year ARI event is insufficient for it to fillduring a flood of this return period. As a result, the peak flood level in the ponding area is belowthat in the river. For example, the peak 100 year ARI flood level in the river is aboutRL 2.1 metres AHD, while in the ponding area it is about 0.5 metre lower at about RL 1.6 metresAHD.1 Depths of ponding in the northern portion of the Kogarah Golf Course are sufficient toresult in hazardous flooding conditions arising during a flood of this recurrence internal (referFigure 4.13, sheet 2).
In the case of the PMF event, the golf course would be inundated to depths exceeding twometres, with the peak flood level along its common boundary with Marsh Street reaching aboutRL 4.4 metres AHD.
Peak PMF levels in the vicinity of the Alexandria Landfill site (ie the location of the planned StPeters interchange) are controlled by flows generated by a storm centred over the Sheas Creekcatchment, rather than from backwater flooding caused by a storm centred over the larger CooksRiver catchment (refer Figure 4.12).
1 Note that this finding is linked to a design storm of two hours duration which was found to be critical formaximising peak flows in the river. During a longer duration storm event, the volume of floodwaterdischarging to the golf course may be sufficient to fill the ponding area such that water levels equalise withthose in the river.

WestConnex New M5 EISTechnical Working Paper: Flooding
WCXM5_Flooding_Rev 1.8_19112015.doc Page 22 Lyall & AssociatesNovember 2015 Rev. 1.8
As shown on Figure 4.10, sheet 1, floodwater would partially inundate the Alexandria Landfill siteto an elevation of about RL 4.5 metres AHD during a PMF event. It is noted that an existing spoilmound (known as Bradshaw Mountain) which is located near Campbell Road prevents floodwaterfrom discharging to the landfill site during a PMF event. The peak flood level on the canal side ofthe spoil mound is about RL 4.7 metres AHD.
WestConnex New M5 EISTechnical Working Paper: Flooding
WCXM5_Flooding_Rev 1.8_19112015.doc Page 23 Lyall & AssociatesNovember 2015 Rev. 1.8
5 FLOOD RISK ASSESSMENT
5.1 Overview
This chapter of the technical working paper deals with the key findings of the floodinginvestigation in terms of the impact the project would have on flooding behaviour on both theupper Wolli Creek and lower Cooks River floodplains. Also set out in this chapter is anassessment of the impact flooding would have on key components of the project, such as theroad tunnels and motorway operations complexes. The findings of an assessment into the impacta partial blockage of major hydraulic structures and future climate change would have on floodingbehaviour under post-construction conditions are also presented.
The figures referred to in this chapter show the impact the project would have on floodingbehaviour in terms of changes in peak flood levels (commonly referred to as “afflux”). A positiveafflux represents an increase and conversely a negative afflux represents a decrease in peakflood levels when compared to present day conditions. Differences in peak flood levels of±0.01 metres (equal to one centimetre or 10 millimetres) are considered to be within the accuracyof the hydraulic model. The project is therefore considered to have a negligible or nil effect onflooding behaviour in areas where an afflux of ±0.01 metres is shown to be present. The figuresalso show the extent of additional land which would be inundated by floodwater, and converselythe extent of land which would be rendered flood free, as a result of the project.
5.2 Impact of the Project on flood behaviour
5.2.1 Upper Wolli Creek floodplain
Figures 5.1, 5.2, 5.3 and 5.4 (2 sheets each) respectively show the impact the project wouldhave on existing flooding behaviour on the upper Wolli Creek floodplain for design floods of 20,100 and 200 year ARI, as well as the PMF. Table 5.1 at the end of this chapter gives the changethat would occur in peak flood levels at four locations outside the motorway corridor, whileTable C1 in Appendix C gives the change that would occur in the distribution of flow in thedrainage system as a result of the project.
The key findings of the assessment were as follows:
· The project would not increase peak flood levels in existing residential development for allfloods up to 100 year ARI.
· The project would not increase the duration of flooding for all events up to the PMF.
· The widening of the M5 East Motorway would result in an increase in peak flood levelsalong the northern side of the motorway corridor for floods up to 100 year ARI. However,the resulting impacts would be confined to the motorway corridor and the Canterbury GolfClub.
· The minor change in the distribution of flow in the drainage system would result in a minorincrease in peak 100 year ARI flood levels in two industrial/commercial properties that arelocated on the southern side of the motorway corridor opposite the outlet of transversedrainage structures XD2 and XD3. The maximum increase in peak 100 year ARI levels inboth properties would be about 20 millimetres.
· The constriction imposed on flow by the widening of the M5 East Motorway would lead toan increase in peak PMF levels of up to about 1.6 metres in the vicinity of the CanterburyGolf Course. Peak PMF flood levels would also be increased by around 0.45 metres toaround 0.95 metres in seven residential properties that are located immediately to the
WestConnex New M5 EISTechnical Working Paper: Flooding
WCXM5_Flooding_Rev 1.8_19112015.doc Page 24 Lyall & AssociatesNovember 2015 Rev. 1.8
west of the golf course in Elouera Street and Kirrang Street, Beverly Hills (refer maximumincrease in peak PMF levels shown in the inset on Figure 5.4, sheet 1). Flooding in theseven properties would generally be of a ponding nature, with flow velocities shown to beless than about 0.1 metre per second during a PMF event.
While the inundation of previously flood free land would generally be confined to thelandscaped portion of five of the seven properties, floodwater would inundate landbordering the dwellings in Nos. 50 and 52 Elouera Street, Beverley Hills. While floor levelsurvey would be required to determine whether the project would result in the above-floorinundation of these two dwellings, inspection of the LiDAR survey data shows that groundlevels in the majority of No. 50 Elouera Street and in the south-west corner of No. 52Elouera Street lie above the PMF level, indicating that evacuation would still be possiblefrom the properties by foot during an event of this magnitude.
· The constriction imposed by the widening of the M5 East Motorway would lead to areduction in peak PMF flood levels on the northern side of the motorway corridor in thevicinity of Beverly Grove Park and on the southern side of the motorway corridor in thevicinity of Tallawalla Street.
· The realignment of the existing motorway transverse drainage structure XD4 would notresult in a major redistribution of flow in the drainage system for all floods up to the PMF.The project would not result in the more frequent inundation of property or the local roadnetwork over the full range of flood events.
Based on the above findings, it is concluded that the project would not impact the developmentpotential of existing properties for residential, commercial and industrial purposes. However, theincrease in peak PMF levels which would occur along the northern side of the motorway corridorin the vicinity of Canterbury Golf Course would constrain development in at least one residentialproperty which is located in Elouera Street, Beverly Hills, if for example the property owner(s)decided to augment the existing dwelling to incorporate a child or aged-care facility.
5.2.2 Lower Cooks River floodplain
Figures 5.5, 5.6, 5.7 and 5.8 (2 sheets each) respectively show the impact the project wouldhave on existing flooding behaviour on the lower Cooks River floodplain for design floods of 20,100 and 200 year ARI, as well as the PMF. Table 5.2 at the end of this chapter gives the changethat would occur in peak flood levels at four locations outside the motorway corridor, while TableC2 in Appendix C gives the change that would occur in the distribution of flow in the drainagesystem as a result of the project.
The key findings of the assessment were as follows:
· The loss of about 12,000 cubic metres of floodplain storage associated with theconstruction of the Arncliffe motorway operations complex in Kogarah Golf Course wouldresult in an increase in peak 100 year ARI flood levels in seven residential properties thatare located on the northern (upstream) side of Marsh Street. The maximum increase inpeak flood levels in these properties would be about 10 millimetres. The potential impactswould be confirmed based on the detailed design of the Arncliffe motorway operationscomplex. Floor level survey would be required to determine whether the project wouldresult in the above-floor inundation of these properties.
WestConnex New M5 EISTechnical Working Paper: Flooding
WCXM5_Flooding_Rev 1.8_19112015.doc Page 25 Lyall & AssociatesNovember 2015 Rev. 1.8
· The construction of the two new road bridges across Alexandra Canal would generally notimpact peak flood levels for events up to 100 year ARI. However, the raising of theCampbell Road / Burrows Road intersection would impact local flooding patterns, leadingto an increase in peak 100 year ARI flood levels of about 30 millimetres in twocommercial/industrial properties, as well as in a recently upgraded section of TransGrid’sBeaconsfield West Substation.
· The loss of floodplain storage resulting from the construction of both the Arncliffemotorway operations complex in Kogarah Golf Course and the St Peters interchange inthe Alexandria Landfill site in combination with the constrictive effects imposed by the twonew road bridges across Alexandra Canal would result in an increase in peak PMF floodlevels across a large portion of the lower Cooks River floodplain. While increases in peakPMF levels are generally in the range 10 to 50 millimetres, increases of greater than100 millimetres would occur in a number of commercial/industrial properties that arelocated on the western overbank of Alexandra Canal immediately upstream of the newCampbell Road bridge.
· The resulting increase in peak PMF flood levels would not translate into a significantincrease in the extent of flood prone land.
· The project would not alter the distribution of flows on the lower Cooks River floodplain.
· The project would not result in the more frequent inundation of property or the local roadnetwork over the full range of flood events.
· The project would not increase the duration of flooding for all events up to the PMF.
Based on the above findings, it is concluded that the project could potentially increase thefrequency and depth of above-floor inundation in a number of residential properties that arelocated along the northern (upstream) side of Marsh Street opposite the Arncliffe motorwayoperations complex. As detailed in Chapter 6, a floor level survey would be completed for theseproperties and further investigations would be undertaken during detailed design to minimise thepotential for increased flood risk at these properties during the 100 year ARI. Any such mitigationcould also reduce the impact during a PMF.
TransGrid advised that while a conservative approach was adopted in the recent upgrade of itsBeaconsfield West Substation, whereby critical infrastructure was positioned above aboutRL six metres AHD, all transformer switch bays and reactive plant were set at ground level (aboutRL two metres AHD) as per the existing design philosophy for the site. Further liaison would becarried out with TransGrid to determine whether the predicted increases in peak flood levelsattributable to the project would adversely affect its infrastructure.
5.3 Impact of flooding on the project
5.3.1 Upper Wolli Creek floodplain
The Kingsgrove motorway operations complex would be located on land that lies above the PMFevent.
While the Bexley Road South motorway operations complex is located on land that is currentlysubject to flooding during events as frequent as 20 year ARI, the extent of land affected byflooding is restricted to areas directly adjacent to Wolli Creek for events up to 100 year ARI. Theemergency smoke extraction facility at the complex has been designed to be above the peakPMF level.
WestConnex New M5 EISTechnical Working Paper: Flooding
WCXM5_Flooding_Rev 1.8_19112015.doc Page 26 Lyall & AssociatesNovember 2015 Rev. 1.8
Consideration would also need to be given to setting appropriate road/flood wall heights whichare aimed at preventing floodwater from discharging onto the surface of the widened motorway inthe vicinity of the tunnel portals during a PMF event. The findings of the assessment into theimpact a partial blockage of major hydraulic structures could have on flooding behaviour shouldalso be taken into considering when setting road/flood wall heights (refer Section 5.4 for details).
5.3.2 Lower Cooks River floodplain
The ventilation facilities at the Arncliffe and St Peters motorway operations complexes have beendesigned to be above the PMF event. The Burrows Road motorway operations complex, whichcontains the Motorway Control Centre lies on land which is located above peak 100 year ARIflood levels. However, it would be impacted during a PMF event. Components critical to tunneloperations would be located on the first floor of the centre, which would lie above the peak PMFlevel.
Consideration would also need to be given to setting appropriate road/flood wall heights in orderto prevent floodwater from discharging to the tunnel portals via the St Peters interchange.
5.4 Impact of a partial blockage of major hydraulic structures on flood behaviour
Figures 5.9 and 5.10 show the impact a partial blockage of all major hydraulic structures locatedon the upper Wolli Creek floodplain in the vicinity of the project would have on flooding behaviourfor the 100 year ARI and PMF events, respectively, while Table 5.3 at the end of this chaptergives the increases which would occur in peak 100 year ARI and PMF levels at key locationsbordering the project. The assessment showed that a partial blockage of major hydraulicstructures located on the upper Wolli Creek floodplain would only have a minor impact on peakflood levels.
Figures 5.11 and 5.12 show the impact a partial blockage of all major hydraulic structureslocated on the lower Cooks River floodplain in the vicinity of the project would have on floodingbehaviour for the 100 year ARI and PMF events, respectively, while Table 5.3 at the end of thischapter gives the increases which would occur in peak 100 year ARI and PMF levels at keylocations bordering the project. A partial blockage of the SWSOOS where it crosses the CooksRiver would increase peak 100 year ARI flood levels adjacent to the Arncliffe motorwayoperations complex. A partial blockage of major hydraulic structures located downstream ofCampbell Road bridge would also increase peak PMF levels adjacent to the St Petersinterchange.
5.5 Impact of future climate change on flood behaviour
5.5.1 Potential increase in rainfall intensities
Figures 5.13 and 5.14 show the impact a potential increase of 10 per cent in 100 year ARIdesign rainfall intensities would have on flooding behaviour on the upper Wolli Creek and lowerCooks River floodplains, respectively, Table 5.4 at the end of this chapter gives the increasesthat would occur in peak 100 year ARI flood levels at key locations bordering the project.
A 10 per cent increase in 100 year ARI design rainfall intensities would generally not have animpact on the project except at the Arncliffe motorway operations complex. At this location, thereis the potential for peak flood levels to be increased by up to 190 millimetres in areas adjacent tothe complex. Increases in rainfall intensity associated with future climate change would alsoincrease the frequency of floodwater surcharging the banks of the Cooks River, which could alsoimpact the complex.
WestConnex New M5 EISTechnical Working Paper: Flooding
WCXM5_Flooding_Rev 1.8_19112015.doc Page 27 Lyall & AssociatesNovember 2015 Rev. 1.8
5.5.2 Sea level rise
Figures 5.15 and 5.16 show the impact a projected rise in sea levels of 0.4 metre by the year2050 would have on flooding behaviour on the lower Cooks River floodplain for the 100 year ARIand PMF events, respectively, while Figures 5.17 and 5.18 show the impact a projected rise insea levels of 0.9 metre by the year 2100 would have on flooding behaviour on the lower CooksRiver floodplain for the 100 year ARI and PMF events, respectively. Table 5.5 at the end of thischapter gives the increases that would occur in peak 100 year ARI and PMF flood levels at keylocations bordering the project under both 2050 and 2100 sea level rise conditions.
While climate change induced sea level rise would not impact the St Peters interchange forevents up to 100 year ARI, it would result in the more frequent inundation of Kogarah Golf Coursein the vicinity of the Arncliffe motorway operations complex. Peak 100 year ARI flood levelswould also be increased in the vicinity of the motorway operations complex by about 0.49 metresand 0.84 metres in the case of a 0.4 metre and 0.9 metre rise in sea level, respectively.1
A rise in sea level of 0.4 metres would result in an increase in peak PMF levels of about0.13 metres in the vicinity of the St Peters interchange (including the Burrows Road and St Petersmotorway operation complexes) and about 0.14 metres in the vicinity of the Arncliffe motorwayoperations complex. A rise in sea level of 0.9 metres would result in an increase in peak PMFlevels of about 0.29 metres in the vicinity of the Burrows Road and St Peters motorway operationcomplexes, as well as the St Peters interchange and about 0.32 metres in the vicinity of theArncliffe motorway operations complex.
1 Note that the greater relative increase in peak 100 year ARI flood levels adjacent to the motorwayoperations complex under 2050 sea level rise conditions is a function of the filling of the temporary floodstorage within the northern portion of the golf course.

WestConnex New M5 EISTechnical Working Paper: Flooding
WCXM5_Flooding_Rev 1.8_19112015.doc Page 28 Lyall & AssociatesNovember 2015 Rev. 1.8
(blank page)
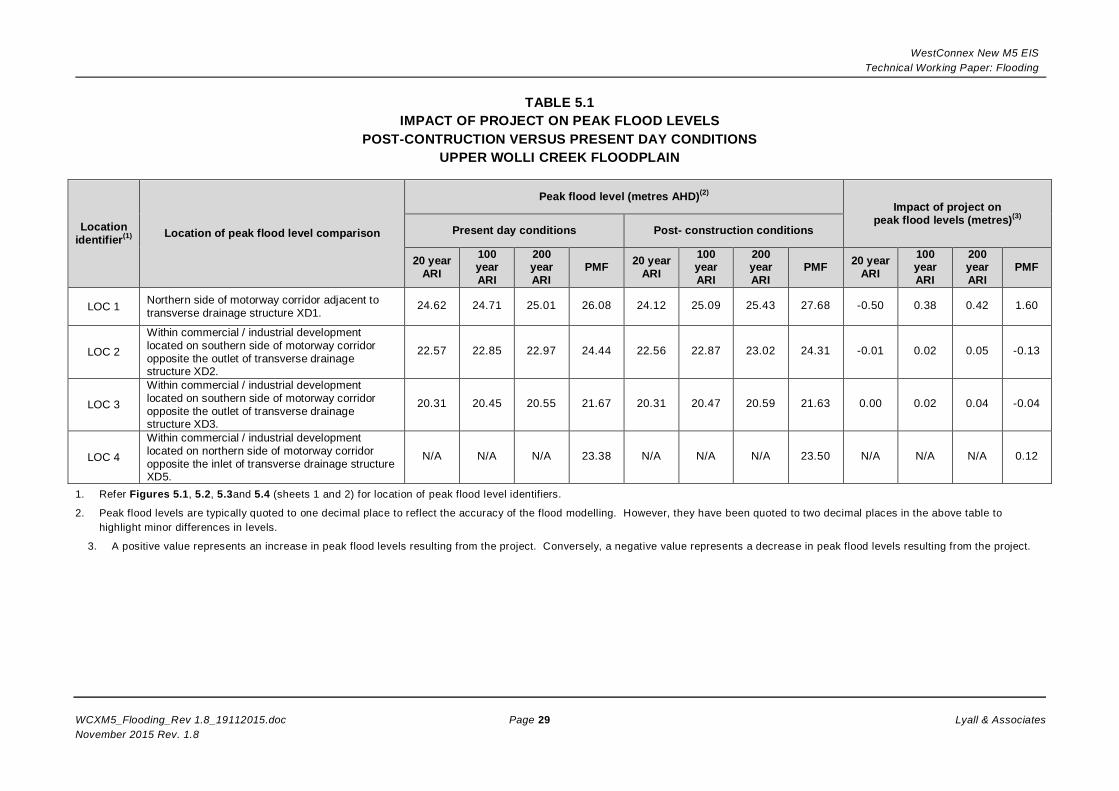
WestConnex New M5 EISTechnical Working Paper: Flooding
WCXM5_Flooding_Rev 1.8_19112015.doc Page 29 Lyall & AssociatesNovember 2015 Rev. 1.8
TABLE 5.1IMPACT OF PROJECT ON PEAK FLOOD LEVELS
POST-CONTRUCTION VERSUS PRESENT DAY CONDITIONSUPPER WOLLI CREEK FLOODPLAIN
Locationidentifier(1) Location of peak flood level comparison
Peak flood level (metres AHD)(2)
Impact of project onpeak flood levels (metres)(3)
Present day conditions Post- construction conditions
20 yearARI
100yearARI
200yearARI
PMF 20 yearARI
100yearARI
200yearARI
PMF 20 yearARI
100yearARI
200yearARI
PMF
LOC 1 Northern side of motorway corridor adjacent totransverse drainage structure XD1.
24.62 24.71 25.01 26.08 24.12 25.09 25.43 27.68 -0.50 0.38 0.42 1.60
LOC 2
Within commercial / industrial developmentlocated on southern side of motorway corridoropposite the outlet of transverse drainagestructure XD2.
22.57 22.85 22.97 24.44 22.56 22.87 23.02 24.31 -0.01 0.02 0.05 -0.13
LOC 3
Within commercial / industrial developmentlocated on southern side of motorway corridoropposite the outlet of transverse drainagestructure XD3.
20.31 20.45 20.55 21.67 20.31 20.47 20.59 21.63 0.00 0.02 0.04 -0.04
LOC 4
Within commercial / industrial developmentlocated on northern side of motorway corridoropposite the inlet of transverse drainage structureXD5.
N/A N/A N/A 23.38 N/A N/A N/A 23.50 N/A N/A N/A 0.12
1. Refer Figures 5.1, 5.2, 5.3and 5.4 (sheets 1 and 2) for location of peak flood level identifiers.
2. Peak flood levels are typically quoted to one decimal place to reflect the accuracy of the flood modelling. However, they have been quoted to two decimal places in the above table tohighlight minor differences in levels.
3. A positive value represents an increase in peak flood levels resulting from the project. Conversely, a negative value represents a decrease in peak flood levels resulting from the project.
WestConnex New M5 EISTechnical Working Paper: Flooding
WCXM5_Flooding_Rev 1.8_19112015.doc Page 30 Lyall & AssociatesNovember 2015 Rev. 1.8
(blank page)
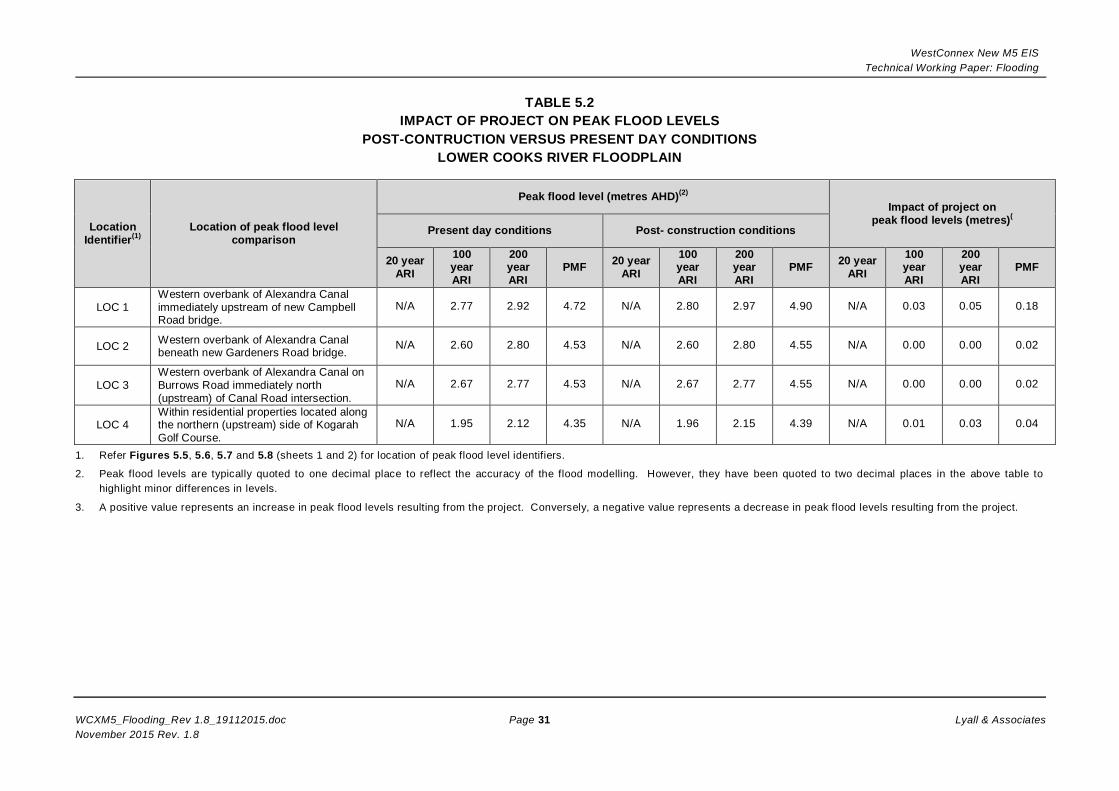
WestConnex New M5 EISTechnical Working Paper: Flooding
WCXM5_Flooding_Rev 1.8_19112015.doc Page 31 Lyall & AssociatesNovember 2015 Rev. 1.8
TABLE 5.2IMPACT OF PROJECT ON PEAK FLOOD LEVELS
POST-CONTRUCTION VERSUS PRESENT DAY CONDITIONSLOWER COOKS RIVER FLOODPLAIN
LocationIdentifier(1)
Location of peak flood levelcomparison
Peak flood level (metres AHD)(2)
Impact of project onpeak flood levels (metres)(
Present day conditions Post- construction conditions
20 yearARI
100yearARI
200yearARI
PMF 20 yearARI
100yearARI
200yearARI
PMF 20 yearARI
100yearARI
200yearARI
PMF
LOC 1Western overbank of Alexandra Canalimmediately upstream of new CampbellRoad bridge.
N/A 2.77 2.92 4.72 N/A 2.80 2.97 4.90 N/A 0.03 0.05 0.18
LOC 2 Western overbank of Alexandra Canalbeneath new Gardeners Road bridge.
N/A 2.60 2.80 4.53 N/A 2.60 2.80 4.55 N/A 0.00 0.00 0.02
LOC 3Western overbank of Alexandra Canal onBurrows Road immediately north(upstream) of Canal Road intersection.
N/A 2.67 2.77 4.53 N/A 2.67 2.77 4.55 N/A 0.00 0.00 0.02
LOC 4Within residential properties located alongthe northern (upstream) side of KogarahGolf Course.
N/A 1.95 2.12 4.35 N/A 1.96 2.15 4.39 N/A 0.01 0.03 0.04
1. Refer Figures 5.5, 5.6, 5.7 and 5.8 (sheets 1 and 2) for location of peak flood level identifiers.
2. Peak flood levels are typically quoted to one decimal place to reflect the accuracy of the flood modelling. However, they have been quoted to two decimal places in the above table tohighlight minor differences in levels.
3. A positive value represents an increase in peak flood levels resulting from the project. Conversely, a negative value represents a decrease in peak flood levels resulting from the project.

WestConnex New M5 EISTechnical Working Paper: Flooding
WCXM5_Flooding_Rev 1.8_19112015.doc Page 32 Lyall & AssociatesNovember 2015 Rev. 1.8
(blank page)
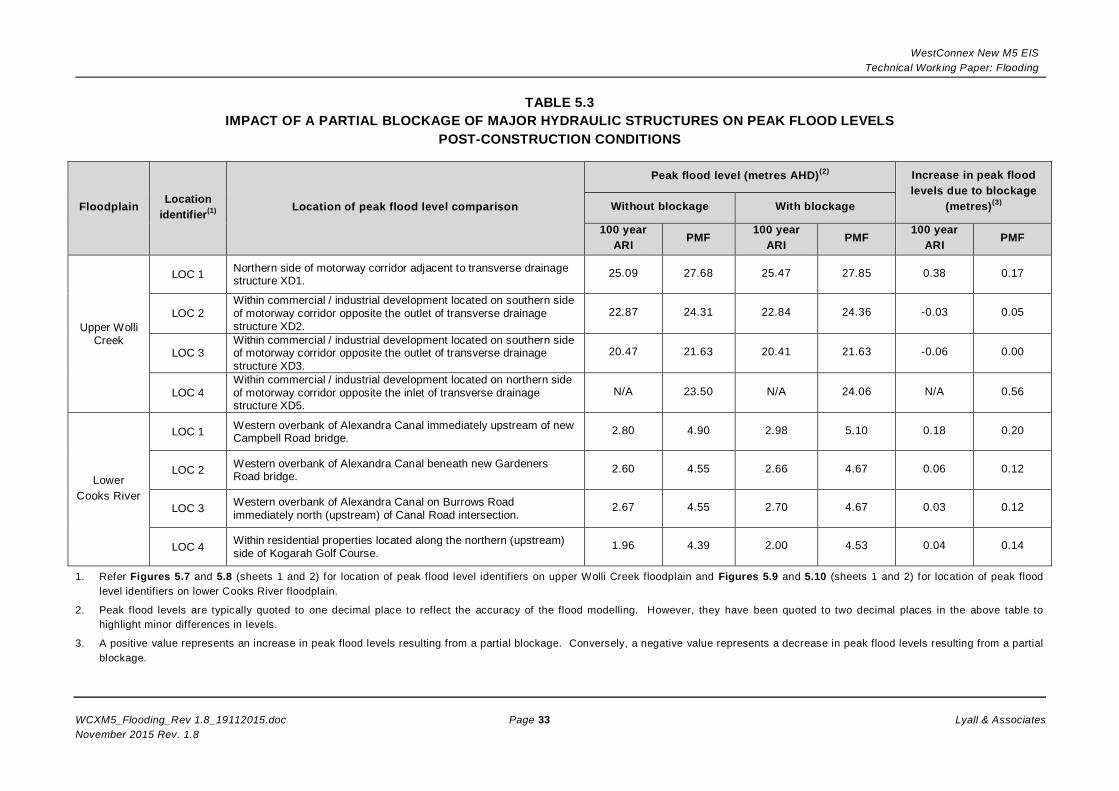
WestConnex New M5 EISTechnical Working Paper: Flooding
WCXM5_Flooding_Rev 1.8_19112015.doc Page 33 Lyall & AssociatesNovember 2015 Rev. 1.8
TABLE 5.3IMPACT OF A PARTIAL BLOCKAGE OF MAJOR HYDRAULIC STRUCTURES ON PEAK FLOOD LEVELS
POST-CONSTRUCTION CONDITIONS
Floodplain Locationidentifier(1) Location of peak flood level comparison
Peak flood level (metres AHD)(2) Increase in peak floodlevels due to blockage
(metres)(3)Without blockage With blockage
100 yearARI PMF
100 yearARI PMF
100 yearARI PMF
Upper WolliCreek
LOC 1 Northern side of motorway corridor adjacent to transverse drainagestructure XD1.
25.09 27.68 25.47 27.85 0.38 0.17
LOC 2Within commercial / industrial development located on southern sideof motorway corridor opposite the outlet of transverse drainagestructure XD2.
22.87 24.31 22.84 24.36 -0.03 0.05
LOC 3Within commercial / industrial development located on southern sideof motorway corridor opposite the outlet of transverse drainagestructure XD3.
20.47 21.63 20.41 21.63 -0.06 0.00
LOC 4Within commercial / industrial development located on northern sideof motorway corridor opposite the inlet of transverse drainagestructure XD5.
N/A 23.50 N/A 24.06 N/A 0.56
LowerCooks River
LOC 1 Western overbank of Alexandra Canal immediately upstream of newCampbell Road bridge.
2.80 4.90 2.98 5.10 0.18 0.20
LOC 2 Western overbank of Alexandra Canal beneath new GardenersRoad bridge.
2.60 4.55 2.66 4.67 0.06 0.12
LOC 3 Western overbank of Alexandra Canal on Burrows Roadimmediately north (upstream) of Canal Road intersection.
2.67 4.55 2.70 4.67 0.03 0.12
LOC 4 Within residential properties located along the northern (upstream)side of Kogarah Golf Course.
1.96 4.39 2.00 4.53 0.04 0.14
1. Refer Figures 5.7 and 5.8 (sheets 1 and 2) for location of peak flood level identifiers on upper Wolli Creek floodplain and Figures 5.9 and 5.10 (sheets 1 and 2) for location of peak floodlevel identifiers on lower Cooks River floodplain.
2. Peak flood levels are typically quoted to one decimal place to reflect the accuracy of the flood modelling. However, they have been quoted to two decimal places in the above table tohighlight minor differences in levels.
3. A positive value represents an increase in peak flood levels resulting from a partial blockage. Conversely, a negative value represents a decrease in peak flood levels resulting from a partialblockage.

WestConnex New M5 EISTechnical Working Paper: Flooding
WCXM5_Flooding_Rev 1.8_19112015.doc Page 34 Lyall & AssociatesNovember 2015 Rev. 1.8
(blank page)
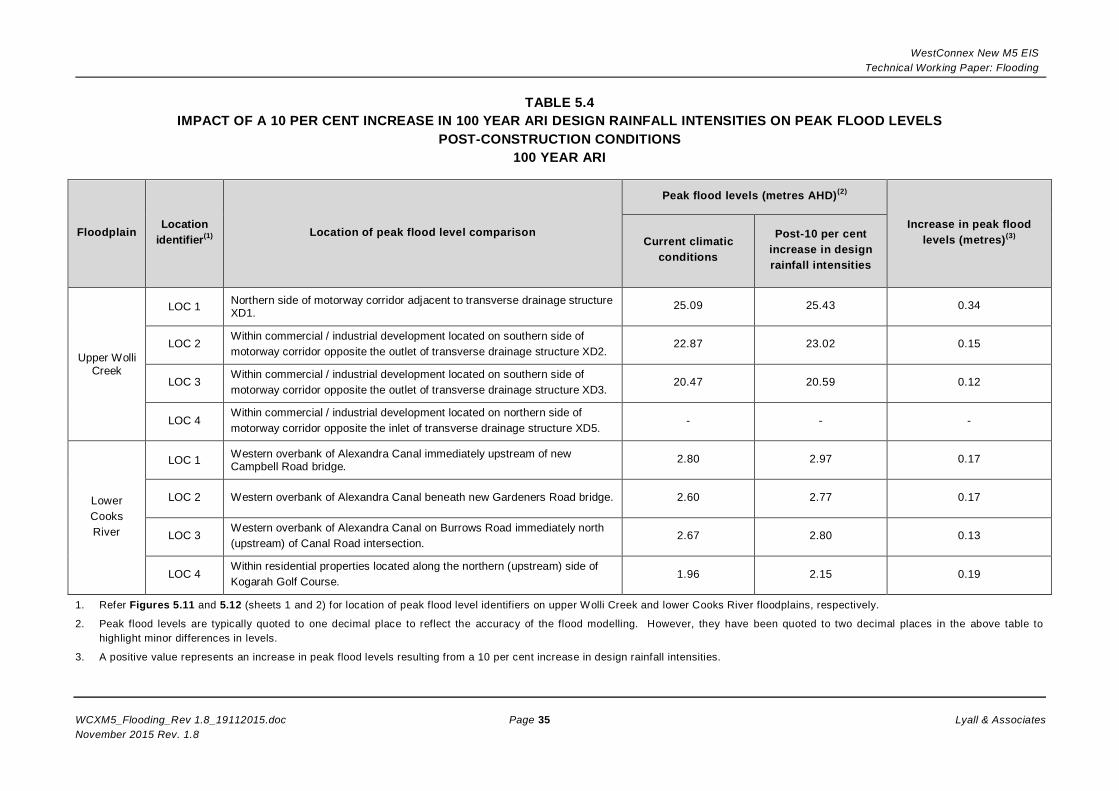
WestConnex New M5 EISTechnical Working Paper: Flooding
WCXM5_Flooding_Rev 1.8_19112015.doc Page 35 Lyall & AssociatesNovember 2015 Rev. 1.8
TABLE 5.4IMPACT OF A 10 PER CENT INCREASE IN 100 YEAR ARI DESIGN RAINFALL INTENSITIES ON PEAK FLOOD LEVELS
POST-CONSTRUCTION CONDITIONS100 YEAR ARI
FloodplainLocation
identifier(1) Location of peak flood level comparison
Peak flood levels (metres AHD)(2)
Increase in peak floodlevels (metres)(3)Current climatic
conditions
Post-10 per centincrease in designrainfall intensities
Upper WolliCreek
LOC 1 Northern side of motorway corridor adjacent to transverse drainage structureXD1.
25.09 25.43 0.34
LOC 2Within commercial / industrial development located on southern side ofmotorway corridor opposite the outlet of transverse drainage structure XD2.
22.87 23.02 0.15
LOC 3Within commercial / industrial development located on southern side ofmotorway corridor opposite the outlet of transverse drainage structure XD3.
20.47 20.59 0.12
LOC 4Within commercial / industrial development located on northern side ofmotorway corridor opposite the inlet of transverse drainage structure XD5.
- - -
LowerCooksRiver
LOC 1 Western overbank of Alexandra Canal immediately upstream of newCampbell Road bridge.
2.80 2.97 0.17
LOC 2 Western overbank of Alexandra Canal beneath new Gardeners Road bridge. 2.60 2.77 0.17
LOC 3Western overbank of Alexandra Canal on Burrows Road immediately north(upstream) of Canal Road intersection.
2.67 2.80 0.13
LOC 4Within residential properties located along the northern (upstream) side ofKogarah Golf Course.
1.96 2.15 0.19
1. Refer Figures 5.11 and 5.12 (sheets 1 and 2) for location of peak flood level identifiers on upper Wolli Creek and lower Cooks River floodplains, respectively.
2. Peak flood levels are typically quoted to one decimal place to reflect the accuracy of the flood modelling. However, they have been quoted to two decimal places in the above table tohighlight minor differences in levels.
3. A positive value represents an increase in peak flood levels resulting from a 10 per cent increase in design rainfall intensities.

WestConnex New M5 EISTechnical Working Paper: Flooding
WCXM5_Flooding_Rev 1.8_19112015.doc Page 36 Lyall & AssociatesNovember 2015 Rev. 1.8
(blank page)
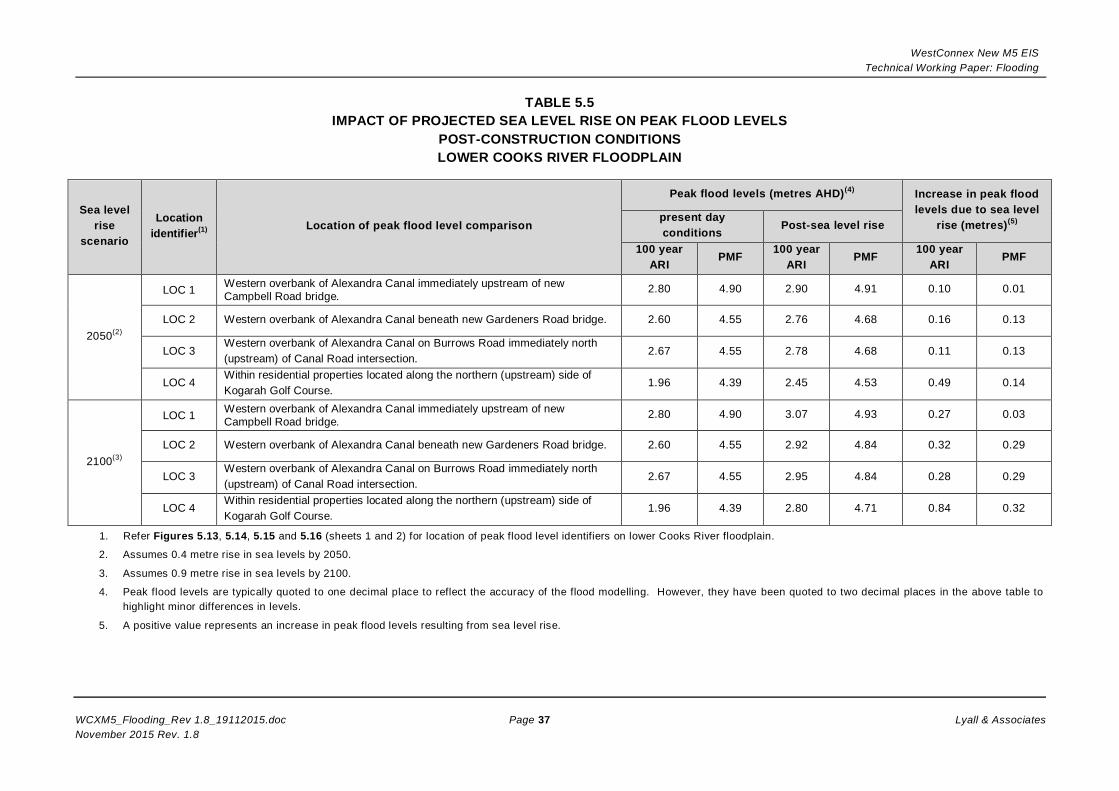
WestConnex New M5 EISTechnical Working Paper: Flooding
WCXM5_Flooding_Rev 1.8_19112015.doc Page 37 Lyall & AssociatesNovember 2015 Rev. 1.8
TABLE 5.5IMPACT OF PROJECTED SEA LEVEL RISE ON PEAK FLOOD LEVELS
POST-CONSTRUCTION CONDITIONSLOWER COOKS RIVER FLOODPLAIN
Sea levelrise
scenario
Locationidentifier(1) Location of peak flood level comparison
Peak flood levels (metres AHD)(4) Increase in peak floodlevels due to sea level
rise (metres)(5)present dayconditions Post-sea level rise
100 yearARI
PMF 100 yearARI
PMF 100 yearARI
PMF
2050(2)
LOC 1 Western overbank of Alexandra Canal immediately upstream of newCampbell Road bridge.
2.80 4.90 2.90 4.91 0.10 0.01
LOC 2 Western overbank of Alexandra Canal beneath new Gardeners Road bridge. 2.60 4.55 2.76 4.68 0.16 0.13
LOC 3Western overbank of Alexandra Canal on Burrows Road immediately north(upstream) of Canal Road intersection.
2.67 4.55 2.78 4.68 0.11 0.13
LOC 4Within residential properties located along the northern (upstream) side ofKogarah Golf Course.
1.96 4.39 2.45 4.53 0.49 0.14
2100(3)
LOC 1 Western overbank of Alexandra Canal immediately upstream of newCampbell Road bridge.
2.80 4.90 3.07 4.93 0.27 0.03
LOC 2 Western overbank of Alexandra Canal beneath new Gardeners Road bridge. 2.60 4.55 2.92 4.84 0.32 0.29
LOC 3Western overbank of Alexandra Canal on Burrows Road immediately north(upstream) of Canal Road intersection.
2.67 4.55 2.95 4.84 0.28 0.29
LOC 4Within residential properties located along the northern (upstream) side ofKogarah Golf Course.
1.96 4.39 2.80 4.71 0.84 0.32
1. Refer Figures 5.13, 5.14, 5.15 and 5.16 (sheets 1 and 2) for location of peak flood level identifiers on lower Cooks River floodplain.
2. Assumes 0.4 metre rise in sea levels by 2050.
3. Assumes 0.9 metre rise in sea levels by 2100.
4. Peak flood levels are typically quoted to one decimal place to reflect the accuracy of the flood modelling. However, they have been quoted to two decimal places in the above table tohighlight minor differences in levels.
5. A positive value represents an increase in peak flood levels resulting from sea level rise.

WestConnex New M5 EISTechnical Working Paper: Flooding
WCXM5_Flooding_Rev 1.8_19112015.doc Page 38 Lyall & AssociatesNovember 2015 Rev. 1.8
(blank page)

WestConnex New M5 EISTechnical Working Paper: Flooding
WCXM5_Flooding_Rev 1.8_19112015.doc Page 39 Lyall & AssociatesNovember 2015 Rev. 1.8
6 ASSESSMENT OF POTENTIAL FLOOD MITIGATION MEASURES
6.1 Proposed flood mitigation strategy
A Flood Management Strategy (FMS) would be prepared for flood prone or flood affected landprior to construction, or as otherwise agreed by the Secretary, to ensure that the project does notexacerbate existing flooding characteristics within the vicinity of the project. The Strategy wouldinclude but not be limited to:
(a) The identification of flood risks to the project and adjoining areas, including theconsideration of local drainage catchment assessments, and climate change implicationson rainfall, drainage and tidal characteristics;
(b) Identify design and mitigation measures that would be implemented to protect proposedoperations and not worsen existing flooding characteristics during construction andoperation, including soil erosion and scouring;
(c) Identifying drainage system upgrades;
(d) The preparation of a flood/emergency management plan; and
(e) The strategy is to be prepared in consultation with the relevant Council’s.
The strategy would be prepared by a suitably qualified and experienced person in consultationwith directly affected landowners, the NSW Office of Water, OEH, and relevant Councils.
The strategy would be peer reviewed and confirmed as meeting the requirements of this conditionby a suitably qualified and experienced independent hydrological engineer. The strategy shall besubmitted to the Secretary and the relevant council prior to the commencement of construction inthe vicinity of the flood prone land and overland flow paths for the waterways and catchments inthe vicinity of the project, or as otherwise agreed by the Secretary.
The following section of this chapter lists measures which should be considered during thepreparation of the FMS in regards the project related flood risks and impacts.
6.2 General flood mitigation requirements
The assessment of flood impacts associated with the project has provided an understanding ofthe scale and nature of the flood risk to the project infrastructure and its operation, as well as theincreased flood risks on the surrounding environment. A broad outline of measures which wouldneed to be implemented in order to manage the project related flood risks and impacts areoutlined below.
Tunnel portals and ancillary facilities
· Tunnel entries and associated flood protection barriers are to be located above the PMFlevel or the 100 year ARI flood level plus 0.5 metres (whichever is greater).1
· The same hydrologic standard would be applied to tunnel ancillary facilities such astunnel ventilation and water treatment plants where the ingress of floodwaters would alsohave the potential to flood the tunnels.
1 The energy grade line computed by the Wolli Creek HEC-RAS model is considered to represent the upperlimit of potential flooding along the reach of Wolli Creek downstream of Kingsgrove Road and should beused for setting critical levels such as the ingress points to the Bexley Road South motorway operationscomplex. Refer Section A4 in Appendix A of this technical working paper for background to thedevelopment of the Wolli Creek HEC-RAS Model.
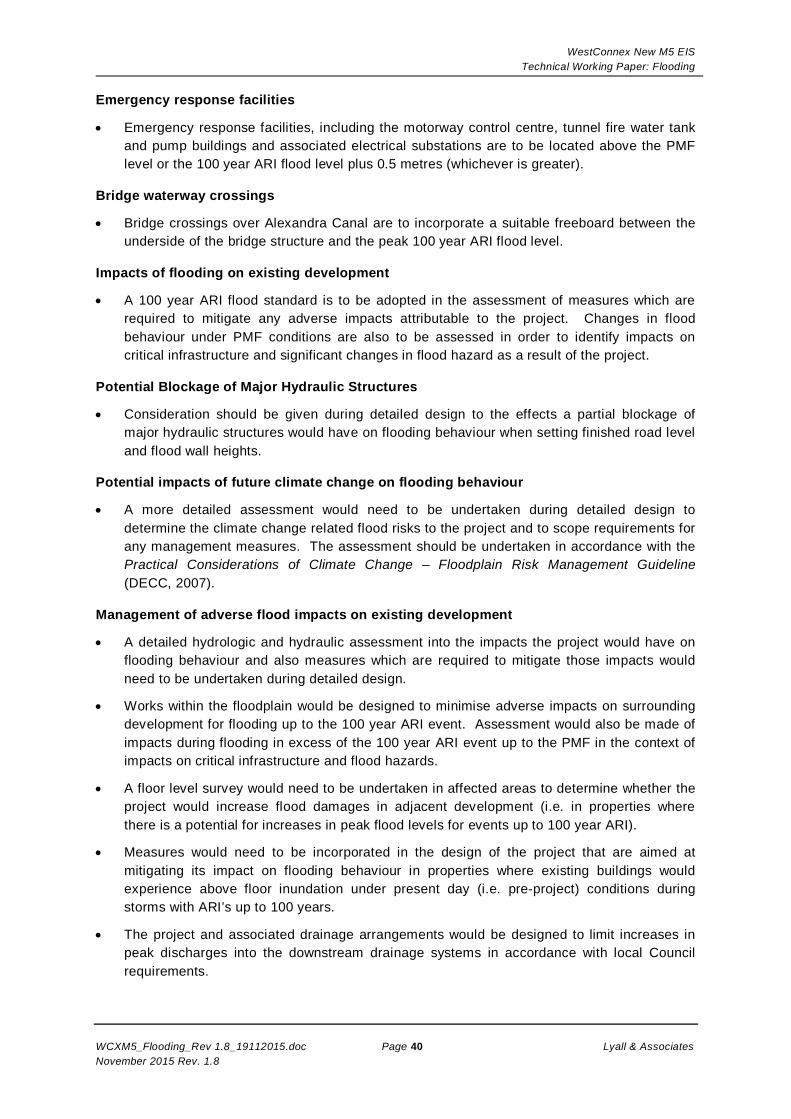
WestConnex New M5 EISTechnical Working Paper: Flooding
WCXM5_Flooding_Rev 1.8_19112015.doc Page 40 Lyall & AssociatesNovember 2015 Rev. 1.8
Emergency response facilities
· Emergency response facilities, including the motorway control centre, tunnel fire water tankand pump buildings and associated electrical substations are to be located above the PMFlevel or the 100 year ARI flood level plus 0.5 metres (whichever is greater).
Bridge waterway crossings
· Bridge crossings over Alexandra Canal are to incorporate a suitable freeboard between theunderside of the bridge structure and the peak 100 year ARI flood level.
Impacts of flooding on existing development
· A 100 year ARI flood standard is to be adopted in the assessment of measures which arerequired to mitigate any adverse impacts attributable to the project. Changes in floodbehaviour under PMF conditions are also to be assessed in order to identify impacts oncritical infrastructure and significant changes in flood hazard as a result of the project.
Potential Blockage of Major Hydraulic Structures
· Consideration should be given during detailed design to the effects a partial blockage ofmajor hydraulic structures would have on flooding behaviour when setting finished road leveland flood wall heights.
Potential impacts of future climate change on flooding behaviour
· A more detailed assessment would need to be undertaken during detailed design todetermine the climate change related flood risks to the project and to scope requirements forany management measures. The assessment should be undertaken in accordance with thePractical Considerations of Climate Change – Floodplain Risk Management Guideline(DECC, 2007).
Management of adverse flood impacts on existing development
· A detailed hydrologic and hydraulic assessment into the impacts the project would have onflooding behaviour and also measures which are required to mitigate those impacts wouldneed to be undertaken during detailed design.
· Works within the floodplain would be designed to minimise adverse impacts on surroundingdevelopment for flooding up to the 100 year ARI event. Assessment would also be made ofimpacts during flooding in excess of the 100 year ARI event up to the PMF in the context ofimpacts on critical infrastructure and flood hazards.
· A floor level survey would need to be undertaken in affected areas to determine whether theproject would increase flood damages in adjacent development (i.e. in properties wherethere is a potential for increases in peak flood levels for events up to 100 year ARI).
· Measures would need to be incorporated in the design of the project that are aimed atmitigating its impact on flooding behaviour in properties where existing buildings wouldexperience above floor inundation under present day (i.e. pre-project) conditions duringstorms with ARI’s up to 100 years.
· The project and associated drainage arrangements would be designed to limit increases inpeak discharges into the downstream drainage systems in accordance with local Councilrequirements.
WestConnex New M5 EISTechnical Working Paper: Flooding
WCXM5_Flooding_Rev 1.8_19112015.doc Page 41 Lyall & AssociatesNovember 2015 Rev. 1.8
The following sections of this chapter provide a brief overview of the approach which should beadopted to addressing the impact of the project on flooding behaviour in existing developmentwhich is located on the upper Wolli Creek and lower Cooks River floodplains.
6.3 Upper Wolli Creek floodplain
6.3.1 Flooding in existing residential development
The project would not exacerbate flooding conditions in existing residential development forevents up to 100 year ARI. However, the assessment has was found that peak PMF levels wouldbe increased in seven residential properties which are located immediately to the west of theCanterbury Golf Course in Elouera Street and Kirrang Street, Beverly Hills.
As evacuation of the seven residential properties would still be possible by foot for all events upto the PMF and given that their development potential for residential purposes would not beaffected by the project (i.e. because these properties are located on land which lies above theFlood Planning Level (FPL), which in the Canterbury LGA is equal to the peak 100 year ARI floodlevel plus 0.5 metre freeboard), it is not considered necessary to implement measures whichwould be aimed at mitigating the effects of the project on peak PMF levels.
6.3.2 Flooding in existing commercial/industrial development
The assessment found that the project would increase peak 100 year ARI flood levels by amaximum of about 20 millimetres in two flood prone commercial/industrial properties that arelocated on the southern side of the motorway corridor opposite the outlet of transverse drainagestructures XD3 and XD4 (refer Figure 5.2, sheet 1).
Further design development would be undertaken during detailed design which would be aimedat mitigating the impact of the project on flooding conditions in the two properties. Measuresaimed at mitigating the impact of the project on flooding conditions in the two properties couldinclude modification of entrance / exit channels to the transverse drainage structures to balanceflow impacts upstream and downstream of the motorway and/or the inclusion of localiseddetention along the northern side of the corridor. The assessment would include consideration ofwhether the project would result in above-floor inundation of these properties.
6.4 Lower Cooks River floodplain
6.4.1 Flooding in existing residential development
The assessment has found that the loss of about 12,000 cubic metres of floodplain storage due tothe construction of the Arncliffe motorway operations complex has the potential to increase peak100 year ARI flood levels by up to about 10 millimetres in seven residential properties that arelocated along the northern (upstream) side of Marsh Street. The potential impacts would beconfirmed during detailed design based on the final layout of the motorway operations complexand the finished floor levels of the buildings on Marsh Street.
The option of providing compensatory flood storage in the northern portion of the Kogarah GolfCourse to recapture a portion of the 12,000 cubic metres of lost floodplain storage and theimpacts that this would have on flooding conditions in the affected properties was assessed aspart of the present investigation. A preliminary investigation found that it would be necessary torecapture about 8,000 cubic metres of lost floodplain storage in order to mitigate the impacts ofthe project on flooding conditions in the seven residential properties. This could be achieved bylowering natural surface levels within the construction footprint of the project by 200 millimetres
WestConnex New M5 EISTechnical Working Paper: Flooding
WCXM5_Flooding_Rev 1.8_19112015.doc Page 42 Lyall & AssociatesNovember 2015 Rev. 1.8
on average. Figure 6.1 shows the impact the lowering of natural surface levels within thenorthern portion of Kogarah Golf Course would have on flooding behaviour. However, the finaldesign solution and requirement (and extent) for compensatory flood storage would bedetermined during detailed design.
Further design development would be undertaken during detailed design to confirm the extent ofworks required to mitigate the impact of the project on flooding conditions within existingresidential development.
6.4.2 Flooding in existing commercial/industrial development
The investigation found that peak 100 year ARI flood levels would be increased by a maximum ofabout 30 millimetres in two commercial/industrial properties that are located on the westernoverbank of Alexandra Canal, immediately upstream of Campbell Road bridge.
Further design development would need to be undertaken during detailed design in order tomitigate the impact of the project on flooding conditions in the two properties. This would includefurther refinement of design of the relief drain, as well as the western approach to the CampbellRoad bridge.
6.4.3 Flooding in TransGrid’s Beaconsfield West Substation
The investigation found that peak 100 year ARI flood levels would be increased by a maximum ofabout 30 millimetres in the recently upgraded portion of TransGrid’s Beaconsfield WestSubstation. As previously mentioned, TransGrid advised that while a conservative approach wasadopted in the recent upgrade of the substation, whereby critical infrastructure was positionedmetres AHD), all transformer switch bays and reactive plant were set at ground level (at aboutRL two metres AHD) as per the existing design philosophy for the site.
Further design development would need to be undertaken during detailed design in order tomitigate the impact of the project on flooding conditions in the TransGrid site. This would includefurther refinement of design of the relief drain, as well as the western approach to the CampbellRoad bridge.
WestConnex New M5 EISTechnical Working Paper: Flooding
WCXM5_Flooding_Rev 1.8_19112015.doc Page 43 Lyall & AssociatesNovember 2015 Rev. 1.8
7 REFERENCES
AECOM, 2015. “Technical Working Paper: Surface Water”.
Botany Bay City Council, 2013. “Botany Bay City Council Development Control Plan 2013”.
Botany Bay City Council, 2013. “Stormwater Management Technical Guidelines – December2013”.
Bureau of Meteorology, 2003. “The Estimation of Probable Maximum Precipitation in Australia:Generalised Short-Duration Method”.
Canterbury City Council, 2012. “Canterbury Development Control Plan 2012”.
City of Sydney Council, 2012. “Sydney Development Control Plan”
Department of Environment and Climate Change, 2007. “Floodplain Risk Management Guideline:Practical Considerations of Climate Change”.
Department of Environment and Climate Change, 2008. “Fort Denison Sea Level RiseVulnerability Study”.
Department of Environment, Climate Change and Water, 2009. “Derivation of the NSWGovernment’s Sea Level Rise Planning Benchmarks. Technical Note”.
Department of Environment, Climate Change and Water, 2010. “Flood Risk Management Guide:Incorporating Sea Level Rise Benchmarks in Flood Risk Assessments”.
Department of Infrastructure, Planning and Natural Resources, 2005. “Floodplain DevelopmentManual: the management of flood liable land”.
Department of Planning, 2010. “Coastal Planning Guideline – Adapting to Sea Level Rise”.
Department of Planning, 2010. “Coastal Risk Management Guideline – Incorporating Sea LevelRise Benchmarks in Coastal Risk Assessments”.
Engineers Australia, 2013 “AR&R Revision projects – project 11 – Blockage of HydraulicStructures”.
Hurstville City Council, 2012. “Hurstville Development Control Plan 1- LGA Wide DCP”.
Intergovernmental Panel on Climate Change, 2007. “Climate Change 2007: The PhysicalScience Basis. Summary for Policymakers” Contribution of Working Group I to the FourthAssessment Report of the Intergovernmental Panel on Climate Change, 5 February 2007.
Marrickville City Council, 2011. “Marrickville Development Control Plan 2011”.
McInnes K., Macadam I., Abbs D., O’Farrell S., O’Grady J., Ranasinghe R., “Projected Changesin Climatological Forcing Conditions for Coastal Erosion in NSW” Australasian Ports and CoastsConference, Melbourne, July 2007.
WestConnex New M5 EISTechnical Working Paper: Flooding
WCXM5_Flooding_Rev 1.8_19112015.doc Page 44 Lyall & AssociatesNovember 2015 Rev. 1.8
Rockdale City Council, 2011. “Rockdale Development Control Plan 2011”.
The Institution of Engineers, Australia, 1998. “Australian Rainfall and Runoff – A Guide to FloodEstimation”.

FIGURES

(blank page)
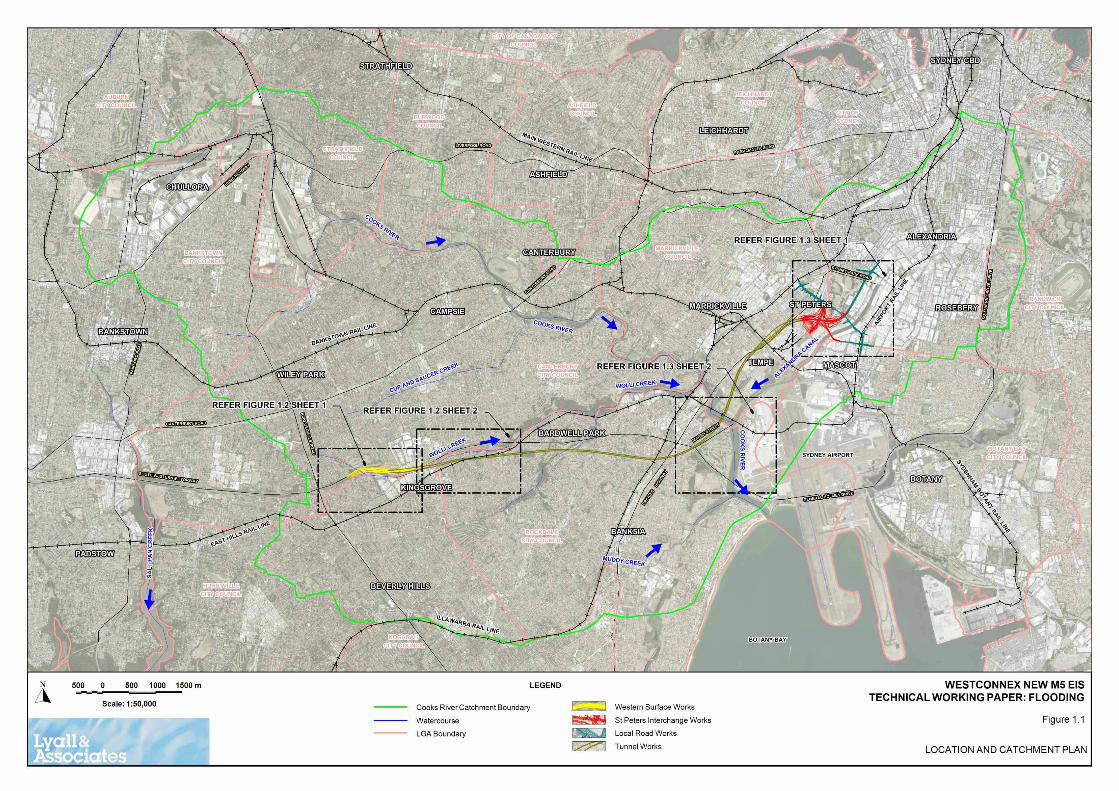
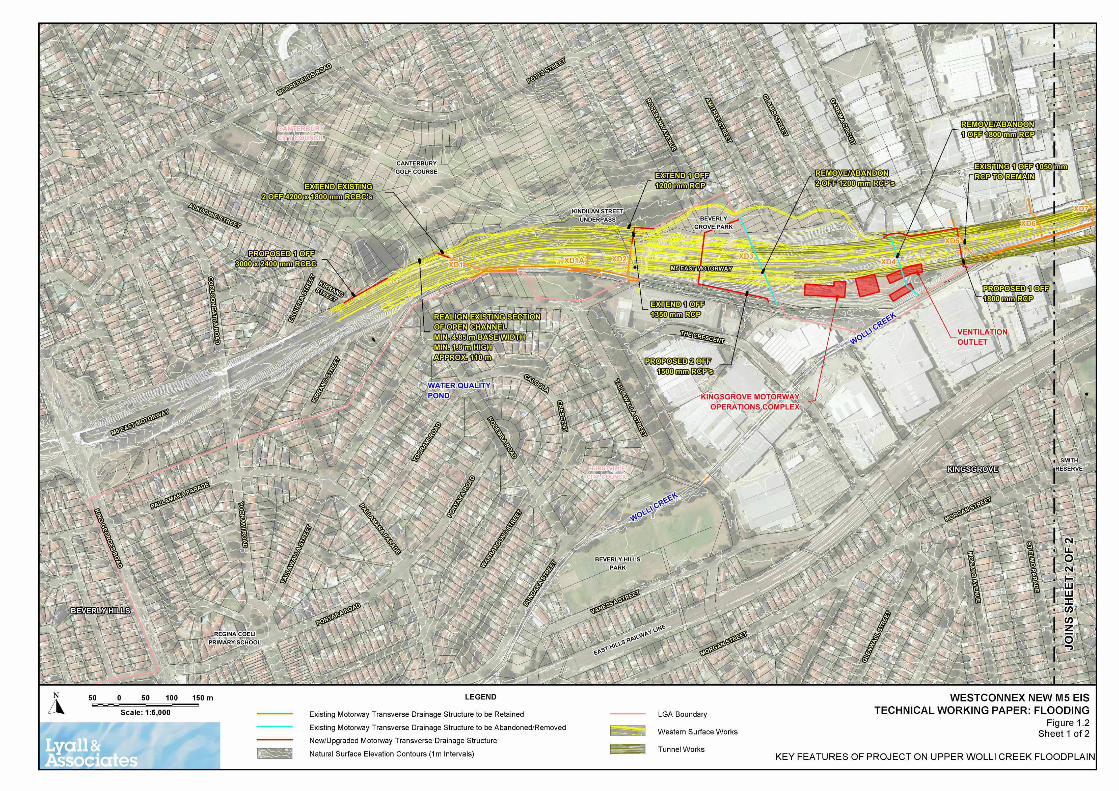
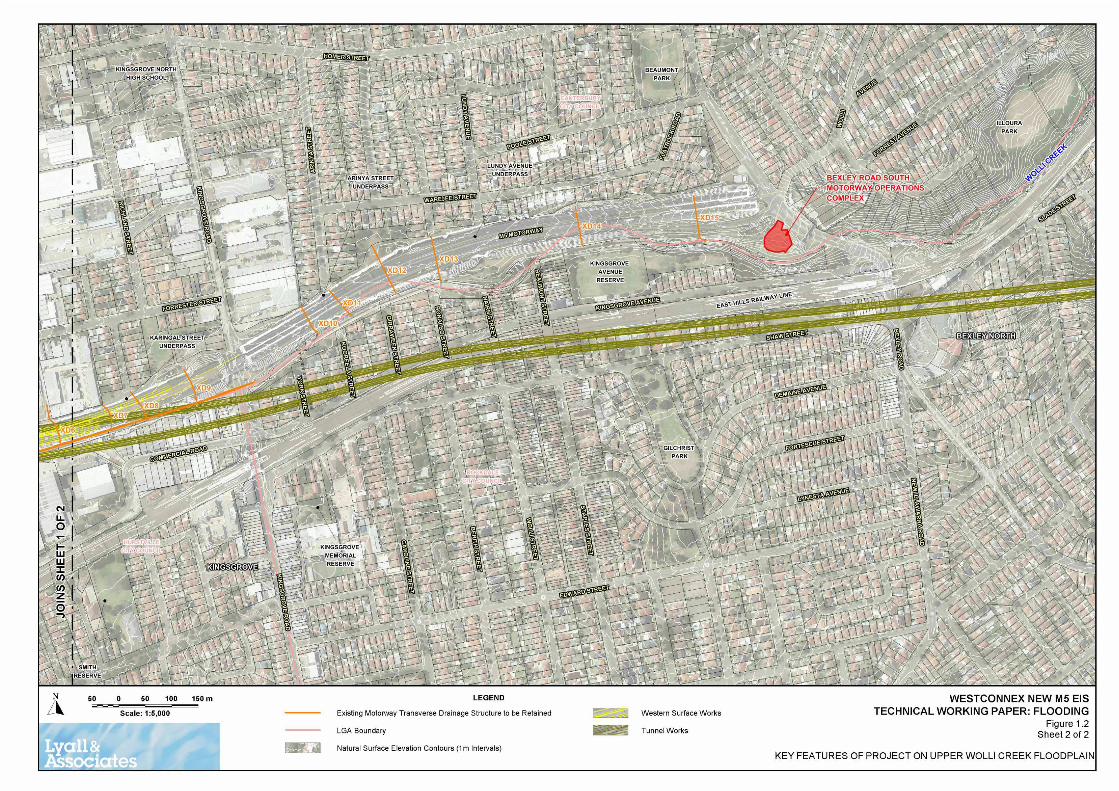
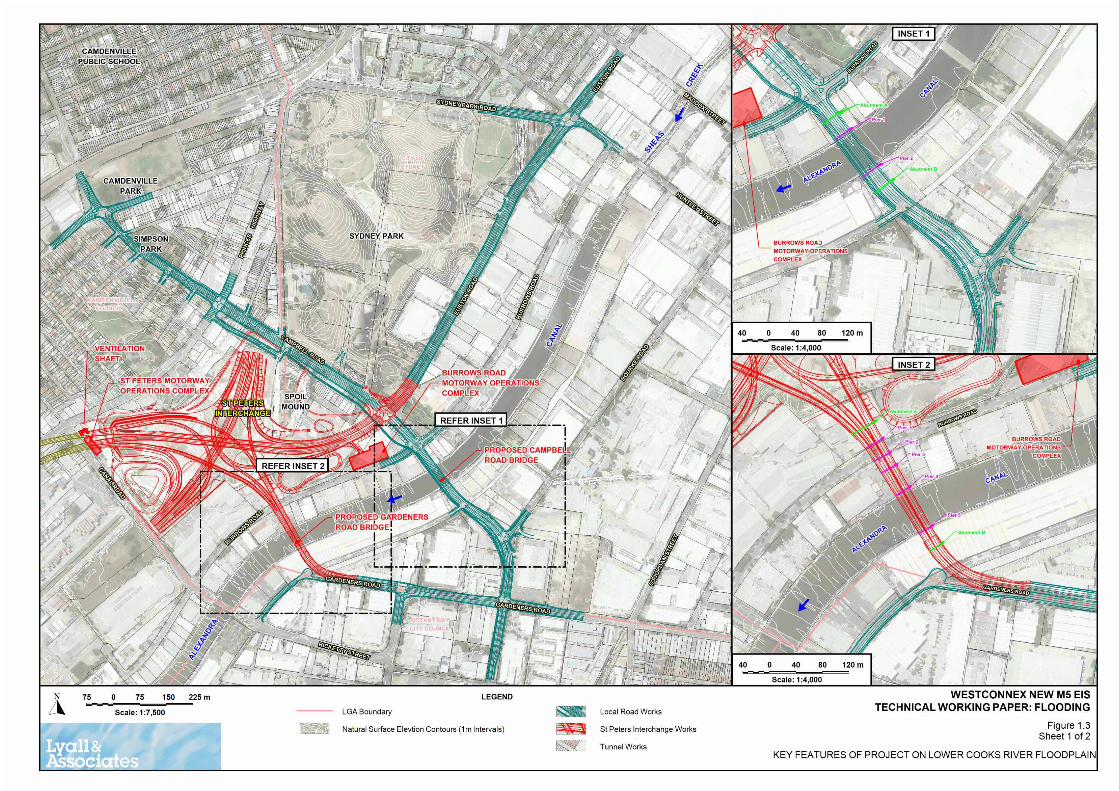
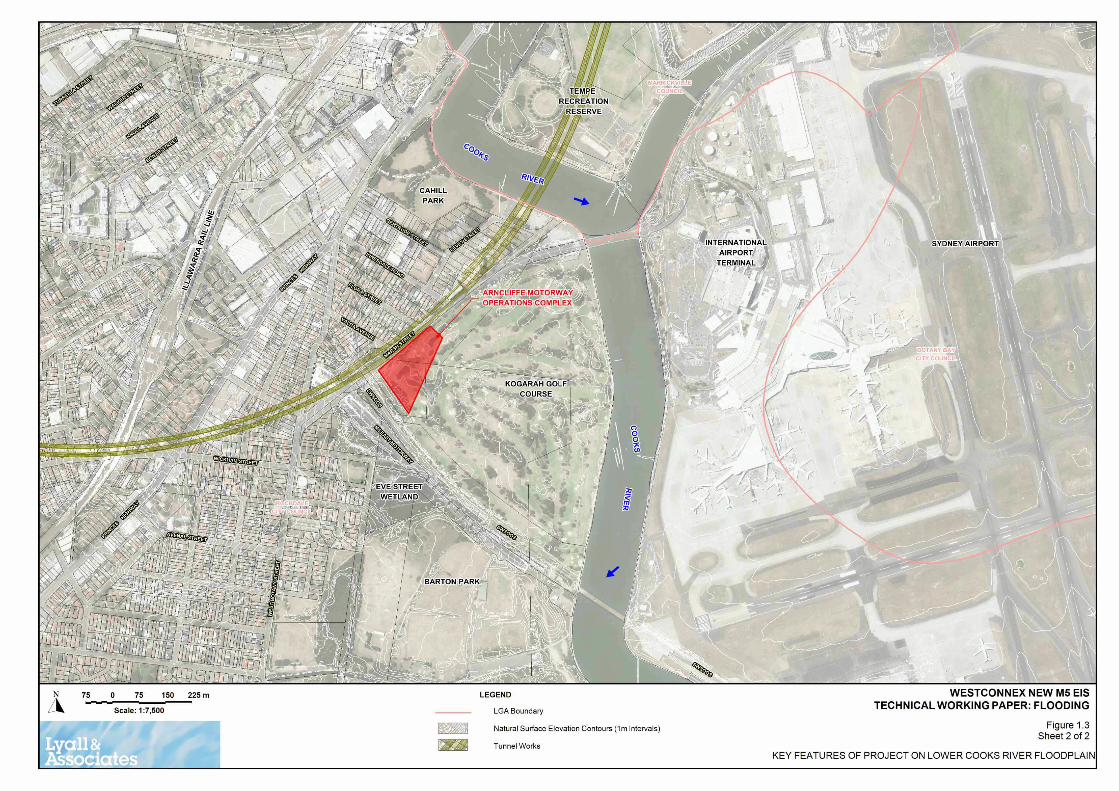
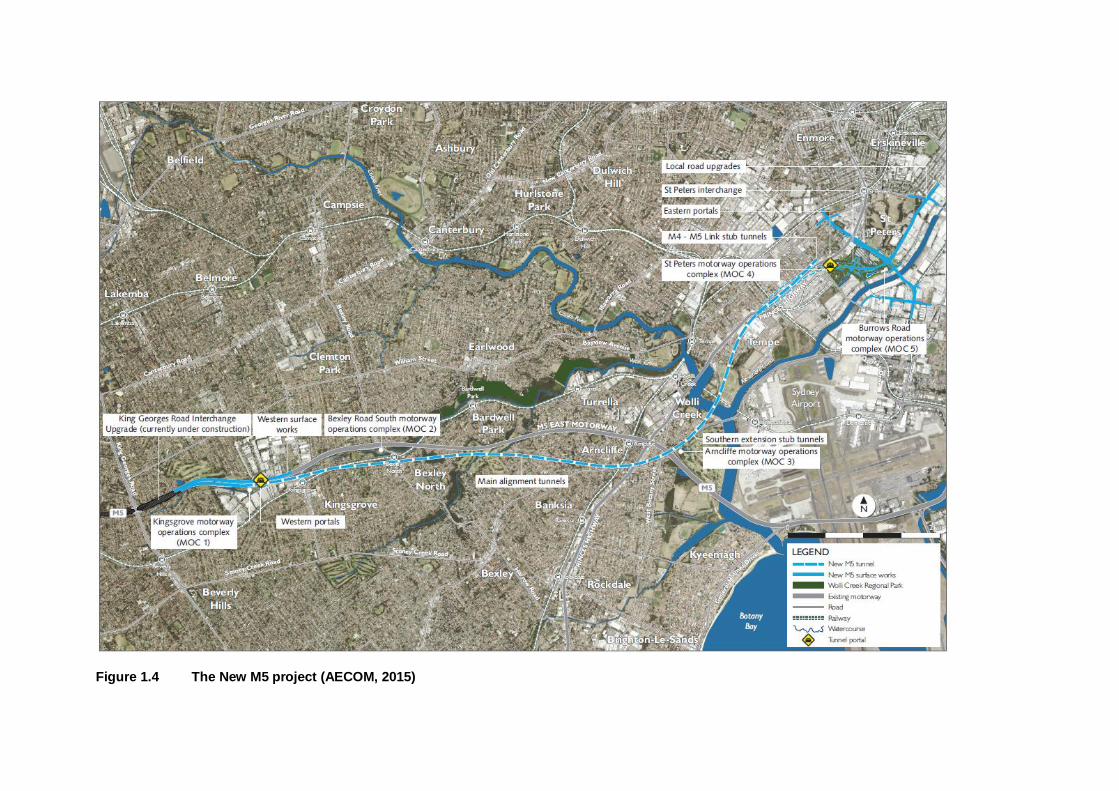
Figure 1.4 The New M5 project (AECOM, 2015)