Embed Size (px)
Citation preview

PAPG May Meeting Taylor McClain Range Resources

Introduction
Objectives
Study area and dataset
Geologic Setting
Sequence stratigraphy Present understanding
Cross-sections and interpretations
Regional maps
Petrophysics Passey TOC, density TOC
Regional TOC maps
Porosity and water saturation modeling
Hydrocarbon potential Normalized oil
Peak porosity
Initial production and percent liquids reported to date

Upper Ordovician black shale and limestone
Historic production dating to early 1900’s
Modern organic source-rock play
Vernon/Sandy Creek
Bluetail-Rooster
Albion-Scipio
Lima Indiana
Fractured interbedded play
Point Pleasant Play

Create a depositional model for the Utica-Point Pleasant interval in eastern OH and western PA.
Create stratigraphic architecture consistent between states
Correlate core data and wireline logs to calculate and map total organic carbon (TOC) and porosity.
Investigate relationship of high TOC intervals to sequence stratigraphy and basin structure
Identify prospective production fairways
Map geochemisty to determine source potential and maturity

Ohio, WV, PA, NY
300 well logs
2 measured cores
~100 wells with core TOC, Rock-eval data

Late Middle-Ordovician Paleogeography
N.E. North America situated 20-25°S latitude
Great American Carbonate Platform
Collision with island arc sets up Taconic foreland basin
Blakey, 2005, Northern Arizona Univ. Dept. of Geology; http://jan.ucc.nau.edu

Brett and Baird (2002)
Atypical foreland basin
Cross-strike lineaments create sub-basins
Sebree trough
Pennsylvania basin
Point Pleasant sub-basin
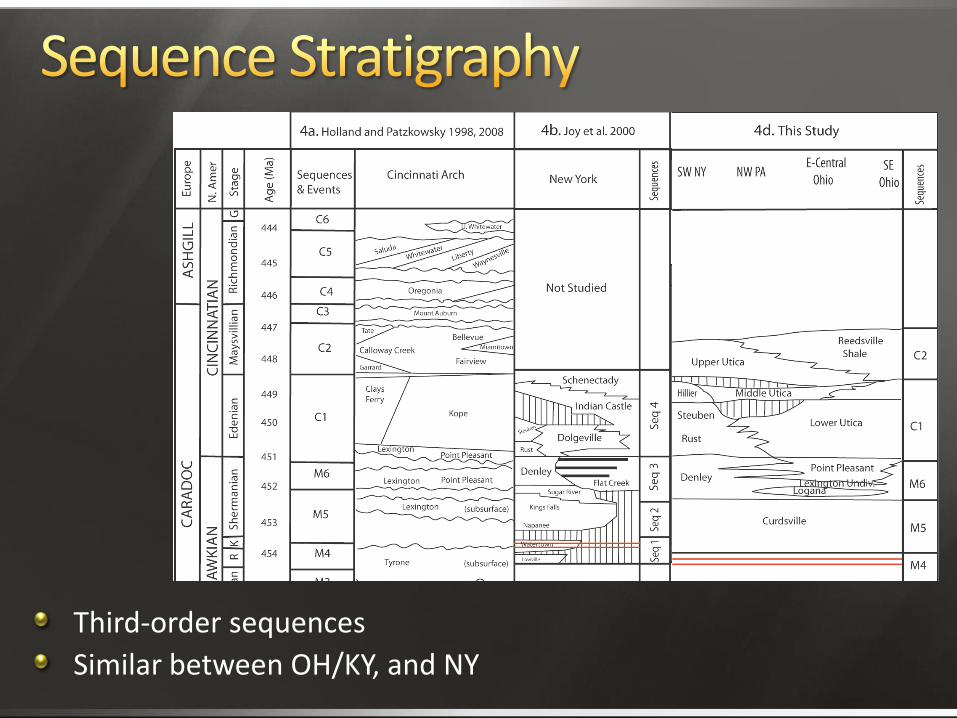
Third-order sequences
Similar between OH/KY, and NY

Cores from SW Ohio matched to logs
Correlated to study area
McLaughlin et al. (2004)
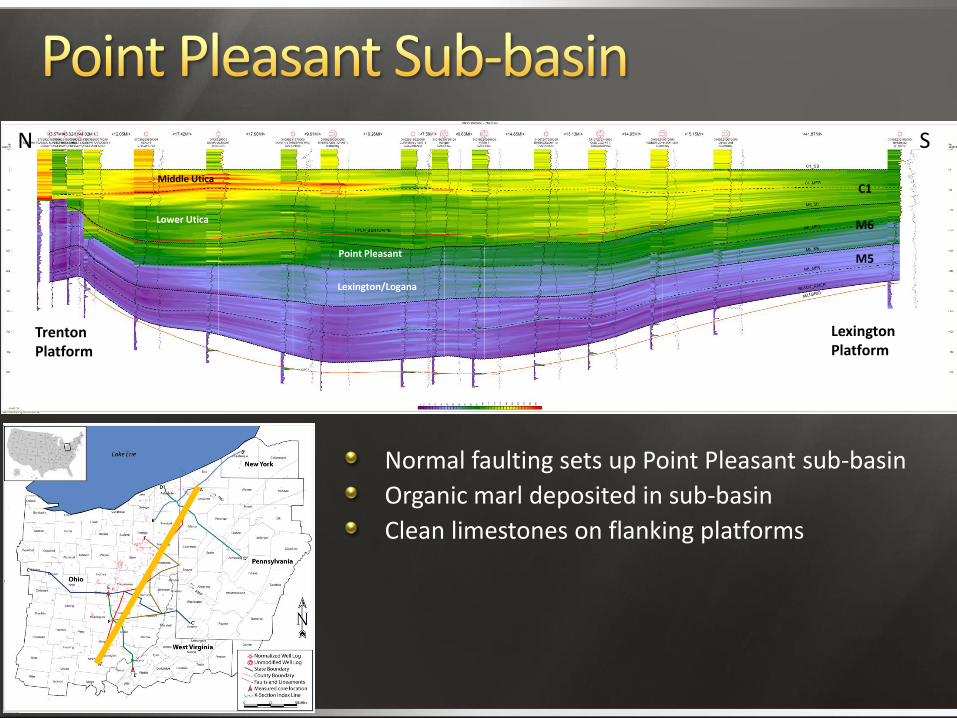
Normal faulting sets up Point Pleasant sub-basin
Organic marl deposited in sub-basin
Clean limestones on flanking platforms
N S
Point Pleasant
Lexington/Logana
Middle Utica
Lower Utica
Lexington Platform
Trenton Platform
M5
M6
C1

Organic Trenton
Upper Utica
Middle Utica
Lower Utica
N S
M5
M6
C1
C2
Brett and Baird (2002)

N S
E Canada K-b
Manheim K-b
Deer River K-b
Sherman Falls K-b
Lehman et al. (1995)

PPLN grades into Lexington platform carbonates
Utica downlaps, becomes less shale-rich
Lexington
N S
Lexington Platform
M5
M6
C1

Widespread clean carbonates
No tectonic activity

Subsidence and relative sea level increasing
Trenton Platform develops
Gentle slope
Clean LS at edge, lagoonal facies behind
Sub-basins with marl

Sharp edge at platform
Water depth differences
Subsidence, relative sea level increase
Platform retreating
Sebree trough becoming apparent

Steep edge platform, sharp facies change

Platform area significantly reduced
Black shale in the Sebree trough

Westward shift in black shale

Trenton-Utica strata are a 2nd-order transgression Utica shale marks maximum flooding surface
Four, 3rd-order sequences present (M5, M6, C1, C2)
Lowstand deposits absent, sequences separated by type 3 sequence boundaries
Amalgamation of the TS with the SB
Normal faulting along CSD’s creates steep paleo-topography, resulting in sharp facies changes
Upper Utica recognized to the north Younger than Utica shale in the south

Passey Method Porosity and resistivity respond to organic matter
Overlay logs, magnitude of separation proportional to organic content
Works best with sonic-logR, rhob-logR has two different baselines ΔLogR

0 1 2 3 4 5
LOGR - Log10(HLLD)
3
2.9
2.8
2.7
2.6
2.5
2.4
2.3
2.2
2.1
2
RH
OB
- B
ulk
Density
{F
13.4
}
0
10
20
30
40
50
60
70
80
90
100
110
120
130
140
150
160
170
180
190
200
GR
_U
TIC
A_N
RM
- GR
Utic
a N
rm L
og - c
ut fo
r Utic
a in
terv
a
6900
6950
7000
7050
7100
7150
7200
7250
7300
7350
7400
7450
7500
LOGR
(0-5)
RHOB
(3-2)
GR_UTICA_NRM
(0-200)
RHOB = 0.05359223*LOGR + 2.5384 StdErr=0.0967
WELL: 34029215930000 (1267 samples)
Utica Database - TMcClain
PETRA 12/19/2012 5:51:13 PM Plot Log10 of resistivity
Best fit line on non-organic rock (limestone)
Compute pseudo bulk density log (RhobR)
-0.2 -0.1 0 0.1 0.2 0.3 0.4
DELTRHOBR - Delta RHOBR - RHOB
0
1
2
3
4
5
6
7
8
9
10
CO
RE
_T
OC
-
0
10
20
30
40
50
60
70
80
90
100
110
120
130
140
150
160
170
180
190
200
GR
_U
TIC
A_N
RM
- GR
Utic
a N
rm L
og - c
ut fo
r Utic
a in
terv
a
CORE_TOC = 9.41689881*DELTRHOBR + 1.2086 Corr=0.819 StdErr=0.5379
91 Samples f or 5 out of 7 Wells
Utica Database - TMcClain
PETRA 3/1/2013 5:17:21 PM Calculate magnitude of separation between density and pseudo-density
Plot against TOC
Slope of line varies with LOM
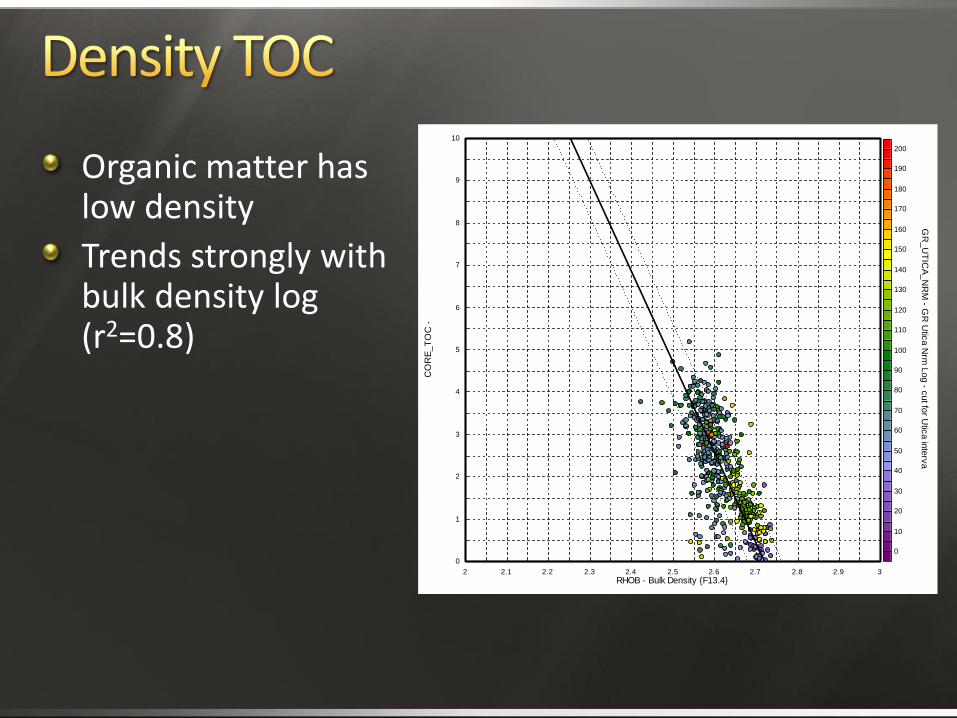
Organic matter has low density
Trends strongly with bulk density log (r2=0.8)
2 2.1 2.2 2.3 2.4 2.5 2.6 2.7 2.8 2.9 3
RHOB - Bulk Density {F13.4}
0
1
2
3
4
5
6
7
8
9
10
CO
RE
_T
OC
-
0
10
20
30
40
50
60
70
80
90
100
110
120
130
140
150
160
170
180
190
200
GR
_U
TIC
A_N
RM
- GR
Utic
a N
rm L
og - c
ut fo
r Utic
a in
terv
a
CORE_TOC = (-21.34105257)*RHOB + 58.0943 Corr=-0.704 StdErr=0.8694
499 Samples f or 6 out of 6 Wells
Utica Database - TMcClain
PETRA 12/19/2012 5:11:16 PM
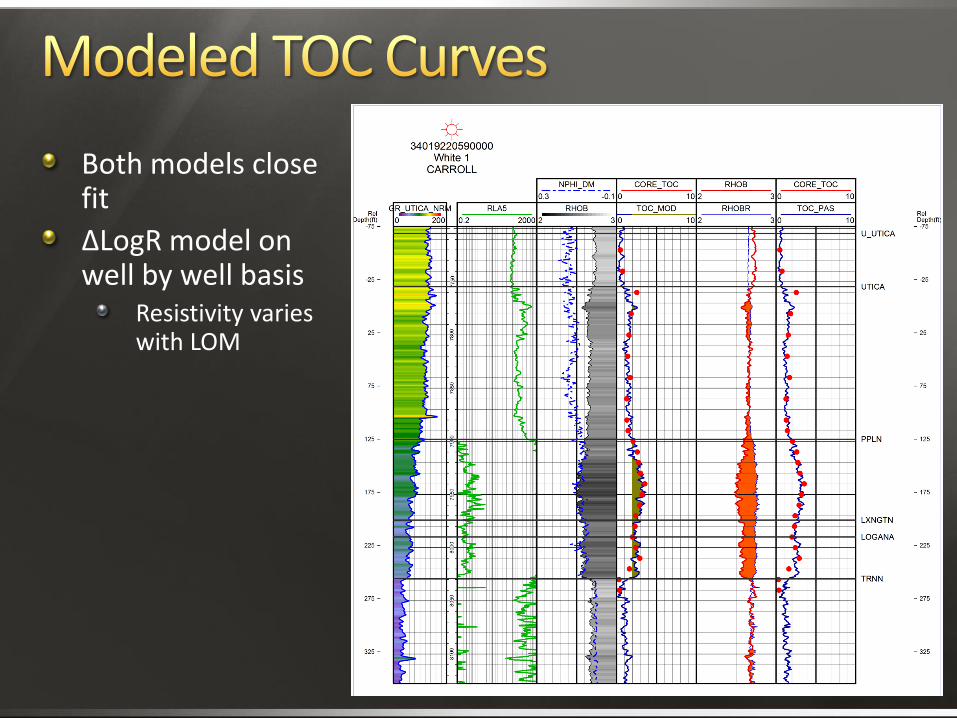
Both models close fit
ΔLogR model on well by well basis
Resistivity varies with LOM

Organic-rich strata focused in sub-basin
Clean carbonates on platforms
Point Pleasant sub-basin
Trenton platform
Lexington platform

Same footprint as M6, more restricted
Lines up with P-MW lineament zone

Organic-rich depocenter broadens
Highest organics to south
P-MW lineament dropping to the south

Organic-rich strata in Pennsylvania basin
Pennsylvania basin
Trenton platform

Point Pleasant TOC increases to south
Utica TOC increases to north

Core data from Fred Barth
Fit with bulk density

Very low Sw in Point Pleasant
Utica organic lean
Shallow-deep resistivity separation indicates perm
Sw Phi TOC Vclay/Vcarb

S1 - generated HC’s
S2 – Potential HC’s
S1 decreases into dry gas phase
Gaseous HC’s lost during sample recovery

S1/TOC*100
Evaluate source potential and maturity
Mix of gas and liquids needed for production

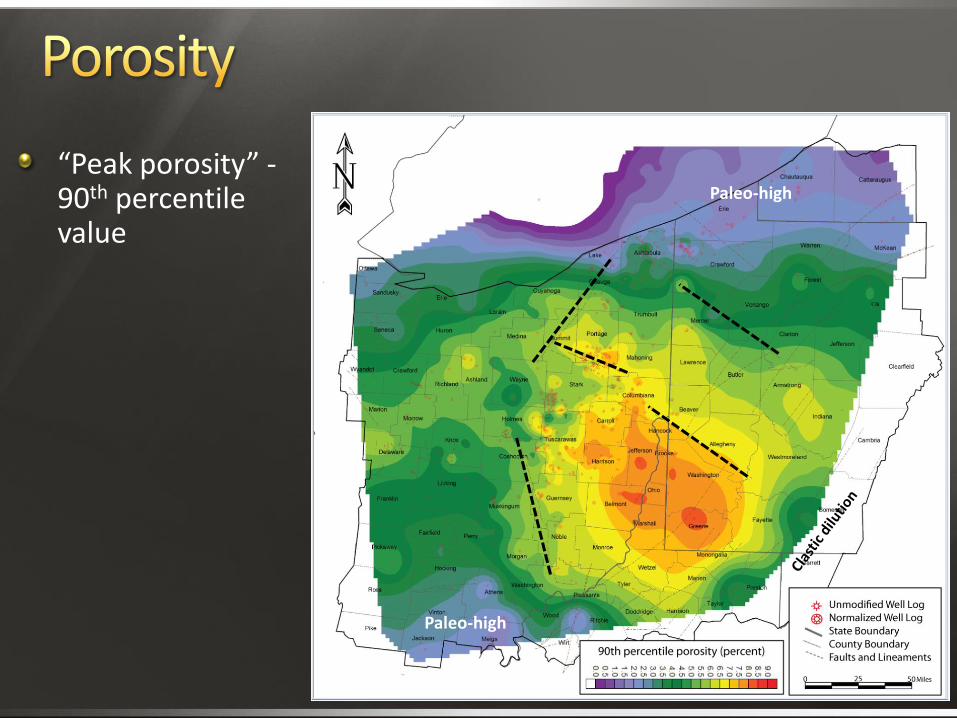
“Peak porosity” - 90th percentile value
Paleo-high
Paleo-high

Lower IP’s where Utica source
Higher IP’s where Utica seals

Thick calcareousLexington/Logana
Organic Utica Section
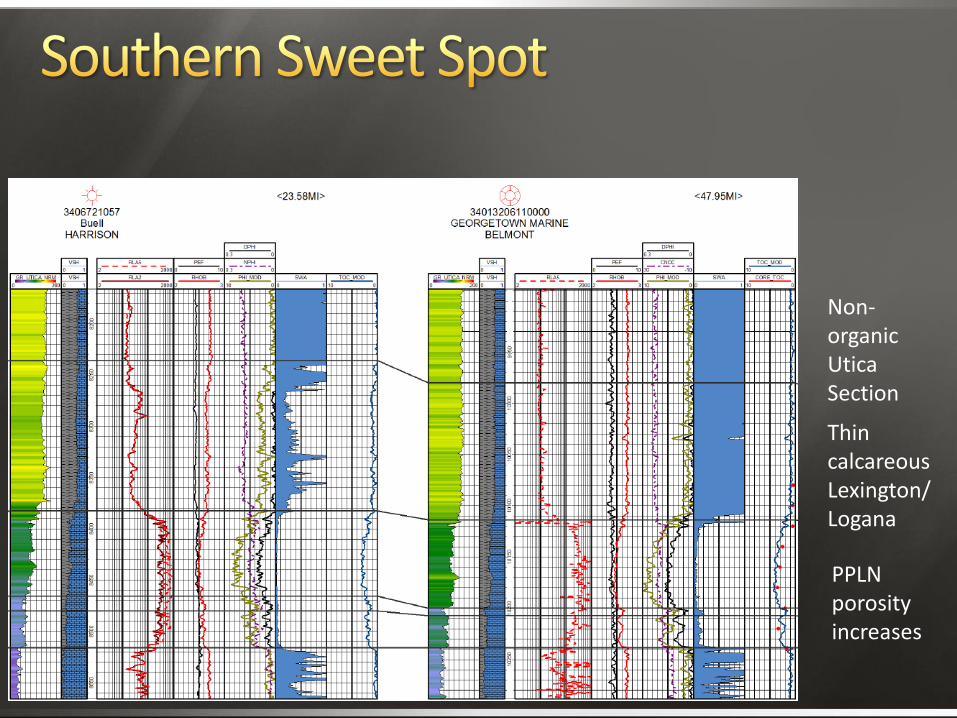
Thin calcareousLexington/Logana
Non-organic Utica Section
PPLN porosity increases

Density shows strong correlation with TOC and porosity ΔLogR method based on maturity
Point Pleasant contains highest TOC and porosity, lowest Sw Utica Shale contains low organic strata
TOC concentrated in Point Pleasant sub-basin
Normalized oil content mapping shows source potential and thermal maturity
Peak porosity map identifies “sweet spot” PPLN thickness increases to the north
Porosity increases to the south
Larger production rates to the south Higher PPLN porosity
Utica Shale acts as a seal?