Embed Size (px)
Citation preview
New generation electricity networks and Climate Change: the economic potential of national and trans-national Super-Grids powered by Concentrated Solar Power
FEEM, Milan 10 February 2011
Elena C. RicciUniversità degli Studi di Milano and Fondazione Eni Enrico Mattei
Joint work with Emanuele Massetti
1
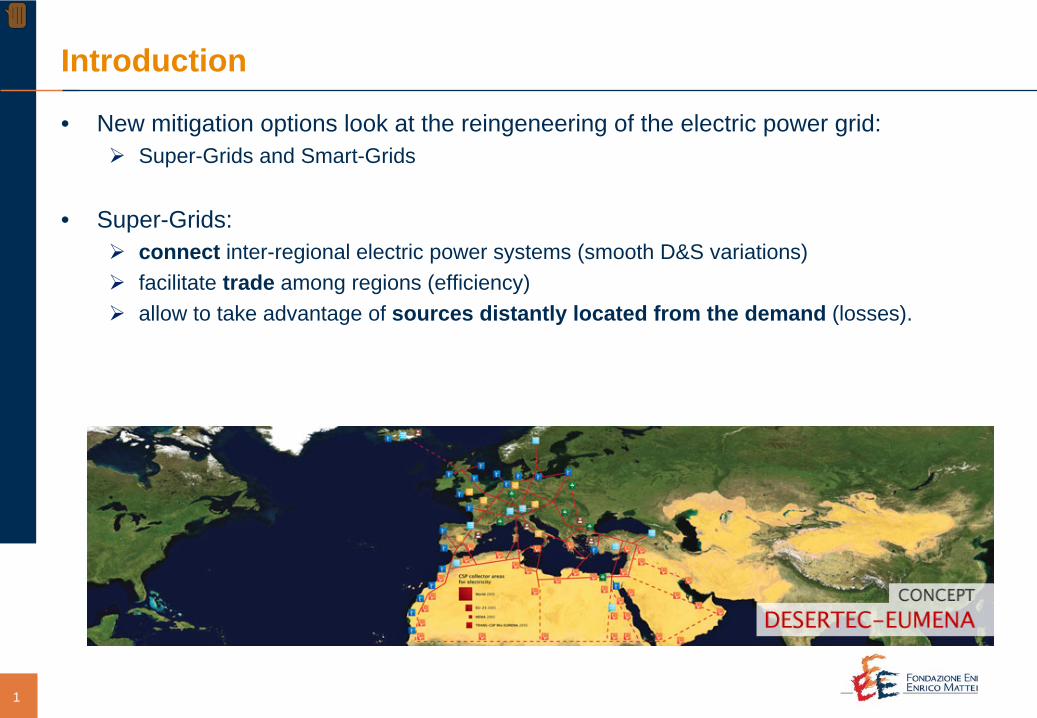
• New mitigation options look at the reingeneering of the electric power grid:Super-Grids and Smart-Grids
• Super-Grids:connect inter-regional electric power systems (smooth D&S variations)facilitate trade among regions (efficiency)allow to take advantage of sources distantly located from the demand (losses).
Introduction
2
• We model the SG as:HVDC cables2 converter stationsNo change in national AC power grid
HVDC• Transmission losses• Submarine and underground cables• Greater control over power transfers• Cable footprint• Converter stations
Modelling the Super-Grid
3
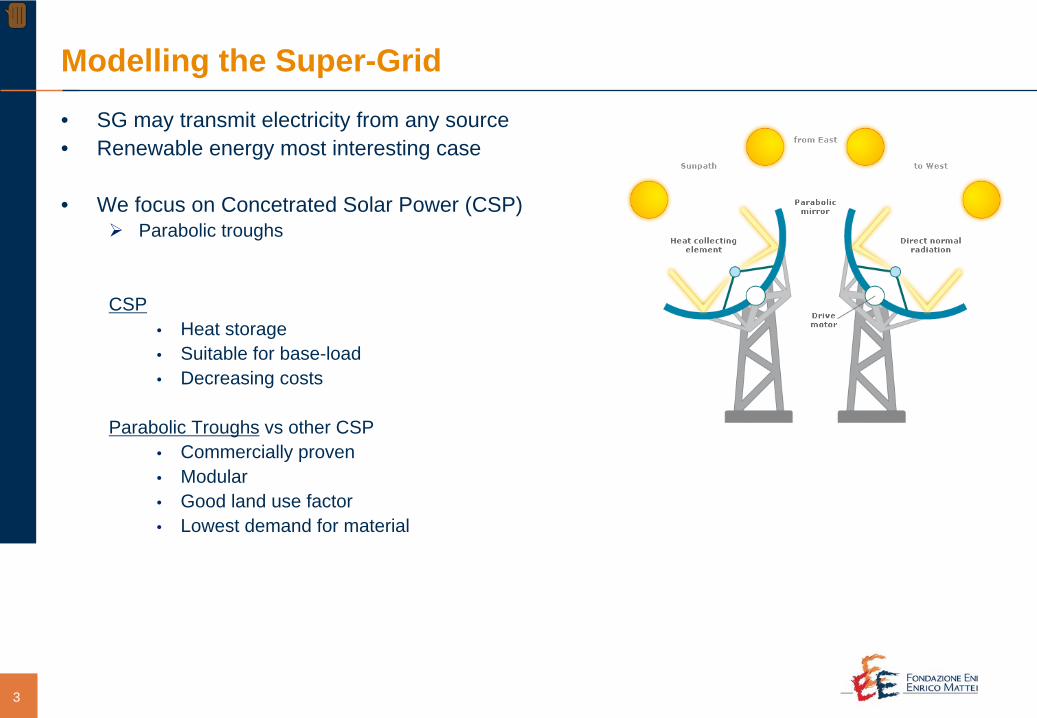
• SG may transmit electricity from any source• Renewable energy most interesting case
• We focus on Concetrated Solar Power (CSP)Parabolic troughs
CSP• Heat storage• Suitable for base-load• Decreasing costs
Parabolic Troughs vs other CSP• Commercially proven• Modular• Good land use factor• Lowest demand for material
Modelling the Super-Grid
4
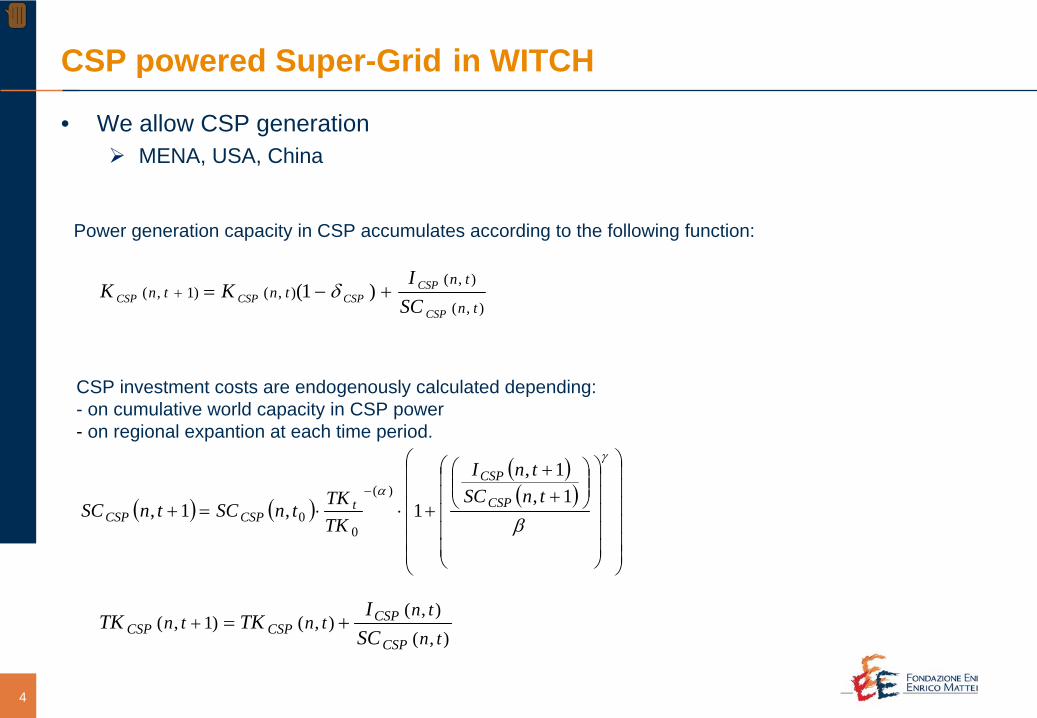
• We allow CSP generation MENA, USA, China
CSP powered Super-Grid in WITCH
Power generation capacity in CSP accumulates according to the following function:
),(
),(),()1,( )1(
tn
tntntn
CSP
CSPCSPCSPCSP SC
IKK +−=+ δ
CSP investment costs are endogenously calculated depending:- on cumulative world capacity in CSP power - on regional expantion at each time period.
( ) ( )
( )( )
⎟⎟⎟⎟⎟⎟
⎠
⎞
⎜⎜⎜⎜⎜⎜
⎝
⎛
⎟⎟⎟⎟⎟
⎠
⎞
⎜⎜⎜⎜⎜
⎝
⎛⎟⎟⎠
⎞⎜⎜⎝
⎛++
+⋅⋅=+−
γ
α
β1,
1,
1,1,)(
00
tnSCtnI
TKTK
tnSCtnSC CSP
CSP
tCSPCSP
),(),(
),()1,(tn
tntntn
CSP
CSPCSPCSP SC
ITKTK +=+
5
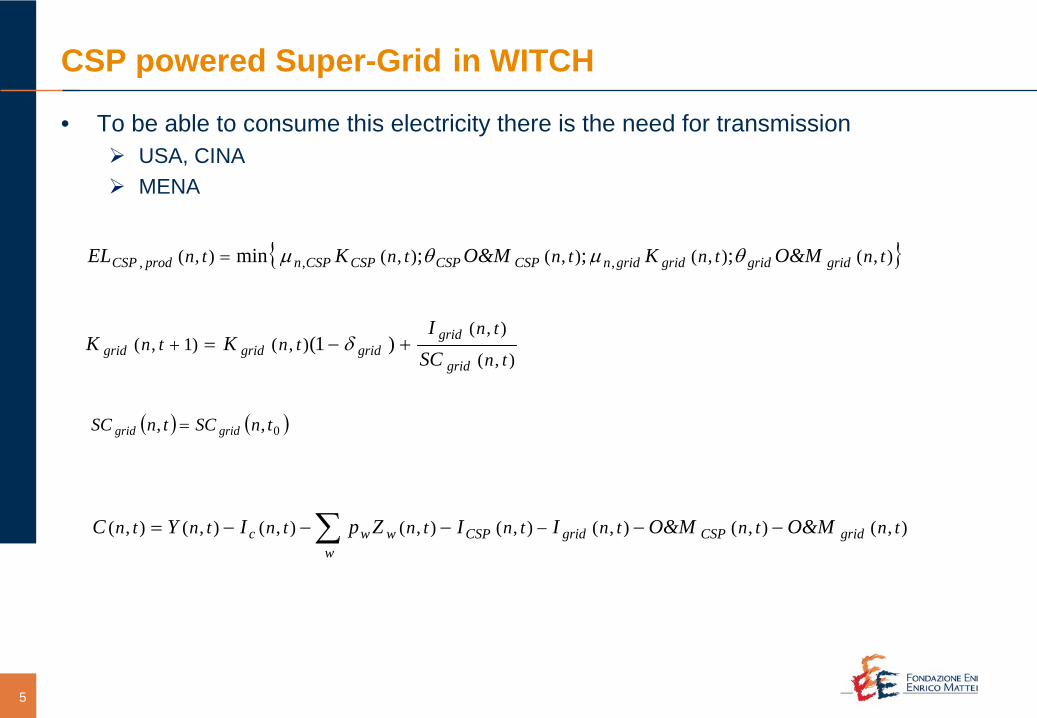
• To be able to consume this electricity there is the need for transmissionUSA, CINAMENA
{ }),(),(),(),(),( ;;;min ,,, tntntntntn gridgridgridgridnCSPCSPCSPCSPnprodCSP O&MKO&MKEL θμθμ=
),(
),(),()1,( )1(
tn
tntntn
grid
gridgridgridgrid SC
IKK +−=+ δ
( ) ( )0,, tnSCtnSC gridgrid =
CSP powered Super-Grid in WITCH
),(),(),(),(),(),(),(),( tntntntntntntntn gridCSPgridCSPw
wwc O&MO&MIIZpIYC −−−−−= −∑
6
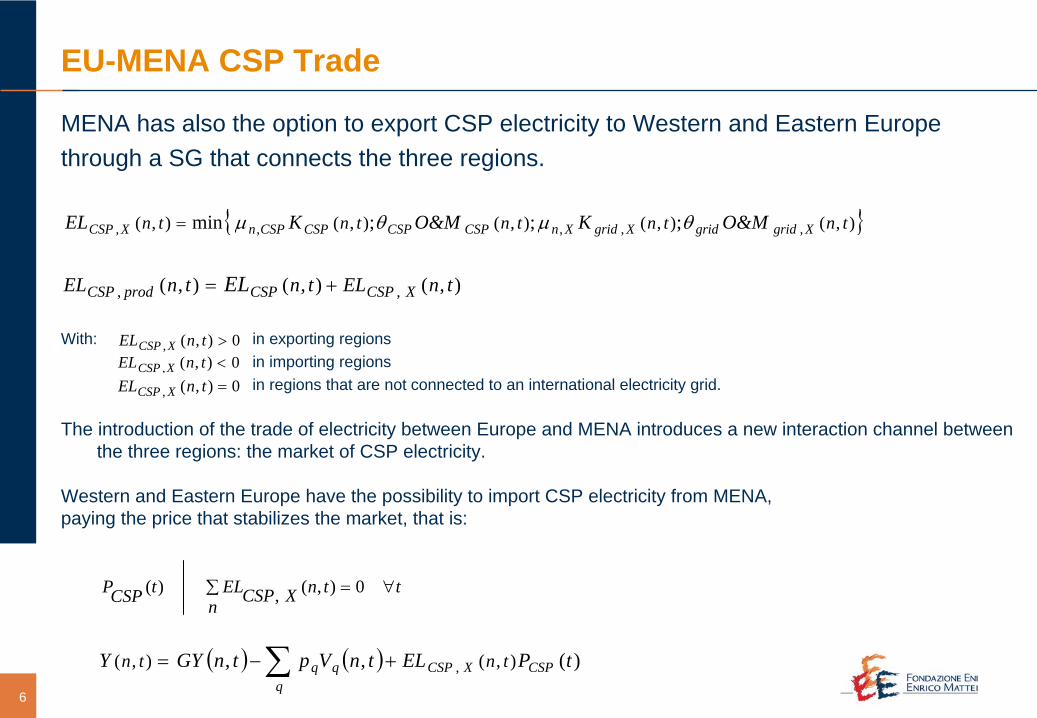
MENA has also the option to export CSP electricity to Western and Eastern Europe through a SG that connects the three regions.
EU-MENA CSP Trade
{ }),(),(),(),(),( ,,,,, ;;;min tntntntntn XgridgridXgridXnCSPCSPCSPCSPnXCSP O&MKO&MKEL θμθμ=
),(),(),( ,, tnELtntnEL XCSPCSPprodCSP EL +=
0),(, <tnEL XCSP0),(, =tnEL XCSP
0),(, >tnEL XCSP
The introduction of the trade of electricity between Europe and MENA introduces a new interaction channel between the three regions: the market of CSP electricity.
Western and Eastern Europe have the possibility to import CSP electricity from MENA, paying the price that stabilizes the market, that is:
∑ ∀=n
ttnXCSPELtCSPP 0),(,)(
With: in exporting regionsin importing regions in regions that are not connected to an international electricity grid.
( ) ( ) )(,, ),(),( , tPELtnVptnGYY CSPXCSPq
qq tntn +−= ∑
7
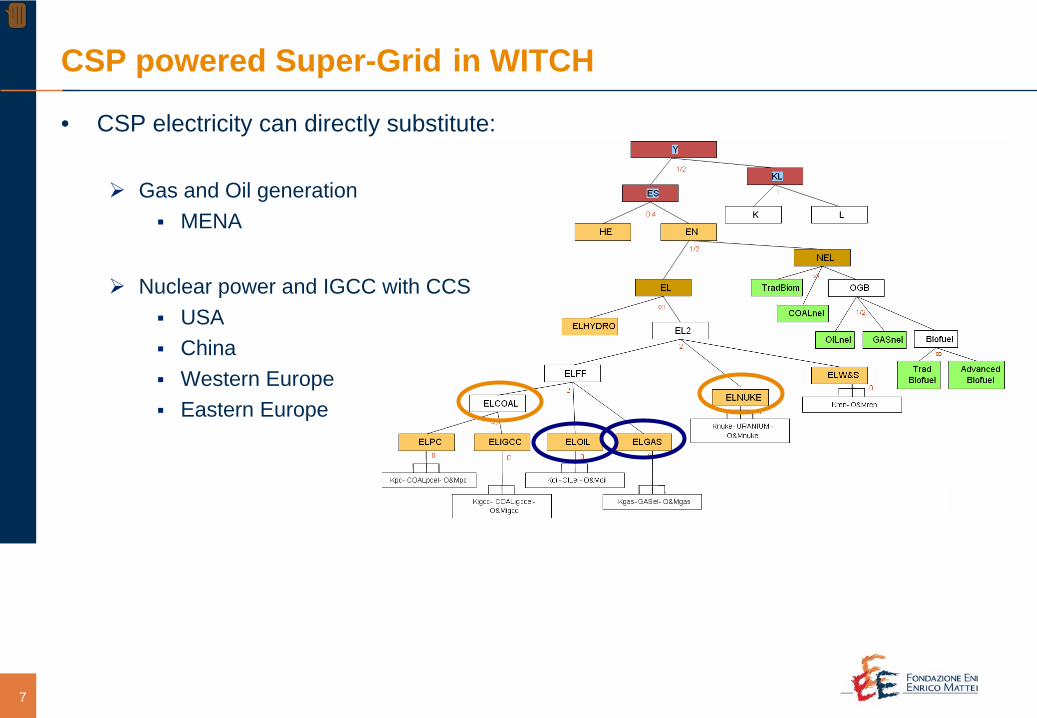
• CSP electricity can directly substitute:
Gas and Oil generation MENA
Nuclear power and IGCC with CCSUSAChinaWestern EuropeEastern Europe
CSP powered Super-Grid in WITCH
8
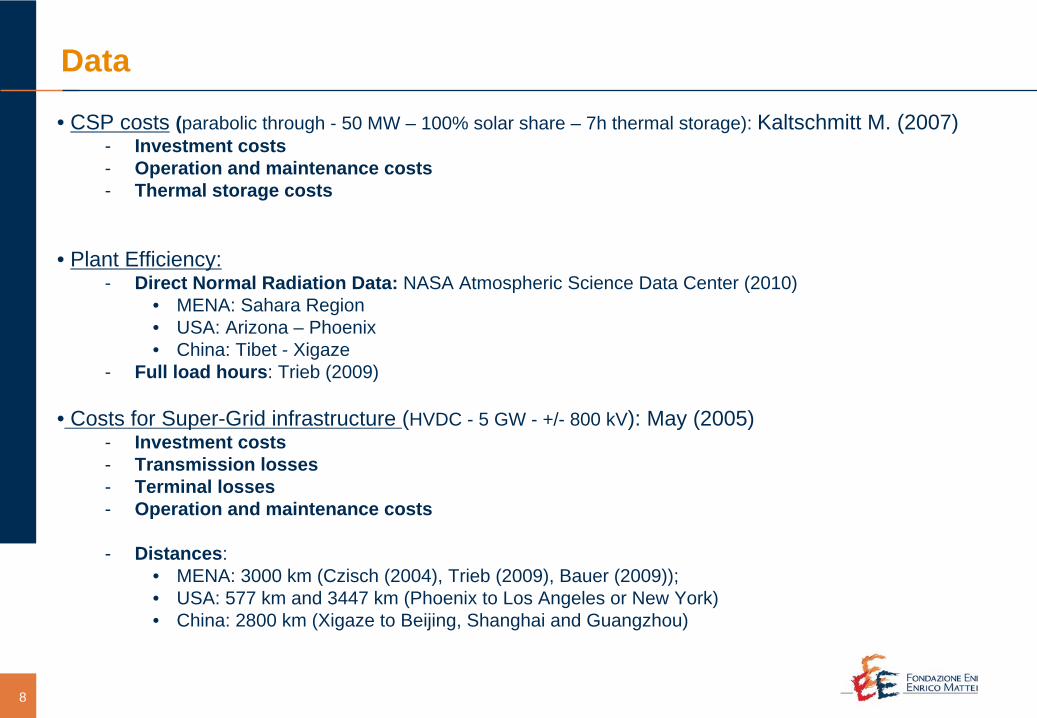
Data
• CSP costs (parabolic through - 50 MW – 100% solar share – 7h thermal storage): Kaltschmitt M. (2007)- Investment costs- Operation and maintenance costs- Thermal storage costs
• Plant Efficiency:- Direct Normal Radiation Data: NASA Atmospheric Science Data Center (2010)
• MENA: Sahara Region• USA: Arizona – Phoenix• China: Tibet - Xigaze
- Full load hours: Trieb (2009)
• Costs for Super-Grid infrastructure (HVDC - 5 GW - +/- 800 kV): May (2005)- Investment costs- Transmission losses- Terminal losses- Operation and maintenance costs
- Distances: • MENA: 3000 km (Czisch (2004), Trieb (2009), Bauer (2009));• USA: 577 km and 3447 km (Phoenix to Los Angeles or New York)• China: 2800 km (Xigaze to Beijing, Shanghai and Guangzhou)
9
Simulation Scenarios
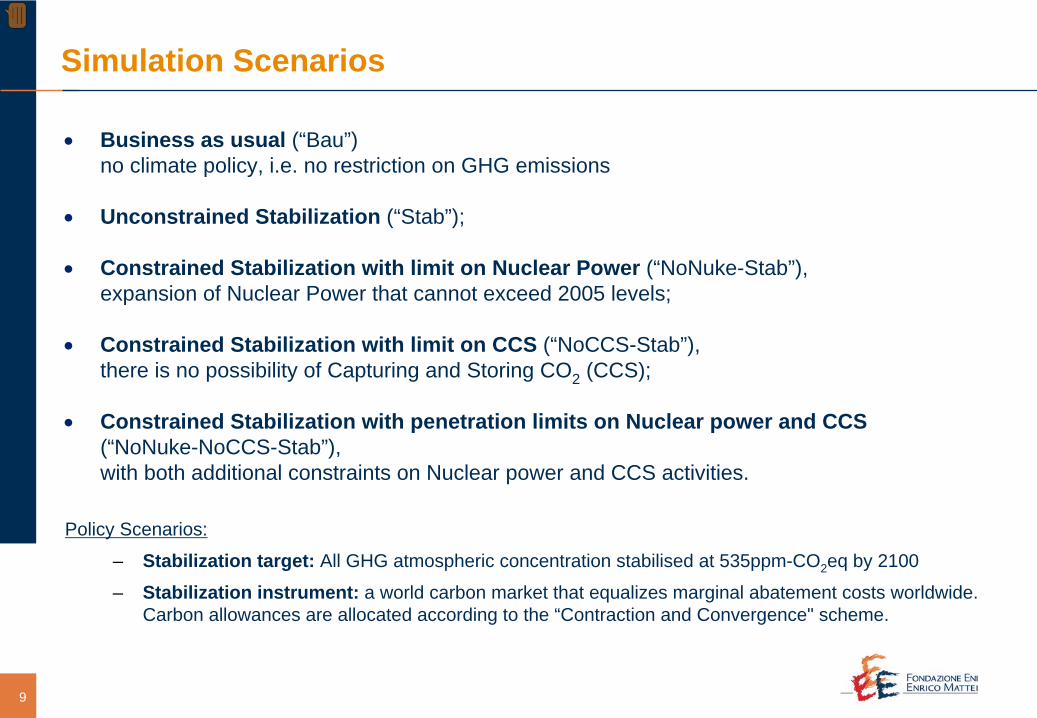
Policy Scenarios:
– Stabilization target: All GHG atmospheric concentration stabilised at 535ppm-CO2 eq by 2100
– Stabilization instrument: a world carbon market that equalizes marginal abatement costs worldwide. Carbon allowances are allocated according to the “Contraction and Convergence" scheme.
•
Business as usual (“Bau”)no climate policy, i.e. no restriction on GHG emissions
•
Unconstrained Stabilization (“Stab”);
•
Constrained Stabilization with limit on Nuclear Power (“NoNuke-Stab”),expansion of Nuclear Power that cannot exceed 2005 levels;
•
Constrained Stabilization with limit on CCS (“NoCCS-Stab”),there is no possibility of Capturing and Storing CO2 (CCS);
•
Constrained Stabilization with penetration limits on Nuclear power and CCS(“NoNuke-NoCCS-Stab”),with both additional constraints on Nuclear power and CCS activities.
10
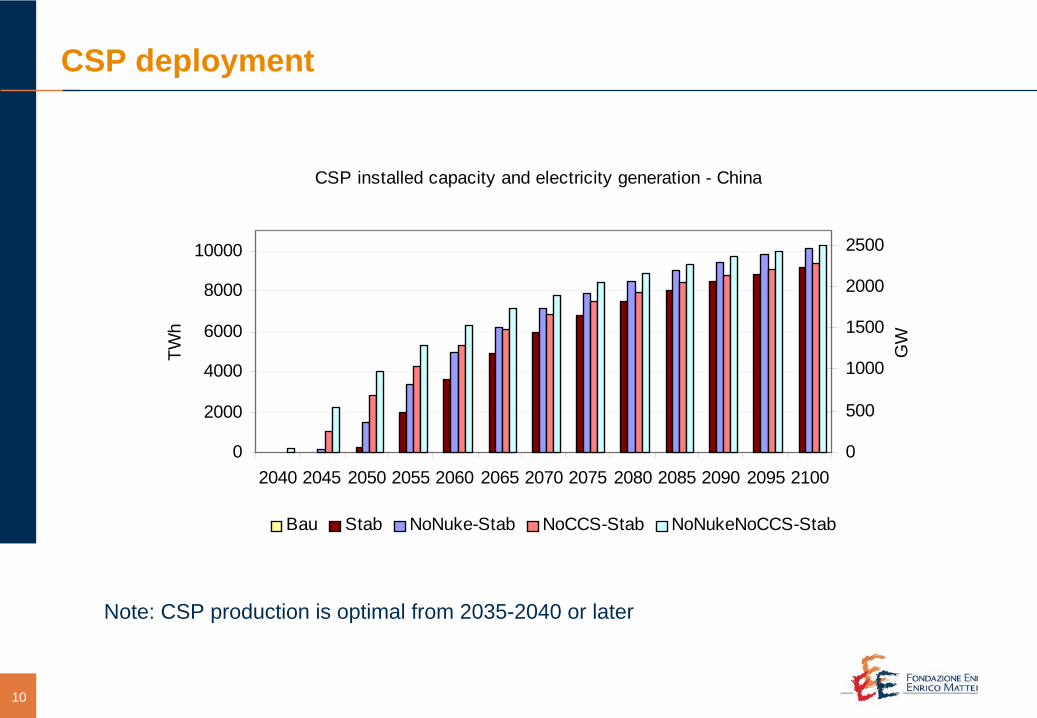
CSP deployment
Note: CSP production is optimal from 2035-2040 or later
CSP installed capacity and electricity generation - MENA
0
2000
4000
6000
8000
10000
2040 2045 2050 2055 2060 2065 2070 2075 2080 2085 2090 2095 2100
TWh
0
500
1000
1500
2000
2500
GW
Bau Stab NoNuke-Stab NoCCS-Stab NoNukeNoCCS-Stab
CSP installed capacity and electricity generation - USA
0
2000
4000
6000
8000
10000
2040 2045 2050 2055 2060 2065 2070 2075 2080 2085 2090 2095 2100
TWh
0
500
1000
1500
2000
2500
GW
Bau Stab NoNuke-Stab NoCCS-Stab NoNukeNoCCS-Stab
CSP installed capacity and electricity generation - China
0
2000
4000
6000
8000
10000
2040 2045 2050 2055 2060 2065 2070 2075 2080 2085 2090 2095 2100
TWh
0
500
1000
1500
2000
2500
GW
Bau Stab NoNuke-Stab NoCCS-Stab NoNukeNoCCS-Stab
11
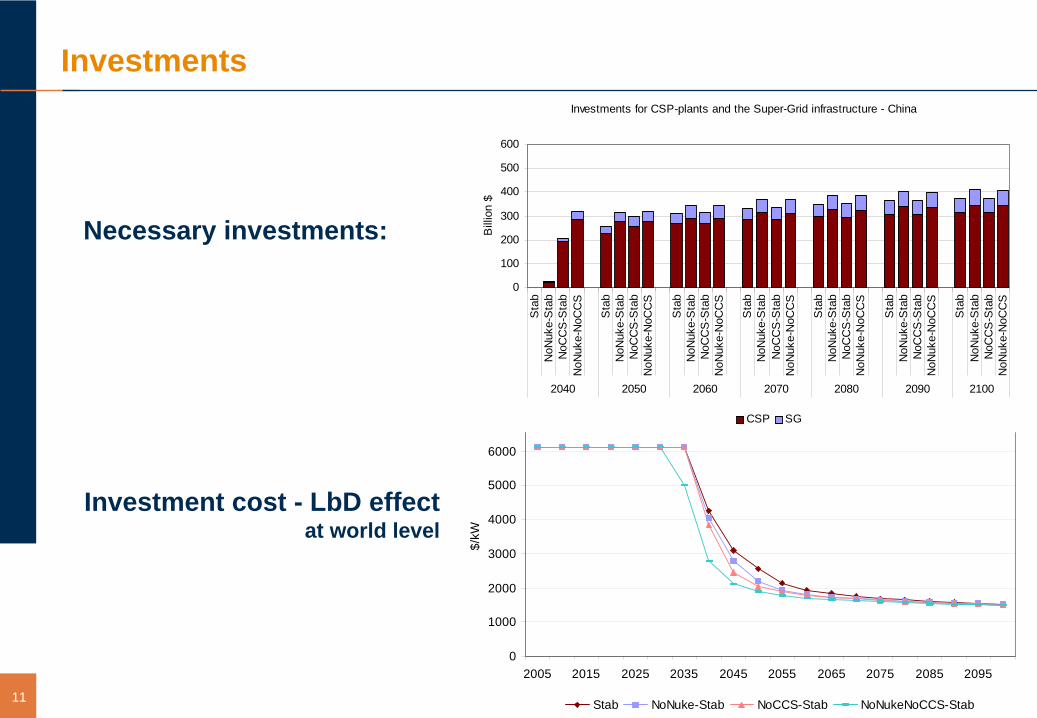
Investments
Necessary investments:
Investment cost - LbD effectat world level
CSP Investment costs
0
1000
2000
3000
4000
5000
6000
7000
2005 2015 2025 2035 2045 2055 2065 2075 2085 2095
$/kW
Stab NoNuke-Stab NoCCS-Stab NoNukeNoCCS-Stab
Investments for CSP-plants and the Super-Grid infrastructure - MENA
0
100
200
300
400
500
600
Sta
bN
oNuk
e-S
tab
NoC
CS
-Sta
bN
oNuk
e-N
oCC
S
Sta
bN
oNuk
e-S
tab
NoC
CS
-Sta
bN
oNuk
e-N
oCC
S
Sta
bN
oNuk
e-S
tab
NoC
CS
-Sta
bN
oNuk
e-N
oCC
S
Sta
bN
oNuk
e-S
tab
NoC
CS
-Sta
bN
oNuk
e-N
oCC
S
Sta
bN
oNuk
e-S
tab
NoC
CS
-Sta
bN
oNuk
e-N
oCC
S
Sta
bN
oNuk
e-S
tab
NoC
CS
-Sta
bN
oNuk
e-N
oCC
S
Sta
bN
oNuk
e-S
tab
NoC
CS
-Sta
bN
oNuk
e-N
oCC
S
2040 2050 2060 2070 2080 2090 2100
Bill
ion
$
CSP SG
Investments for CSP-plants and the Super-Grid infrastructure - USA
0
100
200
300
400
500
600
Sta
bN
oNuk
e-S
tab
NoC
CS
-Sta
bN
oNuk
e-N
oCC
S
Sta
bN
oNuk
e-S
tab
NoC
CS
-Sta
bN
oNuk
e-N
oCC
S
Sta
bN
oNuk
e-S
tab
NoC
CS
-Sta
bN
oNuk
e-N
oCC
S
Sta
bN
oNuk
e-S
tab
NoC
CS
-Sta
bN
oNuk
e-N
oCC
S
Sta
bN
oNuk
e-S
tab
NoC
CS
-Sta
bN
oNuk
e-N
oCC
S
Sta
bN
oNuk
e-S
tab
NoC
CS
-Sta
bN
oNuk
e-N
oCC
S
Sta
bN
oNuk
e-S
tab
NoC
CS
-Sta
bN
oNuk
e-N
oCC
S
2040 2050 2060 2070 2080 2090 2100
Bill
ion
$
CSP SG
Investments for CSP-plants and the Super-Grid infrastructure - China
0
100
200
300
400
500
600
Sta
bN
oNuk
e-S
tab
NoC
CS
-Sta
bN
oNuk
e-N
oCC
S
Sta
bN
oNuk
e-S
tab
NoC
CS
-Sta
bN
oNuk
e-N
oCC
S
Sta
bN
oNuk
e-S
tab
NoC
CS
-Sta
bN
oNuk
e-N
oCC
S
Sta
bN
oNuk
e-S
tab
NoC
CS
-Sta
bN
oNuk
e-N
oCC
S
Sta
bN
oNuk
e-S
tab
NoC
CS
-Sta
bN
oNuk
e-N
oCC
S
Sta
bN
oNuk
e-S
tab
NoC
CS
-Sta
bN
oNuk
e-N
oCC
S
Sta
bN
oNuk
e-S
tab
NoC
CS
-Sta
bN
oNuk
e-N
oCC
S
2040 2050 2060 2070 2080 2090 2100
Bill
ion
$
CSP SG
12
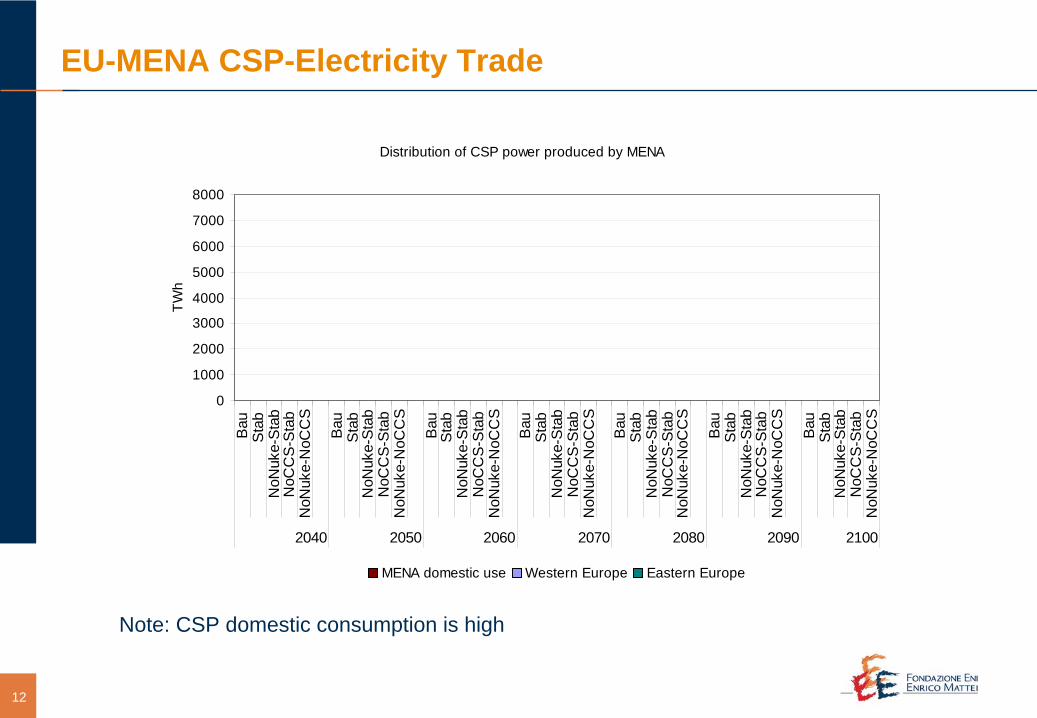
EU-MENA CSP-Electricity Trade
Note: CSP domestic consumption is high
Distribution of CSP power produced by MENA
0
1000
2000
3000
4000
5000
6000
7000
8000
Bau
Sta
bN
oNuk
e-St
abN
oCC
S-S
tab
NoN
uke-
NoC
CS
Bau
Sta
bN
oNuk
e-St
abN
oCC
S-S
tab
NoN
uke-
NoC
CS
Bau
Sta
bN
oNuk
e-St
abN
oCC
S-S
tab
NoN
uke-
NoC
CS
Bau
Sta
bN
oNuk
e-St
abN
oCC
S-S
tab
NoN
uke-
NoC
CS
Bau
Sta
bN
oNuk
e-St
abN
oCC
S-S
tab
NoN
uke-
NoC
CS
Bau
Sta
bN
oNuk
e-St
abN
oCC
S-S
tab
NoN
uke-
NoC
CS
Bau
Sta
bN
oNuk
e-St
abN
oCC
S-S
tab
NoN
uke-
NoC
CS
2040 2050 2060 2070 2080 2090 2100
TWh
MENA domestic use Western Europe Eastern Europe
Distribution of CSP power produced by MENA
0
1000
2000
3000
4000
5000
6000
7000
8000
Bau
Sta
bN
oNuk
e-S
tab
NoC
CS
-Sta
bN
oNuk
e-N
oCC
S
Bau
Sta
bN
oNuk
e-S
tab
NoC
CS
-Sta
bN
oNuk
e-N
oCC
S
Bau
Sta
bN
oNuk
e-S
tab
NoC
CS
-Sta
bN
oNuk
e-N
oCC
S
Bau
Sta
bN
oNuk
e-S
tab
NoC
CS
-Sta
bN
oNuk
e-N
oCC
S
Bau
Sta
bN
oNuk
e-S
tab
NoC
CS
-Sta
bN
oNuk
e-N
oCC
S
Bau
Sta
bN
oNuk
e-S
tab
NoC
CS
-Sta
bN
oNuk
e-N
oCC
S
Bau
Sta
bN
oNuk
e-S
tab
NoC
CS
-Sta
bN
oNuk
e-N
oCC
S
2040 2050 2060 2070 2080 2090 2100
TWh
MENA domestic use Western Europe Eastern Europe
Distribution of CSP power produced by MENA
0
1000
2000
3000
4000
5000
6000
7000
8000
Bau
Sta
bN
oNuk
e-St
abN
oCC
S-S
tab
NoN
uke-
NoC
CS
Bau
Sta
bN
oNuk
e-St
abN
oCC
S-S
tab
NoN
uke-
NoC
CS
Bau
Sta
bN
oNuk
e-St
abN
oCC
S-S
tab
NoN
uke-
NoC
CS
Bau
Sta
bN
oNuk
e-St
abN
oCC
S-S
tab
NoN
uke-
NoC
CS
Bau
Sta
bN
oNuk
e-St
abN
oCC
S-S
tab
NoN
uke-
NoC
CS
Bau
Sta
bN
oNuk
e-St
abN
oCC
S-S
tab
NoN
uke-
NoC
CS
Bau
Sta
bN
oNuk
e-St
abN
oCC
S-S
tab
NoN
uke-
NoC
CS
2040 2050 2060 2070 2080 2090 2100
TWh
MENA domestic use Western Europe Eastern Europe
13
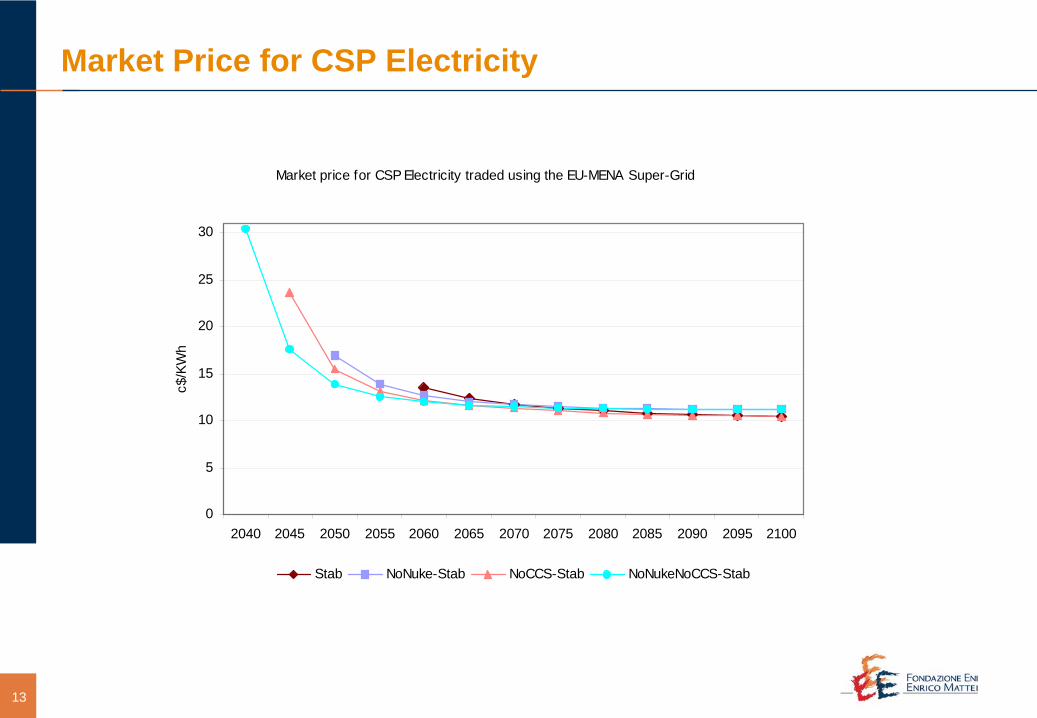
Market Price for CSP Electricity
Market price for CSP Electricity traded using the EU-MENA Super-Grid
0
5
10
15
20
25
30
2040 2045 2050 2055 2060 2065 2070 2075 2080 2085 2090 2095 2100
c$/K
Wh
Stab NoNuke-Stab NoCCS-Stab NoNukeNoCCS-Stab
14
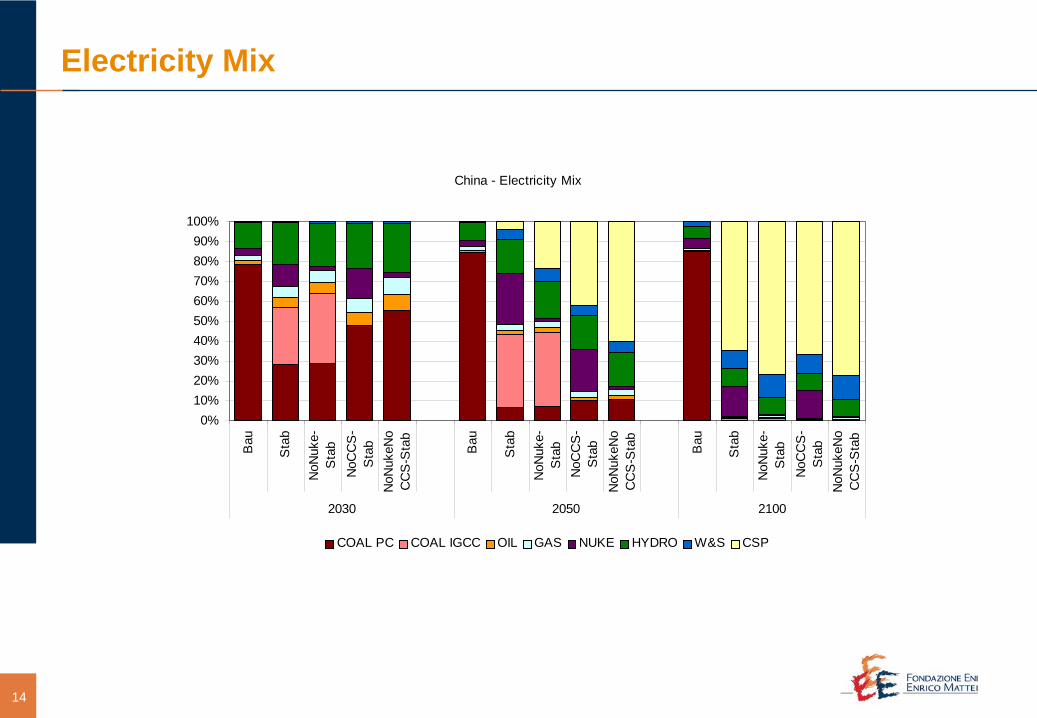
Electricity Mix
Western Europe - Electricity Mix
0%
20%
40%
60%
80%
100%
Bau
Sta
b
NoN
uke-
Sta
bN
oCC
S-
Sta
bN
oNuk
eNo
CC
S-S
tab
Bau
Sta
b
NoN
uke-
Sta
bN
oCC
S-
Sta
bN
oNuk
eNo
CC
S-S
tab
Bau
Sta
b
NoN
uke-
Sta
bN
oCC
S-
Sta
bN
oNuk
eNo
CC
S-S
tab
2030 2050 2100
COAL PC COAL IGCC OIL GAS NUKE HYDRO W&S CSP
Eastern Europe - Electricity Mix
0%10%20%30%40%50%60%70%80%90%
100%
Bau
Sta
b
NoN
uke-
Sta
bN
oCC
S-
Sta
bN
oNuk
eNo
CC
S-S
tab
Bau
Sta
b
NoN
uke-
Sta
bN
oCC
S-
Sta
bN
oNuk
eNo
CC
S-S
tab
Bau
Sta
b
NoN
uke-
Sta
bN
oCC
S-
Sta
bN
oNuk
eNo
CC
S-S
tab
2030 2050 2100
COAL PC COAL IGCC OIL GAS NUKE HYDRO W&S CSP
MENA - Electricity Mix
0%10%20%30%40%50%60%70%80%90%
100%
Bau
Sta
b
NoN
uke-
Sta
bN
oCC
S-
Sta
bN
oNuk
eNo
CC
S-S
tab
Bau
Sta
b
NoN
uke-
Sta
bN
oCC
S-
Sta
bN
oNuk
eNo
CC
S-S
tab
Bau
Sta
b
NoN
uke-
Sta
bN
oCC
S-
Sta
bN
oNuk
eNo
CC
S-S
tab
2030 2050 2100
COAL PC COAL IGCC OIL GAS NUKE HYDRO W&S CSP
USA - Electricity Mix
0%
20%
40%
60%
80%
100%
Bau
Sta
b
NoN
uke-
Sta
bN
oCC
S-
Sta
bN
oNuk
eNo
CC
S-S
tab
Bau
Sta
b
NoN
uke-
Sta
bN
oCC
S-
Sta
bN
oNuk
eNo
CC
S-S
tab
Bau
Sta
b
NoN
uke-
Sta
bN
oCC
S-
Sta
bN
oNuk
eNo
CC
S-S
tab
2030 2050 2100
COAL PC COAL IGCC OIL GAS NUKE HYDRO W&S CSP
China - Electricity Mix
0%10%20%30%40%50%60%70%80%90%
100%
Bau
Sta
b
NoN
uke-
Sta
bN
oCC
S-
Sta
bN
oNuk
eNo
CC
S-S
tab
Bau
Sta
b
NoN
uke-
Sta
bN
oCC
S-
Sta
bN
oNuk
eNo
CC
S-S
tab
Bau
Sta
b
NoN
uke-
Sta
bN
oCC
S-
Sta
bN
oNuk
eNo
CC
S-S
tab
2030 2050 2100
COAL PC COAL IGCC OIL GAS NUKE HYDRO W&S CSP
15
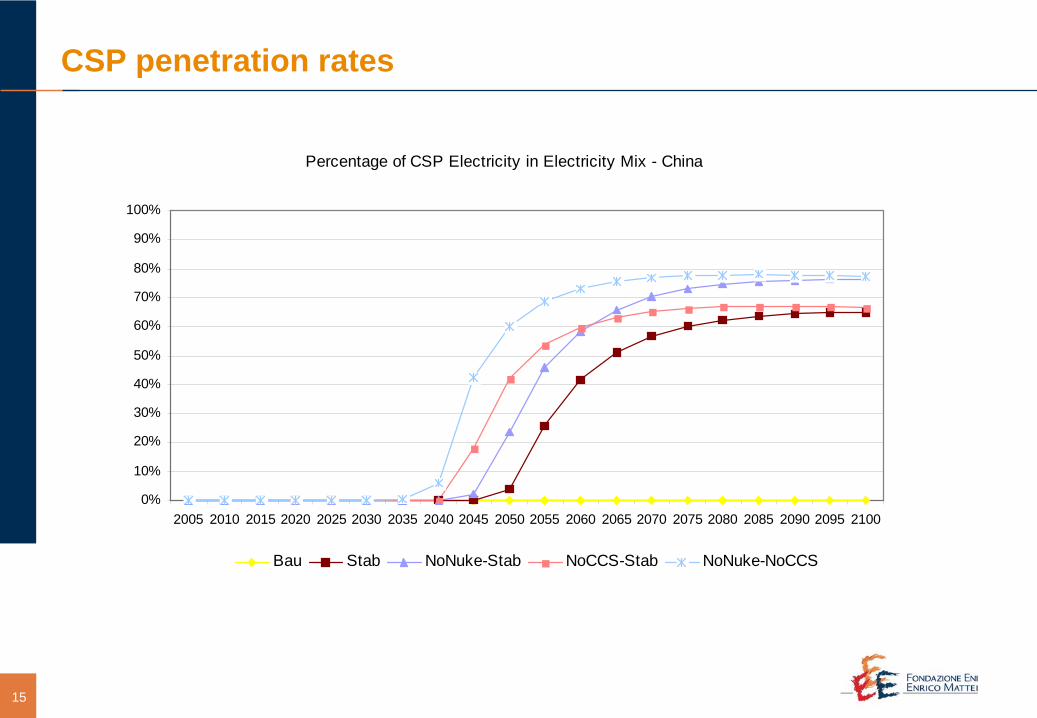
CSP penetration rates
Percentage of CSP Electricity in Electricity Mix - WESTERN EUROPE
0%
10%
20%
30%
40%
50%
60%
70%
80%
90%
100%
2005 2010 2015 2020 2025 2030 2035 2040 2045 2050 2055 2060 2065 2070 2075 2080 2085 2090 2095 2100
Bau Stab NoNuke-Stab NoCCS-Stab NoNuke-NoCCS
Percentage of CSP Electricity in Electricity Mix - EASTERN EUROPE
0%
10%
20%
30%
40%
50%
60%
70%
80%
90%
100%
2005 2010 2015 2020 2025 2030 2035 2040 2045 2050 2055 2060 2065 2070 2075 2080 2085 2090 2095 2100
Bau Stab NoNuke-Stab NoCCS-Stab NoNuke-NoCCS
Percentage of CSP Electricity in Electricity Mix - MENA
0%
10%
20%
30%
40%
50%
60%
70%
80%
90%
100%
2005 2010 2015 2020 2025 2030 2035 2040 2045 2050 2055 2060 2065 2070 2075 2080 2085 2090 2095 2100
Bau Stab NoNuke-Stab NoCCS-Stab NoNuke-NoCCS
Percentage of CSP Electricity in Electricity Mix - USA
0%
10%
20%
30%
40%
50%
60%
70%
80%
90%
100%
2005 2010 2015 2020 2025 2030 2035 2040 2045 2050 2055 2060 2065 2070 2075 2080 2085 2090 2095 2100
Bau Stab NoNuke-Stab NoCCS-Stab NoNuke-NoCCS
Percentage of CSP Electricity in Electricity Mix - China
0%
10%
20%
30%
40%
50%
60%
70%
80%
90%
100%
2005 2010 2015 2020 2025 2030 2035 2040 2045 2050 2055 2060 2065 2070 2075 2080 2085 2090 2095 2100
Bau Stab NoNuke-Stab NoCCS-Stab NoNuke-NoCCS
16
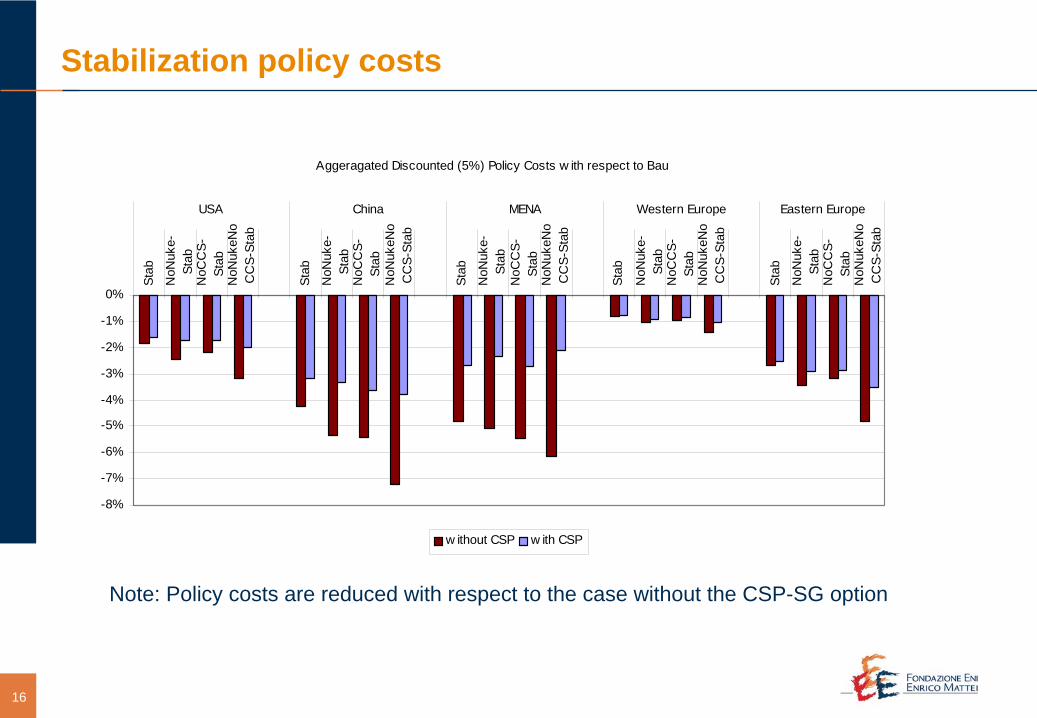
Stabilization policy costs
Note: Policy costs are reduced with respect to the case without the CSP-SG option
Aggeragated Discounted (5%) Policy Costs w ith respect to Bau
-8%
-7%
-6%
-5%
-4%
-3%
-2%
-1%
0%
Stab
NoN
uke-
Stab
NoC
CS-
Stab
NoN
ukeN
oC
CS-
Stab
Stab
NoN
uke-
Stab
NoC
CS-
Stab
NoN
ukeN
oC
CS-
Stab
Stab
NoN
uke-
Stab
NoC
CS-
Stab
NoN
ukeN
oC
CS-
Stab
Stab
NoN
uke-
Stab
NoC
CS-
Stab
NoN
ukeN
oC
CS-
Stab
Stab
NoN
uke-
Stab
NoC
CS-
Stab
NoN
ukeN
oC
CS-
Stab
USA China MENA Western Europe Eastern Europe
w ithout CSP w ith CSP
17
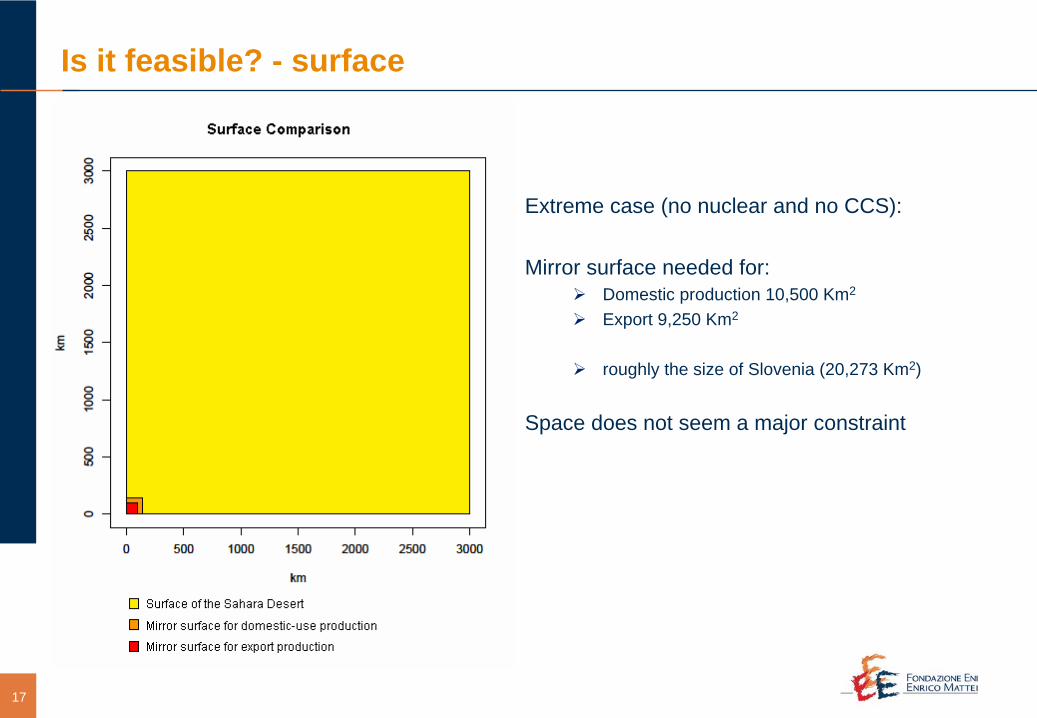
Is it feasible? - surface
Extreme case (no nuclear and no CCS):
Mirror surface needed for:Domestic production 10,500 Km2
Export 9,250 Km2
roughly the size of Slovenia (20,273 Km2)
Space does not seem a major constraint
18
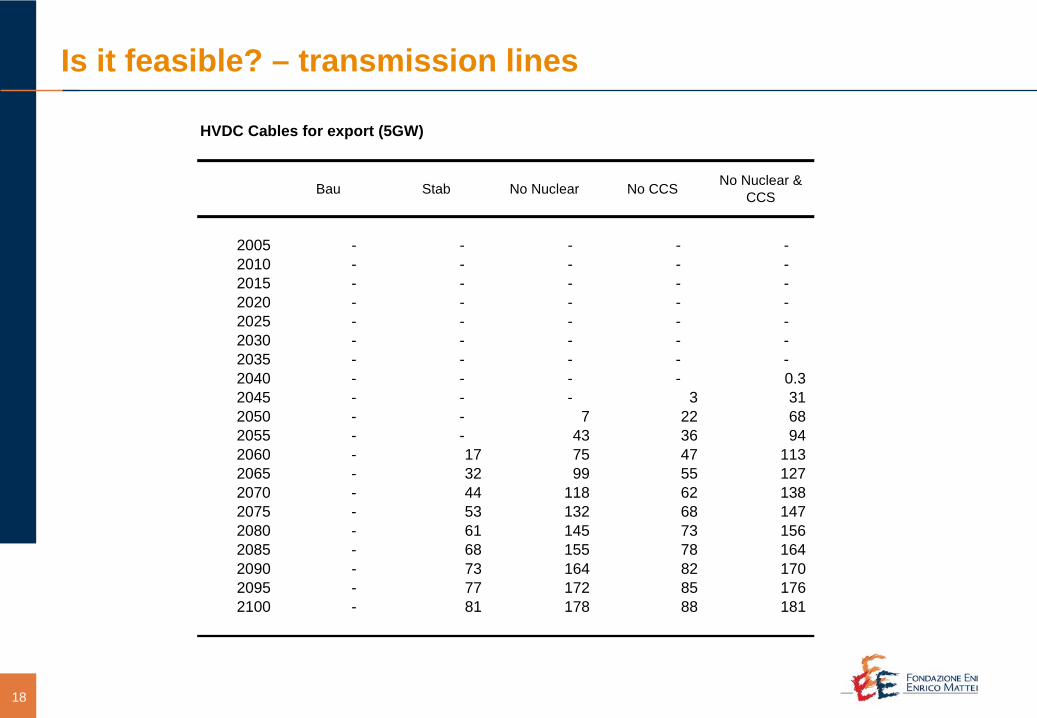
HVDC Cables for export (5GW)
Bau Stab No Nuclear No CCS No Nuclear & CCS
2005 - - - - - 2010 - - - - - 2015 - - - - - 2020 - - - - - 2025 - - - - - 2030 - - - - - 2035 - - - - - 2040 - - - - 0.3 2045 - - - 3 31 2050 - - 7 22 68 2055 - - 43 36 94 2060 - 17 75 47 113 2065 - 32 99 55 127 2070 - 44 118 62 138 2075 - 53 132 68 147 2080 - 61 145 73 156 2085 - 68 155 78 164 2090 - 73 164 82 170 2095 - 77 172 85 176 2100 - 81 178 88 181
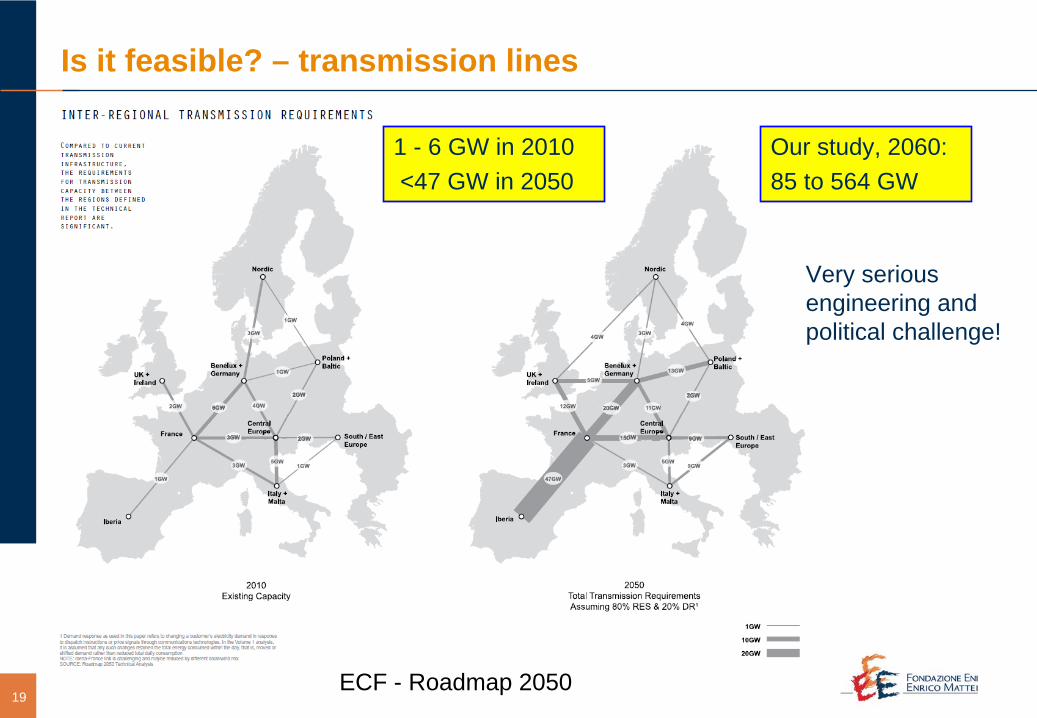
Is it feasible? – transmission lines
19
Our study, 2060:85 to 564 GW
ECF - Roadmap 2050
Very serious engineering and political challenge!
1 - 6 GW in 2010<47 GW in 2050
Is it feasible? – transmission lines
20
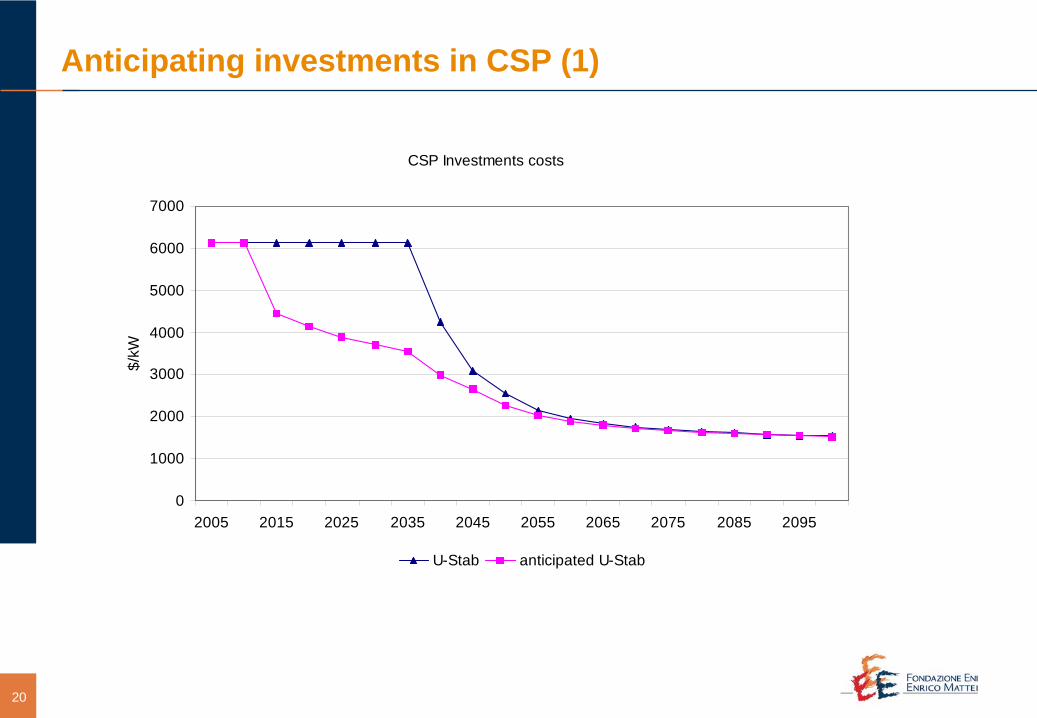
Anticipating investments in CSP (1)
CSP Investments costs
0
1000
2000
3000
4000
5000
6000
7000
2005 2015 2025 2035 2045 2055 2065 2075 2085 2095
$/kW
U-Stab anticipated U-Stab
21
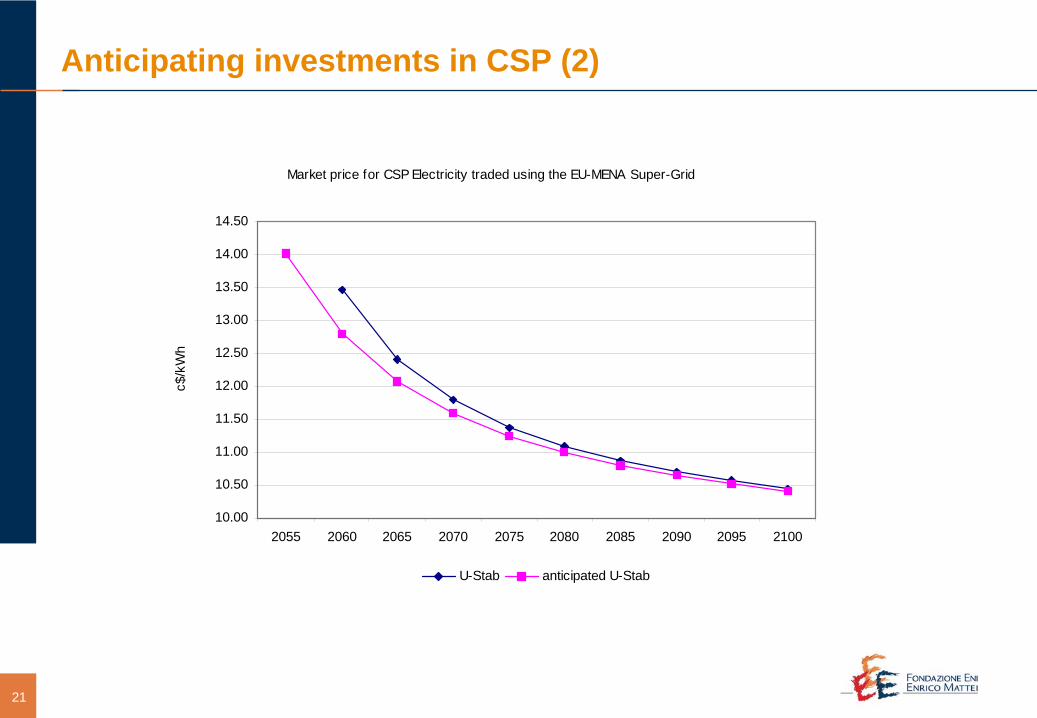
Anticipating investments in CSP (2)
Market price for CSP Electricity traded using the EU-MENA Super-Grid
10.00
10.50
11.00
11.50
12.00
12.50
13.00
13.50
14.00
14.50
2055 2060 2065 2070 2075 2080 2085 2090 2095 2100
c$/k
Wh
U-Stab anticipated U-Stab
22
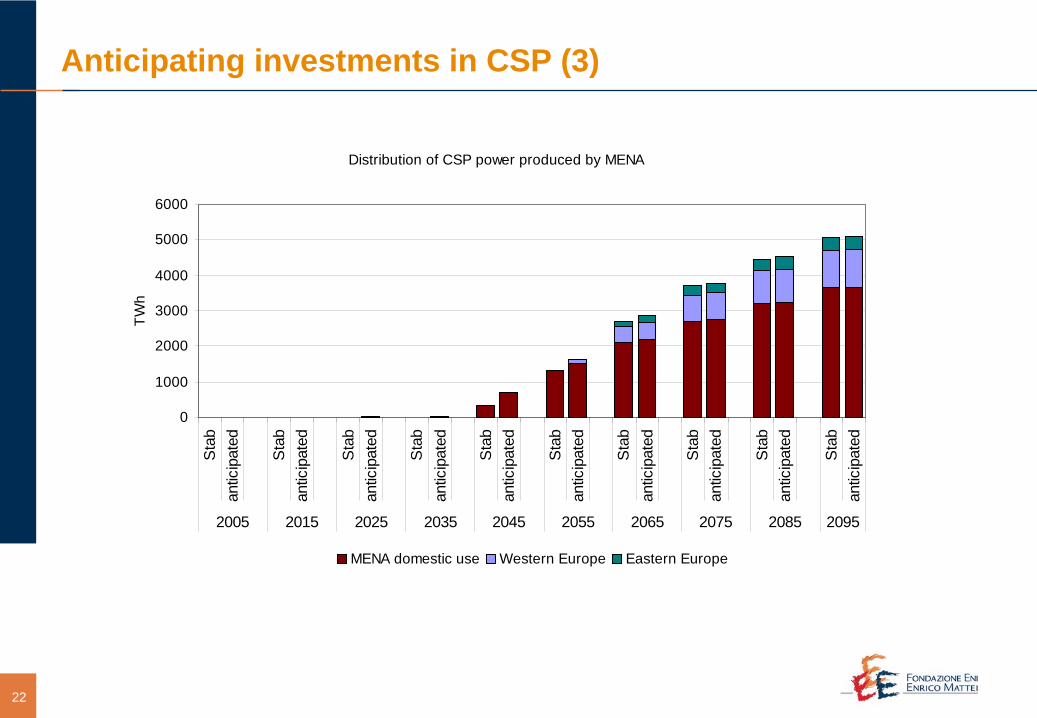
Anticipating investments in CSP (3)
Distribution of CSP power produced by MENA
0
1000
2000
3000
4000
5000
6000S
tab
antic
ipat
ed
Sta
ban
ticip
ated
Sta
ban
ticip
ated
Sta
ban
ticip
ated
Sta
ban
ticip
ated
Sta
ban
ticip
ated
Sta
ban
ticip
ated
Sta
ban
ticip
ated
Sta
ban
ticip
ated
Sta
ban
ticip
ated
2005 2015 2025 2035 2045 2055 2065 2075 2085 2095
TWh
MENA domestic use Western Europe Eastern Europe
23
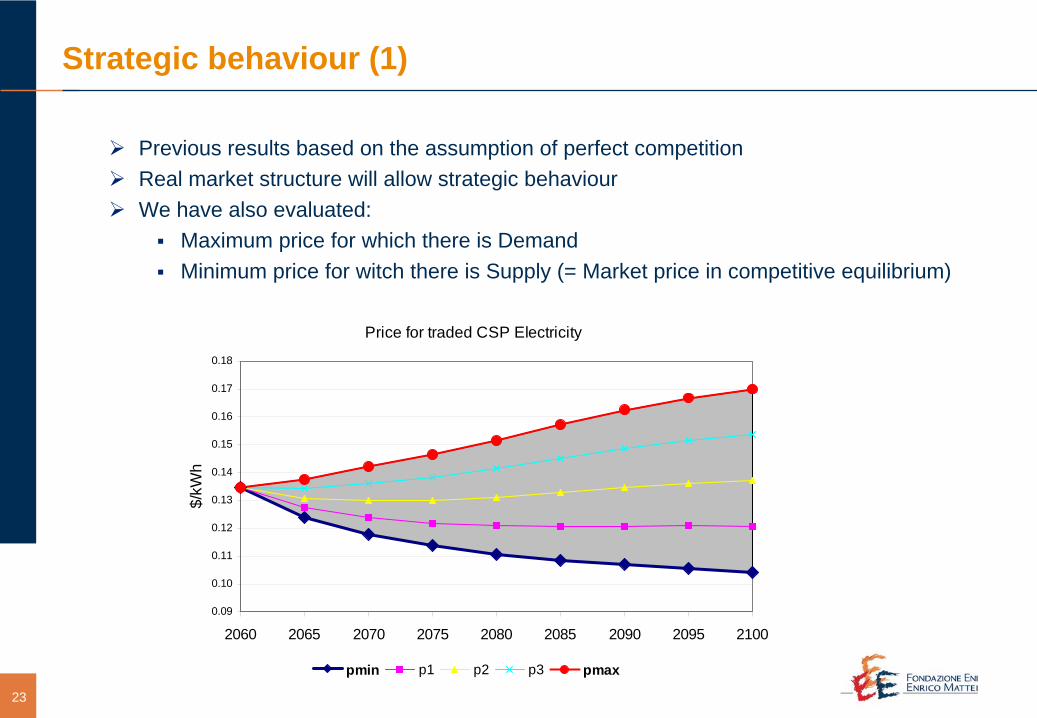
Previous results based on the assumption of perfect competitionReal market structure will allow strategic behaviourWe have also evaluated:
Maximum price for which there is Demand Minimum price for witch there is Supply (= Market price in competitive equilibrium)
Strategic behaviour (1)
Price for traded CSP Electricity
0.09
0.10
0.11
0.12
0.13
0.14
0.15
0.16
0.17
0.18
2060 2065 2070 2075 2080 2085 2090 2095 2100
$/kW
h
pmin pmax
Price for traded CSP Electricity
0.09
0.10
0.11
0.12
0.13
0.14
0.15
0.16
0.17
0.18
2060 2065 2070 2075 2080 2085 2090 2095 2100
$/kW
h
pmin p1 p2 p3 pmax
24
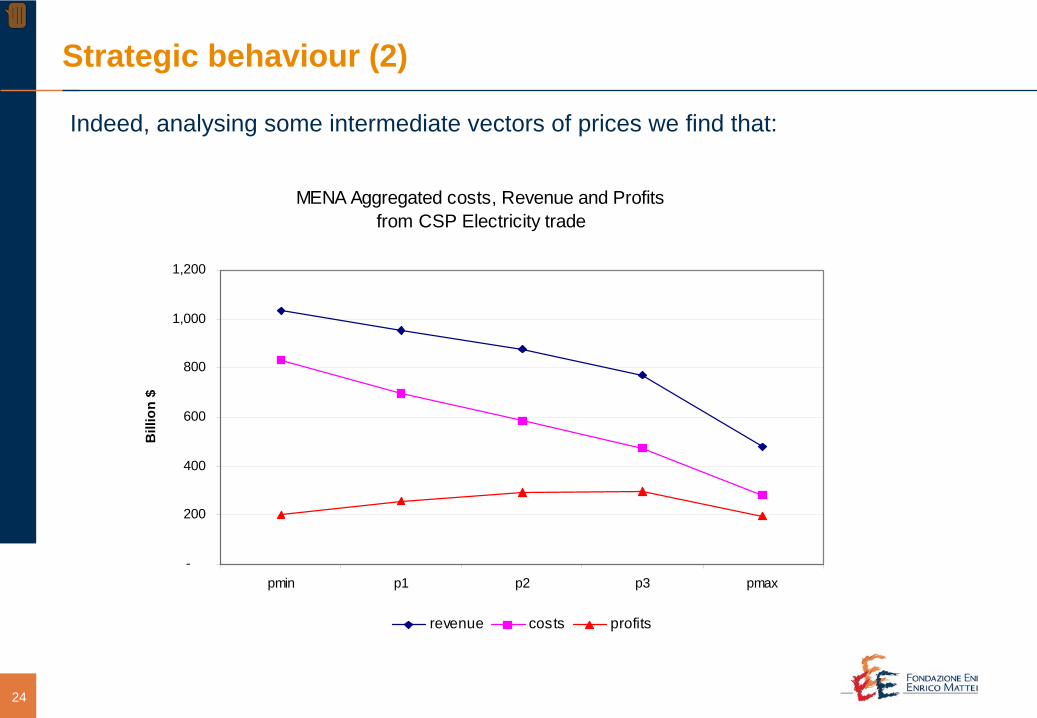
Indeed, analysing some intermediate vectors of prices we find that:
Strategic behaviour (2)
MENA Aggregated costs, Revenue and Profits from CSP Electricity trade
-
200
400
600
800
1,000
1,200
pmin p1 p2 p3 pmax
Bill
ion
$
revenue costs profits
25
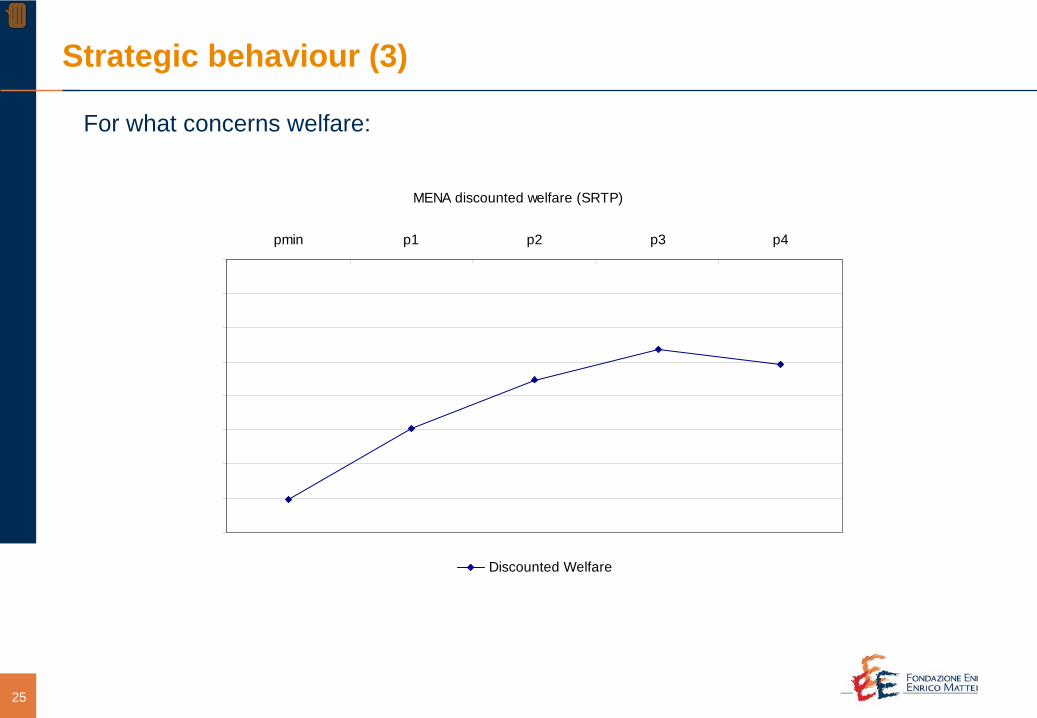
For what concerns welfare:
Strategic behaviour (3)
MENA discounted welfare (SRTP)
-14
-14
-14
-14
-14
-14
-14
-14
-14pmin p1 p2 p3 p4
Discounted Welfare
26
Conclusions
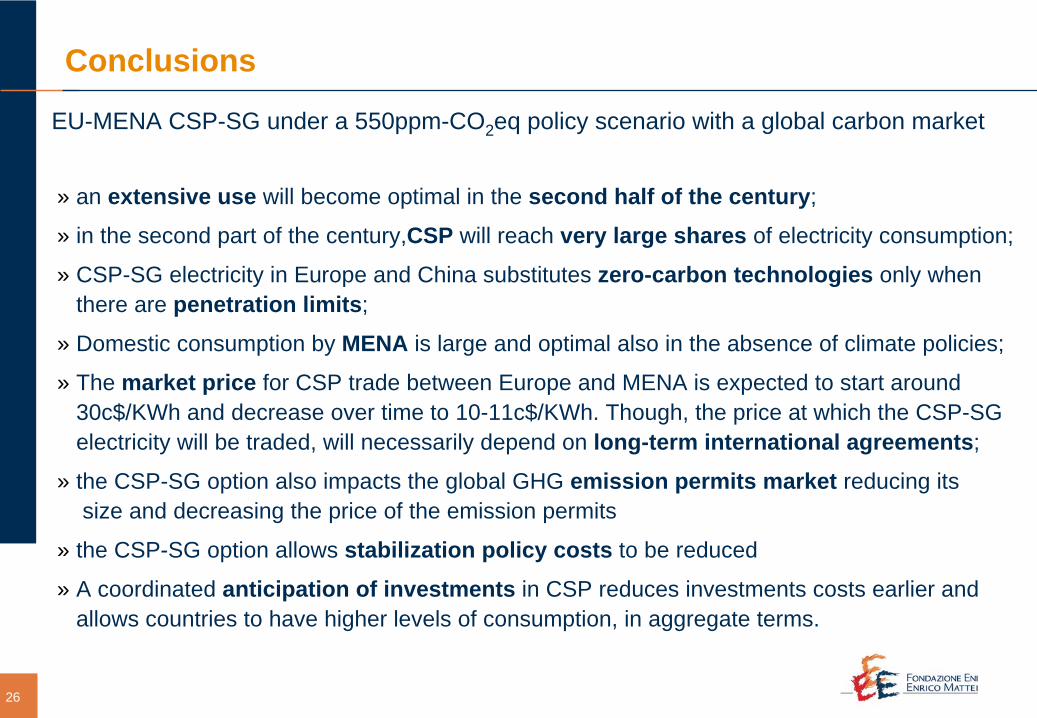
EU-MENA CSP-SG under a 550ppm-CO2 eq policy scenario with a global carbon market
» an extensive use will become optimal in the second half of the century;
» in the second part of the century,CSP will reach very large shares of electricity consumption;
» CSP-SG electricity in Europe and China substitutes zero-carbon technologies only when there are penetration limits;
» Domestic consumption by MENA is large and optimal also in the absence of climate policies;
» The market price for CSP trade between Europe and MENA is expected to start around 30c$/KWh and decrease over time to 10-11c$/KWh. Though, the price at which the CSP-SG electricity will be traded, will necessarily depend on long-term international agreements;
» the CSP-SG option also impacts the global GHG emission permits market reducing its size and decreasing the price of the emission permits
» the CSP-SG option allows stabilization policy costs to be reduced
» A coordinated anticipation of investments in CSP reduces investments costs earlier and allows countries to have higher levels of consumption, in aggregate terms.
27
Future Steps
Future work will focus on:- Linking CSP electricity trade with Oil trade,- Introducing the spatial dimension in order to take into account geographic variability, - Extend the analysis to other innovations of the electric power grid.
Corso Magenta 63, 20123 Milano - Italia - Tel +39 02.520.36934 - Fax +39 02.520.36946 - www.feem.it
Thank You