Embed Size (px)
Citation preview
Network of Practice, IT Knowledge Spillovers, and Productivity: Evidence
from Enterprise Software
Peng Huang
R.H. Smith School of Business
University of Maryland
College Park, MD 20742
Marco Ceccagnoli, Chris Forman and D. J. Wu
Scheller College of Business
Georgia Institute of Technology
800 West Peachtree Street, NW
Atlanta, GA 30308
{marco.ceccagnoli;chris.forman;dj.wu}@scheller.gatech.edu
Abstract
Prior research on IT spillover often uses spillover pools with undefined transmission mechanisms and
ignores the direction of the spillovers. We invent an alternative measurement of IT spillover derived from
a different transmission pathway: knowledge transfer through interactions in an Internet-enabled network
of practices where IT professionals exchange ideas and help each other resolve technical problems they
encounter. Our method separates the effects of knowledge spillover from spillovers that are embedded in
intermediate inputs. We show that IT knowledge spillovers through these networks contribute positively
to firm productivity. The economic payoff of the spillovers is significant: by our estimate, one percent
increase in the inward knowledge spillovers translates to a $0.46 million increase in added value for an
average firm in our sample. Further, we find that IT spillovers complement a firm’s investment in IT
capital in the sense that the productivity of IT capital is increased with higher level of IT spillovers, but
such compelmentarity does not exist for either non-IT capital or non-IT labor. We discuss the
implications for research and practice.

1
1. Introduction
As knowledge becomes one of the central sources of competitive advantage, the identification, acquisition
and use of knowledge has generated sustained interest among researchers (Alcácer and Chung 2007). The
non-rival, public-goods characteristics of knowledge implies that when external knowledge is not
protected by intellectual property rights, it can be acquired through indirect means of spillovers. For
example, Romer (1986) argues that increasing economy-wide returns of innovation are likely to be a
result of spillovers, despite the fact that there is decreasing firm-specific returns to innovation. A large
body of literature has examined the role of knowledge spillovers in R&D (Eeckhout and Jovanovic 2002,
Griliches 1992, Nadiri 1993, O'Mahony and Vecchi 2009). In contrast, IT knowledge spillovers have
been examined only recently (Chang and Gurbaxani 2011, Cheng and Nault 2007, Han et al. 2011), with
good reasons. First, for a long time, the IT productivity paradox (Brynjolfsson 1993) has plagued IS
researchers due to the lack of robust and consistent measures of IT capital investment, and the fact that a
large fraction of IT investment is spent on intangible assets that are not recorded on the balance sheet
(Brynjolfsson et al. 2002). In addition, as Krugman (1991) pointed out, “knowledge flows… leave no
paper trail by which they may be measured and tracked.” The only exception to this is in the form of
patent citations, which has been used by researchers to explore R&D spillovers in inventive activities
(Jaffe and Trajtenberg 1999, Jaffe et al. 1993). In contrast, it is difficult to observe a similar linkage of IT
knowledge spillovers as that in patent citations. Therefore, studies on IT spillovers have to rely on
vaguely defined spillover pools, with little understanding of the mechanisms of spillovers that underlie
these pools. Such methodological treatment is further complicated by the well-known issue of
measurement errors in IT investments, which is likely to result in estimation bias in the magnitude of the
spillover effect (Tambe and Hitt 2012).
This paper aims to provide yet another counterexample to Krugman’s observation by identifying “paper
trails” of IT knowledge spillovers through fine-grained data obtained from an Internet-enabled network of
practices, where IT practitioners help each other solve technical problems and exchange knowledge and

2
ideas on the use of technologies. While prior research stresses the role of geographical proximity in
knowledge spillovers (Jaffe et al. 1993, Keller 2002a), spillovers are increasingly taking place over virtual
channels such as Internet. IT knowledge spillovers are especially susceptible to this path of transmission,
as many large platform technology companies have established Internet-enabled professional
communities of practice to facilitate knowledge exchange and self-support among the technology users.
IT knowledge spillovers are likely to enhance efficiency in the implementation, deployment, and use of
the latest information technology, and therefore shift total factor productivity. That is, given the same
amount of productive inputs such as labor, capital, and IT investment, firms that receive greater inward IT
knowledge spillovers tend to produce more production output than firms that do not. We test this
hypothesis by examining the knowledge spillovers that take place in the context of enterprise software, an
information technology that represents a large fraction of firms’ IT investment that is accompanied by
recent innovation in corporate IT (McAfee and Brynjolfsson 2008), and has significantly improved firm
financial and operational performances (Hitt et al. 2002, McAfee 2002). We measure knowledge
spillovers by tracking SAP Community Network forum activities of the members who are employees of
the Fortune 1000 firms that have installed SAP software, and use a production function framework to
examine the extent to which IT knowledge spillovers drive variations in total factor productivity.
There are several major results from our study. First, we find that the SAP community network has
attracted a large number of IT professionals in a relatively short time period and has experienced
exponential growth. For example, the total number of registered users has grown to around 268,000 in
about 7 years. In addition, consistent with prior anecdotal evidence, we find that the community has been
used as an effective means of knowledge acquisition and peer-support through “crowd sourcing” (Howe
2008). For example, there have been over 1.8 million discussion threads (Q&A conversations) posted in
the forums that focus on various technical and business process-related questions. On average, about a
quarter of all the questions raised by knowledge seekers are solved by the collective efforts of the
community members, and the average time it takes to get a correct solution is between 3-5 days.
3
Second, we find evidence that is consistent with interpreting these interactions as IT spillovers.
Particularly, results from fixed effect panel data estimates of a production function that incorporates the
role of IT spillovers suggest that, among firms that are SAP customers, those that receive higher levels of
knowledge spillovers have greater productivity than firms that do not. The economic payoff of the IT
knowledge spillovers is significant: by our estimate, a one percent increase in the inward knowledge
spillovers translates to a $0.46 million increase in added value for an average firm in our sample. We
conduct a series of falsification tests to explore the robustness of our findings. For example, we find the
identified effect is absent for the rest of the firms in the Fortune 1000 that do not use SAP software.
Further, IT spillovers complement a firm’s investment in IT capital in the sense that the productivity of IT
capital is increased with higher level of IT spillovers, but such compelmentarity does not exist for either
non-IT capital or non-IT labor. Finally, the identified effects of IT spillovers are also robust to
instrumental variables tests.
The reminder of the paper is organized as follow: Section 2 presents a brief overview of literature on
knowledge spillovers in information technology and its relationship to productivity. Section 3 introduces
the research context from which our measure of IT spillover is derived. The data and empirical methods
are introduced in Section 4. We present the results of data analyses in Section 5. In Section 6 we
summarize the findings and discuss their implications.
2. Knowledge Spillovers, Information Technology, and Productivity
The analysis of economic growth by Solow (1957) has sparked much interest in the search of factors that
underlie the productivity residual, which represents the part of output growth that is not explained by the
changes in factor inputs (Hulten 2001). Such factors include firm investment in R&D (Griliches 1979,
1986) and the use of information technologies (Brynjolfsson and Hitt 1995, Brynjolfsson and Hitt 2003).
A significant part of literature on endogenous growth has started to examine not only the effects of firm’s
own investment in these factors but also their social returns to the rest of the economy in the form of
4
spillovers (Romer 1986). Traditionally, empirical research that examined the relationship between
spillovers and productivity has focused primarily on the investments in R&D, and it has revealed positive
spillovers at the firm level (Griliches 1986, Jaffe 1986), the industry level (Goto and Suzuki 1989, Keller
2002b), and the country level (Coe and Helpman 1995, Madsen 2007).1 In some cases, the estimates of
the social return of R&D appear to be unusually high and exceed the internal return, especially when
R&D embedded in upstream industries where intermediate inputs are purchased are included in the
specification of production functions (O'Mahony and Vecchi 2009). In addition, R&D spillovers are
found to display high levels of technological proximity (Jaffe and Trajtenberg 1999, Jaffe 1986) and
geographical proximity (Agrawal et al. 2006, Alcácer and Chung 2007, Griffith et al. 2006, Jaffe et al.
1993).
There is a surge of empirical research in the spillovers of IT investment in recent years (Chang and
Gurbaxani 2011, Cheng and Nault 2007, Cheng and Nault 2011, Han et al. 2011, Tambe and Hitt 2012).
For example, recent studies have shown that IT investments made by a firm’s suppliers or customers
reduce transaction costs through information sharing and coordination, resulting in positive IT spillovers
within supply chains (Cheng and Nault 2007, Cheng and Nault 2011). Similar conclusions were drawn by
earlier works (e.g., Mun and Nadiri 2002). However, not all the firms benefit equally from IT spillovers;
Han et al. (2011) document that two characteristics of downstream industries – IT intensity and
competitiveness – influences the ability and motivation to capture and appropriate IT spillovers of the
firms in the industry. Moreover, Chang and Gurbaxani (2011) find that a large fraction of IT spillover
benefits is derived from trade relationships with IT services industry, and IT-related spillovers have
sustained contribution to productivity in the long run, in some cases persisting for over ten years in IT
intensive firms.
1 For comprehensive surveys, see Griliches (1992) and Nadiri (1993).

5
There are several reasons behind this recent interest in IT spillovers. First, a series of studies on
endogenous growth present evidence that support the hypothesis that information technology is behind
the productivity growth in the late 1990s (Jorgenson et al. 2008, Jorgenson and Stiroh 1999, Jorgenson et
al. 2000, Stiroh 2002b), and that it is the primary reason that explains the difference in the growth rates
between US and most European countries (Bloom et al. 2012, Severgnini 2010). Second, while the IT
productivity paradox has largely been resolved by using better data and improved methodology
(Brynjolfsson and Hitt 1996, Brynjolfsson and Hitt 2003), studies in this area have often detected an
unusually large output elasticity of IT (Brynjolfsson and Hitt 1995, Dewan and Min 1997), which tends to
be substantially higher than its input share. In a neoclassical economics framework where all capital input
must be paid at their marginal product, the output elasticity of IT must equal to its input factor share. This
contradiction leads to the hypothesis that at least some of the excess returns of IT are attributed to IT-
related spillovers (Stiroh 2002a).
Although significant progresses have been made in the research of IT spillovers, scholars in this field are
facing several challenges. One of such challenges is the inability to directly observe IT knowledge
spillovers with clearly defined transmission mechanism and the direction of knowledge flow. While
remedies for this issue exist in R&D spillovers,2 there hasn’t been any satisfactory solution to this
problem in the spillovers of IT. In the absence of such data, researchers rely heavily on the use of
aggregate spillover pools with undefined spillover transmission pathways. For example, Tambe and Hitt
(2012) reveal that the measurements of IT spillover pools are usually calculated by aggregating IT
capitals of other firms using either supply chain weights, industry weights, or trading weights.3 This
2 For example, researchers of R&D spillovers have started to examine the actual mechanisms of knowledge transfer:
some use patent citations to trace the source and destination of knowledge spillovers (Thompson 2006), while others
seek to employ variations in alliance and inventor mobility (Rosenkopf and Almeida 2003).
3 The pooled approach is not unique to IT spillovers. For example, many studies on R&D spillovers implicitly
assume that the technological distance between two firms is primarily determined by their industrial proximity, and
6
methodological treatment leads to several implications. First, it assumes that spillovers are nondirectional
and ignores asymmetry of spillovers in the sense that all firms in the industry/region draw equal benefits
from the contributions of all other firms. However, the endogenous growth literature maintains the view
that knowledge flows exclusively from frontier firms to follower firms, which promotes inequality and
results in free riding by followers (Eeckhout and Jovanovic 2002). More generally, this literature implies
that the sizes of relevant spillover pools differ across firms (Atallah 2005). Empirically, results from
Knott et al. (2009) support the notion that knowledge does have directionality and reject the hypothesis
that spillovers are pooled.
Second, the use of spillover pool has the limitation of being unable to separate rent spillover from
knowledge spillover (Griliches 1979, 1992), although the differences between the two have been
highlighted in prior literature. Rent spillover happens when factor inputs are purchased from other
industries at a price that does not fully reflect the improvements in the quality (Griliches 1992, Severgnini
2010). For example, an upstream supplier’s IT investment may improve the quality/variety of its
production offerings or timelineness /convenience of its services, which are used by a downstream firm as
intermediate input. If the upstream firm is unable to internalize the full return of its IT investment due to
competition among suppliers, externalities result in the downstream industry in the form of spillovers.
Knowledge spillovers, on the other hand, refers to IT-enabled innovations and practices that can be
transferred to other firms through interactions over time (Han et al. 2011). To the extent that the owner of
the knowledge cannot perfectly protect its invention through patent, and such knowledge is non-rival and
non-excludable, it can be learned and replicated by others. Such spillovers may happen via a number of
channels, such as learning, employee mobility, and leakage at trade conferences. As Griliches (1992)
correctly points out, rent spillover is more of a consequence of conventional measurement problem rather
than a true spillover effect.
therefore construct the spillover pool by calculating a weighted sum of R&D stocks of other firms within the same
industry (Ornaghi 2006).
7
In addition, IT spillover researchers encounter another challenge that is quite unique to IT value studies:
the lack of robust, consistently available measures of IT investment. Even in situations where data sets
that are available, the measurement errors in these IT data are rampant, in some cases constituting as high
as 30-40% of the total variance (Tambe and Hitt 2011). While this measurement error creates a downward
bias on the estimate of the productivity of own IT investment, it creates a different issue when the mis-
measured IT data is used to construct IT spillover pool, which often leads to significant overestimate of
the spillover effects. This estimation bias is caused by the fact that the spillover pool constructed in this
way (for example, industry weighted spillover pool) tends to be highly correlated with a firm’s own IT
investment, as the firms in the same industry often share common operating environment and
technological opportunities, therefore make similar IT investments. Tambe and Hitt (2012) provide a
formal analysis of this problem, and they present evidence that when such measurement errors are
corrected using instrumental variable method, the magnitude of the estimate of IT spillovers is
significantly reduced.
The aforementioned challenges call for a better understanding of the mechanisms through which IT
spillovers take place, as well as more accurate measurements of IT spillovers with carefully constructed
spillover functions. In consideration of these issues, this study invents an alternative measurement of IT
spillovers derived from directly observable linkage of knowledge flow. In contrast to prior literature, we
focus on a different spillover transmission pathway: knowledge transfer through interactions in virtual,
Internet-enabled network of practices where IT professionals exchange ideas and help each other resolve
technical problems they encounter. A unique characteristic of these online communities is that they have
the capability to generate spillovers that are not bounded by geographic spaces, as they permit long
distance transmission of technologies (Severgnini 2010). Recent research has theorized this community-
based model of knowledge creation and transfer as an evolutionary process of learning driven by criticism
(Lee and Cole 2003), which may expand beyond the boundary of firms (O'Mahony and Ferraro 2007).
Compared to a traditional closed model, such an model is said to result in faster and high quality solutions
8
to technical questions raised by members and greater variety of innovations (Füller et al. 2007). More
importantly, with the advent of Internet and online communities, there is a possibility to track the “paper
trail” of knowledge flows between IT professionals that participate in these communities. For example,
using information on the collaborative relationships between open-source software (OSS) developers,
Fershtman and Gandal construct a two-mode social network of OSS developers and projects, and link
project success with contributor spillovers and project spillovers (Fershtman and Gandal 2011).
We take this nascent line of research one step further to examine if the knowledge spillovers that take
place in these online networks of practice between the IT professionals lead to the variation in the
accumulation of IT knowledge capital of the firms that employ these professionals, and therefore
influence the total factor productivity of the firms. Although several prior studies have shown that IT
investment may generate externalities (Chang and Gurbaxani 2011, Cheng and Nault 2007, Cheng and
Nault 2011, Han et al. 2011), none of them have demonstrated that such externalities are due to pure IT
knowledge spillovers in the sense of Griliches (Griliches 1992). Compared to the spillover pool approach,
our method has the advantage of identifying knowledge flow with observable source and destination of
the spillovers in a way similar to that observed in patent citations for R&D spillovers. Therefore, our
study aims to add to the recent empirical evidence on IT spillovers by separating the effect of IT
knowledge spillovers on productivity from that of IT-related rent spillover, resulting in cleaner
identification. In addition, our work extends the current understanding of emerging online networks of
practice by presenting evidence of their business value. For example, although there is anecdotal evidence
that technology platform owner-sponsored online communities are often used for promoting innovation
and peer-support among platform adopters, and they bear similarity to open source communities in many
ways (Gorman and Fischer 2009, Von Hippel 1994), there has been a lack of formal studies that examine
the extent to which user firms of the underlying technology platform benefit from participation in those
online communities. Given that technology platform sponsors have invested heavily in building such

9
online user communities and they were embraced by millions of members in some cases, answer to this
question is critical in the understanding of the economic payoff to the investment in these technologies.
3. Research Context
Our research setting is the online community network run by SAP AG, the largest enterprise software
vendor by revenue. As part of its platform strategy, SAP established its Internet-based community of
innovation since 2004, with SAP developer network (SDN) and business process expert (BPX) as its two
major modules. It serves as a resource repository and a platform for SAP users, developers, architects,
consultants and integrators to collaborate and exchange knowledge on the adoption, implementation and
customization of SAP solutions. SAP Community Network (SCN) hosts forums, expert blogs, a technical
library, article downloads, a code sharing gallery, e-learning catalogs, wikis and other facilities through
which its members contribute their knowledge. All these web 2.0 technologies support open
communication between active members of the community, which amount to over 268,000 registered
users from 224 different countries as of 2010.
We choose enterprise software as the background for measuring IT knowledge spillovers for several
reasons. First, wide adoption of enterprise software – such as enterprise resource management (ERP),
customer relationship management (CRM), and supply chain management (SCM) – marks the start of a
period of innovation in corporate IT, and it coincides with the productivity revival of the US in the mid-
1990s (McAfee and Brynjolfsson 2008). Research has shown that investment in enterprise software and
its implementation makes a significant portion of a firm’s overall IT spending (Brynjolfsson et al. 2002)
— in some cases accounting for as high as 75% of corporate IT investment (McAfee and Brynjolfsson
2008), and adoption of enterprise software is associated with significant improvement in firm financial
and operational performance (Hitt et al. 2002). The use of corporate IT such as enterprise software
multiplies the value of innovation in business processes, intensifies competition among rival firms, and
drives economic growth (McAfee and Brynjolfsson 2008). Second, the adoption of complex IT platforms
10
such as enterprise software often requires complementary, specialized knowledge to unlock their
productivity. Enterprise software products are highly business process-oriented and usually need to be
tailored to fit business practices, where idiosyncratic local needs usually drive innovations in work places
(Hitt et al. 2002, Von Hippel 2005). For example, implementation of the off-the-shelf enterprise software
modules usually requires users to customize the configuration of a series of system parameters, modify
existing business processes, choose specific add-on functions and features, and sometimes even devise
specific tools to meet heterogeneous user needs. In addition, to facilitate the interoperability of the
enterprise system with legacy IT infrastructure, or the seamless integration with the information systems
of its partners, suppliers and customers, the end users often have to create workarounds and solutions to
integrate various IS components. Accumulation of specialized knowledge is likely to result during this
process of adaption and customization, and such knowledge is particularly susceptible to spillovers as
most of it is not protected by intellectual property rights. Third, although IT knowledge spillovers may
include that of knowledge related to other technologies such as computer operating systems and personal
productivity software, we choose not to include them in this study as they may be driven by the need of
individual skill-building that is not necessarily linked to the accruement of knowledge capital of the firm
that the individual works for. Unlike many other open source software communities, the knowledge
learned from enterprise software communities is most likely to be applied to drive firm productivity,
instead of being applied to pursue personal interest of the individuals.
A unique feature of SAP community network is that its members’ knowledge contribution to the
community can be quantified. To reward active members, SAP’s online community adopts a contributor
recognition program (CRP), which awards points to community members for each technical article, code
sample, video, wiki contribution, forum post, and weblog authored. For example, in the case of forum
discussion participation, points may be awarded for posting solutions in reply to existing discussion
threads marked as questions, if the answer is deemed helpful by the person who asks the question. SAP
publicly recognizes its most active members. For example, on the “Top Contributors” page, the top 50
11
contributors are listed in recognition of their contribution. On each discussion forum page, the top three
contributors to that forum are listed, with their total reward points displayed. In addition, SAP identifies
and provides special status to exceptional and high-value members by granting them the tile of “SAP
Mentor”. SAP Mentors are offered unique opportunities for access to SAP senior management, early
access to information on products and programs and greater visibility in the on-line communities as well
as at SAP events such as the SAP Tech Ed conference.
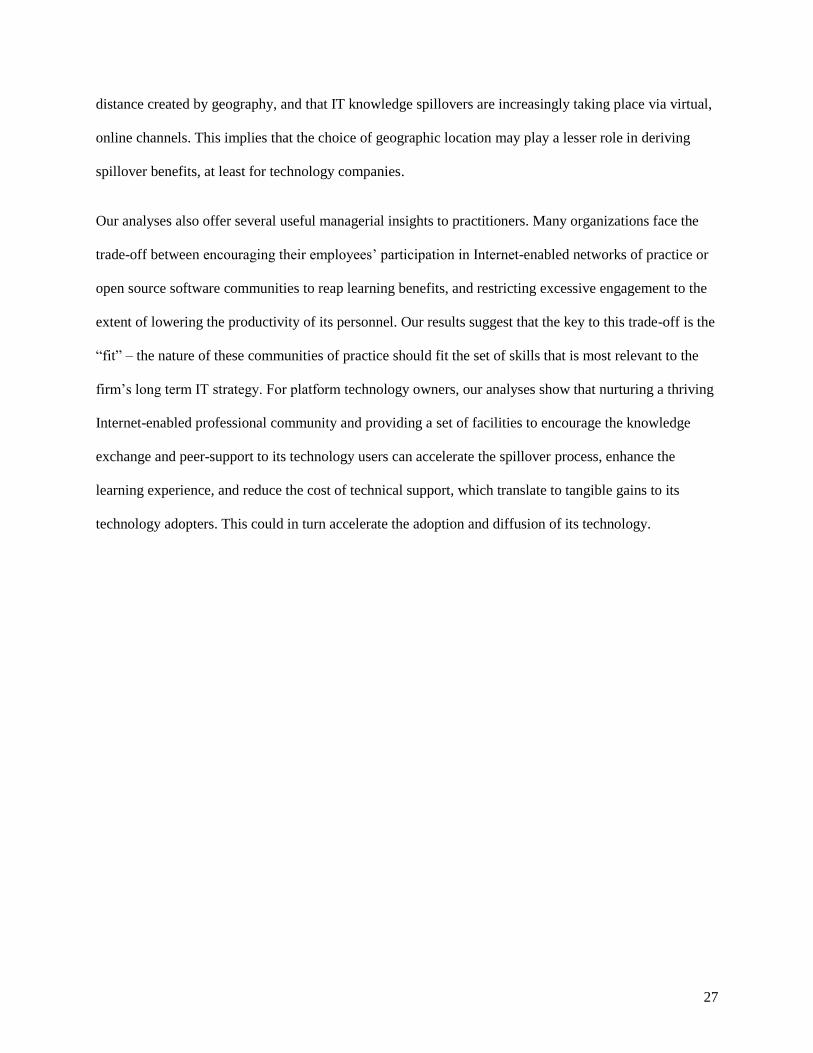
The participation in the community network is completely voluntarily and anyone can register as a
member by providing basic personal information. One piece of such profile information is the company
that employs the individual. Using this piece of information, it is possible to aggregate individual level
knowledge contribution and exchange to the firms that employ these individuals, and to derive the
knowledge flow patterns among firms (the definition of such knowledge flow will be introduced in the
next section). Other identifying information includes the country that the user comes from, her
relationship to SAP, email address, phone number, expertise, and LinkedIn profile page, etc. Figure 1
presents a sample user profile.
[Insert Figure 1 Here]
To track knowledge flows between the members of SAP online community network, we focus on user
interactions through the most frequently used communication format: the discussion forums. The primary
purpose of the discussion forums is to provide an avenue for conversations between the community
members so that they help each other solve problems that they encounter during the implementation,
deployment and use of SAP software (Fahey et al. 2007). The forums are organized according to the
domains of the relevant knowledge or expertise, each of which usually corresponds to a particular SAP
software module, or the application of the software solutions in a particular industry. Examples of SAP
forums include ERP manufacturing, product life cycle management, CRM-interaction center, and SAP for
automotive solutions. Each discussion thread is initiated by a knowledge seeker, who posts a specific
12
technical question in a topic forum of her choice. Knowledge contributors, on the other hand, post
responses to the question and try to solve the problem. A discussion thread is comprised of a list of
messages, and each message (either a question or an answer attempt) contains the information about the
member who posts the message, the body of the message, and a time stamp. Once a correct answer (at the
discretion of the knowledge seeker) is received, the discussion thread is closed. We developed a web
scripting tool and obtained the complete history of SAP forum discussions from 2004 to 2010. The
dataset includes about 1.8 million discussion threads with over 8 million messages posted in 243 topic-
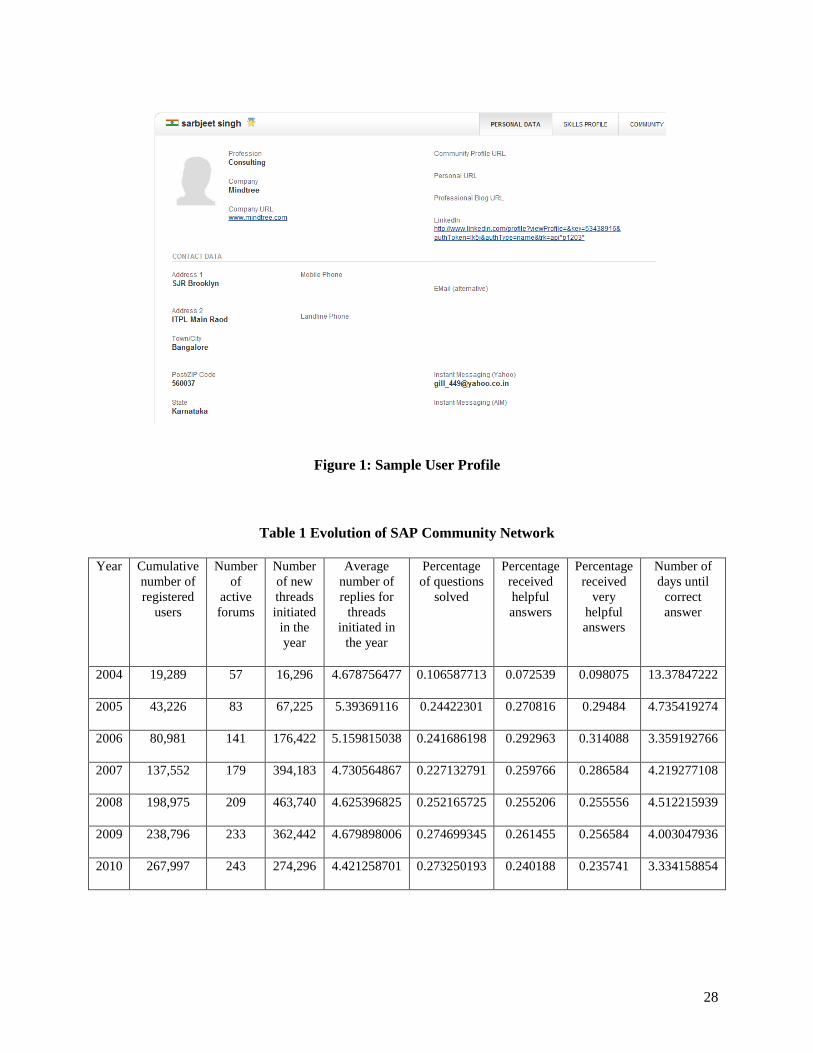
specific forums. Table 1 presents some summary statistics of the evolution of the SAP community
network, including numbers of registered members, topic forums and the discussion threads posted in
these forums. Overall, we find that the online community has experienced rapid growth since its
establishment, attracting close to 268,000 registered users in just 7 years, although the growth rate has
slowed recently. In addition, the discussion forums are heavily employed by the members of SCN, with
over 463,000 discussion threads generated in 2008 alone. Further, our data are consistent with earlier
anecdotal evidences that online communities of practice are an effective means of using the “wisdom of
the crowd” for peer support: on average, about a quarter of all the questions raised are solved by the
collective effort of the community members, and the average time it takes to get a correct solution is
between 3-5 days.
[Insert Table 1 Here]
4. Data and Methods
4.1. Estimation models
We adopt the production function approach and extend it by introducing our measurement of IT-related
spillovers. A typical production function relates firm output to factors of input of production (Hulten
2001). For example, a simple form of three-factor Cobb-Douglas production function has been widely

13
used in prior studies on IT productivity (Brynjolfsson and Hitt 1996, Dewan and Min 1997, Mittal and
Nault 2009):
(1)
Where Y is the quantity of production output, K is the stock of non-IT capital, L is the stock of labor, C is
the stock of IT-capital, and A denotes the total factor productivity (TFP). TFP is defined as the output
contribution that is not explained by the factor inputs and often interpreted as technological progress. In
this case, the output elasticity of IT-capital, , represents the percentage increase in output
due to a one percent increase in IT capital. To incorporate the role of knowledge spillovers, we consider
the following modification of (1), which also exploit longitudinal variation in a way similar to that is used
in Thornton and Thompson (2001):
(2)
Where S denotes the measure of inward IT-related knowledge spillovers. In this equation i and t index
firm and time period, respectively. The Cobb-Douglas production function can be employed to estimate
the factor productivities by implementing the following stochastic model:
(3)
OLS estimates of IT spillovers effects are likely to suffer from unobserved firm heterogeneities that are
correlated with inward spillovers. To address this issue, we introduce a set of firm- and year-fixed effects
to control for unobserved heterogeneities. This amounts to the modification of (3)
(4)
Where I and T represent firm fixed effect and year fixed effect, respectively.
14
4.2. Data
We conduct the empirical tests by constructing a dataset of firms that form the SAP install base and are
publicly traded. Our data come from a variety of sources. Particularly, we obtained the SAP installation
data, with a detailed list of product modules that are sold to and installed at all its clients in the United
States prior to the end of year 2004. In addition, we use the Harte Hanks Computer Intelligence (Ci)
Technology database to collect firm-level IT investment data. The Ci database records detailed
information about IT infrastructure for most of the Fortune 1000 firms, which include data on the quantity
of mainframes, peripheral, minicomputers, servers and PC systems, as well as other IT hardware stocks.
Ci database has been widely used by prior studies to investigate issues related to IT productivity
(Chwelos et al. 2010). The Ci data were then matched with Standard and Poor’s Compustat database to
obtain financial information of the publicly traded companies. Using similar method of prior research
(Brynjolfsson and Hitt 1996, Brynjolfsson and Hitt 2003, Chwelos et al. 2010, Dewan and Min 1997), we
use the financial data to construct measures of production output, non-IT capital stock and labor expenses.
4.2.1. Sample
As we are primarily interested in the knowledge spillovers restricted to those associated with a particular
platform technology – enterprise software by SAP, our sample is chosen as the set of firms among the
Fortune 1000 that had installed SAP product prior to the beginning of our sample period. The SAP
community network was established around the end of 2003 and beginning of 2004, so we choose 2004
as the starting year of our analyses. Although we have complete data of Ci Technology database from
2004 to 2009, the methods that are used to collect information on critical data items – such as numbers of
PC and Server owned by firms – has been changed dramatically by Harte Hanks from year 2009. To
maintain consistency of the measurement of IT capital over the sample years, we choose to exclude data
from 2009, resulting a five year sample period from 2004 to 2008. The sample is derived in several steps.
First, we retrieve the set of firms that had ever made into the Fortune 1000 list during 2004-2008, and
match them to Computstat data. We then match these firms with Ci Technology data and get the firms in

15
the intersection of the two databases. Finally, using the list of SAP clients, we obtain those firms that had
installed at least one SAP module prior to the end of year 2004. The final sample consists of 278 firms
with 1264 observations over a 5-year period.
4.2.2 Variables
IT Knowledge Spillovers
We derive the variable of inward IT-related spillovers, Sit, from forum conversations took place on the
SAP community network. Specifically, the rules of SAP reward program dictates that, for each question
that is posted in a topic forum, the knowledge seeker may use her discretion to judge the quality of
answers posted by knowledge contributors, and she can distribute 10 reward points to a user whose
answer is deemed correct (at most 1 answer can be evaluated as correct), 6 points if very helpful (at most
2 answers), and 2 points if helpful (no limit on number of helpful answers). We use a crawler program to
acquire the information on the user profiles for all the registered users of SAP Community Network, such
as their names, addresses, companies, profession, email addresses, countries, personal websites, LinkedIn
profiles, etc. Next, we select all the members that reside in the United States, and match them to
companies in our sample by examining their company affiliations and domains of their email addresses.
For each individual a who is an employee of firm i, we retrieve all the discussion threads that were
initiated by a in year t, and examine the history of the answers posted by other forum members. If a
received any correct, very helpful, or helpful answers in year t, the total number of reward points she gave
to the knowledge contributors are used as a proxy for inward IT spillovers to a. The reward points were
then aggregated across all the threads posted by a in year t to derive an individual level spillover variable,
Sait. The firm level spillover variable is defined as the sum of spillover measures of all the individuals who
are employees of the firm:
16
IT Capital
The measure of IT capital is derived from Computer Intelligence Technology database. The information
in the database covers major categories of IT hardware investments made by Fortune 1000 firms, such as
personal computing, systems and servers, networking, software, storage and managed services (Gu et al.
2008). We adopt the method used by Brynjofsson and Hitt (1995), Hitt and Brynjofsson (1996), and
Dewan and Min (1997) that define the IT capital stock as the sum of computer capital and three times of
IT labor. Inclusion of IT labor expense in the calculation of IT capital is justified by the fact that a large
fraction of IT labor expenses is dedicated to the development of computer software, which is a capital
good. The assumption that underlies this method is that the current IT labor spending is a good proxy of
the IT labor expenses in the recent past, and IS staff “stock” depreciates fully in three years (Brynjolfsson
and Hitt 1995).
The first component of this variable is the market value of total PCs and Servers currently owned by the
firm, converted to constant 2005 US dollars. To be specific, we collect market prices of PCs and Servers
in the United States from two report series produced by Gartner Dataquest Market Statistics database:
Gartner Worldwide Server Forecast and Gartner Worldwide PC Forecast from 2004 to 2008. These two
report series present detailed statistics on the number of shipments, prices, vendor revenues and other
related information about PC and Servers, which is broken down to the level of each geographic region
and market segment. 4 Our market prices of PC and Server are calculated as the average user price across
their respective market segments within the region of United States. These prices are then multiplied by
the quantities of PCs and Servers owned by the firms in our sample, which are retrieved from Harte
Hanks Ci Technology database, to derive the market value of the IT computer assets. Our approach of
calculating the computer market value is similar to that in Brynjofsson and Hitt (2003). Finally, we
4 Gartner Dataquest defines PC market segments as: desk-based, mobile, professional, and home. Server market
segments are defined by CPU types, which include x86, IA64, RISC, and other. The database covers regions of
Asia/Pacific, Eastern Europe, Latin America, Middle East & Africa, and West Europe. Several country level
statistics are also available, which include United States, Canada, and Japan.

17
deflate the market value by Bureau of Economic Analysis (BEA) Price Index for computers and
peripherals.
The second component of IT capital stock is IT-related labor expenses. Ci Technology database provides
the number of IT employees of the sample firms at the site level. We aggregate the site-level employee
numbers to the firm level to derive the total number of IT-related employees hired by the firm.5 IT labor
prices are obtained from Occupational Employment and Wage Estimates series of Bureau of Labor
Statistics (BLS) Occupational Employment Statistics (OES), and we use the mean annual wage of
computer and mathematical occupations as the average labor price for IT employees. As the wage
reported by OES series does not reflect benefits, we multiply the wage number by the ratio of total
compensation to salary, which is obtained from BLS Employer Costs for Employee Compensation
(ECEC) series. The IT labor expense is then deflated by BLS Employment Cost Index (ECI) for private
industry workers.
Production output
We follow prior literature (Brynjolfsson and Hitt 2003, Dewan and Min 1997) and use added value as the
measure of production output, which equals to deflated sale less deflated material. Compared to sales,
added value is said to be less noisy and more comparable across industry sectors (Dewan and Min 1997).
Annual sales numbers are retrieved from Compustat, and we deflate them using industry-specific (at two-
digit NAICS sector) price deflators from BEA Gross Output and Related Series by Industry. Materials are
calculated by subtracting undeflated labor and related expenses (Compustat data item XLR) from
undeflated total operating expenses (Compustat data item XOPR), and deflating by BLS Producer Price
Index (PPI) for intermediate materials, supplies, and components.
5 Ci database actually records a range of IT employees at each site. The ranges are defined as: 1-4, 5-9, 10-24, 25-
49, 50-99, 100-249, 250-499, and 500 or more. For each range, we take the middle value of the range as the number
of IT employees.
18
Non-IT capital
The calculation of total capital stock is similar to that in Brynjofsson and Hitt (2003) for ordinary capital.
Specifically, the gross book value of capital stock (Property, Plant and Equipment (Total-Gross),
Compustat data item PPEGT) is deflated by industry-specific capital investment deflator reported in BLS
1987-2010 Detailed Capital Measures.6 In order to apply the deflators, the average age of capital stock is
calculated as the ratio of total accumulated depreciation (Compustat data item DPACT) to current
depreciation (DP). We then subtract the deflated computer capital from deflated total capital to get the
value of non-IT capital.
Non-IT labor
Consistent with prior studies on IT productivities (Bloom and Van Reenen 2007, Bresnahan et al. 2002,
Brynjolfsson and Hitt 2003), total labor expense is either obtained directly from Compustat Labor and
Related Expenses (data item XLR), or calculated as the product of a firm’s reported number of employees
(Compustat data item EMP) and industry-average labor cost per employee, and deflated by BLS
Employment Cost Index (ECI) for private industry workers. Average labor cost per employee is obtained
from National Sector NAICS Industry-Specific estimates series of BLS Occupational Employment
Statistics (OES). To account for the fraction of benefits in total compensation, we multiply the wage
number by the ratio of total compensation to salary, which is obtained from BLS Employer Costs for
Employee Compensation (ECEC) series. Non-IT labor is defined as the difference between deflated total
labor expense and IT labor expense.
Table 2 reports the summary statistics of the variables. The average firm in the sample has sales of $16.43
billion, added value of $5.42 billion, and 40,736 employees, consistent with the fact that our sample being
publicly-traded, Fortune 1,000 SAP adopters. In addition, the firms invest heavily in IT capital, which has
6 Retrieved from http://www.bls.gov/mfp/mprdload.htm

19
a mean level of $100.59 million and maximum of $1.22 billion. Table 3 provides the correlation matrix
among the key variables.
[Insert Table 2 and Table 3 Here]
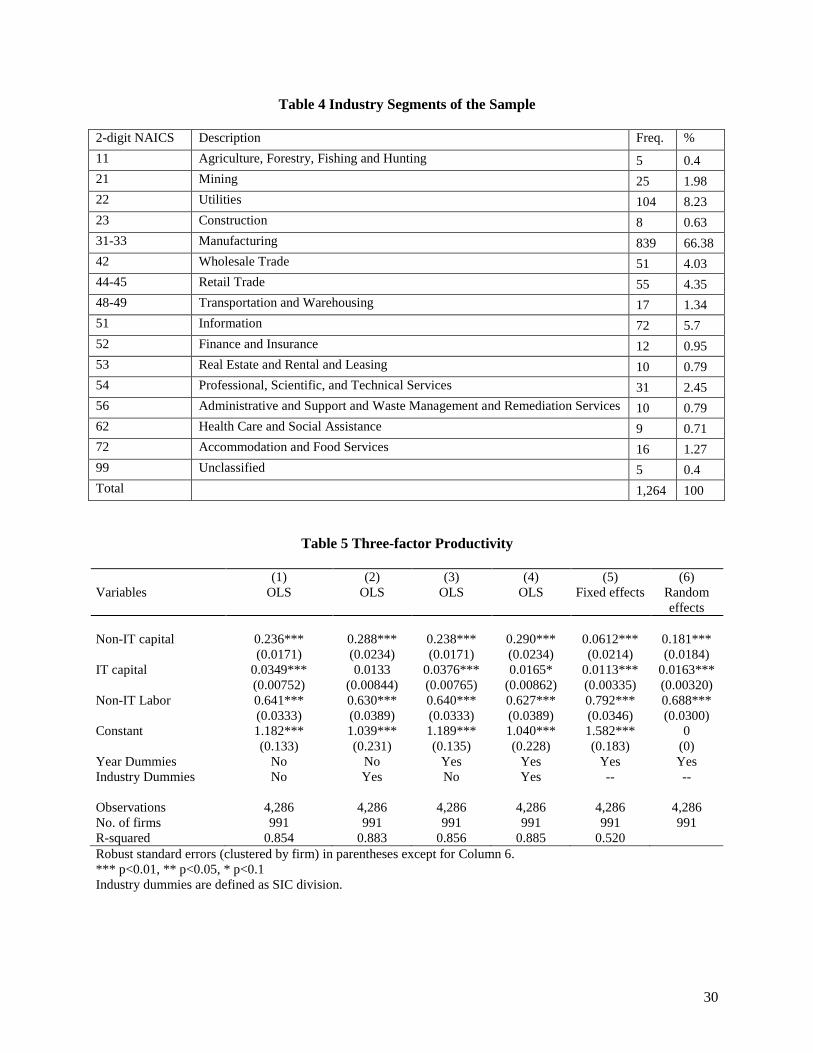
Table 4 presents a breakdown of the sample firms by vertical industries, which is based on 2-digit NACIS
sectors. It is notable that firms in manufacturing industry account for the majority (66%) of the sample,
followed by utilities firms (8%).
[Insert Table 4 Here]
5. Results
Three-Factor Productivity Analysis
Although the primary objective of this work is to examine the role of IT knowledge spillovers on firm
productivity, considering a large body of literature has centered on the role of IT capital investment in
driving productivity growth (Brynjolfsson and Hitt 1995, 1996, Brynjolfsson and Hitt 2003, Dewan and
Min 1997), we present a set of results in comparison with prior studies on IT productivities using the
same theoretical framework. One of the reasons that we include this analysis is the lack of studies that
present the evidence of IT productivity using data of recent years, partly due to the lack of robust and
consistent data that measure IT investment. Although exceptions do exist (Chwelos et al. 2010, Tambe
and Hitt 2011), the ways of constructing IT capital variable in these studies are usually different from
earlier literature.7 In addition, economists have raised the concern that returns in IT investments may
decline in recent years, implying that the stock of IT-enabled innovations is being depleted (Stiroh 2008).
7 For example, Tambe and Hitt (Tambe and Hitt 2011) use IT personnel data derived from a job search website,
while Chwelos et al. (Chwelos et al. 2010) use hedonic regression to impute IT equipment price, which is different
from the method employed by Ci database in earlier years.
20
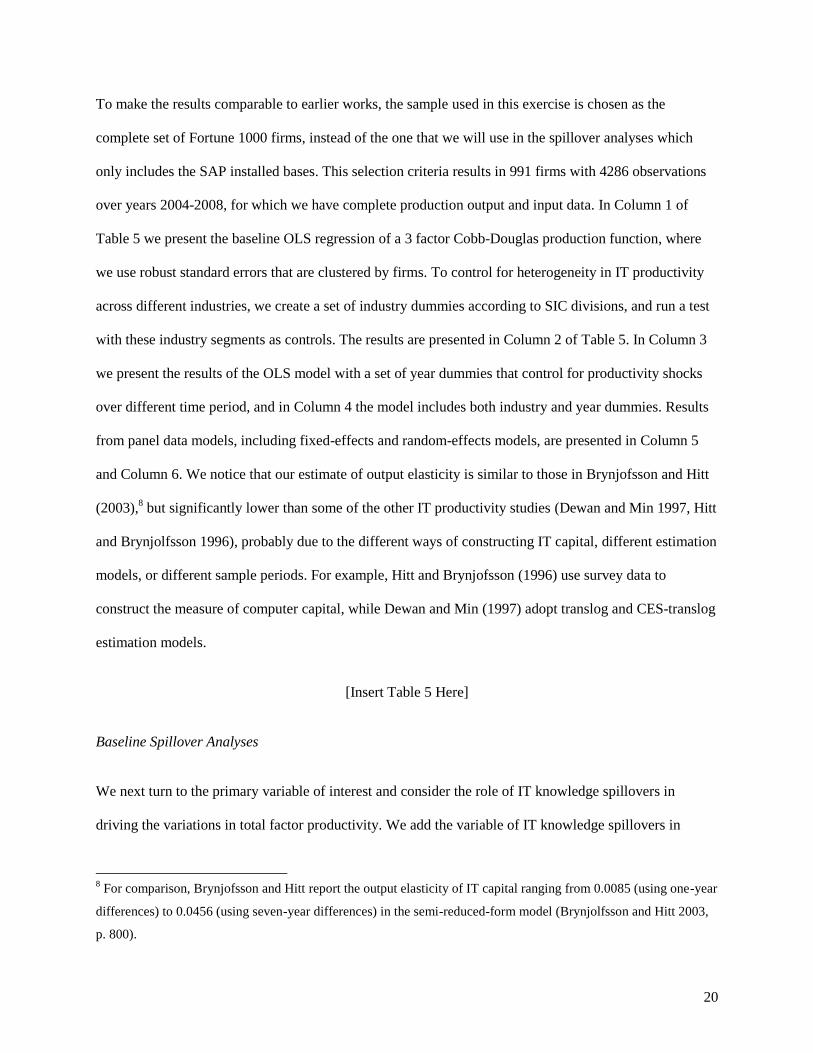
To make the results comparable to earlier works, the sample used in this exercise is chosen as the
complete set of Fortune 1000 firms, instead of the one that we will use in the spillover analyses which
only includes the SAP installed bases. This selection criteria results in 991 firms with 4286 observations
over years 2004-2008, for which we have complete production output and input data. In Column 1 of
Table 5 we present the baseline OLS regression of a 3 factor Cobb-Douglas production function, where
we use robust standard errors that are clustered by firms. To control for heterogeneity in IT productivity
across different industries, we create a set of industry dummies according to SIC divisions, and run a test
with these industry segments as controls. The results are presented in Column 2 of Table 5. In Column 3
we present the results of the OLS model with a set of year dummies that control for productivity shocks
over different time period, and in Column 4 the model includes both industry and year dummies. Results
from panel data models, including fixed-effects and random-effects models, are presented in Column 5
and Column 6. We notice that our estimate of output elasticity is similar to those in Brynjofsson and Hitt
(2003),8 but significantly lower than some of the other IT productivity studies (Dewan and Min 1997, Hitt
and Brynjolfsson 1996), probably due to the different ways of constructing IT capital, different estimation
models, or different sample periods. For example, Hitt and Brynjofsson (1996) use survey data to
construct the measure of computer capital, while Dewan and Min (1997) adopt translog and CES-translog
estimation models.
[Insert Table 5 Here]
Baseline Spillover Analyses
We next turn to the primary variable of interest and consider the role of IT knowledge spillovers in
driving the variations in total factor productivity. We add the variable of IT knowledge spillovers in
8 For comparison, Brynjofsson and Hitt report the output elasticity of IT capital ranging from 0.0085 (using one-year
differences) to 0.0456 (using seven-year differences) in the semi-reduced-form model (Brynjolfsson and Hitt 2003,
p. 800).
21
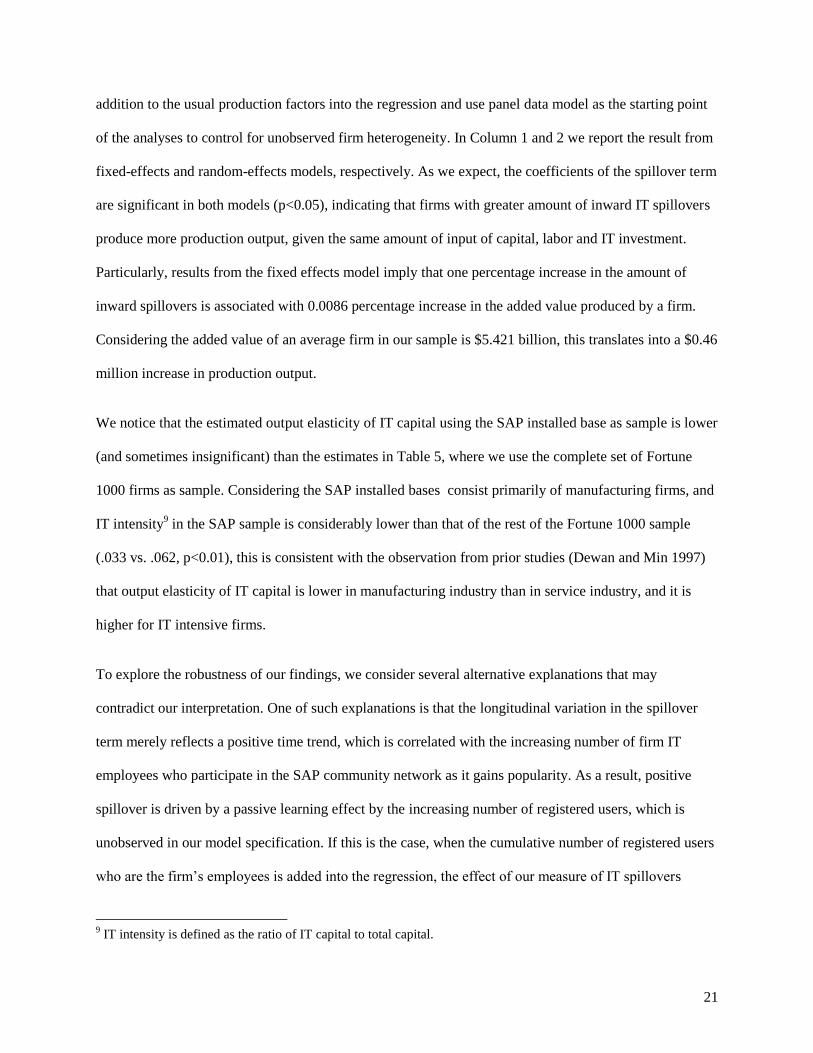
addition to the usual production factors into the regression and use panel data model as the starting point
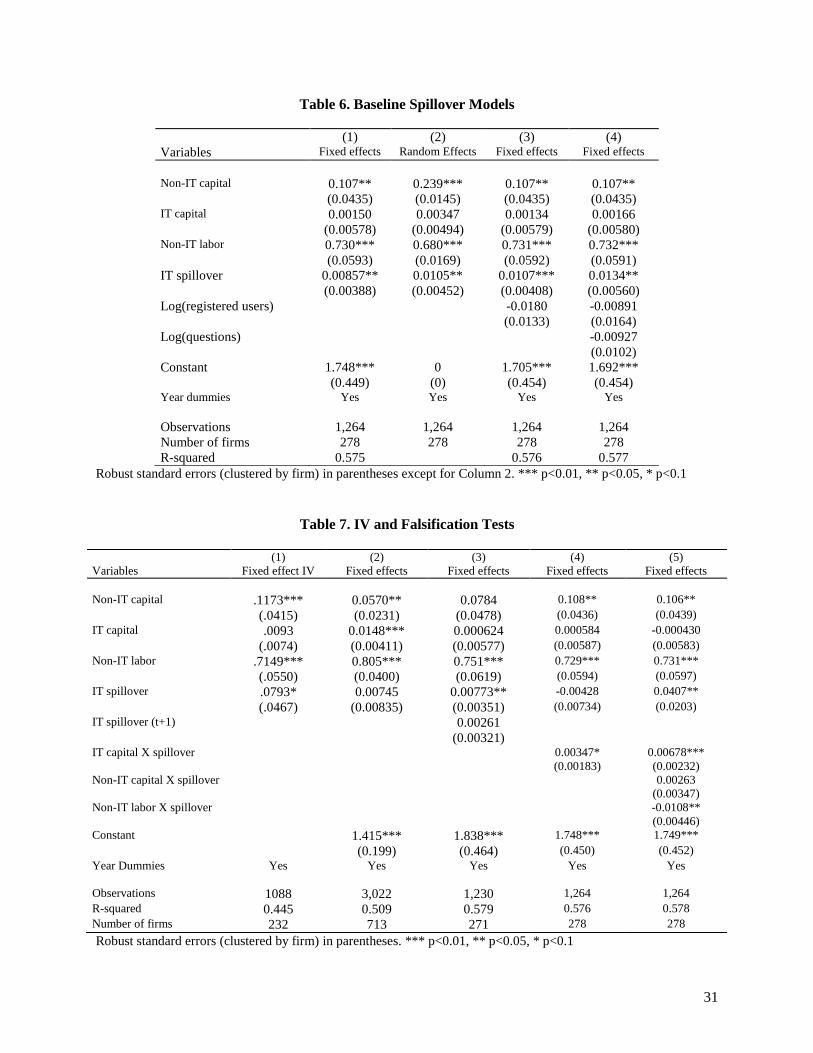
of the analyses to control for unobserved firm heterogeneity. In Column 1 and 2 we report the result from
fixed-effects and random-effects models, respectively. As we expect, the coefficients of the spillover term
are significant in both models (p<0.05), indicating that firms with greater amount of inward IT spillovers
produce more production output, given the same amount of input of capital, labor and IT investment.
Particularly, results from the fixed effects model imply that one percentage increase in the amount of
inward spillovers is associated with 0.0086 percentage increase in the added value produced by a firm.
Considering the added value of an average firm in our sample is $5.421 billion, this translates into a $0.46
million increase in production output.
We notice that the estimated output elasticity of IT capital using the SAP installed base as sample is lower
(and sometimes insignificant) than the estimates in Table 5, where we use the complete set of Fortune
1000 firms as sample. Considering the SAP installed bases consist primarily of manufacturing firms, and
IT intensity9 in the SAP sample is considerably lower than that of the rest of the Fortune 1000 sample
(.033 vs. .062, p<0.01), this is consistent with the observation from prior studies (Dewan and Min 1997)
that output elasticity of IT capital is lower in manufacturing industry than in service industry, and it is
higher for IT intensive firms.
To explore the robustness of our findings, we consider several alternative explanations that may
contradict our interpretation. One of such explanations is that the longitudinal variation in the spillover
term merely reflects a positive time trend, which is correlated with the increasing number of firm IT
employees who participate in the SAP community network as it gains popularity. As a result, positive
spillover is driven by a passive learning effect by the increasing number of registered users, which is
unobserved in our model specification. If this is the case, when the cumulative number of registered users
who are the firm’s employees is added into the regression, the effect of our measure of IT spillovers
9 IT intensity is defined as the ratio of IT capital to total capital.
22
would go away. Our results from Column 3, in which we add this variable to the regression, indicate that
this is not the case, and the magnitude of the spillover effect is actually even higher when we control for
this variable. Another possible explanation is that the spillover effect is caused by some unobserved firm
characteristics that drive up the need for knowledge seeking. For example, changes in complexity in a
firm’s IT architecture as a result of an acquisition may prompt compatibility issues with SAP enterprise
software, leading to a greater need for seeking outside consultancy to resolve some technical issues,
which in turn causes a larger spillover. In Column 4 we present a model that explicitly includes the total
number of questions that are raised by a firm’s employees (recall that a question is usually the first
message that initiates a discussion thread) in a year as a control. The results indicate that our finding is
robust to this alternative explanation.
[Insert Table 6 Here]
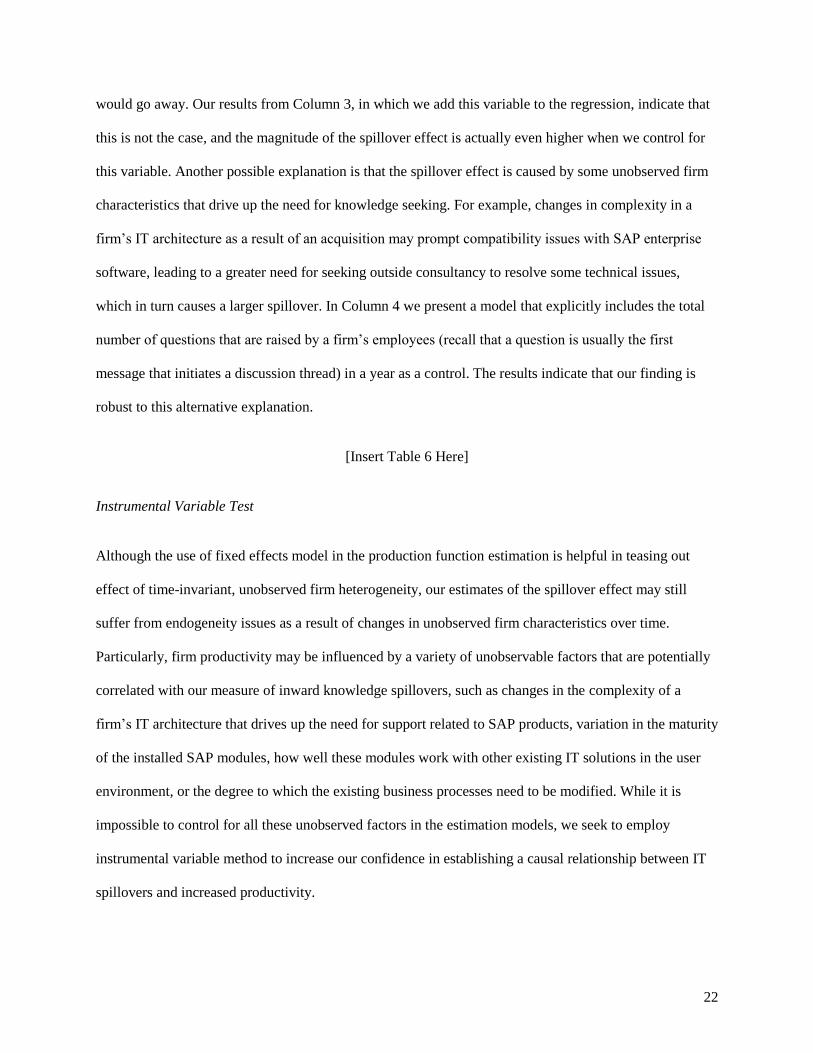
Instrumental Variable Test
Although the use of fixed effects model in the production function estimation is helpful in teasing out
effect of time-invariant, unobserved firm heterogeneity, our estimates of the spillover effect may still
suffer from endogeneity issues as a result of changes in unobserved firm characteristics over time.
Particularly, firm productivity may be influenced by a variety of unobservable factors that are potentially
correlated with our measure of inward knowledge spillovers, such as changes in the complexity of a
firm’s IT architecture that drives up the need for support related to SAP products, variation in the maturity
of the installed SAP modules, how well these modules work with other existing IT solutions in the user
environment, or the degree to which the existing business processes need to be modified. While it is
impossible to control for all these unobserved factors in the estimation models, we seek to employ
instrumental variable method to increase our confidence in establishing a causal relationship between IT
spillovers and increased productivity.

23
The rationale behind our choice of instrumental variables is that these variables should exogenously shift
the likelihood of getting inward knowledge spillovers, and at the same time being uncorrelated with
unobserved error component mentioned above. To find such variables, we make use of the SAP
installation data and take advantage of the variations in the different product modules installed by
different SAP clients.10
The idea is that firms with different installed product modules may derive varying
degree of benefits from the use of SAP community forums, and the variation in the potential benefits in
turn shapes the incentive of firm employees to seek knowledge in the community. Particularly, we
observe that the online forums are usually organized in such a way that each forum is dedicated to a
special topic of interest, which often corresponds to a specific SAP product module or an industry
solution. In addition, SAP introduces the forums gradually over the years, with only 57 forums in 2004
and 243 forums in 2010 (see details in Table 1). To make use of this longitudinal variation, we create a
mapping table that associates each SAP product module with the forums that are most relevant to this
module.11
In this way, we can identify the forums that are most useful for a firm, by examining the
product modules that the firm installs. Once such firm-to-forum correspondence is established, some of
the forum characteristics that may shift knowledge spillovers can be used to construct our instrumental
variables.
One of such variables is the number of forums that are most useful for a firm in a particular year. Since
the forums are introduced at different times, this variable is time-varying. In addition, the introduction of
the forums reflects SAP decisions that are exogenous to the characteristics of the firms that may drive
changes in the firm’s productivity. Particularly, we obtain the number of forums that are associated with
each firm-year, and create a binary variable high_forum which is set to 1 if the number is greater than the
sample median and to 0 otherwise. Two additional instrumental variables that we construct are related to
10
Some of the most frequently installed SAP product modules include: Financial accounting (FI), material
management (MM), business intelligence and data warehouse (BIW).
11 The mapping table is available upon request.

24
the potential benefits of participation in the forums. Particularly, we calculate the average number of
replies a question receives across all the discussion threads in a forum-year, and then derive a second IV
as the log of weighted average of “number of replies per question” at the firm-year level by referencing
the firm-to-forum matching table. In addition, we calculate the average of total number of useful answers
(which is equal to the sum of correct, helpful and very helpful answers) that a question receives across all
the discussion threads in a forum-year, and then construct a weighted average of “number of useful
answers per question” at the firm-year level by using our firm-to-forum mapping. We then create a binary
indicator high_useful as the third IV. These two variables should increase the expect payoff that shape the
incentive of participation, and therefore exogenously shift the likelihood of generating inward spillover.
We run an instrumental variable model with fixed effects using these 3 IVs, and present the results in
column 1 of Table 7. The results suggest that the positive spillover effect is robust to the endogeneity
issue.
Falsification Tests
To increase the confidence in our interpretation of the regression results, we conduct a series of
falsification tests. First, since the variable we use for IT spillover includes only the knowledge on a
narrowly defined technology platform – SAP enterprise software, such inflow of knowledge would only
be useful for those firms that install SAP software product. In other words, if the observed productivity
increase is indeed due to positive knowledge spillover, we should expect that no such effect exists for
firms that do not use SAP product, despite the fact that some of their employees also participate in forum
activities. We test the same fixed effects spillover model using the rest of the Fortune 1000 firm as sample
(which includes 713 firms and 3022 firm-year observations), and present the result in Column 2 of Table
7. Consistent with our expectation, we find that such knowledge spillover does not boost productivity for
companies that are not in the SAP install base. This result also confirms prior findings that spillovers have
directionality such that the sizes of relevant spillover pools differ across firms (Knott et al. 2009).

25
Second, a particular concern over our panel data estimation model is that serial correlation among the
spillover measure is partly driving the significant results. To rule out this interpretation, in Column 3 of
Table 7 we report a model in which we add the spillover variable in the next period in addition to its
current value. If our interpretation is correct, we expect that the future value of spillover should have no
effect on the productivity of the current year. This is indeed the result we find.
Third, to the extent that our spillover variable measures the knowledge on the implementation and use of
enterprise software, a major component of a firm’s IT investment, we expect that there is a synergy
between IT capital and IT spillovers, in the sense that the output elasticity of IT capital would be higher if
a firm receives greater inward spillovers, due to more effective use of its existing IT infrastructure. We
interact the IT capital variable with the spillover term, and enter it into the fixed effects model. The result
is presented in Column 4 of Table 7. The coefficient estimate of the interaction term is indeed positive,
consistent with the theory of complementarity between IT capital and IT knowledge spillover. For the
purpose of comparison, we also interact the spillover variable with non-IT capital and non-IT labor, and
enter them into the fixed effects model. The results from Column 5 of Table 7 suggest that no such
complementarity exist for non-IT capital or non-IT labor.
[Insert Table 7 Here]
6. Conclusions and Discussion
While most of the existing studies that assess the contribution of IT spillovers to firm productivity have
adopted the empirical strategy of constructing an aggregate pool of external IT investments and
embedding it along with other factor inputs in the production function, such identification method has
been shown to produce significant upward bias on the estimated effects of spillovers due to the
measurement errors in IT capital, and a high correlation between IT capital and the spillover pool (Tambe
and Hitt 2012). In many cases the estimated elasticity of spillover pool is even higher than that of a firm’s
own IT investment, making it difficult to justify these investments in the first place. In contrast, in this
26
study we invent a new method of measuring IT-related spillovers through directly observable linkage of
knowledge flows by using data on the knowledge exchanges and transfers that take place on Internet-
enabled network of practice. We obtain data on the inward knowledge spillovers at individual levels, and
use the company affiliation of these individuals to construct firm level spillover measures. Our analyses
indicate that greater level of IT-related knowledge spillovers is associated with higher productivity, and
our results are robust to a series of falsification tests and instrumental variable tests. To the best of our
knowledge, this is the first study that observes IT spillover with clearly defined transmission paths in a
way similar to that is observed in patent citations for R&D spillovers. Our measure of IT spillovers is less
likely to suffer from estimation bias caused by the pooled approach, since there is little correlation
between the spillover variable and IT capital. In addition, while prior research on knowledge spillovers
has highlighted the distinctions between rent spillover and knowledge spillover (Griliches 1979, 1992),
prior empirical studies of IT spillovers were unable to separate the two due to the way that the spillover
variable is constructed. In this sense, the estimated spillover effect in this study is a constituent of that
estimated by prior researchers, and we show that IT knowledge spillovers alone can drive increase in
productivity, even when the component of rent spillovers is removed.
Our findings reveal several theoretical implications. First, our data support the notion that spillovers are
asymmetric and different firms receive different spillover benefits (Knott et al. 2009, Singh 2007), even if
they are in the same industry or situated in similar positions in the supply chain. For example, a
downstream firm who uses SAP enterprise software systems is unlikely to receive IT knowledge spillover
benefits from an upstream supplier who implement Oracle enterprise software (however this does not
preclude the benefits of rent spillover). More generally, researchers should be more cautious in adopting
the pooled approach to spillover measurement and in choosing the correct spillover function. Second,
much of the R&D spillovers research has pointed to the phenomenon of localized spillovers (Alcácer and
Chung 2007, Jaffe et al. 1993, Keller 2002a), which often leads to the geographic concentration of the
firms in the same industry. Our study suggests that information technology has the capability to bridge the
27
distance created by geography, and that IT knowledge spillovers are increasingly taking place via virtual,
online channels. This implies that the choice of geographic location may play a lesser role in deriving
spillover benefits, at least for technology companies.
Our analyses also offer several useful managerial insights to practitioners. Many organizations face the
trade-off between encouraging their employees’ participation in Internet-enabled networks of practice or
open source software communities to reap learning benefits, and restricting excessive engagement to the
extent of lowering the productivity of its personnel. Our results suggest that the key to this trade-off is the
“fit” – the nature of these communities of practice should fit the set of skills that is most relevant to the
firm’s long term IT strategy. For platform technology owners, our analyses show that nurturing a thriving
Internet-enabled professional community and providing a set of facilities to encourage the knowledge
exchange and peer-support to its technology users can accelerate the spillover process, enhance the
learning experience, and reduce the cost of technical support, which translate to tangible gains to its
technology adopters. This could in turn accelerate the adoption and diffusion of its technology.
28
Figure 1: Sample User Profile
Table 1 Evolution of SAP Community Network
Year Cumulative
number of
registered
users
Number
of
active
forums
Number
of new
threads
initiated
in the
year
Average
number of
replies for
threads
initiated in
the year
Percentage
of questions
solved
Percentage
received
helpful
answers
Percentage
received
very
helpful
answers
Number of
days until
correct
answer
2004 19,289 57 16,296 4.678756477 0.106587713 0.072539 0.098075 13.37847222
2005 43,226 83 67,225 5.39369116 0.24422301 0.270816 0.29484 4.735419274
2006 80,981 141 176,422 5.159815038 0.241686198 0.292963 0.314088 3.359192766
2007 137,552 179 394,183 4.730564867 0.227132791 0.259766 0.286584 4.219277108
2008 198,975 209 463,740 4.625396825 0.252165725 0.255206 0.255556 4.512215939
2009 238,796 233 362,442 4.679898006 0.274699345 0.261455 0.256584 4.003047936
2010 267,997 243 274,296 4.421258701 0.273250193 0.240188 0.235741 3.334158854

29
Table 2 Summary Statistics
Variable Obs Mean Std. dev Min Max
Annual sales (million $) 1264 16432.97 32774.9 298.9129 364392.4
Added value (million $) 1264 5421.446 8745.522 118.1137 73242.29
Non-IT capital (million $) 1264 12306 29417.79 48.44337 321767.7
IT capital (million $) 1264 100.5927 147.0563 0.001968 1224.126
Non-IT labor expense (million $) 1264 2748.302 4372.957 28.75259 40586.13
No. of employees (thousands) 1261 40.73639 59.1636 0.658 428
IT spillover (reward points) 1264 10.51108 92.93818 0 2190
Table 3 Pearson Correlation Matrix of Selected Variables
Variable 1 2 3 4 5 6 7
1 Annual sales 1.0000
(-)
2 Added value 0.8616 1.0000
(0.0000) (-)
3 Non-IT capital 0.8310 0.7693 1.0000
(0.0000) (0.0000) (-)
4 IT capital 0.3331 0.4824 0.3216 1.0000
(0.0000) (0.0000) (0.0000) (-)
5 Non-IT labor expense 0.5496 0.8108 0.3675 0.5725 1.0000
(0.0000) (0.0000) (0.0001) (0.0000) (-)
6 No. of employees 0.5248 0.7576 0.3730 0.5480 0.9334 1.0000
(0.0000) (0.0000) (0.0000) (0.0000) (0.0000) (-)
7 IT spillover 0.0173 0.0451 -0.0006 0.0003 0.0600 0.0357 1.0000
(0.5387) (0.1089) (0.9834) (0.9908) (0.0329) (0.2055) (-)
30
Table 4 Industry Segments of the Sample
2-digit NAICS Description Freq. %
11 Agriculture, Forestry, Fishing and Hunting 5 0.4
21 Mining 25 1.98
22 Utilities 104 8.23
23 Construction 8 0.63
31-33 Manufacturing 839 66.38
42 Wholesale Trade 51 4.03
44-45 Retail Trade 55 4.35
48-49 Transportation and Warehousing 17 1.34
51 Information 72 5.7
52 Finance and Insurance 12 0.95
53 Real Estate and Rental and Leasing 10 0.79
54 Professional, Scientific, and Technical Services 31 2.45
56 Administrative and Support and Waste Management and Remediation Services 10 0.79
62 Health Care and Social Assistance 9 0.71
72 Accommodation and Food Services 16 1.27
99 Unclassified 5 0.4
Total 1,264 100
Table 5 Three-factor Productivity
(1) (2) (3) (4) (5) (6)
Variables OLS OLS OLS OLS Fixed effects Random
effects
Non-IT capital 0.236*** 0.288*** 0.238*** 0.290*** 0.0612*** 0.181***
(0.0171) (0.0234) (0.0171) (0.0234) (0.0214) (0.0184)
IT capital 0.0349*** 0.0133 0.0376*** 0.0165* 0.0113*** 0.0163***
(0.00752) (0.00844) (0.00765) (0.00862) (0.00335) (0.00320)
Non-IT Labor 0.641*** 0.630*** 0.640*** 0.627*** 0.792*** 0.688***
(0.0333) (0.0389) (0.0333) (0.0389) (0.0346) (0.0300)
Constant 1.182*** 1.039*** 1.189*** 1.040*** 1.582*** 0
(0.133) (0.231) (0.135) (0.228) (0.183) (0)
Year Dummies No No Yes Yes Yes Yes
Industry Dummies No Yes No Yes -- --
Observations 4,286 4,286 4,286 4,286 4,286 4,286
No. of firms 991 991 991 991 991 991
R-squared 0.854 0.883 0.856 0.885 0.520
Robust standard errors (clustered by firm) in parentheses except for Column 6.
*** p<0.01, ** p<0.05, * p<0.1
Industry dummies are defined as SIC division.
31
Table 6. Baseline Spillover Models
(1) (2) (3) (4)
Variables Fixed effects Random Effects Fixed effects Fixed effects
Non-IT capital 0.107** 0.239*** 0.107** 0.107** (0.0435) (0.0145) (0.0435) (0.0435) IT capital 0.00150 0.00347 0.00134 0.00166 (0.00578) (0.00494) (0.00579) (0.00580) Non-IT labor 0.730*** 0.680*** 0.731*** 0.732***
(0.0593) (0.0169) (0.0592) (0.0591)
IT spillover 0.00857** 0.0105** 0.0107*** 0.0134**
(0.00388) (0.00452) (0.00408) (0.00560)
Log(registered users) -0.0180 -0.00891
(0.0133) (0.0164)
Log(questions) -0.00927
(0.0102)
Constant 1.748*** 0 1.705*** 1.692***
(0.449) (0) (0.454) (0.454) Year dummies Yes Yes Yes Yes
Observations 1,264 1,264 1,264 1,264
Number of firms 278 278 278 278
R-squared 0.575 0.576 0.577
Robust standard errors (clustered by firm) in parentheses except for Column 2. *** p<0.01, ** p<0.05, * p<0.1
Table 7. IV and Falsification Tests
(1) (2) (3) (4) (5)
Variables Fixed effect IV Fixed effects Fixed effects Fixed effects Fixed effects
Non-IT capital .1173*** 0.0570** 0.0784 0.108** 0.106**
(.0415) (0.0231) (0.0478) (0.0436) (0.0439)
IT capital .0093 0.0148*** 0.000624 0.000584 -0.000430
(.0074) (0.00411) (0.00577) (0.00587) (0.00583)
Non-IT labor .7149*** 0.805*** 0.751*** 0.729*** 0.731***
(.0550) (0.0400) (0.0619) (0.0594) (0.0597)
IT spillover .0793* 0.00745 0.00773** -0.00428 0.0407**
(.0467) (0.00835) (0.00351) (0.00734) (0.0203)
IT spillover (t+1) 0.00261
(0.00321)
IT capital X spillover 0.00347* 0.00678***
(0.00183) (0.00232)
Non-IT capital X spillover 0.00263
(0.00347)
Non-IT labor X spillover -0.0108**
(0.00446)
Constant 1.415*** 1.838*** 1.748*** 1.749***
(0.199) (0.464) (0.450) (0.452)
Year Dummies Yes Yes Yes Yes Yes
Observations 1088 3,022 1,230 1,264 1,264
R-squared 0.445 0.509 0.579 0.576 0.578
Number of firms 232 713 271 278 278
Robust standard errors (clustered by firm) in parentheses. *** p<0.01, ** p<0.05, * p<0.1
32
References
Agrawal, A., I. Cockburn, J. McHale. 2006. Gone but not forgotten: knowledge flows, labor mobility, and
enduring social relationships. Journal of Economic Geography. 6(5) 571-591.
Alcácer, J., W. Chung. 2007. Location strategies and knowledge spillovers. Management Science. 53(5)
760-776.
Atallah, G. 2005. R&D cooperation with asymmetric spillovers. Canadian Journal of Economics. 38(3)
919-936.
Bloom, N., R. Sadun, J. Van Reenen. 2012. Americans Do IT Better: US Multinationals and the
Productivity Miracle. The American Economic Review. 102(1) 167-201.
Bloom, N., J. Van Reenen. 2007. Measuring and Explaining Management Practices Across Firms and
Countries. Quarterly Journal of Economics. 122(4) 1351-1408.
Bresnahan, T.F., E. Brynjolfsson, L.M. Hitt. 2002. Information Technology, Workplace Organization,
And The Demand For Skilled Labor: Firm-Level Evidence. Quarterly Journal of Economics.
117(1) 339-376.
Brynjolfsson, E. 1993. The productivity paradox of information technology. Communications of the
ACM. 36(12) 66-77.
Brynjolfsson, E., L. Hitt. 1995. Information Technology as a Factor of Production: The Role Of
Differences among Firms. Economics of Innovation and New Technology. 3(3&4) 183 - 200.
Brynjolfsson, E., L. Hitt. 1996. Paradox Lost? Firm-level Evidence on the Returns to Information
Systems Spending. Management Science. 42(4) 541-558.
Brynjolfsson, E., L.M. Hitt. 2003. Computing Productivity: Firm-Level Evidence. Review of Economics
& Statistics. 85(4) 793-808.
Brynjolfsson, E., L.M. Hitt, S. Yang. 2002. Intangible Assets: Computers and Organizational Capital.
Brookings Papers on Economic Activity. 2002(1) 137-181.
Chang, Y.B., V. Gurbaxani. 2011. The Impact of IT-Related Spillovers on Long-Run Productivity: An
Empirical Analysis. Information Systems Research. Forthcoming.
Cheng, Z., B.R. Nault. 2007. Industry level supplier-driven IT spillovers. Management Science. 53(8)
1199-1216.
Cheng, Z., B.R. Nault. 2011. Relative Industry Concentration and Customer-Driven IT Spillovers.
Information Systems Research. 23(2) 340-355.
Chwelos, P., R. Ramirez, K.L. Kraemer, N.P. Melville. 2010. Does Technological Progress Alter the
Nature of Information Technology as a Production Input? New Evidence and New Results.
Information Systems Research. 21(2) 392-408.
Coe, D.T., E. Helpman. 1995. International r&d spillovers. European Economic Review. 39(5) 859-887.
Dewan, S., C.-K. Min. 1997. The Substitution of Information Technology for Other Factors of
Production: A Firm Level Analysis. Management Science. 43(12) 1660-1675.
Eeckhout, J., B. Jovanovic. 2002. Knowledge spillovers and inequality. The American Economic Review.
92(5) 1290-1307.
Fahey, R., A.C. Vasconcelos, D. Ellis. 2007. The impact of rewards within communities of practice: a
study of the SAP online global community. Knowledge Management Research & Practice. 5
186-198.
Fershtman, C., N. Gandal. 2011. Direct and indirect knowledge spillovers: the “social network” of
open‐source projects. The RAND Journal of Economics. 42(1) 70-91.
Füller, J., G. Jawecki, H. Mühlbacher. 2007. Innovation creation by online basketball communities.
Journal of Business Research. 60(1) 60-71.
Gorman, A., G. Fischer. 2009. Toward an Analytic Framework for Understanding and Fostering Peer-
support Communities in Using and Evolving Software Products. Proceedings of the fourth
international conference on communities and technologies, University Park, PA, USA.

33
Goto, A., K. Suzuki. 1989. R & D capital, rate of return on R & D investment and spillover of R & D in
Japanese manufacturing industries. The Review of Economics and Statistics. 71(4) 555-564.
Griffith, R., R. Harrison, J. Van Reenen. 2006. How special is the special relationship? Using the impact
of US R&D spillovers on UK firms as a test of technology sourcing. The American Economic
Review. 96(5) 1859-1875.
Griliches, Z. 1979. Issues in assessing the contribution of research and development to productivity
growth. Bell Journal of Economics. 10(1) 92-116.
Griliches, Z. 1986. Productivity, R and D, and Basic Research at the Firm Level in the 1970's. The
American Economic Review. 76(1) 141-154.
Griliches, Z. 1992. The Search for R&D Spillovers. Scandinavian Journal of Economics. 94(Supplement)
S29-S47.
Gu, B., L. Xue, G.N. Ray. 2008. IT Governance and IT Investment Performance: An Empirical Analysis.
Proceedings of the 29th International Conference on Information Systems, Paris, France.
Han, K., Y.B. Chang, J. Hahn. 2011. Information Technology Spillover and Productivity: The Role of
Information Technology Intensity and Competition. Journal of Management Information
Systems. 28(1) 115-146.
Hitt, L.M., E. Brynjolfsson. 1996. Productivity, Business Profitability, and Consumer Surplus: Three
Different Measures of Information Technology Value. MIS Quarterly. 20(2) 121-142.
Hitt, L.M., D.J. Wu, X. Zhou. 2002. Investment in Enterprise Resource Planning: Business Impact and
Productivity Measures. Journal of Management Information Systems. 19(1) 71-98.
Howe, J. 2008. Crowdsourcing: Why the power of the crowd is driving the future of business. Crown
Business, New York.
Hulten, C.R. 2001. Total factor productivity: a short biography. C.R. Hulten, E.R. Dean, M.J. Harper, eds.
New Developments in Productivity Analysis. University of Chicago Press, 1-54.
Jaffe, A., M. Trajtenberg. 1999. International Knowledge Flows: Evidence From Patent Citations.
Economics of Innovation and New Technology. 8(1-2) 105-136.
Jaffe, A.B. 1986. Technological Opportunity and Spillovers of R & D: Evidence from Firms' Patents,
Profits, and Market Value. The American Economic Review. 76(5) 984-1001.
Jaffe, A.B., M. Trajtenberg, R. Henderson. 1993. Geographic Localization of Knowledge Spillovers as
Evidenced by Patent Citations. The Quarterly Journal of Economics. 108(3) 577-598.
Jorgenson, D.W., M.S. Ho, K.J. Stiroh. 2008. A Retrospective Look at the U.S. Productivity Growth
Resurgence. Journal of Economic Perspectives. 22(1) 3-24.
Jorgenson, D.W., K.J. Stiroh. 1999. Information Technology and Growth. The American Economic
Review. 89(2) 109-115.
Jorgenson, D.W., K.J. Stiroh, R.J. Gordon, D.E. Sichel. 2000. Raising the Speed Limit: U.S. Economic
Growth in the Information Age. Brookings Papers on Economic Activity. 2000(1) 125-235.
Keller, W. 2002a. Geographic Localization of International Technology Diffusion. The American
Economic Review. 92(1) 120-142.
Keller, W. 2002b. Trade and the Transmission of Technology. Journal of Economic Growth. 7(1) 5-24.
Knott, A.M., H.E. Posen, B. Wu. 2009. Spillover asymmetry and why it matters. Management Science.
55(3) 373-388.
Krugman, P.R. 1991. Geography and trade. the MIT Press, Cambridge, MA.
Lee, G.K., R.E. Cole. 2003. From a Firm-Based to a Community-Based Model of Knowledge Creation:
The Case of the Linux Kernel Development. Organization Science. 14(6) 633-649.
Madsen, J.B. 2007. Technology spillover through trade and TFP convergence: 135 years of evidence for
the OECD countries. Journal of International Economics. 72(2) 464-480.
McAfee, A. 2002. The Impact of Enterprise Information Technology Adoption on Operational
Performance: An Empirical Investigation. Production & Operations Management. 11(1) 33-53.
McAfee, A., E. Brynjolfsson. 2008. Investing in the IT That Makes a Competitive Difference. Harvard
Business Review. 86(7/8) 98-107.

34
Mittal, N., B.R. Nault. 2009. Research Note--Investments in Information Technology: Indirect Effects
and Information Technology Intensity. Information Systems Research. 20(1) 140-154.
Mun, S.B., M.I. Nadiri. 2002. Information technology externalities: empirical evidence from 42 US
industries. NBER working paper.
Nadiri, M.I. 1993. Innovations and technological spillovers. NBER Working Paper, No. 4423.
O'Mahony, M., M. Vecchi. 2009. R&D, knowledge spillovers and company productivity performance.
Research Policy. 38(1) 35-44.
O'Mahony, S., F. Ferraro. 2007. The emergence of governance in an open source community. Academy of
Management Journal. 50(5) 1079-1106.
Romer, P.M. 1986. Increasing returns and long-run growth. The Journal of Political Economy. 94(5)
1002-1037.
Rosenkopf, L., P. Almeida. 2003. Overcoming Local Search Through Alliances and Mobility.
Management Science. 49(6) 751-766.
Severgnini, B. 2010. Is ICT a Jack-in-the-Box? A Counterfactual Approach for Identifying Productivity
Spillovers. Working Paper.
Singh, J. 2007. Asymmetry of knowledge spillovers between MNCs and host country firms. Journal of
International Business Studies. 38(5) 764-786.
Solow, R.M. 1957. Technical change and the aggregate production function. The Review of Economics
and Statistics. 39(3) 312-320.
Stiroh, K. 2008. Information Technology and Productivity: Old Answers and New Questions. CESifo
Economic Studies. 54(3) 358-385.
Stiroh, K.J. 2002a. Are ICT spillovers driving the New Economy? Review of Income and Wealth. 48(1)
33-57.
Stiroh, K.J. 2002b. Information Technology and the U.S. Productivity Revival: What Do the Industry
Data Say? American Economic Review. 92(5) 1559-1576.
Tambe, P., L.M. Hitt. 2011. The Productivity of Information Technology Investments: New Evidence
from IT Labor Data. Information Systems Research. Forthcoming.
Tambe, P., L.M. Hitt. 2012. Measuring spillovers from information technology investments. New York
University Working Paper.
Thompson, P. 2006. Patent citations and the geography of knowledge spillovers: evidence from inventor-
and examiner-added citations. The Review of Economics and Statistics. 88(2) 383-388.
Thornton, R.A., P. Thompson. 2001. Learning from experience and learning from others: An exploration
of learning and spillovers in wartime shipbuilding. American Economic Review. 91(5) 1350-1368.
Von Hippel, E. 1994. The Sources of Innovation. Oxford University Press, New York.
Von Hippel, E. 2005. Democratizing Innovation. The MIT Press, Cambridge, MA.