Embed Size (px)
Citation preview
Knowledge Spillovers in Cost-Reduction Incentives
Luis Aguiar1 Philippe Gagnepain2
September 30, 2013
Abstract
The goal of this paper is to identify and measure the relevance of knowledgespillovers in the French urban transport industry, where most regulated trans-portation networks are operated by firms that belong to the same company. Webuild and estimate a structural cost regulation model under incomplete informa-tion where the service is regulated by an authority and is provided by a singleoperator that may be owned by a larger company. We identify the knowledgespillovers which arise for some operators being linked to a same group, and seehow they influence the firms’ decisions of exerting effort in order to reduce theiroperating costs. Our model provides us with estimates of the operators’ inefficien-cies, the effort of the managers and the knowledge spillovers. Our results showthat knowledge spillovers are indeed relevant for the existing industrial groupspresent in the French urban transport industry. Simulation exercises provide evi-dence of significant reductions in total operating cost following the enlargement ofindustrial groups and/or mergers between existing groups.
JEL codes: L25, L51, L92
1Institute for Prospective Technological Studies (IPTS) and Universidad Carlos III de Madrid.2Paris School of Economics-Université Paris 1 and CEPR.
1
1 Introduction
This goal of this paper is to identify and measure the relevance of knowledge spillovers
in the French urban transport industry. In each French city of significant size, the local
authority regulates and monitors the activity of a single operator that provides the
transport services on the urban network within a regulatory framework. The latter
takes the form of a written contract that defines the payment and cost-reimbursement
rules between the parties. Two types of regulatory contracts are observed in practice,
namely fixed-price and cost-plus schemes. Under fixed-price contracts, the operator
receives subsidies to cover ex-ante (expected) operating deficits, while under cost-plus
regulation, subsidies are provided by the local authorities to finance ex-post (realized)
deficits. As it is well known, each type of regulatory rule has an impact on operating
costs since it entails different levels of incentives in terms of effort in cost reduction
activities. In particular, fixed-price contracts provide powerful incentives to reduce
operating costs.
The regulator does not observe the technological efficiency or the cost reduction
activity of the operator. In France, local authorities have been historically blamed for
their laxness in assessing operating costs, mainly because of their lack of knowledge
and experience of transportation economics and technologies, and/or because of their
limited capacity of monitoring and auditing complex operating activities. These con-
siderations prevent them to adequately assess the effort of operators in providing ap-
propriate and competent solutions to cost and network inefficiencies.
A distinguishing feature of the French urban transport industry is that about eighty
percent of the operators are owned by three large companies. The transport services
provided in different networks by operators belonging to the same industrial group
are therefore, in essence, provided by the same firm. This peculiarity suggests that
these companies may benefit from spillovers by operating several networks in differ-
ent localities. In other words, the economic activity involved in one specific network
may affect the economic activity in other networks operated by the same company.
In the specific context of the urban transport industry, we expect these spillovers or
externalities to take place when a cost-reducing activity developed by one of the oper-
ators reaches other parts of the group. As a consequence of this positive externality, all
networks operated by the firms belonging to the group benefit from the cost-reducing
2
efforts provided by any of the operators. In the French urban transportation industry,
operators have engineer teams in each network that are responsible for the improve-
ment of the operator’s productivity. When operators belong to the same group, the
new methods and procedures that they develop can potentially be used by the en-
tire company, therefore improving productivity and/or reducing operating costs. To
reflect the fact that these spillovers could be related to a large array of know-how gen-
erated by the firm, ranging from technological to organizational, we will refer to them
as knowledge spillovers throughout the text.
This paper is aimed at identifying and measuring the importance of these knowl-
edge spillovers in the French urban transport industry and their impact on the effi-
ciency of operators.
Our work shares features with different strands of the empirical literature on both
regulation and firm performance. First, our paper belongs to the recent empirical lit-
erature on incentive regulatory policies. Considering contract in the transportation
industry, Gagnepain and Ivaldi (2002) focus on the incentives effects of cost-plus and
fixed-price contracts on the cost-reducing activities of operators and compare the wel-
fare level of observed regulatory practices with the one that would have been obtained
using first-best and second-best regulatory policies. Gagnepain and Ivaldi (2012) build
on a similar model and incorporate political aspects of regulation to analyze the deter-
minants of contract choices. Gagnepain, Ivaldi and Martimort (forthcoming) analyze
the dynamics aspects of regulation by assessing the cost of renegotiation in the French
transportation industry. Our models builds on this previous literature by focusing on
the incentives of cost-plus and fixed-price contracts and extends it by modeling the
knowledge spillovers that result from these incentives when transport operators are
linked to each other. From that perspective, our paper is one of the first to take into
account knowledge spillovers in a regulation context.
Dealing with technology and knowledge externalities, our paper also relates to the
empirical literature on R&D knowledge spillovers. However, most of the latter deals
with knowledge spillovers across firms rather than within firms (see for example Bern-
stein and Nadiri, 1989; Griliches, 1992; Bloom et al, 2013). Most related to our paper
is the work of Klette (1996). Using data on Norwegian manufacturing firms, he ana-
lyzes the relationship between firm performance and R&D. In addition to being able
3
to identify R&D at the line-of-business level within each firm, he can identify firms
that belong to the same “interlocking group of firms”.3 His results show significant
spillover effects across different lines of business (e.g. chemicals or metal products)
within a firm but also reveal significant spillovers for activities within a line of busi-
ness that are carried out by different firms within the same group.
Our work also relates to part of the literature on knowledge transfer within the
firm. In a seminal paper, Szulanski (1996) analyzes firms’ ability to transfer best prac-
tices internally. Using survey data on best practice transfers in eight different com-
panies, he shows the major barriers to internal knowledge transfer to be knowledge-
related factors such as the recipient lack of absorptive capacity. Although we are not
able to explicitly measure the knowledge transfers within groups in our analysis, we
can still account for some form of network-specific absorptive capacity in our analy-
sis and find evidence of positive knowledge spillovers across networks linked to the
same group.4 Another related paper is Darr et al (1995), which analyze knowledge
transfer acquired through learning-by-doing in service organization. Focusing on 36
pizza stores owned by 10 different franchisees, they find evidence of knowledge trans-
fer across stores owned by the same franchisee but not across stores owned by different
franchisees. Related to this, some papers have also highlighted the importance of free-
riding among the different franchisees of a given chain (see for example Brickley, 1999
and Lafontaine and Slade, 1997,2007). Indeed, a franchisee has incentives to free-ride
on the tradename of the franchisor given that her effort is private while the benefits
will accrue to all the members of the chain. This closely relates to our case where each
local network privately pays the cost of its effort which will benefit (at least partially)
all members of the group.
We build and estimate a structural cost regulation model with asymmetric infor-
mation that includes knowledge spillovers (i.e. externalities) of operating different
networks. Our goal is to identify the latter, and see how they influence firms’ decisions
of exerting effort to reduce their operating costs. Our model provides us with estimates
of the firms’ inefficiencies, the effort of the managers and the technology.
In each given city, there’s a single network operator in charge of providing the trans-3According to the author, an interlocking group of firm is characterized by a parent company and all
subsidiaries in which the parent company owns a majority share of equity.4In particular, we are able to construct indices that relate to the structural differences between a given
network and the remaining networks from the same group. They are presented in greater detail below.
4
portation service. This operator can be part of one of the largest industrial groups or
it can be independent. In either case, each operator has a local manager who takes
care of running the network and decides on the effort to be exerted to reduce the op-
erating costs of the local transportation activity. In our model, each operator in each
given city faces different incentives to reduce these costs. First, the type of regulatory
contract (fixed-price vs cost-plus) is a crucial determinant of cost reducing activities.
The second class of incentive is the one driven by the knowledge spillovers that fol-
low from operators being part of a same group, if any. The econometric task consists
then in recovering the parameters of a static model of cost regulation under incomplete
information, and testing for the relevance of knowledge spillovers.
Our results show that knowledge spillovers are indeed relevant in the French urban
transport industry. Note that we do not model the regulation decision by the authority,
i.e. we take the regulatory mechanisms as exogenously given to estimate the model’s
parameters.5 Likewise, we leave dynamic considerations out of our framework. In
particular, we do not address the ability of the regulator to commit not to use the infor-
mation on the operator’s cost from one regulatory period to another.6 Here, our aim
is to focus on the knowledge spillovers that arise from the operators’ group structure
within a static framework.
The organization of the paper is as follows: Section 2 describes the regulation of
urban transportation in France in more detail. Section 3 presents the contracts that are
implemented during our period of observation and describes the structure of the dif-
ferent existing industrial groups in the French urban transport industry. Section 4 dis-
cusses the assumptions that are maintained throughout the paper. Section 5 presents
our model of cost regulation which encompasses the main features of urban transporta-
tion and the environment in which network operators make their decisions. Section 6
then develops a formal specification of the cost function to be estimated. Section 7 is
devoted to the construction of the variables and the presentation of our results. Sec-
tion 8 evaluates the cost gains of adding operators to a group and further simulates the
cost gains following a merger between two groups. Section 9 provides a summary and
some concluding remarks.
5See Gagnepain and Ivaldi (2012) for a political model of regulation that incorporates the determi-nants of contract choices.
6These issues are addressed in Gagnepain et al. (forthcoming).
5

2 The French Urban Transportation Industry
As in most countries around the world, urban transportation in France is a regulated
activity. Local transportation networks cover each urban area of significant size, and
for each network, a local authority (a municipality, a group of municipalities or a dis-
trict) is in charge to regulate an operator which has been selected to provide the trans-
portation service. Regulatory rules prevent the presence of several suppliers of trans-
portation services on the same urban network, and each network is therefore operated
by a single operator.
The 1982 Transportation Law was enacted to facilitate decentralized decision-making
on urban transportation and to provide guidelines for regulation. As a result, each lo-
cal authority now organizes its own transportation system by setting route and fare
structures, capacity, quality of service, conditions for subsidizing the service, levels of
investment and ownership nature. The local authority may decide to operate the net-
work directly or to require the services of a transport service provider. In the latter
case, a formal contract defines the regulatory rules that the operator must follow as
well as the payment and/or cost-reimbursement scheme between the authority (the
principal) and the operator (the agent).
In most urban areas, operating costs are on average twice as high as commercial
revenues. Budgets are therefore rarely balanced without subsidies. One reason is that
operators face universal service obligations and must operate in low demand areas.
Low prices are maintained to ensure affordable access to all consumers of public trans-
portation. Moreover, special fares are given to targeted groups like seniors and stu-
dents. Subsidies come from the State’s budget, the local authority’s budget, and a
special tax paid by local firms (employing more than nine full-time workers). They are
not necessarily paid directly to the operator. In addition to the price distortions causing
deficits, informational asymmetries that affect the cost side and lead to inefficiencies
make it more difficult to resume these deficits. We return on these points more in detail
below.
A distinguishing feature of France compared to most other OECD countries is that
about eighty percent of local operators are private and are owned by three large com-
6
panies, two of them being private while the third one is semi-public.7 In 2002, these
companies, with their respective ownership structures and market shares (in terms
of number of networks operated) were Keolis (private, 30%), Transdev (semi-public,
19%), Connex (private, 25%). In addition there are a small private group, Agir, and a
few public firms controlled by local governments. The next section is dedicated to a
more detailed presentation of the structure of these groups.
Our objective is to take these features of the urban transport industry into account
and to perform an analysis of the observed regulatory schemes within a principal-
agent setting. This requires a database that provides information on both the perfor-
mance and the organization of the French urban transport industry. Such a database
was created in the early 1980s from an annual survey conducted by the Centre d’Etude
et de Recherche du Transport Urbain (CERTU, Lyon) with the support of the Groupement
des Autorités Responsables du Transport (GART, Paris), a nationwide trade organization
that gathers most of the local authorities in charge of a urban transport network. In
France, this rich source is a unique tool for comparing observed regulatory schemes
both across year and over time. In our econometric analysis, we consider the regu-
latory scheme adopted in each urban area during a year as a realization of the same
regulatory contract. The sample does not include the largest networks of France, i.e.,
Paris, Lyon and Marseille, as they are not covered by the survey. Overall, the panel
data set covers 87 different urban transport networks over the period 1987-2001.
We now turn to a more detailed description of the contractual relationships and of
the urban transport group structures.
3 Regulatory Contracts and Transport Groups
Two types of regulatory contracts are implemented in the French urban transport in-
dustry, namely fixed-price and cost-plus schemes. Over the period of observation,
fixed-price contracts are employed in 61% of the cases, as shown in table 1. Under
fixed-price contracts, operators receive subsidies to finance the expected operating
deficits, while under cost-plus schemes, subsidies are paid to the local authorities to
finance ex-post deficits. Hence fixed-price regimes are very high-powered incentive
7For an overview of the regulation of urban transportation systems in the different countries of theEuropean Union, the United States and Japan, see IDEI (1999).
7
schemes, while cost-plus regimes do not provide any incentives for cost reduction. For
the same network, the regulatory scheme may switch from cost-plus to fixed-price or
from fixed-price to cost-plus between two contract periods. We indeed count twenty-
three changes of regulatory regimes, eighteen of them being switches from cost-plus to
fixed-price regimes. These changes may occur either during the term of a local author-
ity which decides for a shift in the regulatory framework, or after the election of a new
local government.
As already mentioned, and as shown in table 1, about eighty percent of local trans-
port service operators are owned by three larger industrial groups; Keolis, Connex
and Transdev. Industrial groups of urban transport have a long history of mergers
in France. Keolis was born out of the merger of several companies created in the be-
ginning of the 20th century. The Société des transports automobiles, created in 1908, its
subsidiary (the Société générale des transports départementeaux) and the company Lesexel,
founded in 1911 to help on the development of tramways, merged to form the VIA-GTI
company, mainly focused on urban transport. In the meantime, another company, Car-
iane, was specialized in the French interurban transport. Ultimately, VIA-GTI and Car-
iane merged in 2001 to give birth to Keolis.8 The industrial group Connex was born out
of the merger of the Compagnie Générale Française des Transports et Entreprises (CGFTE)
and the Compagnie Générale d’Entreprises Automobiles (CGEA) in the late 1980’s.9 The
company was ultimately renamed Veolia Transport in 2005. Finally, the Transdev group
was created in 1955. On March 3rd 2011, it merged with Veolia Transport to give birth
to Veolia Transdev.
Table 1 presents figures on the distribution of the operators in our sample according
to their affiliation to one of the three groups and to the type of contract they face. While
61% of all the networks are under a FP regime, this figure amounts to 64.5% when
focusing on the operators belonging to a group and to 48% for independent networks.
Although it seems that belonging to a group is an important determinant of being
regulated under a FP contract, a closer look at the frequency of FP contracts within
groups indicates that this figure comes mainly from the Transdev group, where more
than 90% of the networks it operates are under a FP scheme. The overall proportion
8http://www.keolis.com/en/about-us/key-facts/history.html9The company actually decided to take on the name Connex in 2000. For more details, see
http://www.connex.info/tmpl/ExtensionPage____2778.aspx?epslanguage=ML.
8
of networks operated by firms belonging to one of the three major groups is of 78.6%.
For networks regulated under a FP regime, 83.1% are operated by firms belonging to
a group. For networks under CP contracts, this figure amounts to 71.6%.
For each urban transport network, the automatic renewal of the contract between
the local authority and the operator in place was effectively ended, by law, in 1993.
Since then, local authorities are required to use beauty contests to allocate the construc-
tion and management of infrastructures of urban transportation. In practice, however,
very few networks have experienced changes of operators from one regulatory period
to another. Over the period covered by our analysis, only 5 networks have decided to
get rid of their operators to select another company. Out of these, two changed from
being operated by a firm belonging to a group to a being operated by an independent
firm, while only one network changed from being operated by an independent firm
to being operated by a firm belonging to a group. Finally, only 2 networks saw their
operator change from a firm belonging to a given group to a firm belonging to another
group.
As a matter of fact, the different operators mostly avoided head to head competi-
tion and generally put tenders for markets in distinct urban areas. By committing to
distinct geographical areas, the three main groups succeeded in reducing the degree of
competition in the awarding of transport operations in urban areas where the regula-
tory contract comes to an end. Competitive tendering is therefore not a relevant issue
in this sector, and ex-ante competition is not so fierce. Finally, these groups also op-
erate other municipal services such as water distribution or garbage collection, which
makes it even harder for public authorities to credibly punish operators following bad
performances in the provision of transport services. It follows that group structures
are rather stable both across networks and over time in our sample.
These urban transport industry features constitute the core of our analysis on the
knowledge spillovers among operators belonging to the same group and inspire the
construction of the structural model of regulation that we present below. Before going
to the construction of our economic model, we introduce some assumptions that we
now present in detail.
9
4 Delineating the Scope of the Study
The organization and structure of the urban transportation industry in France as de-
scribed above motivates the following assumptions.
Assumption 1: The network operator has private information about its technology, andthe authority does not observe its effort to improve productivity or to reduce costs.
We assume that the network operator has private information about its innate tech-
nology (adverse selection) and that its cost-reducing effort is non-observable (moral
hazard). Because French local authorities exercise their new powers on transportation
policy since the enactment of the 1982 Law only, and since they usually face serious fi-
nancial difficulties, their limited auditing capacities is recognized among practitioners.
A powerful and well-performed audit system needs effort, time and money. French ex-
perts on urban transportation blame local authorities for being too lax in assessing op-
erating costs, mainly because of a lack of knowledge of the technology.10 The number
of buses required for a specific network, the costs incurred on each route, the fuel con-
sumption of buses (which is highly dependent on drivers’ skills), the drivers’ behavior
toward customers, the effect of traffic congestion on costs, are all aspects for which
operators have much more data and a better understanding than public authorities.
This suggests the presence of adverse selection on innate technology in the first place.
Given the technical complexity of these issues, it should be even harder for the local
authority to assess whether and to what extent operators undertake efforts to provide
appropriate and efficient management. Moral hazard arises quite naturally on top of
the adverse selection problem. When compounded, those informational asymmetries
play a crucial role in the design of contractual arrangements and financial objectives.11
10The French urban transport expert O. Domenach has argued that “the regulator is not able ofdetermining the number of buses which is necessary to run the network. The same comment can bemade regarding the fuel consumption of each bus. The regulators are generally general practitioners in-stead of transport professionals. Hence, the (re)negotiation of contracts between regulators and opera-tors is not fair. See Domenach (1987). A more recent report on the weak capabilities of exper-tise of the local governments and the lack of ex ante competition in the industry is proposedby the French court of auditors (Cour des Comptes) in its 2005 report; for more details seehttp://www.ccomptes.fr/content/download/2454/24573/version/2/file/RapportTransports.pdf.
11Gagnepain and Ivaldi (2002) confirmed through a test that adverse selection and moral hazard aretwo important features of the industry. They showed that a regulatory framework which encompassesthese two ingredients performs well to explain the data.
10
Assumption 2: Regulatory schemes and operators’ efficiency levels are exogenous
According to the new theory of regulation, when contractual relationships are char-
acterized by informational asymmetries, a welfare-maximizing regulator applies the
revelation principle to provide the operator with incentives to reveal its true efficiency
level. This mechanism can be decentralized through a menu of linear contracts and
avoids leaving excessive rents. Each operator facing such a menu chooses the con-
tract that corresponds to his own efficiency level. In this context, the most efficient
firm chooses the highest-powered incentive scheme, i.e. a fixed-price contract, while
the most inefficient firm chooses the lowest-powered incentive scheme, i.e. a cost-plus
contract. Between these two extremes are incentive schemes chosen by firms with in-
termediate efficiency levels (Laffont and Tirole, 1993).
Does this framework apply to the French urban transport industry? If it did, fixed-
price and cost-plus contracts would be extreme cases of a menu and would be chosen
by the most efficient and the most inefficient firms, respectively. Since current rules ap-
ply to any companies (even the ones with intermediate efficiency levels) and since the
real world cannot be confined to fully efficient or inefficient firms, one must conclude
a priori that observed contracts do not include any revelation principle, and cost-plus
and fixed-price schemes are equally proposed to operators without paying any atten-
tion to their efficiency level. It is therefore realistic to assume that regulatory schemes
are not driven by the intrinsic characteristics and efficiency levels of large service com-
panies and of network operators.
Assumption 3: An operators belonging to an industrial group benefits from the costreducing activities of the remaining operators of the group.
In each network, the existence of inefficiencies may lead to higher operating costs than
the levels defined by the cost frontier. Firms can, however, undertake cost-reducing
activities to overcome these inefficiencies. They can, for instance, engage in process
research and development, or managers can spend time and effort in improving the
location of inputs within the network. They can as well attempt to find cheaper suppli-
ers, bargain better procurement contracts, subcontract non-essential activities, monitor
employees, or solve potential labor conflicts.
We assume that operators belonging to one of the groups presented above (i.e. Ke-
11
olis, Transdev or Connex) will be affected by actions taken in other networks operated
by another member of the same group. In each network, the group has a local manager
(or team of managers) who takes care of running the network and has decision rights
on the effort to be exerted in order to decrease operating costs. Given this decision-
making configuration, we expect actions related to cost-reducing activities taken in
a specific network to generate a positive externality on the operating costs of the re-
maining operators of the group. The main idea is that knowledge generated in a given
location can be processed by the group’s headquarters and later be transmitted and
used in another network operated by the group. For instance, the results of process
R&D obtained in one location can spill-over to another operator through the group’s
headquarters. This operator would therefore benefit from (part of) this R&D without
investing as much effort as it would have to if it were independent. Similarly, the effort
incurred to find a cheaper supplier in one network may reduce the need to look for a
cheaper supplier in another city. The bargaining of procurement contracts may also be
easier if the operator belongs to a group with relevant experience in other networks.
Likewise, methods to efficiently monitor employees could also be learned in a given
place and transmitted to another. In that sense, a network belonging to a group will
benefit from positive externalities coming from the effort exerted in all the remaining
networks of the group. To reflect the fact that these spillovers could be related to a
large array of know-how generated by the firm, ranging from technological to organi-
zational, we refer to them as knowledge spillovers.
We propose to estimate a structural cost function that accounts for the regulatory
scheme faced by the operator as well as for the structure of the group it belongs to, if
any. This allows us to test for the relevance of knowledge spillovers among operators
in the French urban transport industry.12
We now turn to the construction of our structural model of regulation.
12Three additional remarks should be made. First, private information on demand is not a relevantissue in our industry. Local governments are well informed about the transportation needs of citizens.The number of trips performed over a certain period is easily observed, and the regulator has a veryprecise idea of how the socio-demographic characteristics of a urban area fluctuate over time. Giventhe level of demand, the regulator sets the service capacity provided by the operator. Second, we donot address the issue of determining what should be the optimal rate-of-return on capital. The rollingstock is owned by the local government for a vast majority of networks. In this case, the regulator isresponsible for renewing the vehicles, as well as guaranteeing a certain level of capital quality. Finally,we rule out the possibility of risk sharing in the contractual relationships between the operators and theregulators since the provision of transport services does not entail unpredictable cost fluctuations forthe operators.
12
5 The Economic Model
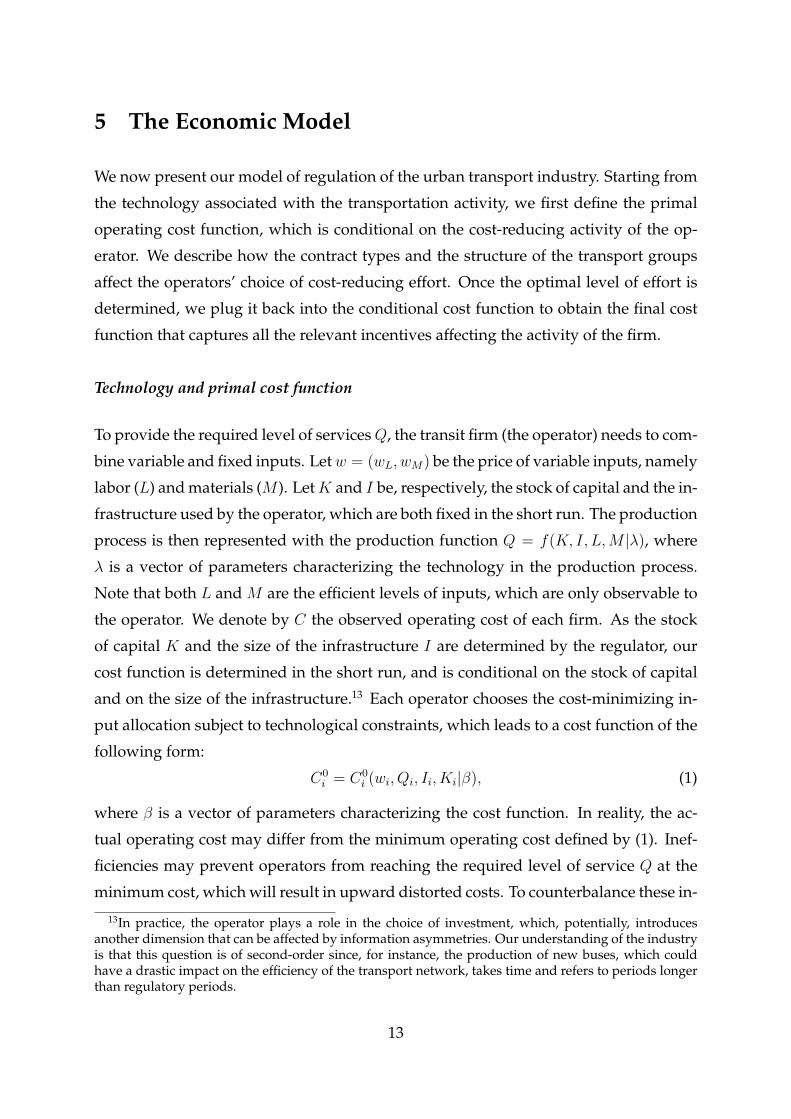
We now present our model of regulation of the urban transport industry. Starting from
the technology associated with the transportation activity, we first define the primal
operating cost function, which is conditional on the cost-reducing activity of the op-
erator. We describe how the contract types and the structure of the transport groups
affect the operators’ choice of cost-reducing effort. Once the optimal level of effort is
determined, we plug it back into the conditional cost function to obtain the final cost
function that captures all the relevant incentives affecting the activity of the firm.
Technology and primal cost function
To provide the required level of servicesQ, the transit firm (the operator) needs to com-
bine variable and fixed inputs. Letw = (wL, wM) be the price of variable inputs, namely
labor (L) and materials (M ). LetK and I be, respectively, the stock of capital and the in-
frastructure used by the operator, which are both fixed in the short run. The production
process is then represented with the production function Q = f(K, I, L,M |λ), where
λ is a vector of parameters characterizing the technology in the production process.
Note that both L and M are the efficient levels of inputs, which are only observable to
the operator. We denote by C the observed operating cost of each firm. As the stock
of capital K and the size of the infrastructure I are determined by the regulator, our
cost function is determined in the short run, and is conditional on the stock of capital
and on the size of the infrastructure.13 Each operator chooses the cost-minimizing in-
put allocation subject to technological constraints, which leads to a cost function of the
following form:
C0i = C0
i (wi, Qi, Ii, Ki|β), (1)
where β is a vector of parameters characterizing the cost function. In reality, the ac-
tual operating cost may differ from the minimum operating cost defined by (1). Inef-
ficiencies may prevent operators from reaching the required level of service Q at the
minimum cost, which will result in upward distorted costs. To counterbalance these in-
13In practice, the operator plays a role in the choice of investment, which, potentially, introducesanother dimension that can be affected by information asymmetries. Our understanding of the industryis that this question is of second-order since, for instance, the production of new buses, which couldhave a drastic impact on the efficiency of the transport network, takes time and refers to periods longerthan regulatory periods.
13

efficiencies however, firms can undertake cost-reducing activities. They can engage in
process research and development, or managers can spend time and effort in improv-
ing the location of inputs within the network. They can as well attempt to find cheaper
suppliers, bargain better procurement contracts, subcontract non-essential activities,
monitor employees, or solve potential labor conflicts. Whatever these cost-reducing
activities may be, we will refer to them as effort.
A distinguishing feature of the French urban transport system is that about 80% of
local operators are private and are owned by three large industrial groups. In 2002,
these companies, with their respective market shares (in terms of number of networks
operated) were Keolis (30%), Transdev (19%) and Connex (25%). Hence a given firm i
operating a specific network can be either independent or belong to one of these larger
companies. Each of these industrial groups g = {Keolis, T ransdev, Connex} operates
a set of urban networks Ng = {1, . . . , ng}. While production inputs are exclusively
network specific, we assume the inefficiencies to affect all the ng networks of a given
group g. Likewise, we expect the cost-reducing efforts exerted in a given network to
affect the operating cost of other firms belonging to the same industrial group. These
knowledge spillovers are, however, not present for an independent network. We return
to these points more in detail below.
Denote by θg the intrinsic inefficiency level of each of the ng networks of group
g, and let θ be the intrinsic inefficiency level of an independent network. We denote
the effort level of firm i belonging to group g by eig, and let e−ig denote the effort
of the remaining networks belonging to the same group. Let ei be the effort level of
an independent network i. Note that both the inefficiency and the effort levels are
unobservable to the regulator and to the econometrician. Each operator therefore faces
a cost function which provides the frontier of minimum operating costs conditional on
the levels of capital, infrastructure, inefficiency, effort and group structure. Specifically,
operator i faces a cost function of the form:
Ci(C0i , θ, e|β) =
C0i × φ (θ, ei) if i is independent
C0i × φ (θg, eig, κige−ig) if i ∈ Ng,
(2)
where φ (θ, e) is a continuous function that is increasing in θ and decreasing in e.
κig is a parameter measuring the knowledge spillovers obtained by operator i for be-
14
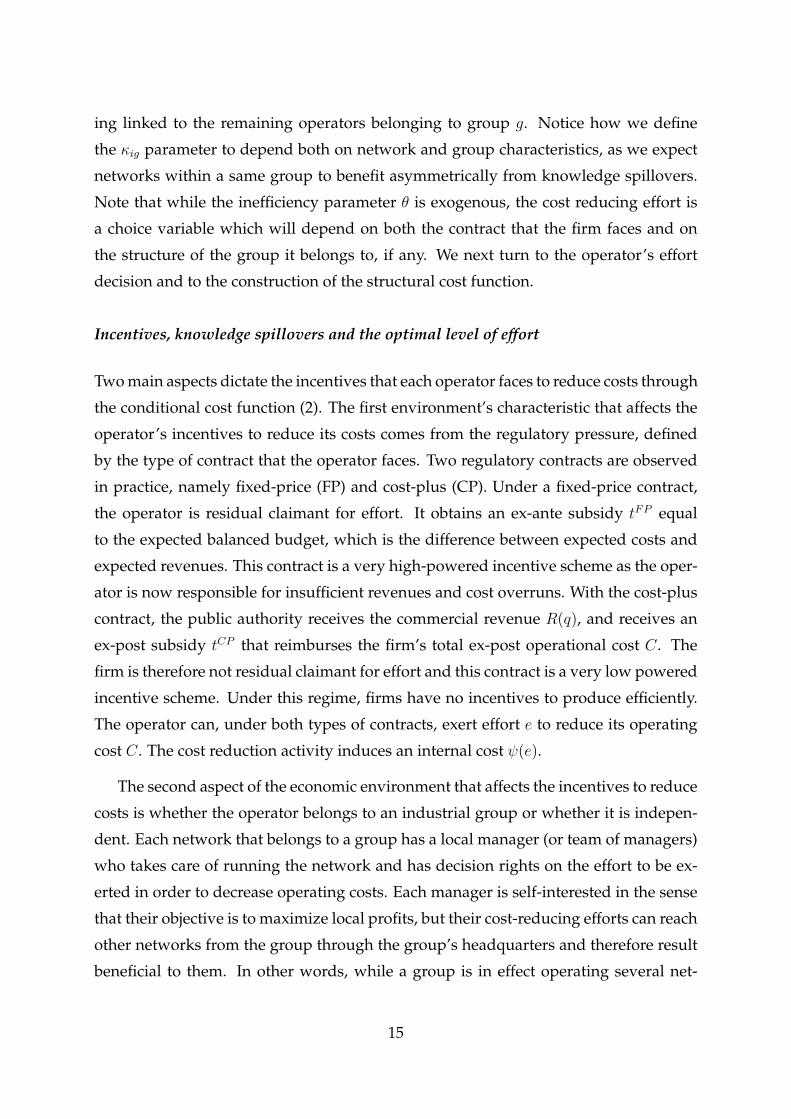
ing linked to the remaining operators belonging to group g. Notice how we define
the κig parameter to depend both on network and group characteristics, as we expect
networks within a same group to benefit asymmetrically from knowledge spillovers.
Note that while the inefficiency parameter θ is exogenous, the cost reducing effort is
a choice variable which will depend on both the contract that the firm faces and on
the structure of the group it belongs to, if any. We next turn to the operator’s effort
decision and to the construction of the structural cost function.
Incentives, knowledge spillovers and the optimal level of effort
Two main aspects dictate the incentives that each operator faces to reduce costs through
the conditional cost function (2). The first environment’s characteristic that affects the
operator’s incentives to reduce its costs comes from the regulatory pressure, defined
by the type of contract that the operator faces. Two regulatory contracts are observed
in practice, namely fixed-price (FP) and cost-plus (CP). Under a fixed-price contract,
the operator is residual claimant for effort. It obtains an ex-ante subsidy tFP equal
to the expected balanced budget, which is the difference between expected costs and
expected revenues. This contract is a very high-powered incentive scheme as the oper-
ator is now responsible for insufficient revenues and cost overruns. With the cost-plus
contract, the public authority receives the commercial revenue R(q), and receives an
ex-post subsidy tCP that reimburses the firm’s total ex-post operational cost C. The
firm is therefore not residual claimant for effort and this contract is a very low powered
incentive scheme. Under this regime, firms have no incentives to produce efficiently.
The operator can, under both types of contracts, exert effort e to reduce its operating
cost C. The cost reduction activity induces an internal cost ψ(e).
The second aspect of the economic environment that affects the incentives to reduce
costs is whether the operator belongs to an industrial group or whether it is indepen-
dent. Each network that belongs to a group has a local manager (or team of managers)
who takes care of running the network and has decision rights on the effort to be ex-
erted in order to decrease operating costs. Each manager is self-interested in the sense
that their objective is to maximize local profits, but their cost-reducing efforts can reach
other networks from the group through the group’s headquarters and therefore result
beneficial to them. In other words, while a group is in effect operating several net-
15
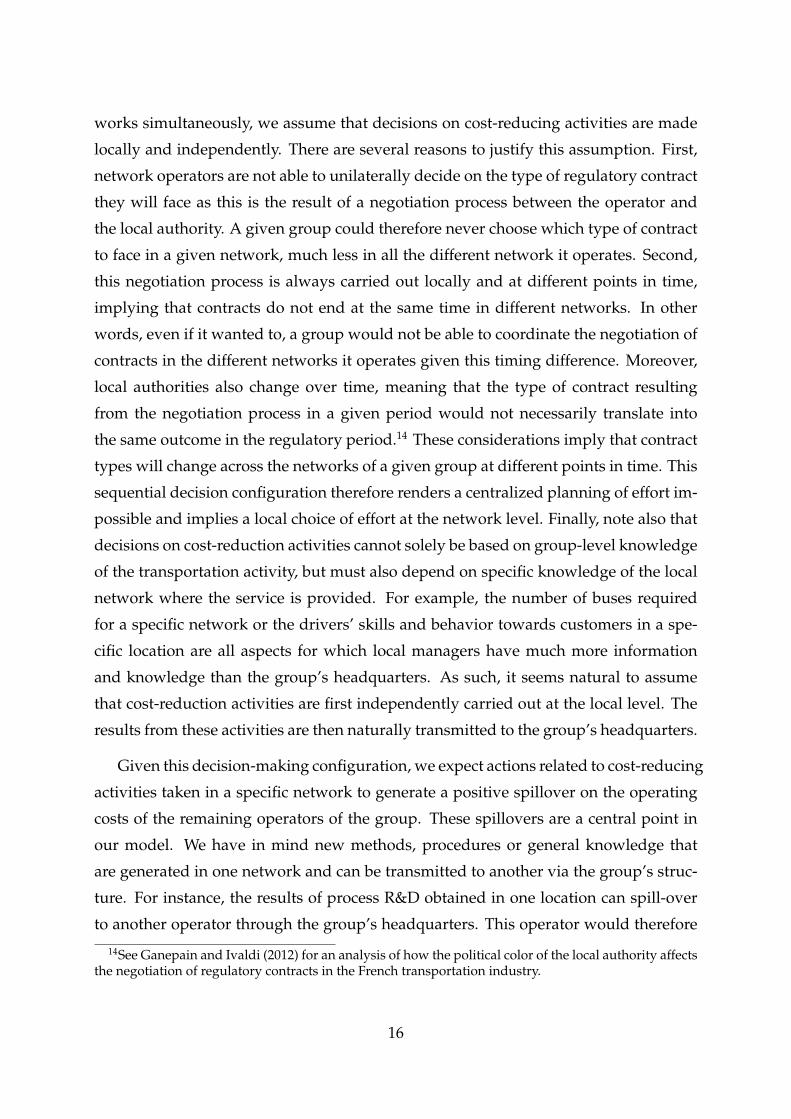
works simultaneously, we assume that decisions on cost-reducing activities are made
locally and independently. There are several reasons to justify this assumption. First,
network operators are not able to unilaterally decide on the type of regulatory contract
they will face as this is the result of a negotiation process between the operator and
the local authority. A given group could therefore never choose which type of contract
to face in a given network, much less in all the different network it operates. Second,
this negotiation process is always carried out locally and at different points in time,
implying that contracts do not end at the same time in different networks. In other
words, even if it wanted to, a group would not be able to coordinate the negotiation of
contracts in the different networks it operates given this timing difference. Moreover,
local authorities also change over time, meaning that the type of contract resulting
from the negotiation process in a given period would not necessarily translate into
the same outcome in the regulatory period.14 These considerations imply that contract
types will change across the networks of a given group at different points in time. This
sequential decision configuration therefore renders a centralized planning of effort im-
possible and implies a local choice of effort at the network level. Finally, note also that
decisions on cost-reduction activities cannot solely be based on group-level knowledge
of the transportation activity, but must also depend on specific knowledge of the local
network where the service is provided. For example, the number of buses required
for a specific network or the drivers’ skills and behavior towards customers in a spe-
cific location are all aspects for which local managers have much more information
and knowledge than the group’s headquarters. As such, it seems natural to assume
that cost-reduction activities are first independently carried out at the local level. The
results from these activities are then naturally transmitted to the group’s headquarters.
Given this decision-making configuration, we expect actions related to cost-reducing
activities taken in a specific network to generate a positive spillover on the operating
costs of the remaining operators of the group. These spillovers are a central point in
our model. We have in mind new methods, procedures or general knowledge that
are generated in one network and can be transmitted to another via the group’s struc-
ture. For instance, the results of process R&D obtained in one location can spill-over
to another operator through the group’s headquarters. This operator would therefore
14See Ganepain and Ivaldi (2012) for an analysis of how the political color of the local authority affectsthe negotiation of regulatory contracts in the French transportation industry.
16
benefit from (part of) this R&D without investing as much effort as it would have to
if it were independent. Similarly, the effort incurred to find a cheaper supplier in one
network may reduce the need to look for a cheaper supplier in another city. The bar-
gaining of procurement contracts may also be easier if the operator belongs to a group
with relevant experience in other networks. Likewise, methods to efficiently monitor
employees could also be learned in a given place and transmitted to another. Note,
however, that the knowledge generated in a given location may not necessarily be
perfectly transferable or applicable to another network of the group. In particular, its
application and use in other locations will depend on specific network characteristics
and capabilities (such as input and/or network structure).
While the necessary amount of effort to reduce inefficiencies is affected by the group
structure a firm belongs to, we assume that it is still expensive to exert a given amount
of effort. In other words, we assume that the marginal cost of effort is not affected by
the group structure. For a given firm that belongs to group, this means that while the
efforts exerted in the remaining networks will affect its operational costs, the function
ψ(e) will only depend on its own effort. These network effects are not present for an
independent network and its effort level will therefore only depend on the type of
contract it faces.
We now explicitly take into account these incentives through the cost function (1)
that is conditional on inefficiency θ and the effort level e. We first derive the optimal
level of effort for each operator and check how this effort depends on the incentives
mentioned above. Second, we plug back this equilibrium level of effort into the condi-
tional cost function. This will lead us to an unconditional structural cost function that
can be estimated. Accounting for these changes in incentives through the cost structure
enables us to reduce the source of misspecification and avoid biases in the estimation
of the technological parameters.
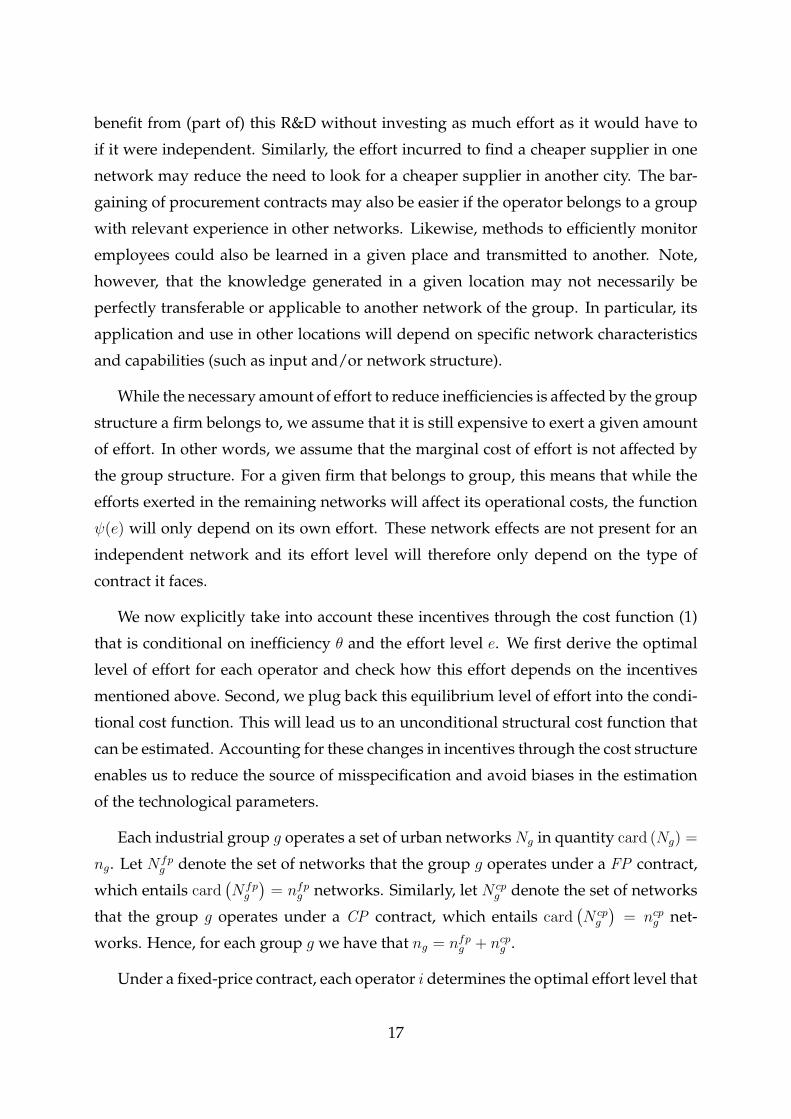
Each industrial group g operates a set of urban networks Ng in quantity card (Ng) =
ng. Let N fpg denote the set of networks that the group g operates under a FP contract,
which entails card(N fpg
)= nfpg networks. Similarly, let N cp
g denote the set of networks
that the group g operates under a CP contract, which entails card(N cpg
)= ncpg net-
works. Hence, for each group g we have that ng = nfpg + ncpg .
Under a fixed-price contract, each operator i determines the optimal effort level that
17
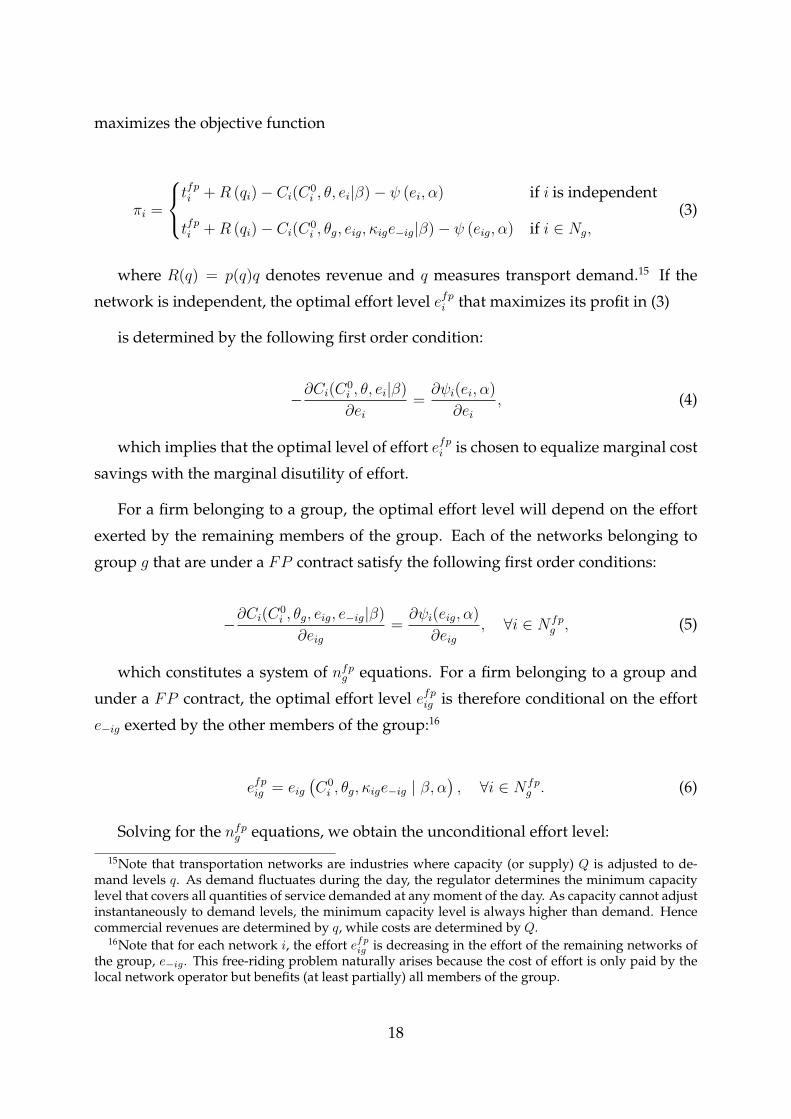
maximizes the objective function
πi =
tfpi +R (qi)− Ci(C0
i , θ, ei|β)− ψ (ei, α) if i is independent
tfpi +R (qi)− Ci(C0i , θg, eig, κige−ig|β)− ψ (eig, α) if i ∈ Ng,
(3)
where R(q) = p(q)q denotes revenue and q measures transport demand.15 If the
network is independent, the optimal effort level efpi that maximizes its profit in (3)
is determined by the following first order condition:
−∂Ci(C0i , θ, ei|β)
∂ei=∂ψi(ei, α)
∂ei, (4)
which implies that the optimal level of effort efpi is chosen to equalize marginal cost
savings with the marginal disutility of effort.
For a firm belonging to a group, the optimal effort level will depend on the effort
exerted by the remaining members of the group. Each of the networks belonging to
group g that are under a FP contract satisfy the following first order conditions:
−∂Ci(C0i , θg, eig, e−ig|β)
∂eig=∂ψi(eig, α)
∂eig, ∀i ∈ N fp
g , (5)
which constitutes a system of nfpg equations. For a firm belonging to a group and
under a FP contract, the optimal effort level efpig is therefore conditional on the effort
e−ig exerted by the other members of the group:16
efpig = eig(C0i , θg, κige−ig | β, α
), ∀i ∈ N fp
g . (6)
Solving for the nfpg equations, we obtain the unconditional effort level:
15Note that transportation networks are industries where capacity (or supply) Q is adjusted to de-mand levels q. As demand fluctuates during the day, the regulator determines the minimum capacitylevel that covers all quantities of service demanded at any moment of the day. As capacity cannot adjustinstantaneously to demand levels, the minimum capacity level is always higher than demand. Hencecommercial revenues are determined by q, while costs are determined by Q.
16Note that for each network i, the effort efpig is decreasing in the effort of the remaining networks ofthe group, e−ig . This free-riding problem naturally arises because the cost of effort is only paid by thelocal network operator but benefits (at least partially) all members of the group.
18
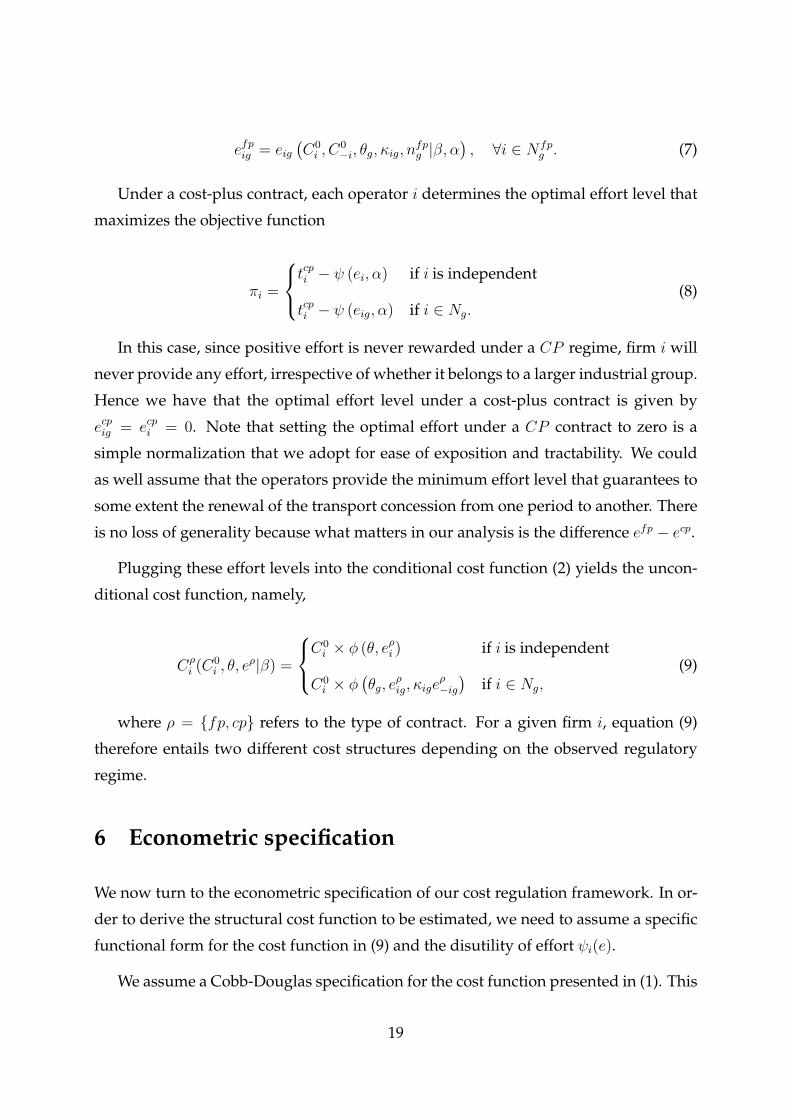
efpig = eig(C0i , C
0−i, θg, κig, n
fpg |β, α
), ∀i ∈ N fp
g . (7)
Under a cost-plus contract, each operator i determines the optimal effort level that
maximizes the objective function
πi =
tcpi − ψ (ei, α) if i is independent
tcpi − ψ (eig, α) if i ∈ Ng.(8)
In this case, since positive effort is never rewarded under a CP regime, firm i will
never provide any effort, irrespective of whether it belongs to a larger industrial group.
Hence we have that the optimal effort level under a cost-plus contract is given by
ecpig = ecpi = 0. Note that setting the optimal effort under a CP contract to zero is a
simple normalization that we adopt for ease of exposition and tractability. We could
as well assume that the operators provide the minimum effort level that guarantees to
some extent the renewal of the transport concession from one period to another. There
is no loss of generality because what matters in our analysis is the difference efp − ecp.
Plugging these effort levels into the conditional cost function (2) yields the uncon-
ditional cost function, namely,
Cρi (C0
i , θ, eρ|β) =
C0i × φ (θ, eρi ) if i is independent
C0i × φ
(θg, e
ρig, κige
ρ−ig)
if i ∈ Ng,(9)
where ρ = {fp, cp} refers to the type of contract. For a given firm i, equation (9)
therefore entails two different cost structures depending on the observed regulatory
regime.
6 Econometric specification
We now turn to the econometric specification of our cost regulation framework. In or-
der to derive the structural cost function to be estimated, we need to assume a specific
functional form for the cost function in (9) and the disutility of effort ψi(e).
We assume a Cobb-Douglas specification for the cost function presented in (1). This
19
specification retains the main properties desirable for a cost function while remaining
tractable. Alternative more flexible specifications such as the translog function lead to
cumbersome computations of the first order conditions when effort is unobservable.
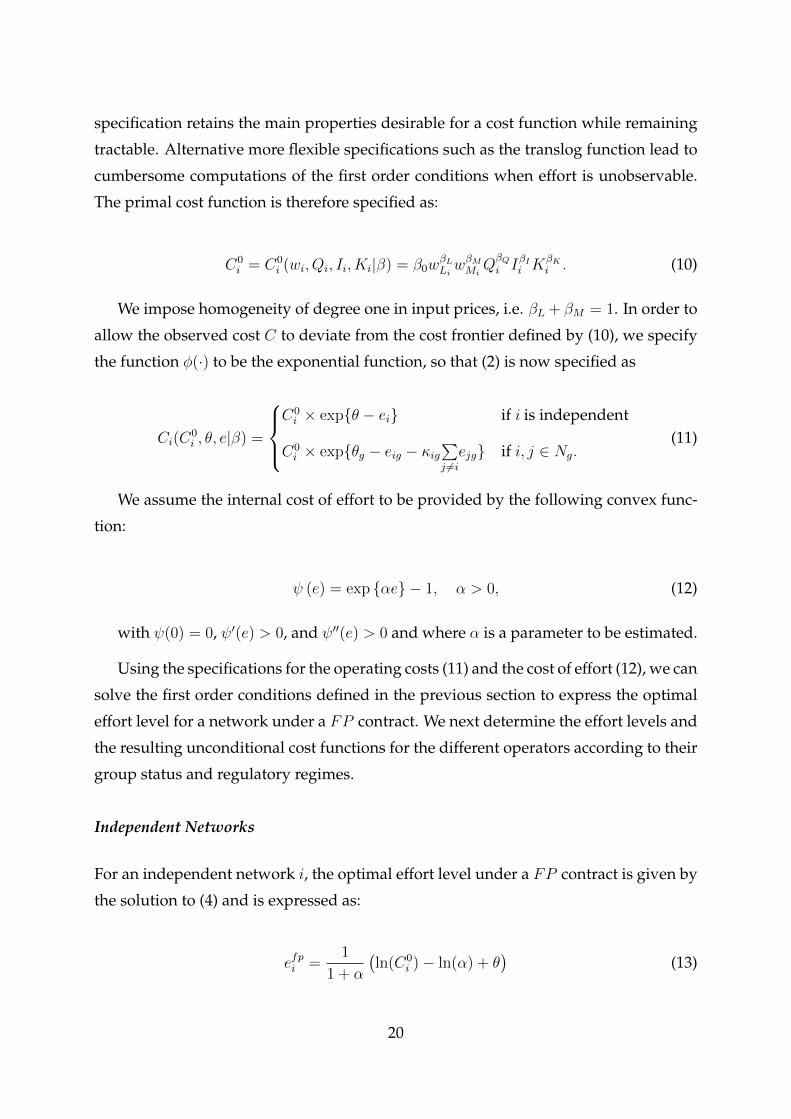
The primal cost function is therefore specified as:
C0i = C0
i (wi, Qi, Ii, Ki|β) = β0wβLLiwβMMi
QβQi IβIi K
βKi . (10)
We impose homogeneity of degree one in input prices, i.e. βL + βM = 1. In order to
allow the observed cost C to deviate from the cost frontier defined by (10), we specify
the function φ(·) to be the exponential function, so that (2) is now specified as
Ci(C0i , θ, e|β) =
C0i × exp{θ − ei} if i is independent
C0i × exp{θg − eig − κig
∑j 6=iejg} if i, j ∈ Ng.
(11)
We assume the internal cost of effort to be provided by the following convex func-
tion:
ψ (e) = exp {αe} − 1, α > 0, (12)
with ψ(0) = 0, ψ′(e) > 0, and ψ′′(e) > 0 and where α is a parameter to be estimated.
Using the specifications for the operating costs (11) and the cost of effort (12), we can
solve the first order conditions defined in the previous section to express the optimal
effort level for a network under a FP contract. We next determine the effort levels and
the resulting unconditional cost functions for the different operators according to their
group status and regulatory regimes.
Independent Networks
For an independent network i, the optimal effort level under a FP contract is given by
the solution to (4) and is expressed as:
efpi =1
1 + α
(ln(C0
i )− ln(α) + θ)
(13)
20
Recalling that ecpi = 0 and substituting back ecpi and efpi into (11) allows us to obtain
the final forms for the cost functions Ccpi (·) and Cfp
i (·) to be estimated for independent
networks as:
ln(Cfpi ) =
α
1 + α
[ln(C0
i ) + θ]
+1
1 + αln(α) (14)
and
ln(Ccpi ) = ln(C0
i ) + θ. (15)
Note that equation (14) corresponds to the expression of the Cobb-Douglas cost
function which is usually estimated, i.e. when moral hazard in the form of presence of
an effort activity is not taken into account. Note also that limα→+∞
ln(Cfpi ) = ln(Ccp
i ), since
the effort level under a FP contract converges to 0 when the cost-reducing technology
parameter α becomes infinitely large. This also translates into a lower effect of the
inefficiency θ on the final costs of operator i when the cost of exerting effort is lower.
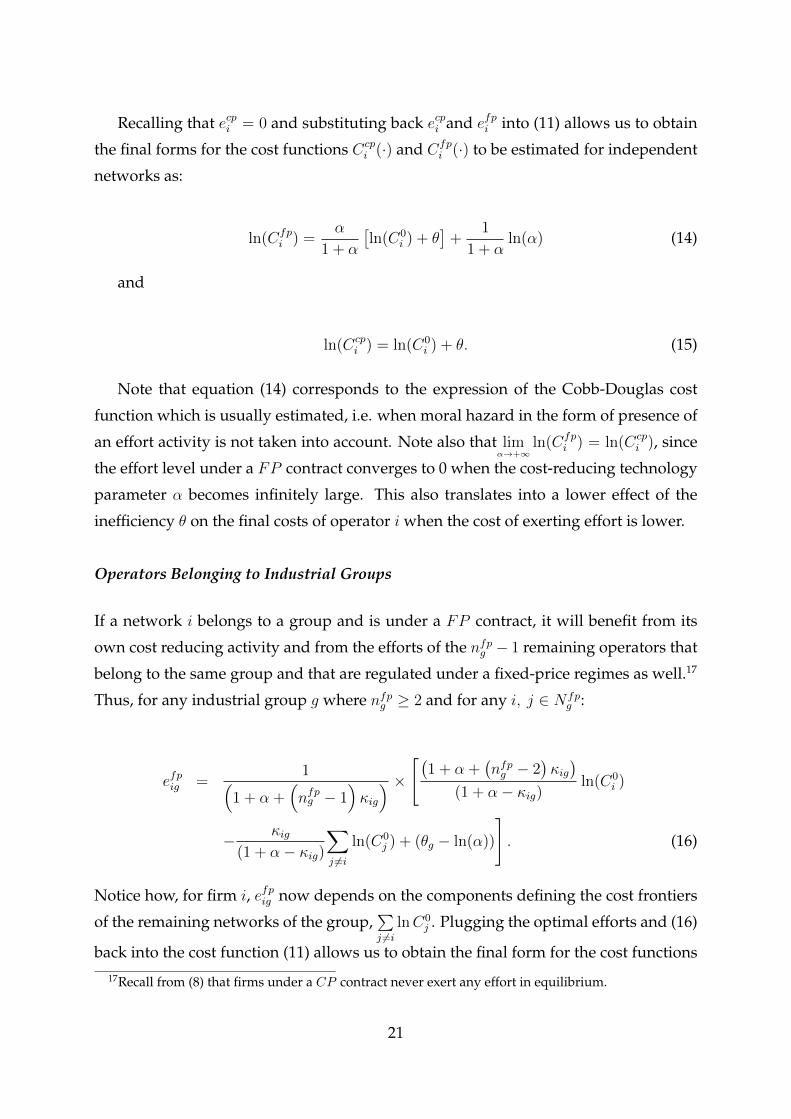
Operators Belonging to Industrial Groups
If a network i belongs to a group and is under a FP contract, it will benefit from its
own cost reducing activity and from the efforts of the nfpg − 1 remaining operators that
belong to the same group and that are regulated under a fixed-price regimes as well.17
Thus, for any industrial group g where nfpg ≥ 2 and for any i, j ∈ N fpg :
efpig =1(
1 + α +(nfpg − 1
)κig
) × [(1 + α +(nfpg − 2
)κig)
(1 + α− κig)ln(C0
i )
− κig(1 + α− κig)
∑j 6=i
ln(C0j ) + (θg − ln(α))
]. (16)
Notice how, for firm i, efpig now depends on the components defining the cost frontiers
of the remaining networks of the group,∑j 6=i
lnC0j . Plugging the optimal efforts and (16)
back into the cost function (11) allows us to obtain the final form for the cost functions17Recall from (8) that firms under a CP contract never exert any effort in equilibrium.
21
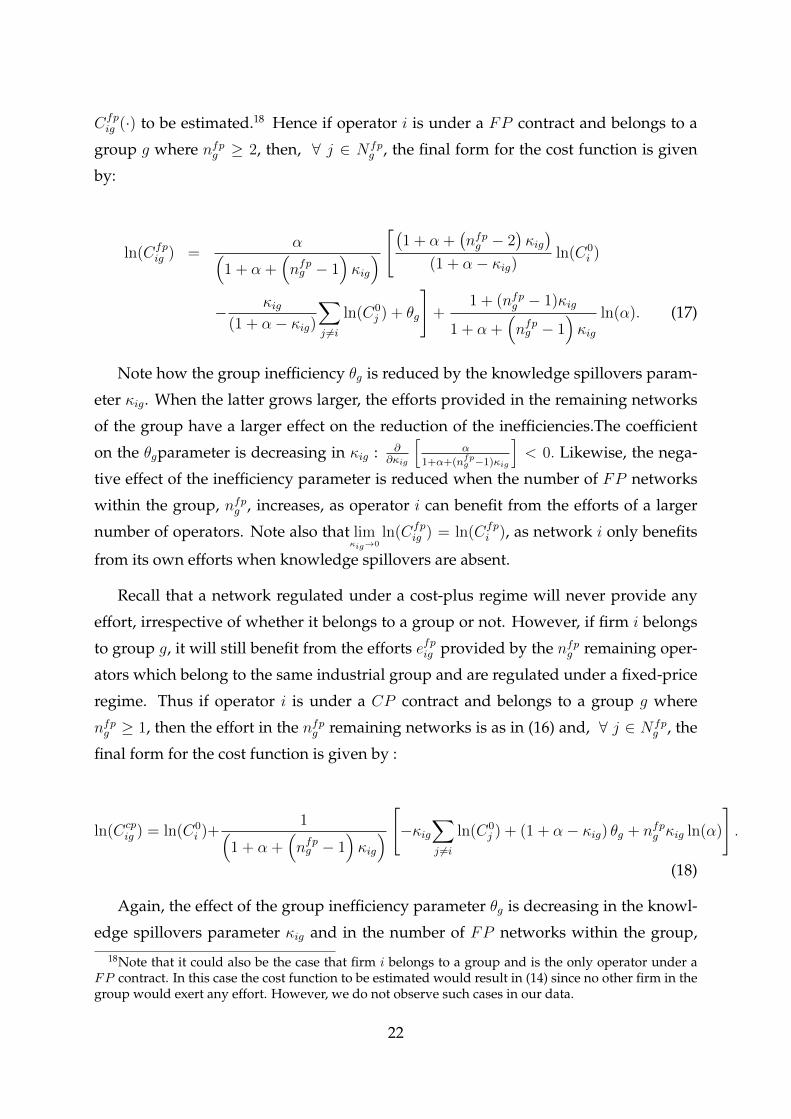
Cfpig (·) to be estimated.18 Hence if operator i is under a FP contract and belongs to a
group g where nfpg ≥ 2, then, ∀ j ∈ N fpg , the final form for the cost function is given
by:
ln(Cfpig ) =
α(1 + α +
(nfpg − 1
)κig
) [(1 + α +(nfpg − 2
)κig)
(1 + α− κig)ln(C0
i )
− κig(1 + α− κig)
∑j 6=i
ln(C0j ) + θg
]+
1 + (nfpg − 1)κig
1 + α +(nfpg − 1
)κig
ln(α). (17)
Note how the group inefficiency θg is reduced by the knowledge spillovers param-
eter κig. When the latter grows larger, the efforts provided in the remaining networks
of the group have a larger effect on the reduction of the inefficiencies.The coefficient
on the θgparameter is decreasing in κig : ∂∂κig
[α
1+α+(nfpg −1)κig
]< 0. Likewise, the nega-
tive effect of the inefficiency parameter is reduced when the number of FP networks
within the group, nfpg , increases, as operator i can benefit from the efforts of a larger
number of operators. Note also that limκig→0
ln(Cfpig ) = ln(Cfp
i ), as network i only benefits
from its own efforts when knowledge spillovers are absent.
Recall that a network regulated under a cost-plus regime will never provide any
effort, irrespective of whether it belongs to a group or not. However, if firm i belongs
to group g, it will still benefit from the efforts efpig provided by the nfpg remaining oper-
ators which belong to the same industrial group and are regulated under a fixed-price
regime. Thus if operator i is under a CP contract and belongs to a group g where
nfpg ≥ 1, then the effort in the nfpg remaining networks is as in (16) and, ∀ j ∈ N fpg , the
final form for the cost function is given by :
ln(Ccpig ) = ln(C0
i )+1(
1 + α +(nfpg − 1
)κig
) [−κig∑j 6=i
ln(C0j ) + (1 + α− κig) θg + nfpg κig ln(α)
].
(18)
Again, the effect of the group inefficiency parameter θg is decreasing in the knowl-
edge spillovers parameter κig and in the number of FP networks within the group,18Note that it could also be the case that firm i belongs to a group and is the only operator under a
FP contract. In this case the cost function to be estimated would result in (14) since no other firm in thegroup would exert any effort. However, we do not observe such cases in our data.
22
nfpg .
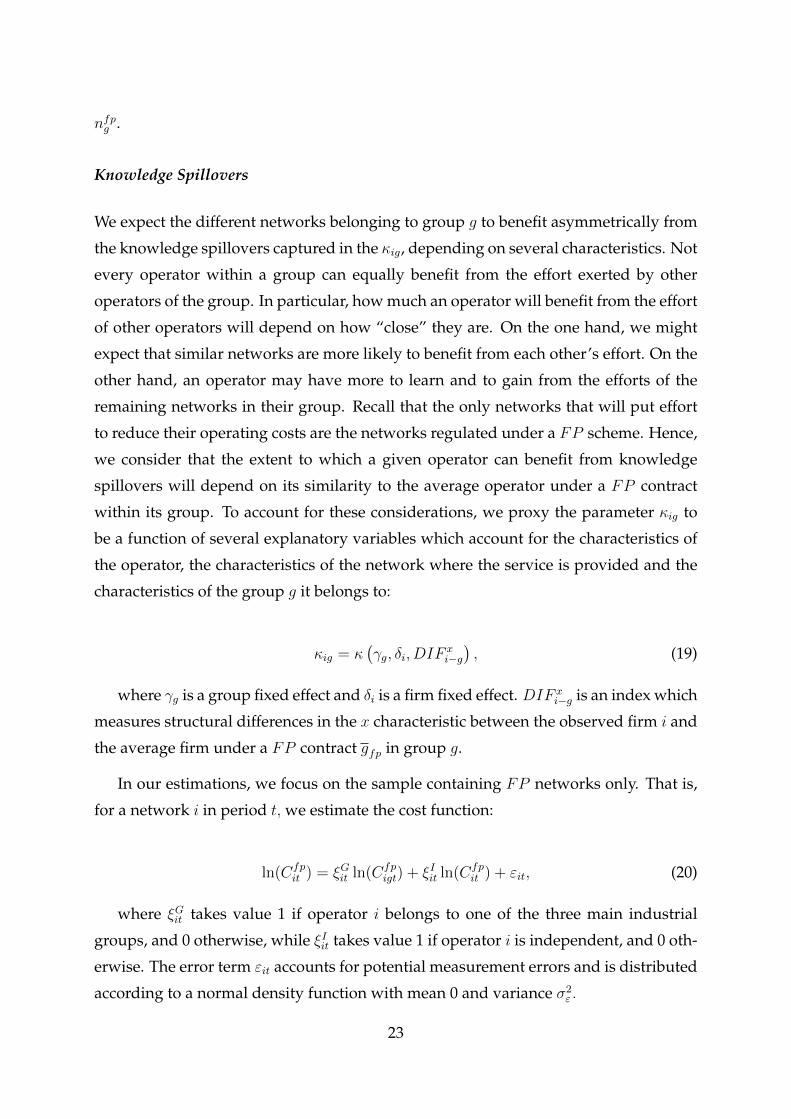
Knowledge Spillovers
We expect the different networks belonging to group g to benefit asymmetrically from
the knowledge spillovers captured in the κig, depending on several characteristics. Not
every operator within a group can equally benefit from the effort exerted by other
operators of the group. In particular, how much an operator will benefit from the effort
of other operators will depend on how “close” they are. On the one hand, we might
expect that similar networks are more likely to benefit from each other’s effort. On the
other hand, an operator may have more to learn and to gain from the efforts of the
remaining networks in their group. Recall that the only networks that will put effort
to reduce their operating costs are the networks regulated under a FP scheme. Hence,
we consider that the extent to which a given operator can benefit from knowledge
spillovers will depend on its similarity to the average operator under a FP contract
within its group. To account for these considerations, we proxy the parameter κig to
be a function of several explanatory variables which account for the characteristics of
the operator, the characteristics of the network where the service is provided and the
characteristics of the group g it belongs to:
κig = κ(γg, δi, DIF
xi−g), (19)
where γg is a group fixed effect and δi is a firm fixed effect. DIF xi−g is an index which
measures structural differences in the x characteristic between the observed firm i and
the average firm under a FP contract gfp in group g.
In our estimations, we focus on the sample containing FP networks only. That is,
for a network i in period t, we estimate the cost function:
ln(Cfpit ) = ξGit ln(Cfp
igt) + ξIit ln(Cfpit ) + εit, (20)
where ξGit takes value 1 if operator i belongs to one of the three main industrial
groups, and 0 otherwise, while ξIit takes value 1 if operator i is independent, and 0 oth-
erwise. The error term εit accounts for potential measurement errors and is distributed
according to a normal density function with mean 0 and variance σ2ε .
23
7 Data and Empirical Results
We present the estimation results of our model which are obtained by estimating the
structural cost function (20) by maximum likelihood. We first comment the construc-
tion of the variables that enter the model.
7.1 Data and Variables
Different types of variables are required in order to identify our model. The cost equa-
tion calls for covariates that capture elements of the economic environment. Concern-
ing the knowledge spillovers, we need variables that capture both group-specific and
network-specific characteristics. Summary statistics are given in table 2, where we dis-
tinguish operators according to their group affiliation.
Estimating the Cobb-Douglas cost function requires information on the level of op-
erating costs, the quantity of output, capital, and the input prices. Total costs C are
defined as the sum of labor and material costs. Output Q is measured by the number
of seatkilometers, i.e., the number of seats available in all components of rolling stock
times the total number of kilometers traveled on all routes. In other words, this mea-
sure accounts for the length of the network, the frequency of the service and the size
of the fleet. Note that this is also a measure of the quality of service. Capital K, which
plays the role of a fixed input in our short-run cost function, is measured by the size of
the rolling stock, which is the total number of seats available. Infrastructure I , which
also plays the role of a fixed input, is measured by the total length of the transport
network in kilometers. Since the authority owns the capital, the operators do not incur
capital costs. The average wage rate wl is obtained by dividing total labor costs by the
annual number of employees. The price of materials wm has been constructed as the
average fuel price for France (published by OECD).
Estimating the knowledge spillovers requires observations on the characteristics of
the operators, as well as on the features of the networks in which they operate and of
the group they belong to, if any. We construct a dummy variable for each specific net-
work and another dummy for each one of the three industrial groups (Connex, Keolis
and Transdev). In order to take into account for the fact that different operators from
the same group may benefit asymmetrically from knowledge spillovers, we construct
24
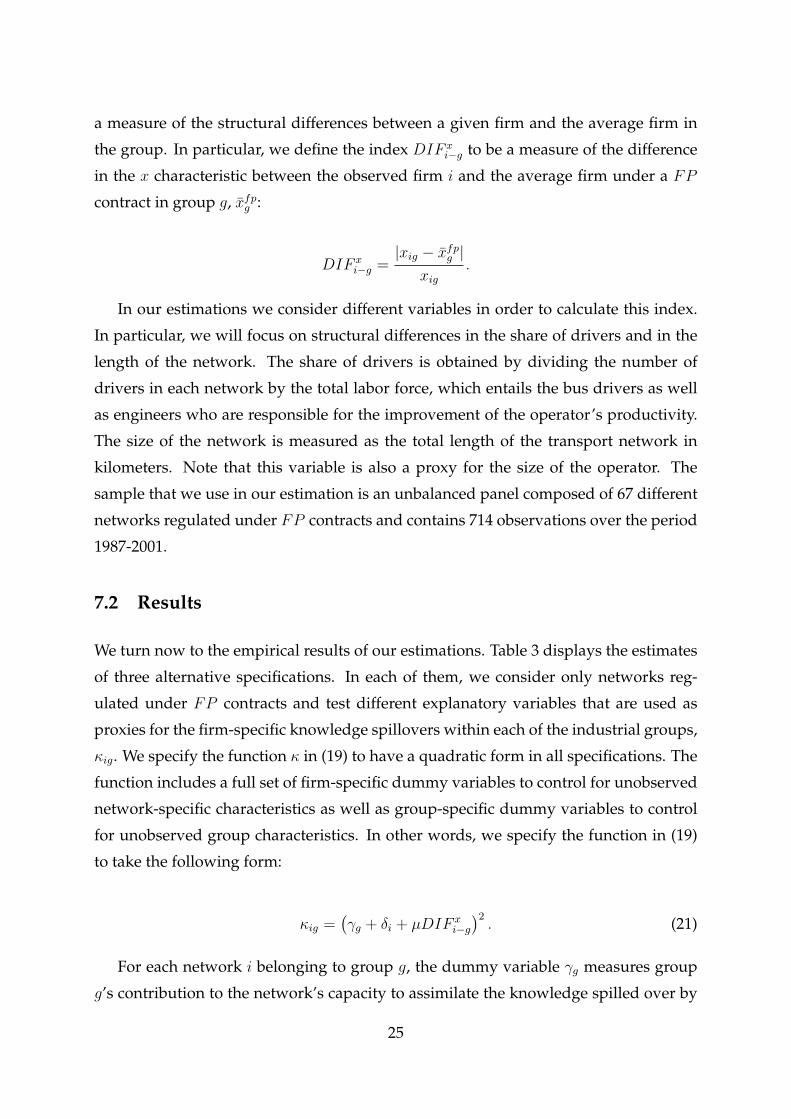
a measure of the structural differences between a given firm and the average firm in
the group. In particular, we define the index DIF xi−g to be a measure of the difference
in the x characteristic between the observed firm i and the average firm under a FP
contract in group g, x̄fpg :
DIF xi−g =
|xig − x̄fpg |xig
.
In our estimations we consider different variables in order to calculate this index.
In particular, we will focus on structural differences in the share of drivers and in the
length of the network. The share of drivers is obtained by dividing the number of
drivers in each network by the total labor force, which entails the bus drivers as well
as engineers who are responsible for the improvement of the operator’s productivity.
The size of the network is measured as the total length of the transport network in
kilometers. Note that this variable is also a proxy for the size of the operator. The
sample that we use in our estimation is an unbalanced panel composed of 67 different
networks regulated under FP contracts and contains 714 observations over the period
1987-2001.
7.2 Results
We turn now to the empirical results of our estimations. Table 3 displays the estimates
of three alternative specifications. In each of them, we consider only networks reg-
ulated under FP contracts and test different explanatory variables that are used as
proxies for the firm-specific knowledge spillovers within each of the industrial groups,
κig. We specify the function κ in (19) to have a quadratic form in all specifications. The
function includes a full set of firm-specific dummy variables to control for unobserved
network-specific characteristics as well as group-specific dummy variables to control
for unobserved group characteristics. In other words, we specify the function in (19)
to take the following form:
κig =(γg + δi + µDIF x
i−g)2. (21)
For each network i belonging to group g, the dummy variable γg measures group
g’s contribution to the network’s capacity to assimilate the knowledge spilled over by
25
the other networks from the group. The dummy variable δi measures the network’s
specificities that will affect its capacity to benefit from the knowledge spillovers. These
are aimed at capturing unobserved network characteristics that affect its ability to as-
similate the spillovers coming from the other networks of the group. As an example,
consider the firms operating the transport services in the French cities of Lille and
Lyon, both belonging to the Keolis group. If the mechanic team in Lille develops a
new method for repairing its buses’ windshields, part of this knowledge is reached by
the mechanic team in Lyon through Keolis’ headquarters.19 While the overall efficiency
of both networks is similar and determined by the Keolis group, the mechanic team in
Lyon may the have local characteristics which would affect its ability to fully benefit
from the effort exerted by Lille’s mechanic team.
Finally, we include the structural difference between a given firm and the average
firm under a FP contract in the group, DIF xi−g. In specification I, it is measured using
the size of the network (the total length in kilometers). We compute this index using
the share of drivers in specification II.
Consider first the estimates related to the output and input variables in table 3. All
parameter are significant at the 1% level and have the expected sign. Note that the
parameter are very stable across each specification. The disutility of effort parameter,
α, is also positive in both specifications, although only significant in specification II.
The effect of our similarity indexes on the knowledge spillovers parameter are posi-
tive and significant in both specifications. This result means that networks that present
larger difference relative to their group (measured either in terms of drivers or length of
the network) benefit to a larger extent from the efforts provided in the other networks
from their group.
As already mentioned in section 5, we consider the network’s intrinsic inefficiency,
captured by the parameter θg in equation (17), to be group-specific. Indeed, each one of
the operators belonging to group g possesses a team of engineers which is responsible
for research development, quality control, maintenance, and efficiency of the network.
We consider that their efficiency is determined at the group level rather than being
independently determined. The estimates of the group dummy variables θg appear
positive and highly significant. Irrespective of the specification, Keolis appears to be
19This example is taken from Barbosa (2010).
26
the most efficient group, followed by Connex and Transdev. Finally, it is interesting
to note the differences in the coefficients on the group dummy variables entering the
knowledge spillovers parameter, γg. The latter appear to be negative for each group,
although it is much larger in absolute value for Connex in both specifications.
Evaluating Knowledge Spillovers
Having these estimates in hands, we are able to derive the estimated κ̂ig for each net-
work at each period. In order to test the relevance of the knowledge spillovers in our
regulation model, we compute an average value of the knowledge spillovers parame-
ter for each of the three different groups. Table 4 presents the results derived from each
of our specifications. The estimates show statistically significant knowledge spillovers,
confirming our hypothesis that operators belonging to a same group benefit from the
efforts exerted by all the networks of the group. Our results also present differences
across groups, with larger knowledge spillover values for the Connex and Transdev
groups. Note that these two groups are the ones with the largest proportions of net-
works under a FP contract, highlighting the importance of this component for the
knowledge spillover effects to take place.
8 Simulations
The resulting estimates of our structural model of regulation allow us to produce a
series of counterfactual exercises. The effect of adding extra operators to a group on the
final operating costs of the group members is of particular interest. Indeed, if we expect
companies to benefit from knowledge spillovers, operating extra networks should help
in reducing the costs of operators already in place. Another counterfactual of interest is
to see what would be the effect of a merger between two groups. While such an event
will undoubtedly reduce competition in the industry, it could nonetheless be beneficial
if it leads to important cost reductions due to knowledge spillovers. In what follows
we propose to simulate such counterfactuals in order to illustrate the potential impacts
of knowledge spillovers in the French transport industry. We start by analyzing the
effects of adding new operators to the existing groups.
27
8.1 Group expansion
Our model predicts that a given network i belonging to a given group g will benefit
from the efforts exerted by the remaining firms in the group through the knowledge
spillovers parameter κig. We now focus our attention on the effect of increasing the
number of operators in a given group, while maintaining the knowledge spillovers pa-
rameter constant. To do this, we consider a hypothetical scenario where a new operator
is added to a given group and compute the cost difference resulting from that change in
the group structure. We perform our simulation exercise as follows. We start by consid-
ering each operator to be the only member of its group. That is, if for example operator
A originally belongs to Keolis, we consider that it is now part of a new group composed
of only 1 network (namely, itself). Under this hypothetical situation, we compute the
total operating cost for each operator in the sample. The next step consists in evaluat-
ing the cost change that each operator would face if a new network were added to its
respective group (which, so far, consisted in only 1 network). From our cost function
in (17), we compute the total cost associated with the operator belonging to a group
composed of 2 networks. We assume the operator that is added to the group to be the
representative operator of the group to which the initial network belongs. Following
the example above, we would therefore add to the group of operator A (initially com-
posed of only 1 network) an operator that is representative of the Keolis group (i.e. an
operator characterized by the average values of the operators from Keolis).20 Similarly,
and using the same reasoning, we can compute the effect of adding a larger number
of networks into the group. Once the simulation exercise is completed, we can easily
compute the cost differential associated with the increase in group size from x to x+ p
operators. That is, we can compute 4xpCfpig ≡
(Cfpig | nfpg = x+ p
)−(Cfpig | nfpg = x
)for x, p = {1, 2, 3, . . .}.
Tables 5 to 7 present the results of this simulation exercise using the estimates de-
rived from specification II. 21 Results show significant costs reductions from being
linked to a larger number of networks. In particular, the cost savings are increasing
importantly with the number of operators that are added to the group. Note also that
20Note that for any operator i that belongs to group g, the variable DIF xi−g is unaffected by the addi-
tion of an operator that is representative of the existing firms already in the group. It follows that theknowledge spillovers parameter κig is unaffected by such a change.
21The simulations based on the estimates derived from specifications I show similar results.
28
the effect of an additional network varies in function of the initial group size. Although
to a small extent, the cost reduction associated with an extra operator is decreasing in
the size of the group. Finally, note that the different groups benefit from the inclusion
of additional operators to different extents. In particular, and in accordance with the
knowledge spillovers values presented in table 4, Connex and Transdev benefit to a
larger extent from the inclusion of extra networks into their group.
8.2 Merger
As already mentioned, industrial groups of urban transport have a long history of
mergers in France. The last merger that was witnessed in the French transport indus-
try occurred on March 3rd 2011 and involved Veolia Transport (the former Connex) and
Transdev, which gave birth to Veolia Transdev. Our model allows us to simulate such
a merger and to evaluate the potential gains in costs for the merging groups, namely
Connex and Transdev.22 Several assumption must be made on the post merger out-
comes regarding our parameters. We first assume that the inefficiency level of the
group resulting from the merger (Veolia Transdev in our example) will take the value
of the most efficient merging group. In other words, we assume that the less efficient
group is absorbed by the most efficient one. In all of our estimations above, the es-
timated parameters θ̂g show that Connex is the most efficient group of the two since
θ̂Transdev > θ̂Connex . We therefore assume that θV eoliaTransdev = θConnex in our simula-
tions. Similarly, we assume that, after the merger, the group-specific capacity to trans-
mit knowledge will be the highest of the two merging groups. In all of our estimations
results, the estimated parameters γ̂g show that Transdev has the highest capacity to
transmit knowledge among its operators since γ̂Transdev >γ̂Connex. We therefore assume
that γV eoliaTransdev =γTransdev in our simulations. Finally, note the difference between
this simulation exercise and the one we carried in the previous section. In the latter,
we computed the cost reduction associated with an increase in the group size while
maintaining the knowledge spillover parameter κ constant. Here, κ will also change
as a result of the merger since the operators entering the new group are not necessar-
22Note, however, that our simulation does not correspond with the same years in which the actualmerger occurred. Since we simulate the merger with our entire sample that covers the period 1987-2001,it is as if the merger had occurred in 1987.
29
ily representative of the ones already in place within the group.23 Table 8 presents the
results of the merger simulation exercise using the estimates derived from each of our
specifications. For each one of the merging groups, each cell in the table presents the
average percentage change in the operators’ costs following the merger. The results
are very similar across each specification and show important gains in costs from the
merger. In particular, cost reductions are very important for operators initially belong-
ing to Connex, sometimes twice as large as the cost reductions for operators initially
belonging to Transdev. This last fact is perhaps not surprising for two reasons. First,
according to our results in table 4, Connex is the group that benefits the most, on aver-
age, from knowledge spillovers. Second, Transdev is the group with the largest num-
ber of networks regulated under FP contracts (see table 1). It follows that, after the
merger, the operators initially belonging to Connex see their number of FP networks
increase much more relative to operators initially belonging to Transdev. For instance,
in our first year of data (1987), Connex was present in 5 different networks regulated
under a FP contract while Transdev was present in 15 such networks. After a merger,
the operators initially belonging to Transdev would therefore see the number of FP
networks in their group increase by a third (from 15 to 20) while operators initially
belonging to Connex would see the number of such networks quadruple (from 5 to
20). It is however important to highlight that our model does not capture the fact that
not all of the 15 FP networks from Transdev will equally contribute to Connex’s cost
savings when the merger takes place (nor will all of the 5 FP networks from Connex
equally contribute to Transdev’s cost savings). In particular, one might expect merging
parties to show decreasing returns to the number of merging networks with a given
set of characteristics. To illustrate this point, consider table 9 which presents a measure
of the congestion levels of the different FP networks involved in our merger simula-
tion.24 While Connex will benefit from the efforts of all 15 networks from Transdev
after the merger, our previous results have suggested that it will benefit from them
based on their characteristics rather than based on their number. For instance, table 9
indicates that Connex operates a single network with a congestion level of around 850
inhabitants per km of line. Transdev, on the other hand, is operating 5 different net-
23Recall that the simulation exercise in section 8.1 was realized by adding representative operators toa group, maintaining constant the DIF x
i−gvariable throughout the exercise (see footnote 20).24These are networks that were operated by either Connex or Transdev in 1987, the first year of our
data, and our congestion measure is computed as the ration of the population over the size of the net-work in kilometers.
30
works with congestion levels within this range (between 600 and 950 inhabitants per
km of line). It therefore seems natural to think that the relevant knowledge that Connex
would benefit from would come for these 5 networks as a whole. Given that our model
and simulation does not explicitly take this consideration into account, the results from
our simulations should be taken as an upper bound on the potential gains that could
follow from the merger and should be interpreted with caution. In the same line, one
must still take into account that the main trade-off involved in a merger evaluation is
between potential efficiency gains resulting from consolidation versus the potential in-
creases in price and potential deterioration of the quality of the transportation service.
It is therefore important to highlight that our simulations only allow us to evaluate one
part of this trade-off, namely the potential gains in costs that would follow from the
merger. From that perspective, our results confirm the importance of considering the
structure of the industrial transportation groups at the time of evaluating mergers in
the French transportation industry.
9 Conclusion
In this paper we identify and measure the relevance of knowledge spillovers in ur-
ban transport regulation. We take advantage of a specific feature of the French urban
transport industry, namely that about eighty percent of the operators that provide the
transport services in each city are owned by three large industrial groups. The trans-
port services provided in different networks by operators belonging to the same in-
dustrial group are therefore essentially provided by the same firm. On top of that, the
activity of every network is regulated by a local authority within a specific regulatory
framework. The latter takes the form of a written contract that can be, in practice, ei-
ther cost-plus or fixed-price. While effort to compensate technological inefficiencies
is not rewarded under a cost-plus contract, fixed-price contracts provides powerful
incentives to reduce operating costs.
When operators belong to a same group, the new methods and procedures that
they develop can potentially be used by the entire company. We build and estimate
a structural cost regulation model with asymmetric information that includes knowl-
edge spillovers resulting from operating different networks. By focusing our analy-
sis on operators regulated under fixed-price contracts, we ask whether their linkage
31
through a larger group helps them further reduce their operating costs.
Our results show statistically significant knowledge spillovers, confirming the ex-
istence of relevant knowledge spillovers in the French public urban transportation in-
dustry. Furthermore, several simulation exercises derived from our estimates show
that operators gain significantly from being linked to a larger number of networks
within a group. In particular, the cost reductions following the addition of new opera-
tors into a group is increasing in the number of networks added. Finally, the simulation
of a merger between the Connex and Transdev groups, as actually occurred on March
3rd 2011, show important costs reductions for the operators involved, between 24%
and 49%. Our results therefore provide evidence on the importance of taking knowl-
edge spillovers into account when evaluating the economic effects of mergers.
32
References
Barbosa, K. “Free-Riding in Procurement Design”, Working Paper, 2010.
Bernstein, Jeffrey and M. Ishaq Nadiri. “Research and Development and Intrain-
dustry Spillovers: An Empirical Application of Dynamic Duality.” Review of Economic
Studies 56 (1989), 249-269
Bloom, N., Schankerman, M. and Van Reenen, J. “Identifying Technology Spillovers
and Product Market Rivalry.” Econometrica vol. 81(4) (2013), pp. 1347-1393, 07.
Brickley, J. A. “Incentive Conflicts and Contractual Restraints: Evidence from Fran-
chising” Journal of Law and Economics Vol. 42, No. 2 (1999), pp. 745-774.
Cour de Comptes.“Les transports publics urbains: rapport au président de la république
suivi des réponses des administrations et des organismes intéressés”, April 2005.
Darr, E.D., Argote, L. and Epple, D. “The Acquisition, Transfer, and Depreciation of
Knowledge in Service Organizations: Productivity in Franchises” Management Science
Vol. 41 (1995), No. 11, pp. 1750-1762.
Domenach, O.,“Métamorphose des rapports contractuels dans les transports publics
urbains,” Transports, 326, 1987.
Gagnepain, P. and Ivaldi, M. “Incentive Regulatory policies: The Case of Public
Transit Systems in France.” The Rand Journal of Economics, Vol. 33 (2002), pp. 605-629.
Gagnepain, P. and Ivaldi, M. “Choice of Regulation, Incentives and Political Cap-
ture: The Case of Local Transport Services in France.” CEPR working Paper, 2012.
Gagnepain, P., Ivaldi, M. and Martimort, D. “The cost of contract renegotiation:
Evidence from the local public transport.” Forthcoming American Economic Review.
Griliches, Z. “The Search for R&D Spillovers.” Scandinavian Journal of Economics,
vol. 94(0) (1992), pages S29-47, Supplemen.
Institut D’Economie Industrielle. “Network Industries and Public Service.” Euro-
pean Commission Reports and Studies, Vol. 4 (1999).
Klette, TJ. “R&D, Scope Economies, and Plant Performance” The Rand Journal of
Economics , Vol. 27 (1996), pp. 502-522.
33
Laffont, J.J., and Tirole, J. A Theory of Incentives in Procurement and Regulation. Cam-
bridge: MIT Press, 1993.
Lafontaine, F., and Slade, M. “Vertical Integration and Firm Boundaries: The Evi-
dence” Journal of Economic Literature, 45(3): 629-685 (2007).
Lafontaine, F., and Slade, M. “Retail Contracting: Theory and Practice Francine”
The Journal of Industrial Economics Vol. 45, No. 1 (1997), pp. 1-25
Szulanski G. “Exploring internal stickiness: impediments to the transfer of best
practice within the firm.” Strategic Management Journal 17: 27-43 (1996).
34
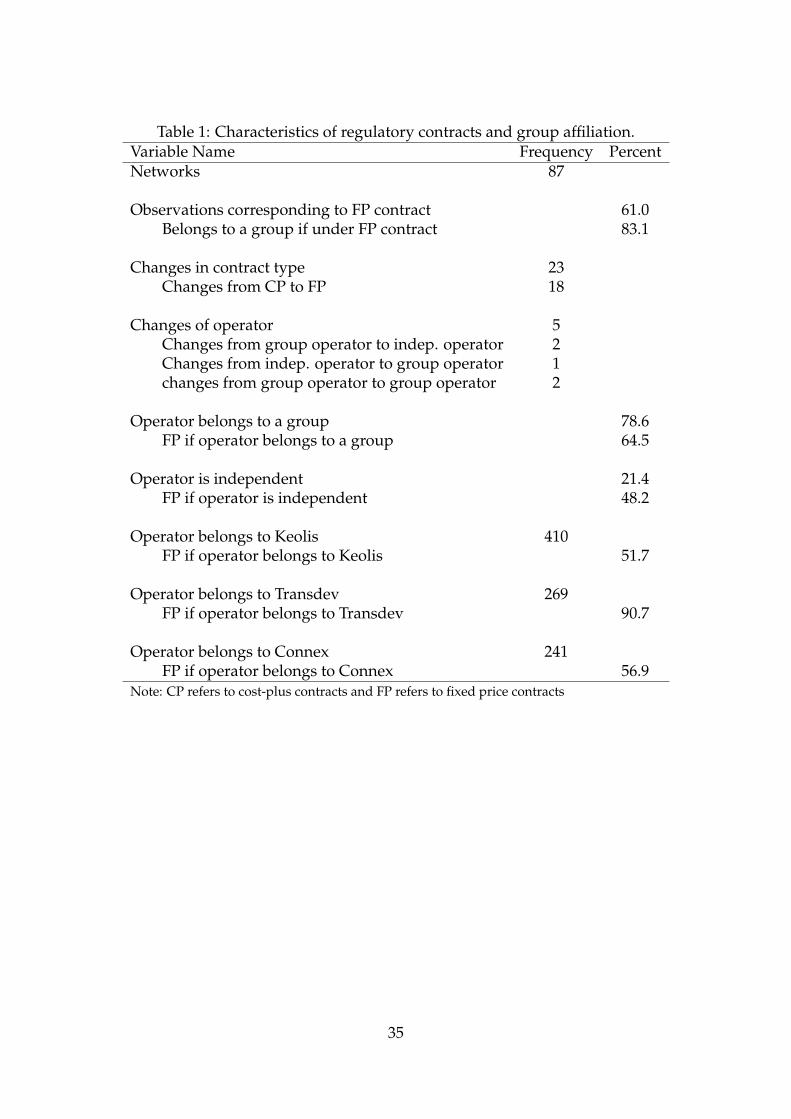
Table 1: Characteristics of regulatory contracts and group affiliation.Variable Name Frequency PercentNetworks 87
Observations corresponding to FP contract 61.0Belongs to a group if under FP contract 83.1
Changes in contract type 23Changes from CP to FP 18
Changes of operator 5Changes from group operator to indep. operator 2Changes from indep. operator to group operator 1changes from group operator to group operator 2
Operator belongs to a group 78.6FP if operator belongs to a group 64.5
Operator is independent 21.4FP if operator is independent 48.2
Operator belongs to Keolis 410FP if operator belongs to Keolis 51.7
Operator belongs to Transdev 269FP if operator belongs to Transdev 90.7
Operator belongs to Connex 241FP if operator belongs to Connex 56.9
Note: CP refers to cost-plus contracts and FP refers to fixed price contracts
35
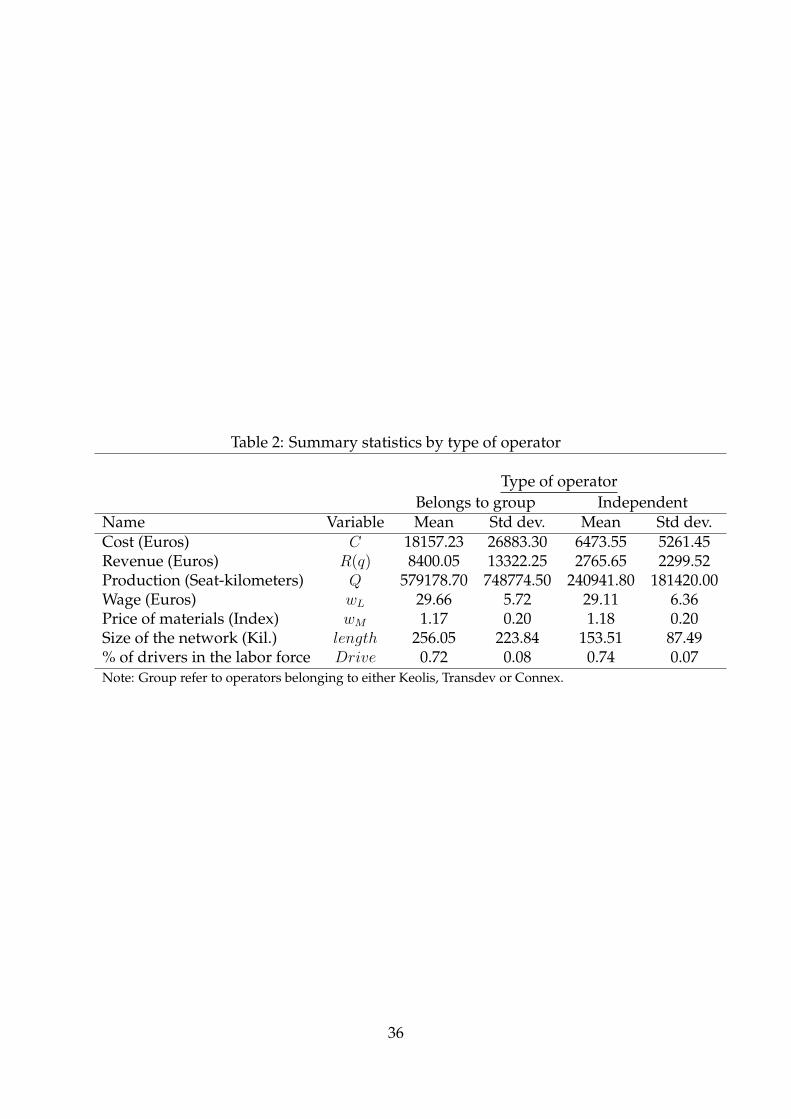
Table 2: Summary statistics by type of operator
Type of operatorBelongs to group Independent
Name Variable Mean Std dev. Mean Std dev.Cost (Euros) C 18157.23 26883.30 6473.55 5261.45Revenue (Euros) R(q) 8400.05 13322.25 2765.65 2299.52Production (Seat-kilometers) Q 579178.70 748774.50 240941.80 181420.00Wage (Euros) wL 29.66 5.72 29.11 6.36Price of materials (Index) wM 1.17 0.20 1.18 0.20Size of the network (Kil.) length 256.05 223.84 153.51 87.49% of drivers in the labor force Drive 0.72 0.08 0.74 0.07Note: Group refer to operators belonging to either Keolis, Transdev or Connex.
36
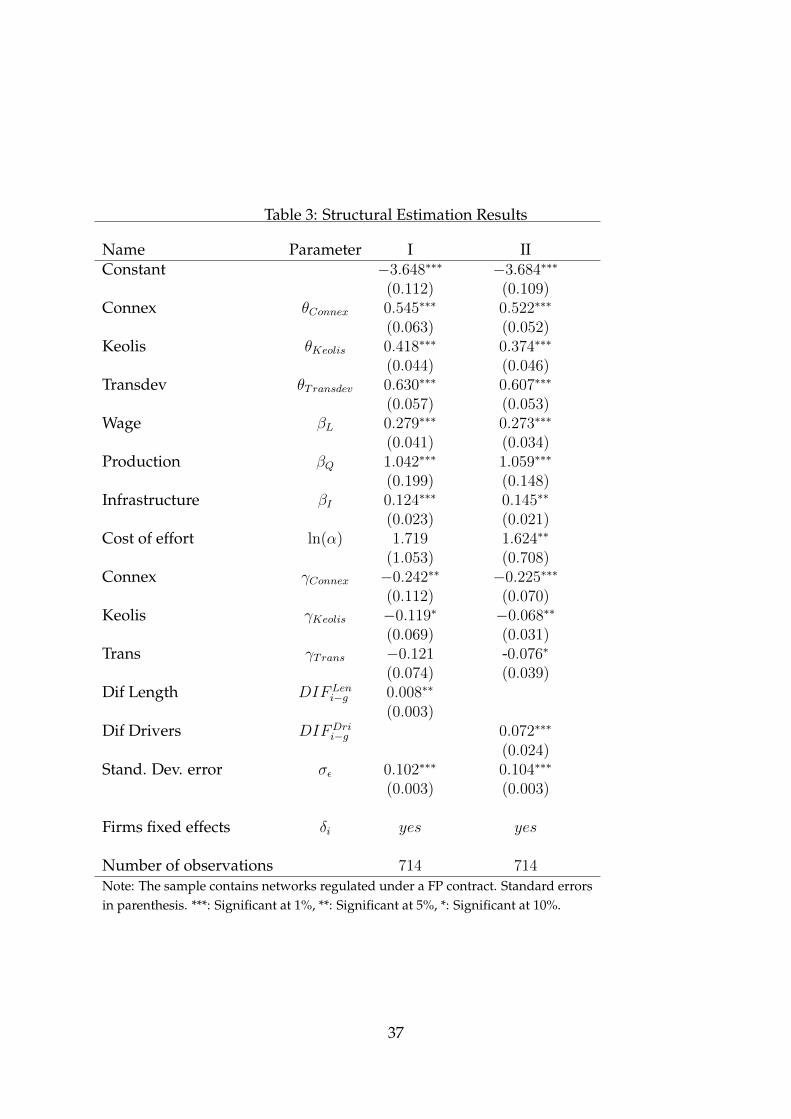
Table 3: Structural Estimation Results
Name Parameter I IIConstant −3.648∗∗∗ −3.684∗∗∗
(0.112) (0.109)Connex θConnex 0.545∗∗∗ 0.522∗∗∗
(0.063) (0.052)Keolis θKeolis 0.418∗∗∗ 0.374∗∗∗
(0.044) (0.046)Transdev θTransdev 0.630∗∗∗ 0.607∗∗∗
(0.057) (0.053)Wage βL 0.279∗∗∗ 0.273∗∗∗
(0.041) (0.034)Production βQ 1.042∗∗∗ 1.059∗∗∗
(0.199) (0.148)Infrastructure βI 0.124∗∗∗ 0.145∗∗
(0.023) (0.021)Cost of effort ln(α) 1.719 1.624∗∗
(1.053) (0.708)Connex γConnex −0.242∗∗ −0.225∗∗∗
(0.112) (0.070)Keolis γKeolis −0.119∗ −0.068∗∗
(0.069) (0.031)Trans γTrans −0.121 -0.076∗
(0.074) (0.039)Dif Length DIFLen
i−g 0.008∗∗
(0.003)Dif Drivers DIFDri
i−g 0.072∗∗∗
(0.024)Stand. Dev. error σε 0.102∗∗∗ 0.104∗∗∗
(0.003) (0.003)
Firms fixed effects δi yes yes
Number of observations 714 714Note: The sample contains networks regulated under a FP contract. Standard errorsin parenthesis. ***: Significant at 1%, **: Significant at 5%, *: Significant at 10%.
37
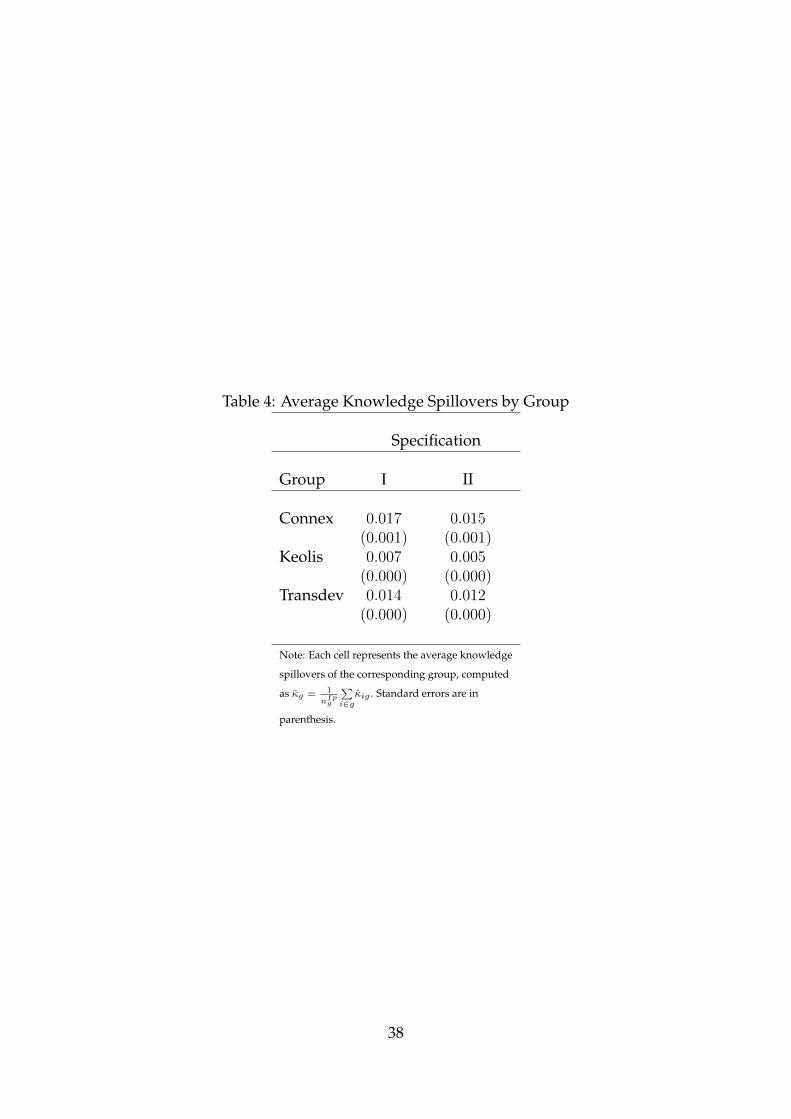
Table 4: Average Knowledge Spillovers by Group
Specification
Group I II
Connex 0.017 0.015(0.001) (0.001)
Keolis 0.007 0.005(0.000) (0.000)
Transdev 0.014 0.012(0.000) (0.000)
Note: Each cell represents the average knowledge
spillovers of the corresponding group, computed
as κ̄g = 1
nfpg
∑i∈g
κ̂ig . Standard errors are in
parenthesis.
38

Tabl
e5:
Perc
enta
gech
ange
into
talc
osts
from
addi
ngne
wop
erat
ors
for
Con
nex
...tox
+p
oper
ator
sin
the
Con
nex
grou
p
23
45
67
89
10
Goingfromxoperators...1
−4.
51−
8.58
−12.2
8−
15.6
5−
18.7
4−
21.5
8−
24.1
9−
26.6
2−
28.8
6(0.3
17)
(0.5
87)
(0.8
21)
(1.0
23)
(1.1
20)
(1.3
53)
(1.4
88)
(1.6
08)
(1.7
15)
2-
−4.
40−
8.39
−12.0
3−
15.3
5−
18.4
0−
21.2
1−
23.8
0−
26.2
1-
(0.3
06)
(0.5
68)
(0.7
96)
(0.9
94)
(1.1
67)
(1.3
19)
(1.4
54)
(1.5
73)
3-
-−
4.30
−8.
22−
11.7
9−
15.0
6−
18.0
7−
20.8
5−
23.4
2-
-(0.2
95)
(0.5
50)
(0.7
72)
(0.9
66)
(1.1
36)
(1.2
87)
(1.4
20)
4-
--
−4.
21−
8.04
−11.5
6−
14.7
8−
17.7
5−
20.5
0-
--
(0.2
85)
(0.5
33)
(0.7
49)
(0.9
39)
(1.1
07)
(1.2
55)
5-
--
-−
4.12
−7.
88−
11.3
3−
14.5
1−
17.4
4-
--
-(0.2
76)
(0.5
16)
(0.7
28)
(0.9
14)
(1.0
78)
6-
--
--
−4.
03−
7.72
−11.1
1−
14.2
5-
--
--
(0.2
67)
(0.5
01)
(0.7
07)
(0.8
89)
7-
--
--
-−
3.94
−7.
57−
10.9
0-
--
--
-(0.2
58)
(0.4
86)
(0.6
87)
8-
--
--
--
−3.
863−
7.41
9-
--
--
--
(0.2
50)
(0.4
72)
9-
--
--
--
-−
3.78
4-
--
--
--
-(0.2
43)
Not
e:Ea
chce
llin
the
tabl
epr
esen
tsth
eav
erag
epe
rcen
tage
chan
gein
cost
sfo
llow
ing
the
addi
tion
ofp
netw
orks
toa
grou
pin
whi
chx
oper
ator
sar
eal
read
ypr
esen
t:4xpCfpig≡
[ ( Cfp
ig|n
fp
g=x+p) −( Cf
pig|n
fp
g=x)
( Cfp
ig|n
fp
g=x)
] ×100
,usi
ngeq
uati
on(1
7)in
the
text
.E.g
.the
cell
corr
es-
pond
ing
toro
w2
and
colu
mn
7gi
veth
epe
rcen
tage
chan
gein
the
cost
ofan
oper
ator
that
goes
from
belo
ngin
gto
agr
oup
of2
oper
ator
s
toa
grou
pof
7op
erat
ors.
Stan
dard
erro
rsin
pare
nthe
sis.
Esti
mat
esar
eco
mpu
ted
from
the
resu
lts
obta
ined
insp
ecifi
cati
onII
.
39
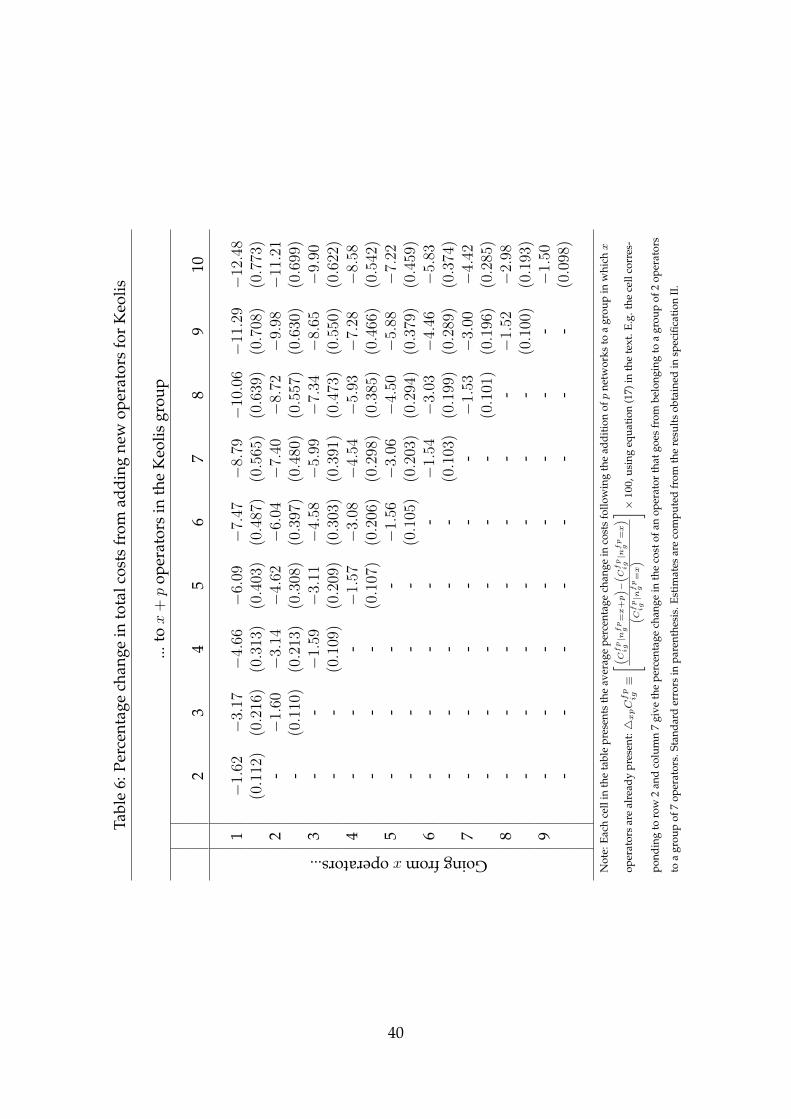
Tabl
e6:
Perc
enta
gech
ange
into
talc
osts
from
addi
ngne
wop
erat
ors
for
Keo
lis
...tox
+p
oper
ator
sin
the
Keo
lisgr
oup
23
45
67
89
10
Goingfromxoperators...1
−1.
62−
3.17
−4.
66−
6.09
−7.
47−
8.79
−10.0
6−
11.2
9−
12.4
8(0.1
12)
(0.2
16)
(0.3
13)
(0.4
03)
(0.4
87)
(0.5
65)
(0.6
39)
(0.7
08)
(0.7
73)
2-
−1.
60−
3.14
−4.
62−
6.04
−7.
40−
8.72
−9.
98−
11.2
1-
(0.1
10)
(0.2
13)
(0.3
08)
(0.3
97)
(0.4
80)
(0.5
57)
(0.6
30)
(0.6
99)
3-
-−
1.59
−3.
11−
4.58
−5.
99−
7.34
−8.
65−
9.90
--
(0.1
09)
(0.2
09)
(0.3
03)
(0.3
91)
(0.4
73)
(0.5
50)
(0.6
22)
4-
--
−1.
57−
3.08
−4.
54−
5.93
−7.
28−
8.58
--
-(0.1
07)
(0.2
06)
(0.2
98)
(0.3
85)
(0.4
66)
(0.5
42)
5-
--
-−
1.56
−3.
06−
4.50
−5.
88−
7.22
--
--
(0.1
05)
(0.2
03)
(0.2
94)
(0.3
79)
(0.4
59)
6-
--
--
−1.
54−
3.03
−4.
46−
5.83
--
--
-(0.1
03)
(0.1
99)
(0.2
89)
(0.3
74)
7-
--
--
-−
1.53
−3.
00−
4.42
--
--
--
(0.1
01)
(0.1
96)
(0.2
85)
8-
--
--
--
−1.
52−
2.98
--
--
--
-(0.1
00)
(0.1
93)
9-
--
--
--
-−
1.50
--
--
--
--
(0.0
98)
Not
e:Ea
chce
llin
the
tabl
epr
esen
tsth
eav
erag
epe
rcen
tage
chan
gein
cost
sfo
llow
ing
the
addi
tion
ofp
netw
orks
toa
grou
pin
whi
chx
oper
ator
sar
eal
read
ypr
esen
t:4xpCfpig≡
[ ( Cfp
ig|n
fp
g=x+p) −( Cf
pig|n
fp
g=x)
( Cfp
ig|n
fp
g=x)
] ×100
,usi
ngeq
uati
on(1
7)in
the
text
.E.g
.the
cell
corr
es-
pond
ing
toro
w2
and
colu
mn
7gi
veth
epe
rcen
tage
chan
gein
the
cost
ofan
oper
ator
that
goes
from
belo
ngin
gto
agr
oup
of2
oper
ator
s
toa
grou
pof
7op
erat
ors.
Stan
dard
erro
rsin
pare
nthe
sis.
Esti
mat
esar
eco
mpu
ted
from
the
resu
lts
obta
ined
insp
ecifi
cati
onII
.
40
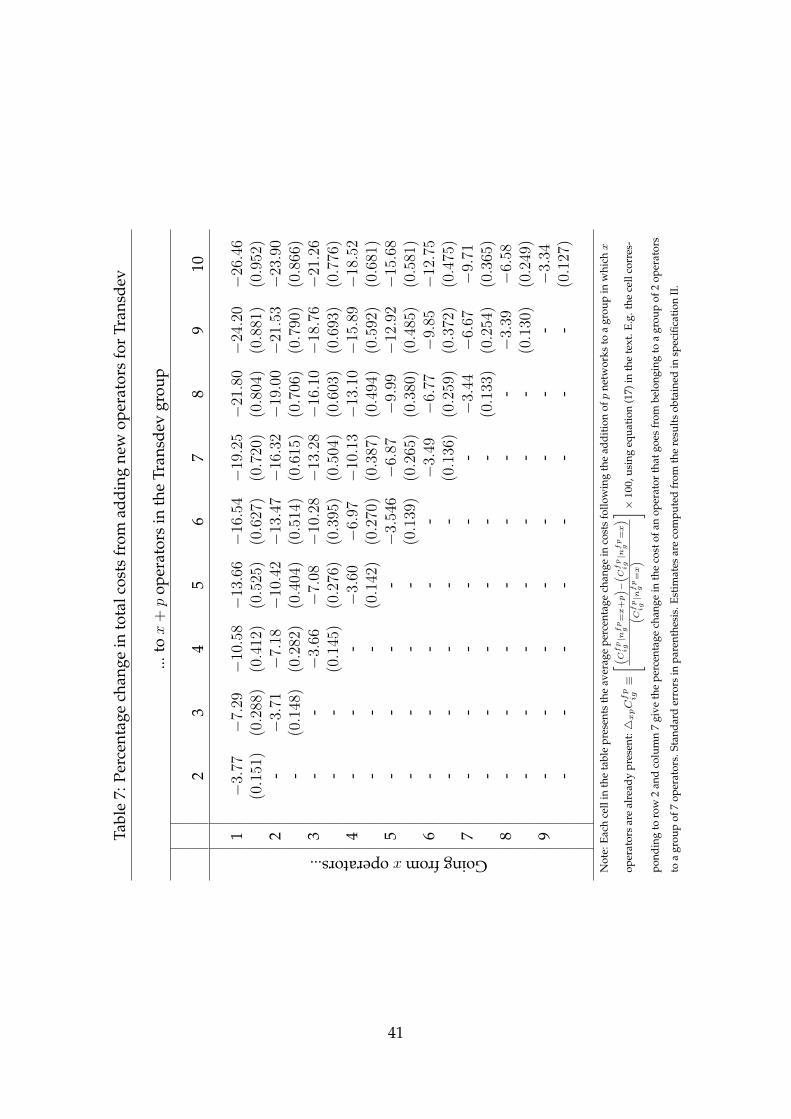
Tabl
e7:
Perc
enta
gech
ange
into
talc
osts
from
addi
ngne
wop
erat
ors
for
Tran
sdev
...tox
+p
oper
ator
sin
the
Tran
sdev
grou
p
23
45
67
89
10
Goingfromxoperators...1
−3.
77−
7.29
−10.5
8−
13.6
6−
16.5
4−
19.2
5−
21.8
0−
24.2
0−
26.4
6(0.1
51)
(0.2
88)
(0.4
12)
(0.5
25)
(0.6
27)
(0.7
20)
(0.8
04)
(0.8
81)
(0.9
52)
2-
−3.
71−
7.18
−10.4
2−
13.4
7−
16.3
2−
19.0
0−
21.5
3−
23.9
0-
(0.1
48)
(0.2
82)
(0.4
04)
(0.5
14)
(0.6
15)
(0.7
06)
(0.7
90)
(0.8
66)
3-
-−
3.66
−7.
08−
10.2
8−
13.2
8−
16.1
0−
18.7
6−
21.2
6-
-(0.1
45)
(0.2
76)
(0.3
95)
(0.5
04)
(0.6
03)
(0.6
93)
(0.7
76)
4-
--
−3.
60−
6.97
−10.1
3−
13.1
0−
15.8
9−
18.5
2-
--
(0.1
42)
(0.2
70)
(0.3
87)
(0.4
94)
(0.5
92)
(0.6
81)
5-
--
-−
3.54
6−
6.87
−9.
99−
12.9
2−
15.6
8-
--
-(0.1
39)
(0.2
65)
(0.3
80)
(0.4
85)
(0.5
81)
6-
--
--
−3.
49−
6.77
−9.
85−
12.7
5-
--
--
(0.1
36)
(0.2
59)
(0.3
72)
(0.4
75)
7-
--
--
-−
3.44
−6.
67−
9.71
--
--
--
(0.1
33)
(0.2
54)
(0.3
65)
8-
--
--
--
−3.
39−
6.58
--
--
--
-(0.1
30)
(0.2
49)
9-
--
--
--
-−
3.34
--
--
--
--
(0.1
27)
Not
e:Ea
chce
llin
the
tabl
epr
esen
tsth
eav
erag
epe
rcen
tage
chan
gein
cost
sfo
llow
ing
the
addi
tion
ofp
netw
orks
toa
grou
pin
whi
chx
oper
ator
sar
eal
read
ypr
esen
t:4xpCfpig≡
[ ( Cfp
ig|n
fp
g=x+p) −( Cf
pig|n
fp
g=x)
( Cfp
ig|n
fp
g=x)
] ×100
,usi
ngeq
uati
on(1
7)in
the
text
.E.g
.the
cell
corr
es-
pond
ing
toro
w2
and
colu
mn
7gi
veth
epe
rcen
tage
chan
gein
the
cost
ofan
oper
ator
that
goes
from
belo
ngin
gto
agr
oup
of2
oper
ator
s
toa
grou
pof
7op
erat
ors.
Stan
dard
erro
rsin
pare
nthe
sis.
Esti
mat
esar
eco
mpu
ted
from
the
resu
lts
obta
ined
insp
ecifi
cati
onII
.
41
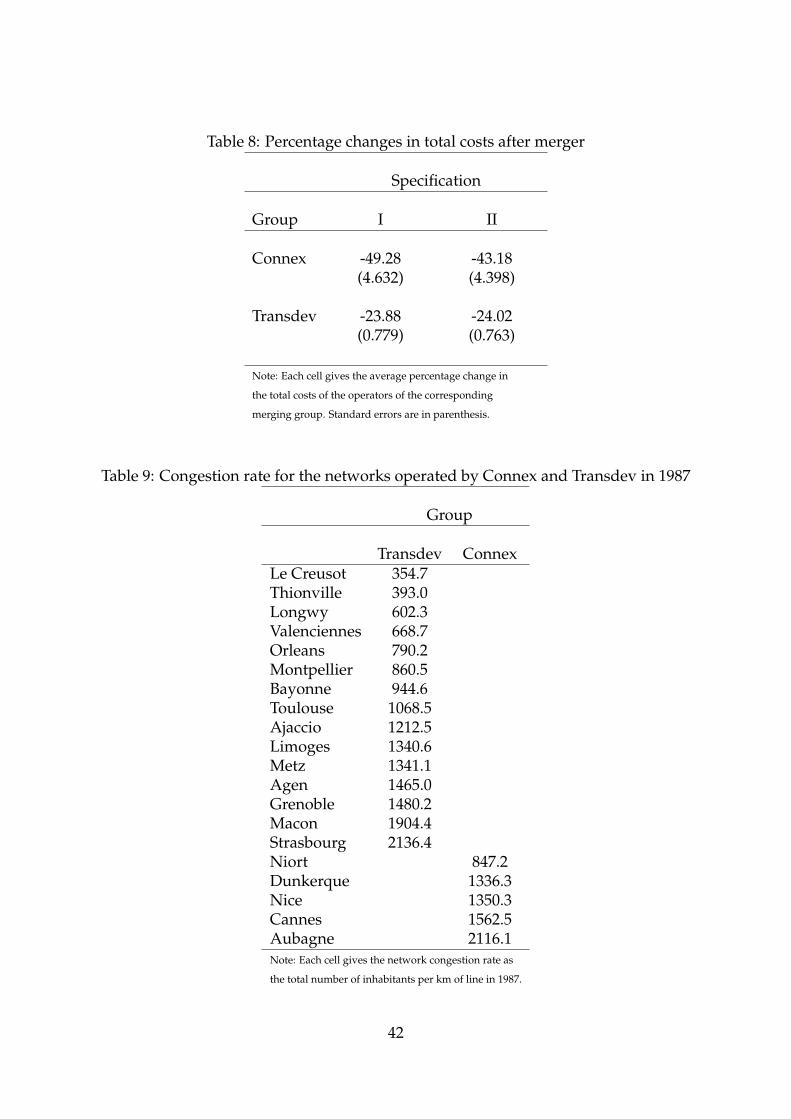
Table 8: Percentage changes in total costs after merger
Specification
Group I II
Connex -49.28 -43.18(4.632) (4.398)
Transdev -23.88 -24.02(0.779) (0.763)
Note: Each cell gives the average percentage change in
the total costs of the operators of the corresponding
merging group. Standard errors are in parenthesis.
Table 9: Congestion rate for the networks operated by Connex and Transdev in 1987
Group
Transdev ConnexLe Creusot 354.7Thionville 393.0Longwy 602.3Valenciennes 668.7Orleans 790.2Montpellier 860.5Bayonne 944.6Toulouse 1068.5Ajaccio 1212.5Limoges 1340.6Metz 1341.1Agen 1465.0Grenoble 1480.2Macon 1904.4Strasbourg 2136.4Niort 847.2Dunkerque 1336.3Nice 1350.3Cannes 1562.5Aubagne 2116.1Note: Each cell gives the network congestion rate as
the total number of inhabitants per km of line in 1987.
42