Embed Size (px)
Citation preview
Agglomeration Spillovers from
Intangible Capital: An Analysis
of UK City Regions
Rebecca Riley and
Catherine Robinson
March 2011
INNODRIVE Working Paper No 15.
ABSTRACT INN
OD
RIV
E W
ORK
ING
PAPE
R S
ERIE
S
The research leading to these results has received funding from
the European Community's Seventh Framework Programme
under grant agreement n° 214576
2
Agglomeration Spillovers from Intangible Capital: An Analysis of UK
City Regions
Rebecca Riley1 and Catherine Robinson2
1 National Institute of Economic and Social Research and LLAKES, London, UK 2 School of Business and Economics & WISERD, Swansea University, UK
March 2011
ABSTRACT
The importance of intangible capital as a driver of productivity growth is being increasingly rec-
ognised; however as yet, its importance at a regional level has barely been considered. In this
paper we present recently constructed occupationally defined measures of intangible capital at
the firm level for the UK within a regional framework. We analyse the extent to which returns
to intangible capital exceed their direct value to individual firms and generate regional spillovers.
Our regional analysis is defined by City Regions, which reflect the commuting patterns of skilled
workers and therefore represent a more economically meaningful unit of geographic delineation.
Our measures of intangible capital focus on ICT, R&D and organisational capital, and we sepa-
rately consider the individual associations as well as considering the aggregate association with
productivity. We estimate firm level determinants of productivity, measured not only in terms of
labour productivity but also in relation to wages, controlling for regional characteristics that in-
clude intangible capital. Our findings suggest there is a positive association between productivity
and organisation capital in particular, consistent with the presence of spillovers.
JEL classification: M40, J30, O30, O40, M12, J24
KEYWORDS: Intangible capital, R&D, ICT, management, linked employer-employee data,
spillovers
________________________________
Acknowledgements: This paper is part of the INNODRIVE project financed by the EU 7th Framework Pro-gramme, No. 214576. Thanks to Richard Harris, Richard Upward and the MAUS team at ONS for making available useful data items, and to Geoff Mason, John Forth, Mary O‟Mahony, Andy Dickerson, Jonathan Haskel, and partic-ipants in INNODRIVE for comments and discussion of this work.
Disclaimer: This work contains statistical data from ONS which is Crown copyright and reproduced with the per-mission of the controller of HMSO and Queen's Printer for Scotland. The use of the ONS statistical data in this work does not imply the endorsement of the ONS in relation to the interpretation or analysis of the statistical data. This work uses research datasets which may not exactly reproduce National Statistics aggregates.
3
1. INTRODUCTION
Intangible assets have long since been recognised for their important contribution to productivi-
ty (Veblen, 1908). However, the scope of intangibles has increased considerably in recent years
which Lev (2001) argues has been driven by a variety of economic factors, including globalisa-
tion, deregulation and technological innovation, which has forced firms to innovate if they are to
be profitable. At the same time, there has been increasing recognition of the benefits firms gain
from co-location. Reasons given for these benefits largely stem from having a shared pool of
skilled labour. The purpose in this paper is to consider the extent to which regional levels of in-
tangibles are associated with higher firm level productivity.
Previous research has constructed intangible capital estimates at the national level (Corrado, Hul-
ten and Sichel, 2009, hereafter CHF) and also at the firm level (Piekkola, 2010). The impact on
national accounts, growth and productivity appear to be highly significant; however there has
been little consideration of the spatial distribution of intangibles and indeed whether location
matters. Given the tacit and non-market orientated nature of these assets, combined with their
substantial knowledge component, there is an expectation that they are likely to generate sub-
stantial spillovers to local communities.
In this paper, we analyse firm level measures of intangible capital within a regional context and
examining whether in addition to firm level effects there are significant spillovers as a result of
local intensities of intangibles. Thus we include regional measures as well as firm specific intensi-
ties of intangible capital to see how these are associated with firm level performance. In addi-
tion, we control for other agglomeration economies separately.
This paper builds on the earlier work of Artis et al (2009) and others who have considered
knowledge spillovers in a number of ways. Firstly, our data are firm level, secondly, we use an
economically meaningful measure of geography and thirdly, we incorporate directly a firm level
measure of intangible capital into the analysis, as well as regional impacts. The paper is struc-
tured as follows: we begin with a review of existing evidence, considering the role of intangible
capital in generating agglomeration economies. In section 3 we give an overview of data used
and how our data have been constructed, including descriptive statistics. Section 4 provides a
discussion of the methodological approach adopted and in Section 5 we present our results for
the UK. In section 6 we conclude and highlight areas for further research.
4
2. AGGLOMERATION ECONOMIES & INTANGIBLE CAPITAL: EXISTING EV-
IDENCE
Agglomeration at its most simple may be defined as regional concentration, usually based on
some concept of an urban area. Devereux et al (2005) refer to agglomeration as excess concentra-
tion – i.e. regional concentration over and above that which would be expected, given the indus-
trial structure of the region. Agglomeration economies are generally thought to be benefits that
accrue at the geographical level as a result of firms locating close together, but they do not have
to be exclusively positive; Swann (1996) emphasises the negative effects of congestion as a result
of a concentration of firms. The persistence of areas such as „Silicon Valley‟ in the US and „Sili-
con Fen‟ in the UK are modern examples of high technology based clusters of firms, however,
more traditional concentrations based around industries such as lace-making in Nottingham and
tableware in Derbyshire highlight that benefits are not a new phenomenon. Two main strands to
the economies that are associated with agglomeration exist; firstly, those that operate within an
industry, and secondly those that operate between industries, usually through forward and back-
ward linkages.
Jaffe (1986) identifies three types of spillovers; Market spillovers, Knowledge spillovers and
Network spillovers. Others have looked to defined spillovers operating along different channels.
Within-industry economies encourage specialisation and are most akin to those proposed by
Marshall (1890). Those that operate across industries would lead to the development of diverse
regions and are more closely identified in the work of Jacobs (1968). The source of the econo-
mies, regardless of whether they operate within or between industries, can be identified as stem-
ming from either natural advantages or local externalities and diminish over distance. The new
economic geography literature (Krugman, 1998) looks at the phenomenon of industry location in
terms of increasing returns that can be identified as either being purely technological or pecuni-
ary externalities (Moreno et al, 2006). Technological externalities may be regarded as knowledge
spillovers, whilst pecuniary externalities are regarded as factors that operate through a market
such as the availability of qualified work force, primary and intermediate inputs.
A large proportion of the empirical agglomeration and clusters literature concentrates on innova-
tion and manufacturing industries. Linking agglomeration to productivity is complicated by the
direction of causality. It is as plausible to think that productivity is high because of agglomera-
tion as it is to think that agglomeration occurs because of high regional productivity. Notwith-
5
standing these problems, Ciccone (2002) develops a regional productivity model and compares
findings for France, Germany and the UK to those for the US. He finds a 5 per cent increase in
average labour productivity as a result of a doubling of employment density, with little difference
across European countries. His findings are similar to those for the US. Remedies for combat-
ing the causality question are used, including an instrumental variable of the area of the NUTS3
regions, which, Ciccone argues are appropriate given that they are geographic areas that are his-
torically determined. In addition, he includes detailed regional fixed effects.
Using European Patent Office (EPO) data, Abramovsky et al (2008) match innovative activity to
data on firm performance from the AMADEUS database to look at the location of innovation
across Europe. They argue that the use of EPO data as a measure of innovative activity allows
for a better understanding of the location, since it pinpoints the inventor and permits the consid-
eration of innovative activity in a number of countries. In terms of the relationship between in-
novation and national location, they find similar patterns in France, Germany and UK.
Audretsch and Lehmann (2006) explore the relationship between geography to knowledge
sources and performance using firm level German data. They find that the nature of the rela-
tionship depends very much on the precise nature of the type of knowledge produced. Thus, we
see the importance of taking into account the multifaceted nature of knowledge and the extent to
which spillovers may arise.
From a resource based view of the firm, intangible assets are those inputs into the production
process for which there is little traceable evidence in a standard accounting sense. By its very
nature, defining an intangible asset is difficult, but these include (tacit) knowledge and organisa-
tional characteristics and are thought to affect the innovativeness of the firm. In a firm level
analysis of the productivity impact Lev and Radhakrishnan (2004) define organisational capital as
an agglomeration of technologies – business practices, processes and designs and incentive and
compensation systems. Some view it as being embodied in the workforce (Becker, 1993), others
view it as a “firm-specific capital good jointly produced with output and embodied in the organi-
sation itself”, Atkeson and Kehoe (2002). Intangible assets, because they do not fully operate
through a market, are thought to generate gains over and above their „value‟ and not always ap-
propriated by the source firm. This component of productivity from intangibles can be termed a
6
spillover; knowledge transfers that are not traded but spread more organically through a com-
mon infrastructure – be it a region or an industry (Artis, et al, 2009).
In recent years, the importance of these intangible assets has grown, in part a response to tech-
nologically driven changes with the advent of the ICT driven productivity growth and partly the
shift in industrial structure, away from the production of goods and a move towards services.
This has led to increasing calls to change the way intangibles are captured within the national ac-
counts framework (Corrado, Hulten and Sichel, 2005), as well as the growth in literature that has
explored the direct impact of intangibles on productivity growth (Haskel et al, 2009).
At the sectoral level in the UK, Artis et al (2009) use patent data as a measure of innovation in
their study of agglomeration economies in Great Britain and their impact on productivity per-
formance at a regional level. Their point of departure is the Ciccone (2002) study and using local
area data (NUTS3) they construct a variety of indicators to capture intangibles and model their
effect on GVA per job filled at the regional level. They find a significant effect of agglomeration
economies on productivity which diminishes slightly when the more intangible assets are taken
into account and even more so when account is taken of the spatial autocorrelation, that is, the
extent to which variables (GVA per job filled) display patterns over geography1. However, they
are still significant.
Thus we see that increasingly there has been recognition that R&D and innovation data alone do
not adequately capture knowledge and the external benefits to local firms that stem from it. We
add to the literature by providing a more complete view of knowledge assets in a firm and test
for associations between performance and regional spillovers.
3. DATA CONSTRUCTION The data sources that have been used to construct our measure of intangible assets are an ex-
haustive collection of UK data and include the Annual Survey of Hours and Earnings (ASHE)
1 They do this by adopting a feasible generalised two stage least squared approach.
7
and the Labour Force Survey (LFS). These surveys contain detailed information on occupations
and earnings for a sample of individuals in the UK. Our data on individuals have been linked to
business surveys held by the ONS at the Virtual Microdata Laboratory. The business datasets
that we have to link to, are the Annual Business Inquiry (ABI or ARD) and the Business Struc-
ture Database. The latter contains very basic information on all UK registered firms (based on
VAT and PAYE registers). The former contains a sample of UK firms (a census of large firms)
with detailed financial information.
Data cover the period 1998-2006 and so this will be our period of analysis. This is an interesting
period of analysis for the UK, since it is a period when there was a sharp increase in investment
in ICT technologies. There are of course limitations to any data. In the case of the occupation-
ally based measures of intangibles for the UK, our data are based on a detailed industry and firm
size matrix. This is because, with the exception of very large firms, the AHSE contains only a
very small number of workers for each firm. The robustness of our findings have been com-
pared with a sample of very large firms, and our method appeared to be the most suitable (Riley
and Robinson, 2010).
3.1 Constructing Intangible capital
We measure intangible investment and capital following the methodology adopted in IN-
NODRIVE (European Commission FP7 project), which is described in full in Görzig et al.
(2011). Here we outline briefly the methodology described there. We assume that in addition to
any traded goods and services each firm produces intangible goods of the three types discussed
above: IT, R&D and Organisational capital (OC) goods. The production of these types of goods
is exclusively directed towards firms‟ own use. If the uses are not in the current year, these types
of goods can be classified as intangible capital goods. In order to produce these types of capital
goods, firms apply resources supplied by different factors of production: labour, intermediate,
and capital services. To assess labour services that go towards the production of these intangi-
bles, we distinguish three types of labour input: IT-, R&D-, and OC-related personnel (see Ap-
pendix 1 for the SOC classification). We assume that only a fraction of workers in these occupa-
tions are engaged in the production of intangible capital goods; with the remainder of these
workers engaged in current production (i.e. production of goods and services with a service life
less than a year). Specifically, we assume that 50% of IT workers‟ time, 70% of R&D workers‟
time and 20% of organisational workers‟ time is spent on the production of intangible capital
8
goods (see investment share of labour in Table 3.2). To account for the capital services and ma-
terials that complement this labour in the production of intangible assets we scale the relevant
labour expenditures with the ratio of total production to labour costs in the IT, R&D and Busi-
ness services sectors; SIC 72, 73 and 74 respectively. These are shown as the factor multiplier in
Table 3.2. The product of this factor multiplier and the investment share of labour yields the
combined multiplier in Table 3.2, which is essentially the scaling factor we apply to firms‟ ex-
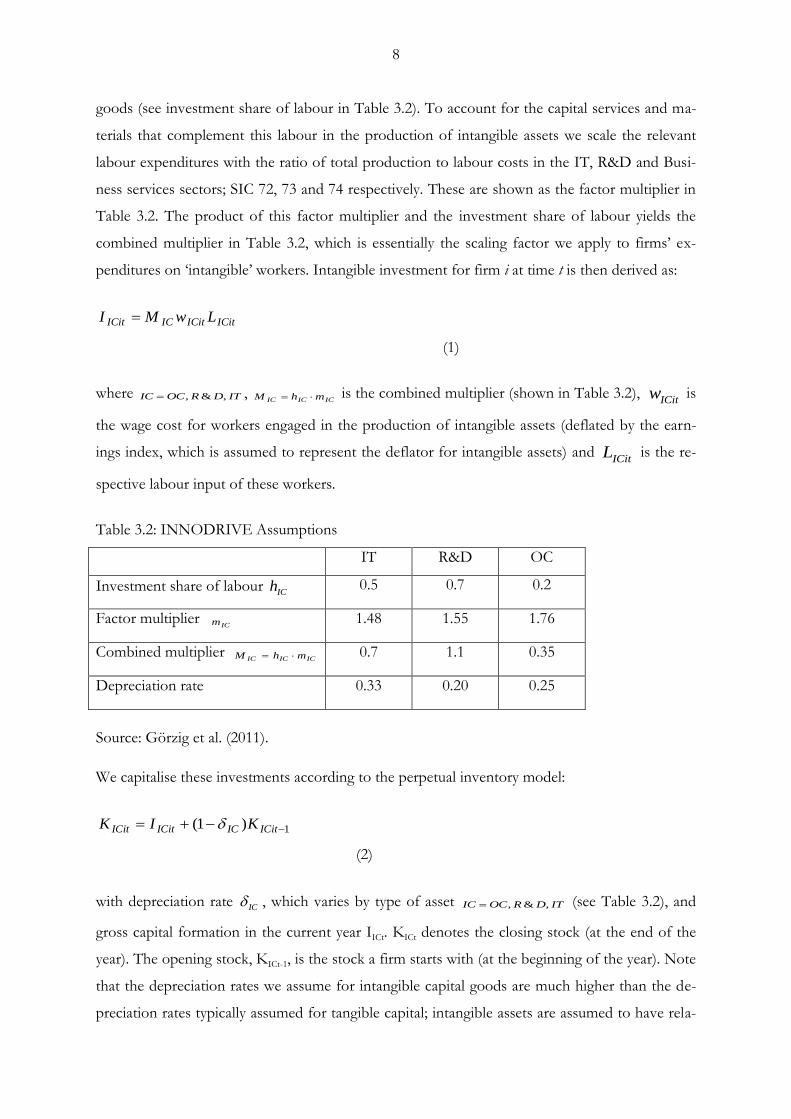
penditures on „intangible‟ workers. Intangible investment for firm i at time t is then derived as:
(1)
where , is the combined multiplier (shown in Table 3.2), is
the wage cost for workers engaged in the production of intangible assets (deflated by the earn-
ings index, which is assumed to represent the deflator for intangible assets) and is the re-
spective labour input of these workers.
Table 3.2: INNODRIVE Assumptions
IT R&D OC
Investment share of labour 0.5 0.7 0.2
Factor multiplier 1.48 1.55 1.76
Combined multiplier 0.7 1.1 0.35
Depreciation rate 0.33 0.20 0.25
Source: Görzig et al. (2011).
We capitalise these investments according to the perpetual inventory model:
(2)
with depreciation rate , which varies by type of asset (see Table 3.2), and
gross capital formation in the current year IICt. KICt denotes the closing stock (at the end of the
year). The opening stock, KICt-1, is the stock a firm starts with (at the beginning of the year). Note
that the depreciation rates we assume for intangible capital goods are much higher than the de-
preciation rates typically assumed for tangible capital; intangible assets are assumed to have rela-
ICitICitICICit LwMI
ITDROCIC ,&, ICICIC mhM ICitw
ICitL
ICh
ICm
ICICIC mhM
1)1( ICitICICitICit KIK
IC ITDROCIC ,&,
9
tively short service lives. For years where firms are absent from the sample investment is con-
structed using a simple linear interpolation. This mostly concerns SMEs (enterprises with less
than 250 employees), which are not required to respond to the Annual Business Inquiry every
year.
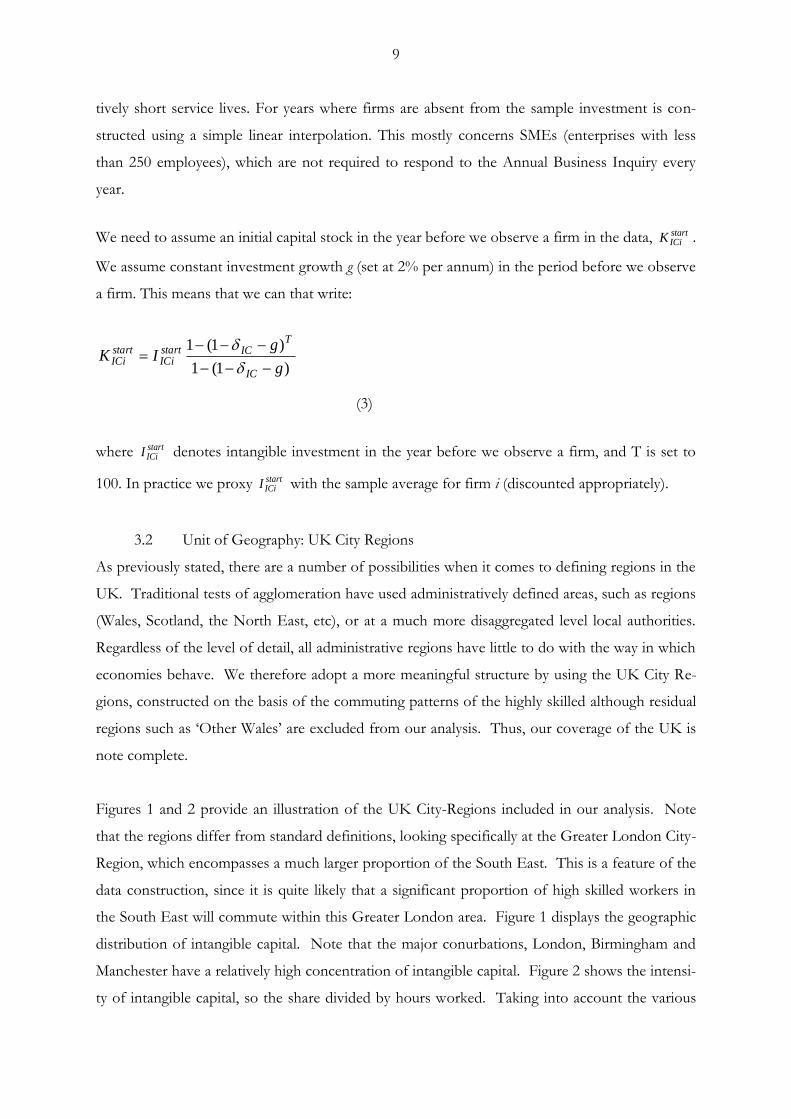
We need to assume an initial capital stock in the year before we observe a firm in the data, .
We assume constant investment growth g (set at 2% per annum) in the period before we observe
a firm. This means that we can that write:
(3)
where denotes intangible investment in the year before we observe a firm, and T is set to
100. In practice we proxy with the sample average for firm i (discounted appropriately).
3.2 Unit of Geography: UK City Regions
As previously stated, there are a number of possibilities when it comes to defining regions in the
UK. Traditional tests of agglomeration have used administratively defined areas, such as regions
(Wales, Scotland, the North East, etc), or at a much more disaggregated level local authorities.
Regardless of the level of detail, all administrative regions have little to do with the way in which
economies behave. We therefore adopt a more meaningful structure by using the UK City Re-
gions, constructed on the basis of the commuting patterns of the highly skilled although residual
regions such as „Other Wales‟ are excluded from our analysis. Thus, our coverage of the UK is
note complete.
Figures 1 and 2 provide an illustration of the UK City-Regions included in our analysis. Note
that the regions differ from standard definitions, looking specifically at the Greater London City-
Region, which encompasses a much larger proportion of the South East. This is a feature of the
data construction, since it is quite likely that a significant proportion of high skilled workers in
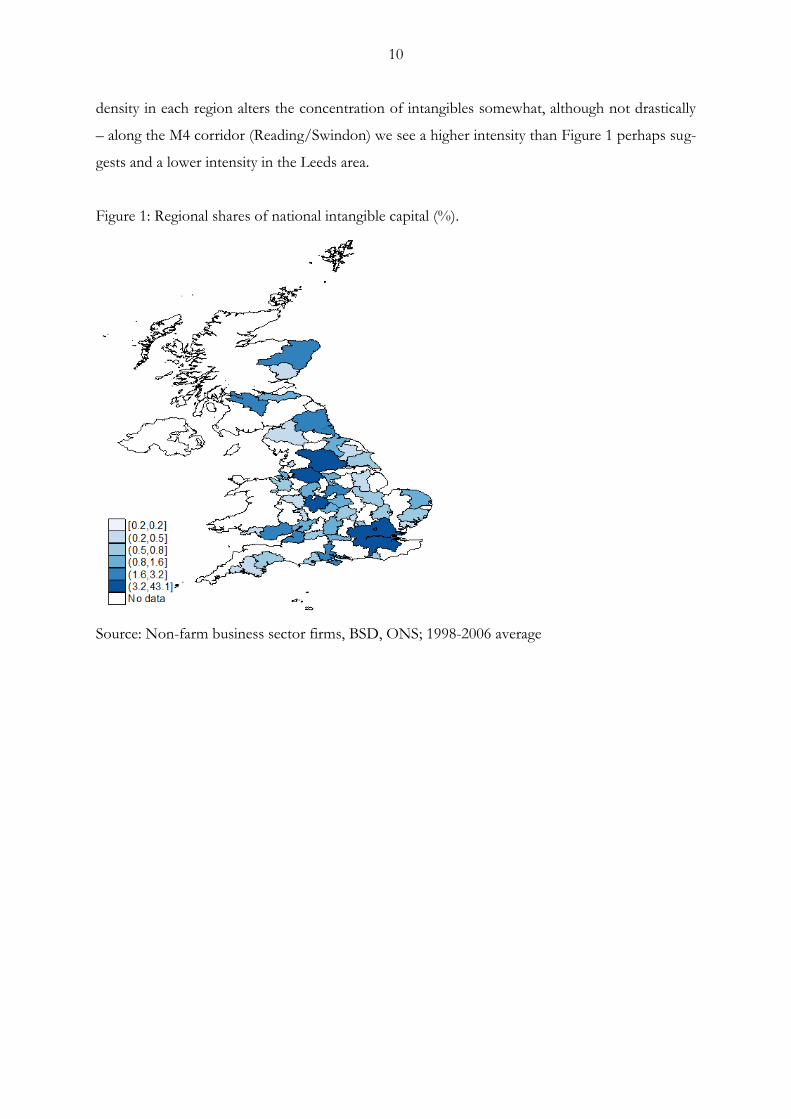
the South East will commute within this Greater London area. Figure 1 displays the geographic
distribution of intangible capital. Note that the major conurbations, London, Birmingham and
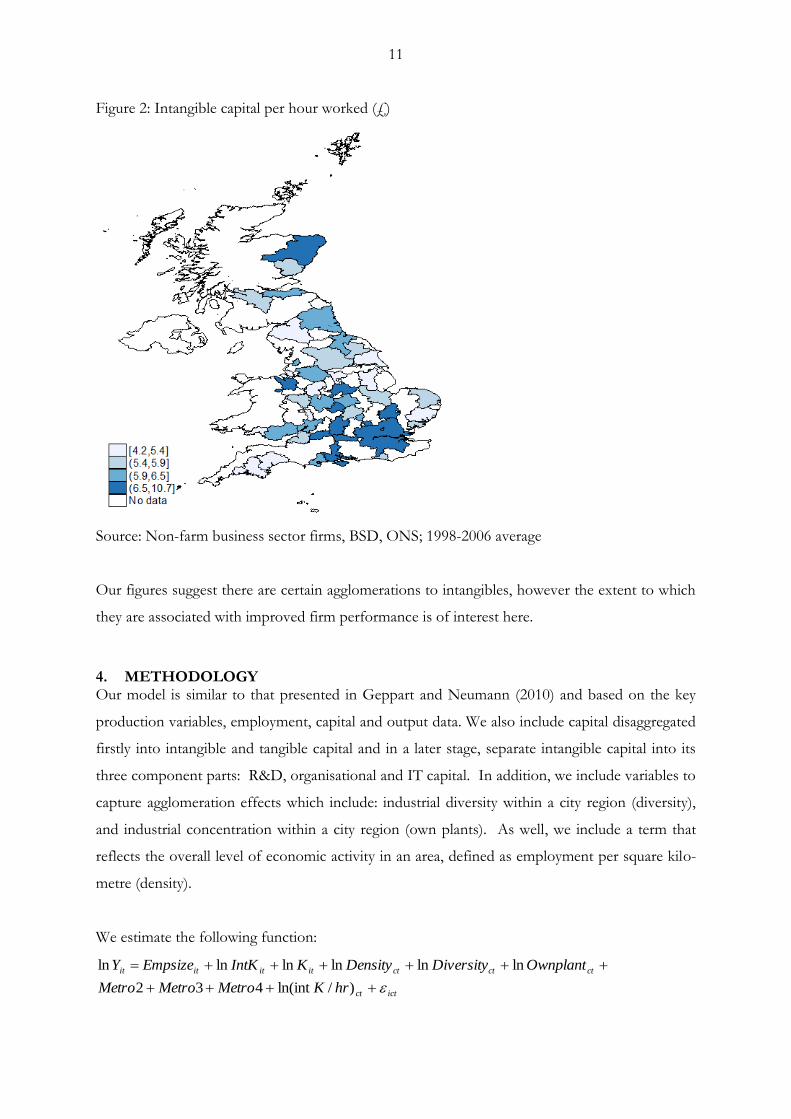
Manchester have a relatively high concentration of intangible capital. Figure 2 shows the intensi-
ty of intangible capital, so the share divided by hours worked. Taking into account the various
startICiK
)1(1
)1(1
g
gIK
IC
TICstart
ICistartICi
startICiI
startICiI
10
density in each region alters the concentration of intangibles somewhat, although not drastically
– along the M4 corridor (Reading/Swindon) we see a higher intensity than Figure 1 perhaps sug-
gests and a lower intensity in the Leeds area.
Figure 1: Regional shares of national intangible capital (%).
Source: Non-farm business sector firms, BSD, ONS; 1998-2006 average
11
Figure 2: Intangible capital per hour worked (£)
Source: Non-farm business sector firms, BSD, ONS; 1998-2006 average
Our figures suggest there are certain agglomerations to intangibles, however the extent to which
they are associated with improved firm performance is of interest here.
4. METHODOLOGY Our model is similar to that presented in Geppart and Neumann (2010) and based on the key
production variables, employment, capital and output data. We also include capital disaggregated
firstly into intangible and tangible capital and in a later stage, separate intangible capital into its
three component parts: R&D, organisational and IT capital. In addition, we include variables to
capture agglomeration effects which include: industrial diversity within a city region (diversity),
and industrial concentration within a city region (own plants). As well, we include a term that
reflects the overall level of economic activity in an area, defined as employment per square kilo-
metre (density).
We estimate the following function:
ictct
ctctctitititit
hrKMetroMetroMetro
OwnplantDiversityDensityKIntKEmpsizeY
)/ln(int432
lnlnlnlnlnln
12
Where Y is one of 4 measures of productivity; either hourly wage, GVA per worker of the hourly
wage of (non) intangible workers by firm i in year t. Employment size band (EmpSize). Capital
is comprised of intangible, constructed as discussed above, and tangible plant and machinery
capital, kindly provided by Richard Harris, constructed as in (Harris and Drinkwater, 2000).
Density is measured as employment per square kilometre. Our measure of urbanisation is cap-
tured in diversity, which is constructed in the following way, following Duranton and Puga,
2005):
∑( )
Following Henderson (2003), we use the number of other own-industry establishments in the
region as a measure of localisation in order to capture industry specific spillovers. We estimate
random effects regressions over the period 1998-2006, across 45 industrial sectors (broadly 2
digit) and across 44 City Regions (excluding „other‟ areas). We cluster on the basis of year and
city regions and include year and sector dummies, as well as year*sector to pick up any business
cycle effects.
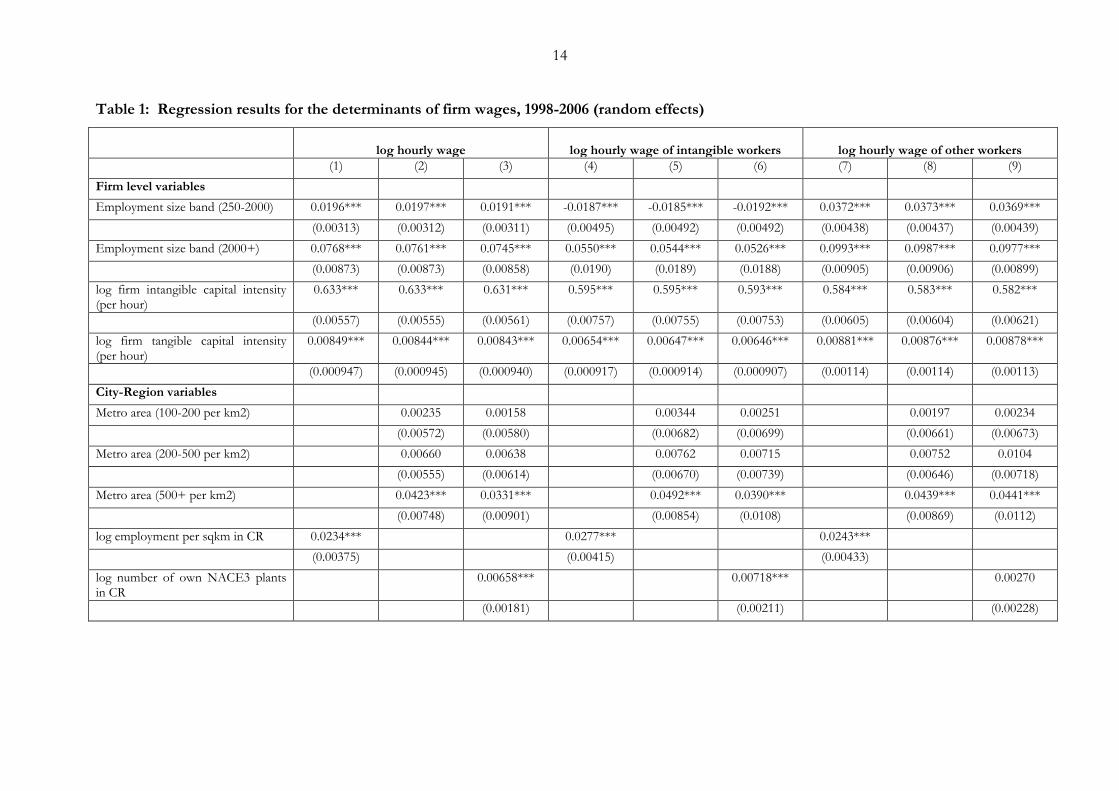
5. RESULTS
In table 1 we present the findings from the wage equations. Columns 1 to 3 relate to the log
hourly wage. Here we see that the firm level variables behave in line with expectations in all
specifications. Hourly wages are positively related to employment size (the excluded category is
those firms employing less than 250 workers). We see that intangible capital intensity is highly
significantly positive; this is also true for tangible capital.2 We concentrate on the City-Region
variables in order to identify the potential for spillovers, but the inclusion of the City-Region var-
iables do not detract from the coefficients at the firm level, which remain the same over the vari-
ous specifications. We see in model (2) that the standard measure of agglomeration – the em-
ployment density – is significant and positive in our baseline model (1). In model (2) we band
density into 4 groups. The excluded group here are the least dense areas, with less than 100 em-
2 Relative to the tangible capital, the coefficients on intangible capital intensity are large. This is in part due to the fact that we do not control here for labour quality, and given that intangible capital is knowledge worker intensive, the measure is likely to be combination of these two factors. In addition, we acknowledge that our tangible capital measure relates only to plant and machinery capital. These limitations are corrected for elsewhere and are not the focus of this analysis.
13
ployees per square kilometre. This reveals that for the less dense areas, agglomerations are not
significant. However, where there are more than 500 employees per square kilometre, there is a
clear indication of positive agglomeration economies. This suggests that the intensity of cluster-
ing has to be quite high before benefits from collocation pay off.
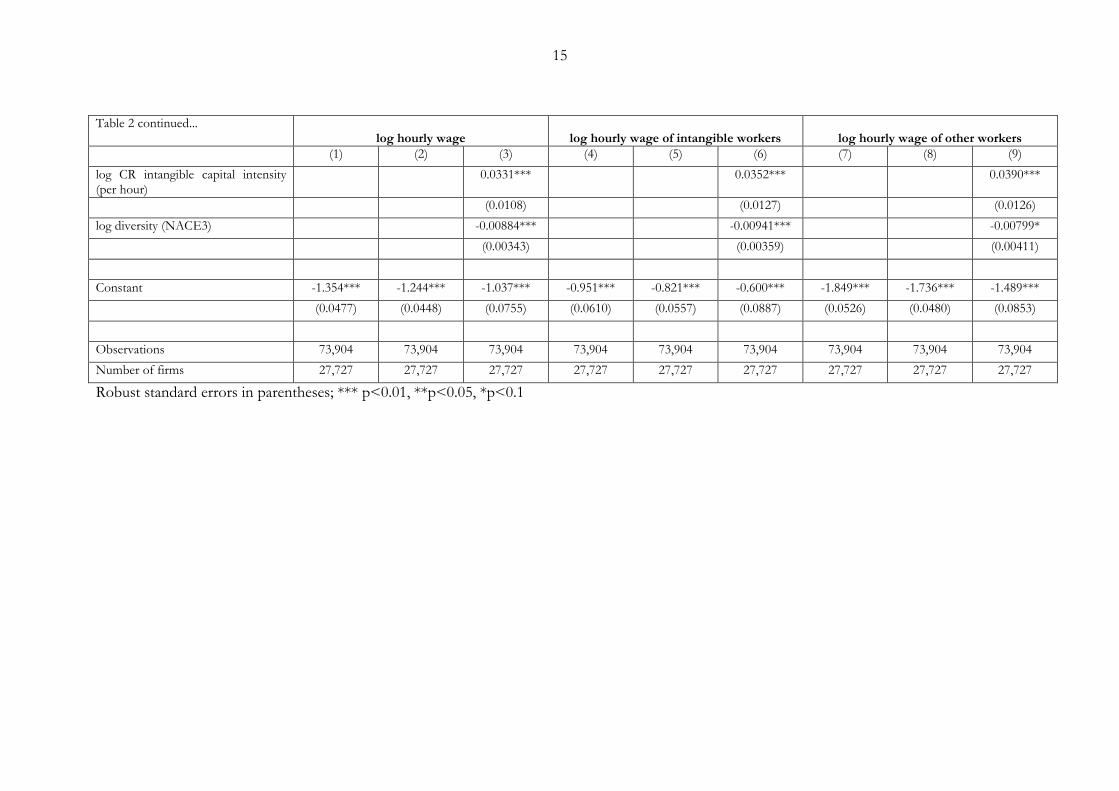
If we turn to the results in model (3), we are able to consider the role of additional factors at the
City-Region level, including intangible capital intensity. The inclusion of the additional factors
reduces the value of the coefficient attached to the standard measure of agglomeration, however
it is still positive and highly significant. We find that being located in a City-Region that has a
concentration of firms in the same NACE3 industry has a significantly positive association with
hourly wages and conversely, the diversity of sectors in the City-Region has a significantly nega-
tive association. The coefficient attached to the intangible capital intensity in the City-Region is
significant and positive. This indicates that there is a clear, positive association between higher
hourly wages and the level of intangible capital in the city-region.
Of course, there is a danger that this association could be regarded as evidence of complementa-
rity between workers and not of significant gains from higher regional levels intangible capital.
For this reason, models (4) to (9) separate the hourly wages of intangible workers (models (4) to
(6)) from those of other workers (models (7) to (9)). Firm level variables behave similarly to the
aggregate model, except in the case of the employment size band for intangible workers....this
implies a negative association with the log hourly wages of intangible workers in medium sized
firms. Considering the City-Region effects, in the case of other workers, we do not observe sig-
nificant effects on own sector concentration or diversity, although diversity is significant at the
10 per cent level of significance – still, the effect is weaker. In the case of intangible workers, all
spillover variables behave as they did in the aggregated hourly wage specification, which slightly
larger coefficients, so the association with the wages of the intangible workers is more marked.
14
Table 1: Regression results for the determinants of firm wages, 1998-2006 (random effects)
log hourly wage
log hourly wage of intangible workers
log hourly wage of other workers
(1) (2) (3) (4) (5) (6) (7) (8) (9)
Firm level variables
Employment size band (250-2000) 0.0196*** 0.0197*** 0.0191*** -0.0187*** -0.0185*** -0.0192*** 0.0372*** 0.0373*** 0.0369***
(0.00313) (0.00312) (0.00311) (0.00495) (0.00492) (0.00492) (0.00438) (0.00437) (0.00439)
Employment size band (2000+) 0.0768*** 0.0761*** 0.0745*** 0.0550*** 0.0544*** 0.0526*** 0.0993*** 0.0987*** 0.0977***
(0.00873) (0.00873) (0.00858) (0.0190) (0.0189) (0.0188) (0.00905) (0.00906) (0.00899)
log firm intangible capital intensity (per hour)
0.633*** 0.633*** 0.631*** 0.595*** 0.595*** 0.593*** 0.584*** 0.583*** 0.582***
(0.00557) (0.00555) (0.00561) (0.00757) (0.00755) (0.00753) (0.00605) (0.00604) (0.00621)
log firm tangible capital intensity (per hour)
0.00849*** 0.00844*** 0.00843*** 0.00654*** 0.00647*** 0.00646*** 0.00881*** 0.00876*** 0.00878***
(0.000947) (0.000945) (0.000940) (0.000917) (0.000914) (0.000907) (0.00114) (0.00114) (0.00113)
City-Region variables
Metro area (100-200 per km2) 0.00235 0.00158 0.00344 0.00251 0.00197 0.00234
(0.00572) (0.00580) (0.00682) (0.00699) (0.00661) (0.00673)
Metro area (200-500 per km2) 0.00660 0.00638 0.00762 0.00715 0.00752 0.0104
(0.00555) (0.00614) (0.00670) (0.00739) (0.00646) (0.00718)
Metro area (500+ per km2) 0.0423*** 0.0331*** 0.0492*** 0.0390*** 0.0439*** 0.0441***
(0.00748) (0.00901) (0.00854) (0.0108) (0.00869) (0.0112)
log employment per sqkm in CR 0.0234*** 0.0277*** 0.0243***
(0.00375) (0.00415) (0.00433)
log number of own NACE3 plants in CR
0.00658*** 0.00718*** 0.00270
(0.00181) (0.00211) (0.00228)
15
Table 2 continued... log hourly wage
log hourly wage of intangible workers
log hourly wage of other workers
(1) (2) (3) (4) (5) (6) (7) (8) (9)
log CR intangible capital intensity (per hour)
0.0331*** 0.0352*** 0.0390***
(0.0108) (0.0127) (0.0126)
log diversity (NACE3) -0.00884*** -0.00941*** -0.00799*
(0.00343) (0.00359) (0.00411)
Constant -1.354*** -1.244*** -1.037*** -0.951*** -0.821*** -0.600*** -1.849*** -1.736*** -1.489***
(0.0477) (0.0448) (0.0755) (0.0610) (0.0557) (0.0887) (0.0526) (0.0480) (0.0853)
Observations 73,904 73,904 73,904 73,904 73,904 73,904 73,904 73,904 73,904
Number of firms 27,727 27,727 27,727 27,727 27,727 27,727 27,727 27,727 27,727
Robust standard errors in parentheses; *** p<0.01, **p<0.05, *p<0.1
16
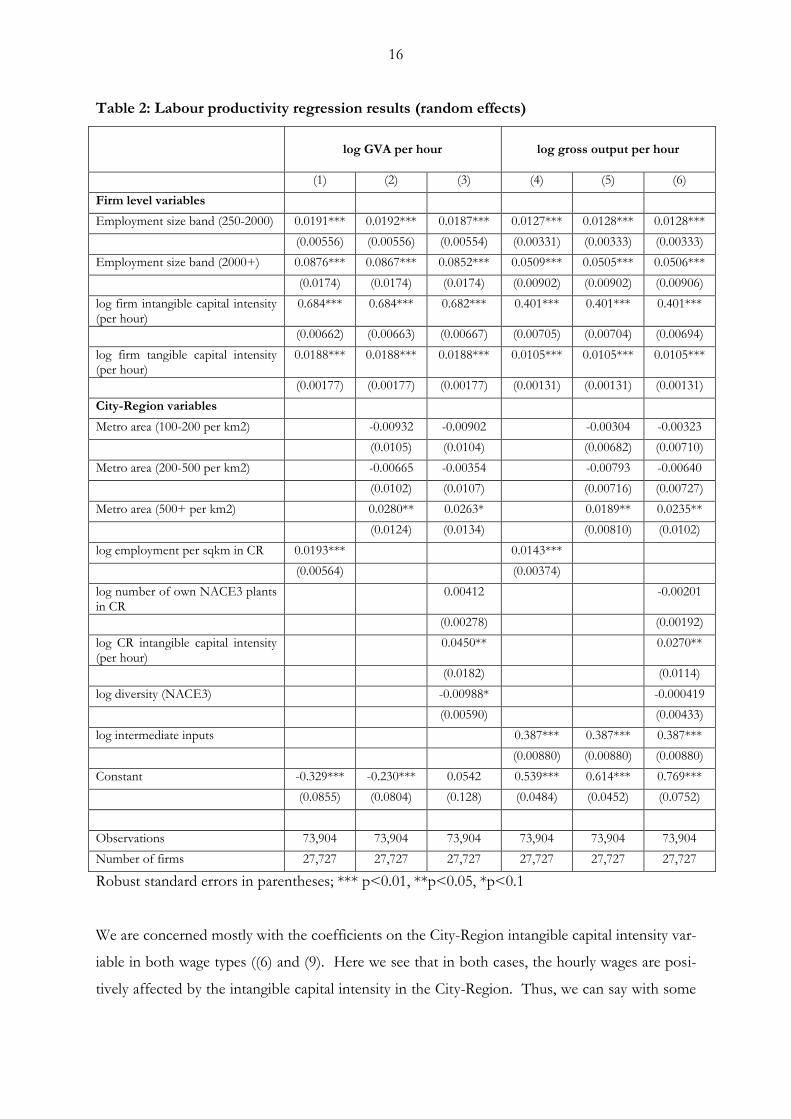
Table 2: Labour productivity regression results (random effects)
log GVA per hour
log gross output per hour
(1) (2) (3) (4) (5) (6)
Firm level variables
Employment size band (250-2000) 0.0191*** 0.0192*** 0.0187*** 0.0127*** 0.0128*** 0.0128***
(0.00556) (0.00556) (0.00554) (0.00331) (0.00333) (0.00333)
Employment size band (2000+) 0.0876*** 0.0867*** 0.0852*** 0.0509*** 0.0505*** 0.0506***
(0.0174) (0.0174) (0.0174) (0.00902) (0.00902) (0.00906)
log firm intangible capital intensity (per hour)
0.684*** 0.684*** 0.682*** 0.401*** 0.401*** 0.401***
(0.00662) (0.00663) (0.00667) (0.00705) (0.00704) (0.00694)
log firm tangible capital intensity (per hour)
0.0188*** 0.0188*** 0.0188*** 0.0105*** 0.0105*** 0.0105***
(0.00177) (0.00177) (0.00177) (0.00131) (0.00131) (0.00131)
City-Region variables
Metro area (100-200 per km2) -0.00932 -0.00902 -0.00304 -0.00323
(0.0105) (0.0104) (0.00682) (0.00710)
Metro area (200-500 per km2) -0.00665 -0.00354 -0.00793 -0.00640
(0.0102) (0.0107) (0.00716) (0.00727)
Metro area (500+ per km2) 0.0280** 0.0263* 0.0189** 0.0235**
(0.0124) (0.0134) (0.00810) (0.0102)
log employment per sqkm in CR 0.0193*** 0.0143***
(0.00564) (0.00374)
log number of own NACE3 plants in CR
0.00412 -0.00201
(0.00278) (0.00192)
log CR intangible capital intensity (per hour)
0.0450** 0.0270**
(0.0182) (0.0114)
log diversity (NACE3) -0.00988* -0.000419
(0.00590) (0.00433)
log intermediate inputs 0.387*** 0.387*** 0.387***
(0.00880) (0.00880) (0.00880)
Constant -0.329*** -0.230*** 0.0542 0.539*** 0.614*** 0.769***
(0.0855) (0.0804) (0.128) (0.0484) (0.0452) (0.0752)
Observations 73,904 73,904 73,904 73,904 73,904 73,904
Number of firms 27,727 27,727 27,727 27,727 27,727 27,727
Robust standard errors in parentheses; *** p<0.01, **p<0.05, *p<0.1
We are concerned mostly with the coefficients on the City-Region intangible capital intensity var-
iable in both wage types ((6) and (9). Here we see that in both cases, the hourly wages are posi-
tively affected by the intangible capital intensity in the City-Region. Thus, we can say with some
17
confidence that our findings are not simply a reflection of labour complementarity but do seem
to reflect the presence of positive spillovers to regional concentrations of intangible capital.
Table 2 provides estimates of determinants of labour productivity measures (GVA per hour and
gross output per hour). Our firm level variables behave consistently, all are positive and signifi-
cant and once again we observe dominance of intangible capital over tangible capital. Model (1)
includes the standard density variable to capture agglomeration economies. We see that this is
significant and positive. When we include a more banded measure of density it again becomes
apparent that this is driven by economies in the most densely populated areas.
Model (3) incorporates variables to capture diversity and specialisation, along with our intangible
intensity in the City-Region. We note here than specialisation (number of plants from the same
NACE3) in the City-Region does not appear to significantly affect labour productivity. Diversity
is observed to have a negative and significant effect only at the 10 per cent level of significance.
At the 5 per cent level of significance, we see that intangible capital intensity in the City-Region is
again positive. Our gross output specification reveals a similar picture (models (4) to (6)) how-
ever, we note that diversity is no longer weakly significant. Note that incorporating intermediate
inputs reduces the magnitude of the firm level intangible capital intensity coefficient suggesting
that this measure is proxying for a number of missing variables.
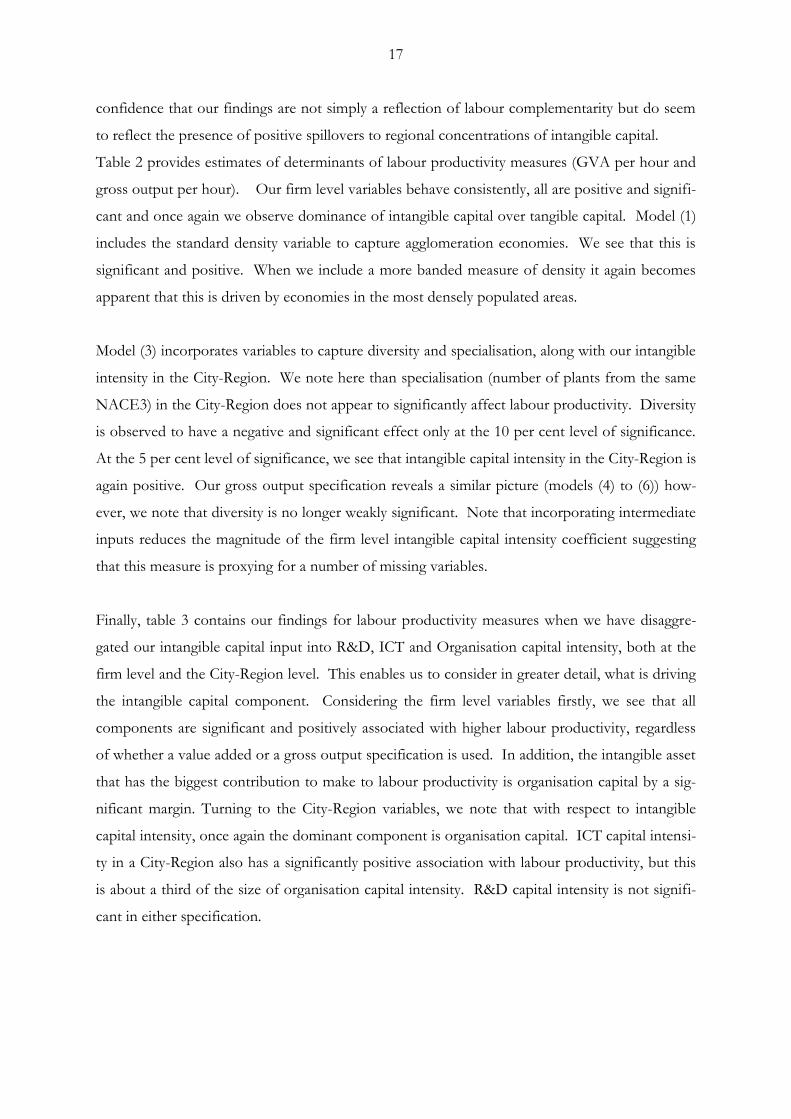
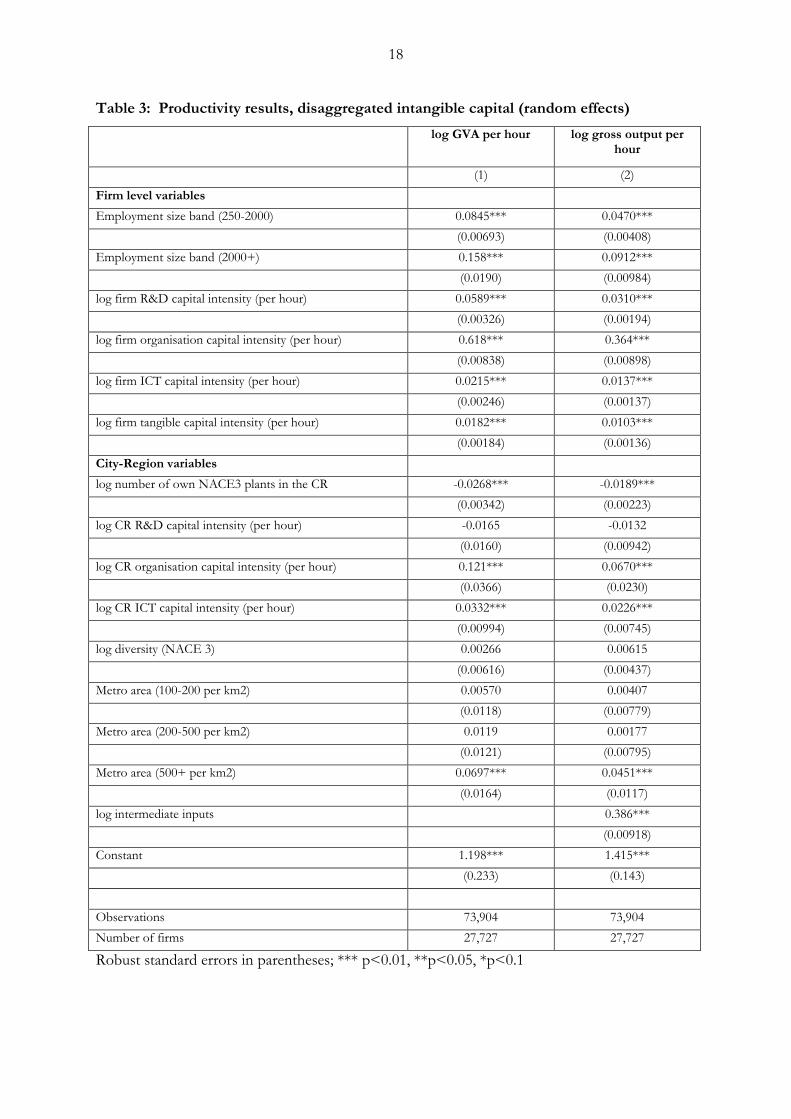
Finally, table 3 contains our findings for labour productivity measures when we have disaggre-
gated our intangible capital input into R&D, ICT and Organisation capital intensity, both at the
firm level and the City-Region level. This enables us to consider in greater detail, what is driving
the intangible capital component. Considering the firm level variables firstly, we see that all
components are significant and positively associated with higher labour productivity, regardless
of whether a value added or a gross output specification is used. In addition, the intangible asset
that has the biggest contribution to make to labour productivity is organisation capital by a sig-
nificant margin. Turning to the City-Region variables, we note that with respect to intangible
capital intensity, once again the dominant component is organisation capital. ICT capital intensi-
ty in a City-Region also has a significantly positive association with labour productivity, but this
is about a third of the size of organisation capital intensity. R&D capital intensity is not signifi-
cant in either specification.
18
Table 3: Productivity results, disaggregated intangible capital (random effects)
log GVA per hour log gross output per hour
(1) (2)
Firm level variables
Employment size band (250-2000) 0.0845*** 0.0470***
(0.00693) (0.00408)
Employment size band (2000+) 0.158*** 0.0912***
(0.0190) (0.00984)
log firm R&D capital intensity (per hour) 0.0589*** 0.0310***
(0.00326) (0.00194)
log firm organisation capital intensity (per hour) 0.618*** 0.364***
(0.00838) (0.00898)
log firm ICT capital intensity (per hour) 0.0215*** 0.0137***
(0.00246) (0.00137)
log firm tangible capital intensity (per hour) 0.0182*** 0.0103***
(0.00184) (0.00136)
City-Region variables
log number of own NACE3 plants in the CR -0.0268*** -0.0189***
(0.00342) (0.00223)
log CR R&D capital intensity (per hour) -0.0165 -0.0132
(0.0160) (0.00942)
log CR organisation capital intensity (per hour) 0.121*** 0.0670***
(0.0366) (0.0230)
log CR ICT capital intensity (per hour) 0.0332*** 0.0226***
(0.00994) (0.00745)
log diversity (NACE 3) 0.00266 0.00615
(0.00616) (0.00437)
Metro area (100-200 per km2) 0.00570 0.00407
(0.0118) (0.00779)
Metro area (200-500 per km2) 0.0119 0.00177
(0.0121) (0.00795)
Metro area (500+ per km2) 0.0697*** 0.0451***
(0.0164) (0.0117)
log intermediate inputs 0.386***
(0.00918)
Constant 1.198*** 1.415***
(0.233) (0.143)
Observations 73,904 73,904
Number of firms 27,727 27,727
Robust standard errors in parentheses; *** p<0.01, **p<0.05, *p<0.1
19
There are a number of alternatives or refinements that we might try in order to test the robust-
ness of our findings. Firstly, we test whether our findings are sensitive to the sample period cho-
sen by analysing the results across different time periods within the overall period. Our findings
indicate that our results are robust to sample period changes. Reported results are generated us-
ing a random effects estimator. As an additional sensitivity check we run the same regressions
using OLS. In comparison to the random effects coefficients, the OLS coefficients point to a
larger effect of regional intangible capital intensity on firm productivity, and a smaller effect of
own-firm intangible capital intensity. Using OLS, the association between firms' productivity
and regional R&D becomes negative and statistically significant. However, we find there to be a
positive association between a firm's productivity and regional IT and organisation capital, in line
with the results presented above, and the associations are not negligible.
When we including firm-level fixed effects, we find no evidence of agglomeration effects. This is
not surprising as these fixed effects essentially remove all variation in the regional variables (be-
cause firms do not tend to move very frequently, and because we also control for all industry-
year interactions (NACE 2 level)). Indeed, 94 per cent of the variation in the City-Region level
variables can be explained by City-Region and year dummies alone, suggesting that the fixed ef-
fects estimator is less appropriate for our purposes. Firm-level intangible capital remains statisti-
cally significant. Similarly, when we include City-Region fixed effects we find no evidence of ag-
glomeration economies. However, in some instances we then find a statistically significant nega-
tive association between City-Region intangible capital intensity and firm-level wages. This may
be picking up a regional labour supply effect. In other words, in City Regions where intangible
capital intensity is rising relatively quickly (and hence the supply of high-skilled labour is rising
quickly), we observe a reduction in average labour costs (once we control for firm-level intangi-
bles).
We model the association between regional intangible capital and firm-level productivity, con-
trolling for firm-level intangible capital. We are unable to say whether the positive associations
we find between regional intangible capital and firm-level productivity arise because of spillover
effects from the local environment to the firm or because high productivity firms, that are highly
productive for reasons that we do not observe in the data, are drawn to City Regions with high
levels of intangible assets, for example. As an attempt to get at the causal nature of the relation-
ship we discuss, we instrument City-Region intangible capital intensity with lagged City-Region
intangible capital intensity (3-5 year lags). Our findings are not dramatically different from
20
those reported above. However, we acknowledge that lagged values are not the strongest instru-
ments, given the persistence over time in the regional distribution of intangibles.
6. CONCLUSIONS
The benefits to co-location have long been recognised however evidence on the channels
through which these spillovers operate have been frustratingly vague. In this paper, we analyse
these by using a firm level dataset and combining data to construct City-Region level measures
that not only incorporate ways in which these agglomerations might occur; through the work-
force (density), through clusters of firms from the same or similar industries or through diversity
in the local area.
Our analysis shows that there is evidence supporting the existence of agglomeration spillovers in
the UK, 1998-2006 but that the regions have to be pretty concentrated to feel benefits in the
form of higher productivity. We find that firms in the most densely populated City Regions pay
higher wages (around 4 per cent above average) and are around 2.5 per cent more productive
than average.
Including City-Region intangible capital intensity in the equation has a significant and positive
effect over and above that of agglomeration, suggesting that there are spillovers to intangible
capital also. When we break intangible capital into its components, we see that the lion‟s share
of this is attributable to organisation capital. It is interesting to note that we observe much less
evidence of spillovers to R&D than any other form of intangible capital. Our findings are gener-
ally consistent with those in Germany and Finland (see Geppart and Neumann, 2010; Piekkola
and Lintamo, 2011).
Whilst encouraging, at present, given the nature of the data, we can only provide indicative asso-
ciations. With improved time series we would hope to deal with selection and endogeity issues.
Moreover, it is important to note that the measure of intangible capital used here is based on
firms‟ own account production, not purchased intangibles. We also acknowledge that the indica-
tor we use to capture intangible capital is likely to be bound up with human capital. Disentan-
gling these effects at a regional level is not straightforward but is the sensible next step in our
research agenda.
21
REFERENCES
Abramovsky, L., R. Griffith, G. Macartney, H. Miller (2008) „The Location of Innovative Activi-
ty in Europe‟, IFS Working Paper, WP08/10.
Artis, M., E. Miguelez and R. Moreno (2009) „Assessing Agglomeration Economies in a Spatial
Framework with Endogenous Regressors‟, SERC Discussion Paper 23.
Atkeson, A. and P. J. Kehoe (2002) „Measuring Organization Capital‟, NBER Working Paper
8722.
Audretsch D. and E. Lehmann (2006) „Do Locational Spillovers Pay? Empirical Evidence from
German IPO Data‟, Economics of Innovation and New Technology, 15(1), 71-81.
Becker, G. S. (1993) Human Capital: A theoretical and empirical analysis, with special reference to education,
3rd Edition, Chicago, University of Chicago Press
Ciccone (2002) „Agglomeration effects in Europe‟ European Economic Review, 46, 213-227.
Corrado, C., C. Hulten and D. Sichel (2009) „Intangible Capital and Economic Growth‟, Review of
Income and Wealth, 55(3), 686-716.
Devereux, M. R. Griffith and H. Simpson (2004) The Geographic Distribution of Production
Activity in the UK‟, Regional Science and Urban Economics, 34 (5), 533-564.
Duranton, G., Puga, D. (2001): Nursery Cities: Urban Diversity, Process Innovation, and the
Life Cycle of Products. American Economic Review, 91, 1454-1477
Ellison and Glaeser (1997) „Geographic Concentration in US Manufacturing: A Dartboard Ap-
proach‟, Journal of Political Economy, 105 (5), 889-927.
Geppart, K. and A. Neumann (2010) „Regional Patterns of Intangible Capital, Agglomeration
Effects and Localised Spillovers in Germany‟, INNODRIVE Working Paper 9.
Giorgio Marrano, M., J. Haskel and G. Wallis (2009) „What Happened to the Knowledge Econ-
omy? ICT, Intangible Investment and Britain‟s Productivity Record Revisited‟, Review of
Income and Wealth, 55(3), 686-716.
Görzig, B., H. Piekkola and Riley, R. (2011) „Production of intangible investment and growth:
Methodology in Innodrive‟, Innodrive working paper No. 1.
Harris, R. I. D. and S. Drinkwater (2000) „UK Plant and Machinery Capital Stocks and Plant Clo-
sures‟, Oxford Bulletin of Economics and Statistics, 62, 239-261
22
Haskel, J., P. Goodridge, A. Pesole, G. Awano, M. Franklin and Z. Kastrinaki (2011) „Driving
Economic Growth. Innovation, knowledge spending and productivity growth in the
UK‟, NESTA Index Report, January, 2011.
Henderson, J. V. (2003) „Marshall‟s Scale Economies‟ Journal of Urban Economics, 53, 1-28
Jaffe, A. (1986) „Technological Opportunity and Spillovers of R&D: Evidence from Firms' Pa-
tents, Profits, and Market Value‟, American Economic Review, 76(5), 984-1001
Jacobs, J. (1968) Cities and the Wealth of Nations. Vintage, New York, NY.
Krugman, P. (1998) „What‟s new about New Economic Geography?‟, Oxford Review of Economic
Policy, 14(2),
Lev B. (2001) Intangibles: Management, Measurement and Reporting, The Brookings Institution Press.
Lev B. and S. Radhakrishnan (2005) „The Valuation of Organization Capital.‟ In Corrado,
Haltiwanger, and Sichel (eds.) Measuring Capital in a New Economy. Chicago: National Bu-
reau of Economic Research and University of Chicago Press
Marshall, A. (1890) Principles of Economics, Macmillan, London.
Moreno. R.. R. Paci and S. Usai (2006) „Spatial Spillovers and Innovation activity in European
Regions‟, Environment and Planning A, 37, 1793-1812.
Piekkola, H. (2010) „Innovativeness and Intangibles: The Case of Finland‟, INNODRIVE
Working Paper
Piekkola, H. and M Lintamo (2011) „Intangible capital agglomeration and economic growth in
Finland‟ INNODRIVE Working Paper.
Rice, P., A. J. Venebles, E. Patacchini (2006) „Spatial determinants of Productivity: Analysis for
the regions of Great Britain‟, Regional Science and Urban Economics, 36, 727-752.
Riley, R. and C. Robinson (2011) „UK Economic Performance: How Far do Intangibles Count?‟,
Innodrive Working Paper 14.
Robson, B., R. Barr, M. Coombes, K. Lymperopoulou amd J. Rees (2006) „A Framework for
City-Regions: Working Paper 1, Mapping City-Regions, London, Office of the Deputy
Prime Minister (ODPM).
Rosenthal, S. S. and W. C. Strange, (2004), „Evidence on the nature and sources of agglomeration
Economies in Henderson and Thisse, Handbook in Urban and Regional Economics, Vol. 4.

23
Swann, G.M.P. (1996), „Technology Evolution and the Rise and Fall of Industrial Clusters‟, Revue
Internationale de Systemique, 10 (3), 285-302.
Veblen, T. (1908) „On the nature of capital: Investment, intangible assets, and the pecuniary
magnate‟, Quarterly Journal of Economics, 23(1), 104-136

24
Appendix 1: Appendix: List of City-Regions
1 "Birmingham /Sandwell/Wolverhampton" 2 "Bournemouth/Poole" 3 "Brighton/Hove" 4 "Bristol/S. Gloucestershire" 5 "Cambridge" 6 "Carlisle" 7 "Chester" 8 "Colchester" 9 "Coventry" 10 "Exeter" 11 "Greater London" 12 "Gloucester/Cheltenham" 13 "Ipswich" 14 "Kingston upon Hull" 15 "Leeds/Bradford" 16 "Leicester" 17 "Lincoln" 18 "Liverpool" 19 "Luton" 20 "Manchester/Salford/Trafford" 21 "Middlesbrough/Stockton" 22 "Milton Keynes" 23 "Newcastle/Gateshead/Sunderland" 24 "Northampton" 25 "Norwich" 26 "Nottingham/Derby" 27 "Oxford" 28"Peterborough"
29 "Plymouth" 30 "Portsmouth/Southampton" 31 "Preston" 32 "Reading" 33 "Sheffield" 34 "Stoke on Trent" 35 "Swindon" 36 "Telford and Wrekin" 37 "Worcester" 38 "York" 39 "Cardiff" 40 "Swansea" 41 "Aberdeen" 42 "Dundee" 43 "Edinburgh" 44 "Glasgow" 45 "Belfast" 46 "Other NE" 47 "Other NW" 48 "Other Y&H" 49 "Other EM" 50 "Other WM" 51 "Other Eastern" 52 "Other SE" 53 "Other SW" 54 "Other Wales" 55 "Other Scotland" 56 "Other NI"