Embed Size (px)
Citation preview
Do knowledge spillovers promote the co-agglomeration between national and
multinational firms?
Sergio Mariotti*, Lucia Piscitello**°, Stefano Elia***
*DIG-Politecnico di Milano, Piazza L. da Vinci, 32 – 20133 MILANO; email: [email protected]
**DIG-Politecnico di Milano, Piazza L. da Vinci, 32 – 20133 MILANO; email: [email protected]
***DIG-Politecnico di Milano, Piazza L. da Vinci, 32 – 20133 MILANO; email: [email protected]
°corresponding author
1
Spatial agglomeration of MNEs:
The role of information externalities and knowledge spillovers
Abstract
This study suggests a model for the agglomerative behaviour of MNEs with local competitors.
Relying on foreign MNEs’ spatial distribution across 686 Italian Local Labor Systems, we
find that MNEs’ locational behaviour is influenced by (i) informational externalities, giving
rise to locational cascades and imitation of other foreign MNEs, and (ii) potential knowledge
spillovers, which might act both as a centrifugal and a centripetal force, depending on the
nature of local counterparts. Specifically, foreign MNEs tend not to agglomerate with local
domestic companies as they perceive potential knowledge inflows to be lower than potential
leakages, unless local companies enjoy some comparative advantages. Conversely, foreign
MNEs’ are willing to agglomerate with other foreign MNEs, as they bet on a positive balance
between knowledge inflows and outflows.
Key words: MNEs’ location choice, agglomeration, information externalities, knowledge
spillovers
JEL classifications: F23, L11, R12, R30
2
1. Introduction
The spatial behaviour of MNEs has significant implications for regional and local
development because of the scale of FDI operations undertaken by MNEs in all industrial and
commercial sectors. According to the latest World Investment Report 2008 (Unctad, 2008),
global FDI inflows has reached the level of $1,833 billion in 2007, and policy makers are
continuing in their efforts to make the investment climate more attractive so that the overall
trend to inward FDI remains one of great openness. Within this contexts, it becomes crucial to
understand and predict the spatial decisions of MNEs.
The study of the concentration of economic activity in geographical space has long
intellectual roots, leading back to Marshall (1920). Traditional location theory was mainly
concerned with the firm’s need to achieve economies of scale, while simultaneously
minimising cross-border and other transportation costs. However, advances in transport and
communication technologies, the rapid developments in the global economy (Dunning, 2009)
as well as the evolution of capabilities and strategies of MNEs towards asset-augmenting and
competence creating investment (Cantwell and Mudambi, 2005) require adjustments to be
made to these explanations. In particular, partly because of the shift in the global
environment, firm-specific advantages have to be considered increasingly interconnected with
location-specific ones (Cantwell, 2009) so that in order to analyze the MNE location problem
properly, it is necessary to consider both the organizational and the locational choices together
(McCann and Mudambi, 2004). Indeed, while receiving knowledge spillovers, firms may also
serve as potential knowledge sources, depending on the local context and local companies
relative characteristics (Alcacer and Chung, 2007).
Within this context, we propose a model for interpreting the location behaviour of MNEs as
respect to the local (either foreign or domestic) competitors, at the industrial level. Extending
the traditional approach à la Ellison and Glaeser (1997), where firms locate near one another
3
as proximity reduces transportation costs for goods, people and ideas, we claim that (i)
geographical proximity alone does not suffice to generate agglomeration economies, and
therefore, interaction between actors; and (ii) interaction does not necessarily lead to positive
spillovers. Specifically, foreign MNEs’ locational behaviour is influenced by two types of
externalities and spillovers (Vicente and Suire, 2007). On the one hand, informational
externalities and observational learning give rise to locational cascades leading MNEs to
imitate (and therefore, agglomerate with) other foreign MNEs, which have already faced the
problems related to their being unfamiliar with the local context. On the other hand, potential
knowledge externalities and spillovers, associated to interactive learning, might act both as a
centrifugal and a centripetal force. In fact, a number of recent studies have recognized that
individual firms interact differently with local networks, as well as experiencing different
degrees of knowledge inflows and outflows with these networks, and they have stressed that
local competitive interaction may offset the potential attractions of knowledge spillovers
(Shaver and Flyer, 2000; Chung and Kalnins, 2001; Aharanson et al., 2007; Alcacer and
Chung, 2007). Therefore, to study the overall impact of potential spillovers on the locational
behaviour of MNEs it is necessary to examine knowledge inflows and knowledge outflows
(leakages) simultaneously.
In particular, MNEs’ subsdiaries might undertake a range of roles (McCann and Mudambi,
2007) going from competence exploitation to competence creation (Cantwell and Mudambi,
2005; Belderbos and Sleuweaegen, 2007; Cantwell and Piscitello, 2007). Specifically,
competence exploiting subsidiaries simply adapt to the local context lines of capabilities
already existing within their parent companies; hence, they have little to gain and much to
lose from co-locating with local firms. Conversely, competence creating subsidiaries aim at
creating new sources of competitive advantage for their parent companies, and are normally
located in countries/local contexts close to the innovation frontier where domestic firms and
4
specific domestic sectors are likely to possess valuable knowledge also for foreign MNEs
(Singh, 2007). However, the majority of MNEs’ subsidiaries continue to focus on incremental
adaptation of their parent firm’s products for the local markets (Kuemmerle, 1999; Frost et
al., 2002), they particularly suffer the risk of technological leakages, i.e. that their technology
will fall into the hands of local competitors (Sanna Randaccio and Veugelers, 2007).
However, knowledge outflows (leakages) might be smoothed (or even counterbalanced)
whenever local companies do perform a comparative international advantage in that sector. If
this is the case, as in Singh (2007), knowledge outflows from host domestic firms to MNE
subsidiaries exceed knowledge inflows from MNE subsidiaries to host country firms.
In order to assess the role of information and knowledge spillovers on the agglomerative
behaviour of foreign MNEs with other foreign MNEs and/or local domestic companies, we
develop and empirical analysis that focus on foreign MNEs in Italy, as in 2001. Namely, we
analyze foreign MNEs’ spatial behaviour and location choices across 686 Italian territorial
units named Local Labor Systems, by relying on the agglomeration indexes originally
developed by Ellison and Glaeser (1997).
This work is original in various respects. First, although previous studies have already
assessed that firms’ agglomerative behaviour might differ according with their
heterogeneity/productivity (Ottaviano et al., 2002; Baldwin and Okubo, 2006; Saito and
Gopinath, 2009), we show that heterogeneity concerns not only “who” agglomerates but the
whole set of actors involved. In other words, explaining agglomeration requires taking into
account “who agglomerate with whom”. In an earlier paper, Alcacer and Chung (2007)
distinguish foreign firms between technological leaders and laggards relative to the host
country, thus allowing for firm heterogeneity. Instead, we allow for a different dimension of
heterogeneity that refers to the distinction between foreign and domestic companies. Second,
we attempt to provide a direct measure for information externalities, while the previous

5
literature has insofar indirectly inferred their role from the observation of spatial
agglomeration. Third, we provide a measure of (intra- and inter-industry) knowledge
spillovers that allow for the fact that spillovers are not simply “in the air” but they do imply
on the one hand, the generation of tacit knowledge and, on the other, the ability and the
opportunities to absorb it. Fourth, we assess the overall impact of potential spillovers on the
locational behaviour of MNEs by examining knowledge inflows and knowledge outflows
(leakages) simultaneously.
The paper is organized as follows. Section 2 presents our conceptual framework and develops
the testable propositions on the role of information externalities and knowledge spillovers on
the industrial location of foreign MNEs and their co-location with other foreign MNEs and
local domestic companies. Section 3 describes the index adopted for measuring agglomeration
and coagglomeration, and presents the data as well as some descriptive statistics. The
econometric model and the variables employed are reported in Section 4, while Section 5
illustrates and discusses the results. The last Section summarizes the main contribution and
implications of the paper and indicates directions for future research.
2. Conceptual background and propositions
Location of MNEs’ investments has been widely investigated both theoretically and
empirically by economic geographers and IB scholarls. Relevant influencing factors have
been recently summarized in three broad categories as follows (Crozet et al., 2004; Dunning
and Lundan, 2008): (i) endowment effects, that explain why particular economic activity
would be “naturally” drawn to a given location; (ii) agglomeration effects, referring to the
Marshallian availability of labour, to the easy and cost-effective access to specialised inputs
and to knowledge spillovers; and (iii) policy-induced effects.

6
Therefore, the attractiveness of some locations lie not only in the fact that they can provide
firms with valuable resources in the form of good physical and human infrastructures but also
valuable opportunities for learning from other firms through intentional and unintentional
knowledge inflows and spillovers (McCann and Mudambi, 2004).
Borrowing from some recent studies on the formation of high tech clusters (Vicente and
Suire, 2007; 2009), we add to this framework the suggestion that MNEs’ location decision-
making is influenced by two types of externalities and spillovers and, namely, the distinction
between informational externalities and knowledge externalities.
Specifically, it has been already widely shown that MNEs’ location decision-making process
is considerably affected by the market and event uncertainty mainly due to their suffering
from the so called “liability of foreigness” dating back to Hymer (1960). Hence, foreign firms
have a poor knowledge of, and ability to forecast, the economic events in the host country,
thus suffering from a condition of adverse asymmetry in information costs, especially those
related to location-specific observation costs needed to investigate the local endowment of
factors (Casson, 1994)1. Consequently, MNEs’ location choices will be inherently influenced
by their rational response to the existence of information costs (Mariotti and Piscitello, 1995;
Shaver, 1998; He, 2002).
Informational externalities refer to the firm’s observational learning and give rise to locational
cascades that lead MNEs to co-locate with companies that already experienced and solved the
same problems with the local environment. Knowledge spillovers are instead associated to
interactive learning and, therefore, they might act both as a centrifugal and a centripetal force
depending on their prevailing outflow vs inflow component.
1 These costs include also market and event observation costs, which are relevant to the acquisition of
information on economic and environmental events affecting general production and market conditions, and information costs related to the communication, monitoring and control of the internal activities of the multinational enterprises (Casson 1994).
7
Foreign MNEs’ location behaviour might then be driven by the presence of other companies
and by the latters’ characteristics. Namely, we refer to MNEs’ agglomeration whenever
foreign MNEs are driven by the presence of other foreign MNEs that have already faced the
same “liability of foreigness”, and to MNEs’ co-agglomeration when they are led by local
domestic companies’ choices.
Informational externalities
Industry level agglomeration has been already widely shown to significantly occur and to play
an important role in MNEs’ location decisions (e.g. Head et al., 1995). Within this context,
models of informational cascades have been used to explain business agglomeration (Caplin
and Leahy, 1998) and clusters formation (Vicente and Suire, 2007, 2009). Informational
cascades are based on the role played by informational externalities (Manski, 2000), which
can be defined as the benefits agents can obtain from the observation of others (Banerjee,
1992; Bikhchandani and Hirshleifer, 1998). Hence agents converge rapidly towards a same
strategy.
When entering a foreign country, MNEs suffer from the liability of foreigness (Zaheer, 1995;
Zaheer and Mosakowski, 1997), which is composed by different barriers of a more or less
permanent nature associated to foreign exchange risks and unfamiliarity with the local
business conditions (nature of the competition, local suppliers and customers, etc.) and the
other specific location factors (availability of infrastructures and services, tax incentives, etc).
Thus, MNEs face high uncertainty about the payoff of their action that, however, might at
least overcome through engagement in learning (Petersen and Pedersen, 2002). In particular,
MNEs confront their individual expectation to the collective choice already undertaken by
firms that have already faced the same issues and, therefore, are more informed about and
8
more embedded in the local context (Hymer, 1960). Thus, foreign MNEs learn from the other
foreign MNEs’ sequence of past actions and simply adopt the same mimetic behaviour.
Such phenomena can be explained basically by an informational problem, and accurately by
an arbitrage between private information and public information (the latter has the externality
property because of the economies of information searching costs it induces). In this context,
behaviour convergence appears as the result of a sequential and cumulative process in which
agents decide on the basis of both their own private and probabilistic informational signal and
the aggregate actions of predecessors facing a similar decision problem (Vicente and Suire,
2007). Therefore, the public signals firms receive from their predecessors are integrated in
their decision as relevant information on the quality of the area. This information reduces the
uncertainty and increases the probability for firms to locate themselves in an area selected by
other firms previously.
We claim that the higher the private cost MNEs should sustain for gathering information
about the unfamiliar foreign locational factors, the more they will rely on public information
embodied in the previous location choices by other foreign MNEs. Namely, MNEs tend to
adopt a strategy of “herd behavior”, which consists in imitating location choices previously
made by other MNEs that have already entered the market and, hence, have already supported
the needed information costs. Conversely, that does not hold for local domestic firms, whose
decisions are strongly driven by historical factors such as the region where an entrepreneur
already lives and the region where the original resources conducive to an industry are located
(Sorenson and Audia, 2000).
Hence, the need for information costs does impact positively on the MNEs’ agglomerative
behaviour. Our first proposition is the following:
9
Proposition 1: Foreign MNEs are more likely to agglomerate with other foreign MNEs the
higher the uncertainty on the local context and the relevant information costs.
Knowledge spillovers
According to both the regional science and economic geography literatures as well as to the
IB approaches, knowledge and technological spillovers do crucially impact on the co-location
of firms in the same areas, i.e. firms locate near one another to learn and “to speed the flow of
ideas” (Ellison et al., 2007). However, although spatial proximity is important to generate
knowledge spillovers it does not suffice as (i) proximity does not necessarily imply
interaction and (ii) interaction does not necessarily mean positive spillovers. Indeed, firms
may absorb knowledge but they may also lose it, and the net balance is not necessarily
positive as it is instead assumed by most of the regional economics literature. Firms are
indeed neither equally equipped to receive knowledge nor homogeneously willing to serve as
a source of spillovers; hence, firms’ location choice is sensitive to their perception of the
benefits of spillovers (McCann and Mudambi, 2005).
Knowledge spillovers are not unidirectional, as they may correspond to either inflows or
outflows of knowledge and, while the former are universally perceived as positive, the latter
may be perceived either positive or negative depending on the local industrial structure and
the relevant competitive scenario, as well as on their being leaders or laggards in the sector (as
compared to the local companies). Knowledge outflows may be regarded from the public
good aspect of knowledge point of view (d’Aspremont et al., 1998), which therefore
contributes to a virtuous cycle by strengthening the knowledge base of the region and making
it a more attractive location for other knowledge-bearing firms, that in turn will generate
larger future knowledge inflows to all the firms in the group (McCann and Mudambi, 2007).
However, the unintentional knowledge leakages of the MNE’s valuable intellectual capital is
10
normally seen negatively by the firm (Grindley and Teece, 1997) and this is true especially in
a context of oligopolistic competition, as it is normally the case for MNEs. In fact, any
information outflows from the MNE might be more valuable to its competitors than any
potential information outflows from these competitors to the MNE, so the overall effect of the
knowledge outflows is perceived to be negative. Hence, knowledge spillovers and the foreign
MNEs’ perception depends on the industrial structure and competitive context (McCann and
Mudambi, 2004; Rosenthal and Strange, 2003), but also on the relative position of foreign
MNEs towards local domestic as companies would strategically choose locations to gain
exposure to others’ localised knowledge while reducing leakage of their knowledge to
competitors (Alcacer and Chung, 2007). Indeed, when foreign MNEs behave as leaders, as
they exploit existing capabilities and adapt existing products and processes to local
environments, leakages towards local companies are likely to be higher than possible inflows.
Thus, foreign MNEs would not co-locate with local domestic companies, which are laggards
and have therefore something to gain from them. Hence, as foreign MNEs are typically more
technologically advanced and more productive than local domestic firms (Castellani and
Zanfei, 2006), they do not normally perceive any advantage from coagglomeration with local
companies as they fear potential knowledge inflows to be lower than potential leakages.
Conversely, whenever local companies are technological leaders or enjoy some comparative
advantages in the relevant sector, foreign MNEs might perceive as positive the net balance of
knowledge flows, thus being possibly willing to co-locating with them.
Instead, foreign MNEs’ are more likely to agglomerate with other foreign MNEs, as
knowledge inflows would be at least as relevant as knowledge outflows. Indeed, MNEs
perceive as likely the chance of benefiting from knowledge spillovers generated by their
“peers”, thus betting on a positive balance of knowledge spillovers. This is likely to be even
truer the more the MNEs’ local subsidiary is competence exploiting, i.e. whenever it
11
constitutes a rather weak source of knowledge spillovers for the international competitors co-
located in the host country.
Therefore, our second proposition is articulated as follows:
Proposition 2a: Foreign MNEs tend to not agglomerate with local domestic companies, the
higher the potential knowledge spillovers as they expect potential knowledge outflows
(leakages) to be higher than inflows.
Proposition 2b: Proposition 2a does not hold if local domestic companies enjoy a
comparative advantage in the relevant sector.
Proposition 2c: Foreign MNEs tend to agglomerate more with other foreign MNEs, the
higher the potential knowledge spillovers. Indeed, they expect the balance between inflows
and outflows to be positive.
Possibly due to the absence of such a distinction between foreign and domestic companies on
the one hand, and between advantaged vs. non advantaged local domestic companies, on the
other, previous empirical evidence concerning the impact of knowledge spillovers on
agglomeration of economic activities is controversial. Indeed, some authors (Figueiredo et al.,
2000; Rosenthal and Strange, 2001; He, 2002; Hogenbirk and Narula, 2004) find that foreign
firms are attracted by potential local spillovers, while others (Flyer and Shaver, 2000;
Alsleben, 2005; Alcácer and Chung, 2007) find that the latter act as a centrifugal force.
However, it is worth specifying that this framework refers to knowledge spillovers occurring
both within the firm’s own industry (i.e. intra-industry spillovers) and in other more or less
related industries (inter-industry spillovers). Intra-industry spillovers are associated with the
12
presence of a wide-ranging collection of firms within a given industry or sector, all
concentrated in the same geographical area (Baptista and Swann, 1998). They relate to
specialisation externalities and can be associated with the contribution of Marshall (1920),
and to what geographers call “localisation economies”. The kinds of linkages that grow up
between competitors, suppliers and customers in any regional district or area are also, to some
extent, peculiar to that location, and imbue the technology creation of its firms with
distinctive features. For these reasons, other MNEs often need to be on-site with their own
production and their innovatory capacity if they are to properly benefit from the latest
advances in geographically localised technological development, to feed their innovation
(Cantwell, 1989). Inter-industry spillovers are associated with the co-presence of firms from
different industries, and working in different fields of research. Indeed, the more diverse is the
R&D conducted in a region, the more the firm could potentially benefit (Feldman and
Audretsch, 1999). Such spillovers relate to diversity externalities, which favor the creation of
new ideas across sectors, and go back to the concept of “urbanisation economies” originally
suggested by Jacobs (1969). Thus, inter-industry spillovers exert an indirect effect upon
foreign firms’ agglomeration. Indeed, if MNEs in sector i tend to agglomerate with other
companies in sectors js to capture and benefit from vertical (or, more generally, inter-
industry) spillovers, they predictably will end to agglomerate together.
3. Location and agglomeration
3.1. The index adopted
Any assessment of the importance of clustering must rest on the counterfactual position that is
adopted, i.e. what one assumes would have happened in the absence of clustering (Dunning
and Lundan, 2008). Accordingly, we rely on the framework suggested by Ellison and Glaeser
13
(1997) that adopted the idea that in the absence of either natural advantages or spillovers (i.e.
in the absence of agglomeration) location choice could be reduced to throwing darts at a map.
As the issue we want to investigate is the foreign MNEs’s locational approach relative to
other foreign MNEs and/or domestic companies, we adopted both an index for agglomeration
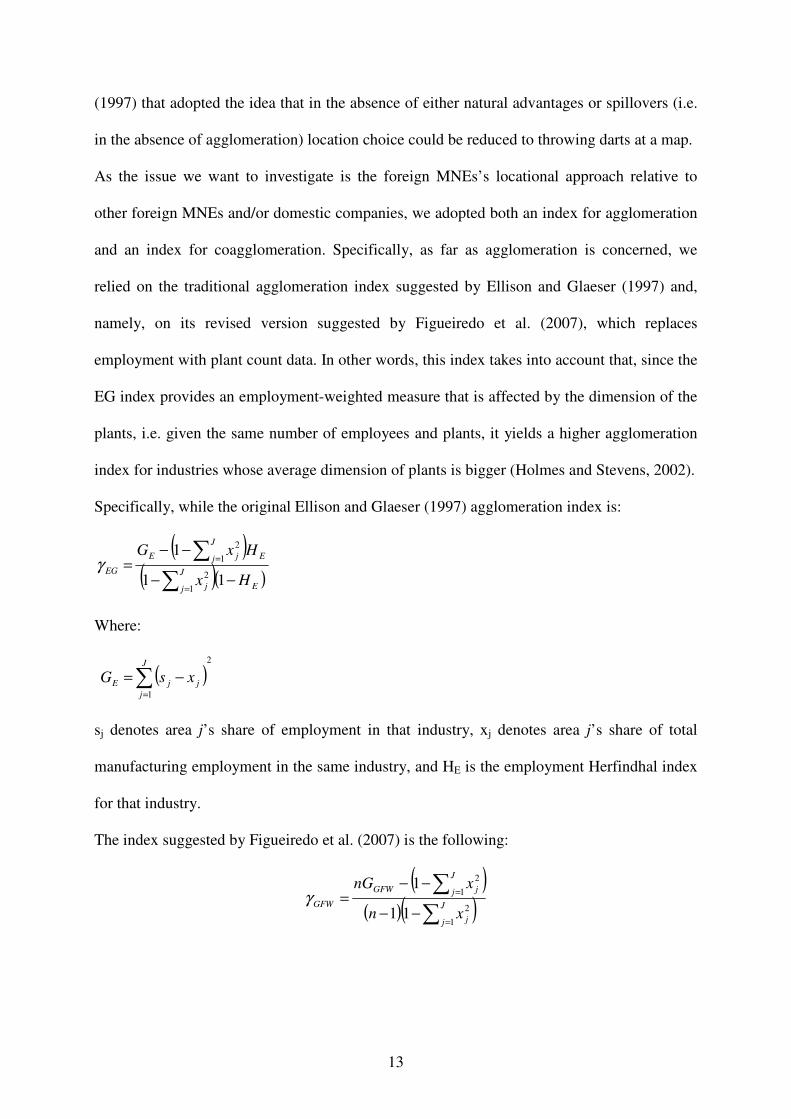
and an index for coagglomeration. Specifically, as far as agglomeration is concerned, we
relied on the traditional agglomeration index suggested by Ellison and Glaeser (1997) and,
namely, on its revised version suggested by Figueiredo et al. (2007), which replaces
employment with plant count data. In other words, this index takes into account that, since the
EG index provides an employment-weighted measure that is affected by the dimension of the
plants, i.e. given the same number of employees and plants, it yields a higher agglomeration
index for industries whose average dimension of plants is bigger (Holmes and Stevens, 2002).
Specifically, while the original Ellison and Glaeser (1997) agglomeration index is:
( )( )( )
E
J
j j
E
J
j jE
EG
Hx
HxG
−−
−−=
∑∑
=
=
11
1
1
2
1
2
γ
Where:
( )2
1
∑=
−=J
j
jjE xsG
sj denotes area j’s share of employment in that industry, xj denotes area j’s share of total
manufacturing employment in the same industry, and HE is the employment Herfindhal index
for that industry.
The index suggested by Figueiredo et al. (2007) is the following:
( )( )( )∑
∑
=
=
−−
−−=
J
j j
J
j jGFW
GFW
xn
xnG
1
2
1
2
11
1γ
14
where ∑=
−=
J
j
j
j
GFW xn
nG
1
2
is the “raw” concentration index, nj is the number of plants in
area j, n is the total number of plants that compose that industry, and xj denotes again area j’s
share of total manufacturing employment in the same industry.
Thus, the GFW index is very similar to the EG index. It only replaces the Herfindhal index by
n
1and the “raw concentration index” is replaced by its counterpart expressed in terms of
counts of plants, GFWG .
As far as whether foreign MNEs tend to locate close to domestic companies, we resorted to
the coagglomeration index originally put forward by Ellison and Glaeser (1997), as in Barrios
et al. (2006). Accordingly, coagglomeration between foreign MNEs and domestic firms
occurs whenever they co-locate more than it would happen randomly, which constitute the
counterfactual for the absence of coagglomeration. Therefore, one should expect zero when
foreign and domestic firms are exactly as co-located with one another as random chance
should make them. Negative values of the index arise when foreign and domestic firms are
agglomerated in different areas2.
Specifically, considering the divide between foreign and domestic plants, and measuring the
degree of coagglomeration between these plant groups across regions, for a given industry i
the index can be written as follows:
( )
∑
∑∑
−
−⋅⋅−−
−
=k ki
k kikikii
j
ji
Co
iw
HwHxG
2
,
,
2
,,
2
1
11/ γ
γ
where Gi is the “raw concentration” of employment in the group as a whole, i.e. an
approximation of the Gini index defined as the sum of square deviations of sij (the share of
2 The authors wish to thank Glenn Ellison, Edward Glaeser, William Kerr and Luisito Bertinelli for their suggestions and clarifications on the correct use and interpretation of the coagglomeration index.
15
industry i’s employment in area j) to xj (the share of aggregate manufacturing employment in
area j):
( )2
∑ −=j
jiji xsG
The term ik
k
iki HwH ∑= 2 represents the group’s plant Herfindhal index for the industry.
Subscripts k = f, d refer to other foreign MNEs or domestic plants, respectively, and wk
represents their relevant shares of total employment of industry j. The term γi is the
agglomeration index calculated previously.
Therefore, we believe these measures of agglomeration are particularly appropriate to
investigate the locational behaviour of foreign MNEs. Indeed, due to the inclusion of
Herfindhal indexes, they allow for the industrial structure of each considered sector that has
been shown to influence firms’ perception of the benefit of information spillovers3 (McCann
and Mudambi, 2007).
3.2. Data and descriptive statistics
Agglomeration indexes have been computed using information on foreign MNEs in Italy from
the Reprint-ICE database, which contains detailed yearly information about both Italian
affiliates of foreign firms (in terms of number of employees, location and sales) and the
foreign affiliates of Italian firms, in manufacturing and service industries, since 1986 (for
further details, see Mariotti and Mutinelli, 2009). Data on the spatial and industrial
distribution of national plants come from the 2001 Economic Census (Italian Office for
National Statistics, 2001a). However, as the Economic Census provides information on the
3 Namely, firms might perceive a potential positive effect associated to knowledge leakages in a competitive market structure, where they may contribute to local virtuous cycles, and the public aspect of knowledge dominates. Conversely, firms negatively see leakages of their valuable capital (e.g. Co, 2002; Alsleben, 2005) when the market structure is oligopolistic, and the private aspect of knowledge dominates.
16
total number of plants regardless of their nationality, we subtracted foreign-owned plants (as
in 2001) in order to obtain the population of the local domestic ones.
As our focus is here on manufacturing, we refer only to the 101 three-digit Nace - rev.1
sectors where at least one foreign MNE is present, as in 2001 (see Annex 1). However, as our
aim is to explain agglomeration, we need to consider only sectors hosting at least two foreign
MNEs’ plants. Hence, we eliminated 9 sectors thus reducing the total number to 92.
Additionally, we also excluded sectors that represented outliers possibly distorcing the
estimation, thus obtaining 85 relevant sectors4.
As far as the territorial level, agglomeration indexes have been calculated at the Local Labor
System (LLS) level in Italy. Namely, we relied on the 686 LLSs identified from the 2001
Census of Population5. The Italian Office for National Statistics identifies LLSs on the basis
of commuters’ patterns and they correspond to geographic areas wherein the bulk of the
resident population both live and work (Italian Office for National Statistics, 2001b). Thus,
LLSs correspond to territorial units constituted by several municipalities6 that are
geographically intertwined, and they may therefore be considered an instrument to investigate
the socio-economic structure of the country more appropriate than the administrative units
(reprensented by regions or provinces). Especially, they costitute a proper unit of analysis to
capture the effects of spillovers on agglomeration as knowledge flows have been extensively
shown to cross administrative boundaries (Anselin et al. 1997; Paci and Usai, 2000; Autant-
Bernard, 2001). Indeed, being identified by means of commuters’ movements, SLLs’
4 Namely, we left out from the analysis publishing and related activities, as they actually refer to services rather
than to manufacturing activities (see the latest revision of the Nace classification), and those sectors where a lion share of the total foreign-owned plants (80 percent or more) is constituted by units co-located in the same municipality and referring to a single MNE. Indeed, this multi-plant structure is exclusively due to administrative and legal reasons, thus introducing a substantial distortion in the value of the agglomeration indexes. 5 For a similar approach based on the Italian LLSs, see Pagnini (2002). 6 It may be worth observing that, referring to the Eurostat scheme of territorial classification - the Nomenclature of Territorial Units for Statistics (NUTS), Italian municipalities correspond to the NUTS5 level.
17
boundaries are more likely to capture the spatial dimension of tacit knowledge spillovers,
which are mainly based on localized interactions among people, firms and social entities.
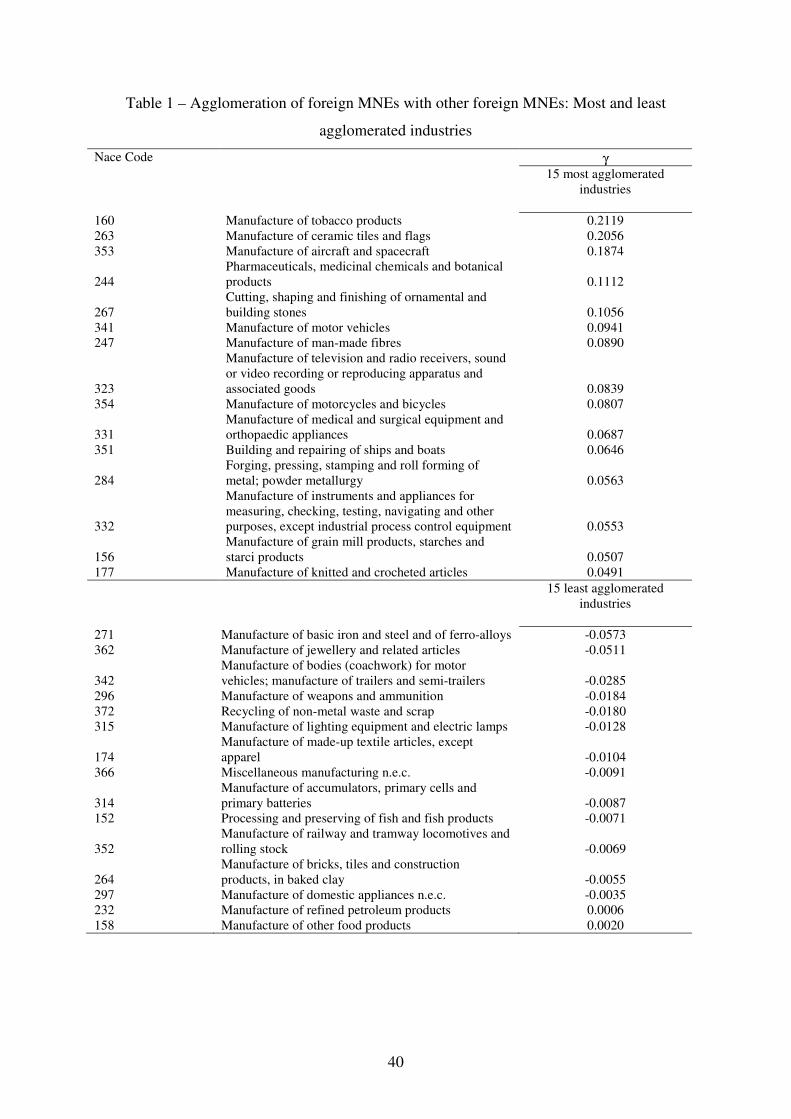
Tables 1 and 2 report the 15 highest and lowest values of agglomeration indexes for foreign
MNEs with other foreign MNEs and local domestic companies, respectively. Interestingly,
the observations of sectors appearing in the two rankings seem to provide a preliminary
confirmatory evidence for our propositions. First of all, foreign MNEs significantly
agglomerate with other foreign firms in several high tech sectors (i.e. aerospace,
pharmaceuticals, consumer electronics, medical equipment, scientific instruments). Apart
from pharmaceuticals, none of these is included in the list of most coagglomerated industries,
i.e. those in which foreign MNEs agglomerate with local domestic firms (see Table 2). On the
contrary, the same or other high tech sectors are in the opposite list of least agglomerated
sectors (i.e. consumer electronics, aerospace, electronic components, optical instruments).
This evidence is coherent with the idea that high tech industries are the first candidates to be
both more sensitive to information costs and a source of important knowledge spillovers. In
the same vein, it is worth noting that three of the four scale intensive sectors (tabacco, motor
vehicles, man-made fibers, motor cycles and bycicles) in which foreign MNEs tend to
agglomerate with other foreign MNEs do appear among the ones in which foreign MNEs do
not agglomerate with local companies. Second, traditional sectors do not record the
agglomeration of foreign MNEs with other foreign firms, while recording that with local
domestic companies, whenever the latter enjoy a comparative advantage (i.e. manufacture of
ceramic tiles, textiles, footwear and furnitures). This evidence gives some descriptive support
to Proposition 2b.
(Tables 1 and 2 go about here)
18
4. The econometric analysis
4.1. The model and the variables
As already widely acknowledged (Barrios et al. 2006; Ellison et al., 2007), the index
suggested to measure agglomeration and coagglomeration do not allow neither to make the
distinction between natural advantages due to site-specific characteristics and potential
spillovers nor to assess their relative importance. Therefore, we adopt a simple OLS
regression model aiming at explaining the role of these explanatory variables on the
agglomeration of foreign MNEs, and their coagglomeration with domestic firms. Specifically,
according to our conceptual framework and propositions, we consider variables related to
both information esternalities and knowledge spillovers, other than traditional variables
associated to the reliance on natural resources and transportation costs. Specifically, the
models are the followings:
iiii
MNC
i ControlsspillKnowexternInfo εββββγ ++++= 3210 __
iiii
Co
i ControlsspillKnowexternInfo ηδδδδγ ++++= 3210 __
where MNC
iγ is the agglomeration index for foreign MNEs with other foreign MNEs in sector
i; Co
iγ is the agglomeration index for foreign MNEs with local domestic firms in sector i,
Info_extern is the variable related to information externalities, and Know_spill refers instead
to knowledge spillovers; Controls accounts for control variables.
The explanatory variables have been built as follows (the detailed description of the variables,
the source of data and the year considered are reported in Table 3). However, it may not be
out of place here observing that in the operationalisation of our variables we followed the
recent empirical innovation put forward by Ellison et al. (2007) to rely on instruments for the
characteristics of industries in order to rule out possible endogeneity. Specifically, they
observe that the I/O tables that are normally employed to proxy interactions amongst
19
industries and agents may be endogenous to agglomeration as they may indeed reflect the
industries’ geography. In fact, I/O relationships might also mirror agglomeration, and not only
influence it. Hence, according with the procedure adopted in that paper, where they
instrument the US I/O tables through the UK one, we also rely on the UK I/O table obtained
from the UK Office for National Statistics, and referring to 1995. Additionally, UK I/O tables
allowed us to adopt detailed information at the three digit level7.
(Table 3 goes about here)
Informational externalities (Info_extern)
In order to allow for the informational effect, we suggest a proxy for information costs, i.e.
those costs firms should sustain in order to gather information on the local industrial and
territorial context. Specifically, we refer to each industry’s firms’ resort to external local
services, the rationale being that higher expenditures for external services mean greater need
of external supports to undertake activities and investments8. Hence, industries displaying
high need for a wide range of diversified external services correspond to those in which firms
sustain high costs for gathering private information about the qualititative and quantitative
availability of services for different locational choices. Alternatively, firms might react by
relying on public information embodied in the others’ behaviour, i.e. they tend to
coagglomerate in order to reduce information costs and to benefit instead from informational
externalities.
Namely, the variable Info_extern is measured by the degree of dependence on external
services for each industry i calculated as the incidence of the total flows each sector i receives
in input from the service sectors, on the total output. Specifically, the variable Info_extern
7 Instead, the Italian I/O tables are not available at the three-digit sectoral level.
20
relies on the UK input-output tables and includes the following sectors: 99
(Telecommunications), 100 (Banking and finance), 102 (Auxiliary financial services), 107
(Computer services), 108 (Research and development), 109 (Legal activities), 110
(Accountancy services), 111 (Market research, management consultancy), 112 (Architectural
activities and technical consultancy), 113 (Advertising), and 114 (Other business services). In
line with our propositions, we expect a positive role in the explanation of agglomeration of
foreign MNEs with other foreign MNEs.
Knowledge spillovers (Know_spill)
Potential knowledge spillovers are hard to identify. In fact, they have been normally inferred
either indirectly by estimating the change in productivity of domestic firms as a result of
investment by foreign MNEs (starting from the pivotal contribution of Caves (1974) and
Griliches (1979)) or by tracing knowledge flows directly using citations between patents
(Jaffe et al., 1993; 2000; Almeida, 1996; Frost, 2001; Singh, 2007) or by relying on the
technology flows between sectors stemming from the Scherer’s matrix (Ellison et al., 2007).
Our proxy for spillovers occurring within (intra) and between (inter) sectors takes into
account that spillovers imply on the one hand, the generation of knowledge and, on the other,
the ability and the opportunities to absorb it (for a related approach, see also Kafouros and
Buckley, 2008). Therefore, we consider the following three dimensions:
(i) The sector i’s ability/potential of generating spillovers refers only to tacit
knowledge, which cannot be codified and requires personal contacts, interaction
and spatial proximity to be transmitted (Alsleben, 2005). Namely, the Tacit
Innovation Index has been measured by the share of firms (in sector i) that
8 Instead, previous empirical studies on spatial distribution of firms has traditionally considered agglomeration
itself as a proxy for information costs (e.g. Mariotti and Piscitello, 1995; Head et al., 1999; He, 2000), thus using the effect (agglomeration) to measure the cause (information costs).
21
undertook innovations in the following fields: strategy, management, organization,
esthetic, design, training and marketing, and/or used tacit methods to protect their
innovation (such as secrecy, increase of complexity of operations and increase of
required competences), in the period 1998-2000. Data come from the Italian
chapter of the Community Innovation Survey (CIS3), which is maintained by the
Italian Office for Statistics.
(ii) The ability of the other sectors j to absorb/capture spillovers generated by sector i,
i.e. their absorptive capacity. According with the previous empirical literature (e.g.
Griffith et al., 2003; Lehay and Neary, 2007), sector i’s absorptive capacity has
been proxied by the sector’s R&D intensity (R&D expenditures/sales). Data come
again from the Community Innovation Survey (CIS3).
(iii) According with previous studies (e.g. Smarzinska Javorcik, 2004; Haskel et al.,
2007; Kafouros and Buckley, 2008), the opportunities to absorb technology are
likely to proportionally depend on the frequency and the intensity of contacts
occurring between the relevant sectors (i and j). Relying on the UK I/O table, we
used the total I/O flows between sector i and sector j in order to proxy the contacts.
Specifically: (xi,j + xj,i), where xi,j represents the flows of goods (in millions of
Euros at current prices) that industry i supply to industry j, and xj,i the amount that
industry i receives from j).
Therefore, the proxy employed for total (i.e. both intra- and inter-industry) knowledge
spillovers involving sector i is the following:
∑∑ +++=i
jijjiijij
j
jiii TIIxxDRDRxxTIItotspillKnow )(&&*)(__ ,,,,
where i, j = 1, …, 85.
Namely, we can distinguish between intra- and inter-industry components as follows:
iiiii DRxTIIraSpillKnow &**int__ ,=
22
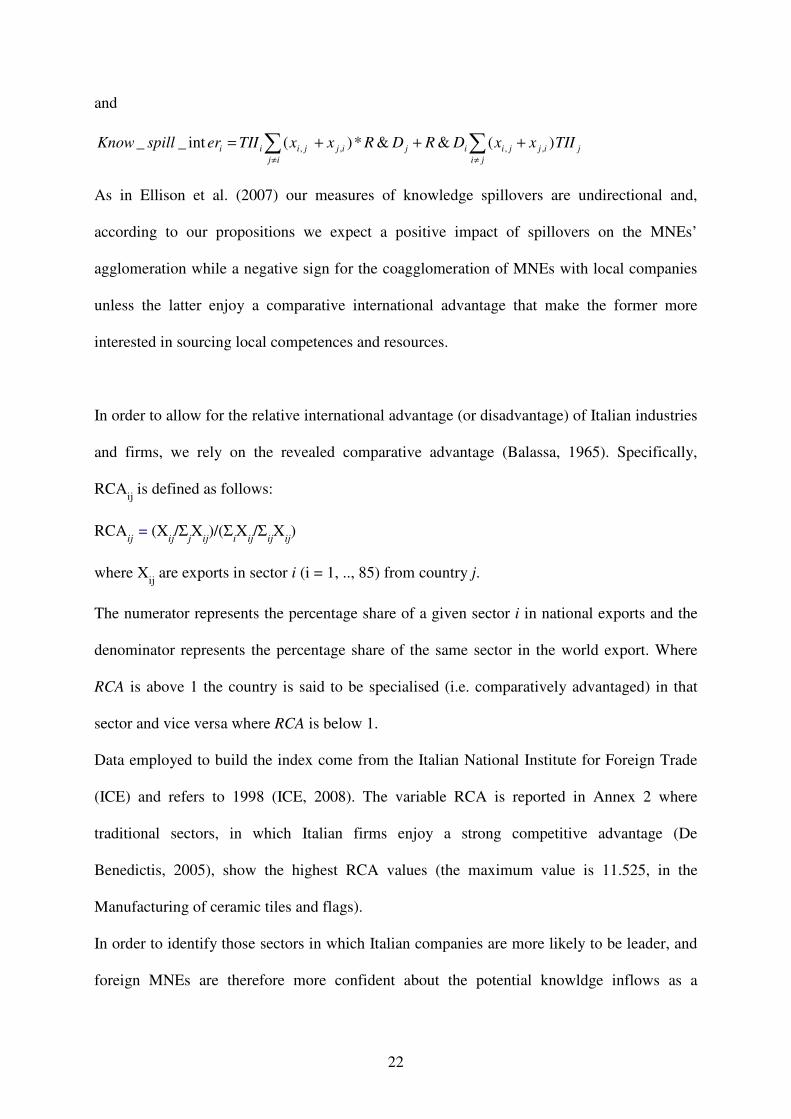
and
∑∑≠≠
+++=ji
jijjiijij
ij
jiii TIIxxDRDRxxTIIerspillKnow )(&&*)(int__ ,,,,
As in Ellison et al. (2007) our measures of knowledge spillovers are undirectional and,
according to our propositions we expect a positive impact of spillovers on the MNEs’
agglomeration while a negative sign for the coagglomeration of MNEs with local companies
unless the latter enjoy a comparative international advantage that make the former more
interested in sourcing local competences and resources.
In order to allow for the relative international advantage (or disadvantage) of Italian industries
and firms, we rely on the revealed comparative advantage (Balassa, 1965). Specifically,
RCAij is defined as follows:
RCAij
= (Xij/Σ
jX
ij)/(Σ
iX
ij/Σ
ijX
ij)
where Xij are exports in sector i (i = 1, .., 85) from country j.
The numerator represents the percentage share of a given sector i in national exports and the
denominator represents the percentage share of the same sector in the world export. Where
RCA is above 1 the country is said to be specialised (i.e. comparatively advantaged) in that
sector and vice versa where RCA is below 1.
Data employed to build the index come from the Italian National Institute for Foreign Trade
(ICE) and refers to 1998 (ICE, 2008). The variable RCA is reported in Annex 2 where
traditional sectors, in which Italian firms enjoy a strong competitive advantage (De
Benedictis, 2005), show the highest RCA values (the maximum value is 11.525, in the
Manufacturing of ceramic tiles and flags).
In order to identify those sectors in which Italian companies are more likely to be leader, and
foreign MNEs are therefore more confident about the potential knowldge inflows as a
23
counterbalancing force against the natural disadvantages related to the unfamiliar
environment, we adopted a threshold equal to 2. Thus, our variable D_RCA2 takes the value
one when RCA>2, and zero otherwise.
Human capital
Besides mechanisms related to interaction and imitation among people, knowledge spillovers
are also vehicled by workers, especially highly educated ones (Blomstrom and Kokko, 1998;
Moretti, 2004; Rosenthal and Strange, 2004). However, although foreign MNEs may count on
their ability to offer higher wages to attract best workers, they may also lose them. According
with the traditional trade-off between labour pooling and labour poaching (Ellison et al.,
2007), one may expect that foreign MNEs tend to colocate with domestic companies the
higher the share of highly educated workers, but also the opposite may be true. The
concentration of skilled employment in a given area or industry represents a strong centripetal
force for any type of firms, since it allows to undertake labor pooling. Indeed, by
agglomerating and by offering the best wages it is possible to attract high skilled workers,
which positively affect the productivity of the firm and which contribute to the transfer of
tacit knowledge (Rosenthal and Strange, 2001). However, it can also assume a negative
connotation when it becomes labor poaching. Indeed, firms may also lose their best workers
and, hence, decrease their productivity and suffer a leak of tacit knowledge (Combes and
Duranton, 2001).
As in Rosenthal and Strange (2001), we proxied human capital with the share of managers on
the total employment in each industry9 (Skilled_labour). Data come from the database
Mediocredito Centrale-Unicredit10 and refer to year 2001. We expect this variable to
9 It is worth mentioning that we also tried the share of graduated workers over the total employment. However, as the latter did not come out significant, we decided to not report it in the paper. 10 We wish to thank Alessandro Arrighetti and Andrea Lasagni for providing us with the relevant data.
24
positively influence the agglomeration of foreign MNEs with local domestic companies,
while we do not have any a priori expectation on the impact on the agglomeration of foreign
MNEs with other foreign MNEs.
Control variables
Transportation costs (Transport)
According to Marshall (1920), the costs of moving goods and people could be reduced by
industrial agglomeration (Ellison and Glaeser, 1997). Therefore, firms tend to concentrate
within the same region when transportation costs decrease. Indeed, low costs allow the firm to
serve proximate and distant markets from a single central location without substantial
disadvantage. But as transportation costs climb, the profitability of such a configuration
diminishes; if transportation costs are high enough, the firm would prefer to have facilities
distributed geographically (Chung and Song, 2004).
Our proxy relies on the UK I/O tables and refers to the degree of dependence on
Transportation costs for each sector i calculated as the incidence of the total flows each sector
i receives in input from the transportation sectors, on the total output. Specifically, our
variable Transport includes the following sectors: 93 (Railway transport), 94 (Other land
transport), 95 (Water transport) and 96 (air transport). In line with results obtained by
previous studies (Krugman, 1991; Figueiredo et al., 2000; Alsleben, 2005), we expect high
transportation costs to constitute a dispersion force that, therefore, does negatively impact on
agglomeration.
Natural resources (Natural_resources)
It has long been recognized that natural advantages can affect the location decisions of firms,
as they explain why particular economic activities would be naturally drawn to a given
25
location (Dunning and Lundan, 2008).
According with Rosenthal and Strange (2001) we rely on the I/O tables to control for the
importance of natural advantages associated with proximity to inputs. Specificially, our
variable Natural_resources is the incidence of the total flow each sector i receives in input
from the natural resource sectors, on the total output. Sectors included are: 1 (Agriculture) ,2
(Forestry), 3 (Fishing), 4 (Coal extraction), 5 (Oil and gas extraction), 6 (Metal ores
extraction), 7 (Other mining and quarrying). To the extent that firms desire to locate close to
natural resources, we expect the coefficient of this variable to be positively related to
agglomeration of foreign MNEs with both other foreign MNEs and local domestic companies.
Descriptive statistics and correlation coefficients are reported in Table 4.
(Table 4 goes about here)
5. Results of the econometric analysis
Results from the robust OLS estimation for the agglomeration of foreign MNEs with other
MNEs ( MNCγ ) and with local domestic companies ( Coγ ) are reported in Table 5. Variables
have been standardized in order to make it easier to interpret estimated coefficients and make
them easily comparable.
(Table 5 goes about here)
The first two columns reveal that the proxy employed for information externalities
(Info_extern) turns out to be positive and significant different from zero (at p<.05), thus
confirming our first proposition on the MNEs’ herding behaviour towards other foreign
MNEs’ locational choices, allowing them to reduce the costs for gathering information on the
context specific locational factors. In fact, information externalities do not seem to influence
the agglomeration of foreign MNEs with local domestic companies (Info_extern is never
26
significant in the models for Coγ ) that have different characteristics and by their very nature
face different problems and local and issues.
As far as our second propositions, i.e. the role of knowledge spillovers, our results seem to
confirm them. Namely, knowledge spillovers do impact positively on the agglomeration of
foreign MNEs with other foreign MNEs (Know_spill_tot is positive and significantly different
from zero, at p<.01 in Model 1), thus confirming Proposition 2c. However, this holds
especially for the intra-industry component, as indeed, Model 2 reveals that both
Know_spill_intra and Know_spill_inter are positive and significant (at p<01) but the former
presents a coefficient that is 5-folds the latter’s one. Proposition 2a is also confirmed as
looking at results for foreign MNEs’ agglomeration with local domestic companies, it
emerges a strongly significant negative effect both for total knowledge spillovers
(Know_spill_tot is significantly different from zero at p<.01, in Model 3) and their intra- and
inter-industry components (Models 6 and 7). However, these negative effects, due to the
foreign MNEs’ fear of outward knowledge leakages to local competitors, seem to be
counterbalanced by the MNEs’ hope to accessing local sources of knowledge, whenever local
companies enjoy a comparative international advantage, thus confirming Proposition 2c. As a
matter of fact, the moltiplicative variable Know_spill_tot_rca turns out to be positive and
significantly different from zero (at p<.01) in Model 4, although the estimated coefficient
does not allow to overcome the negative one obtained for Know_spill_tot. However, the
counterbalancing effect becomes clearer when distinguishing between intra- and inter-
industry knowledge spillovers. Know_spill_intra_rca is positive and significantly different
from zero (at p<.05), while Know_spill_intra remains negative but not significant, in Model
8, thus revealing that foreign MNEs perceive a net positive balance for knowledge inflows vs.
outflows, only when local competitors in the same sector do enjoy a comparative advantage.
27
As far as the availability of skilled labour, the proxy employed does not come out
significantly different from zero in any of the specifications adopted. However, it is always
positive and almost significant when considering the agglomeration of foreign MNEs with
local domestic companies as, if this is the case, they may perceive a positive trade-off
between labour pooling and labour poaching (Ellison et al., 2007). Indeed, foreign MNEs
might count on their ability to offer higher wages to attract best workers (Brown et al., 2004),
with a low risk of losing them. The scant significance of the proxy employed might be
associated to the territorial unit used in the analysis. Indeed, as LSSs are constituted by
clusters of municipalities characterised by the self containing of labour demand and supply,
they already might capture most of the agglomeration due to the local labour market.
Finally, as far as our control variables, we observe that, interestingly, transportation costs do
not come out significantly different from zero in any of the specifications. However, this
result may be not only a sign of changes in transportation technologies that altered the
perception of space, but also to the admittedly irrelevant role of transport costs in influencing
firms’ locational choice in a relative small-sized country like Italy. Likewise, the coefficient
of the variable Natural resource is never significantly different from zero, as in most of the
previous empirical investigation on firms’ agglomeration patterns (e.g. Rosenthal and
Strange, 2001). However, our result might also stem from the exclusion of the mining sectors
and energy products where natural resources certainly play a more relevant role (see also
Pagnini, 2002).
6. Conclusion
This paper investigated factors explaining MNEs’ agglomeration behavior at the subnational
level. Specifically, by distinguishing between foreign MNEs’ agglomeration with other
28
foreign MNEs on the one hand, and with local domestic companies on the other, we assess the
relative importance of factors used to explain agglomeration in traditional studies.
In particular, we believe our results provide some contributions to the dialogue now taking
place between industrial geographers, economics and business analysts. Specifically, our
results confirm the presence of isomorphism in MNEs’ location decisions. However, while
most of previous empirical studies document this phenomenon at the country level for the
same company (e.g. Arregle et al., 2009), we show the same occurs at the subnational level
among foreign MNEs. Additionally, previous studies have already recently shown that
MNEs’ attitude towards knowledge spillovers is not deterministically positive (as instead
implicitly hypothesised in the traditional regional economics) but it may vary according to the
market structure. Here we make a step further as we show that MNEs’ perceptions on the net
effects of outward vs. inward knowledge spillovers crucially depends also on the nature of the
companies MNEs locate close to.
We find that MNEs’ locational behaviour is influenced by (i) informational externalities,
giving rise to locational cascades and imitation of other foreign MNEs, and (ii) potential
knowledge spillovers, which might act both as a centrifugal and a centripetal force, depending
on the nature of local counterparts. Specifically, foreign MNEs tend not to agglomerate with
local domestic companies as they perceive potential knowledge inflows to be lower than
potential leakages, unless local companies enjoy some comparative advantages. Conversely,
foreign MNEs’ are willing to agglomerate with other foreign MNEs, as they bet on a positive
balance between knowledge inflows and outflows.
Our proposed model can be expanded in several directions. For instance, one may distinguish
foreign MNEs by nationality in order to assess whether their imitation approach in location
choices is stronger for companies originating from the same home country. Indeed, companies
29
migth find it easier to trust and imititate other companies’ choices whenever the latter share
the same cultural background and institutional system of values (Lu, 2002; Chan et al., 2006).
Along the same line, one could try to distinguish foreign MNEs’ subsidiaries according to
their motivations and/or mandate. Indeed, motives for FDI have been increasingly
characterised by competence creating attitude over the last decades (Cantwell and Piscitello,
2008) and “the geography of international business activity is not independent of the
competitive advantages of the investing firms, and this interdependence is particularly
apparent when one examines the dynamics of knowledge-intensive MNE activity” (Dunning,
2009, p. 5).
These modifications would allow to account for several dimensions of MNEs’ heterogeneity.
Unfortunately, the small numbers involved in the Italian case, as well as the lack of
information on the very nature of motivations justifying foreign entries, currently hinder such
empirical extensions. The opportunity of replicating the study across other countries would
certainly provide a promising step forward in advancing our understanding of the relationship
between MNEs’ heterogeneity and locational choices.
Other possible modifications may be to allow for the dynamics of the location processes
rather than referring only to the observed spatial configuration of MNEs in a certain point in
time. Another route in which our model can be expanded is adding service sectors to the
manufacturing ones in order to investigate differences, if any, in MNEs location choices. Such
modifications require considerable additional gathering of data, and are beyond the scope of
the current paper.

30
ACKNOWLEDGMENTS
The authors wish to thank Nigel Driffield, Francesco Lissoni, Sarianna Lundan, Marcello
Pagnini, and the participants in the 48th ERSA Conference 2008, the 34th EIBA Conference
2008, the 36th AIB-UK Conference 2009, and the 12th Uddevalla Symposium 2009 for their
helpful comments and suggestions on earlier versions of this paper. Responsibility for any
errors lies solely with the authors.
31
REFERENCES
Aharonson B.S., Baum J.A.C., and Feldman M.P. (2007) Desperately seeking spillovers?
Increasing returns, industrial organization and the location of new entrants in geographic and
technological space. Industrial and Corporate Change, 16: 89-130.
Alcacer, J. and Chung, W. (2007). Location strategies and knowledge spillovers. Management
Sciences, 53: 760-776.
Almeida, P. (1996). Knowledge sourcing by foreign multinationals: Patent citation analysis in
the US semiconductor industry. Strategic Management Journal, 17: 155-165.
Alsleben, C. (2005). Spatial agglomeration, competition and firm size. Discussion Paper in
Economics, No. 04, University of Dortmund
Anselin, L., Varga, A., Acs, Z.A. (1997) Entrepreneurship, geographic spillovers and
university research: A spatial econometric approach. Working paper n. 59, ESRC Centre for
Business Research, University of Cambridge.
Arregle, J.-L., Beamish, P.W., Hébert, L. (2009), The regional dimension of MNEs’ foreign
subsidiary localization, Journal of International Business Studies, 40: 86-107.
Autant-Bernard, C. (2001), The geography of knowledge spillover and technological
proximity, Economics of Innovation and New Technology, 100: 237-254.
Balassa, B. (1965). Trade Liberalization and Revealed Comparative Advantage, The
Manchester School of Economic and Social Studies, 32: 99-123.
Baldwin, R., Okubo, T. (2006), Heterogeneous firms, agglomeration and economic
geography: spatial selection and sortine, Journal of Economic Geography, 6: 323-346.
Banerjee, A. (1992), A simple model of herd behavior, Quarterly Journal of Economics, 57:
797–817.
Baptista, R., Swann, G.M.P. (1998), Do firms in clusters innovate more? Research Policy, 27:
527-542.
32
Barrios S., Bertinelli L., Strobl E. (2006), Co-agglomeration and growth, Regional Science
and Urban Economics, 36: 467–481.
Belderbos, R., Sleuweaegen, L. (2007). Intellectual assets and international investment: a
stocktaking of the evidence. OECD, DAF/INV/WD(2007)6.
Bikhchandani, S., Hirshleifer, D. (1998), Learning from the behaviour of others: Conformity,
fads and informational cascades, The Journal of Economic Perspectives, 12: 151-170.
Blomström, M., Kokko, A. (1998), Multinational corporations and spillovers, Journal of
Economic Surveys, 12: 247-277.
Brown, D.K., Deardoff, A.V., Stern R.M. (2004), The effects of multinational production on
wages and working conditions in developing countries. In Baldwin R.E., Winters L.A.
(Eds), Challenges to Globalisation. Analyzing the Economics. Chicago: The University of
Chicago Press.
Cantwell, J.A. (1989) Technological Innovation and Multinational Corporations. Oxford:
Basil Blackwell.
Cantwell, J. A. (2009), Location and the multinational enterprise, Journal of International
Business Studies, 40: 35-41.
Cantwell, J.A., Mudambi, R. (2005), MNE competence-creating subsidiary mandates,
Strategic Management Journal, 26: 1109-1128.
Cantwell, J.A., Piscitello, L. (2007), Attraction and Deterrence in the Location of Foreign-
Owned R&D Activities. The Role of Positive and Negative Spillovers, International Journal
of Technological Learning, Innovation and Development, 1: 1-29.
Cantwell, J.A., Piscitello, L. (2008). Increasing openness: The co-evolution of MNEs’
innovation strategies, location and business networks, 28th
SMS Annual Conference,
Cologne, 12-15 October.
33
Caplin, A., Leahy, J. (1998), Miracle on sixth avenue: Information externalities and search,
The Economic Journal, 108: 60-74.
Casson, M. (1994), Why Are Firms Hierarchical? Journal of the Economics of Business, 1:
47-76.
Castellani, D., Zanfei, A. (2006) Multinational firms, innovation and productivity.
Cheltenham: Edward Elgar.
Caves, R.E. (1974), Multinational firms, competition and productivity in host-country
markets, Economica, 32: 176-93.
Chan, C. M., Makino S., Isobe, T. (2006), Interdependent behavior in foreign direct
investment: The multi level effects of prior entry and prior exit on foreign market entry,
Journal of International Business Studies, 37: 642-665.
Chung, W., Kalnins, A. (2001), Agglomeration effects and performance: A test of the Texas
lodging industry, Strategic Management Journal, 22: 969-988.
Chung, W., Song, J. (2004), Sequential investment, firm motives, and agglomeration of
Japanese electronics firms in the United States, Journal of Economics and Management
Strategy, 13: 539-60.
Co, C. Y. (2002), The agglomeration of U.S.-owned and foreign-owned plants across the U.S.
States, The Annals of Regional Science, 36: 575-592
Cohen, W., Lenvinthal, D. (1990), Absorptive capacity: a new perspective on learning and
innovation, Admistrative Science Quarterly, 35:128-152.
Combes, P.P., Duranton, G. (2001) Labour pooling, labour poaching and spatial clustering.
CERAS Working Paper 01-03
Crozet, M., Mayer, T., Mucchielli, J-L. (2004), How do firms agglomerate? A study of FDI in
France, Regional Science and Urban Economics, 34: 27– 54.
34
D’Aspremont, C., Bhattacharya, S., Gerard-Varet, L.A. (1998), Knowledge as a public good:
Efficient sharing and incentives for development effort, Journal of Mathematical
Economics, 30: 389-404.
De Benedictis, L. (2005), Three decades of Italian comparative advantages, The World
Economy, 28: 1679-1709.
Dunning, J.H. (2009), Location and the multinational enterprise: A neglected factor? Journal
of International Business Studies, 40: 5-19.
Dunning, J.H., Lundan, S. (2008) Multinational Enterprises and the Global Economy.
Cheltenham: Edward Elgar.
Ellison, G., Glaeser, E.L., Kerr, W. (2007), What causes industry agglomeration? Evidence
from coagglomeration patterns. NBER WP 13068, Cambridge.
Ellison, G., Glaeser, E.L. (1997), Geographic concentration in U.S manufacturing industries:
a dartboard approach, Journal of Political Economy, 105: 889-927.
Feldman, M.P., Audretsch, D.B. (1999), Innovation in cities: Science-based diversity,
specialisation and localised competition, European Economic Review, 43: 409-429.
Figueiredo, O., Guimaraes, P., Woodward, D. (2000), Agglomeration and the location of
foreign direct investments in Portugal, Journal of Urban Economics, 47: 115-135
Figueiredo, O., Guimaraes, P., Woodward, D. (2007), Measuring the localization of economic
activity: A parametric approach, Journal of Regional Science, 47: 753-774.
Flyer, F., Shaver, M. J. (2000), Agglomeration economies, firms heterogeneity, and foreign
direct investments in the United States, Strategic Management Journal, 21: 1175-1193.
Frost, T.S., Birkinshaw, J.M., Ensign, P.C. (2002), Centers of excellence in multinational
corporations, Strategic Management Journal, 23: 997–1018.
Frost, T.S. (2001), The geographic sources of foreign subsidiaries’ innovation, Strategic
Management Journal, 22: 101-123.

35
Griliches, Z. (1990), Patent statistics as economic indicators: A survey, Journal of Economic
Literature, 28: 1661-1707.
Griffith, R., Redding, S., Van Reenen, J. (2003), R&D and absorptive capacity: Theory and
empirical evidence, Scandinavian Journal of Economics, 105: 99-118.
Griliches, Z. (1979). Issues in assessing the contribution of research and development to
productivity growth. Bell Journal of Economics, 10: 92-116.
Grindley, P.C. and Teece, D.J. (1997). Managing intellectual capital: Licensing and cross-
licensing in semiconductors and electronics. California Management Review, 39: 8-41.
Haskel, J. E., Pereira, S. C., Slaughter, M. J. (2007), Does inward foreign direct investment
boost the productivity of domestic firms? The Review of Economics and Statistics, 89: 482-
496.
He, C. (2002), Information costs, agglomeration economies and the location of foreign direct
investment in China, Regional Studies, 36: 1029-1036.
Head, K. C., Ries, J. C., Swenson, D. L. (1999), Attracting foreign manufacturing: investment
promotion and agglomeration, Regional Science and Urban Economics, 29, 197-218.
Head, K. C., Ries, J. C., Swenson, D. L. (1995), Agglomeration benefits and location choice:
Evidence from Japanese manufacturing investments in the United States, Journal of
International Economics, 38: 223-247.
Hogenbirk A., Narula R. (2004) Location and agglomeration of FDI in The Netherlands:
implications for policy. Research memoranda 006, Maastricht: MERIT, Maastricht
Economic Research Institute on Innovation and Technology.
Holmes, T.J., Stevens, J.J. (2002), Geographic concentration and establishment scale, The
Review of Economics and Statistics, 84: 682-690
Hymer, S.H. (1960) The international operations of national firms: A study of direct
investment. Cambridge: MIT, published by MIT Press under same title in 1976.
36
ICE (2008) Rapporto Annuale 2007-2008. L’Italia nell’economia internazionale.
http://www.ice.it/statistiche/rapporto.htm
Italian Office for National Statistics (2001a). 8° Censimento generale dell’industria e dei
servizi, http://www.istat.it/censimenti/industria/.
Italian Office for National Statistics (2001b). I Sistemi locali del lavoro.
http://www.istat.it/salastampa/comunicati/non_calendario/20050721_00/testointegrale.pdf
Jacobs, J. (1969) The Economy of Cities. London: Jonathan Cape.
Jaffe, A., Trajtemberg, M., Fogarty, M. (2000), Knowledge spillovers and patent citations:
Evidence from a survey of inventors, Papers and Proceedings, American Economic Review,
90: 215-218.
Jaffe, A., Trajtemberg, M., Henderson, R. (1993), Geographic localisation of knowledge
spillovers as evidenced by patent citations, Quarterly Journal of Economics, 108: 577-598.
Kafouros, M.I., Buckley, P.J. (2008), Under what conditions do firms benefit from the
research effort of other organizations? Research Policy, 37: 225-239.
Krugman, P. (1991) Geography and Trade. MIT Press: Cambridge MA.
Kuemmerle, W. (1999), The drivers of foreign direct investment into research and
development: and empirical investigation, Journal of International Business Studies, 30: 1-
24.
Leahy, D., Neary, J. P. (2007), Absorptive capacity, R&D spillovers, and public policy,
International Journal of Industrial Organization, 25: 1089-1108.
Lu, J.W. (2002), Intra- and inter-organizational imitative behavior: Institutional influences on
Japanese firms’ entry mode choice, Journal of International Business Studies, 33: 19-37.
Manski, C.F. (2000), Economic analysis of social interactions, The Journal of Economic
Perspectives, 14: 115-136.
37
Mariotti, S., Mutinelli, M. (2009) Italia Multinazionale 2008. Soveria Mannelli: Rubbettino
Editore.
Mariotti S., Piscitello L. (1995). Information costs and location of FDIs within the host
country: empirical evidence from Italy, Journal of International Business Studies, 26: 815-
841.
Marshall, A. (1920) Principles of Economics. London: MacMillan.
McCann P., Mudambi R. (2004), The location behaviour of the multinational enteprise: Some
analytical issues, Growth and Change, 35: 491-524.
McCann P., Mudambi R. (2005), Analytical differences in the economics of geography: The
case of the multinational firm, Environment and Planning, 37: 1857-1876.
McCann P., Mudambi R. (2007) MNEs’ location behaviour and indutrial clustering. In
Piscitello L., Santangelo G.D. (Eds.) Do Multinationals Feed Development and Growth?,
Elsevier, Amsterdam.
Moretti E. (2004), Human capital externalities in cities. In Henderson, J.V., Thisse, J.-F.
(Eds), Handbook of Urban and Regional Economics, Vol. 4, Geography and Cities.
Amsterdam: Elsevier Science/North Holland.
Ottaviano, G., Tabuchi, T., J. F. Thisse. (2002), Agglomeration and Trade Revisited,
International Economic Review, 43: 409-435.
Paci R., Usai S. (2000), Externalities, knowledge spillovers and the spatial distribution of
innovation, GeoJournal, 49: 381-390.
Pagnini, M. (2002) Misura e determinanti dell'agglomerazione spaziale nei comparti
industriali in Italia, Temi di discussione del Servizio Studi della Banca d’Italia, No. 452,
Banca d’Italia, Rome.
Petersen B., Pedersen T. (2002), Coping with liability of foreignness: Different learning
engagements of entrant firms, Journal of International Management, 8: 339-350.
38
Rosenthal S.S., Strange W.C. (2001), The determinants of agglomeration, Journal of Urban
Economics, 50: 191-229.
Rosenthal, S. S., Strange, W. C. (2003), Geography, Industrial Organization, and
Agglomeration, Review of Ecomomics and Statistics, 2: 377–393.
Rosenthal, S. S., Strange, W. C. (2004). Evidence on the Nature and Sources of
Agglomeration Economies. In J.V. Henderson, J.-F. Thisse (Eds), Handbook of Urban and
Regional Economics, Vol. 4, Geography and Cities. Amsterdam: Elsevier Science/North
Holland.
Saito, H., Gopinath, M. (2009), Plants’ self-selection, agglomeration economies and regional
productivity in Chile, Journal of Economic Geography, 9: 539-558
Sanna-Randaccio, F. and Veugelers, R. (2007) Multinational knowledge spillovers with
decentralized R&D: a game theoretic approach. Journal of International Business Studies,
38: 47–63.
Shaver M. J. (1998), Do foreign-owned and U.S.-owned establishment exhibit the same
location pattern in U.S. manufacturing industries? Journal of International Business
Studies, 29: 469-492.
Shaver J.M., Flyer F. (2000), Agglomeration economies, firm heterogeneity, and foreign
direct investment in the United States, Strategic Management Journal, 21: 1175-1193.
Singh, J. (2007), Asymmetry of knowledge spillovers between MNEs and host country firms,
Journal of International Business Studies, 38: 764-86.
Smarzynska Javorcik, B. (2004), Does foreign direct investment increase the productivity of
domestic firms? In search of spillovers through backward linkages, American Economic
Review, 94: 605-627.
Sorenson, O., Audia, P.G., (2000), The social structure of entrepreneurial activity, American
Journal of Sociology, 106: 424-461.
39
Unctad (2008) World Investment Report 2008. Transnational Corporations and the
Infrastructure Challenge. Geneva and New York: United Nations.
Venables A.J. (1996). Equilibrium locations of vertically linked industries. International
Economic Review, 37: 341-359
Vicente, J., Suire, R. (2009), Why do some places succeed when others decline? A social
interaction model of cluster viability, Journal of Economic Geography, 9: 381-404.
Vicente, J., Suire R. (2007), Informational cascades versus network externalities in locational
choice: Evidence of “ICT clusters” formation and stability, Regional Studies, 41: 173-184.
Zaheer, S. (1995), Overcoming the liability of foreignness, Academy of Management Journal,
38: 341-363.
Zaheer S., Mosakowski E. (1997), The dynamics of the liability of foreignness: a global study
of survival in financial services, Strategic Management Journal, 18: 439-464.
40
Table 1 – Agglomeration of foreign MNEs with other foreign MNEs: Most and least
agglomerated industries
Nace Code γ 15 most agglomerated
industries
160 Manufacture of tobacco products 0.2119 263 Manufacture of ceramic tiles and flags 0.2056 353 Manufacture of aircraft and spacecraft 0.1874
244 Pharmaceuticals, medicinal chemicals and botanical products 0.1112
267 Cutting, shaping and finishing of ornamental and building stones 0.1056
341 Manufacture of motor vehicles 0.0941 247 Manufacture of man-made fibres 0.0890
323
Manufacture of television and radio receivers, sound or video recording or reproducing apparatus and associated goods 0.0839
354 Manufacture of motorcycles and bicycles 0.0807
331 Manufacture of medical and surgical equipment and orthopaedic appliances 0.0687
351 Building and repairing of ships and boats 0.0646
284 Forging, pressing, stamping and roll forming of metal; powder metallurgy 0.0563
332
Manufacture of instruments and appliances for measuring, checking, testing, navigating and other purposes, except industrial process control equipment 0.0553
156 Manufacture of grain mill products, starches and starci products 0.0507
177 Manufacture of knitted and crocheted articles 0.0491
15 least agglomerated industries
271 Manufacture of basic iron and steel and of ferro-alloys -0.0573 362 Manufacture of jewellery and related articles -0.0511
342 Manufacture of bodies (coachwork) for motor vehicles; manufacture of trailers and semi-trailers -0.0285
296 Manufacture of weapons and ammunition -0.0184 372 Recycling of non-metal waste and scrap -0.0180 315 Manufacture of lighting equipment and electric lamps -0.0128
174 Manufacture of made-up textile articles, except apparel -0.0104
366 Miscellaneous manufacturing n.e.c. -0.0091
314 Manufacture of accumulators, primary cells and primary batteries -0.0087
152 Processing and preserving of fish and fish products -0.0071
352 Manufacture of railway and tramway locomotives and rolling stock -0.0069
264 Manufacture of bricks, tiles and construction products, in baked clay -0.0055
297 Manufacture of domestic appliances n.e.c. -0.0035 232 Manufacture of refined petroleum products 0.0006 158 Manufacture of other food products 0.0020
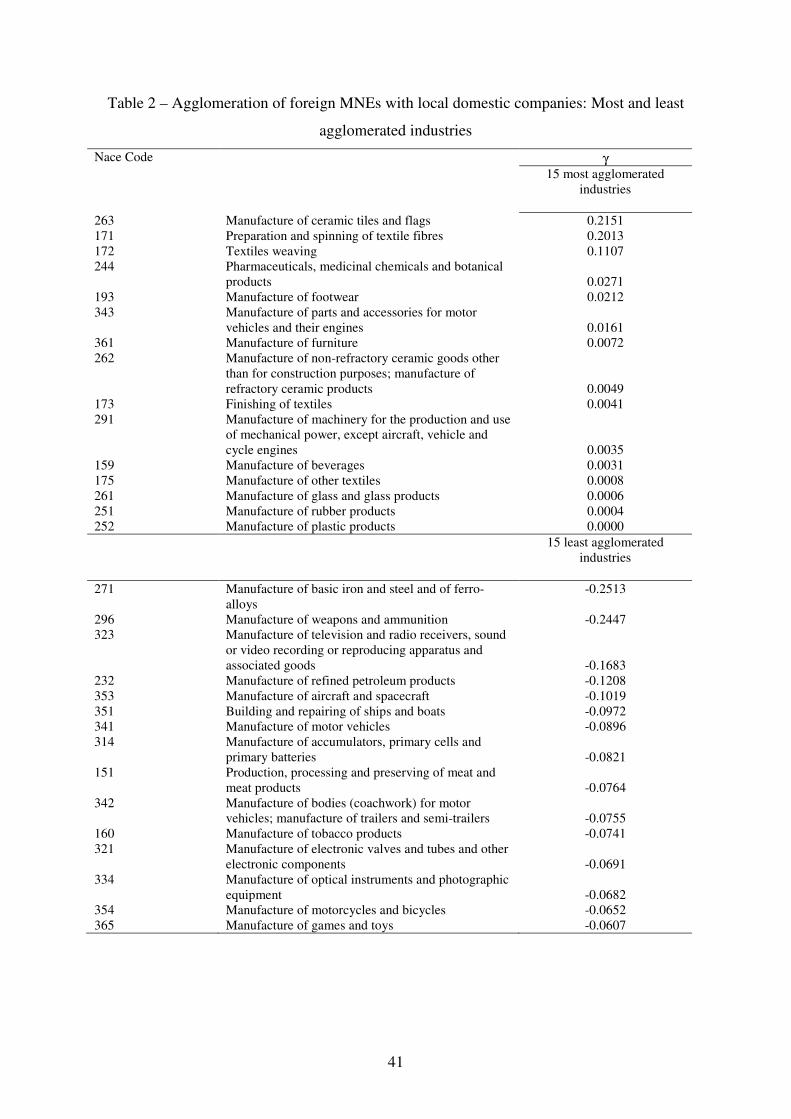
41
Table 2 – Agglomeration of foreign MNEs with local domestic companies: Most and least
agglomerated industries
Nace Code γ 15 most agglomerated
industries
263 Manufacture of ceramic tiles and flags 0.2151 171 Preparation and spinning of textile fibres 0.2013 172 Textiles weaving 0.1107 244 Pharmaceuticals, medicinal chemicals and botanical
products 0.0271 193 Manufacture of footwear 0.0212 343 Manufacture of parts and accessories for motor
vehicles and their engines 0.0161 361 Manufacture of furniture 0.0072 262 Manufacture of non-refractory ceramic goods other
than for construction purposes; manufacture of refractory ceramic products 0.0049
173 Finishing of textiles 0.0041 291 Manufacture of machinery for the production and use
of mechanical power, except aircraft, vehicle and cycle engines 0.0035
159 Manufacture of beverages 0.0031 175 Manufacture of other textiles 0.0008 261 Manufacture of glass and glass products 0.0006 251 Manufacture of rubber products 0.0004 252 Manufacture of plastic products 0.0000
15 least agglomerated industries
271 Manufacture of basic iron and steel and of ferro-alloys
-0.2513
296 Manufacture of weapons and ammunition -0.2447 323 Manufacture of television and radio receivers, sound
or video recording or reproducing apparatus and associated goods -0.1683
232 Manufacture of refined petroleum products -0.1208 353 Manufacture of aircraft and spacecraft -0.1019 351 Building and repairing of ships and boats -0.0972 341 Manufacture of motor vehicles -0.0896 314 Manufacture of accumulators, primary cells and
primary batteries -0.0821 151 Production, processing and preserving of meat and
meat products -0.0764 342 Manufacture of bodies (coachwork) for motor
vehicles; manufacture of trailers and semi-trailers -0.0755 160 Manufacture of tobacco products -0.0741 321 Manufacture of electronic valves and tubes and other
electronic components -0.0691 334 Manufacture of optical instruments and photographic
equipment -0.0682 354 Manufacture of motorcycles and bicycles -0.0652 365 Manufacture of games and toys -0.0607
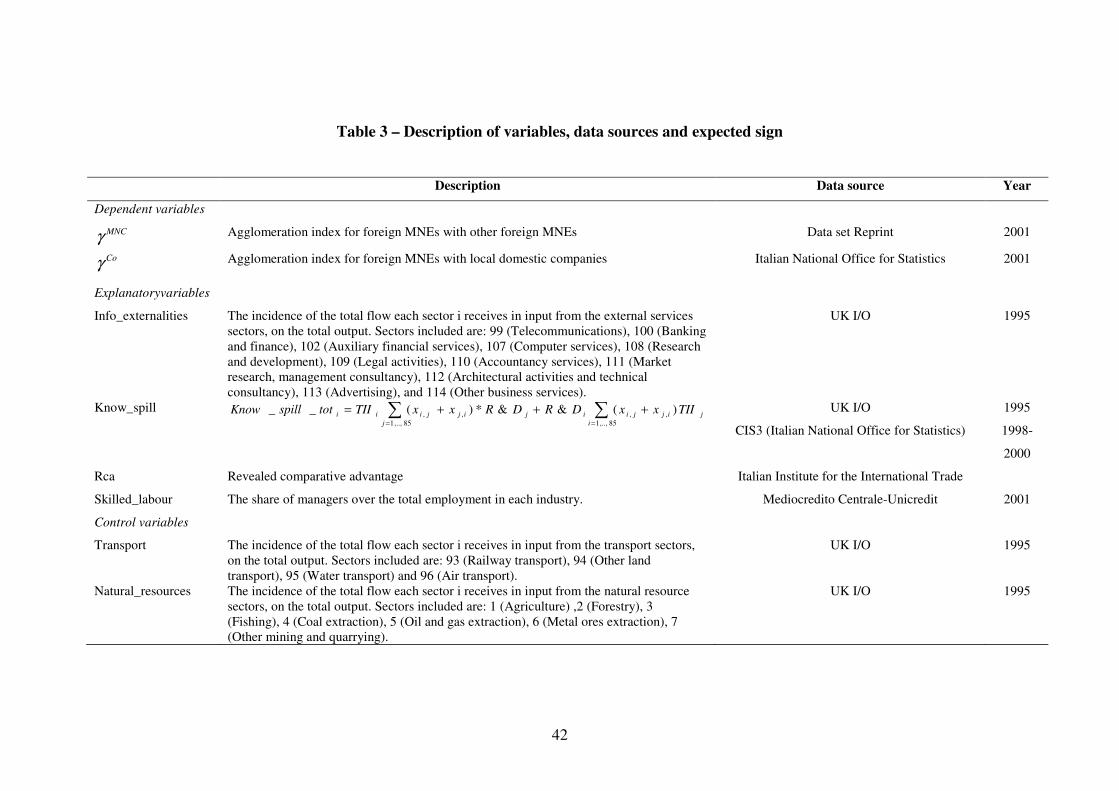
42
Table 3 – Description of variables, data sources and expected sign
Description Data source Year
Dependent variables
MNCγ Agglomeration index for foreign MNEs with other foreign MNEs Data set Reprint 2001
Coγ Agglomeration index for foreign MNEs with local domestic companies Italian National Office for Statistics 2001
Explanatoryvariables
Info_externalities The incidence of the total flow each sector i receives in input from the external services sectors, on the total output. Sectors included are: 99 (Telecommunications), 100 (Banking and finance), 102 (Auxiliary financial services), 107 (Computer services), 108 (Research and development), 109 (Legal activities), 110 (Accountancy services), 111 (Market research, management consultancy), 112 (Architectural activities and technical consultancy), 113 (Advertising), and 114 (Other business services).
UK I/O 1995
Know_spill ∑∑==
+++=85,..,1
,,,
85,..,1
, )(&&*)(__i
jijjiijij
j
jiii TIIxxDRDRxxTIItotspillKnow UK I/O
CIS3 (Italian National Office for Statistics)
1995
1998-
2000
Rca Revealed comparative advantage Italian Institute for the International Trade
Skilled_labour The share of managers over the total employment in each industry. Mediocredito Centrale-Unicredit 2001
Control variables
Transport The incidence of the total flow each sector i receives in input from the transport sectors, on the total output. Sectors included are: 93 (Railway transport), 94 (Other land transport), 95 (Water transport) and 96 (Air transport).
UK I/O 1995
Natural_resources The incidence of the total flow each sector i receives in input from the natural resource sectors, on the total output. Sectors included are: 1 (Agriculture) ,2 (Forestry), 3 (Fishing), 4 (Coal extraction), 5 (Oil and gas extraction), 6 (Metal ores extraction), 7 (Other mining and quarrying).
UK I/O 1995
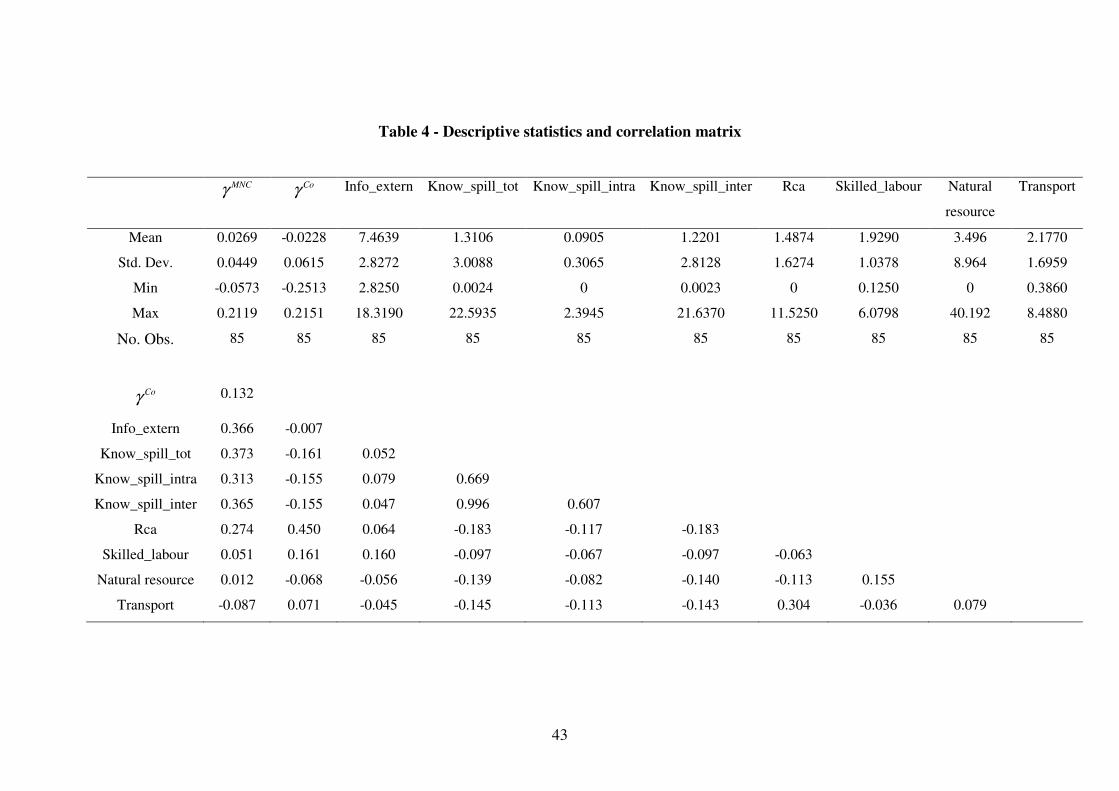
43
Table 4 - Descriptive statistics and correlation matrix
MNCγ Coγ Info_extern Know_spill_tot Know_spill_intra Know_spill_inter Rca Skilled_labour Natural
resource
Transport
Mean 0.0269 -0.0228 7.4639 1.3106 0.0905 1.2201 1.4874 1.9290 3.496 2.1770
Std. Dev. 0.0449 0.0615 2.8272 3.0088 0.3065 2.8128 1.6274 1.0378 8.964 1.6959
Min -0.0573 -0.2513 2.8250 0.0024 0 0.0023 0 0.1250 0 0.3860
Max 0.2119 0.2151 18.3190 22.5935 2.3945 21.6370 11.5250 6.0798 40.192 8.4880
No. Obs. 85 85 85 85 85 85 85 85 85 85
Coγ 0.132
Info_extern 0.366 -0.007
Know_spill_tot 0.373 -0.161 0.052
Know_spill_intra 0.313 -0.155 0.079 0.669
Know_spill_inter 0.365 -0.155 0.047 0.996 0.607
Rca 0.274 0.450 0.064 -0.183 -0.117 -0.183
Skilled_labour 0.051 0.161 0.160 -0.097 -0.067 -0.097 -0.063
Natural resource 0.012 -0.068 -0.056 -0.139 -0.082 -0.140 -0.113 0.155
Transport -0.087 0.071 -0.045 -0.145 -0.113 -0.143 0.304 -0.036 0.079
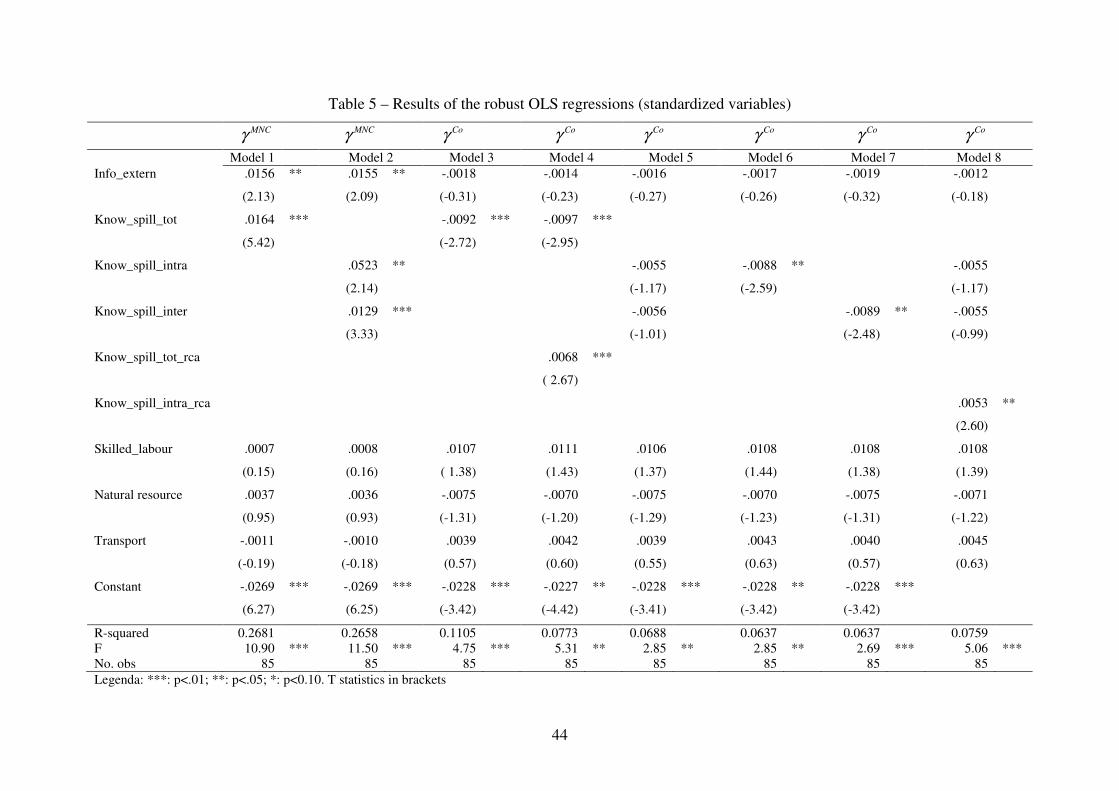
44
Table 5 – Results of the robust OLS regressions (standardized variables)
MNCγ MNCγ Coγ Coγ Coγ Coγ Coγ Coγ
Model 1 Model 2 Model 3 Model 4 Model 5 Model 6 Model 7 Model 8
Info_extern .0156
(2.13)
** .0155
(2.09)
** -.0018
(-0.31)
-.0014
(-0.23)
-.0016
(-0.27)
-.0017
(-0.26)
-.0019
(-0.32)
-.0012
(-0.18)
Know_spill_tot .0164
(5.42)
*** -.0092
(-2.72)
*** -.0097
(-2.95)
***
Know_spill_intra .0523
(2.14)
** -.0055
(-1.17)
-.0088
(-2.59)
** -.0055
(-1.17)
Know_spill_inter .0129
(3.33)
*** -.0056
(-1.01)
-.0089
(-2.48)
** -.0055
(-0.99)
Know_spill_tot_rca .0068
( 2.67)
***
Know_spill_intra_rca .0053
(2.60)
**
Skilled_labour .0007
(0.15)
.0008
(0.16)
.0107
( 1.38)
.0111
(1.43)
.0106
(1.37)
.0108
(1.44)
.0108
(1.38)
.0108
(1.39)
Natural resource .0037
(0.95)
.0036
(0.93)
-.0075
(-1.31)
-.0070
(-1.20)
-.0075
(-1.29)
-.0070
(-1.23)
-.0075
(-1.31)
-.0071
(-1.22)
Transport -.0011
(-0.19)
-.0010
(-0.18)
.0039
(0.57)
.0042
(0.60)
.0039
(0.55)
.0043
(0.63)
.0040
(0.57)
.0045
(0.63)
Constant -.0269
(6.27)
*** -.0269
(6.25)
*** -.0228
(-3.42)
*** -.0227
(-4.42)
** -.0228
(-3.41)
*** -.0228
(-3.42)
** -.0228
(-3.42)
***
R-squared 0.2681 0.2658 0.1105 0.0773 0.0688 0.0637 0.0637 0.0759 F 10.90 *** 11.50 *** 4.75 *** 5.31 ** 2.85 ** 2.85 ** 2.69 *** 5.06 *** No. obs 85 85 85 85 85 85 85 85
Legenda: ***: p<.01; **: p<.05; *: p<0.10. T statistics in brackets
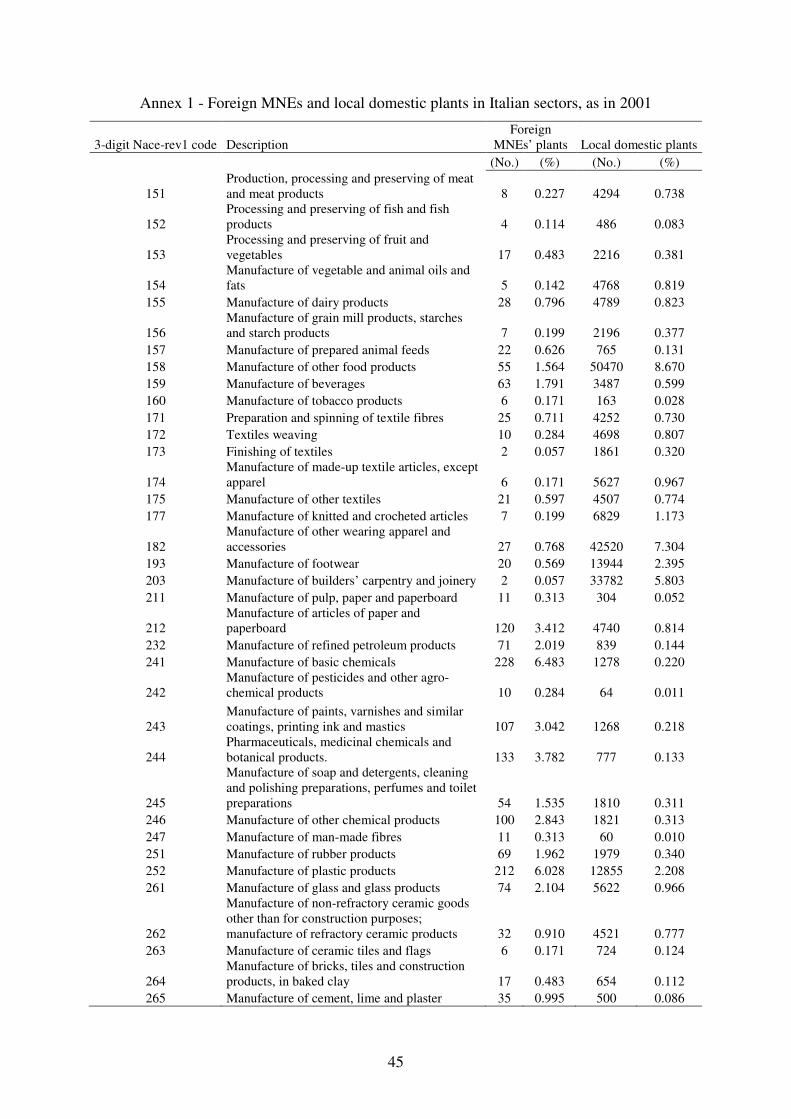
45
Annex 1 - Foreign MNEs and local domestic plants in Italian sectors, as in 2001
3-digit Nace-rev1 code Description Foreign
MNEs’ plants Local domestic plants
(No.) (%) (No.) (%)
151 Production, processing and preserving of meat and meat products 8 0.227 4294 0.738
152 Processing and preserving of fish and fish products 4 0.114 486 0.083
153 Processing and preserving of fruit and vegetables 17 0.483 2216 0.381
154 Manufacture of vegetable and animal oils and fats 5 0.142 4768 0.819
155 Manufacture of dairy products 28 0.796 4789 0.823
156 Manufacture of grain mill products, starches and starch products 7 0.199 2196 0.377
157 Manufacture of prepared animal feeds 22 0.626 765 0.131
158 Manufacture of other food products 55 1.564 50470 8.670
159 Manufacture of beverages 63 1.791 3487 0.599
160 Manufacture of tobacco products 6 0.171 163 0.028
171 Preparation and spinning of textile fibres 25 0.711 4252 0.730
172 Textiles weaving 10 0.284 4698 0.807
173 Finishing of textiles 2 0.057 1861 0.320
174 Manufacture of made-up textile articles, except apparel 6 0.171 5627 0.967
175 Manufacture of other textiles 21 0.597 4507 0.774
177 Manufacture of knitted and crocheted articles 7 0.199 6829 1.173
182 Manufacture of other wearing apparel and accessories 27 0.768 42520 7.304
193 Manufacture of footwear 20 0.569 13944 2.395
203 Manufacture of builders’ carpentry and joinery 2 0.057 33782 5.803
211 Manufacture of pulp, paper and paperboard 11 0.313 304 0.052
212 Manufacture of articles of paper and paperboard 120 3.412 4740 0.814
232 Manufacture of refined petroleum products 71 2.019 839 0.144
241 Manufacture of basic chemicals 228 6.483 1278 0.220
242 Manufacture of pesticides and other agro-chemical products 10 0.284 64 0.011
243 Manufacture of paints, varnishes and similar coatings, printing ink and mastics 107 3.042 1268 0.218
244 Pharmaceuticals, medicinal chemicals and botanical products. 133 3.782 777 0.133
245
Manufacture of soap and detergents, cleaning and polishing preparations, perfumes and toilet preparations 54 1.535 1810 0.311
246 Manufacture of other chemical products 100 2.843 1821 0.313
247 Manufacture of man-made fibres 11 0.313 60 0.010
251 Manufacture of rubber products 69 1.962 1979 0.340
252 Manufacture of plastic products 212 6.028 12855 2.208
261 Manufacture of glass and glass products 74 2.104 5622 0.966
262
Manufacture of non-refractory ceramic goods other than for construction purposes; manufacture of refractory ceramic products 32 0.910 4521 0.777
263 Manufacture of ceramic tiles and flags 6 0.171 724 0.124
264 Manufacture of bricks, tiles and construction products, in baked clay 17 0.483 654 0.112
265 Manufacture of cement, lime and plaster 35 0.995 500 0.086
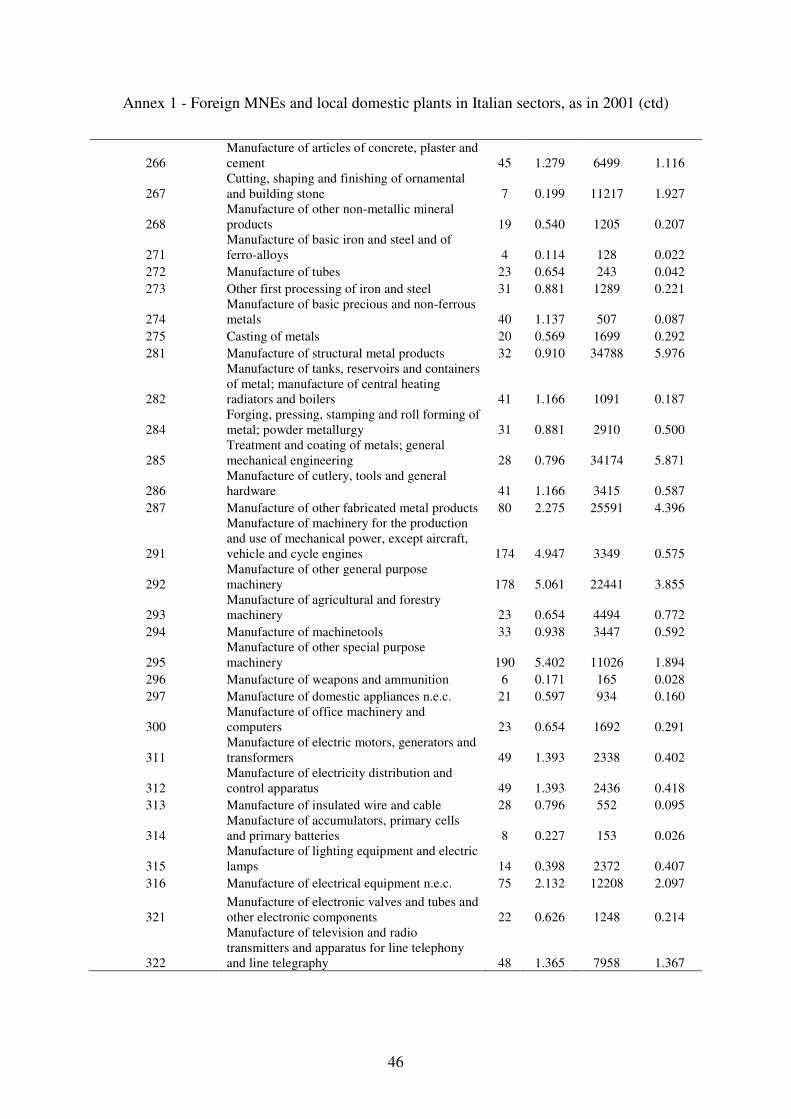
46
Annex 1 - Foreign MNEs and local domestic plants in Italian sectors, as in 2001 (ctd)
266 Manufacture of articles of concrete, plaster and cement 45 1.279 6499 1.116
267 Cutting, shaping and finishing of ornamental and building stone 7 0.199 11217 1.927
268 Manufacture of other non-metallic mineral products 19 0.540 1205 0.207
271 Manufacture of basic iron and steel and of ferro-alloys 4 0.114 128 0.022
272 Manufacture of tubes 23 0.654 243 0.042
273 Other first processing of iron and steel 31 0.881 1289 0.221
274 Manufacture of basic precious and non-ferrous metals 40 1.137 507 0.087
275 Casting of metals 20 0.569 1699 0.292
281 Manufacture of structural metal products 32 0.910 34788 5.976
282
Manufacture of tanks, reservoirs and containers of metal; manufacture of central heating radiators and boilers 41 1.166 1091 0.187
284 Forging, pressing, stamping and roll forming of metal; powder metallurgy 31 0.881 2910 0.500
285 Treatment and coating of metals; general mechanical engineering 28 0.796 34174 5.871
286 Manufacture of cutlery, tools and general hardware 41 1.166 3415 0.587
287 Manufacture of other fabricated metal products 80 2.275 25591 4.396
291
Manufacture of machinery for the production and use of mechanical power, except aircraft, vehicle and cycle engines 174 4.947 3349 0.575
292 Manufacture of other general purpose machinery 178 5.061 22441 3.855
293 Manufacture of agricultural and forestry machinery 23 0.654 4494 0.772
294 Manufacture of machinetools 33 0.938 3447 0.592
295 Manufacture of other special purpose machinery 190 5.402 11026 1.894
296 Manufacture of weapons and ammunition 6 0.171 165 0.028
297 Manufacture of domestic appliances n.e.c. 21 0.597 934 0.160
300 Manufacture of office machinery and computers 23 0.654 1692 0.291
311 Manufacture of electric motors, generators and transformers 49 1.393 2338 0.402
312 Manufacture of electricity distribution and control apparatus 49 1.393 2436 0.418
313 Manufacture of insulated wire and cable 28 0.796 552 0.095
314 Manufacture of accumulators, primary cells and primary batteries 8 0.227 153 0.026
315 Manufacture of lighting equipment and electric lamps 14 0.398 2372 0.407
316 Manufacture of electrical equipment n.e.c. 75 2.132 12208 2.097
321 Manufacture of electronic valves and tubes and other electronic components 22 0.626 1248 0.214
322
Manufacture of television and radio transmitters and apparatus for line telephony and line telegraphy 48 1.365 7958 1.367
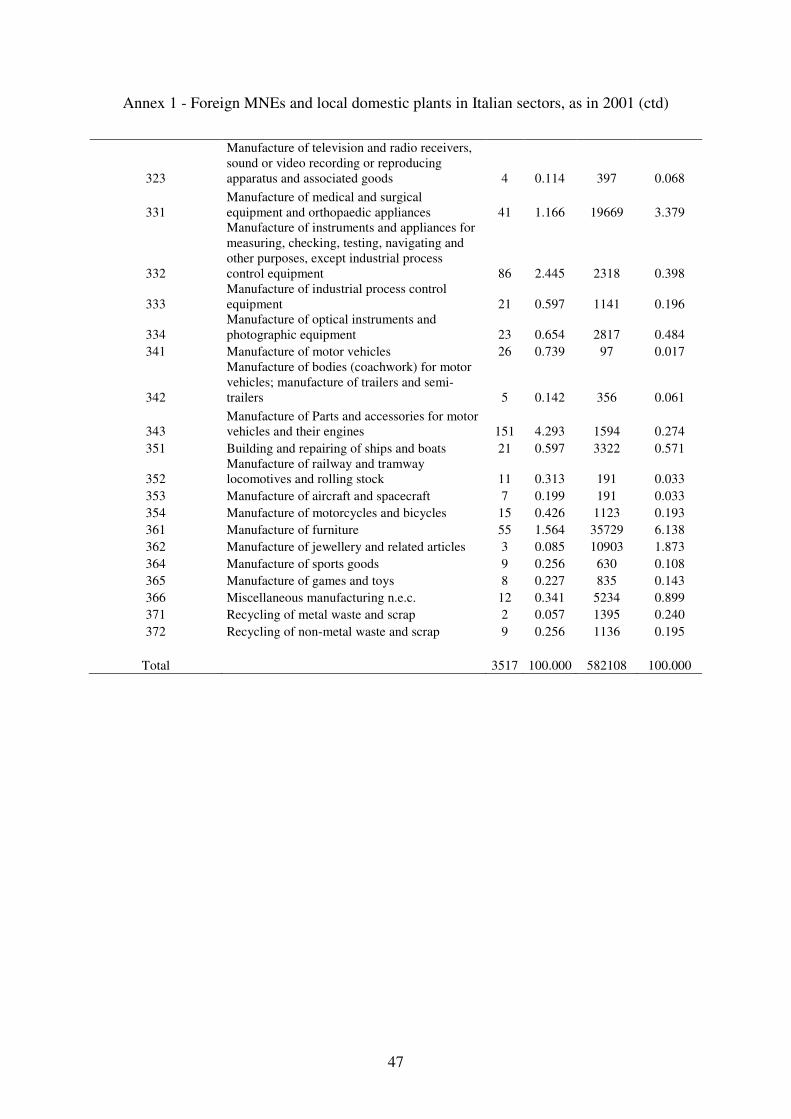
47
Annex 1 - Foreign MNEs and local domestic plants in Italian sectors, as in 2001 (ctd)
323
Manufacture of television and radio receivers, sound or video recording or reproducing apparatus and associated goods 4 0.114 397 0.068
331 Manufacture of medical and surgical equipment and orthopaedic appliances 41 1.166 19669 3.379
332
Manufacture of instruments and appliances for measuring, checking, testing, navigating and other purposes, except industrial process control equipment 86 2.445 2318 0.398
333 Manufacture of industrial process control equipment 21 0.597 1141 0.196
334 Manufacture of optical instruments and photographic equipment 23 0.654 2817 0.484
341 Manufacture of motor vehicles 26 0.739 97 0.017
342
Manufacture of bodies (coachwork) for motor vehicles; manufacture of trailers and semi-trailers 5 0.142 356 0.061
343 Manufacture of Parts and accessories for motor vehicles and their engines 151 4.293 1594 0.274
351 Building and repairing of ships and boats 21 0.597 3322 0.571
352 Manufacture of railway and tramway locomotives and rolling stock 11 0.313 191 0.033
353 Manufacture of aircraft and spacecraft 7 0.199 191 0.033
354 Manufacture of motorcycles and bicycles 15 0.426 1123 0.193
361 Manufacture of furniture 55 1.564 35729 6.138
362 Manufacture of jewellery and related articles 3 0.085 10903 1.873
364 Manufacture of sports goods 9 0.256 630 0.108
365 Manufacture of games and toys 8 0.227 835 0.143
366 Miscellaneous manufacturing n.e.c. 12 0.341 5234 0.899
371 Recycling of metal waste and scrap 2 0.057 1395 0.240
372 Recycling of non-metal waste and scrap 9 0.256 1136 0.195
Total 3517 100.000 582108 100.000
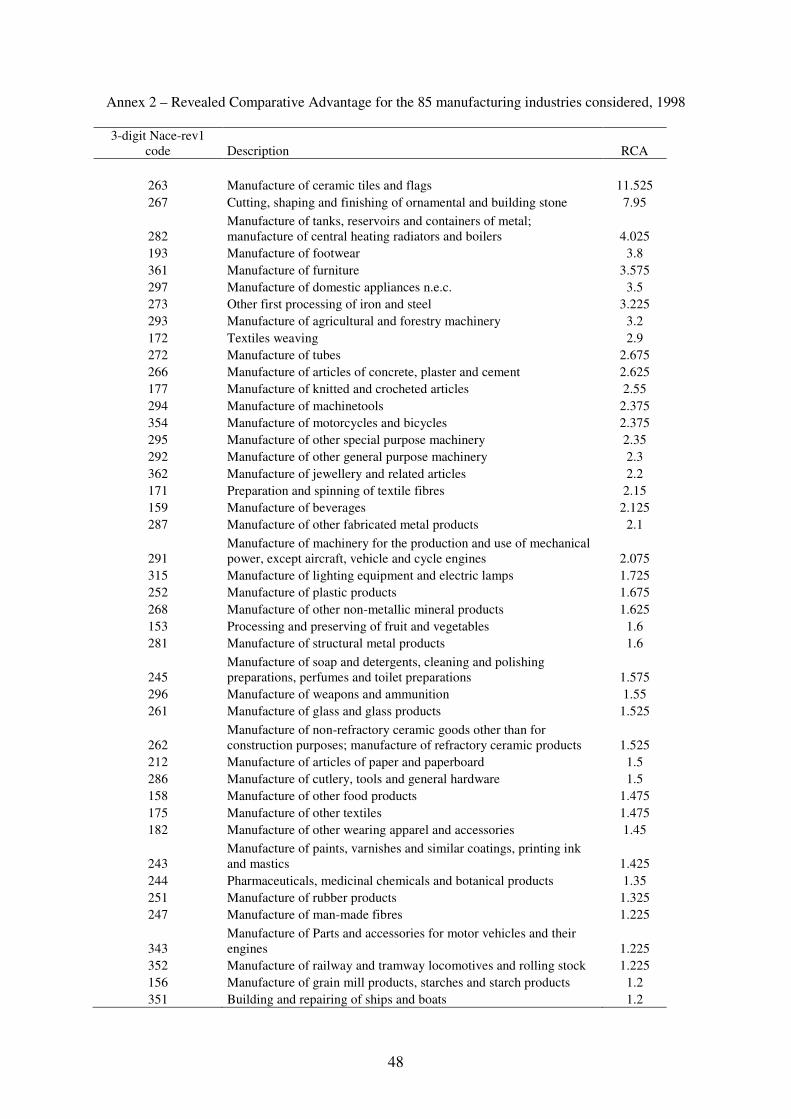
48
Annex 2 – Revealed Comparative Advantage for the 85 manufacturing industries considered, 1998
3-digit Nace-rev1 code Description RCA
263 Manufacture of ceramic tiles and flags 11.525
267 Cutting, shaping and finishing of ornamental and building stone 7.95
282 Manufacture of tanks, reservoirs and containers of metal; manufacture of central heating radiators and boilers 4.025
193 Manufacture of footwear 3.8
361 Manufacture of furniture 3.575
297 Manufacture of domestic appliances n.e.c. 3.5
273 Other first processing of iron and steel 3.225
293 Manufacture of agricultural and forestry machinery 3.2
172 Textiles weaving 2.9
272 Manufacture of tubes 2.675
266 Manufacture of articles of concrete, plaster and cement 2.625
177 Manufacture of knitted and crocheted articles 2.55
294 Manufacture of machinetools 2.375
354 Manufacture of motorcycles and bicycles 2.375
295 Manufacture of other special purpose machinery 2.35
292 Manufacture of other general purpose machinery 2.3
362 Manufacture of jewellery and related articles 2.2
171 Preparation and spinning of textile fibres 2.15
159 Manufacture of beverages 2.125
287 Manufacture of other fabricated metal products 2.1
291 Manufacture of machinery for the production and use of mechanical power, except aircraft, vehicle and cycle engines 2.075
315 Manufacture of lighting equipment and electric lamps 1.725
252 Manufacture of plastic products 1.675
268 Manufacture of other non-metallic mineral products 1.625
153 Processing and preserving of fruit and vegetables 1.6
281 Manufacture of structural metal products 1.6
245 Manufacture of soap and detergents, cleaning and polishing preparations, perfumes and toilet preparations 1.575
296 Manufacture of weapons and ammunition 1.55
261 Manufacture of glass and glass products 1.525
262 Manufacture of non-refractory ceramic goods other than for construction purposes; manufacture of refractory ceramic products 1.525
212 Manufacture of articles of paper and paperboard 1.5
286 Manufacture of cutlery, tools and general hardware 1.5
158 Manufacture of other food products 1.475
175 Manufacture of other textiles 1.475
182 Manufacture of other wearing apparel and accessories 1.45
243 Manufacture of paints, varnishes and similar coatings, printing ink and mastics 1.425
244 Pharmaceuticals, medicinal chemicals and botanical products 1.35
251 Manufacture of rubber products 1.325
247 Manufacture of man-made fibres 1.225
343 Manufacture of Parts and accessories for motor vehicles and their engines 1.225
352 Manufacture of railway and tramway locomotives and rolling stock 1.225
156 Manufacture of grain mill products, starches and starch products 1.2
351 Building and repairing of ships and boats 1.2
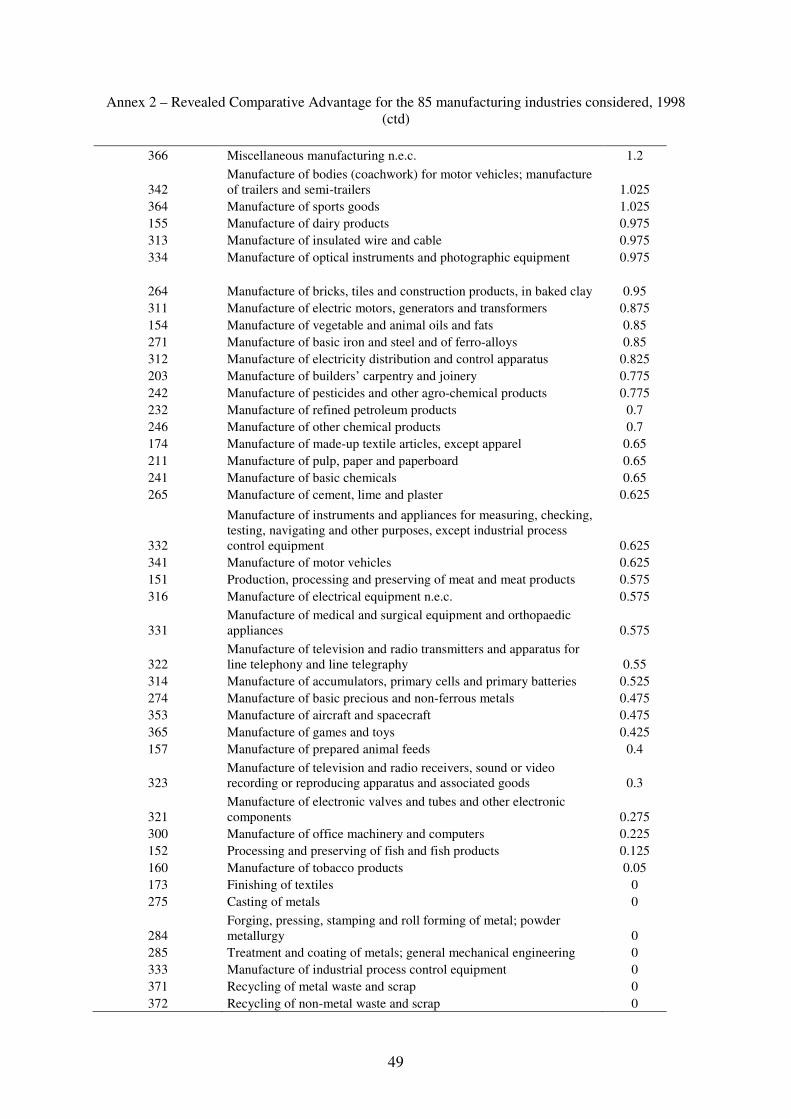
49
Annex 2 – Revealed Comparative Advantage for the 85 manufacturing industries considered, 1998 (ctd)
366 Miscellaneous manufacturing n.e.c. 1.2
342 Manufacture of bodies (coachwork) for motor vehicles; manufacture of trailers and semi-trailers 1.025
364 Manufacture of sports goods 1.025
155 Manufacture of dairy products 0.975
313 Manufacture of insulated wire and cable 0.975
334 Manufacture of optical instruments and photographic equipment 0.975
264 Manufacture of bricks, tiles and construction products, in baked clay 0.95
311 Manufacture of electric motors, generators and transformers 0.875
154 Manufacture of vegetable and animal oils and fats 0.85
271 Manufacture of basic iron and steel and of ferro-alloys 0.85
312 Manufacture of electricity distribution and control apparatus 0.825
203 Manufacture of builders’ carpentry and joinery 0.775
242 Manufacture of pesticides and other agro-chemical products 0.775
232 Manufacture of refined petroleum products 0.7
246 Manufacture of other chemical products 0.7
174 Manufacture of made-up textile articles, except apparel 0.65
211 Manufacture of pulp, paper and paperboard 0.65
241 Manufacture of basic chemicals 0.65
265 Manufacture of cement, lime and plaster 0.625
332
Manufacture of instruments and appliances for measuring, checking, testing, navigating and other purposes, except industrial process control equipment 0.625
341 Manufacture of motor vehicles 0.625
151 Production, processing and preserving of meat and meat products 0.575
316 Manufacture of electrical equipment n.e.c. 0.575
331 Manufacture of medical and surgical equipment and orthopaedic appliances 0.575
322 Manufacture of television and radio transmitters and apparatus for line telephony and line telegraphy 0.55
314 Manufacture of accumulators, primary cells and primary batteries 0.525
274 Manufacture of basic precious and non-ferrous metals 0.475
353 Manufacture of aircraft and spacecraft 0.475
365 Manufacture of games and toys 0.425
157 Manufacture of prepared animal feeds 0.4
323 Manufacture of television and radio receivers, sound or video recording or reproducing apparatus and associated goods 0.3
321 Manufacture of electronic valves and tubes and other electronic components 0.275
300 Manufacture of office machinery and computers 0.225
152 Processing and preserving of fish and fish products 0.125
160 Manufacture of tobacco products 0.05
173 Finishing of textiles 0
275 Casting of metals 0
284 Forging, pressing, stamping and roll forming of metal; powder metallurgy 0
285 Treatment and coating of metals; general mechanical engineering 0
333 Manufacture of industrial process control equipment 0
371 Recycling of metal waste and scrap 0
372 Recycling of non-metal waste and scrap 0

50