Embed Size (px)
Citation preview
Naval Surface Warfare Center Carderock Division
West Bethesda, MD 20817-5700
NSWCCD-83-TM-2013/36 September 2013
Carderock DTIC Catalogue # 80-TR-2014/015 Naval Architecture and Engineering Department
Technical Report
EMPIRICAL EQUATIONS FOR DEVELOPING RIDE SEVERITY ENVELOPES FOR PLANING CRAFT LESS THAN 55 FEET IN LENGTH
By
Combatant Craft Division, Code 83
DISTRIBUTION STATEMENT A: Approved for public release; distribution is unlimited
NS
WC
CD
-83
-TM
-20
13
/36 E
mp
iric
al E
qu
ation
s f
or
Deve
lop
ing
Rid
e S
eve
rity
En
ve
lop
es for
Pla
nin
g C
raft
Le
ss T
ha
n 5
5
Fee
t in
Len
gth
EMPIRICAL EQUATIONS FOR DEVELOPING RIDE SEVERITY ENVELOPES FOR PLANING CRAFT LESS
THAN 55 FEET IN LENGTH NSWCCD-83-TM-2013/36
Prepared by:
__________________________________
Michael R. Riley
Senior Data Analyst
The Columbia Group
Prepared by:
__________________________________
Jason Marshall Senior Craft Design Manager,
Naval Architecture Branch NSWCD Code 831
Reviewed by:
__________________________________
Kelly Haupt
Senior Test Engineer
Test and Evaluation Branch NSWCCD Code 835
Reviewed by:
__________________________________
Don Jacobson
Naval Architect Naval Architecture Branch NSWCCD Code 831
Approved by:
__________________________________
David Pogorzelski Branch Head
Test and Evaluation Branch NSWCCD Code 835
Approved by:
__________________________________
Willard Sokol III Branch Head
Naval Architecture Branch NSWCCD Code 831
Post-Release Revisions
Revision Reviewer/ Approver
Date Change
Description Page, Section
i
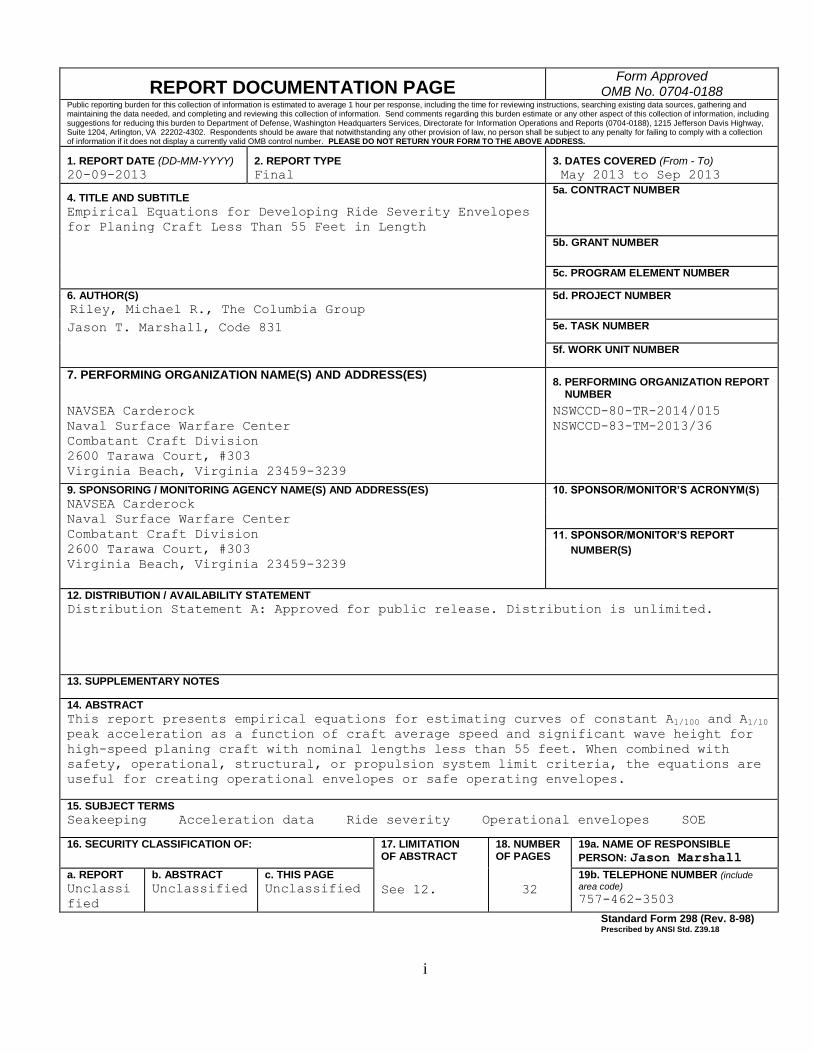
REPORT DOCUMENTATION PAGE Form Approved
OMB No. 0704-0188 Public reporting burden for this collection of information is estimated to average 1 hour per response, including the time for reviewing instructions, searching existing data sources, gathering and maintaining the data needed, and completing and reviewing this collection of information. Send comments regarding this burden estimate or any other aspect of this collection of information, including suggestions for reducing this burden to Department of Defense, Washington Headquarters Services, Directorate for Information Operations and Reports (0704-0188), 1215 Jefferson Davis Highway, Suite 1204, Arlington, VA 22202-4302. Respondents should be aware that notwithstanding any other provision of law, no person shall be subject to any penalty for failing to comply with a collection of information if it does not display a currently valid OMB control number. PLEASE DO NOT RETURN YOUR FORM TO THE ABOVE ADDRESS.
1. REPORT DATE (DD-MM-YYYY)
20-09-2013
2. REPORT TYPE
Final
3. DATES COVERED (From - To)
May 2013 to Sep 2013
4. TITLE AND SUBTITLE
Empirical Equations for Developing Ride Severity Envelopes
for Planing Craft Less Than 55 Feet in Length
5a. CONTRACT NUMBER
5b. GRANT NUMBER
5c. PROGRAM ELEMENT NUMBER
6. AUTHOR(S)
Riley, Michael R., The Columbia Group
5d. PROJECT NUMBER
Jason T. Marshall, Code 831
5e. TASK NUMBER
5f. WORK UNIT NUMBER
7. PERFORMING ORGANIZATION NAME(S) AND ADDRESS(ES)
8. PERFORMING ORGANIZATION REPORT NUMBER
NAVSEA Carderock
Naval Surface Warfare Center
Combatant Craft Division
2600 Tarawa Court, #303
Virginia Beach, Virginia 23459-3239
NSWCCD-80-TR-2014/015
NSWCCD-83-TM-2013/36
9. SPONSORING / MONITORING AGENCY NAME(S) AND ADDRESS(ES) 10. SPONSOR/MONITOR’S ACRONYM(S)
NAVSEA Carderock
Naval Surface Warfare Center
Combatant Craft Division
2600 Tarawa Court, #303
Virginia Beach, Virginia 23459-3239
11. SPONSOR/MONITOR’S REPORT
NUMBER(S)
12. DISTRIBUTION / AVAILABILITY STATEMENT
Distribution Statement A: Approved for public release. Distribution is unlimited.
13. SUPPLEMENTARY NOTES
14. ABSTRACT
This report presents empirical equations for estimating curves of constant A1/100 and A1/10
peak acceleration as a function of craft average speed and significant wave height for
high-speed planing craft with nominal lengths less than 55 feet. When combined with
safety, operational, structural, or propulsion system limit criteria, the equations are
useful for creating operational envelopes or safe operating envelopes.
15. SUBJECT TERMS
Seakeeping Acceleration data Ride severity Operational envelopes SOE
16. SECURITY CLASSIFICATION OF:
17. LIMITATION OF ABSTRACT
18. NUMBER OF PAGES
19a. NAME OF RESPONSIBLE
PERSON: Jason Marshall
a. REPORT
Unclassi
fied
b. ABSTRACT
Unclassified
c. THIS PAGE
Unclassified
See 12.
32
19b. TELEPHONE NUMBER (include
area code)
757-462-3503
Standard Form 298 (Rev. 8-98) Prescribed by ANSI Std. Z39.18

NSWCCD-83-TM-2013/36
ii
This page intentionally left blank
NSWCCD-83-TM-2013/36
iii
Contents
Page
Figures ........................................................................................................................................... iv
Tables ............................................................................................................................................ iv
Administrative Information ..........................................................................................................v
Acknowledgements ........................................................................................................................v
Summary .........................................................................................................................................1
Introduction ....................................................................................................................................1
Purpose................................................................................................................................... 1
Scope ...................................................................................................................................... 1
Background ............................................................................................................................ 1
Wave Impact Severity ............................................................................................................ 3
StandardG .............................................................................................................................. 4
Peak Acceleration Equations ........................................................................................................6
Acceleration Database ........................................................................................................... 6
Equations for Category A Craft ............................................................................................. 7
Equations for Category B Craft ............................................................................................. 9
Crew Comfort and Performance Criteria .................................................................................10
A1/N Acceleration Values ..................................................................................................... 10
Crew Comfort and Performance Transition Zones .............................................................. 11
Craft Speed versus Wave Height Envelopes .............................................................................12
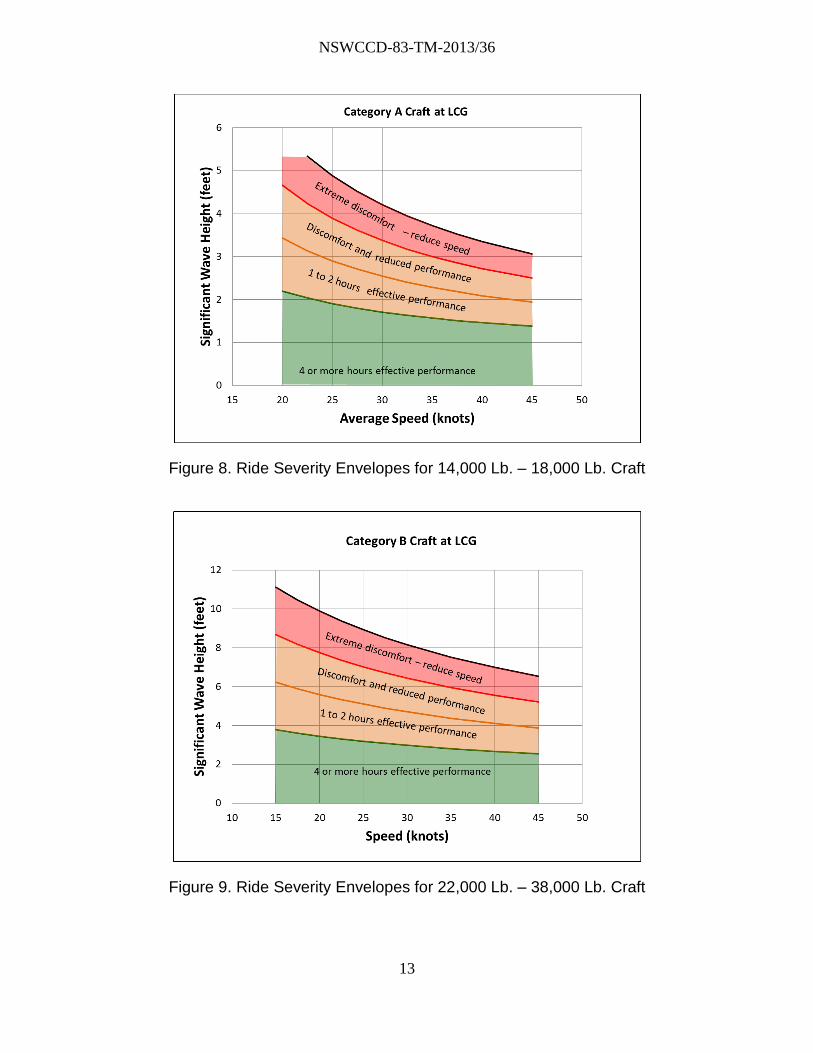
Craft Category A Example Envelopes ................................................................................. 12
Craft Category B Example Envelopes ................................................................................. 12
Observations .................................................................................................................................14
Comfort and Performance Criteria ...................................................................................... 14
Extrapolation of Limited Data ............................................................................................. 14
Craft Heading and Wave Length ......................................................................................... 14
Craft Heading ..............................................................................................................14
NSWCCD-83-TM-2013/36
iv
Wave Length and Wave Period ....................................................................................15
Conclusions and Recommendations ...........................................................................................17
Symbols, Abbreviations, and Acronyms ....................................................................................18
References .....................................................................................................................................19
Distribution ...................................................................................................................................21
Appendix A. Rigid Body Acceleration ...................................................................................... A1
Figures
Page
Figure 1. Example Operational Envelopes for Small Planing Craft ................................................2
Figure 2. Example Unfiltered Acceleration Record ........................................................................5
Figure 3. StandardG Algorithm Peak Acceleration Output.............................................................6
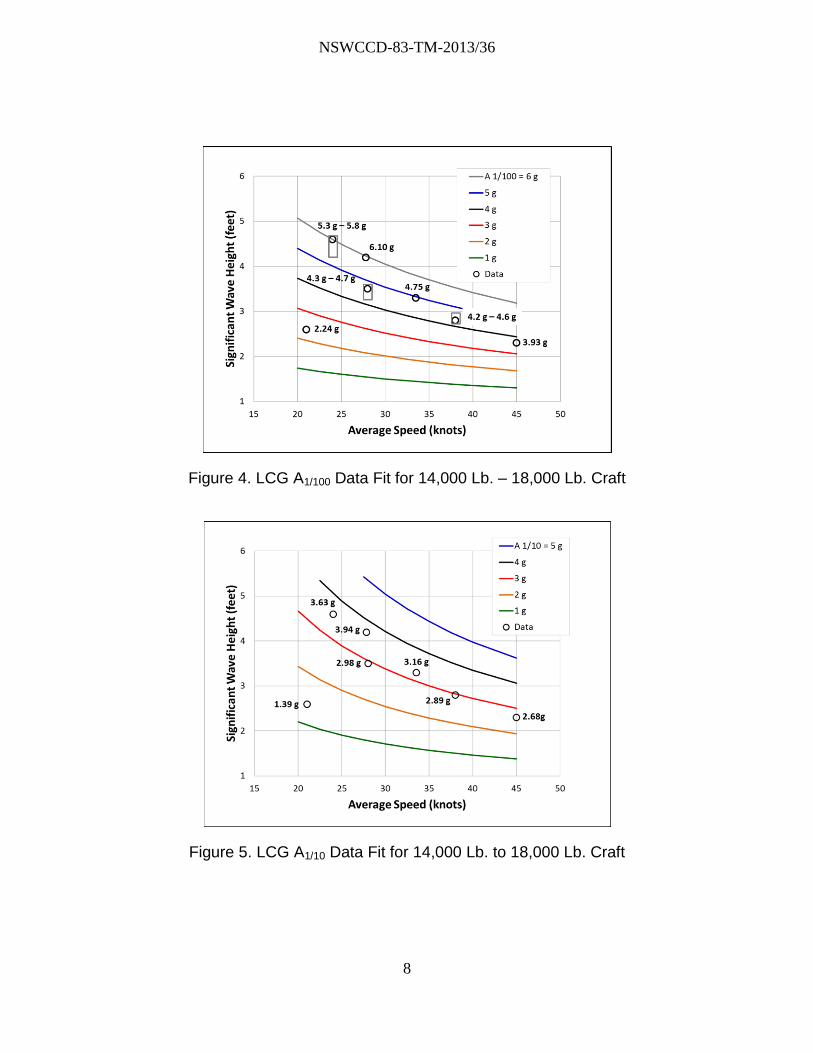
Figure 4. LCG A1/100 Data Fit for 14,000 Lb. – 18,000 Lb. Craft ...................................................8
Figure 5. LCG A1/10 Data Fit for 14,000 Lb. to 18,000 Lb. Craft....................................................8
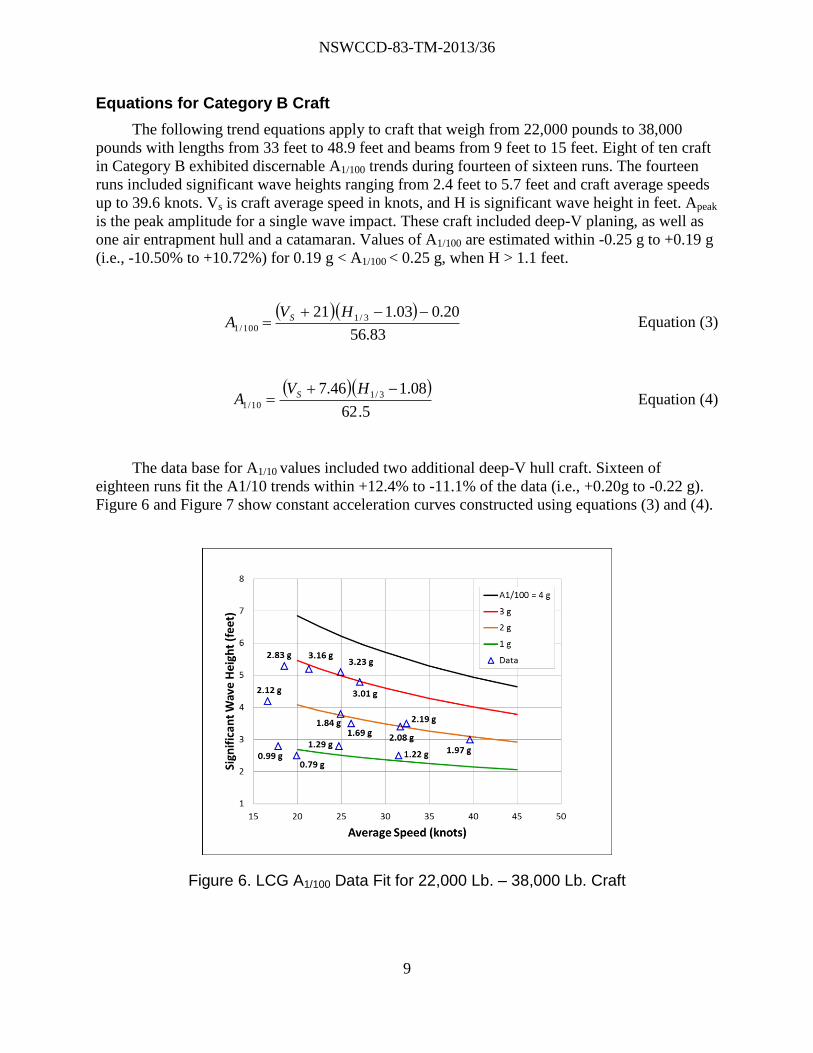
Figure 6. LCG A1/100 Data Fit for 22,000 Lb. – 38,000 Lb. Craft ...................................................9
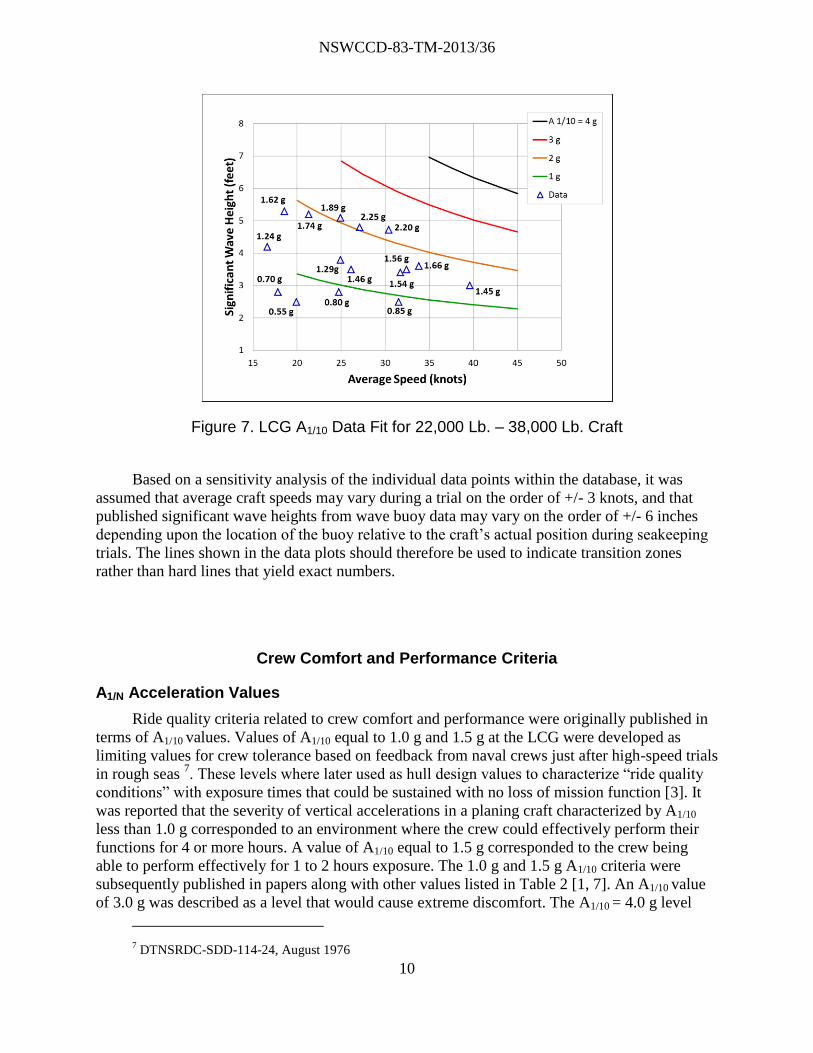
Figure 7. LCG A1/10 Data Fit for 22,000 Lb. – 38,000 Lb. Craft ...................................................10
Figure 8. Ride Severity Envelopes for 14,000 Lb. – 18,000 Lb. Craft ..........................................13
Figure 9. Ride Severity Envelopes for 22,000 Lb. – 38,000 Lb. Craft ..........................................13
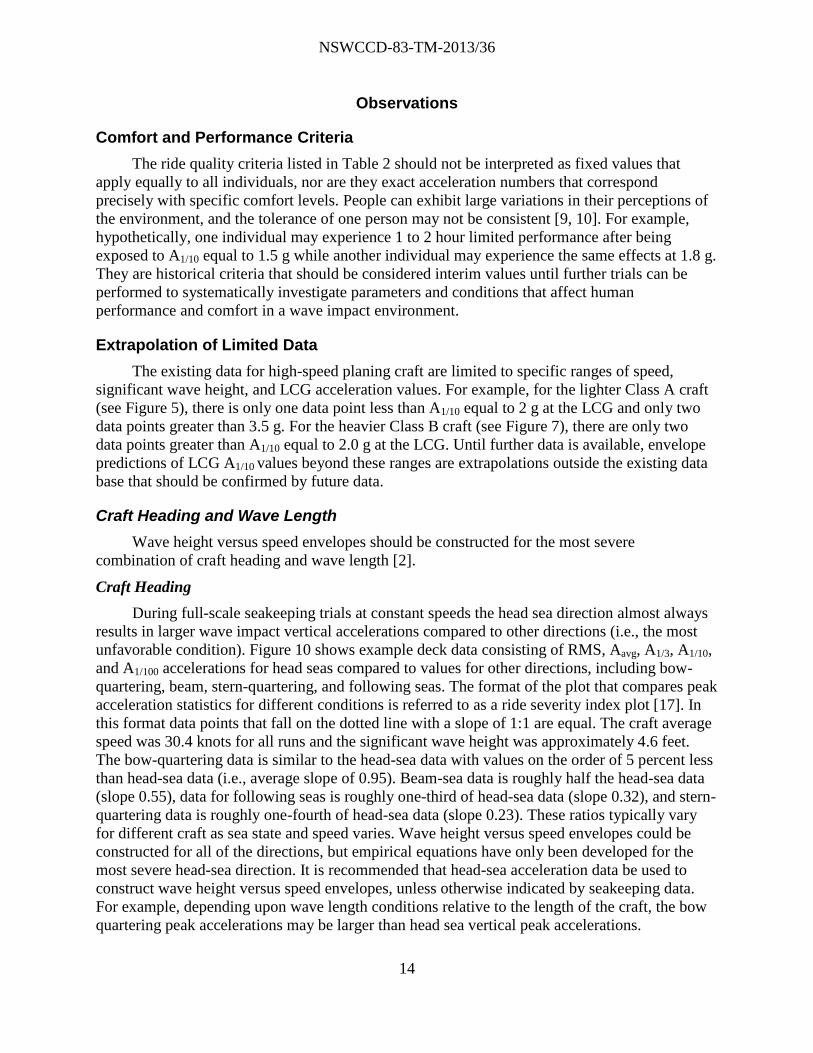
Figure 10. Example Head Sea Accelerations versus Other Directions ..........................................15
Figure 11. Effect of Wave Period on Impact Accelerations ..........................................................16
Tables
Page
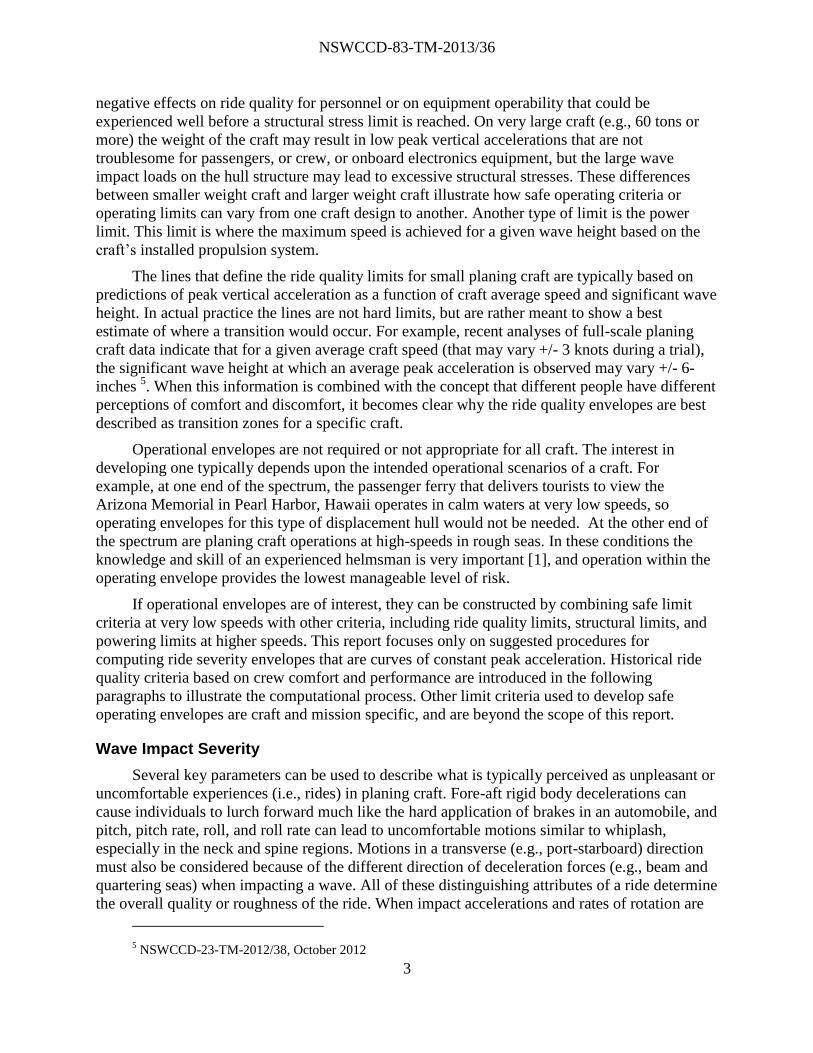
Table 1. Craft Characteristics ..........................................................................................................7
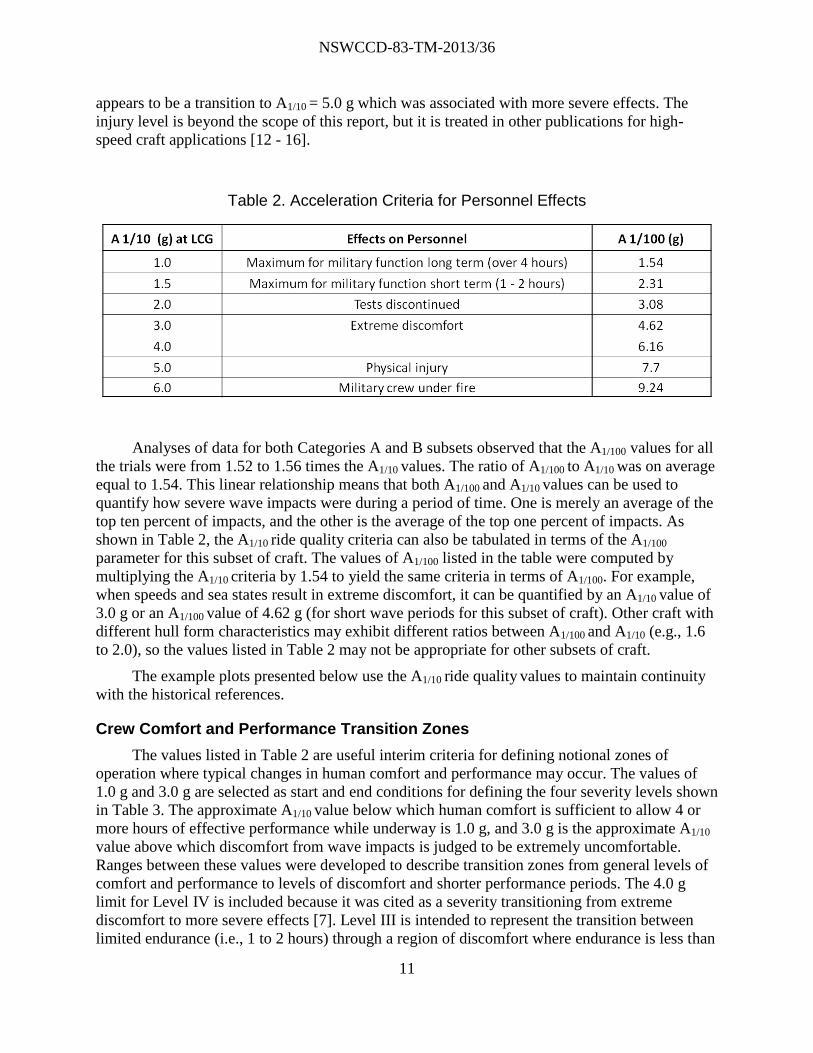
Table 2. Acceleration Criteria for Personnel Effects .....................................................................11
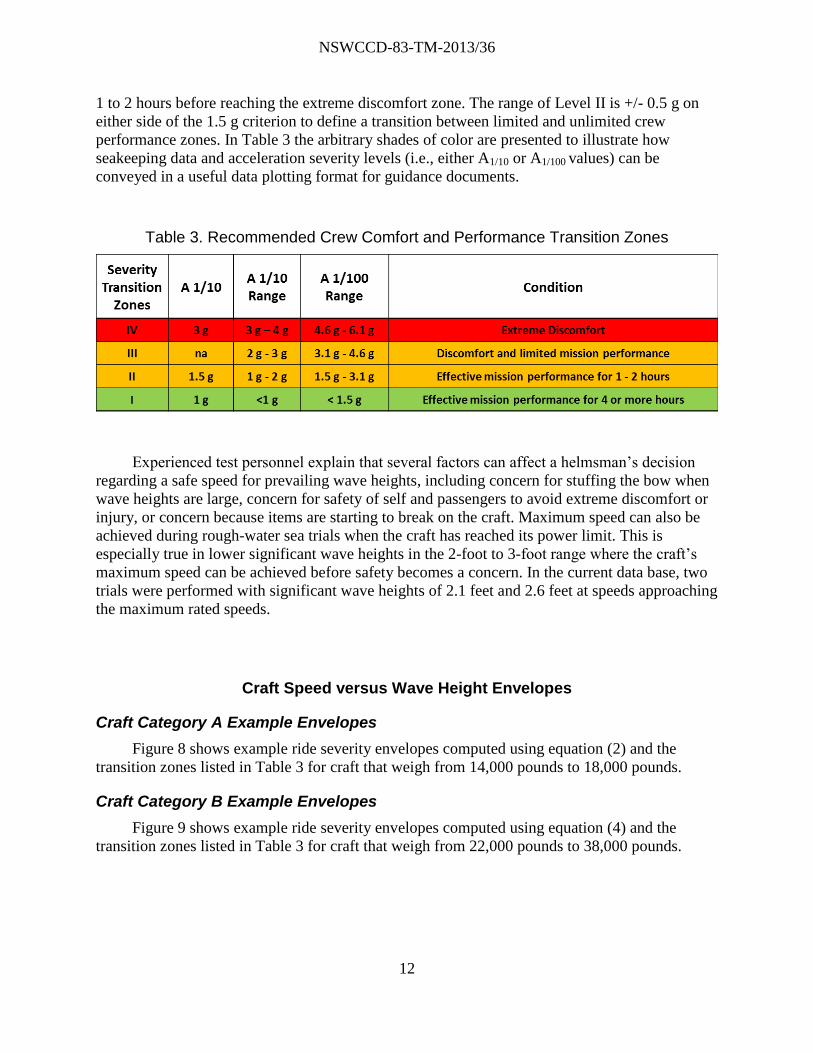
Table 3. Recommended Crew Comfort and Performance Transition Zones .................................12
NSWCCD-83-TM-2013/36
v
Administrative Information
This work was performed by the Combatant Craft Division (Code 831) of the Naval
Architecture and Engineering Department of Naval Surface Warfare Center, Carderock Division
(NSWCCD).
Acknowledgements
The authors would like to thank many individuals for providing important information
critical to the development of this report. Mr. Donald L. Blount, Donald L. Blount and
Associates, Inc. shared historical information related to the development and use of Navy criteria
for estimating crew comfort and effective mission performance levels. Mr. David Shepard,
Project Officer, USCG Office of Boat Forces (CG-731) shared historical documents and
described criteria and rationale for constructing and using operational envelopes. Ms. Dina
Kowalyshyn, Principal Naval Architect, Band Lavis Division, CDI Marine Company shared craft
acceleration criteria and classification society information.
From the NSWCCD Det Norfolk, Combatant Craft Division, numerous individuals
provided comments and suggestions that improved the quality of the first draft of the report,
including the Naval Architecture Branch, Code 831, Mr. Willard Sokol, Mr. Carl Casamassina,
Mr. Richard Wilson, and Mr. Donald Jacobson; from the Test and Evaluation Branch, Code 835,
Mr. David Pogorzelski, Mr. Kelly Haupt, Mrs. Heidi Murphy, Dr. Neil Ganey, and Mr. Tom
Kush. Mr. Malcolm Whitford, CDI Marine, Inc., Senior Naval Architect also provided valuable
feedback comments on the first draft of the report. Their collective knowledge and willingness to
share is greatly appreciated.
This report is dedicated to Mr. Joseph G. Koelbel, Jr., Naval Architect, 29 October 1928 –
14 January 2013. His numerous papers on the subject, along with those of Donald L. Blount,
David Fox, Stephen Denny, E. Nadine Hubble, and Daniel Savitsky provided foundational
information for this report.
NSWCCD-83-TM-2013/36
1
Summary
This report summarizes historical crew comfort and performance criteria and presents
methods for developing speed versus wave height envelopes for high-speed planing craft. In the
absence of craft specific data, empirical equations based on limited data for craft with nominal
lengths less than 55 feet are presented for estimating acceleration values as a function of craft
weight, average speed, and significant wave height. Predictions for speeds and wave heights
outside the empirical range of applicability are extrapolations that should be confirmed by future
data.
Introduction
Purpose
The purpose of this report is to summarize how the combination of crew comfort and
performance criteria and equations for estimating average peak accelerations can be used to
construct ride severity envelopes for planing craft. The envelopes provide a baseline for
constructing safe operating envelopes for high-speed planing craft.
Scope
The equations for computing speed versus wave height envelopes presented in this report
are applicable only to small planing craft that weigh in the range of 14,000 pounds to 38,000
pounds with lengths from 33 feet to 55 feet. The equations are based on acceleration data
recorded in rough seas with short wave periods like those typically observed on the east coast of
the United States on the order of 6.5 seconds or less. The equations are therefore not applicable
for waves with longer periods (e.g., wave periods typically observed on the west coast of the
United States on the order of 8-seconds or more). The wave height versus speed envelopes
shown in the report were developed using historical crew comfort and mission performance
criteria. Personnel injury modeling is beyond the scope of the report.
Background
When a small planing craft’s speed increases in rough seas the severity of individual wave
impacts also increases. The severity of a wave impact is often described in terms of peak vertical
acceleration. Depending upon the size of the craft, increasing vertical impact accelerations can
lead to numerous problems if craft speed is not reduced.
This report does not focus on how to develop safe operating envelopes, but discussion of
the topic in this introduction explains how the empirical equations and ride quality criteria
presented later in the report could be used with other craft specific limit criteria to construct safe
operating envelopes.
NSWCCD-83-TM-2013/36
2
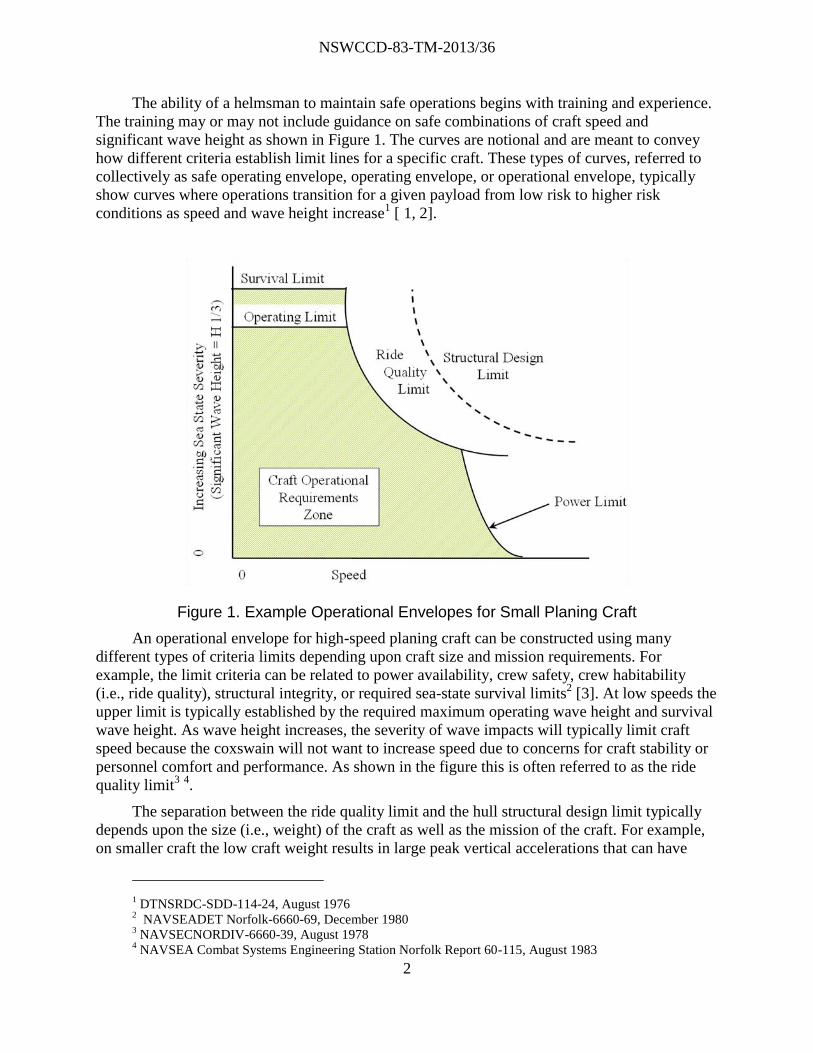
The ability of a helmsman to maintain safe operations begins with training and experience.
The training may or may not include guidance on safe combinations of craft speed and
significant wave height as shown in Figure 1. The curves are notional and are meant to convey
how different criteria establish limit lines for a specific craft. These types of curves, referred to
collectively as safe operating envelope, operating envelope, or operational envelope, typically
show curves where operations transition for a given payload from low risk to higher risk
conditions as speed and wave height increase1 [ 1, 2].
Figure 1. Example Operational Envelopes for Small Planing Craft
An operational envelope for high-speed planing craft can be constructed using many
different types of criteria limits depending upon craft size and mission requirements. For
example, the limit criteria can be related to power availability, crew safety, crew habitability
(i.e., ride quality), structural integrity, or required sea-state survival limits2 [3]. At low speeds the
upper limit is typically established by the required maximum operating wave height and survival
wave height. As wave height increases, the severity of wave impacts will typically limit craft
speed because the coxswain will not want to increase speed due to concerns for craft stability or
personnel comfort and performance. As shown in the figure this is often referred to as the ride
quality limit3 4.
The separation between the ride quality limit and the hull structural design limit typically
depends upon the size (i.e., weight) of the craft as well as the mission of the craft. For example,
on smaller craft the low craft weight results in large peak vertical accelerations that can have
1 DTNSRDC-SDD-114-24, August 1976
2 NAVSEADET Norfolk-6660-69, December 1980
3 NAVSECNORDIV-6660-39, August 1978
4 NAVSEA Combat Systems Engineering Station Norfolk Report 60-115, August 1983
NSWCCD-83-TM-2013/36
3
negative effects on ride quality for personnel or on equipment operability that could be
experienced well before a structural stress limit is reached. On very large craft (e.g., 60 tons or
more) the weight of the craft may result in low peak vertical accelerations that are not
troublesome for passengers, or crew, or onboard electronics equipment, but the large wave
impact loads on the hull structure may lead to excessive structural stresses. These differences
between smaller weight craft and larger weight craft illustrate how safe operating criteria or
operating limits can vary from one craft design to another. Another type of limit is the power
limit. This limit is where the maximum speed is achieved for a given wave height based on the
craft’s installed propulsion system.
The lines that define the ride quality limits for small planing craft are typically based on
predictions of peak vertical acceleration as a function of craft average speed and significant wave
height. In actual practice the lines are not hard limits, but are rather meant to show a best
estimate of where a transition would occur. For example, recent analyses of full-scale planing
craft data indicate that for a given average craft speed (that may vary +/- 3 knots during a trial),
the significant wave height at which an average peak acceleration is observed may vary +/- 6-
inches 5. When this information is combined with the concept that different people have different
perceptions of comfort and discomfort, it becomes clear why the ride quality envelopes are best
described as transition zones for a specific craft.
Operational envelopes are not required or not appropriate for all craft. The interest in
developing one typically depends upon the intended operational scenarios of a craft. For
example, at one end of the spectrum, the passenger ferry that delivers tourists to view the
Arizona Memorial in Pearl Harbor, Hawaii operates in calm waters at very low speeds, so
operating envelopes for this type of displacement hull would not be needed. At the other end of
the spectrum are planing craft operations at high-speeds in rough seas. In these conditions the
knowledge and skill of an experienced helmsman is very important [1], and operation within the
operating envelope provides the lowest manageable level of risk.
If operational envelopes are of interest, they can be constructed by combining safe limit
criteria at very low speeds with other criteria, including ride quality limits, structural limits, and
powering limits at higher speeds. This report focuses only on suggested procedures for
computing ride severity envelopes that are curves of constant peak acceleration. Historical ride
quality criteria based on crew comfort and performance are introduced in the following
paragraphs to illustrate the computational process. Other limit criteria used to develop safe
operating envelopes are craft and mission specific, and are beyond the scope of this report.
Wave Impact Severity
Several key parameters can be used to describe what is typically perceived as unpleasant or
uncomfortable experiences (i.e., rides) in planing craft. Fore-aft rigid body decelerations can
cause individuals to lurch forward much like the hard application of brakes in an automobile, and
pitch, pitch rate, roll, and roll rate can lead to uncomfortable motions similar to whiplash,
especially in the neck and spine regions. Motions in a transverse (e.g., port-starboard) direction
must also be considered because of the different direction of deceleration forces (e.g., beam and
quartering seas) when impacting a wave. All of these distinguishing attributes of a ride determine
the overall quality or roughness of the ride. When impact accelerations and rates of rotation are
5 NSWCCD-23-TM-2012/38, October 2012
NSWCCD-83-TM-2013/36
4
low, the comfort level will typically be perceived as higher (neglecting motion sickness) and the
crew will more likely be able to perform their functions without decreased proficiency over time.
Good human performance attributes such as these are part of the overall description of a hull
design that has good seakeeping qualities [4].
The most common parameter used to describe ride severity has been the vertical rigid body
acceleration [1 to 8]. Vertical accelerations tend to be a better discriminator because they vary
over a larger range than other parameters like pitch or roll. As accelerations increase with speed
and wave height, the discomfort experienced can rapidly lead to extreme discomfort for seated
personnel [9, 10]. As summarized in Appendix A, rigid body heave accelerations should be used
to quantify wave impact loads on hull structure, equipment, and personnel. Acceleration values
are typically based on the same zero reference where -1 g is the acceleration due to gravity. The
fundamental unit of acceleration is length per time-squared (e.g., ft/sec2), but values given in
most publications are normalized for convenience by dividing by the acceleration due to gravity
(e.g., 32.2 ft/sec2).
The widespread practice of averaging peak vertical accelerations over time was adopted to
account for the variability of ocean waves with time. Recorded acceleration data is processed to
calculate the average of the larger peak accelerations, including the average of the highest ten
percent called the average of the one-tenth highest peaks (A1/10), and the average of the highest
one percent called the average of the one-one hundredth highest peaks (A1/100).
In this report all accelerations are vertical rigid body accelerations (i.e., heave
accelerations) decomposed from unfiltered acceleration data using a low-pass filter to remove
acceleration components caused by structural vibrations in the vicinity of the gage. Appendix A
explains why rigid body heave accelerations are directly related to the impulsive load of a wave
impact.
StandardG
StandardG is a software package that applies a four-step process to recorded acceleration
data to extract the accelerations associated with the rigid body motions of planing craft. Rigid
body accelerations can then be used in reverse-engineering processes to estimate dynamic loads
caused by wave impacts. The first two steps apply principles of response mode decomposition to
determine rigid body content in the recorded acceleration signal. The second two steps were
developed specifically for computing the unambiguous average of the highest 1/Nth
peak
accelerations used in naval architecture applications. The use of the StanardG four-step process
enables comparisons of acceleration data results developed by independent researchers and
among different organizations [8].
The StandardG algorithm for extracting rigid body peak accelerations from full-scale
acceleration data and computing standardized A1/N values is available for evaluation from John
Zseleczky, P.E., Branch Head, Hydromechanics Lab, U.S. Naval Academy, [email protected],
(410) 293-5102. It can be run by MATLABTM
or OctaveTM
software. The information package
includes sample raw acceleration data, explanatory text files, computational results, and
applicable papers and reports. The algorithm was specifically developed for computing rigid
body A1/N accelerations using acceleration data acquired using accepted instrumentation
practices [11].
NSWCCD-83-TM-2013/36
5
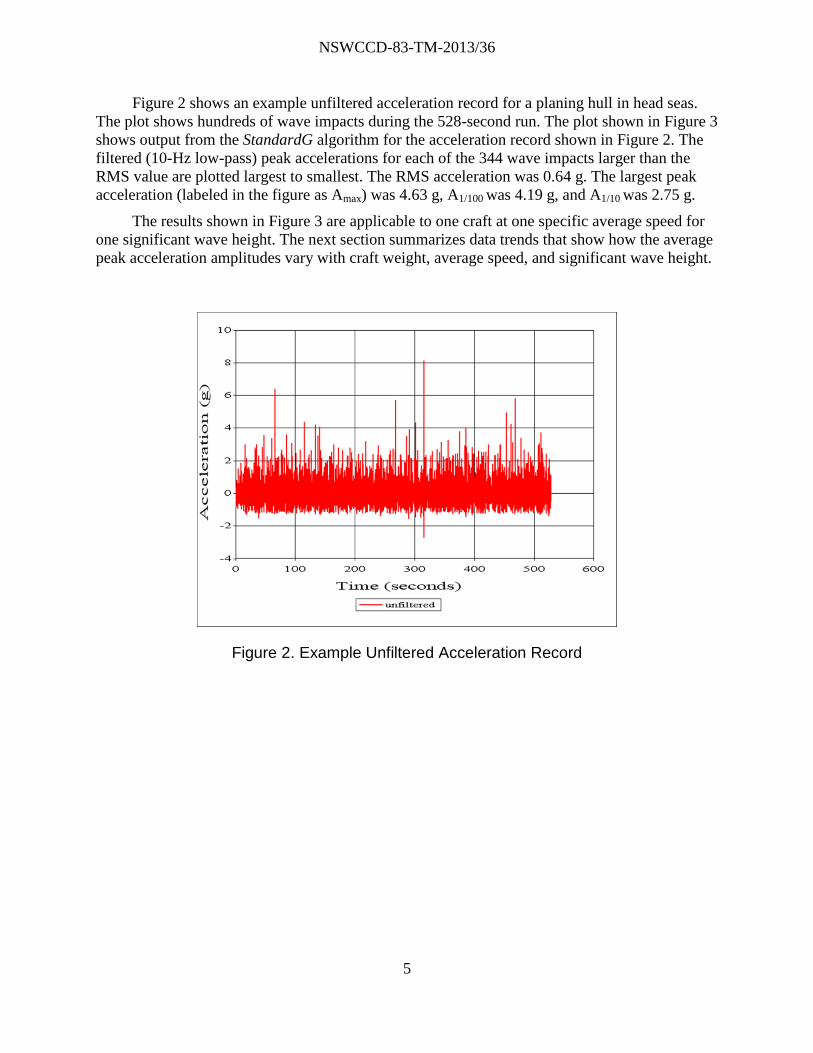
Figure 2 shows an example unfiltered acceleration record for a planing hull in head seas.
The plot shows hundreds of wave impacts during the 528-second run. The plot shown in Figure 3
shows output from the StandardG algorithm for the acceleration record shown in Figure 2. The
filtered (10-Hz low-pass) peak accelerations for each of the 344 wave impacts larger than the
RMS value are plotted largest to smallest. The RMS acceleration was 0.64 g. The largest peak
acceleration (labeled in the figure as Amax) was 4.63 g, A1/100 was 4.19 g, and A1/10 was 2.75 g.
The results shown in Figure 3 are applicable to one craft at one specific average speed for
one significant wave height. The next section summarizes data trends that show how the average
peak acceleration amplitudes vary with craft weight, average speed, and significant wave height.
Figure 2. Example Unfiltered Acceleration Record

NSWCCD-83-TM-2013/36
6
Figure 3. StandardG Algorithm Peak Acceleration Output
Peak Acceleration Equations
Acceleration Database
Analyses of acceleration data recorded during seakeeping trials for fifteen craft in head
seas found that observable trends existed within two craft weight categories 6. Category A
includes craft that weigh from 14,000 pounds to 18,000 pounds. Category B includes craft that
weigh from 22,000 pounds to 38,000 pounds. Table 1 lists characteristic parameters for craft in
each weight category. The beam loading coefficient is the displacement of the craft divided by
the product of the mass density of water and the craft beam cubed. Trim is static trim, and in the
eighth column the speed ratio is craft speed (V) divided by the square-root of craft length (L,
length overall).
6 NSWCCD-23-TM-2012/38, October 2012
NSWCCD-83-TM-2013/36
7
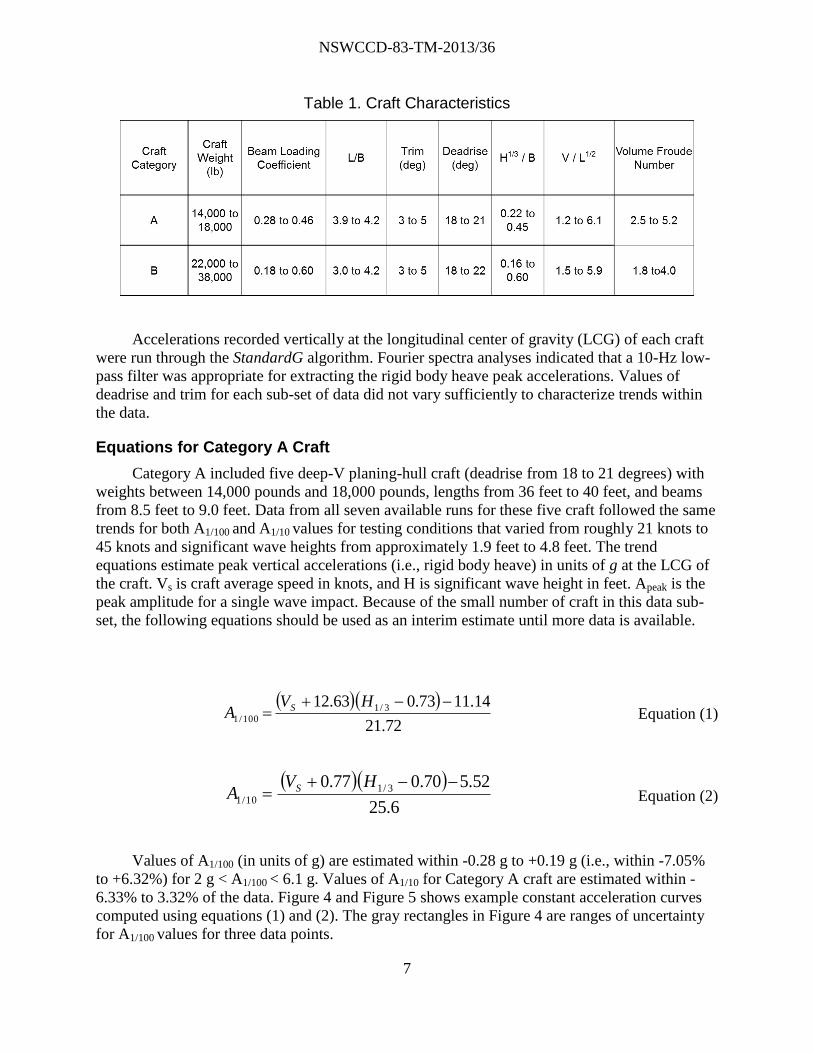
Table 1. Craft Characteristics
Accelerations recorded vertically at the longitudinal center of gravity (LCG) of each craft
were run through the StandardG algorithm. Fourier spectra analyses indicated that a 10-Hz low-
pass filter was appropriate for extracting the rigid body heave peak accelerations. Values of
deadrise and trim for each sub-set of data did not vary sufficiently to characterize trends within
the data.
Equations for Category A Craft
Category A included five deep-V planing-hull craft (deadrise from 18 to 21 degrees) with
weights between 14,000 pounds and 18,000 pounds, lengths from 36 feet to 40 feet, and beams
from 8.5 feet to 9.0 feet. Data from all seven available runs for these five craft followed the same
trends for both A1/100 and A1/10 values for testing conditions that varied from roughly 21 knots to
45 knots and significant wave heights from approximately 1.9 feet to 4.8 feet. The trend
equations estimate peak vertical accelerations (i.e., rigid body heave) in units of g at the LCG of
the craft. Vs is craft average speed in knots, and H is significant wave height in feet. Apeak is the
peak amplitude for a single wave impact. Because of the small number of craft in this data sub-
set, the following equations should be used as an interim estimate until more data is available.
72.21
14.1173.063.12 3/1
100/1
HVA S
Equation (1)
6.25
52.570.077.0 3/110/1
HVA S
Equation (2)
Values of A1/100 (in units of g) are estimated within -0.28 g to +0.19 g (i.e., within -7.05%
to +6.32%) for 2 g < A1/100 < 6.1 g. Values of A1/10 for Category A craft are estimated within -
6.33% to 3.32% of the data. Figure 4 and Figure 5 shows example constant acceleration curves
computed using equations (1) and (2). The gray rectangles in Figure 4 are ranges of uncertainty
for A1/100 values for three data points.
NSWCCD-83-TM-2013/36
8
Figure 4. LCG A1/100 Data Fit for 14,000 Lb. – 18,000 Lb. Craft
Figure 5. LCG A1/10 Data Fit for 14,000 Lb. to 18,000 Lb. Craft
NSWCCD-83-TM-2013/36
9
Equations for Category B Craft
The following trend equations apply to craft that weigh from 22,000 pounds to 38,000
pounds with lengths from 33 feet to 48.9 feet and beams from 9 feet to 15 feet. Eight of ten craft
in Category B exhibited discernable A1/100 trends during fourteen of sixteen runs. The fourteen
runs included significant wave heights ranging from 2.4 feet to 5.7 feet and craft average speeds
up to 39.6 knots. Vs is craft average speed in knots, and H is significant wave height in feet. Apeak
is the peak amplitude for a single wave impact. These craft included deep-V planing, as well as
one air entrapment hull and a catamaran. Values of A1/100 are estimated within -0.25 g to +0.19 g
(i.e., -10.50% to +10.72%) for 0.19 g < A1/100 < 0.25 g, when H > 1.1 feet.
83.56
20.003.121 3/1
100/1
HVA S Equation (3)
5.62
08.146.7 3/110/1
HVA S Equation (4)
The data base for A1/10 values included two additional deep-V hull craft. Sixteen of
eighteen runs fit the A1/10 trends within +12.4% to -11.1% of the data (i.e., +0.20g to -0.22 g).
Figure 6 and Figure 7 show constant acceleration curves constructed using equations (3) and (4).
Figure 6. LCG A1/100 Data Fit for 22,000 Lb. – 38,000 Lb. Craft
NSWCCD-83-TM-2013/36
10
Figure 7. LCG A1/10 Data Fit for 22,000 Lb. – 38,000 Lb. Craft
Based on a sensitivity analysis of the individual data points within the database, it was
assumed that average craft speeds may vary during a trial on the order of +/- 3 knots, and that
published significant wave heights from wave buoy data may vary on the order of +/- 6 inches
depending upon the location of the buoy relative to the craft’s actual position during seakeeping
trials. The lines shown in the data plots should therefore be used to indicate transition zones
rather than hard lines that yield exact numbers.
Crew Comfort and Performance Criteria
A1/N Acceleration Values
Ride quality criteria related to crew comfort and performance were originally published in
terms of A1/10 values. Values of A1/10 equal to 1.0 g and 1.5 g at the LCG were developed as
limiting values for crew tolerance based on feedback from naval crews just after high-speed trials
in rough seas 7. These levels where later used as hull design values to characterize “ride quality
conditions” with exposure times that could be sustained with no loss of mission function [3]. It
was reported that the severity of vertical accelerations in a planing craft characterized by A1/10
less than 1.0 g corresponded to an environment where the crew could effectively perform their
functions for 4 or more hours. A value of A1/10 equal to 1.5 g corresponded to the crew being
able to perform effectively for 1 to 2 hours exposure. The 1.0 g and 1.5 g A1/10 criteria were
subsequently published in papers along with other values listed in Table 2 [1, 7]. An A1/10 value
of 3.0 g was described as a level that would cause extreme discomfort. The A1/10 = 4.0 g level
7 DTNSRDC-SDD-114-24, August 1976
NSWCCD-83-TM-2013/36
11
appears to be a transition to A1/10 = 5.0 g which was associated with more severe effects. The
injury level is beyond the scope of this report, but it is treated in other publications for high-
speed craft applications [12 - 16].
Table 2. Acceleration Criteria for Personnel Effects
Analyses of data for both Categories A and B subsets observed that the A1/100 values for all
the trials were from 1.52 to 1.56 times the A1/10 values. The ratio of A1/100 to A1/10 was on average
equal to 1.54. This linear relationship means that both A1/100 and A1/10 values can be used to
quantify how severe wave impacts were during a period of time. One is merely an average of the
top ten percent of impacts, and the other is the average of the top one percent of impacts. As
shown in Table 2, the A1/10 ride quality criteria can also be tabulated in terms of the A1/100
parameter for this subset of craft. The values of A1/100 listed in the table were computed by
multiplying the A1/10 criteria by 1.54 to yield the same criteria in terms of A1/100. For example,
when speeds and sea states result in extreme discomfort, it can be quantified by an A1/10 value of
3.0 g or an A1/100 value of 4.62 g (for short wave periods for this subset of craft). Other craft with
different hull form characteristics may exhibit different ratios between A1/100 and A1/10 (e.g., 1.6
to 2.0), so the values listed in Table 2 may not be appropriate for other subsets of craft.
The example plots presented below use the A1/10 ride quality values to maintain continuity
with the historical references.
Crew Comfort and Performance Transition Zones
The values listed in Table 2 are useful interim criteria for defining notional zones of
operation where typical changes in human comfort and performance may occur. The values of
1.0 g and 3.0 g are selected as start and end conditions for defining the four severity levels shown
in Table 3. The approximate A1/10 value below which human comfort is sufficient to allow 4 or
more hours of effective performance while underway is 1.0 g, and 3.0 g is the approximate A1/10
value above which discomfort from wave impacts is judged to be extremely uncomfortable.
Ranges between these values were developed to describe transition zones from general levels of
comfort and performance to levels of discomfort and shorter performance periods. The 4.0 g
limit for Level IV is included because it was cited as a severity transitioning from extreme
discomfort to more severe effects [7]. Level III is intended to represent the transition between
limited endurance (i.e., 1 to 2 hours) through a region of discomfort where endurance is less than
NSWCCD-83-TM-2013/36
12
1 to 2 hours before reaching the extreme discomfort zone. The range of Level II is +/- 0.5 g on
either side of the 1.5 g criterion to define a transition between limited and unlimited crew
performance zones. In Table 3 the arbitrary shades of color are presented to illustrate how
seakeeping data and acceleration severity levels (i.e., either A1/10 or A1/100 values) can be
conveyed in a useful data plotting format for guidance documents.
Table 3. Recommended Crew Comfort and Performance Transition Zones
Experienced test personnel explain that several factors can affect a helmsman’s decision
regarding a safe speed for prevailing wave heights, including concern for stuffing the bow when
wave heights are large, concern for safety of self and passengers to avoid extreme discomfort or
injury, or concern because items are starting to break on the craft. Maximum speed can also be
achieved during rough-water sea trials when the craft has reached its power limit. This is
especially true in lower significant wave heights in the 2-foot to 3-foot range where the craft’s
maximum speed can be achieved before safety becomes a concern. In the current data base, two
trials were performed with significant wave heights of 2.1 feet and 2.6 feet at speeds approaching
the maximum rated speeds.
Craft Speed versus Wave Height Envelopes
Craft Category A Example Envelopes
Figure 8 shows example ride severity envelopes computed using equation (2) and the
transition zones listed in Table 3 for craft that weigh from 14,000 pounds to 18,000 pounds.
Craft Category B Example Envelopes
Figure 9 shows example ride severity envelopes computed using equation (4) and the
transition zones listed in Table 3 for craft that weigh from 22,000 pounds to 38,000 pounds.
NSWCCD-83-TM-2013/36
13
Figure 8. Ride Severity Envelopes for 14,000 Lb. – 18,000 Lb. Craft
Figure 9. Ride Severity Envelopes for 22,000 Lb. – 38,000 Lb. Craft
NSWCCD-83-TM-2013/36
14
Observations
Comfort and Performance Criteria
The ride quality criteria listed in Table 2 should not be interpreted as fixed values that
apply equally to all individuals, nor are they exact acceleration numbers that correspond
precisely with specific comfort levels. People can exhibit large variations in their perceptions of
the environment, and the tolerance of one person may not be consistent [9, 10]. For example,
hypothetically, one individual may experience 1 to 2 hour limited performance after being
exposed to A1/10 equal to 1.5 g while another individual may experience the same effects at 1.8 g.
They are historical criteria that should be considered interim values until further trials can be
performed to systematically investigate parameters and conditions that affect human
performance and comfort in a wave impact environment.
Extrapolation of Limited Data
The existing data for high-speed planing craft are limited to specific ranges of speed,
significant wave height, and LCG acceleration values. For example, for the lighter Class A craft
(see Figure 5), there is only one data point less than A1/10 equal to 2 g at the LCG and only two
data points greater than 3.5 g. For the heavier Class B craft (see Figure 7), there are only two
data points greater than A1/10 equal to 2.0 g at the LCG. Until further data is available, envelope
predictions of LCG A1/10 values beyond these ranges are extrapolations outside the existing data
base that should be confirmed by future data.
Craft Heading and Wave Length
Wave height versus speed envelopes should be constructed for the most severe
combination of craft heading and wave length [2].
Craft Heading
During full-scale seakeeping trials at constant speeds the head sea direction almost always
results in larger wave impact vertical accelerations compared to other directions (i.e., the most
unfavorable condition). Figure 10 shows example deck data consisting of RMS, Aavg, A1/3, A1/10,
and A1/100 accelerations for head seas compared to values for other directions, including bow-
quartering, beam, stern-quartering, and following seas. The format of the plot that compares peak
acceleration statistics for different conditions is referred to as a ride severity index plot [17]. In
this format data points that fall on the dotted line with a slope of 1:1 are equal. The craft average
speed was 30.4 knots for all runs and the significant wave height was approximately 4.6 feet.
The bow-quartering data is similar to the head-sea data with values on the order of 5 percent less
than head-sea data (i.e., average slope of 0.95). Beam-sea data is roughly half the head-sea data
(slope 0.55), data for following seas is roughly one-third of head-sea data (slope 0.32), and stern-
quartering data is roughly one-fourth of head-sea data (slope 0.23). These ratios typically vary
for different craft as sea state and speed varies. Wave height versus speed envelopes could be
constructed for all of the directions, but empirical equations have only been developed for the
most severe head-sea direction. It is recommended that head-sea acceleration data be used to
construct wave height versus speed envelopes, unless otherwise indicated by seakeeping data.
For example, depending upon wave length conditions relative to the length of the craft, the bow
quartering peak accelerations may be larger than head sea vertical peak accelerations.
NSWCCD-83-TM-2013/36
15
Figure 10. Example Head Sea Accelerations versus Other Directions
Wave Length and Wave Period
Depending upon average speed and wave height, smaller planing craft within the scope of
this report tend to follow the wave profile with less bow-up and bow-down pitching when wave
lengths are relatively long. In this environment, the craft seldom becomes airborne and
experiences more wave encounters with little or no pitching. Vertical peak accelerations are
typically on the order of 2.0 g to 2.5 g or less at the LCG under these conditions. When wave
lengths are shorter, small craft may become airborne or partially airborne when average speeds
and wave heights increase. This behavior has been observed in full-scale Category A craft
(volumetric Froude number 2.1 to 3.1) and in scale-model data [18] (volumetric Froude number
greater than 4.5). Even if they do not become airborne, they can experience large bow-up
pitching motions especially in higher sea states and at higher speeds. This is especially true for
the lightest weight Category A craft (i.e., 14,000 pounds to 18,000 pounds). Large pitching
motions or becoming airborne (i.e., even partially) can lead to vertical peak accelerations on the
order of 3.0 g to 7.0 g (i.e., rigid body heave acceleration) or higher depending upon craft
weight, wave height, trim, deadrise, and speed. The shorter wave period environment is therefore
the more severe environment for developing wave height versus speed envelopes.
The majority of the full-scale database used in the study was acquired during trials
conducted off the east coast of the United States. East coast waves usually, but not always, have
shorter wave periods (e.g., 6.5 seconds or less) and smaller wave lengths for a given wave height
than west coast waves, or seas further off-shore in open ocean.
Figure 11 compares seakeeping data for peak accelerations in an 8-second wave period on
the west coast of the U.S. compared to peak accelerations recorded on a similar craft in a 5-
second wave period on the east coast of the United States. The similar craft were 44 feet long

NSWCCD-83-TM-2013/36
16
and weighed approximately 37,000 pounds. The west coast wave length was on the order of 212
feet while the east coast wave length was about 90 feet. The trials had comparable wave heights
(3.1 feet versus 3.4 feet) and comparable average speeds (38.3 knots versus 34.8 knots,
respectively). The comparison shows the longer wave period (i.e., longer wave length) resulted
in vertical accelerations on the order of 42-percent less than the vertical accelerations for the
shorter wave period (i.e., shorter wave length).
Unless the small planing craft’s operating area will always be in the longer wave length
environment (e.g., like the west coast of the U.S.), it is recommended that acceleration data for
the short wave length data be used to develop wave height versus speed envelopes. Equations (1)
thru (4) were developed using short wave length east coast data.
Ride severity envelope estimates for west coast operations could be estimated by
substituting scaled accelerations from Figure 11 into equations (3) and (4).
Figure 11. Effect of Wave Period on Impact Accelerations
NSWCCD-83-TM-2013/36
17
Conclusions and Recommendations
The empirical equations presented in this report are based on limited seakeeping data. In
the absence of craft specific data, they may be used to estimate wave height versus speed
envelopes for high-speed planing craft that fall within the weight ranges and characteristics of
Category A and Category B craft. The equations are based on observed trends in data recorded
during seakeeping trials when craft were operating in head seas with relatively short wave
lengths (i.e., east coast short wave period of 6.5 seconds or less). These conditions are the most
unfavorable combination of parameters that typically leads to larger wave impact accelerations
compared to longer wave length conditions (i.e., west coast longer wave period) or beam,
quartering, or following seas. Envelope predictions for speeds and wave heights outside the
range of speeds and wave heights achieved during the trials are extrapolations that should be
confirmed by future data.
Acceleration values corresponding to different levels of crew mission performance
degradation and crew comfort were originally developed based on seakeeping trials data. In the
absence of more recent full-scale data, it is recommended that the acceleration values listed in
Table 2, either A1/10 or A1/100 values, be used as interim criteria for constructing ride severity
envelopes. These single number criteria can be transitioned to ranges of values that are listed in
Table 3.
It is recommended that additional seakeeping trials be conducted to systematically
investigate parameters and conditions that affect human performance and crew comfort in a
wave impact environment. In addition to vertical acceleration values, other parameters like fore-
aft acceleration, pitch rate, and roll rate should be included in the study. The trials should include
head-sea runs at three different planing speeds (e.g., with greater than 6 knot separation if
possible) in three different significant wave height conditions (e.g., with greater than 1 foot
separation if possible) with average wave periods less than approximately 6.5 seconds.
NSWCCD-83-TM-2013/36
18
Symbols, Abbreviations, and Acronyms
A .............................................................................................................. Vertical peak-acceleration
AAVG .................................................................................................... Average vertical acceleration
A1/10 ......................................................................Average of the 1/10th highest peak accelerations
A1/100 ...................................................................Average of the 1/100th highest peak accelerations
A1/N ........................................................................ Average of the 1/Nth highest peak accelerations
Apeak or Amax ...................................................... Maximum or peak wave impact acceleration pulse
B ....................................................................................................................................... Craft beam
CCD ......................................................................................................... Combatant Craft Division
ft .................................................................................................................................................. Feet
g............................................................................................ 32.2 ft/sec2 acceleration due to gravity
H1/3 or H .......................................................................................................Significant wave height
Hz .............................................................................................................................................. Hertz
K ................................................................................................................................................. Kilo
L ......................................................................................................................... Craft overall length
LCG................................................................................................... Longitudinal center of gravity
lb. ............................................................................................................................................ Pound
N ................................................................................................................ Number of wave impacts
NSWCCD ......................................................... Naval Surface Warfare Center Carderock Division
rms......................................................................................................................... Root mean square
V ......................................................................................................................... Craft average speed
NSWCCD-83-TM-2013/36
19
References
1. Koelbel, Joseph G., Jr., “Seakeeping and Seakindliness – The Effect of Hull Form,
Center-of-Gravity, and Other Factors on the Comfort of Those Aboard in a Seaway”,
Symposium on the Design and Construction of Recreational Power Boats, University of
Michigan, Department of Naval Architecture and Marine Engineering, Ann Arbor,
Michigan, August 20 – 24, 1979.
2. “Guide for Building and Classing High-Speed Craft”, American Bureau of Shipping,
Publication 61, Part 1, Rules for Condition of Classification, March 2013.
3. Hubble, E.N., “Performance Predictions for Planing Craft in a Seaway”, David Taylor
Naval Ship Research and Development Center Report DTNSRDC-SPD-0840-02,
September 1980.
4. Blount, Donald L., Hankley, Donald W., “Full-Scale Trials and Analysis of High-
Performance Planing Craft Data”, The Society of Naval Architects and Marine Engineers
Annual Meeting, November 11-13, 1976, New York, NY.
5. Coats, T., Haupt, K., Jacobson, D., Jacobson, A., Pogorzelski, D., “MAST 2007 Working
Towards Vertical Acceleration Data Standards”, Naval Surface Warfare Center Report
NSWCCD-TM-23-2007/16, September 2007.
6. Koelbel, J.G., Jr., “Comments on the Structural Design of High Speed Craft”, Marine
Technology, Volume 32, No. 2, April 1995, pp. 77-100.
7. Savitsky, Daniel, Koelbel, Joseph, “Seakeeping of Hard Chine Planing Hulls”, SNAME,
Technical and Research Bulletin No. R-42, June 1993
8. Riley, M., Haupt, K., Jacobson, D., “A Generalized Approach and Interim Criteria for
Calculating A1/n Accelerations Using Full-Scale High-Speed Craft Data”, Naval Surface
Warfare Center Report NSWCCD-TM-23-2010/13, April 2010.
9. Payne, Peter R., “On Quantizing Ride Comfort and Allowable Acceleration”,
AIAA/SNAME Advanced Marine Vehicle Conference, paper 76-873, Arlington, VA.,
September 20-22, 1976.
10. “Mechanical Vibration and Shock – Evaluation of Human Exposure to Whole-Body
Vibration, Part 1, General Requirements”, International Organization for Standardization,
ISO 2631-1:1997(E), July 1997.
11. Zseleczky, John, “Behind the Scenes of Peak Acceleration Measurements”, The Third
Chesapeake Powerboat Symposium, Annapolis, Maryland, USA, 14-15 June 2012.
12. “Mechanical Vibration and Shock – Evaluation of Human Exposure to Whole-Body
Vibration”, ISO-2631-5:2004(E), International Organization for Standardization, Geneva,
Switzerland, 2004.
NSWCCD-83-TM-2013/36
20
13. Bass, C., Salzar, R., Ziemba, A., Lucas, S., Peterson, R., Price, E., “Dynamics Models for
the Assessment of Spinal Injury from Repeated Impact in High Speed Planing Boats”,
Proceedings of the International Research Council on the Biodynamics of Injury
(IRCOBI): 397-400, Maastricht, The Netherlands, 19-21 September 2007.
14. Pierce, E., Price, B., Blankenship, J., LaBrecque, J., Bass, D., “Industry Day Briefing,
Impact Injury Assessment for Combatant Craft Medium (CCM), unpublished
presentation, 10 December 2008.
15. Schmidt, A.L., Paskoff, G., Shender, B.S., Bass, C.R., “Risk of Lumbar Spine Injury
from Cyclic Compressive Loading”, Spine Magazine, Volume 37, Issue 26:E1614-
E1621, 15 December 2012.
16. Department of Defense Design Criteria Standard, “Human Engineering”, Military
Standard, MIL-STD-1472G, paragraph 5.5.5, 11 January 2012.
17. Riley, Michael R., Coats, Dr. Timothy W., Haupt, Kelly D., “Ride Severity Index: A
Simplified Approach to Comparing Peak Acceleration Responses of High-Speed Craft”,
The Society of Naval Architects and Marine Engineers, Journal of Ship Production and
Design, Vol. 29, No. 1, February 2013, pp. 1 – 11.
18. Blount, Donald L., Funkhouser, Jack, “Planing in Extreme Conditions”, High
performance marine Vehicles, American Society of Naval Engineers High Performance
Marine Vehicle Symposium, Linthicum, MD, 9-10 November 2009.
19. Riley, Michael, R., Coats, Timothy, W., “Acceleration Response Mode Decomposition
for Quantifying Wave Impact Load in High-Speed Planing Craft”, Naval Surface Warfare
Center Report NSWCCD-TR-80-2014/007, April 2014.
NSWCCD-83-TM-2013/36
21
Distribution
Copies Copies
J. M. Coughlin
C. Rozicer
Naval Sea Systems Command
PMS 325G
1333 Isaac Hull Avenue S.E.
Washington Navy Yard
D.C. 20376-1070
J. Zseleczky
U. S. Naval Academy
Hydromechanics Laboratory
590 Holloway Road
Annapolis, MD 21402
Commander
Naval Special Warfare Dev Group
1639 Regulus Avenue
Virginia Beach, VA 23461-2299
Attn: Mr. Joseph Coles, Code N54-4
David Shepard
United States Coast Guard
Office of Boat Forces, CG 731
2100 Second Street, SW STOP 7356
Washington, DC 20593-7356
1
1
NSWC, CARDEROCK DIVISION
INTERNAL DISTRIBUTION
Code Name
1
1
1
83
85
87
801
83R
831
831
833
835
835
835
835
Code
E41
E23
E41
Electronic Data Library
Dr. A. Becnel
Dr. J. Gorski
Dr. T. Fu
Dr. T. Coats
W. Sokol
J. Marshall
K. Beachy
D. Pogorzelski
K. Haupt
H. Murphy
C. Weil
NSWC, PANAMA CITY
Name
Eric Pierce
Brian Price
Jeff Blankenship
1
1
1
1
1
1
1
1
1
1
1
1
1
1
NSWCCD-83-TM-2013/36
A1
Appendix A. Rigid Body Acceleration
The steps required to properly analyze acceleration data begins with the fundamental
concept of input and response. The load of a single wave impact (i.e., the input to the craft)
causes a deterministic response. The word deterministic is used here because the response at a
location on a craft is neither random, nor is it chaotic. For a specific set of load conditions, like
pulse amplitude, duration, pressure distribution, deadrise, trim, speed, and wave height, there is a
unique and repeatable response (as long as permanent deformation of the structure does not
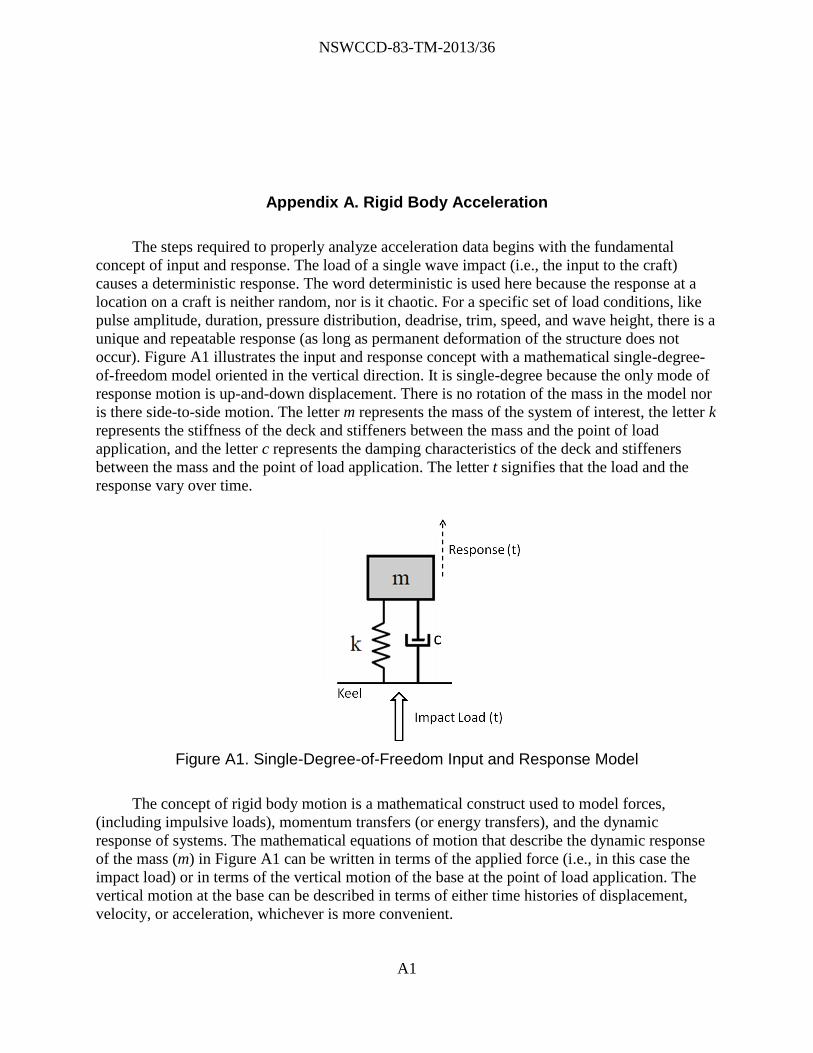
occur). Figure A1 illustrates the input and response concept with a mathematical single-degree-
of-freedom model oriented in the vertical direction. It is single-degree because the only mode of
response motion is up-and-down displacement. There is no rotation of the mass in the model nor
is there side-to-side motion. The letter m represents the mass of the system of interest, the letter k
represents the stiffness of the deck and stiffeners between the mass and the point of load
application, and the letter c represents the damping characteristics of the deck and stiffeners
between the mass and the point of load application. The letter t signifies that the load and the
response vary over time.
Figure A1. Single-Degree-of-Freedom Input and Response Model
The concept of rigid body motion is a mathematical construct used to model forces,
(including impulsive loads), momentum transfers (or energy transfers), and the dynamic
response of systems. The mathematical equations of motion that describe the dynamic response
of the mass (m) in Figure A1 can be written in terms of the applied force (i.e., in this case the
impact load) or in terms of the vertical motion of the base at the point of load application. The
vertical motion at the base can be described in terms of either time histories of displacement,
velocity, or acceleration, whichever is more convenient.
NSWCCD-83-TM-2013/36
A2
Unfortunately, during seakeeping trials, there are no practical force gages with which to
directly measure the force of each wave impact. As a mathematical substitute, the absolute
motion of the base can be used as an input to the mathematical model. Since accelerometers are
typically used, the base input is conveniently described in terms of the heave acceleration. The
heave acceleration is the vertical rigid body acceleration of the craft. The vertical rigid body
acceleration at a cross-section of a craft can therefore be used as a measure of the net vertical
force (i.e., the load) acting at that cross-section. It is a measure of wave impact load severity.
But real systems also experience internal relative motions caused by flexure of structural
elements. Accelerometers are very sensitive instruments that measure flexural motions of deck
plates and stiffeners and rigid body motions like heave, surge, pitch, and roll. The recorded
acceleration is therefore a superposition of different response modes that depend upon the
location of the gage [19].
In order to extract the rigid body acceleration from the record, the recorded acceleration
must be decomposed into its different modes of response. This process is referred to as modal
decomposition.
Analyses of a Fourier spectrum of an unfiltered acceleration time history can be used to
decompose the unfiltered record in the frequency domain into its different modes of response.
The modes of response include rigid body modes, local deck and stiffener flexural modes (i.e.,
local response vibrations), response modes of isolated equipment or shock mitigation seats, and,
if the craft is large enough, global hull-girder flexure.
In the absence of a practical hull force gage or pressure gage, the impulsive load of a wave
impact can be quantified in units of g by the amplitude and duration of the rigid body
acceleration response during the impact. The rigid body acceleration response can be
decomposed from an unfiltered acceleration record by using a low-pass filter. For small high-
speed planing craft less than 100 feet in length it is recommended that a 10-Hz low-pass filter be
used, unless Fourier spectrum analysis indicates some other value [8]. If a different value is used,
it should be published with the analysis results.
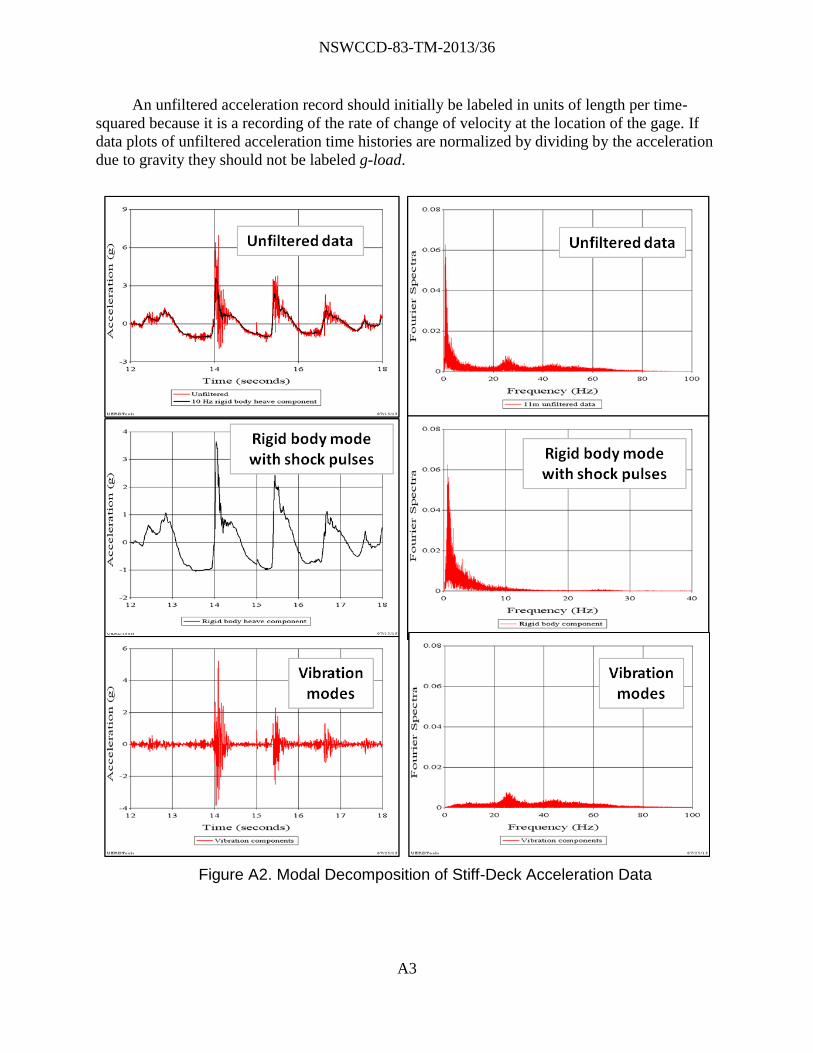
In the time domain the concept of modal decomposition is illustrated by the three plots on
the left shown in Figure A2. Each plot is a 10-second segment of acceleration data that shows six
wave impacts. The accelerometer was oriented vertically and installed on the deck above a
support stiffener at the LCG. The red curve in the upper plot is the unfiltered vertical
acceleration. The middle plot is the vertical rigid body acceleration extracted from the unfiltered
acceleration by low pass filtering. It shows three severe wave impacts where the wave slam
spikes are clearly visible. The rigid body acceleration is also shown as the black curve in the
upper plot to show how the vibration content rides on the rigid body acceleration. The bottom
plot is the deck vibration content obtained by high-pass filtering. When the rigid body and the
vibration responses are added it creates the original unfiltered curve shown in the upper plot.
In the frequency domain the rigid body content and the vibration content are observed as
spikes and humps in the Fourier spectra shown on the right side of Figure A2. They are Fourier
spectra of the three plots shown on the left side. The upper plot is the Fourier spectrum of the
unfiltered acceleration record. It shows the rigid body content at frequencies less than 4 Hz and
several dominant vibration modes in the vicinity of 25 Hz and 43 Hz. The spectrum of the rigid
body content and the spectrum of the vibration content are shown to illustrate the modal
decomposition process and how low-pass and high-pass filtering are used to decompose the
unfiltered signal.
NSWCCD-83-TM-2013/36
A3
An unfiltered acceleration record should initially be labeled in units of length per time-
squared because it is a recording of the rate of change of velocity at the location of the gage. If
data plots of unfiltered acceleration time histories are normalized by dividing by the acceleration
due to gravity they should not be labeled g-load.
Figure A2. Modal Decomposition of Stiff-Deck Acceleration Data