Embed Size (px)
Citation preview
Naval Surface Warfare Center Carderock Division West Bethesda, MD 20817-5700
Approved for public release; distribution is unlimited.
NSWCCD-65-TR–2005/04 March 2005
Survivability, Structures, and Materials Department Technical Report
Preliminary Report on the SIDER Testing of Large-Scale Sandwich Panels by Colin P. Ratcliffe
United States Naval Academy Roger M. Crane
NSWC, Carderock Division
NSW
CC
D-6
5-TR
–200
5/04
Prel
imin
ary
Rep
ort o
n th
e SI
DER
Tes
ting
of L
arge
-Sca
le S
andw
ich
Pane
ls

IN REPLY REFER TO
DEPARTMENT OF THE NAVY NAVAL SURFACE WARFARE CENTER, CARDEROCK DIVISION
9500 MACARTHUR BOULEVARD WEST BETHESDA MD 20817-5700
9078 Ser 65/11-83 5 Jul 11
From: Commander, Naval Surface Warfare Center, Carderock Division
To: Program Executive Officer Ships (PMS 385)
Subj: SIDER INSPECTIONS OF LARGE-SCALE BALSA CORE PANELS
Ref: (a) Surface Ship Hull, Mechanical and Electrical Technology Program, Program Element 0602121N
Encl: (1) NSWCCD-65-TR–2005/04, Preliminary Report on the SIDER Testing of Large-Scale Sandwich Panels
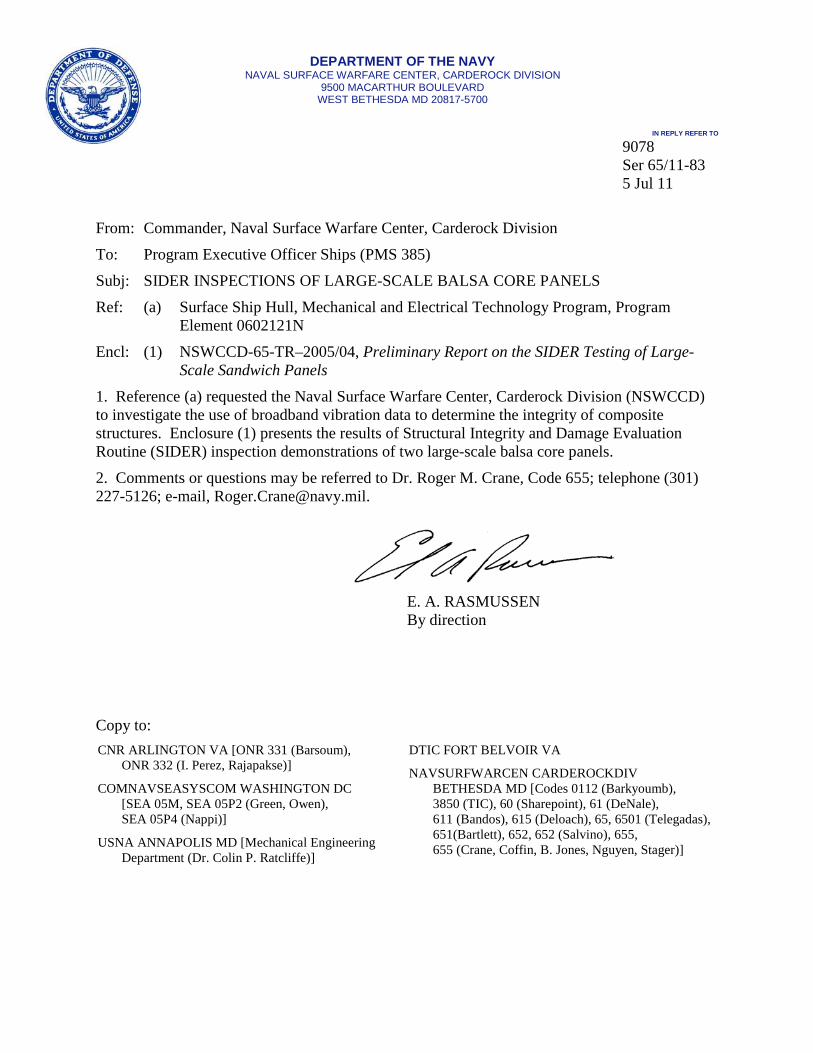
1. Reference (a) requested the Naval Surface Warfare Center, Carderock Division (NSWCCD) to investigate the use of broadband vibration data to determine the integrity of composite structures. Enclosure (1) presents the results of Structural Integrity and Damage Evaluation Routine (SIDER) inspection demonstrations of two large-scale balsa core panels.
2. Comments or questions may be referred to Dr. Roger M. Crane, Code 655; telephone (301) 227-5126; e-mail, [email protected].
E. A. RASMUSSEN By direction
Copy to: CNR ARLINGTON VA [ONR 331 (Barsoum),
ONR 332 (I. Perez, Rajapakse)]
COMNAVSEASYSCOM WASHINGTON DC [SEA 05M, SEA 05P2 (Green, Owen), SEA 05P4 (Nappi)]
USNA ANNAPOLIS MD [Mechanical Engineering Department (Dr. Colin P. Ratcliffe)]
DTIC FORT BELVOIR VA
NAVSURFWARCEN CARDEROCKDIV BETHESDA MD [Codes 0112 (Barkyoumb), 3850 (TIC), 60 (Sharepoint), 61 (DeNale), 611 (Bandos), 615 (Deloach), 65, 6501 (Telegadas), 651(Bartlett), 652, 652 (Salvino), 655, 655 (Crane, Coffin, B. Jones, Nguyen, Stager)]

Enclosure (1)
Naval Surface Warfare Center Carderock Division West Bethesda, MD 20817-5700
Approved for public release; distribution is unlimited.
NSWCCD-65-TR–2005/04 March 2005
Survivability, Structures, and Materials Department Technical Report
Preliminary Report on the SIDER Testing of Large-Scale Sandwich Panels
by Colin P. Ratcliffe
United States Naval Academy Roger M. Crane
NSWC, Carderock Division

REPORT DOCUMENTATION PAGE Form Approved
OMB No. 0704-0188 Public reporting burden for this collection of information is estimated to average 1 hour per response, including the time for reviewing instructions, searching existing data sources, gathering and maintaining the data needed, and completing and reviewing this collection of information. Send comments regarding this burden estimate or any other aspect of this collection of information, including suggestions for reducing this burden to Department of Defense, Washington Headquarters Services, Directorate for Information Operations and Reports (0704-0188), 1215 Jefferson Davis Highway, Suite 1204, Arlington, VA 22202-4302. Respondents should be aware that notwithstanding any other provision of law, no person shall be subject to any penalty for failing to comply with a collection of information if it does not display a currently valid OMB control number. PLEASE DO NOT RETURN YOUR FORM TO THE ABOVE ADDRESS. 1. REPORT DATE (DD-MM-YYYY) 1-Mar-2005
2. REPORT TYPE Final
3. DATES COVERED (From - To) -
4. TITLE AND SUBTITLE
Preliminary Report on the SIDER Testing of Large-Scale Sandwich Panels
5a. CONTRACT NUMBER 5b. GRANT NUMBER 5c. PROGRAM ELEMENT NUMBER
6. AUTHOR(S)
Colin P. Ratcliffe and Roger M. Crane
5d. PROJECT NUMBER 5e. TASK NUMBER 5f. WORK UNIT NUMBER 7. PERFORMING ORGANIZATION NAME(S) AND ADDRESS(ES) AND ADDRESS(ES) 8. PERFORMING ORGANIZATION REPORT NUMBER NSWCCD-65-TR-2005/04
Naval Surface Warfare Center Carderock Division 9500 Macarthur Boulevard West Bethesda, MD 20817-5700
9. SPONSORING / MONITORING AGENCY NAME(S) AND ADDRESS(ES) 10. SPONSOR/MONITOR’S ACRONYM(S) Attn PMS 385
Program Executive Officer Ships 1333 Isaac Hull Ave. SE Washington Navy Yard, DC 20376
11. SPONSOR/MONITOR’S REPORT NUMBER(S)
12. DISTRIBUTION / AVAILABILITY STATEMENT Approved for public release; distribution is unlimited.
13. SUPPLEMENTARY NOTES
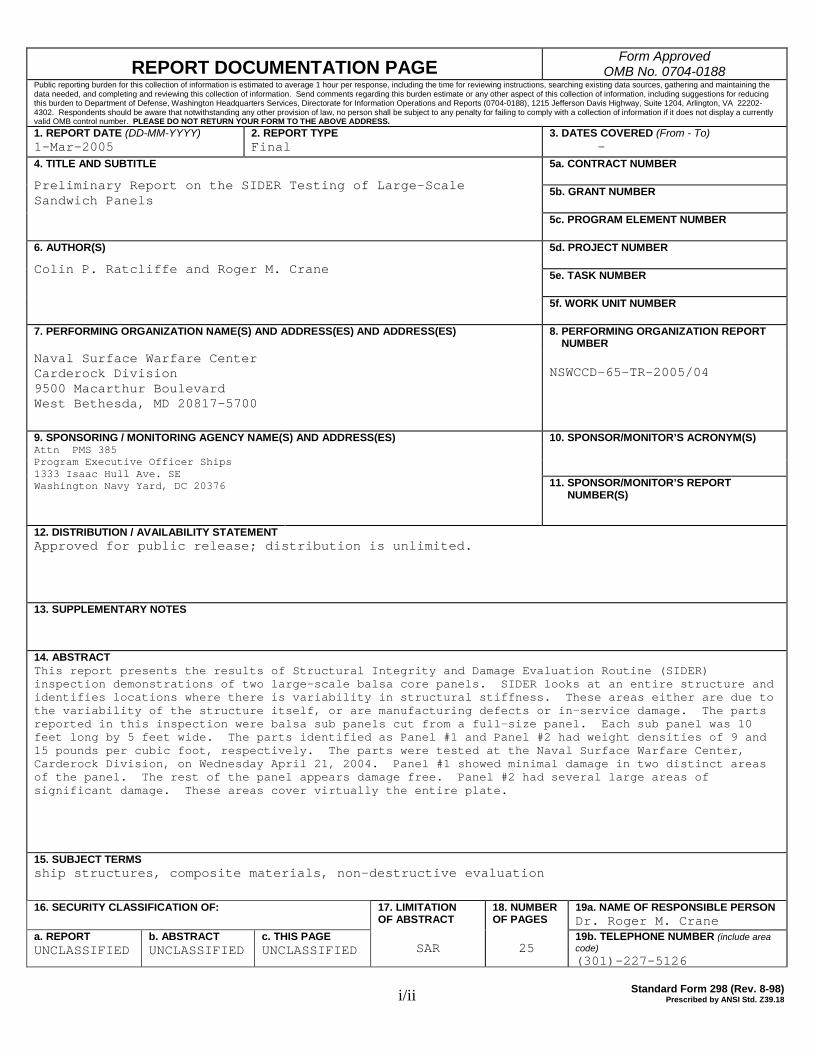
14. ABSTRACT This report presents the results of Structural Integrity and Damage Evaluation Routine (SIDER) inspection demonstrations of two large-scale balsa core panels. SIDER looks at an entire structure and identifies locations where there is variability in structural stiffness. These areas either are due to the variability of the structure itself, or are manufacturing defects or in-service damage. The parts reported in this inspection were balsa sub panels cut from a full-size panel. Each sub panel was 10 feet long by 5 feet wide. The parts identified as Panel #1 and Panel #2 had weight densities of 9 and 15 pounds per cubic foot, respectively. The parts were tested at the Naval Surface Warfare Center, Carderock Division, on Wednesday April 21, 2004. Panel #1 showed minimal damage in two distinct areas of the panel. The rest of the panel appears damage free. Panel #2 had several large areas of significant damage. These areas cover virtually the entire plate.
15. SUBJECT TERMS ship structures, composite materials, non-destructive evaluation
16. SECURITY CLASSIFICATION OF: 17. LIMITATION OF ABSTRACT
SAR
18. NUMBER OF PAGES
25
19a. NAME OF RESPONSIBLE PERSON Dr. Roger M. Crane
a. REPORT UNCLASSIFIED
b. ABSTRACT UNCLASSIFIED
c. THIS PAGE UNCLASSIFIED
19b. TELEPHONE NUMBER (include area code) (301)-227-5126
i/ii
Standard Form 298 (Rev. 8-98) Prescribed by ANSI Std. Z39.18

NSWCCD-65-TR–2005/04
iii
Contents Page
Contents ......................................................................................................................................... iii
Figures............................................................................................................................................ iv
Tables ............................................................................................................................................. iv
Administrative Information .............................................................................................................v
Acknowledgements ..........................................................................................................................v
Introduction ......................................................................................................................................1
Grid ..................................................................................................................................................2
Accelerometer Locations .................................................................................................................2
Data Quality .....................................................................................................................................3
Observations from the Average Coherence Results ...............................................................5
Sider Test Results ............................................................................................................................6
Conclusions ....................................................................................................................................16
Recommendations ..........................................................................................................................17
NSWCCD-65-TR–2005/04
iv
Figures Page
Figure 1. Test Panel Setup for SIDER Testing ...............................................................................3 Figure 2. Average Coherence Comparison between Test Parts ......................................................4 Figure 3. Average Coherence Comparison – Test Part #1 by Accelerometer ................................4 Figure 4. Average Coherence Comparison – Test Part #2 by Accelerometer ................................5 Figure 5. Part #1, Y-Direction Analysis .........................................................................................7 Figure 6. Part #1, X-Direction Analysis .........................................................................................8 Figure 7. Part #2, Y-Direction Analysis .........................................................................................9 Figure 8. Part #2, X-Direction Analysis .......................................................................................10 Figure 9. Part #1, Y-Direction Analysis .......................................................................................11 Figure 10. Part #2, Y-Direction Analysis .....................................................................................11 Figure 11. Part #1, Y-Direction Analysis with 10x Magnification...............................................12 Figure 12. Part #1, X-Direction Analysis with 10x Magnification...............................................13 Figure 13. Part #2, Y-Direction Analysis with 10x Magnification...............................................14 Figure 14. Part #2, x-Direction Analysis with 10x Magnification ...............................................15
Table Page
Table 1. Location of the accelerometers .........................................................................................2
NSWCCD-65-TR–2005/04
v
Administrative Information The work described in this report was performed by the Structures and Composites
Division (Code 65) of the Survivability, Structures and Materials Department at the Naval Surface Warfare Center, Carderock Division (NSWCCD). The work was funded by the Program Executive Officer Ships (PMS 385) as part of the Surface Ship Hull, Mechanical and Electrical Technology Program, Program Element 0602121N.
Acknowledgements The authors would like to acknowledge the financial support of Loc Nguyen, NSWC,
Carderock Division for this testing. They would also like to acknowledge Brian Jones and John Noland for their help in testing the panels.

NSWCCD-65-TR–2005/04
vi
NSWCCD-65-TR–2005/04
1
Introduction This report presents the results of Structural Integrity and Damage Evaluation Routine
(SIDER) inspection demonstrations of two large-scale balsa core panels. SIDER looks at an entire structure and identifies locations where there is variability in structural stiffness. These areas either are due to the variability of the structure itself, or are manufacturing defects or in-service damage. After a preliminary SIDER, a follow-up SIDER can show the change which has taken place; this change is attributable to damage occurring between the two examinations.
The primary focus of the effort reported here was to demonstrate the SIDER procedure as a potential method for verifying manufacturing integrity. As such, this test was not fully documented; the effort was focused on rapidly obtaining and reducing the data. This report does not, therefore, have complete test records which normally include full instrumentation details as well as a comprehensive photographic record.
The parts that were inspected were sub panels cut from a full size panel. Each sub panel was 10 feet long by 5 feet wide. The construction consists of a 3-inch balsa core, with carbon 0.25-in. thick, 19-oz carbon woven roving with 8084 vinyl ester resin face sheets. The 9-lb/ft3 balsa panel is referred to as Part #1, while the 15-lb/ft3 panel is referred to as Part #2 throughout this report.
The parts were tested at the Naval Surface Warfare Center, Carderock Division. After a preliminary look at the parts, one of the sub panels was placed on shock and vibration rubber matting in order to dynamically isolate the part from the ground for testing. A test mesh, described later, was marked on the structure. Data capture took about 50 minutes for each part. Data reduction took about 10 to 15 minutes, after which the SIDER contour plots were available for comparison with the structure.
NSWCCD-65-TR–2005/04
2
Grid In order to conduct a SIDER analysis, the structure needs to be marked with a mesh of test
points. It was decided to use a uniform six-inch square mesh. This mesh size would be sufficiently fine to resolve structural anomalies of interest. In addition, the mesh size would enable mesh marking and complete data acquisition within a short time. The time it takes for data acquisition is approximately proportional to the number of test points. The mesh was marked with chalk lines.
The origin for the test mesh was chosen as the “bottom-left” corner of the panel. The x-axis direction was in the direction of the 5-foot side, and the y-axis was in the direction of the 10-foot side, and the z-direction was up. The first test point was located at coordinate position (3, 3, 0) inches.
The test locations were numbered with chalk. The first point was identified as point # ‘11’. The point numbers incremented along the x-axis direction, with the last point on the first row being point #20. The first point on the second row, at coordinate (3, 9) inches, was point #21. The final test point was #210. Thus there were 200 test points.
It should be noted that a test mesh with a finer size, say 3 inches × 3 inches, could have readily been used and testing completed in a reasonable amount of time, that is, approximately two hours per panel. However, since this demonstration was to show the feasibility of using SIDER as an inspection method for full-scale panels, which are 50 × 50 ft, it was decided to use a test mesh commensurate with testing these larger panels in a reasonable time. As such, a full-scale 50 × 50 ft panel would require about 5 hours of testing, using about 1000 test points.
Accelerometer Locations Most SIDER tests use four accelerometers, arranged on an almost symmetrical pattern.
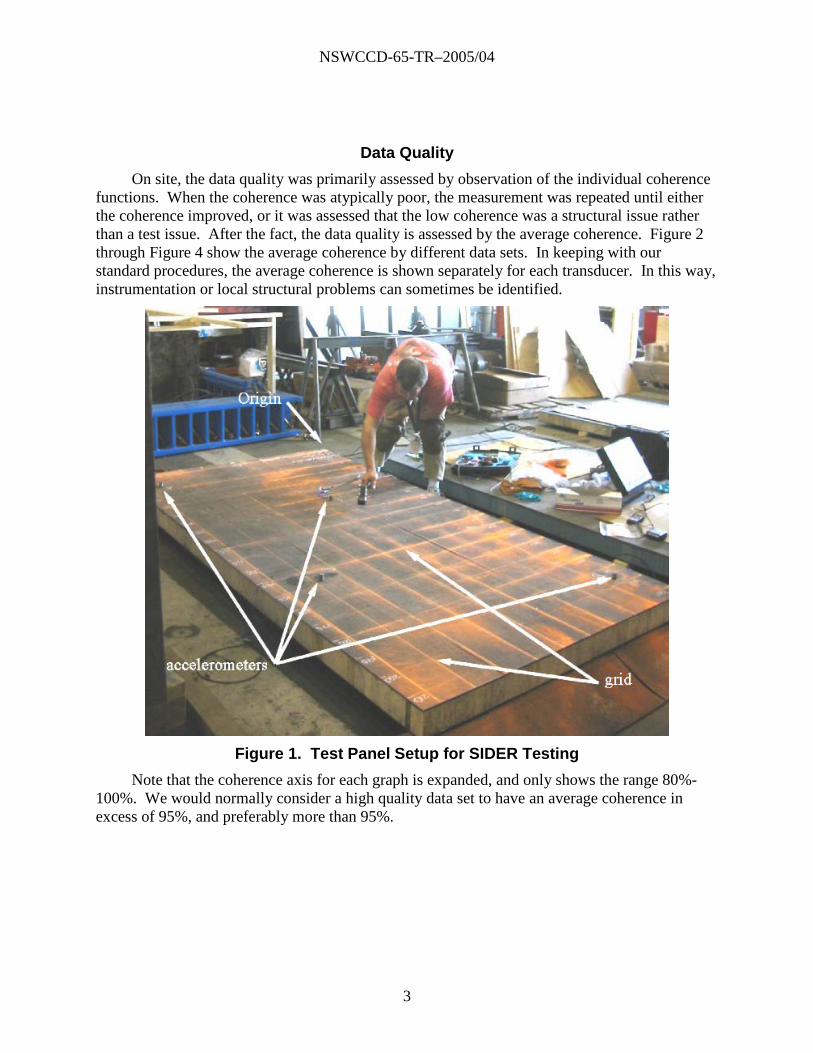
However, the symmetry is deliberately broken so that the accelerometer locations are partly randomized. For this demonstration, four accelerometers were used for the SIDER calculations, each with a nominal sensitivity of 100 mV/g. The panel test setup showing the test grid and accelerometer locations, as well as the support configuration used is shown in Figure 1. The accelerometers details are shown in Table 1.
Table 1. Location of the accelerometers Accelerometer S/N Sensitivity Analyzer channel X Y Z
A 56034 102.8 mV/g 2 54” 12” 0” B 48917 102.0 mV/g 3 24” 42” 0” C 73282 101.8 mV/g 4 48” 78” 0” D 73280 101.9 mV/g 5 6” 108” 0”
NSWCCD-65-TR–2005/04
3
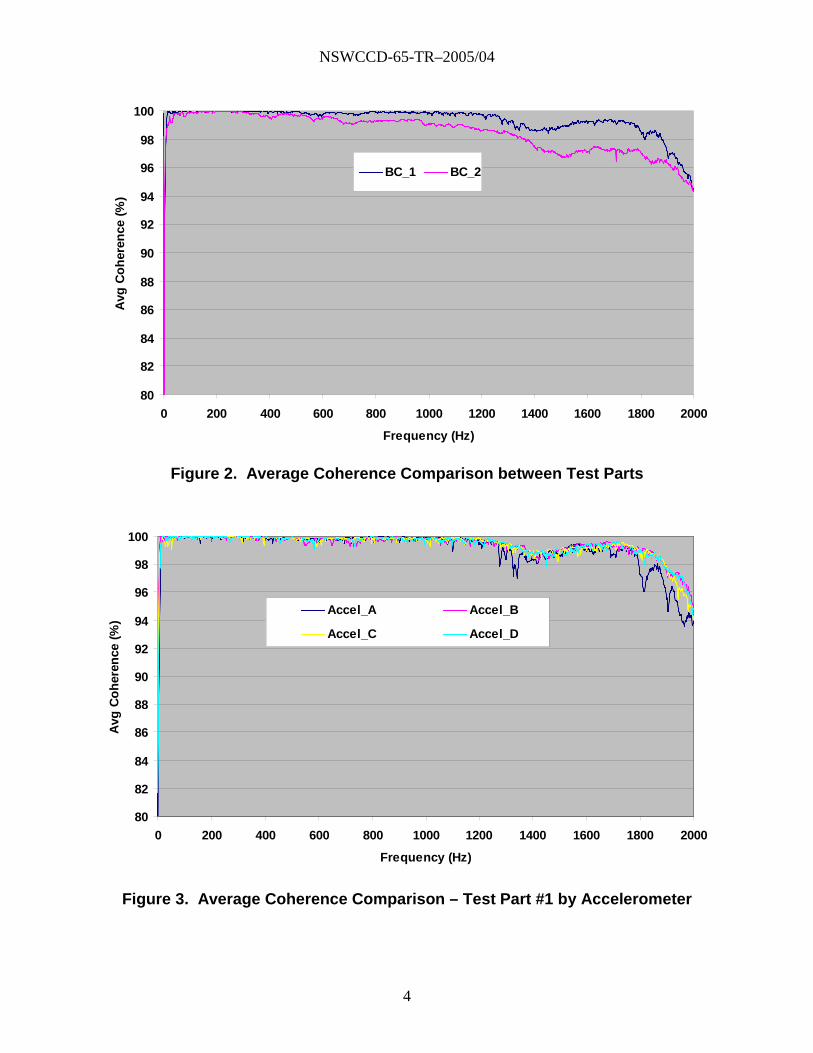
Data Quality On site, the data quality was primarily assessed by observation of the individual coherence
functions. When the coherence was atypically poor, the measurement was repeated until either the coherence improved, or it was assessed that the low coherence was a structural issue rather than a test issue. After the fact, the data quality is assessed by the average coherence. Figure 2 through Figure 4 show the average coherence by different data sets. In keeping with our standard procedures, the average coherence is shown separately for each transducer. In this way, instrumentation or local structural problems can sometimes be identified.
Figure 1. Test Panel Setup for SIDER Testing Note that the coherence axis for each graph is expanded, and only shows the range 80%-
100%. We would normally consider a high quality data set to have an average coherence in excess of 95%, and preferably more than 95%.
NSWCCD-65-TR–2005/04
4
80
82
84
86
88
90
92
94
96
98
100
0 200 400 600 800 1000 1200 1400 1600 1800 2000
Frequency (Hz)
Avg
Cohe
renc
e (%
)
BC_1 BC_2
Figure 2. Average Coherence Comparison between Test Parts
80
82
84
86
88
90
92
94
96
98
100
0 200 400 600 800 1000 1200 1400 1600 1800 2000
Frequency (Hz)
Avg
Cohe
renc
e (%
)
Accel_A Accel_B
Accel_C Accel_D
Figure 3. Average Coherence Comparison – Test Part #1 by Accelerometer
NSWCCD-65-TR–2005/04
5
80
82
84
86
88
90
92
94
96
98
100
0 200 400 600 800 1000 1200 1400 1600 1800 2000
Frequency (Hz)
Avg
Cohe
renc
e (%
)
Accel_A Accel_B
Accel_C Accel_D
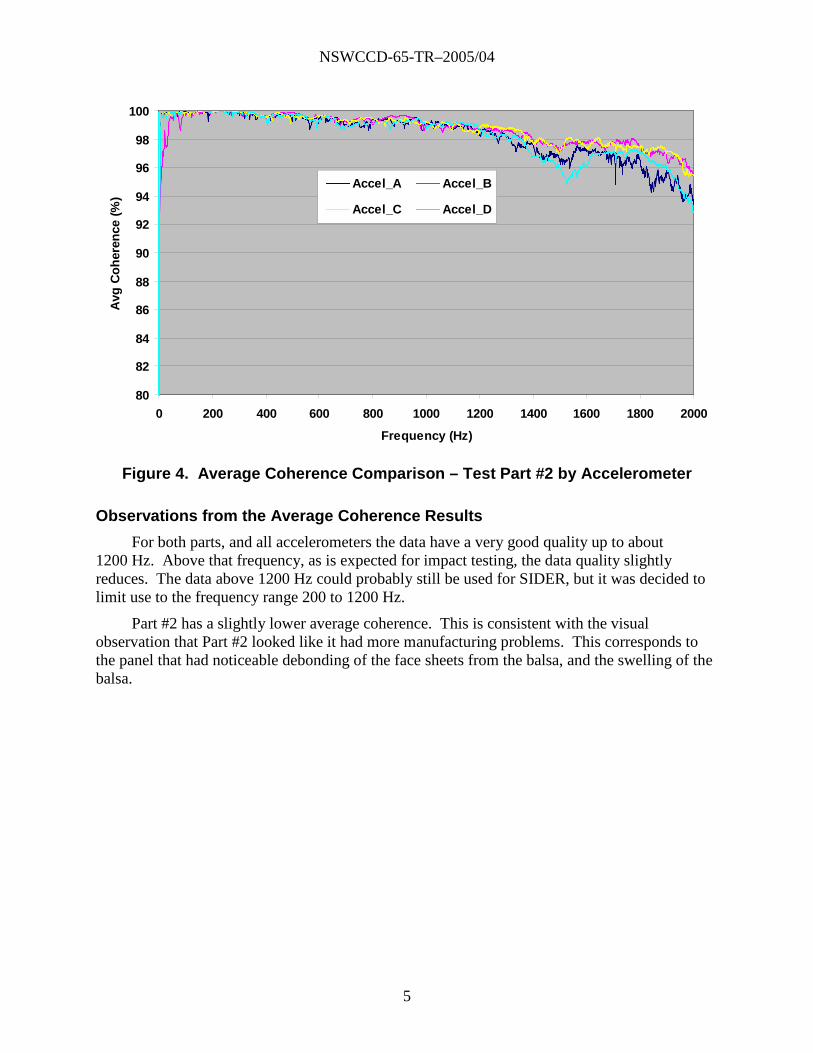
Figure 4. Average Coherence Comparison – Test Part #2 by Accelerometer
Observations from the Average Coherence Results For both parts, and all accelerometers the data have a very good quality up to about
1200 Hz. Above that frequency, as is expected for impact testing, the data quality slightly reduces. The data above 1200 Hz could probably still be used for SIDER, but it was decided to limit use to the frequency range 200 to 1200 Hz.
Part #2 has a slightly lower average coherence. This is consistent with the visual observation that Part #2 looked like it had more manufacturing problems. This corresponds to the panel that had noticeable debonding of the face sheets from the balsa, and the swelling of the balsa.
NSWCCD-65-TR–2005/04
6
Sider Test Results SIDER can be used in a number of ways to inspect structures or components. Typically,
SIDER is used as a preliminary test method for rapidly interrogating large structures. If structures or components to be inspected are small, that is, a few square feet, then conventional non-destructive evaluation (NDE) methods such as ultrasonics may be more appropriate.
Once it has been determined appropriate to use SIDER, the results can be used used in a number of ways. First, an evaluation of the part quality can be determined from a single one-off inspection. Here, variations in stiffness in the structure can be identified. This is similar to what is being done for this specific effort. When multiple components of the same configuration are manufactured, differences between them can be mapped to verify part-to-part uniformity. Once the structure is placed in service, a subsequent SIDER inspection can be used to identify areas that have a stiffness change caused by in-service damage.
As described earlier, based on the coherence data the SIDER analysis was conducted from 200 to 1200 Hz, being the frequency range where the average coherence is above about 98%.
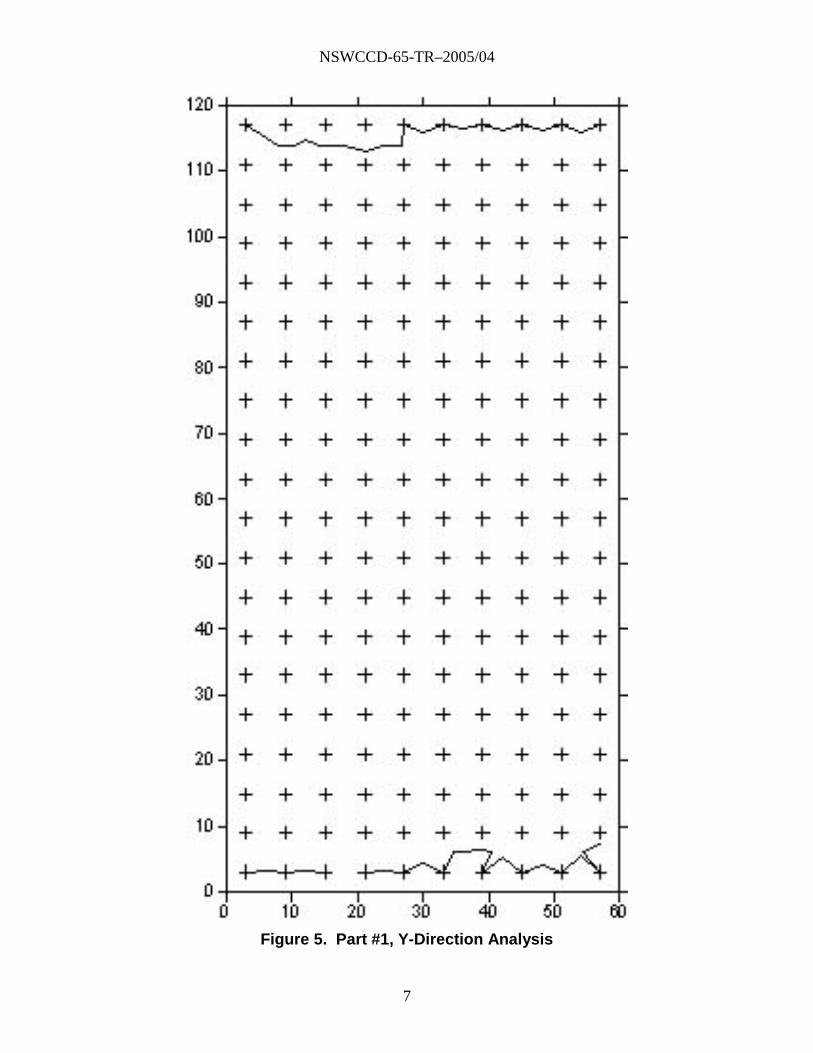
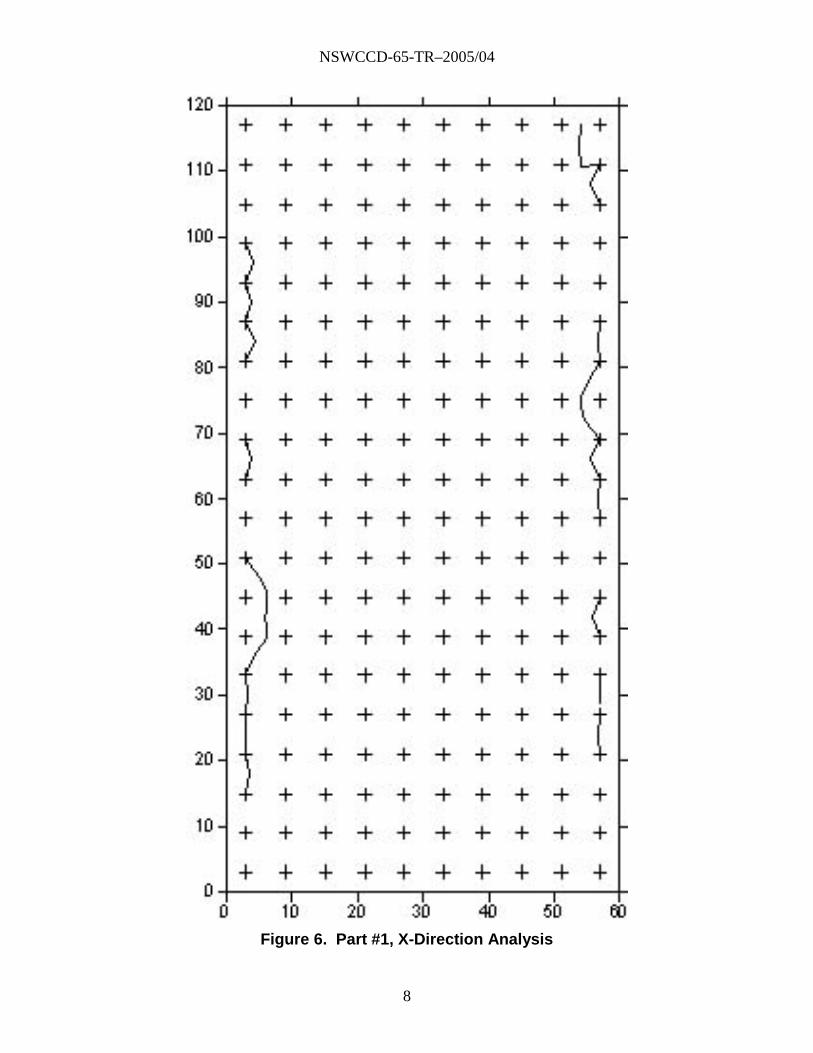
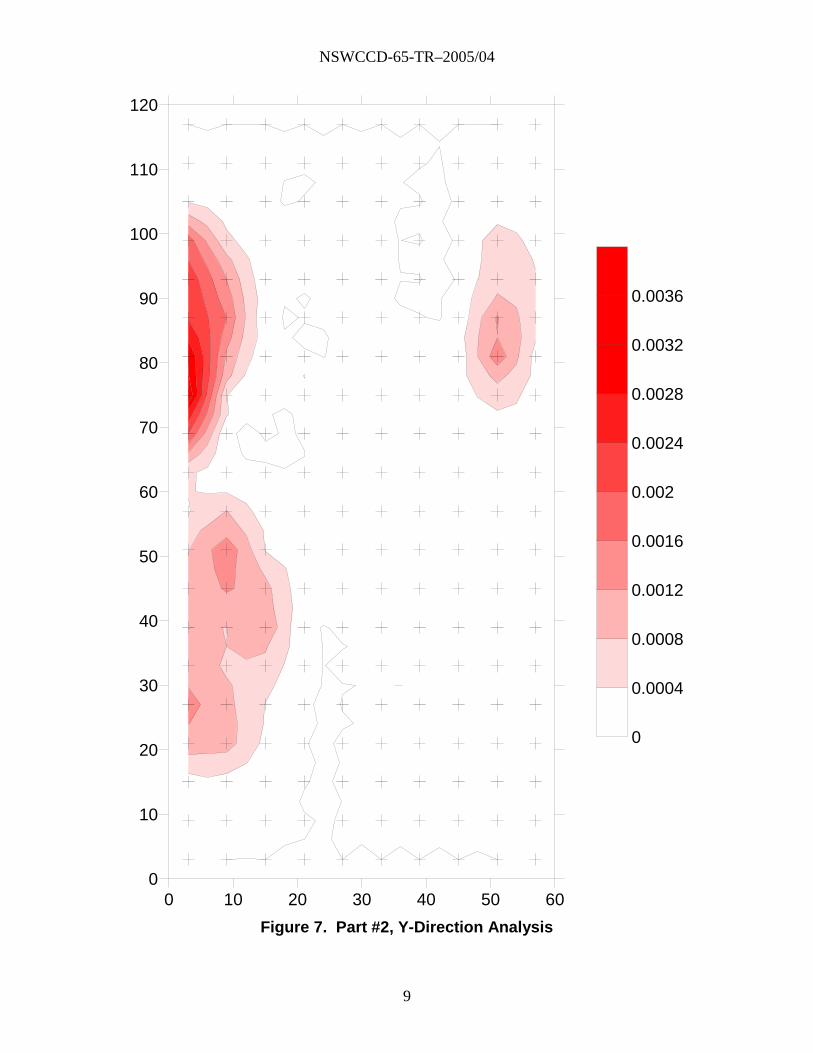
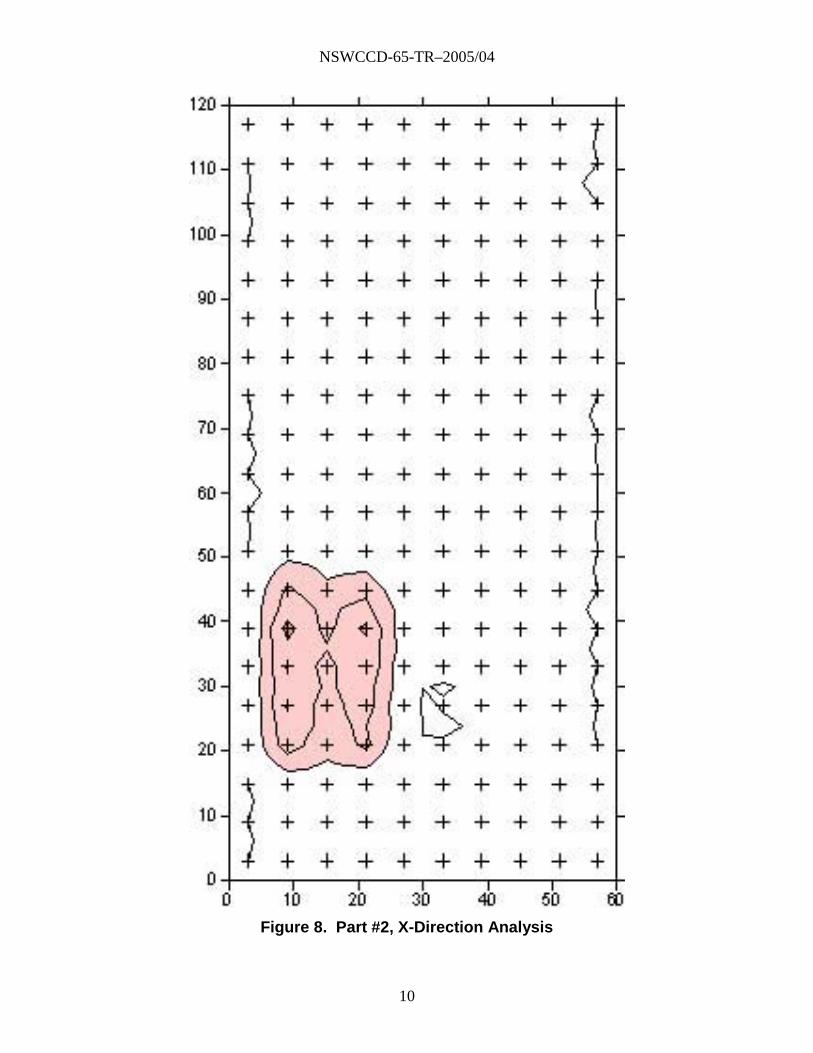
Figure 5 through Figure 8 show the SIDER contour plots for each of the parts. The axes numbering is the distance in inches from the global origin. The crosses identify the test mesh. The SIDER is a directional test. Thus, there are two figures for each tested part, one for the analysis in the x-direction and one for the analysis in the y-direction. All graphs have the same scaling, such that the same contour color identifies similar SIDER values. White indicates little or no irregularity in structural stiffness, and red indicates a higher level of irregularity.
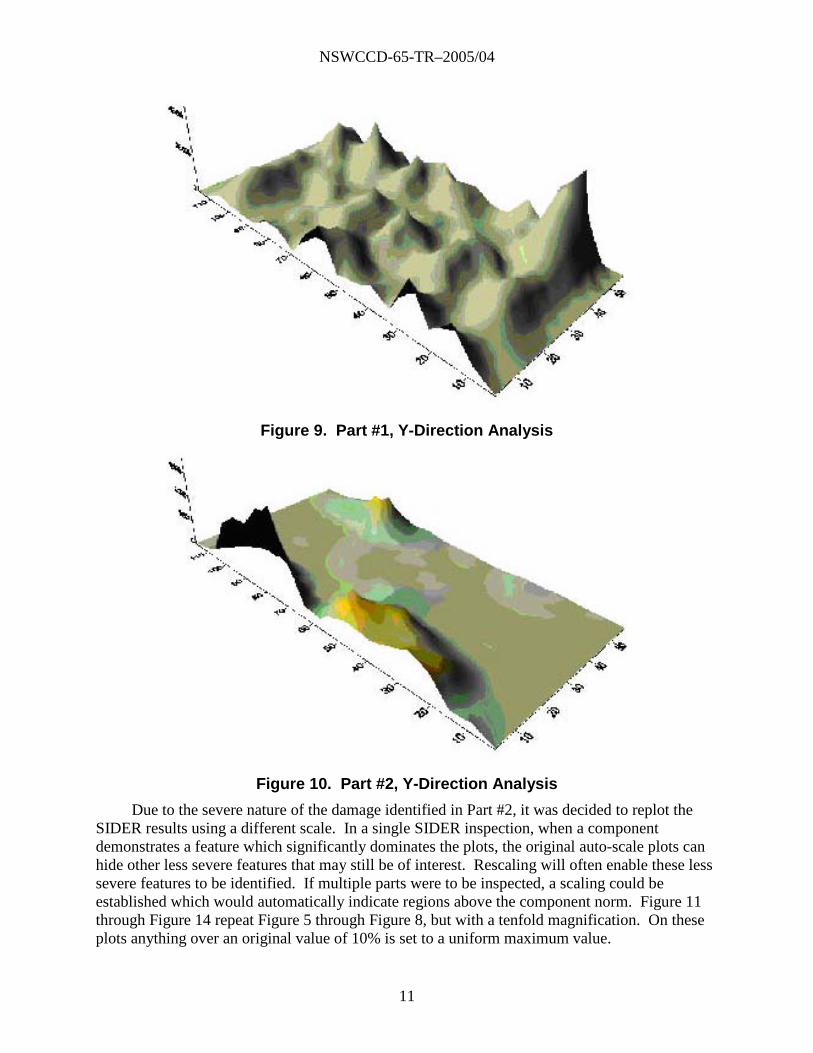
Figure 9 and Figure 10 show the y-axis analyses only using a surface plot. The plots are auto-scaled, so that the coloring cannot quickly be converted to SIDER values. However, these figures can sometimes help visualize locations where there is structural irregularity.
NSWCCD-65-TR–2005/04
7
Figure 5. Part #1, Y-Direction Analysis
NSWCCD-65-TR–2005/04
8
Figure 6. Part #1, X-Direction Analysis
NSWCCD-65-TR–2005/04
9
0 10 20 30 40 50 600
10
20
30
40
50
60
70
80
90
100
110
120
0
0.0004
0.0008
0.0012
0.0016
0.002
0.0024
0.0028
0.0032
0.0036
Figure 7. Part #2, Y-Direction Analysis
NSWCCD-65-TR–2005/04
10
Figure 8. Part #2, X-Direction Analysis
NSWCCD-65-TR–2005/04
11
Figure 9. Part #1, Y-Direction Analysis
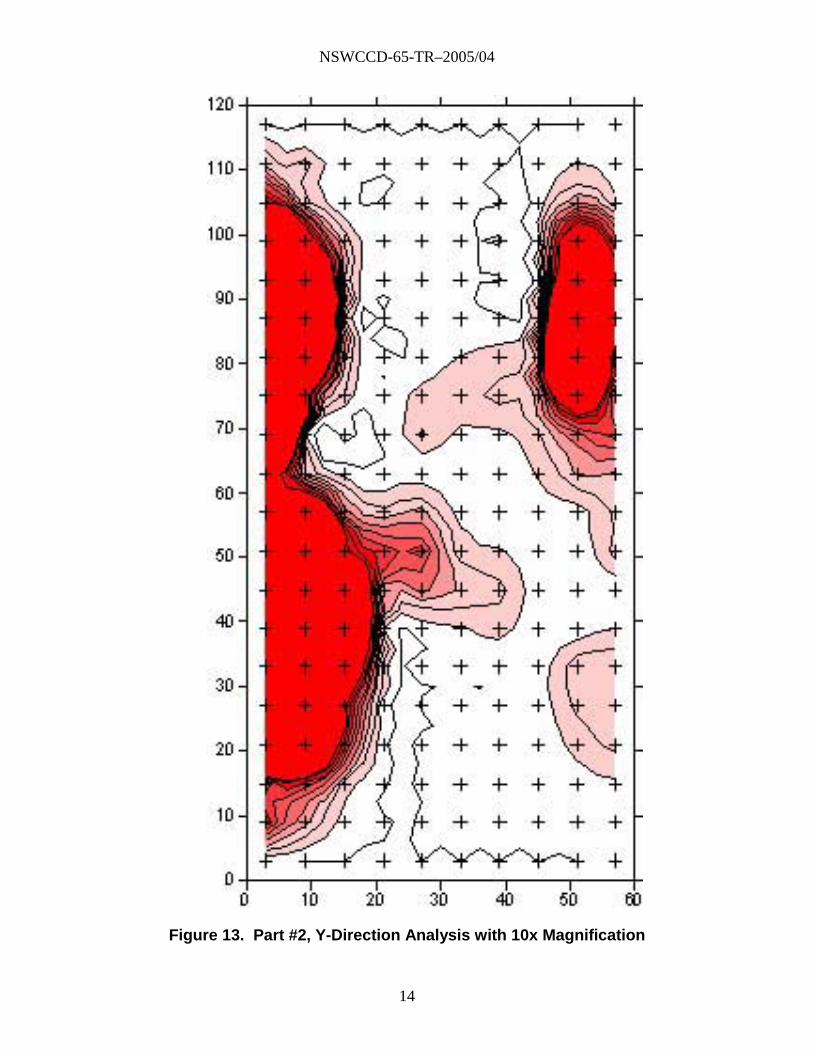
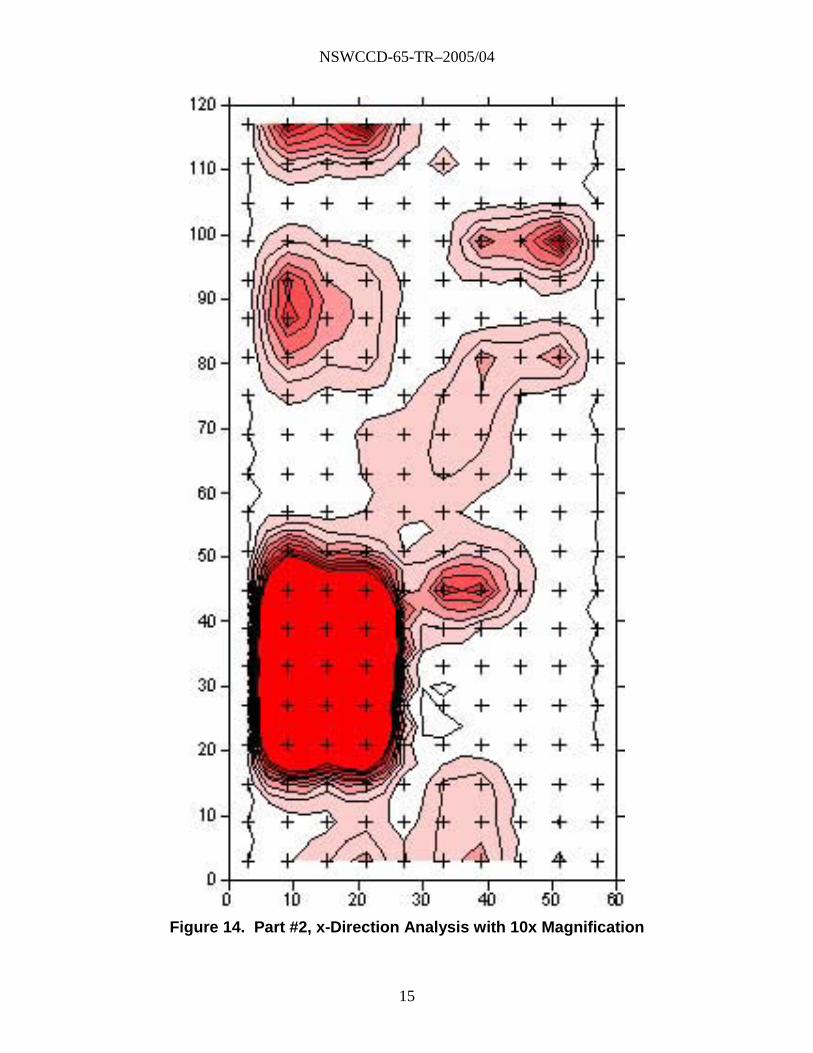
Figure 10. Part #2, Y-Direction Analysis Due to the severe nature of the damage identified in Part #2, it was decided to replot the
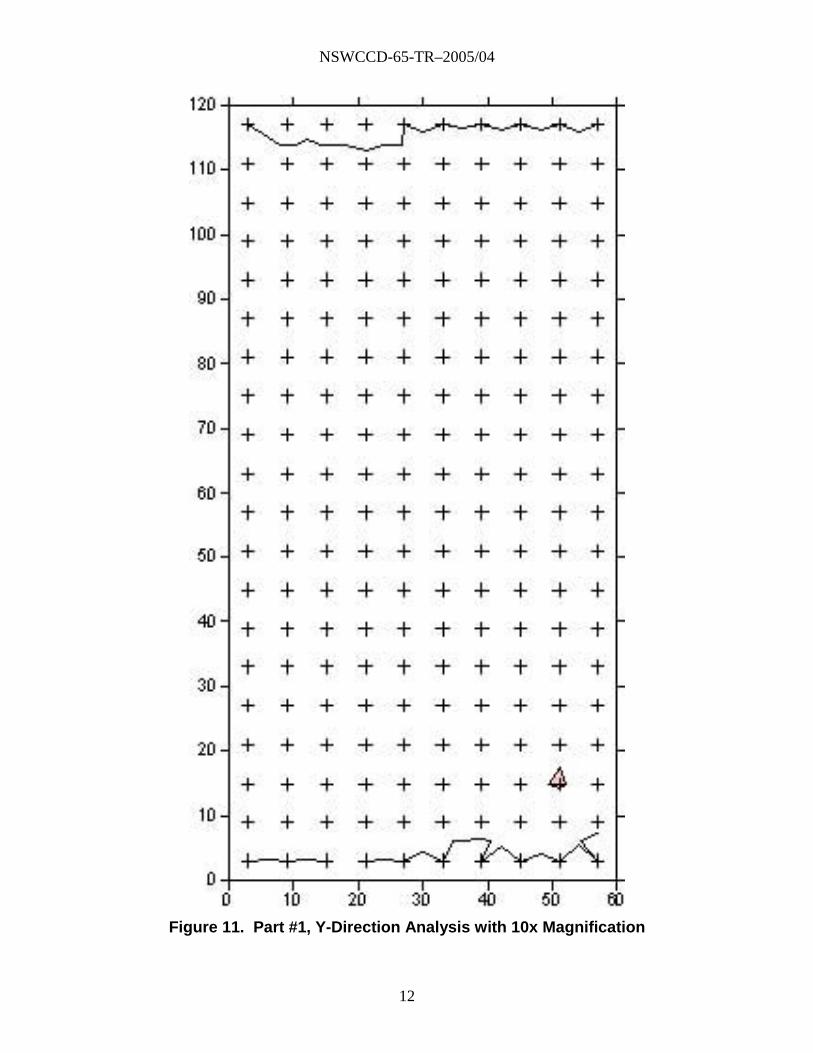
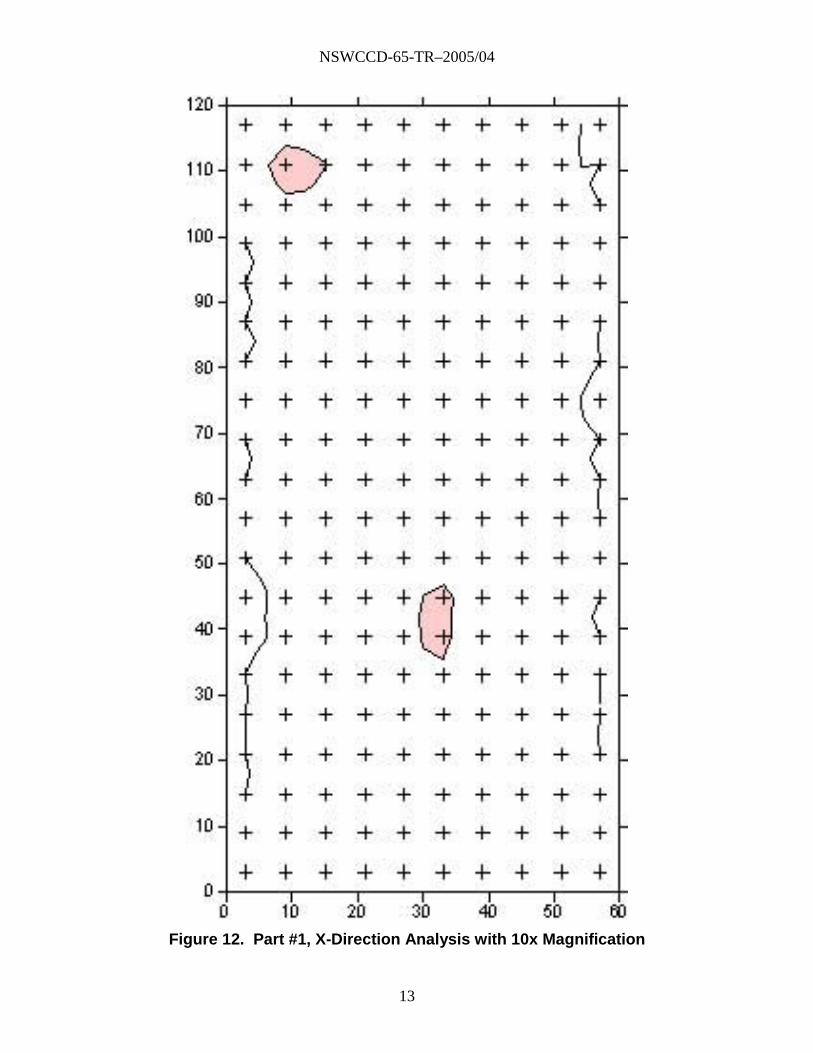
SIDER results using a different scale. In a single SIDER inspection, when a component demonstrates a feature which significantly dominates the plots, the original auto-scale plots can hide other less severe features that may still be of interest. Rescaling will often enable these less severe features to be identified. If multiple parts were to be inspected, a scaling could be established which would automatically indicate regions above the component norm. Figure 11 through Figure 14 repeat Figure 5 through Figure 8, but with a tenfold magnification. On these plots anything over an original value of 10% is set to a uniform maximum value.
NSWCCD-65-TR–2005/04
12
Figure 11. Part #1, Y-Direction Analysis with 10x Magnification
NSWCCD-65-TR–2005/04
13
Figure 12. Part #1, X-Direction Analysis with 10x Magnification
NSWCCD-65-TR–2005/04
14
Figure 13. Part #2, Y-Direction Analysis with 10x Magnification
NSWCCD-65-TR–2005/04
15
Figure 14. Part #2, x-Direction Analysis with 10x Magnification
NSWCCD-65-TR–2005/04
16
In this case, there are two small areas on panel 1 which show a difference from the rest of the panel. These areas are located near grid points 76 and 86, and grid points 192 and 193. For panel 2, there are many additional areas of concern which are too numerous to mention specifically here. It should be noted that with additional SIDER testing of more components, a baseline SIDER value could be established whereby only indications above this value are considered significant and indicative of manufacturing problems or damage.
Conclusions The results of the SIDER testing of the two test sections are as follows:
Panel #1 showed minimal damage in two distinct areas of the panel. The rest of the panel appears damage free.
The recommendation is to interrogate those locations only with an alternative technique such as ultrasonics. With additional alternate testing, it may be possible to identify the specific cause of the SIDER features, and whether they are of structural significance.
Panel #2 had several large areas of significant damage. These areas cover virtually the entire plate.
The main recommendation is to use ultrasonics to map out the boundaries of the major delaminations/debonds in order that they can be compared with the SIDER results. Additionally, if time permits, it may be appropriate to test the “SIDER-good” areas to ensure that they are, indeed, damage free.
It should be noted that the SIDER algorithm is designed to monitor most of a structure. However, the testing method means it is not usually possible to check extreme edges of a structure. For the projected use on the 50-ft × 50-ft panels, this restriction should not be a concern since any edge imperfections can be visually determined.
The testing that has been conducted on the full-thickness panel sections has successfully and expeditiously identified the visible delaminations. Using the test mesh size used in this study, a full-section 50-ft × 50-ft panel would take approximately six hours to test, plus about 15 to 20 minutes of data reduction.
NSWCCD-65-TR–2005/04
17
Recommendations Before using SIDER to inspect full-size panels, several recommendations should be
implemented. First, some full-thickness panels with representative damage should be manufactured and tested to calibrate the SIDER values. For example, on Panel No. 1, there were two regions that SIDER had determined as having a different stiffness from the rest of the panel. The question that needs to be addressed here is whether this level of damage is significant or not. This analysis will enable SIDER to be calibrated such that only significant features are identified. As a note, calibration testing is typically done for ultrasonic testing where flat bottom holes are drilled in the material of interest and the system set up to identify specific diameter holes.
Another test that is recommended is to take a panel with some degree of damage, and then subject it to a loading that should grow the defect. Repeated SIDER inspection could then be used to demonstrate the ability to determine damage growth.
If it is intended to use SIDER to inspect large-scale panels in service, then each manufactured panel should be SIDER tested after manufacture and the results archived. The pedigree of each panel would then be established. At a later time, subsequent SIDER inspections can be performed and compared with the initial test. This will identify changes that have occurred in the panels over time.

NSWCCD-65-TR–2005/04
18