Embed Size (px)
Citation preview
Natural Gas Facts & Figures
3. LNG
3. LNGSources : Total LNG group, PGCD special report
Trade movementsTerminals for import, terminals for exports Liquefaction, regazeificationShips
LNG by road, fluvial
49
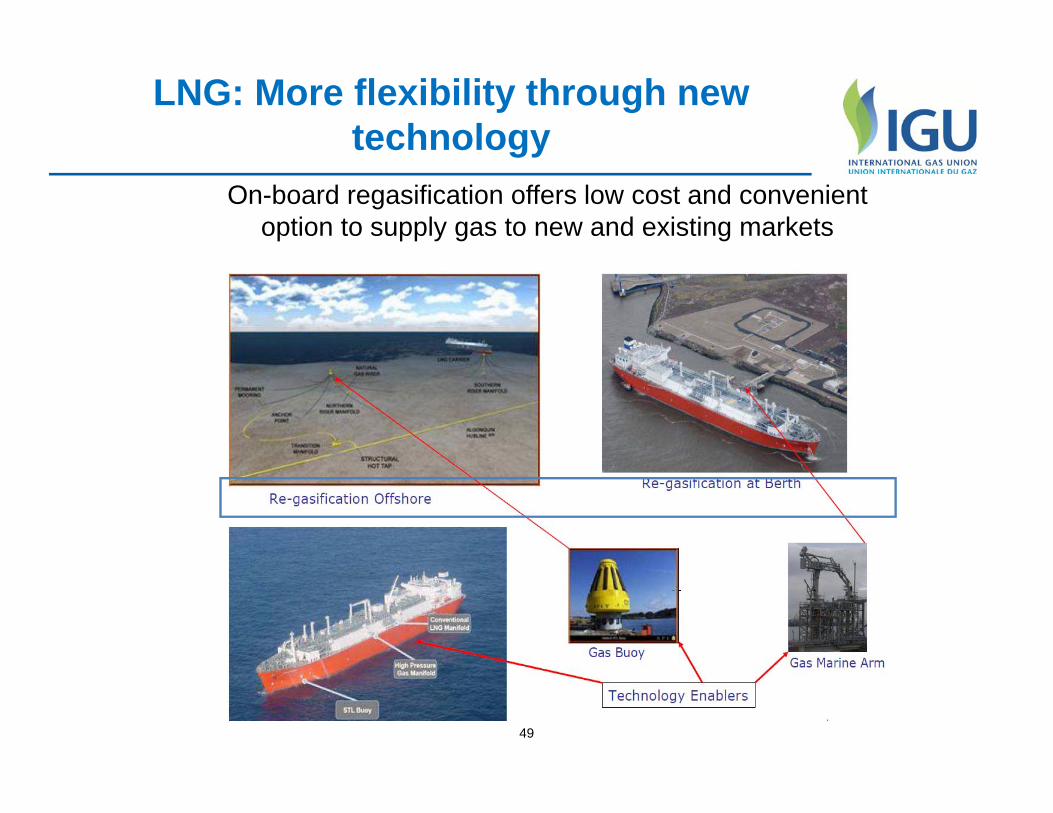
On-board regasification offers low cost and convenient option to supply gas to new and existing markets
LNG: More flexibility through new technology
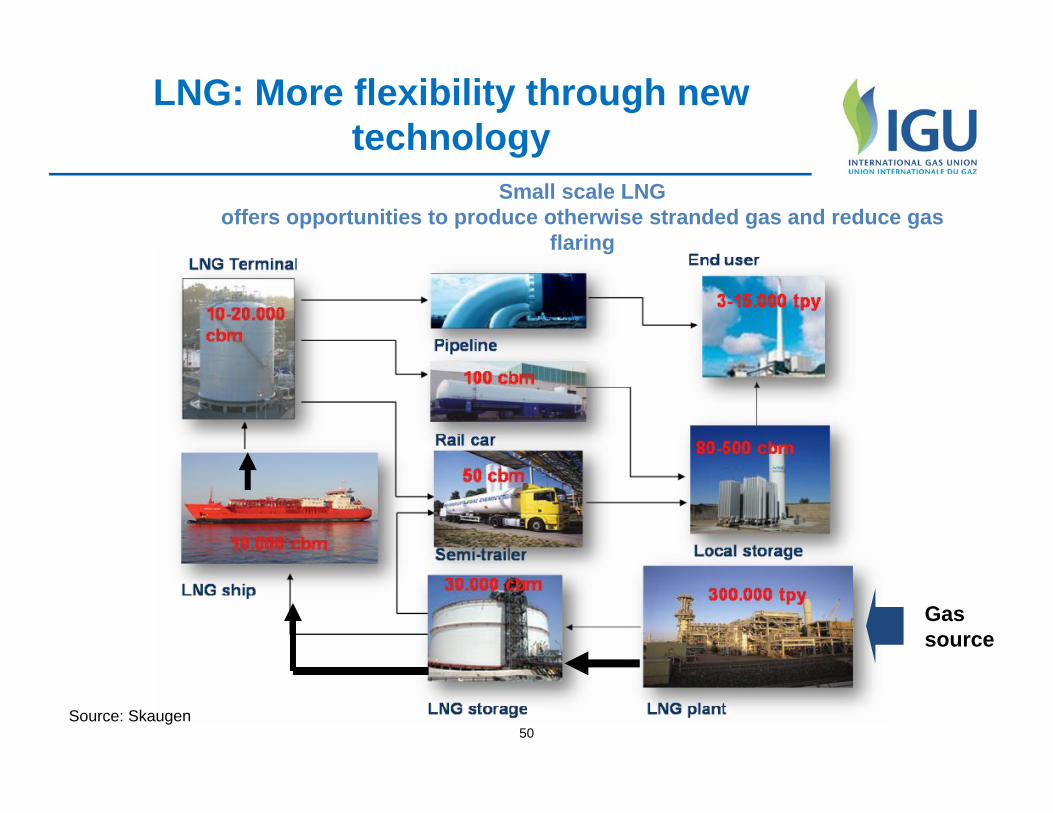
50Source: Skaugen
Gas source
Small scale LNGoffers opportunities to produce otherwise stranded gas and reduce gas
flaring
LNG: More flexibility through new technology
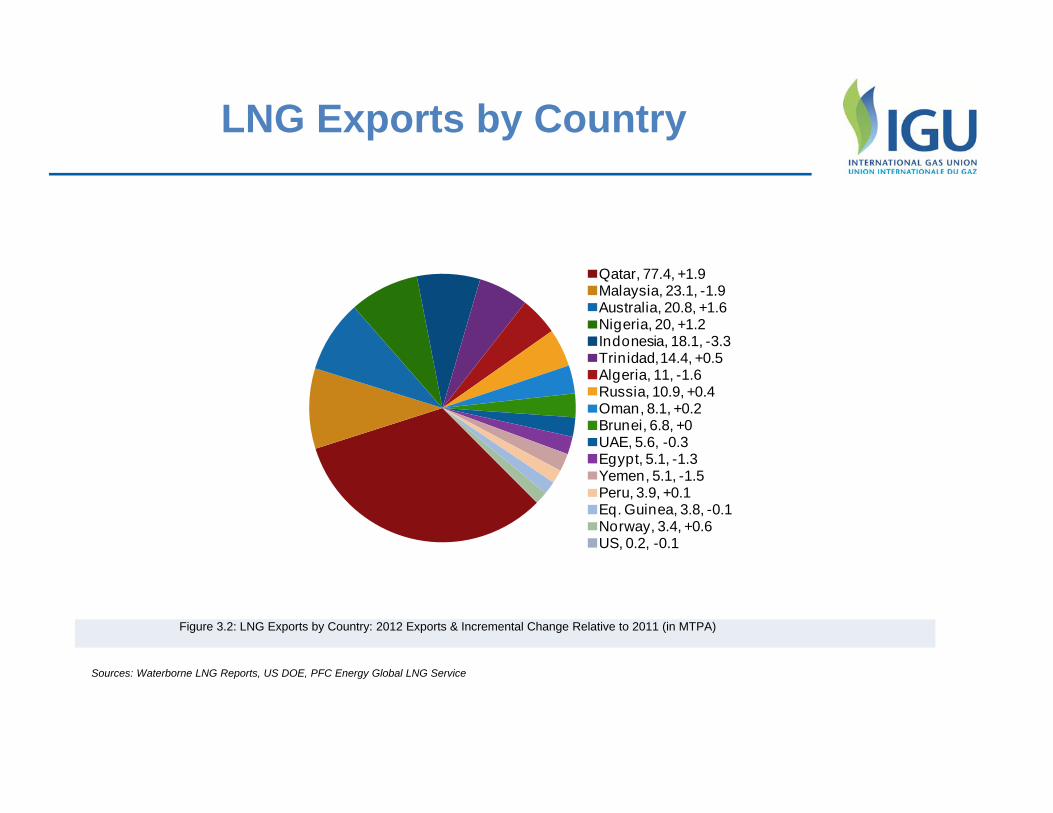
LNG Exports by Country
Qatar, 77.4, +1.9Malaysia, 23.1, -1.9Australia, 20.8, +1.6Nigeria, 20, +1.2Indonesia, 18.1, -3.3Trinidad, 14.4, +0.5Algeria, 11, -1.6Russia, 10.9, +0.4Oman, 8.1, +0.2Brunei, 6.8, +0UAE, 5.6, -0.3Egypt, 5.1, -1.3Yemen, 5.1, -1.5Peru, 3.9, +0.1Eq. Guinea, 3.8, -0.1Norway, 3.4, +0.6US, 0.2, -0.1
Figure 3.2: LNG Exports by Country: 2012 Exports & Incremental Change Relative to 2011 (in MTPA)
Sources: Waterborne LNG Reports, US DOE, PFC Energy Global LNG Service
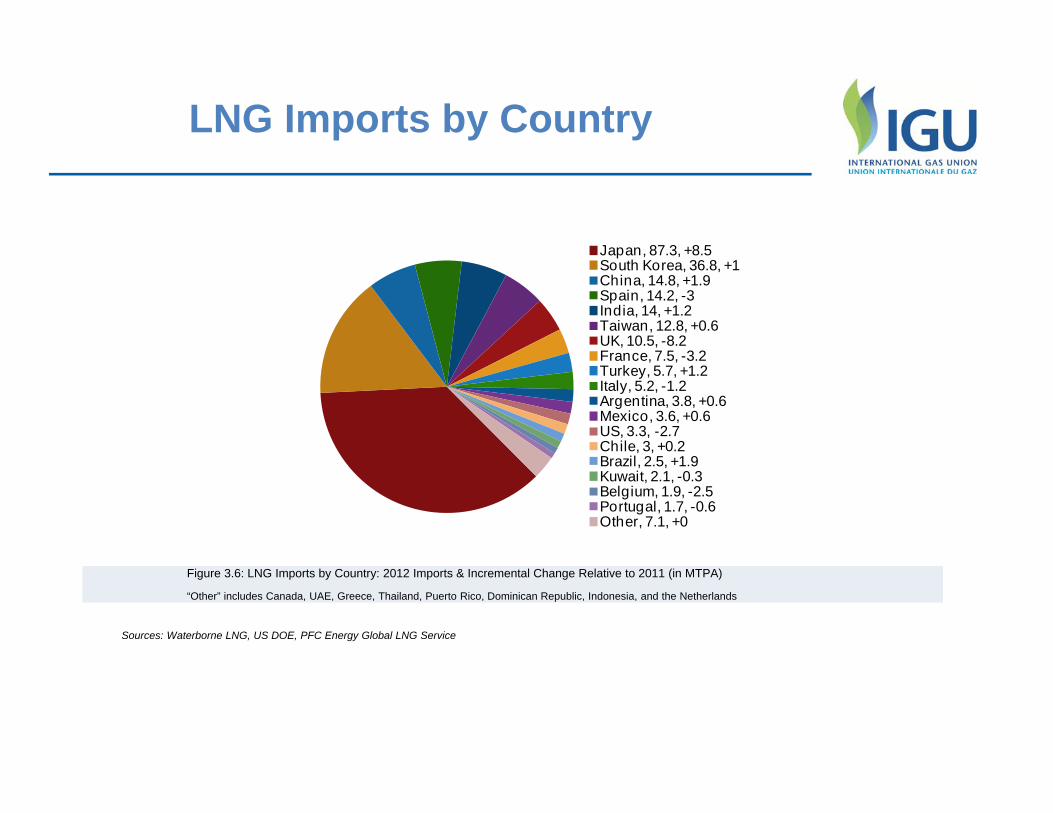
LNG Imports by Country
Japan, 87.3, +8.5South Korea, 36.8, +1China, 14.8, +1.9Spain, 14.2, -3India, 14, +1.2Taiwan, 12.8, +0.6UK, 10.5, -8.2France, 7.5, -3.2Turkey, 5.7, +1.2Italy, 5.2, -1.2Argentina, 3.8, +0.6Mexico, 3.6, +0.6US, 3.3, -2.7Chile, 3, +0.2Brazil, 2.5, +1.9Kuwait, 2.1, -0.3Belgium, 1.9, -2.5Portugal, 1.7, -0.6Other, 7.1, +0
Figure 3.6: LNG Imports by Country: 2012 Imports & Incremental Change Relative to 2011 (in MTPA)
“Other” includes Canada, UAE, Greece, Thailand, Puerto Rico, Dominican Republic, Indonesia, and the Netherlands
Sources: Waterborne LNG, US DOE, PFC Energy Global LNG Service
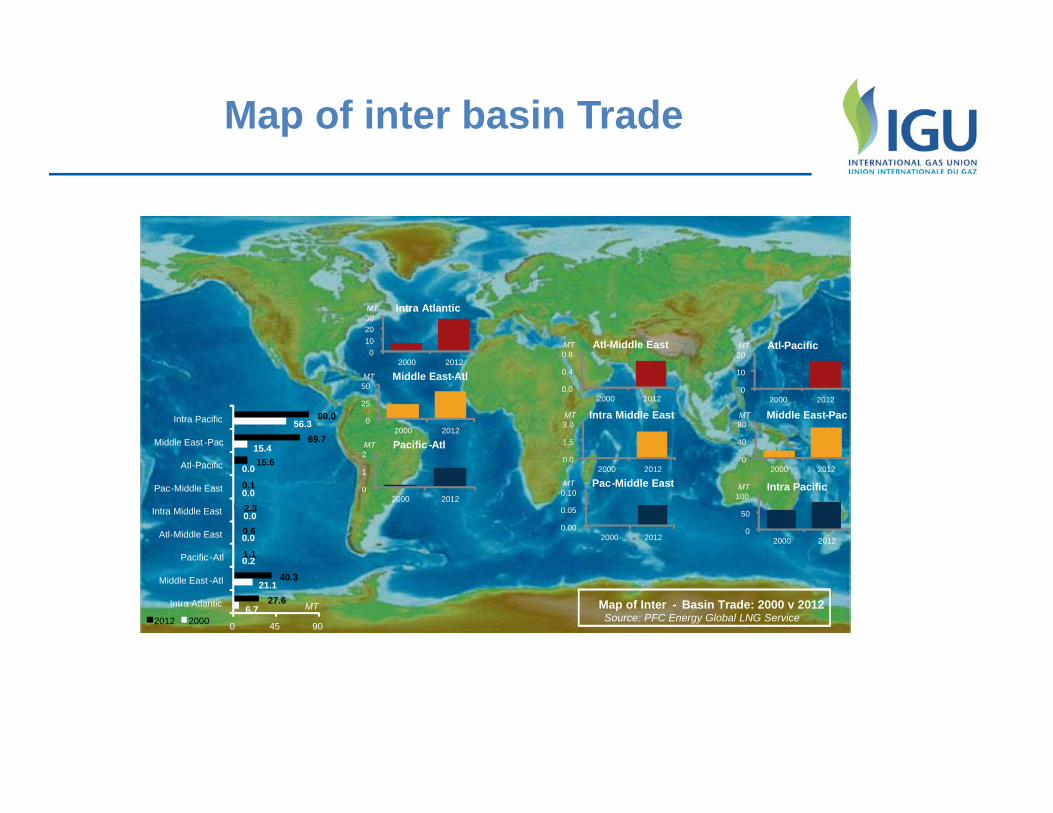
Map of inter basin Trade
6.7
21.1
0.2
0.0
0.0
0.0
0.0
15.4
56.3
27.6
40.3
1.1
0.6
2.3
0.1
15.6
69.7
80.0
0 45 90
Intra Atlantic
Middle East -Atl
Pacific -Atl
Atl-Middle East
Intra Middle East
Pac-Middle East
Atl-Pacific
Middle East -Pac
Intra Pacific
MT2012 2000
0 10 20 30
2000 2012
MT Intra Atlantic
0.0
0.4
0.8
2000 2012
MT Atl-Middle East
0
10
20
2000 2012
MT Atl-Pacific
0
25
50
2000 2012
MT Middle East-Atl
0.0
1.5
3.0
2000 2012
MT Intra Middle East
0
40
80
2000 2012
MT Middle East-Pac
0
1
2
2000 2012
MT Pacific -Atl
0.00
0.05
0.10
2000 2012
MT Pac-Middle East
0
50
100
2000 2012
MT Intra Pacific
Map of Inter - Basin Trade: 2000 v 2012Source: PFC Energy Global LNG Service
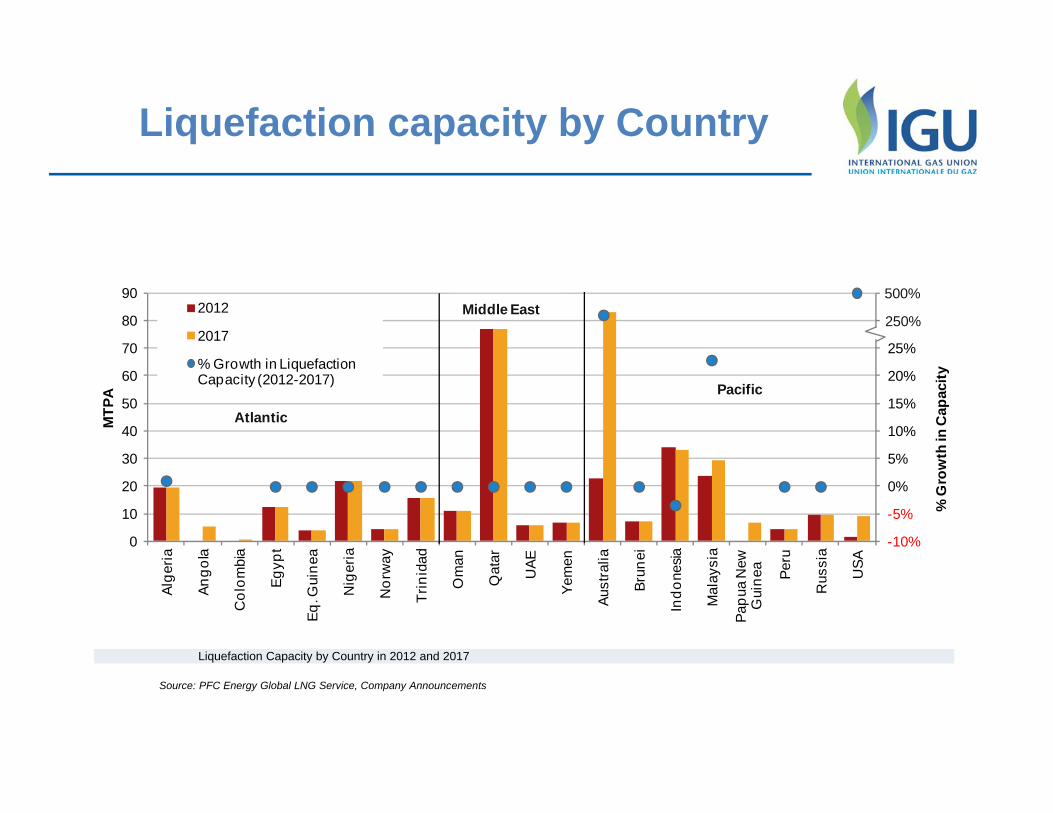
Liquefaction capacity by Country
-10%
-5%
0%
5%
10%
15%
20%
25%
30%
35%
0
10
20
30
40
50
60
70
80
90
Alge
ria
Ango
la
Col
ombi
a
Egyp
t
Eq. G
uine
a
Nig
eria
Nor
way
Trin
idad
Om
an
Qat
ar
UAE
Yem
en
Aust
ralia
Brun
ei
Indo
nesia
Mal
aysi
a
Papu
a N
ew
Gui
nea
Peru
Rus
sia
USA
% G
row
th in
Cap
acity
MTP
A
2012
2017
% Growth in Liquefaction Capacity (2012-2017)
Middle East
Pacific
Atlantic
250%
500%
Liquefaction Capacity by Country in 2012 and 2017
Source: PFC Energy Global LNG Service, Company Announcements
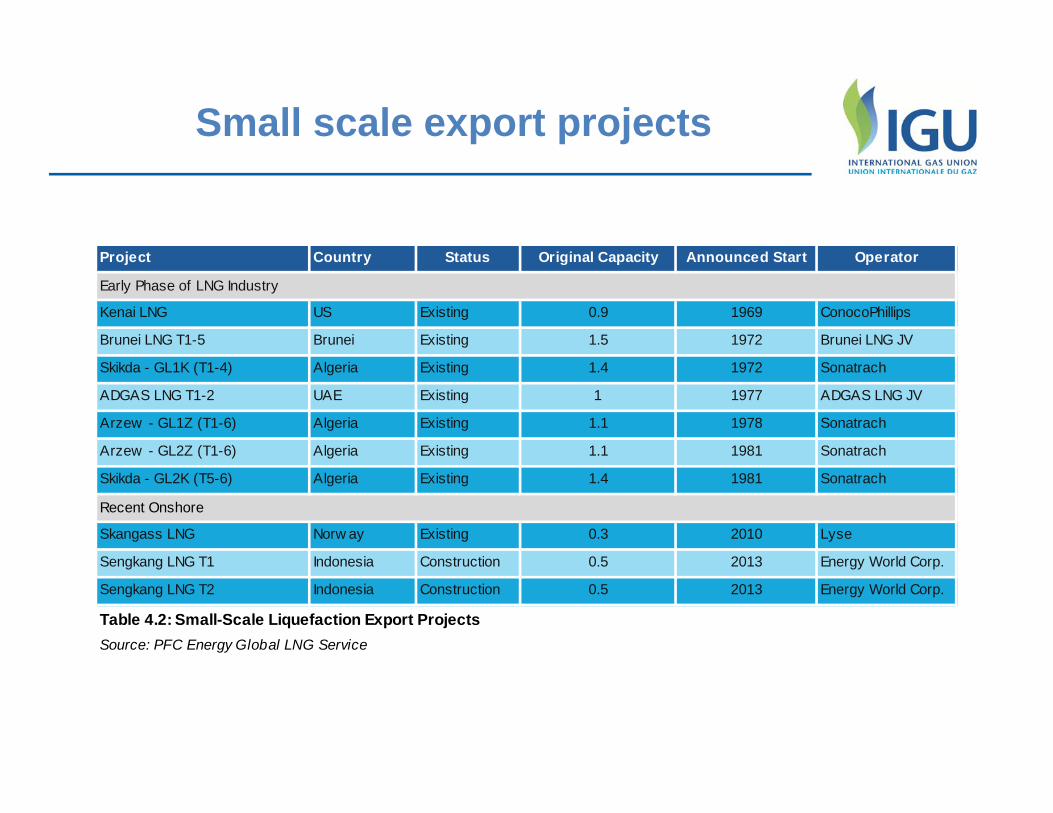
Small scale export projects
Project Country Status Original Capacity Announced Start Operator
Kenai LNG US Existing 0.9 1969 ConocoPhillips
Brunei LNG T1-5 Brunei Existing 1.5 1972 Brunei LNG JV
Skikda - GL1K (T1-4) Algeria Existing 1.4 1972 Sonatrach
ADGAS LNG T1-2 UAE Existing 1 1977 ADGAS LNG JV
Arzew - GL1Z (T1-6) Algeria Existing 1.1 1978 Sonatrach
Arzew - GL2Z (T1-6) Algeria Existing 1.1 1981 Sonatrach
Skikda - GL2K (T5-6) Algeria Existing 1.4 1981 Sonatrach
Skangass LNG Norw ay Existing 0.3 2010 Lyse
Sengkang LNG T1 Indonesia Construction 0.5 2013 Energy World Corp.
Sengkang LNG T2 Indonesia Construction 0.5 2013 Energy World Corp.
Early Phase of LNG Industry
Recent Onshore
Table 4.2: Small-Scale Liquefaction Export ProjectsSource: PFC Energy Global LNG Service
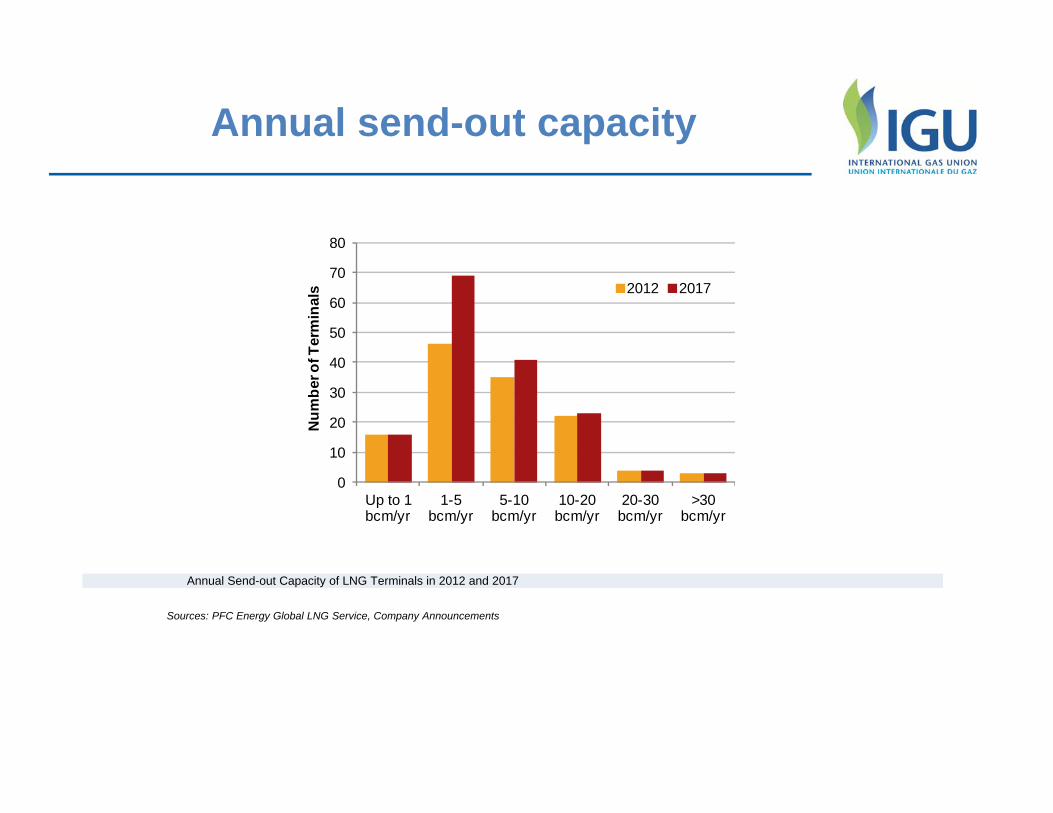
Annual send-out capacity
0
10
20
30
40
50
60
70
80
Up to 1 bcm/yr
1-5 bcm/yr
5-10 bcm/yr
10-20 bcm/yr
20-30 bcm/yr
>30 bcm/yr
Num
ber o
f Ter
min
als 2012 2017
Annual Send-out Capacity of LNG Terminals in 2012 and 2017
Sources: PFC Energy Global LNG Service, Company Announcements
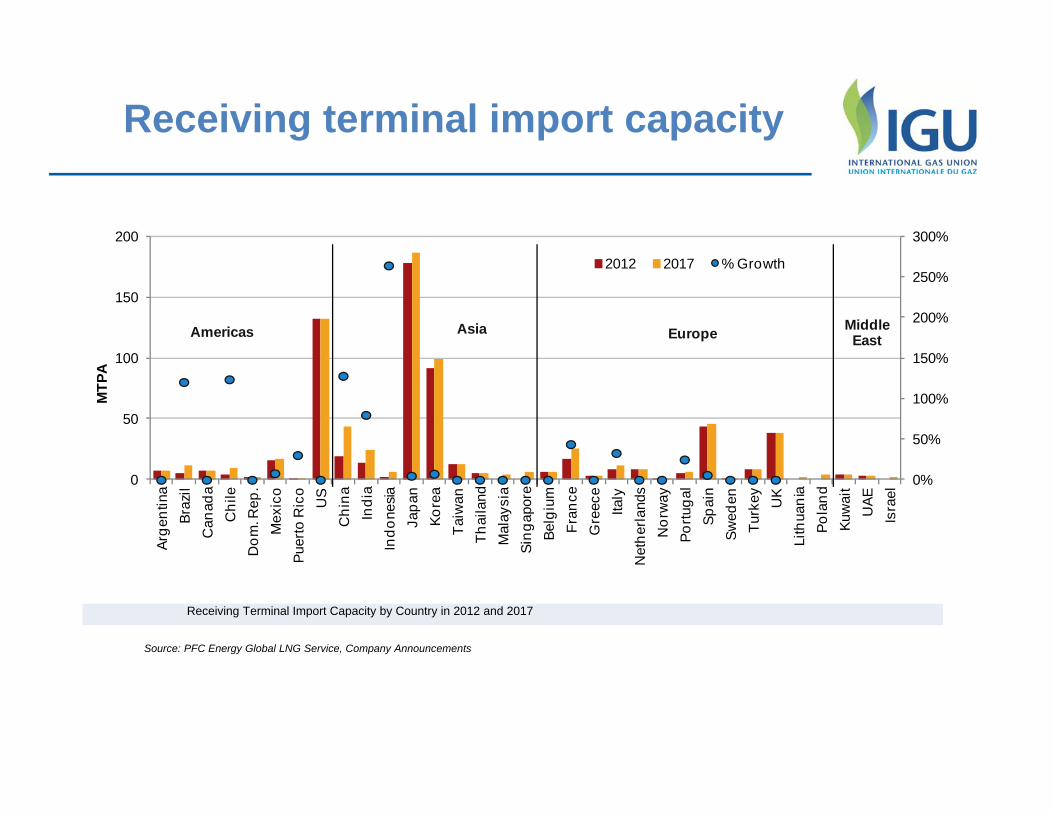
Receiving terminal import capacity
0%
50%
100%
150%
200%
250%
300%
0
50
100
150
200
Arge
ntin
aBr
azil
Can
ada
Chi
leD
om. R
ep.
Mex
ico
Puer
to R
ico
US
Chi
naIn
dia
Indo
nesia
Japa
nKo
rea
Taiw
anTh
aila
ndM
alay
sia
Sing
apor
eBe
lgiu
mFr
ance
Gre
ece
Italy
Net
herla
nds
Nor
way
Portu
gal
Spai
nSw
eden
Turk
ey UK
Lith
uani
aPo
land
Kuw
ait
UAE
Isra
el
MTP
A
2012 2017 % Growth
Americas Asia Europe Middle East
Receiving Terminal Import Capacity by Country in 2012 and 2017
Source: PFC Energy Global LNG Service, Company Announcements
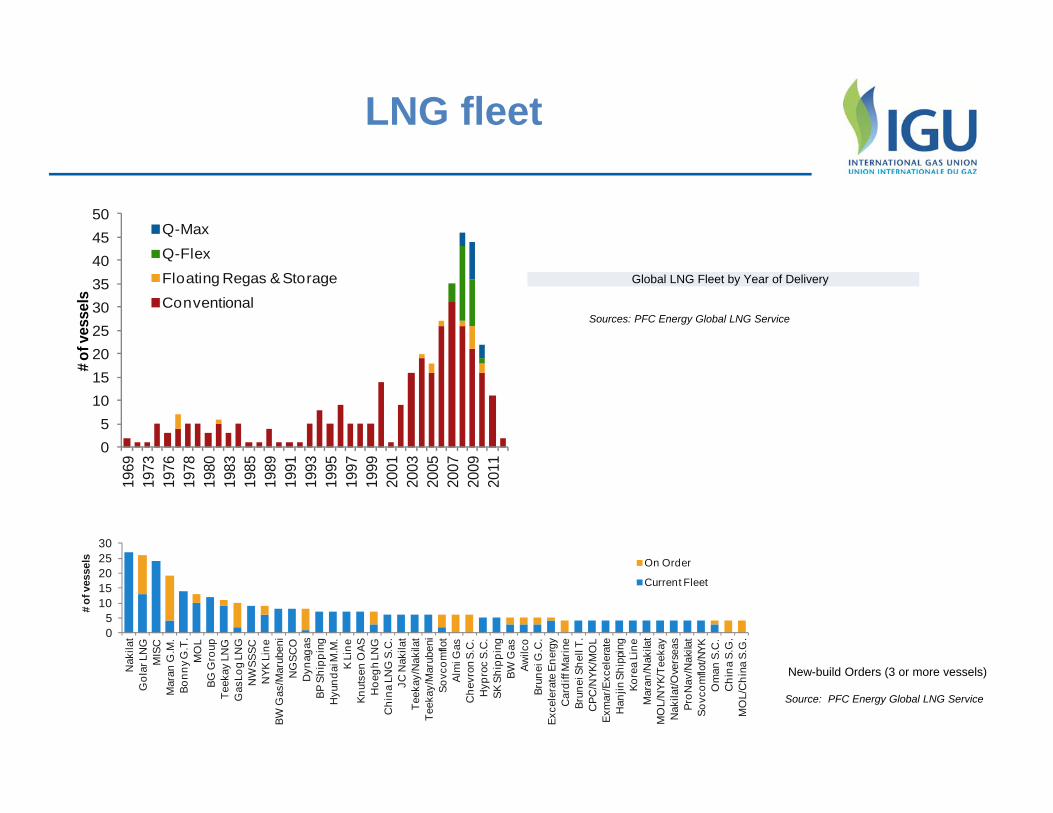
LNG fleet
05
101520253035404550
1969
1973
1976
1978
1980
1983
1985
1989
1991
1993
1995
1997
1999
2001
2003
2005
2007
2009
2011
Q-Max
Q-Flex
Floating Regas & Storage
Conventional
#of v
esse
ls
Global LNG Fleet by Year of Delivery
Sources: PFC Energy Global LNG Service
05
1015202530
Nak
ilat
Gol
ar L
NG
MIS
CM
aran
G.M
.Bo
nny G
.T.
MO
LBG
Gro
upTe
ekay
LN
GG
asLo
g LN
GN
WSS
SCN
YK L
ine
BW G
as/M
arub
eni
NG
SCO
Dyn
agas
BP S
hipp
ing
Hyu
ndai
M.M
.K
Line
Knut
sen
OAS
Hoe
gh L
NG
Chi
na L
NG
S.C
.JC
Nak
ilat
Teek
ay/N
akila
tTe
ekay
/Mar
uben
iSo
vcom
flot
Alm
i Gas
Che
vron
S.C
.H
ypro
c S.
C.
SK S
hipp
ing
BW G
asAw
ilco
Brun
ei G
.C.
Exce
lera
te E
nerg
yC
ardi
ff M
arin
eBr
unei
She
ll T.
CPC
/NYK
/MO
LEx
mar
/Exc
eler
ate
Han
jin S
hipp
ing
Kore
a Li
neM
aran
/Nak
ilat
MO
L/N
YK/T
eeka
yN
akila
t/Ove
rsea
sPr
oNav
/Nak
ilat
Sovc
omflo
t/NYK
Om
an S
.C.
Chi
na S
.G.
MO
L/C
hina
S.G
.
# of
ves
sels On Order
Current Fleet
Source: PFC Energy Global LNG Service
New-build Orders (3 or more vessels)
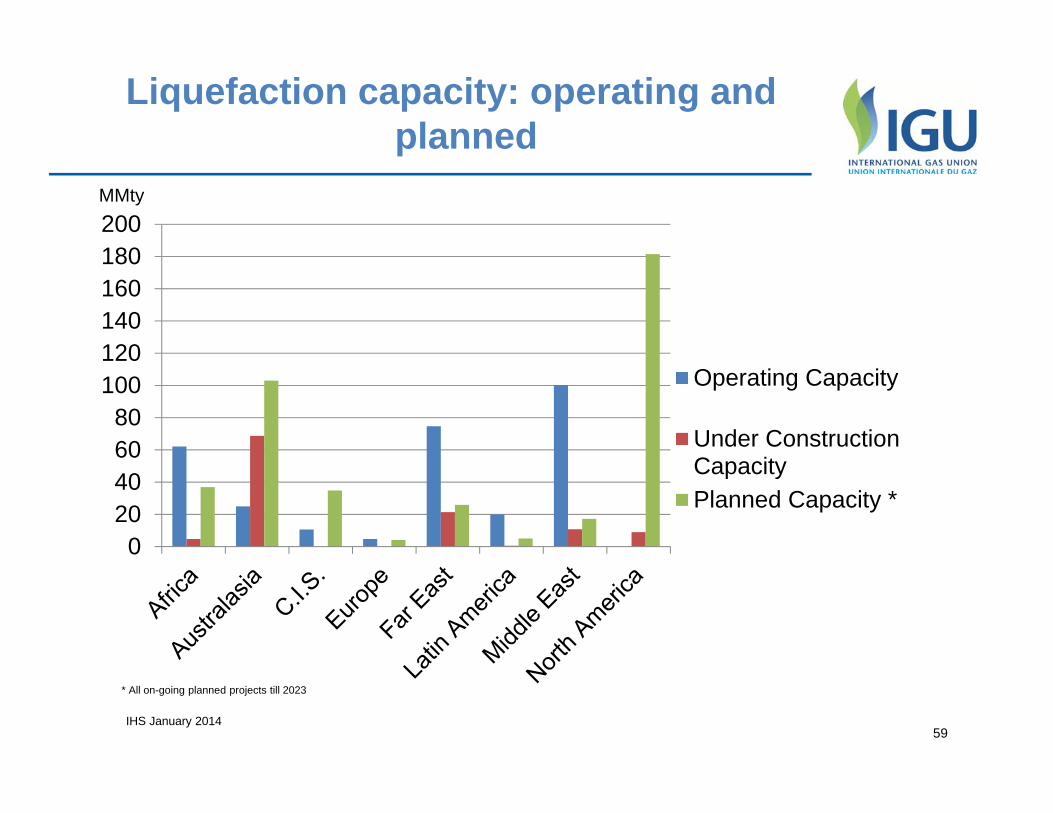
Liquefaction capacity: operating and planned
020406080
100120140160180200
Operating Capacity
Under ConstructionCapacityPlanned Capacity *
59IHS January 2014
MMty
* All on-going planned projects till 2023
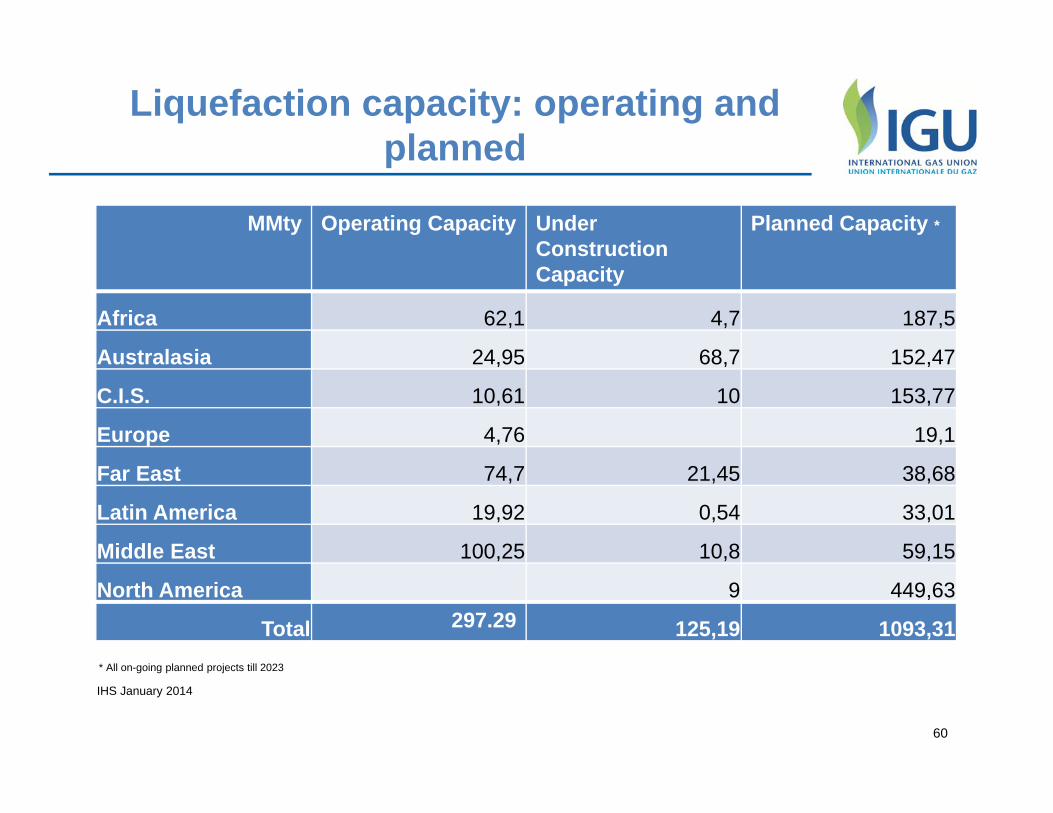
Liquefaction capacity: operating and planned
60
IHS January 2014
MMty Operating Capacity UnderConstructionCapacity
Planned Capacity *
Africa 62,1 4,7 187,5
Australasia 24,95 68,7 152,47
C.I.S. 10,61 10 153,77
Europe 4,76 19,1
Far East 74,7 21,45 38,68
Latin America 19,92 0,54 33,01
Middle East 100,25 10,8 59,15
North America 9 449,63
Total 297.29 125,19 1093,31* All on-going planned projects till 2023
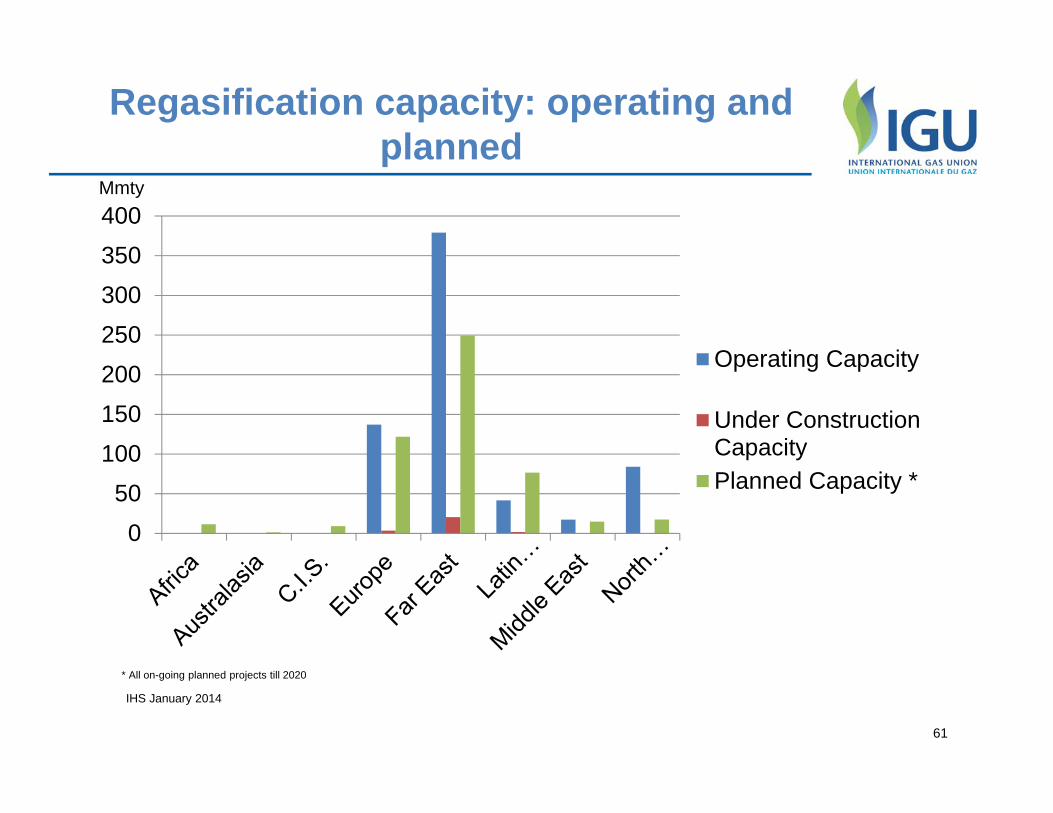
Regasification capacity: operating and planned
050
100150200250300350400
Operating Capacity
Under ConstructionCapacityPlanned Capacity *
61
IHS January 2014
Mmty
* All on-going planned projects till 2020
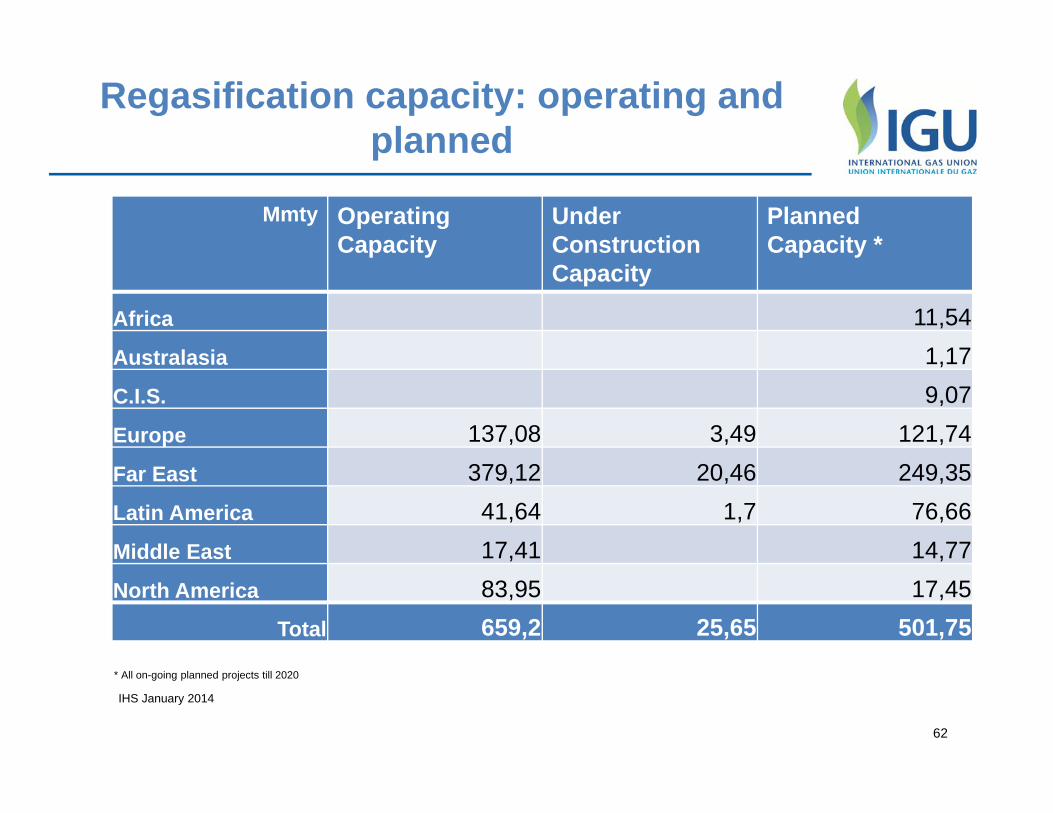
Regasification capacity: operating and planned
62
IHS January 2014
Mmty Operating Capacity
UnderConstruction Capacity
PlannedCapacity *
Africa 11,54Australasia 1,17C.I.S. 9,07Europe 137,08 3,49 121,74Far East 379,12 20,46 249,35Latin America 41,64 1,7 76,66Middle East 17,41 14,77North America 83,95 17,45
Total 659,2 25,65 501,75
* All on-going planned projects till 2020
63
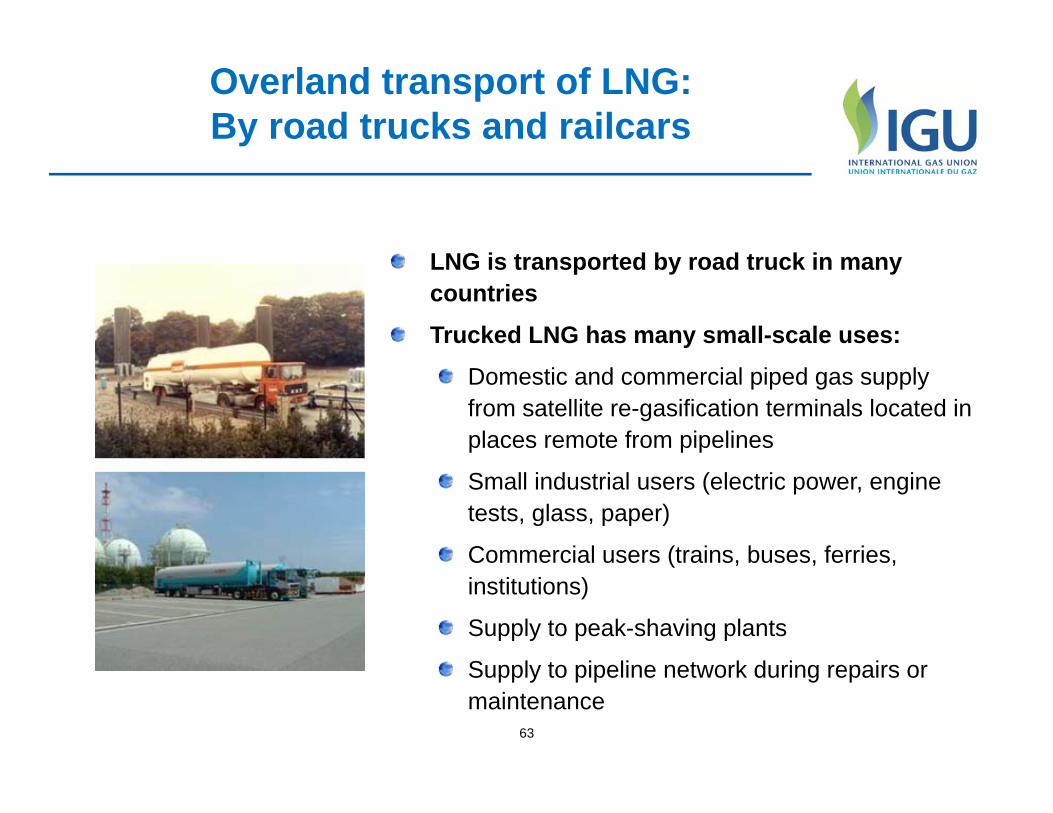
Overland transport of LNG: By road trucks and railcars
LNG is transported by road truck in many countriesTrucked LNG has many small-scale uses:
Domestic and commercial piped gas supply from satellite re-gasification terminals located in places remote from pipelines
Small industrial users (electric power, engine tests, glass, paper)
Commercial users (trains, buses, ferries, institutions)
Supply to peak-shaving plants
Supply to pipeline network during repairs or maintenance