Embed Size (px)
Citation preview

© Frontier Economics Ltd, London.
Grain LNG III competition analysis A REPORT PREPARED FOR NATIONAL GRID GRAIN LNG LIMITED
June 2006


i Frontier Economics | June 2006 |
Contents
Grain LNG III competition analysis
Executive summary....................................................................................... 1 1 Introduction .........................................................................................9 2 The UK gas sector and its connections with continental Europe..... 11
2.1 Sector outlook ........................................................................................... 11 2.2 Structure of the UK gas sector ............................................................... 12
3 Conceptual framework ....................................................................... 19 4 Grain Phase 3 and its impact ............................................................. 21
4.1 The Grain Phase 3 investment................................................................ 21 4.2 Likely impact on gas value chain ............................................................ 22
5 Identifying the relevant markets ........................................................23 5.1 Market definition and the SSNIP-Test .................................................. 23 5.2 The relevant markets in the present case .............................................. 24 5.3 Summary of potentially affected markets.............................................. 32
6 Competitive assessment.....................................................................33 6.1 Directly affected markets......................................................................... 33 6.2 Markets with a probable indirect impact ............................................... 47 6.3 Possible vertically related markets .......................................................... 51 6.4 Competitive assessment Conclusions .................................................... 55
Annexe 1: Estimating the future position of parties in the UK wholesale market.................................................................................................57
Annexe 2: Estimation of daily deliverability to the UK wholesale market.63

ii Frontier Economics | June 2006 |
Tables & figures
Grain LNG III competition analysis
Figure 1: UKCS production and UK gas demand ................................................... 12 Figure 2: Series of activities in the UK gas sector .................................................... 13 Figure 3: UK gas map (current import pipelines in black boxes) .......................... 14 Figure 4: Gas sector framework.................................................................................. 25 Figure 5: Market shares for global LNG supply (2005)........................................... 48
Table 1: Isle of Grain, Phase 3 capacity additions.................................................... 21 Table 2: The UK demand option – Supply market shares and HHIs by scenario,
2010-11 .................................................................................................................. 34 Table 3: North West Europe wholesale market shares (2005) ............................... 37 Table 4: European wholesale market shares (2005) ................................................. 39 Table 5: Daily deliverability - Estimated capacity shares in 2010-11..................... 43 Table 6: Seasonal deliverability - Estimated capacity shares in 2010-11 ............... 46 Table 7: LNG shipping market share range and HHI for shipping built up to
2005........................................................................................................................ 49 Table 8: Market share for supply to power stations in 2002................................... 52 Table 9: Market shares for supply to industrial & commercial customers ........... 53 Table 10: Market shares for supply to domestic customers (accounts) ................ 54 Table 11: Summary of competitive assessment ........................................................ 55 Table 12: UCKS production market share data for 2005........................................ 59 Table 13: Isle of Grain capacity phases...................................................................... 60 Table 14: Existing and future gas infrastructure developments in the UK up to
the gas year 2010-11............................................................................................. 62 Table 15: Data on existing storage sites..................................................................... 63 Table 16: Planned storage sites.................................................................................... 64

1 Frontier Economics | June 2006 |
Executive summary
Executive summary
National Grid Grain LNG Ltd plan expansion, if granted exemption from RTPA
National Grid Grain LNG Ltd. (Grain LNG) has completed construction of its LNG importation facility (Grain Phase I) which became operational in July 2005. Grain Phase 2 is under construction and is expected to become operational in 2008.
Grain LNG is now planning a third phase, comprising an extra jetty and additional vaporisers (and possibly extra storage tanks) which it expects to construct provided that it is able to obtain exemption from the requirement to offer regulated third party access (RTPA).
As part of preparing its exemption application, Grain LNG has commissioned Frontier Economics to carry out a competition assessment of the project. This document presents this assessment.
UK gas use has grown significantly but indigenous production is declining
Energy sector liberalisation and the removal on the restrictions on the use of gas for power generation led to rapid growth in UK gas demand during the late 1980s and 1990s. However, since 2002, United Kingdom Continental Shelf (UKCS) production of gas has been in decline and an increasing volume of imports either via interconnectors or as LNG will be needed to meet demand.
The import capacity of the Bacton – Zeebrugge interconnector has recently been increased from 8.5 to 16.5 bcm pa and further compression is expected to raise this to 23.5 bcm pa at the end of 2006. The BBL interconnector from the Netherlands to the UK is expected to add a further 16 bcm pa at around the same time.
Currently, LNG importation facilities exist or are under construction at three UK sites Grain, and two sites at Milford Haven (Dragon LNG and South Hook). All of these LNG developments (and BBL) have received an exemption from the regulated third party access (RTPA) of section 19D of the Gas Act 1986 (the Act) (as amended).
The exemption must not be detrimental to competition…
Section 19C (7) (e) of the Act (as amended) provides that one of the criteria for gaining an exemption from the RTPA requirements of section 19D of the Act is that:
‘the exemption will not be detrimental to competition, the operation of an economically efficient gas market or the efficient functioning of the pipeline system connected or to be connected to the facility.’
2 Frontier Economics | June 2006 |
Executive summary
therefore the project (with exemption) must not be detrimental
The equivalent conditions in the European Gas Directive (2003/55/EC) also require that the investment should enhance competition in supply. As the investment will add to, rather than reduce capacity for gas supply into the UK/Europe, the investment per se will tend to enhance competition and hence the UK competition condition for exemption is equivalent to those in the Directive. Another condition for the grant of an exemption is that the project will not proceed if an exemption is not granted. These two criteria for exemption have the consequence that the relevant counterfactual for the purposes of analysing the competitive effect of the exemption, is that the project will not proceed. In the light of this and in order to analyse the competitive effect of the proposed exemption, we:
• identify where in the gas value chain the project could have a direct or indirect impact;
• identify which are the relevant markets in competition terms where those impacts may be felt; and
• analyse the current or where practicable the foreseeable state of competition in each of the relevant markets, with and without the proposed investment, assuming as a “worst case” in respect of each market that the player with the largest current market share obtains all of the Grain 3 capacity.
While, in principle, there could be a detriment in a subset of the relevant markets, the condition is that the overall impact should not be detrimental to competition.
Direct and indirect impacts could in theory occur throughout the value chain
The Grain 3 project will add a jetty (providing an additional 85 berthing slots) and between 3 and 6 more vaporisers. In addition, if the open season process reveals adequate demand, Grain 3 could include the addition of up to two further 190,000 cubic metre LNG storage tanks. Given these physical components, we identify that the project could have direct impacts in relation to the following services:
• the provision of LNG importation capacity, which includes “unloading” and regasification (the gas being temporarily stored before placing on the gas network in existing storage tanks);
• potentially, the provision of additional LNG storage capacity; and
• potentially, the provision of further regasification capacity over and above that required by baseload LNG importation.

3 Frontier Economics | June 2006 |
Executive summary
In addition to these direct impacts, Grain 3 could, through the actions of contracting parties, give rise to a series of indirect impacts, namely:
• LNG liquefaction/export – the proposed expansion would be likely to cause or facilitate a player to enter into or expand its LNG exports;
• LNG shipping – the investment will increase the shipping of LNG;
• wholesale supply of gas (UK and Europe) – it will cause more LNG to come to the wholesale market in the UK and therefore also in Europe;
• entry services - it will potentially increase the maximum injection rate from Grain into the NTS;
• network services – it will increase the demand for the use of network services in the UK;
• shipping of gas – as a consequence of the increased demand for network services (transportation), there will be an increase in the demand for shipping services;
• flexibility/storage – it may also have an effect on the demand for flexibility or storage but may also be an additional source of supply for these services; and
• retail supply of gas – the proposed expansion could have an impact on the supply of gas to end consumers if access to upstream supplies afforded a particular competitive advantage.
These impacts occur within relevant markets
We have considered these impacts and endeavoured to identify what, in competition terms, are the relevant markets within which they occur.
Conceptually, to do this we apply the hypothetical monopolist or small but significant non-transitory increase in price (SSNIP) test, although, in practice both data availability and specific characteristics of the energy sector mean that a more pragmatic approach is required. Where we have any major uncertainty as to the relevant market, we have considered various options.
We ignore impacts which occur in monopoly regulated services as there can be no competitive impact in these markets.
Working our way through the value chain, we have identified the following to be possible relevant markets in competition terms:
Direct Impact
• wholesale supply of gas to the UK , North West Europe, or Europe;

4 Frontier Economics | June 2006 |
Executive summary
• flexibility/storage in the UK (i.e. markets for both daily and seasonal delivery);
Probable indirect impact
• global LNG supply (liquefaction);
• global LNG shipping;
• shipping (as in providing commercial access to UK gas transport and balancing services);
Other markets with a possible indirect effect
• supply of gas to UK power stations;
• supply of gas to UK I&C customers; and
• supply of gas to domestic customers in the UK.
Ideally we want to project competitive conditions … and therefore developments before Grain 3 is commissioned
Ideally, in order to analyse the competitive effect of the project (with an exemption) we would want to project the circumstances that will prevail when the project will be commissioned. We have done this in respect of most of the UK markets, i.e. those for which anticipated developments are reasonably well documented. For broader European and global markets, this is not a practicable proposition in relation to this assessment. For these we have, in effect, assumed that competitive conditions at Grain 3’s commissioning resemble those prevailing currently (or strictly those prevailing at the date of the last available data). A key metric that we have used in our competitive assessment is the Herfindahl-Hirschmann Index (HHI) which measures the sum of the squares of market shares (expressed as percentages). This measure is used frequently in the analysis of mergers where there is no capacity addition and a simple comparison of HHIs, with and without the exempt project, will tend to exaggerate the competitive effect of the largest player gaining rights to the project. The results of our competitive analysis are summarised below.
Directly affected markets
UK wholesale market (annual)
We have assumed two demand scenarios for UK gas: one in which there is no export and one in which there is export to continental Europe. Based on these two scenarios, we estimate that in 2010/11 the HHI for the UK wholesale market will be 835 or 803 respectively. If we assume that the largest player, Centrica, takes 100% of the rights to use Grain 3, the HHIs under these two scenarios would be 893 and 889 respectively. Under both scenarios, the UK wholesale market will remain competitive even with the least favourable disposition of Grain 3 rights.

5 Frontier Economics | June 2006 |
Executive summary
NW European wholesale market
In relation to a possible North West European market, we have not attempted to predict new supply sources before 2010/11. We have used the most recently available market share data and therefore implicitly assumed that the market structure, based on most recent data, is indicative of the future market structure immediately prior to the commissioning of Grain 3. On this basis, if the relevant wholesale market were North West Europe, we estimate a pre-Grain 3 HHI of 778, with ExxonMobil being just the largest player in this potential market. If ExxonMobil were to acquire all rights to Grain 3 the HHI would become 808. We therefore conclude that a NW European wholesale market would remain competitive regardless of the disposition of rights to use Grain 3.
European wholesale market
We also considered the possibility that the geographic scope of the relevant wholesale market would be Europe wide if certain physical and institutional barriers to transportation are resolved. Based on the most recent data available, we estimate this market has an HHI of 1042 without Grain 3. In this case Gazprom would hold the largest market share and if we assume that it acquires all rights to Grain 3 its market share would move from just under 25% to just over this level. The implied HHI would be 1081.
Although the HHI of this possible market is higher than the others, we do not believe it creates any significant cause for concern. In summary, this is because:
• Grain 3 will not foreclose any existing sources of supply;
• competition in upstream supply is largely based on longer term contracts with a significant lead time, which means that it is the structure of potential supply rather than actual supply that is more relevant; and
• some degree of concentration is almost inevitable if Europe reduces the rate at which it depletes smaller indigenous sources of supply. Maintaining diversity in actual (as opposed to potential) supply now will tend to reduce the diversity of supply at a later date.
UK flexibility market (daily)
Based on the assumptions detailed in the body of our report, we estimate that the market for daily deliverability in 2010-11 will be quite fragmented, with an HHI of no more than 613. In reality the market is likely to be even more competitive than this implies as we have ignored the regulated access arrangements that apply to the Rough storage facility and National Grid’s LNG storage sites (other than at Grain). There should also be significantly more capacity than demand.

6 Frontier Economics | June 2006 |
Executive summary
Centrica has the largest capacity share with around 15%. If Centrica were to acquire all rights to Grain 3 capacity and all additional vaporisers were available, the HHI based on market shares would be 674. We therefore conclude that this market would remain competitive even if the largest player in this market obtained all Grain 3 capacity.
UK flexibility market (seasonal)
A generally similar picture emerges with respect to the market for seasonal delivery. The HHI of this market is expected to be 687 in 2010/11 and Centrica would have the largest market share with 16.5%. Once again there seems to be a likelihood of significant excess capacity.
If Centrica acquired exclusive use of Grain 3, its share of seasonal gas delivery capacity would increase to 17% and the HHI of this market would be 755. Once again, we conclude that, even if Grain 3 went to the largest player in the market, the market would remain competitive.
Markets in which there may be a potential indirect effect
Global LNG supply (liquefaction) market
The largest single player in the global LNG supply (or liquefaction) market is Sonatrach with a 14% market share. The market has a competitive structure with an estimated HHI of no more than 667. If Sonatrach were to acquire all rights to Grain 3 capacity and then match this by incremental investment in liquefaction capacity, the HHI of the global LNG market would rise to 735. The market would therefore remain competitive.
LNG shipping The LNG shipping market is global and is highly diverse. With approximately 45 players. We estimate the HHI of this market to be approximately 492. The largest player is currently a subsidiary of Petronas. If Petronas were to acquire all the rights to Grain 3 capacity and then match this by further investment in shipping, the HHI of the market based on capacity shares would be increased only marginally. We therefore conclude that exemption for Grain 3 raises no issues for the LNG shipping market.
Gas shipping Use of Grain 3 will inevitably give rise to the imported gas being shipped on the UK transportation system. No data are available on market shares for gas shipping in the UK. However, given that more than 120 entities hold shipping licences and there are few barriers either to entry or to expansion, we do not believe that any shipping activity associated with Grain 3 would have any adverse competitive impact on the market for the provision of shipping services.

7 Frontier Economics | June 2006 |
Executive summary
Possible vertically related markets
If the primary, affected markets are competitive, Grain 3 should have no competitive impact on any vertically related markets. Our analysis suggests that both the directly affected relevant markets (wholesale and flexibility) are competitive and therefore there should be no competition concerns. If these markets are competitive, then an increased market share in these markets confers no material advantage which can be leveraged into other adjacent markets. However, for the sake of completeness we consider hypothetical competitive impacts in three vertically related markets. If there were an effect to be felt anywhere, it would be in one of the three UK retail markets:
(i) the supply of gas to power stations;
(ii) the supply of gas to industrial and commercial customers; and
(iii) the supply of gas to domestic customers.
UK power stations
We have little recent data on this market, but data from 2002 suggests moderate concentration with an HHI of 1351. However, the characteristics of this market are such that there are extremely low barriers to entry for anyone with gas to sell and the customers are limited in number and are very cost conscious.
I&C market More recent data for this market segment shows a lower concentration than for supply to power stations, with our estimate of the HHI being 1099. Once again barriers to entry are generally low and this market is generally regarded as being quite competitive.
Domestic market
According to the most recent data from Ofgem (June 2005), Centrica still has a little over 50% of this market (by customer numbers). This inevitably makes the market appear concentrated with an HHI in excess of 3000. However, this simple picture conflates two factors: (i) an initial legacy in which Centrica (British Gas) had a 100% market share and (ii) the evolving competition which appears to be proceeding very healthily with high levels of customer switching. We concur with Ofgem’s conclusion that this market is competitive despite its apparent concentration.

8 Frontier Economics | June 2006 |
Executive summary
Overall conclusion
Grain 3 represents a net addition to capacity which will not foreclose any existing source of supply. The investment per se can therefore be expected to be pro competitive.
With regard to the effect of exemption, there is in our view no relevant market in which Grain 3 (with RTPA exemption) would have a materially adverse competitive impact even if, in each market, the party with the highest market share in each market were to acquire exclusive rights to Grain 3 (noting also that the party with the largest share is not the same across all these markets). Consequently, we conclude that exemption from RTPA would not be detrimental to competition.

9 Frontier Economics | June 2006 |
Introduction
1 Introduction
In recent years, the UK has gone from being a net exporter to being a net importer of gas. Longer-term projections by National Grid Gas and the DTI show that the UK will require substantial new sources of gas to meet increasing demand, given decreasing production from the UKCS1.
In response to the market demand for import infrastructure, National Grid Grain LNG Limited (Grain LNG) in 2004/05 converted an existing LNG storage facility at the Isle of Grain into a fully-fledged import facility to receive LNG, a new source of gas for the UK. The first phase of this project is now operational and construction has started on the second phase. The latter is expected to become operational by late 2008. This facility is the first modern LNG import facility in the UK and its development has been followed by the construction of a further two LNG importation terminals at Milford Haven, by Dragon LNG and South Hook by ExxonMobil, the initial phases of which are expected to become operational in late 2007/early 2008. All of these facilities have requested and been granted exemption from the requirement to provide RTPA under the Act, (as amended) which transposes into UK law the 2003 European Gas Directive2.
Grain LNG is now planning to invest in a further expansion of its existing LNG importation facility and intends to request exemption from the requirement to provide RTPA for the additional capacity created by this expansion. Establishing whether the project meets the relevant criteria for eligibility for an exemption requires inter alia an assessment of the likely impact of the project (with RTPA exemption) on competition. Grain LNG has asked Frontier Economics to carry out this assessment, which is presented in this report.
The remainder of this report is structured as follows:
Section 2 provides a brief overview of the UK gas sector and its connections with continental Europe. This includes a review of developments since Grain LNG’s first application for exemption in 2004;
Section 3 sets out the conceptual framework for the competition analysis required to support an exemption request;
Section 4 describes the planned investment in Grain Phase 3 and identifies on which activities in the gas value chain it could have an impact;
Section 5 reviews the markets that might be affected (directly or indirectly) by Grain Phase 3, and endeavours to define what in competition terms are, or may be, the relevant markets; and
1 We use the term “UK” but most of this report is about “Great Britain”, i.e. England, Scotland and Wales.
2 The second EU Gas Directive - 2003/55/EC.

10 Frontier Economics | June 2006 |
Introduction
Section 6 analyses the competitive effects that Grain Phase 3, with RTPA exemption, could have on the potential relevant markets identified in Section 5.
Annexe 1 provides the data and assumptions used to project market shares in the UK wholesale market in 2010-2011, the year in which Grain 3 is expected to be commissioned.
Annexe 2 provides the data and assumptions used to calculate shares of daily gas delivery capacity.

11 Frontier Economics | June 2006 |
The UK gas sector and its connections with continental Europe
2 The UK gas sector and its connections with continental Europe
This section provides a brief overview of the UK gas sector. It summarises the main market trends in terms of sources of supply of gas to the UK and interconnections with Europe; discusses the structure of the sector; and identifies the main types of player active in the sector.
2.1 SECTOR OUTLOOK
The UK gas sector is the most advanced in terms of liberalisation in Europe. The introduction of the Act initiated a staged liberalisation of the entire UK gas market. These reforms, which extended competition to the domestic sector in the late 1990s, were generally regarded as successful3 and have led to the creation of reasonably liquid spot and forwards markets. Liberalisation and the lifting of the prohibition on the use of gas in power generation led to a rapid rise in gas demand. Over the last two decades, gas consumption has risen to account for over 40% of UK energy demand. The UK was self-sufficient in the production of gas to meet its demand. Indeed, gas production in the UK was sufficient for the UK to become a net exporter of gas and with the construction of the Bacton-Zeebrugge interconnector, the UK did become a net exporter of gas. Since 2002, however, UK indigenous production has been declining whilst UK consumption has continued to rise and in recent years the UK has gone from being a net exporter to a net importer of gas.
This is illustrated in Figure 1, which plots historical and projected UKCS production and national demand from 1990 to 2030.
3 Large Scale Investments in Liberalised Gas Markets: The Case of UK, Oxford Institute for Energy Studies –
Natural Gas Research Programme, July 2004.

12 Frontier Economics | June 2006 |
The UK gas sector and its connections with continental Europe
UKCS production and national demand
0
20
40
60
80
100
120
140
160
1990
1992
1994
1996
1998
2000
2002
2004
2006
2008
2010
2012
2014
2016
2018
2020
2022
2024
2026
2028
2030
(bcm
)
UKCS ProductionDemand
Figure 1: UKCS production and UK gas demand Source: National Grid Gas Ten Year Statement 2005
According to estimates by National Grid Gas, UK dependence on imports to meet its requirements for gas will amount to around 46% by the end of the decade, rising to around 80% by 2014/15.
There are a number of import infrastructure projects underway in response to these developments. These will be discussed in more detail below. Against this background, we now turn to a brief overview of the structure of the UK gas sector including recent developments since Grain LNG’s first application for exemption in 2004.
2.2 STRUCTURE OF THE UK GAS SECTOR
Figure 2 below shows a schematic representation of the UK gas supply system. Each of the main elements and activities are described in turn below.

13 Frontier Economics | June 2006 |
The UK gas sector and its connections with continental Europe
UKCS production
Norwayimports
LNGimports
Interconn. imports
Entry point to the network
Gas networkStorage
Domestic supply
I&C supply
PG supply
Figure 2: Series of activities in the UK gas sector
2.2.1 Gas supply to the UK
Gas in the UK currently comes from the following four sources:
• the UK Continental Shelf (UKCS), which consists of around 100 individual fields under the North Sea and Irish Sea;
• Norway through the Vesterled pipeline between Norwegian gas fields in the North Sea and St. Fergus on the north-east coast of Scotland;
• the import of LNG at the Isle of Grain in Kent (since July 2005); and
• continental Europe through the Interconnector between Zeebrugge on the Belgian coast and Bacton on the Norfolk coast of England.
The UKCS currently accounts for the largest proportion of gas supplied to the UK (94%). In the latest gas year, 2004-05, this amounted to around 100 bcm, the remainder being made up largely by gas from Norway4. As the gas year runs from October to October, these figures do not yet reflect the import of LNG, the capacity of which currently amounts to 4.7 bcm per annum, i.e. if all the capacity of the facility were used it could supply roughly 4-5% of the UK’s annual gas demand, based on demand from the 2004-05 gas year.
4 Information sourced from Wood Mackenzie.

14 Frontier Economics | June 2006 |
The UK gas sector and its connections with continental Europe
The map in Figure 3 provides an overview of the different locations at which gas enters the UK, including pipeline and LNG terminals under construction. We discuss briefly each of the different sources of gas to the UK.
Milford Haven
Isle of Grain
BBL
Langeled
Figure 3: UK gas map (current import pipelines in black boxes)
Gas from the UKCS
Gas production on the UKCS is sourced from over 100 individual fields under the North Sea and Irish Sea. The gas is transported through dedicated pipelines to one of 7 “beach” terminals. Each terminal is equipped with one or more facilities to process the gas to the quality level required before it can enter into the UK gas transmission network (NTS). In other words, when gas arrives at the beach, it is passed through processing facilities, after which it enters the NTS. (The UK gas transmission and distribution system is discussed further below.)
Gas from Continental Europe
Gas is imported from Continental Europe through the Bacton-Zeebrugge Interconnector, which opened in October 1998 and is owned and operated by Interconnector UK (IUK), a consortium of nine energy companies. The Bacton Interconnector is a bi-directional link, which means that gas can flow either from the UK to the Continent (“forward”) or the other way round (“reverse”)5.
The development of the interconnector was driven principally by UKCS producers wishing to benefit from higher prices available for gas on the European continent. The interconnector has therefore been in export mode for the majority of the time since it was commissioned. In this mode, it has a capacity of 20 bcm per annum. However, from time to time flow has been
5 In addition to this UK-Continent interconnector, there is an interconnector via Moffat in Southern
Scotland to Northern Ireland and the Republic of Ireland respectively. The Irish interconnector however flows from the NTS to Ireland only, i.e. is only used for export.

15 Frontier Economics | June 2006 |
The UK gas sector and its connections with continental Europe
reversed (most commonly in winter). Furthermore, as UKCS production declines, it is expected that the interconnector will play an increasing role in gas importation into the UK.
The interconnector’s import capacity has recently been raised from 8.5 to 16.5 bcm per annum. Additional compression facilities at Zeebrugge are expected to raise the import capacity to 23.5 bcm per annum by December 20066.
Moreover, a second European interconnector between Balgzand in the Netherlands and Bacton (the BBL) is currently under construction. It will be owned and operated by BBL Company, a joint venture between Gasunie, E.ON Ruhrgas and Fluxys. The BBL is expected to be commissioned in December 2006 and will be able to import into the UK at a rate of 16 bcm per annum7. Although initially planned only to import into the UK, we understand that technical studies are now underway to assess the possibility of reverse flow use8.
Gas from Norway
There are also imports of gas from Norwegian fields near the UK/Norwegian boundary in the North Sea via the Vesterled pipeline (with a maximum capacity of 10 bcm per annum) although some of this gas delivered to the UK beach supply point at St. Fergus is re-exported to Continental Europe via the Bacton interconnector.
In addition, a pipeline for the import of Norwegian gas supplies from the Norwegian Ormen Lange gas field to the UK beach supply point at Easington (the Langeled pipeline) is currently under construction. This pipeline forms part of the wider Ormen Lange project which comprises the development of the gas field, the construction of a gas processing complex in Norway as well as the pipeline. It is being undertaken by a partnership of seven energy companies and is expected to be completed in 2007 (with a maximum capacity up to 20 bcm9 per annum, although some gas from the Ormen Lange field is expected to be diverted to Continental Europe)10.
Gas from global LNG supply
In July 2005, the UK began importing Liquefied Natural Gas (LNG) at the Isle of Grain with the completion of the conversion of an existing LNG storage facility into an LNG importation facility operated by Grain LNG.
LNG is transported in deep-sea tankers and arrives at the import terminal where it is moved to storage tanks and then re-gasified and processed to enter the NTS.
6 www.interconnector.com. 7 www.bblcompany.com. 8 Argus Gas Connections, 2 September 2005. 9 Reduced to 20 bcm pa after reserves were downgraded (Argus Gas, 8 July 2004). 10 www.hydrocarbons-technology.com,

16 Frontier Economics | June 2006 |
The UK gas sector and its connections with continental Europe
The European capability for receiving LNG in the latest gas year, 2004-05, was 60 bcm per annum11 (approximately equal to 10% of the total demand for gas in Europe12). The initial capacity development (Phase 1) at the Isle of Grain facility has added a further 4.7 bcm per annum, approximately 8% of current European LNG import capacity, 0.6% of the supply of gas to Europe. The additional capacity currently under construction (Phase 2) will add an additional 9.2 bcm per annum at the end of 2008. In addition to the Isle of Grain, two further LNG importation facilities, referred to earlier, are currently being built at Milford Haven, owned and operated by Dragon LNG and South Hook LNG respectively. Dragon LNG is owned by Petroplus, BG Group and Petronas, the latter two each holding 50% of the capacity13. The project is split into two phases, the first of which will have a capacity of 6 bcm per annum and the second phase could add a further 6 bcm per annum. The first phase is expected to become operational at the end of 2007; the timing of the second phase has not yet been confirmed14. South Hook LNG is owned by ExxonMobil and Qatar Petroleum. This project is also split into two phases, the first of which will have a capacity of 10.5 bcm per annum and the second phase could add a further 10.5 bcm per annum. The first phase is expected to become operational at the end of 2007/beginning of 2008 and the second phase is expected to become operational one year later15.
2.2.2 NTS entry, onshore transmission and distribution Once gas has arrived at one of the beach terminals and has been processed to the quality and specification permitting it to enter the NTS, it has to pass through entry facilities into the NTS. These facilities are located near to the points where upstream supplies are brought onshore and connected via pipelines. Having made the choice of where to land gas, producers/shippers have essentially no choice of the entry facility that they use. Subsequently moving the gas from its input point on the network to the final consumer requires transportation through a pipeline network. The UK gas pipeline network consists of a long distance National Transmission System (NTS) carrying gas at high pressure and local transmission and distribution systems. These were previously under the ownership of National Grid but four distribution networks were divested by National Grid in June 2005. The large majority of customers are connected to the local distribution systems but many gas-fired power stations and a few very large industrial consumers are connected directly to the NTS.
11 King & Spalding International (www.kslaw.com). 12 Information sourced from Wood Mackenzie. 13 Centrica has contracted for 3 bcm of gas supply (not importation capacity) per annum from
Petronas. 14 www.dragonlng.co.uk; Petroplus annual report 2004; LNG in Europe – An Overview of European Import
Terminals, King & Spalding International, February 2006. 15 www.southhooklng.co.uk ; ExxonMobil press release, December 2004.

17 Frontier Economics | June 2006 |
The UK gas sector and its connections with continental Europe
2.2.3 Gas transportation, trading and shipper services In addition to producers that deliver their gas to the UK, the main types of player in the UK gas industry are gas transporters, shippers, suppliers and traders. Gas transporters
Gas transportation services on shore are provided by holders of a gas transporter’s licence issued by Ofgem. National Grid Gas, along with several small gas transporters, is licensed by Ofgem to convey gas through its pipeline network for Shippers. National Grid Gas currently operates the NTS and its four retained distribution networks. Around 180 companies are licensed by Ofgem as shippers although many of these are affiliates within the same corporate group. Holders of a shipper’s licence can purchase gas from producers, traders or other shippers, sell it to suppliers (see below) or other shippers, and employ National Grid Gas (and other gas transporters) to transport the gas to final customers. Typically, shippers purchase gas at the beach and deliver it to the final consumer, or sell the gas at the National Balancing Point (NBP) to another shipper who will then deliver the gas to a final consumer. (The NBP is a notional point within the NTS defined for shipper balancing but is also used to provide a ‘place’ for transfer of traded gas.) Shippers are responsible for balancing their own gas entry and off-take, with National Grid Gas balancing the total system to ensure system integrity. Companies, wishing to sell gas to small consumers, i.e. customers using 2,200 GWh a year or less, need to obtain a supplier’s licence from Ofgem. No such licence is needed to supply customers using more than that, i.e. shippers can sell gas to these larger end customers direct. A company with a supplier’s licence contracts with shippers to ship gas through the network to its customers on the supplier’s behalf. (A supplier that is not also a shipper has no direct relationship with gas transporters.) In practice, many suppliers are also licensed as shippers. Gas traders
Aside from physical delivery, there is an active and liquid over-the-counter traded market for wholesale gas involving shippers and retail suppliers. The market includes several forms of forward contract and trades up to day-ahead and within day.
2.2.4 Downstream retail supply Shippers/suppliers sell their gas to broadly three types of customer: domestic (i.e. household) customers, industrial and commercial (I&C) users of gas and power stations. Domestic supply currently accounts for approximately 35% of total supply. Domestic suppliers buy their gas from shippers, frequently on long-term contracts. Supply to power stations forms about 30% of total gas supply. About 24% is supplied to I&C users16.
16 From National Grid Gas Ten Year Statement, 2005.

18 Frontier Economics | June 2006 |
The UK gas sector and its connections with continental Europe
2.2.5 Flexibility and storage Final demand for gas is not constant but varies by season, day of the week etc. It is not sufficient for shippers/suppliers to buy gas as a simple commodity. They need to have gas for final delivery at exactly the time that the final customer wants it. This means that shippers/suppliers need to procure flexibility. This can be bought by having contracts with producers that provide swing (i.e. a potential rate of delivery in excess of the average rate of take), by using one or more of currently nine storage facilities such as those at Rough and Hornsea or the various LNG storage facilities that are operated by National Grid Gas, or by securing the right to interrupt gas supplies to a proportion of their customers (typically large I&C customers or power stations).

19 Frontier Economics | June 2006 |
Conceptual framework
3 Conceptual framework
The criteria that need to be met for a UK LNG import facility to gain an exemption from RTPA are contained in section 19C (7) of the Act17. The relevant criterion for the purposes of this report, i.e. the competition assessment, is set out in the box below:
Competition conditions in Section 19C(7) of The Act
(e) the exemption will not be detrimental to competition, the operation of an economically efficient gas market or the efficient functioning of the pipeline system connected or to be connected to the facility.
The criteria are expressed slightly differently in the Gas Directive 2003/55/EC, which envisages two competition tests:
Competition conditions in Article 22.1, Directive, 2003/55/EC
(a) the investment must enhance competition in supply ….
…..
(e) the exemption is not detrimental to competition or the effective functioning of the internal gas market, or the efficient functioning of the regulated system to which the infrastructure is connected.
Ofgem regards the two sets of criteria as equivalent18. We concur with this view.
So long as the investment in question represents a net addition to the sources of supply that are available to the market, the physical investment per se must always be pro competitive. It is almost inconceivable that the commissioning of the investment represented by the Grain 3 facility would immediately cause an equivalent or greater capacity to close. It is therefore only when the exemption is considered, and hence the long term disposition of usage rights, that competition concerns could arise.
Hence, the substantive competition test remaining is whether the exemption (and the disposition of rights under it) is detrimental to competition. To test whether the exemption may be detrimental we need to establish what the counterfactual is. We understand that Grain LNG will make representations to the effect that, without exemption, the investment in Grain Phase 3 will not proceed. Indeed this must be the case, to meet another of the criteria for exemption. It therefore follows that, with respect to condition (e), the counterfactual is that no investment will take place - not that the same investment will take place but the facilities constructed will operate under the RTPA regime.
17 Essentially the same criteria apply elsewhere in the EU, but implemented under the relevant national
law. 18 Application by Dragon LNG Limited under Section 19C of the Gas Act 1986 for an exemption
from section 19D of the Gas Act 1986, Ofgem final views, February 2005.
20 Frontier Economics | June 2006 |
Conceptual framework
In short, the key question for consideration is whether, after taking account of the possible disposition of usage rights for the Grain 3 facility which could arise under an exemption from RTPA, the project could have a materially adverse effect on the market structure and hence competitiveness of any affected relevant gas market.
The test of this requires a competitive assessment which normally consists of the following steps:
Identifying where in the gas value chain the project could have a direct or indirect impact.
Identifying which are the relevant markets in competition terms where those impacts may be felt.
Analysing the current or foreseeable state of competition in each of the relevant markets, with and without the proposed investment.
Ideally we would like to analyse competitive conditions in the period just after Grain 3 would be commissioned. We have endeavoured to do this for the relevant potentially UK markets, for which reasonably good data are readily available. However, for potential European and global markets it is not practicable within the context of this assignment to project future projects with any accuracy. We therefore implicitly assume for these broader markets that the structure of the market at the time Grain 3 would be commissioned is likely to be similar that implied by the most recent data.
In order to test whether the case for exemption is robust to the result of the open season process which would allocate rights to use Grain 3, we assume for each relevant market the disposition of usage rights most likely to have an adverse effect on competition in that market. These scenarios are not the same for each market: as a result, if the scenario which may be most likely to have an adverse effect on competition on one market were to come into being, the competitive impact on the other markets will not be worse (and may well be significantly better) than those set out in the analysis below.
If no possible outcome of the open season process leads to a material adverse effect on competition, criterion (e) is met19.
In analysing competitive conditions in a market we would ideally like to have information on long term contracts as they can affect the ability of parties to control supply sources and benefit from higher market prices. However, there is extremely limited contractual information in the public domain and therefore it is necessary to focus on the structure of ownership/control of physical sources.
19 We note that formally it is not necessary for the investment with exemption to have no detrimental
effect in any relevant market. It is sufficient if the detriment to one or more relevant markets is offset with greater benefits to competition in other relevant markets.
21 Frontier Economics | June 2006 |
Grain Phase 3 and its impact
4 Grain Phase 3 and its impact
4.1 THE GRAIN PHASE 3 INVESTMENT
The first phase of the Grain development is now operational and construction has already started on a second phase. Capacity for both these phases has been sold to a number of companies wishing to utilise the facility.
The exact size and configuration of the proposed Phase 3 expansion at the Isle of Grain will be a function of market appetite following a public offering of capacity through an open season process.
In any event the minimum expansion would involve:
• the construction of a second jetty; and
• additional regasification capacity in the form of extra vaporisers.
The extra jetty would provide initially a further 85 berthing slots, enabling greater utilisation of existing storage facilities and the cryogenic pipeline. The extra vaporisers will provide additional regasification capacity to cope with the additional throughput at a reasonable level of redundancy.
Over and above the minimum investment in Phase 3 of Grain, if the market demands it, up to two storage tanks may be added making available a maximum of an additional 380,000 m3. Again, if there is market demand, further additional vaporisers could be added.
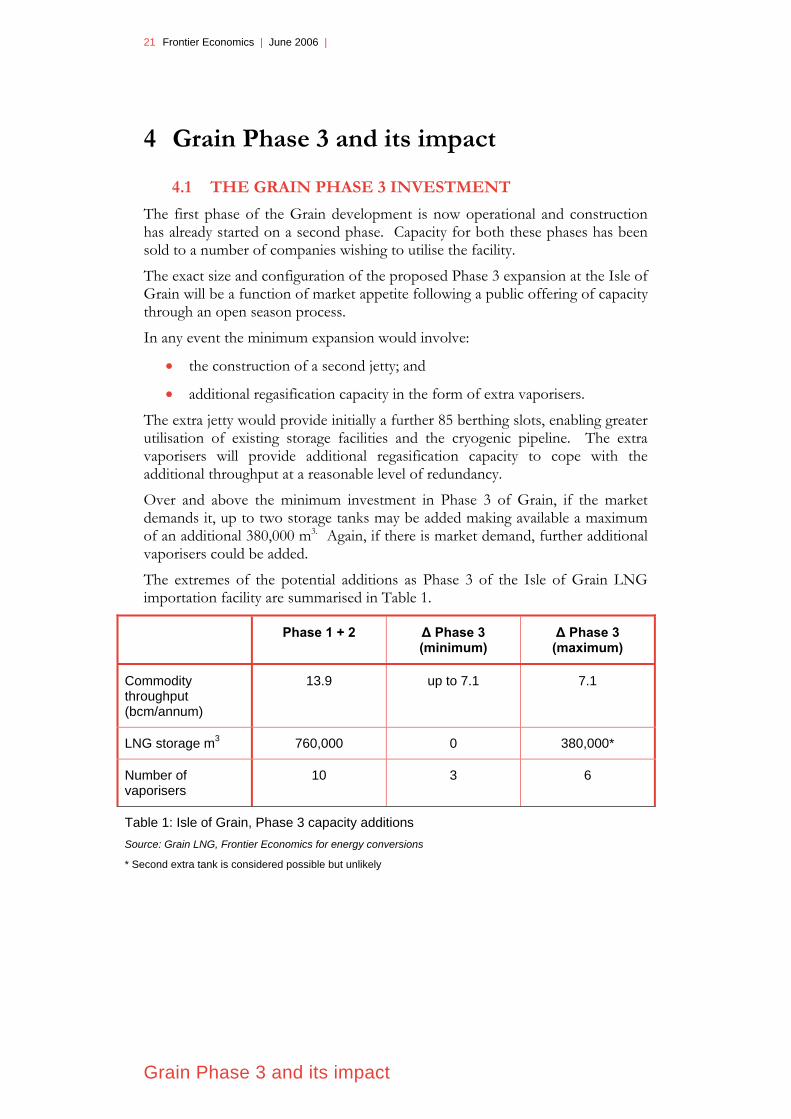
The extremes of the potential additions as Phase 3 of the Isle of Grain LNG importation facility are summarised in Table 1.
Phase 1 + 2 Δ Phase 3 (minimum)
Δ Phase 3 (maximum)
Commodity throughput (bcm/annum)
13.9 up to 7.1 7.1
LNG storage m3 760,000 0 380,000*
Number of vaporisers
10 3 6
Table 1: Isle of Grain, Phase 3 capacity additions Source: Grain LNG, Frontier Economics for energy conversions
* Second extra tank is considered possible but unlikely

22 Frontier Economics | June 2006 |
Grain Phase 3 and its impact
4.2 LIKELY IMPACT ON GAS VALUE CHAIN
There are essentially three physical services that either will or may be provided as a result of the proposed investment in Grain. These are:
• the provision of LNG importation capacity, which includes “unloading” and regasification (possibly using existing storage);
• potentially, the provision of additional storage for LNG; and
• potentially, the provision of further regasification capacity over and above that required in relation to baseload LNG importation.
In addition to these physical services, the proposed investment might be expected to have an impact on the following activities in the gas/LNG value chain:
• LNG exports – the proposed expansion would be likely to cause or facilitate a player to enter into or expand its exports of LNG;
• LNG shipping – the investment will increase the shipping of LNG;
• wholesale supply of gas (UK and Europe) – it will cause more gas (from LNG) to come to the wholesale market in the UK and in Europe;
• entry services - it will potentially increase the maximum injection rate from Grain into the NTS;
• network services – it will increase the demand for the use of network services in the UK;
• shipping of gas – as a consequence of the increased demand for network services (transportation), there will be an increase in the demand for shipping services;
• flexibility/storage – it may also have an effect on the demand for flexibility or storage but may also be an additional source of supply for these services; and
• retail supply of gas – the proposed expansion could have an impact on the supply of gas to end consumers, for example if access to upstream supplies afforded a particular competitive advantage.

23 Frontier Economics | June 2006 |
Identifying the relevant markets
5 Identifying the relevant markets
Having identified where the proposed project will, or could have, a direct or indirect impact on competition, this section identifies as far as is practicable the relevant markets that could be affected.
5.1 MARKET DEFINITION AND THE SSNIP-TEST
Definition of the relevant market for a particular competition case typically begins with the set of products most directly relevant to the case under review. One then asks whether this set of products passes the hypothetical monopolist/SSNIP test20 21.
The SSNIP Test
Could a hypothetical monopolist with control over a defined set of products be able permanently and profitably to raise the price of the products within that set by 5-10% from the competitive price level, assuming that the price of all other goods remained constant?
Any market defined under the SSNIP test will normally have two dimensions, a product market dimension and a geographic market dimension. A market is defined as the smallest set of products – defined in both product and geographic terms – that meets the SSNIP test. In other words, the SSNIP test defines a market as the smallest set of products worth monopolising. The test is applied first to a narrow definition of the market and then, if the test is not met, the market definition is broadened progressively until such a price increase by a hypothetical monopolist appears both feasible and profitable. There are essentially two reasons why a SSNIP might not be profitable. First, there may be products or services outside of the control of the hypothetical monopoly to which customers would switch in the event of a price rise. These products are known as demand-side substitutes. Second, there may be products or services outside of the control of the hypothetical monopoly which are supplied using similar assets that could be rapidly used to supply directly competing products/services. These products are known as supply-side substitutes. (The above was phrased in product market terms, but an analogous approach applies to the definition of the geographic scope of the relevant markets.) Put simply, a market essentially comprises all products/geographic areas that are substitutes for one another in that they constrain each others’ pricing.
20 SSNIP means a small but significant non-transitory increase in price. 21 See also European Commission Notice on the definition of the relevant market for the purposes of
Community competition law, published in the Official Journal: OJ C 372 on 9/12/1997.

24 Frontier Economics | June 2006 |
Identifying the relevant markets
The SSNIP test is phrased as a precise and quantitative test. However, it is often not possible to take a market definition exercise to a point at which the SSNIP test can be explicitly and quantitatively tested with market data and to observe the effect of a 5% increase in prices on the demand for the product. In these circumstances, it is common practice to use whatever quantitative and qualitative evidence is available to infer what the likely result would be, i.e. to gauge which products/geographic areas are likely to be substitutes for one another in that they constrain each others’ pricing. This is also the approach that we have taken in this report, i.e. where necessary we employ qualitative assessments and use market definitions already adopted by competition authorities. We also note that the SSNIP test needs to be applied with caution in the energy sector. A variety of features make the energy sector different from many other markets. For example, as the energy sector involves capital intensive inflexible projects, many intermediate markets are characterised by competition for contracts not the day-to-day competition characteristic of most consumer markets. In such circumstances, the timeframes over which to judge the operation of competitive constraints and the firms that provide them may differ from the one year most frequently employed in the SSNIP test.
5.2 THE RELEVANT MARKETS IN THE PRESENT CASE
For the purposes of gauging the effect of the planned expansion of the Isle of Grain LNG terminal on competition, we need to identify each possible market that the activities due to the expansion of the terminal, i.e. activities leading to the supply of LNG to the UK, could have an impact on. In what follows, we therefore discuss each of the relevant activities in the UK LNG supply chain and, where appropriate, define the likely scope of the relevant product and geographic markets. We conclude with a list of markets/activities that might be affected by the proposed expansion of the Grain LNG import facility and that we will examine in more detail in our assessment of the impact of the expansion on competition.
As a precursor to our discussion of individual markets it is helpful to look at an overview of the way in which competition operates. This is shown schematically in Figure 4.

25 Frontier Economics | June 2006 |
Identifying the relevant markets
Gas producers
Indi
geno
us g
as
Pipe
d im
port
s
LNG
impo
rts
Dom
estic
I & C
Pow
er s
tatio
ns
Gas upstream suppliers
Retail markets
Wholesale market
(UK/Europe)
Production / liquifaction
LNG shipping
LNG importation
Storage / flexShipping
Figure 4: Gas sector framework
The focal point of competition is the relevant wholesale market. Various gas producers compete to supply that market by producing indigenously, importing piped gas or importing LNG. Those who use the LNG route need to buy the relevant subsidiary services necessary to get LNG into the wholesale market, including LNG shipping importation and regasification etc. Retailers buy from the wholesale market and compete to sell to final customers. Upstream suppliers or/and retailers need to source or self supply flexibility and shipping services.
5.2.1 LNG liquefaction (export) Gas imports through the Isle of Grain LNG facility start with the liquefaction and supply of LNG from an exporting country. The expansion of the LNG import capacity at the Isle of Grain may (indirectly, as will be discussed in more detail in our competitive assessment in section 6 below) have an impact on the supply of LNG in that it opens up a new supply source or expands an existing supply source for LNG exports, to the extent that existing export capacity is perceived to be either booked or constrained. The main issue for the purposes of market definition for LNG supplies is the likely appropriate geographic scope of the relevant market. The players that are active in the supply of LNG around the world include many global energy companies such as Shell, ExxonMobil and BP, as well as Sonatrach, Qatar Petroleum, Petronas, etc. with wide reaching regional interests. LNG supplied through Grain is expected to be sourced from a variety of countries including Algeria, Egypt and Trinidad. It is clear that the market for LNG supplies is not limited to Europe/North Africa. Indeed, the planned LNG

26 Frontier Economics | June 2006 |
Identifying the relevant markets
supply sources for the two other LNG importation facilities currently being constructed at Milford Haven include Trinidad and Tobago to the West and Qatar to the East. Considering Europe more widely, LNG has been sourced from as far away as Australia and is currently being sourced from Trinidad and Tobago and several North African, African and Middle-eastern countries22. Moreover, the Middle East, in particular Qatar, has become a swing supplier to both Asia and the Atlantic, transmitting price signals between the two areas23. This does not imply that prices are equal everywhere, owing to transportation cost differences. However, if Qatar is acting rationally and the marginal values netted back to Qatar are equal, a hypothetical monopolist raising the price of LNG to the Mediterranean/Atlantic area would cause Qatar to move LNG that would have gone to the Asia Pacific region to the Mediterranean/ Atlantic region. This would tend to suggest that although there are geographical factors influencing the pattern of supply, supply side substitution may well make LNG export a global market. New, larger LNG tankers are expected to be delivered to the market in the near future that will further improve the economics of LNG transportation, making LNG from distant suppliers even more competitive24. As regards the definition of the relevant product market, the question to examine is to what extent LNG can be considered a separate relevant market, or whether piped natural gas forms part of the same relevant market. This question is more difficult to answer. In many instances (including the UK and almost all mainland Europe) piped natural gas is a perfect substitute for LNG imports. For a few regions outside of these areas, the use of piped natural gas is infeasible and any demand side substitution would have to be in terms of fuels other than natural gas. We cannot readily conclude whether or not a hypothetical monopolist of global gas LNG supplies could profitably raise prices, but for the purposes of further analysis in this case we assume that it might, i.e. for the purposes of this study, we assume that the relevant market is that for global LNG supply.
5.2.2 LNG shipping
The main service required to bring LNG to the market is a shipping service to transport the gas to a location where it can be marketed. The expansion of the LNG import capacity at the Isle of Grain might (indirectly) have an impact on the supply of LNG shipping services, in that it might lead to an addition of new tankers to the market.
22 LNG in Europe – An Overview of European Import Terminals, King & Spalding International, February
2006. 23 The development of a global LNG market, Is it likely? If so when? - Oxford Institute for Energy Studies,
James T Jensen (2004). 24 National Grid Gas Ten Year Statement 2005, page 37.
27 Frontier Economics | June 2006 |
Identifying the relevant markets
The relevant questions that one would wish to examine for the purposes of product and geographic market definition in this context are whether different types of LNG tankers in terms of capacity are likely to form part of the same relevant product market of LNG shipping services and whether LNG shipping is a global activity or whether the geographic scope of the market is likely to be narrower than that.
As regards the definition of the relevant product market for LNG shipping, LNG tanker design is such that no other tankers are a substitute for them. The product market is therefore no wider than all LNG tankers. The relevant question is therefore whether it would be appropriate to segment the product market into sizes of LNG tanker.
Our understanding of the development of LNG is that new tankers have frequently been ordered for use on a particular new route and that sometimes tankers are sized for the specific route for which they are bought. That said, the ordering of new tankers is usually necessary because a new route increases the demand for tankers. Even if some harbours cannot accommodate the largest vessels it seems reasonable to suppose that a chain of substitution would mean that the whole market would be affected by hypothetical monopolist action in a segment. We therefore assume that the relevant product market is that of LNG shipping services without any further sub-segmentation by tanker size.
As far as the geographic scope of the market for LNG shipping services is concerned, tankers clearly have no material difficulty in moving from one part of the world to another. In our view it is therefore clear that the geographic scope of the LNG shipping services market is global.
5.2.3 LNG importation
The next activity in the LNG supply chain that is likely to be affected by the planned capacity expansion at Grain is the provision of LNG importation services, i.e. the provision of access to LNG importation facilities.
When Grain LNG first applied for an exemption for its LNG importation facility, it was going to be the first LNG importation facility in the UK and therefore there was no prior UK LNG importation market to be affected by the development. However, by the time that Grain Phase 3 is commissioned there will be two further terminals constructed at Milford Haven by Dragon LNG and South Hook respectively.
This means that a relevant question to be examined for the purposes of this study is whether the provision of access to LNG importation facilities in the UK is likely to constitute a relevant market in competition terms. To address this question it is necessary to understand the surrounding markets.
If, on the one hand, the UK/European wholesale market is competitive and, on the other, the supply and shipping of LNG are competitive, a monopolist of UK LNG import facilities faces competitive constraints on what it can charge.

28 Frontier Economics | June 2006 |
Identifying the relevant markets
As our competition analysis (Section 6) concludes that these surrounding markets are indeed competitive, it would appear that UK LNG importation is not a separate market.
Furthermore, we note that, even if it were a separate market, competition in this area only really occurs during the contracting phase for a facility. Open season arrangements are designed to facilitate contractual competition on an open, transparent basis. It therefore follows that the open season arrangements that Grain LNG are following for Phase 3, mean that the investment must make a positive contribution to competition in the supply of LNG importation services.
5.2.4 Entry services and network services
The service of providing entry to the NTS at Grain may be a market in economic terms but it is recognised as a natural monopoly and is regulated as such. As a result no competition concerns can arise.
The Network services which use of Grain 3 will entail are also a regulated natural monopoly and for the same reason need not be considered further in this competition assessment.
5.2.5 Supply to/relevant wholesale markets (UK/Europe) The proposed investment is located such that it will supply the UK wholesale market. (Note that there is no real distinction between the supply to the wholesale market and the wholesale market itself in that suppliers/producers of LNG/gas sell their gas on the wholesale market, i.e. are part of it – they form the supply-side of/compete in this market. We use the expression supply to the wholesale market merely for logical consistency as the purpose of this section is to go through the different activities in the LNG/gas supply chain in detail in order to determine the activities that are likely to be affected by the proposed investment.) For the purpose of determining the appropriate product and geographic delineation of this part of the LNG supply chain in competition terms, the relevant questions that need to be examined are first, whether LNG constitutes a separate market or is constrained by alternative sources of gas, and second, whether the relevant wholesale market should be limited to the UK or should be widened to include other European countries. As was discussed above, in our view all forms of natural gas compete with each other in the UK/European wholesale markets. A hypothetical monopolist of LNG is unlikely to be able to act independently of suppliers of piped natural gas and to profitably raise prices as buyers would switch to other sources of gas. The next question is therefore whether in economic terms the relevant wholesale market is the UK, or is the UK wholesale supply market part of a wider European market? The answer depends on the extent to which there is slack capacity in interconnection between the UK and continental Europe and within continental Europe, as well as the extent to which the capacity of LNG importation facilities allows tankers to choose between UK and continental European destinations.

29 Frontier Economics | June 2006 |
Identifying the relevant markets
The UK Competition Commission concluded that in 2003 there was a UK wholesale market25. Without being specific to the UK the European Commission in its recent sector enquiry noted that gas supply markets were generally national. However, since the Competition Commission reached its conclusion, incremental reverse flow capacity has been added to the Bacton - Zeebrugge line. Furthermore, before Grain Phase 3 is commissioned:
• the BBL line will connect the Netherlands and the UK. This was initially designed for flow solely to the UK. Even this should help to integrate the UK market with Europe as it must represent the sponsors’ expectation of price differentials. However, we understand that adding reverse flow capacity is always an option and is being actively studied and is to be expected if material price differentials of the opposite sign emerge;
• the configuration of pipelines from the Ormen Lange field will allow gas from that field to be piped to either the UK or continental Europe in varying proportions; and
• LNG import capacity both into the UK and to continental Europe may well make it feasible for LNG tankers to choose their final destination on the basis of prevailing spot prices.
These developments, and the option of reverse flow on the BBL line, all point towards a greater coupling of the UK and European wholesale gas markets.
Given the pattern of supply and demand, the capacity of transmission network and the institutional arrangements in Europe currently, it is quite possible that for much of the time the relevant market might be limited to North Western Europe (essentially UK, Netherlands, Denmark, Belgium, part of Germany and part of France). However, the plans for further gas transmission capacity and improvements to institutional arrangements could mean that, by the time that Grain 3 is commissioned, the market may be essentially Europe wide. The planned SEL line through Austria and the delivery of increasing volumes of LNG to the South, West and North West of Europe may relieve the current East West constraint. Depending on plans within Germany, the Baltic Sea Pipeline may also help to relieve this. The transmission constraint to the South West of France may persist but the ability of LNG suppliers to choose between delivery to Iberia or North West Europe will tend to couple the South Western and North Western European gas markets.
In reality the relevant market may well vary over time. At times the UK may be an independent market, i.e. when there is no slack interconnection capacity. At other times it will be part of a wider European market. (Note that even in situations in which there is no slack capacity in the interconnector, European gas imports to the UK up to the capacity limit of the interconnector would have to be considered as part of the UK market.)
25 The Competition Commission “Centrica plc and Dynegy Storage Ltd and Dynegy Onshore
Processing UK Ltd – A report on the merger situation”, August 2003.
30 Frontier Economics | June 2006 |
Identifying the relevant markets
Given the future degree of integration, we think that, for the purposes of this report, it would be prudent to consider the possibility of a North West European wholesale market or a Europe wide wholesale market in addition to the possibility of a UK wholesale market.
5.2.6 Shipping (use of UK transmission network)
Moving down the supply chain the next activity that might be affected by the proposed expansion is the provision of shipping services.
The Act has the effect that only shippers may purchase transportation services from National Grid Gas and the distribution network companies. Upstream suppliers and retailers can either purchase shipping services or, more often than not, choose obtain shipper licences themselves and self supply. In one, rather trivial sense shipping is a market in that there is no access to the transportation system other than through a shipper. We therefore regard shipping as a potentially relevant market.
5.2.7 Flexibility and storage
There are several different sources of flexibility available to system users in the UK. These include the use of:
• different types of storage facilities (e.g. Rough, Hornsea, LNG);
• beach swing;
• line pack;
• the Bacton-Zeebrugge interconnector; and
• demand interruption.
The exact extent of substitutability between these sources of flexibility is a complex issue due to:
• differences in the rates at which the various sources of flexibility are able to accept and deliver gas; and
• differences in the duration over which the flexibility can be provided.
The Competition Commission (CC) considered the relevant market in this area at length in its ‘Rough’ enquiry two years ago26. It carried out an analysis of the flexibility market in two dimensions: daily flexibility and seasonal flexibility. In the view of the Competition Commission, the product market for flexibility included all forms of flexibility, but excluded LNG importation facilities which were already planned at that time as, in its view, LNG importation would be used as baseload capacity.
In geographic terms the CC took the market to be Great Britain.
26 The Competition Commission “Centrica plc and Dynegy Storage Ltd and Dynegy Onshore
Processing UK Ltd – A report on the merger situation”, August 2003.

31 Frontier Economics | June 2006 |
Identifying the relevant markets
We generally agree with the Competition Commission’s view, but note that:
• the regasification capacity of LNG import facilities may exceed that needed to meet baseload use since LNG importation facility operators need to have some additional regasification (vaporisation) capacity in reserve so that they can meet their contractual obligations even when some of their regasification capacity is out of action for planned or unplanned maintenance. On days when the available regasification capacity exceeds the firm contracted regasification requirements of the facility users, the facility will be available as a direct source of daily flexibility. However, it is to be noted that such flexibility is only ever available on a short-term basis because the use of such flexibility will cause the facility to be emptied more quickly than planned. Any increase in flow will necessarily be accompanied by a reduction in flow prior to the next planned injection of LNG from a tanker;
• although expectations have been that LNG importation facilities will operate as baseload, they may not necessarily do so; and
• in any event, even if such facilities do operate in baseload mode, they will from time to time deliver gas that is a direct substitute for gas delivered from more narrowly defined flexibility products. Put simply, baseload gas will in part be delivered in peak periods.
In the light of these observations, in order to ensure that any impact of LNG importation facilities on the markets for flexibility has been considered by this analysis, we think that it would be prudent (despite the CC’s position of regarding LNG importation as not in any flexibility market) to analyse the effect that Grain 3 may have on the two flexibility markets that the CC identified, i.e.:
• the market for peak day delivery of gas (the daily flexibility market); and
• the market for peak season delivery of gas (the seasonal flexibility market).
For the reasons set out in Section 6, we define a “season” to be the period of maximum demand arising in 67 continuous days, (i.e. corresponding to the maximum delivery characteristics of the Rough seasonal storage facility).
5.2.8 Retailing The final activity in the supply chain is retailing – frequently referred to in the UK as supply. This is by no means a homogeneous activity and typically the supply of gas to end users is considered in relation to three segments, namely supply to: power stations, industrial and commercial (I&C) customers, and households based largely on demand-side considerations. This is also the approach adopted by the Competition Commission in its Rough enquiry two years ago27. There have been competition cases in the past concerning the UK
27 Ibid.

32 Frontier Economics | June 2006 |
Identifying the relevant markets
gas sector that have further sub-divided the market for the supply of gas to I&C customers into small and large I&C customers28. In our view, however, rather than further disaggregating the relevant product markets, it is at least possible that there are only two real markets for the supply of gas to final users: one supplying large customers where buyers are sophisticated and price is paramount; and one supplying smaller customers where brand and customer facing functions such as call centres are important. However, there is no very clear cut-off point dividing these two. As available data map on to the three distinct segments set out above, we adopt these three market definitions for the purposes of this report. The geographic scope of these three markets is typically defined as national at least as far as the UK is concerned29. We see no reason to depart from this approach for the purpose of this report.
5.3 SUMMARY OF POTENTIALLY AFFECTED MARKETS In the above analysis we tried to identify relevant markets by systematically working down the value chain. We summarise below the potentially relevant markets that we have identified but now characterised by the nature of the potential impact. The potential relevant markets are: Direct Impact
• wholesale supply of gas to the UK / North West Europe / Europe;
• flexibility/storage in the UK (and possibly Europe);
Probable indirect impact
• global LNG liquefaction;
• global LNG shipping;
• shipping (as in providing commercial access to UK gas transport and balancing services);
Other markets
• supply of gas to UK power stations;
• supply of gas to UK I&C customers; and
• supply of gas to domestic customers in the UK.
28 COMP/M.3007 – E.ON/TXU Europe Group, December 2002; COMP/M.3096 –
TotalFinaElf/Mobil Gas, February 2003. 29 Ibid.

33 Frontier Economics | June 2006 |
Competitive assessment
6 Competitive assessment
The previous section identified as far as is practicable the relevant markets in which the Phase 3 expansion of Grain may have a direct or indirect impact. In this section we analyse for each potentially relevant market, the worst competitive impact that the disposition of rights to Grain 3 could cause. In essence, we do this by hypothesising in relation to each market that the player currently with the highest market share will acquire all of the rights to Grain 3. These players are not the same for each market: as a result, if the player which may be most likely to have an adverse effect on competition on one market were to acquire all the rights to the Grain 3 facility, the competitive impact on the other markets will not be worse (and may well be significantly better) than those set out in the analysis below.
6.1 DIRECTLY AFFECTED MARKETS
6.1.1 UK wholesale gas market
The proposed Grain 3 development adds capacity through which gas can be delivered to the UK NBP, the (notional) focal point of the UK wholesale gas market. Statically (i.e. with same capital stock), the addition of such capacity must be good for consumers. The addition of capacity to reach the NBP, controlled by ExxonMobil for instance, cannot create a strategic opportunity for ExxonMobil immediately to withdraw more capacity than it has just added. If such a withdrawal were economic, then to maximise profits it would already be withdrawing capacity in the absence of any rights to Grain 3. 30
Any possible concern can only relate to dynamic effects. Specifically, the relevant question is: ‘Would the addition of capacity controlled by one of the key players foreclose other developments and allow that player to exercise dominance in the UK upstream gas supply market?’
A potential starting point to address this question is the analysis of market concentration with and without the proposed investment.
Table 2 and Table 3 list the market shares of the largest suppliers to the UK wholesale market that we anticipate in 2010-11, the year in which Grain 3 would come on stream. The difference between the two Tables relates to the assumption as to whether there is export through interconnection with continental Europe that should be added to UK demand. The detailed assumptions made to predict market shares in 2010-11 are set out in Annexe 1.
30 Strictly speaking a company could choose a strategy which saw it replace existing supplies with LNG
through Grain as a cheaper way to meet the demand it has for gas at the NBP. This would be an entirely legitimate activity which would not involve a strategic withdrawal. Furthermore, indivisibilities of projects could in theory create circumstances where the withdrawal was indeed larger than the new supplies, but this would again be consistent with legitimate commercial behaviour, not strategic withholding of capacity.

34 Frontier Economics | June 2006 |
Competitive assessment
These tables suggest that with or without substantial exports from the UK, it is likely that Centrica would be the largest supplier. We therefore choose, as the worst scenario (i.e. the scenario which allocates all of the new capacity to the existing largest player) to analyse in relation to this market, Centrica acquiring all rights to Grain 3.
Company Counterfactual Centrica takes G3
BG 6% 5%
BP 9% 9%
Centrica 14% 18%
ExxonMobil 12% 11%
GdF 3% 3%
Qatar 11% 10%
Shell 7% 7%
Sonatrach 4% 3%
Statoil 5% 5%
Total 5% 5%
Others (known)* 14% 14%
Others (unknown)* 10% 10%
HHI 835 893
Delta 57
Table 2: The UK demand option – Supply market shares and HHIs by scenario, 2010-11 Source: Frontier Economics based on Wood Mackenzie data and other data from public domain resources
* HHIs are calculated using individual shares that are known. The ‘unknown’ group has not been split and therefore the HHIs shown will overstate the real HHIs with and without Grain

35 Frontier Economics | June 2006 |
Competitive assessment
Company Counterfactual Centrica takes G3
BG 5% 5%
BP 8% 8%
Centrica 14% 19%
ExxonMobil 11% 11%
GdF 3% 3%
Qatar 11% 11%
Shell 6% 6%
Sonatrach 4% 4%
Statoil 5% 5%
Total 5% 4%
Others (known)* 17% 16%
Others (unknown)* 9% 9%
HHI 803 889
Delta 53
Table 3: The UK demand plus exports option – Supply market shares and HHI results by scenario, 2010-11 Source: Frontier Economics based on Wood Mackenzie data and other data from public domain resources
* see note to Table 2
Market shares and measures of concentration such as HHIs are considered a possible guide to the extent to which firms may be able to exercise market power. An HHI of under 1000 generally indicates a market with low concentration and an index over 1800 indicating a high level of concentration31. The HHI of the market prior to Grain 3 is in the region of 803 – 835 (even when all unknown shares are aggregated), depending on the extent of exports assumed. Assuming that all the rights to Grain 3 are taken by the largest upstream supplier inevitably causes deterioration in the HHI. However, a change of 53 or 57 in the HHI is modest and still leaves the market’s HHI as less than 900. This is well inside the range within which there is a presumption that the market is competitive.
31 The Competition Commission: “Market Investigation References: Competition Commission
Guidelines June 2003”. The EC has recently indicated that HHIs over 2000 would indicate high concentration in The Official Journal of the European Union “Guidelines on the assessment of horizontal mergers under the Council Regulation on the control of concentrations between undertakings” (2004/C 31/03).

36 Frontier Economics | June 2006 |
Competitive assessment
Qualitative considerations reinforce the conclusion that the UK wholesale market is competitive and would remain competitive even, in a worst case scenario, if Centrica were to gain the exclusive use of Grain Phase 3.
If all the projects that are planned come to fruition on schedule, the UK will be long in importation capacity in the coming years (for details see Annexe 1). Under these circumstances it is conceivable that the interconnectors will be working only in export mode and in addition some of the potential supply sources will have to be turned down. This in turn means that there would need to be a truly massive withdrawal of capacity before the interconnectors were constrained in import mode. Reversing a combined export capacity of 36 bcm32 to import of 40 bcm would need a supply withdrawal of 76 bcm (plus that needed to reverse any turn down of other supplies). This is considerably more than the projected market share of Centrica and indeed more than half of demand projected under any of the above scenarios.
Even if not all the new projects materialise in the timescale, there is still likely to be a healthy rate of capacity addition and the potential to bring on those projects that have been announced but delayed would also help to control any possible exercise of market power. In other words, the supply/demand balance is likely to be such that there is no plausible unilateral strategy of withholding supply that Centrica could pursue profitably to raise prices substantially.
The European Commission’s sector enquiry provides further qualitative evidence for the competitive health of the UK market. The EC observed that:
Liquidity - The volume traded in UK wholesale market is of the order of 4 times that in the whole of the rest of the EU. NBP/beach trading volumes are of the order of 3 times physical quantities.
Concentration (sources of gas) - The UK exhibits the lowest share of the historic incumbent both in imports and in domestic production.
Concentration (trading) - The UK has the lowest proportion of hub trade accounted for by the historic incumbent.
New entrants - The UK has a far larger presence of new entrants trading NBP/beach than there are at any other hub in Europe.
Vertical foreclosure - This was a prevalent threat - ‘wholesale gas markets in Europe are not liquid enough to provide confidence about gas availability. (The UK being an exception.)’ (emphasis added).
6.1.2 A North West European or European wholesale market
As noted in Section 5, we think it is quite possible that the relevant wholesale market will be, at the time Grain 3 is commissioned, wider than the UK, i.e. either a North West European or Europe wide wholesale market.
32 This assumes BBL would be equipped for reverse flow.

37 Frontier Economics | June 2006 |
Competitive assessment
If the relevant market is North West Europe, we estimate the wholesale market shares to be as shown in the first column of Table 3.
Market shares (current) Market shares imputed with ExxonMobil obtaining Grain 3*
ExxonMobil 12.9% 15.1%
Shell 12.4% 12.1%
Gazprom 11.3% 11.0%
EBN 10.0% 9.8%
Statoil 9.6% 9.4%
Total 6.3% 6.2%
Sonatrach 4.5% 4.4%
BP 4.4% 4.3%
ConocoPhillips 3.4% 3.3%
Centrica 3.3% 3.3%
BG 2.3% 2.3%
Gaz de France 1.8% 1.7%
Eni 1.8% 1.7%
Norsk Hydro 1.7% 1.7%
ChevronTexaco 1.5% 1.5%
DONG 0.1% 0.1%
Other 12.6% 12.3%
HHI (Other disaggregated into 10 parties with equal share)
778 808
Delta 30
Table 3: North West Europe wholesale market shares (2005) Source: Frontier Economics calculations using Wood MacKenzie data
* Data with Grain 3 volume simply added to existing volumes. There is no projection of other projects etc
We have derived these estimated market shares from WoodMacKenzie data for supplies to The UK, The Netherlands, Belgium, Luxembourg, Denmark Germany and France. We have assumed that half of German demand and two thirds of French fall into this market. We also assume that the shares of supply to the relevant parts of Germany and France are the same as Wood MacKenzie estimate for the complete countries respectively. These market shares are based

38 Frontier Economics | June 2006 |
Competitive assessment
on the most recently available historic data and do not attempt to reflect changes that may occur before 2010-11 However, we have no reason to believe that they are not a reasonable proxy for conditions in 2010-11 and beyond.
If there is a North West European market, its structure appears to be quite diverse with an HHI likely to be around 780. ExxonMobil, with 12.9 % of the market, is just larger than Shell with 12.4%. If ExxonMobil were to acquire rights to Grain 3, and ignoring any other changes to the market, the HHI would rise to around 800. This is well beneath the threshold below which there is a presumption that the market is competitive.
If, in the alternative, the relevant wholesale market were indeed the whole European market, how should we expect this to be affected by the worst scenario for the disposition of rights at Grain 3? We can get a good sense of the likelihood of any competition issue arising by looking at the existing structure of the European market. This is illustrated in Table 4 below.

39 Frontier Economics | June 2006 |
Competitive assessment
Market shares (current) Market shares imputed with Gazprom obtaining Grain 3*
Gazprom 24.5% 25.6%
Sonatrach 11.2% 11.0%
Statoil 8.7% 8.6%
Shell 8.3% 8.2%
ExxonMobil 8.3% 8.2%
EBN 5.4% 5.3%
Total 4.4% 4.3%
Eni 3.2% 3.1%
BP 2.9% 2.8%
ConocoPhillips 2.0% 2.0%
Centrica 1.8% 1.8%
BG 1.6% 1.6%
Norsk Hydro 1.6% 1.5%
Gaz de France 1.2% 1.2%
ChevronTexaco 0.8% 0.8%
DONG 0.0% 0.0%
Other 14.1% 13.9%
HHI (Other disaggregated into 10 parties with equal share)
1042 1081
Delta 39
Table 4: European wholesale market shares (2005) Source: Frontier Economics calculations using Wood MacKenzie data
* Data with Grain 3 volume simply added to existing volumes. There is no projection of other projects etc
The largest supplier of gas to the European wholesale market is Gazprom with a 24.5% market share. The HHI of this market is currently 1042. As Gazprom is the largest supplier the worst competition scenario would be that Gazprom acquired all rights to Grain 3. Assuming that market shares and volumes remain unchanged up to the time at which Grain 3 is commissioned, Gazprom’s market share would rise by approximately 1% to 25.6% and the HHI for the market would be increased by 39 to 1081.

40 Frontier Economics | June 2006 |
Competitive assessment
In normal markets, HHIs at this level are neither alarmingly high nor reassuringly low. However, various features of the European wholesale gas market lead us to be not unduly concerned either with the current HHI or the implied change. The factors that lead us to that conclusion are:
Investment in Grain 3 will not foreclose any existing supply sources -We should not lose sight of the fact that Grain 3 represents a net addition to capacity to supply the wholesale market. This is not a merger situation in which any deterioration in HHI has no offsetting benefit through the introduction of extra capacity to the market. Natural gas production and wholesale market supply are generally very capital intensive and with low short run marginal costs (except the opportunity cost of not having the gas for a future date). Production rates from existing fields may be eased or concentrated on periods of higher gas prices but nothing is likely to physically reduce their capacity to supply. We therefore do not see that Grain 3 is at all likely to cause premature closure of existing supply assets. If all the other assets remain in essentially their existing ownership and are capable of delivering the same profile of gas to the market, the addition of Grain 3 capacity in the hands of the largest supplier to the market cannot leave purchasers in the wholesale market worse off.
The nature of competition in the industry - Most downstream players in the gas industry tend to contract for supplies over periods measured in years rather than just buying in very short term markets. This means that a substantial part of the competition from producers to supply gas occurs on timescales which allow for the development of new sources of supply. The relevant competitive conditions in the market are not defined by current market shares but the capability of all firms regardless of their existing market share to invest in new sources of supply. The diversity of firms available to develop new sources is quite adequate. Although the geographic diversity of new gas sources could be an issue (see next point) it is not an issue which competition policy can solve.
Europe faces a trade-off over time - Any attempts to create or retain an atomistic structure for supply are likely to favour diverse and smaller indigenous sources of gas at the expense of the large exporting countries close to but outside the EU (in several of which, gas exports are controlled by essentially one firm - e.g. Gazprom or Sonatrach). While this may seem to produce a pro competitive result in the short term, it will accelerate depletion of indigenous sources and hasten the day when there will potentially be an even greater reliance on gas from the key exporting countries. Accepting modest concentration now may be in the longer term competitive interests of consumers.
On balance, these considerations and the relatively modest HHI of the market lead us to conclude that if the relevant wholesale market is Europe rather than the UK, Gazprom’s acquisition of the rights to Grain 3 would not create a detriment to competition. As any other party’s acquisition of Grain 3 rights would be less problematic, we conclude that Grain 3 with RTPA exemption would not cause a detriment to competition in a European wholesale market.

41 Frontier Economics | June 2006 |
Competitive assessment
We are conscious that any view that appears to imply a moderately competitive European wholesale market appears to be clearly at odds with the preliminary findings of the European Commission’s sector enquiry. However, it is important to note that our entertaining the possibility of a wider North West European or European market depends on many of the EC’s concerns disappearing by 2010-11. In addition, the current concerns in Europe are not focussed on the overall horizontal structure of wholesale supply across the whole of Europe, but mainly on the control of local transportation and storage. Even if some of these concerns endure they are likely to be in areas of Europe that are not directly relevant to the Grain investment. Indeed, if these concerns endure, they make it more likely that the relevant geographic market is national or restricted to North West Europe. If, hypothetically, there were a dominant player in Germany and the German market were separated from the market that Grain 3 would supply, acquisition of rights to Grain 3 would not help such a player to continue or intensify its exercise of market power in Germany unless that player also had market power in the narrower market in which Grain 3 will sit.
6.1.3 The UK flexibility markets
As noted in Section 5, being an essentially baseload facility, the delivery of the Grain 3 facility will lead to an increase in delivery capacity to the Great Britain transportation system across all time frames. However, it has the potential proportionally to make a much more significant contribution to daily delivery capacity because regasification capacity is often likely to exceed the bare base load requirement. In this subsection, we examine the potential impact of Grain 3 on both the market for daily delivery capacity and the market for seasonal delivery capacity.
Daily flexibility
In analysing the market for daily flexibility, we have taken account of all the sources that can deliver gas to the market on the days in which market demand is greatest. To estimate the future structure of this market we have had to make a number of assumptions. These are:
• annual production from UKCS fields has been projected based on the assumptions indicated above;
• the swing available from UKCS fields is in aggregate approximately 140% as estimated by Wood MacKenzie;
• in the absence of better data, we have assumed that each individual UKCS field has this swing factor. (We do, however, comment on a sensitivity in which we explore the Morecambe field having a higher level of swing);
• the deliverability of gas from existing storage is taken from Wood MacKenzie’s proprietary data;

42 Frontier Economics | June 2006 |
Competitive assessment
• for new storage projects that are under construction but for which we have no deliverability estimates, we have assumed the same cycle time as the average cycle time of existing storage of the same type (depleted field or salt cavern);33
• we have ignored storage developments which we understand are planned but not yet under construction. All such facilities that we are aware of would, if they were to materialise, increase the competitiveness of the market as none of them is being developed by a party expected to hold a large share of daily delivery capacity;
• we have assumed that interconnectors would be available to meet peak day demand with shares of capacity corresponding to ownership shares; and
• we have assumed that those constructed LNG importation facilities before Phase 3 of Grain will be able to deliver gas on any one day at a rate which is 120% of their expected pro-rata annual capacity. (We are uncertain as to what ratio is appropriate here, but sensitivity analysis shows that whether the ratio is 100% or 140% makes no material difference to the conclusions – HHIs differ by no more than 5.
Based on these assumptions, the shares of daily deliverability that we estimate are shown in Table 5.
33 Data from both National Grid’s Ten Year Statement and Wood Mackenzie proprietary data.

43 Frontier Economics | June 2006 |
Competitive assessment
Company Delivery capacity (mcm/d) Capacity share
BG 41.8 5.9%
BP 39.5 5.6%
Calor 7.1 1.0%
Centrica 103.0 14.5%
Chevron 7.2 1.0%
ConocoPhillips 26.4 3.7%
Distrigas 10.6 1.5%
Eni 11.9 1.7%
Eon 31.1 4.4%
ExxonMobil 53.0 7.5%
Fluxys 8.8 1.2%
Gasunie 26.3 3.7%
GdF 15.1 2.1%
LNG Japan 7.1 1.0%
Norwegian State 12.3 1.7%
Qatar 47.6 6.7%
Shell 30.3 4.3%
Sonatrach 15.7 2.2%
SSE 27.1 3.8%
Star Energy 8.0 1.1%
Statoil 26.7 3.8%
Total 30.1 4.2%
National Grid Gas 52.0 7.3%
Other (known) (with < 1% market share)
23.3 3.3%
Other (unknown) 46.3 6.5%
Total 708.4 100.0%
Table 5: Daily deliverability - Estimated capacity shares in 2010-11

44 Frontier Economics | June 2006 |
Competitive assessment
According to National Grid’s Ten Year Statement, maximum daily demand in 2010-11 is likely to be around 600 mcm/d. This implies that, prior to Grain 3 being constructed, there would be an excess of capacity of a little more than 18% of demand, a demand/supply balance which would, a priori, imply reasonable prospects for competition.
The largest capacity share is anticipated to be held by Centrica with just under 15% of the total capacity available to the market. However, close to half of this is provided by Rough and 80% (rising to 85%) of the capacity of Rough must be made available to other market participants through auctions, in line with the remedy imposed by the CC. This reduces the capacity that Centrica controls and, to the extent that Rough capacity is sold in longer term contracts, it also reduces the extent to which Centrica would benefit from higher market prices.
However, ignoring both this requirement and the fact that National Grid Gas’ LNG storage facilities are offered on RTPA terms to all market participants, the HHI of the peak day deliverability market is 613 (even treating the ‘other (unknown)’ category as just one firm). This HHI is well below 1000, beneath which level there is a strong presumption of a competitive market.
As the CC’s Rough inquiry implies that the Morecambe Bay field owned by Centrica may have a higher swing factor than the average of UKCS fields, we have carried out a sensitivity analysis assuming Morecambe has a 160% swing factor and all other sources of daily deliverability remain as above. This causes no material change to the picture given above. Centrica’s share of daily deliverability would be slightly higher at a full 15% and the HHI for the market, based on capacity shares, would be 621. Again, this structure suggests that the market can be expected to be competitive.
Impact of Grain 3
We understand that the maximum number of vaporisers that will be installed as part of the Grain 3 project is 6, each capable of delivering c.70 GWh/d (6.44 mcm/d). Not all of this capacity can be offered in open season arrangements because Grain LNG cannot guarantee 100% availability of these vaporisers at all times (because of maintenance requirements etc). As a result, it will need to continue to ensure that it has a reasonable degree of additional capacity in order to be able to meet its contractual commitments. However, as we understand that Grain LNG will make any extra capacity over and above its contractual commitments available on an ‘all reasonable endeavours’ basis, we have ignored the planned additional vaporisation capacity and have assumed that Grain 3 adds the full delivery capability of 6 vaporizers, with the “worst” scenario being that Centrica as the player with the largest market share acquires all of that capacity. On this basis, the HHI of the market (based on capacity shares) would rise to 674 (683 if Morecambe is assumed to have a 160% swing factor). Both of these HHIs fall significantly under the threshold beneath which there is a presumption of competitiveness.
Grain 3 would increase the excess of capacity over demand to nearly 22% of demand.

45 Frontier Economics | June 2006 |
Competitive assessment
Given that in this analysis we have made several assumptions which are likely to underestimate the competitiveness of the daily deliverability market, we conclude that the market would remain competitive even if the party anticipated to have the largest market share were to acquire all rights to the use of Grain 3.
Seasonal flexibility
We have defined the market for seasonal flexibility by reference to delivery over a continuous period of 67 days of high demand. This corresponds to the duration over which the main seasonal storage facility connected to the UK transmission system, Rough, is able to deliver the gas stored in it. Given that Centrica, as the owner of Rough, is also the largest player in the seasonal flexibility market, this definition of a “season” is likely to provide the most stringent test of the potential competitive effect of Grain, once again assuming hypothetically that Centrica takes all of Grain 3 capacity.
In analysing this market we have maintained those assumptions made previously that are relevant, complemented by others in order to account appropriately for all the sources that can deliver gas to the market in the 2010-11 winter season. Specifically:
• we have assumed projected annual production from UKCS fields as described above;
• we have assumed that the swing available from UKCS fields is 140% and we have continued to apply this level of swing to each individual UKCS field as a base case (once again we have looked at a sensitivity in which the Morecambe field is assumed to have a higher swing factor);
• we have ignored storage developments which we understand are planned but not yet under construction;
• we have assumed working gas volumes for storage assets, based on National Grid’s Ten Year Statement and Wood MacKenzie’s proprietary data;
• we have assumed that the working volumes of storage assets are exhausted over 67 days (even if the normal cycle time for the assets is shorter);
• we have assumed interconnectors are available to meet seasonal demand, with capacity shares mirroring ownership; and
• we have assumed that LNG importation facilities (those constructed before Phase 3 of Grain) will only be able to deliver seasonally at a rate that is commensurate with their annual capacity (pro-rated).
Based on these assumptions, the shares of seasonal deliverability that we estimate are shown in Table 6.

46 Frontier Economics | June 2006 |
Competitive assessment
Company Delivery capacity (mcm/season) Capacity share
BG 2,692 6.7%
BP 2,558 6.4%
Calor 396 1.0%
Centrica 6,612 16.5%
Chevron 483 1.2%
ConocoPhillips 1,769 4.4%
Distrigas 708 1.8%
Eni 794 2.0%
Eon 1,770 4.4%
ExxonMobil 3,325 8.3%
Fluxys 587 1.5%
Gasunie 1,762 4.4%
Gazprom 431 1.1%
GdF 885 2.2%
LNG Japan 396 1.0%
Norsk Hydro 408 1.0%
Norwegian State 826 2.1%
Qatar 2,658 6.6%
Shell 2,030 5.1%
Sonatrach 879 2.2%
SSE 532 1.3%
Statoil 1,389 3.5%
Total 2,014 5.0%
Other (with 1% mkt share) 973 2.4%
Other 3,102 7.8%
Total 39,983 100.0%
Table 6: Seasonal deliverability - Estimated capacity shares in 2010-11

47 Frontier Economics | June 2006 |
Competitive assessment
As indicated above, Centrica has the largest market share of seasonal deliverability with 16.5%. A substantial part of this is attributable to its ownership of Rough and, once again, we have not attempted to make any allowance for the effect of Centrica’s auction obligations with respect to this asset. On this basis, the future market for seasonal deliverability is projected to be competitive with an HHI (based on capacity shares) of 687. There is also expected to be material excess capacity. We estimate that the demand for gas during the 67 days of highest demand in the winter of 2010-11 will be 33,800 mcm, based on National Grid’s Ten Year Statement. This volume is likely to be an overestimate of the maximum gas demand in 67 continuous days because the estimate is derived from a load duration curve in which discontinuous periods are combined. Given this estimate for seasonal demand, delivery capacity will exceed demand by some 18%. As in our analysis of the daily flexibility market, we have undertaken sensitivity analysis assuming that the swing factor for Centrica’s Morecambe Bay field is 160%, with all other assumptions held constant. Under this scenario Centrica’s market share of seasonal delivery capacity rises to 17% and the HHI of the market (based on capacity shares) is fractionally higher at 698. Once again, this structure suggests that the market can be expected to be competitive. Impact of Grain 3
In the worst scenario where Centrica, as the player with the largest market share, acquires all of the capacity at Grain 3, the HHI of the market (based on shares of ability to deliver seasonally) would then rise to 755 (767 under the scenario in which Morecambe is assumed to have higher swing). This is still well under the threshold beneath which there is a presumption of competitiveness. We therefore conclude that the market for seasonal delivery of gas will be competitive both before and after the commissioning of Grain 3.
6.2 MARKETS WITH A PROBABLE INDIRECT IMPACT
It is reasonable to suppose that the party or parties who contract for capacity at Grain 3 will develop or contract for the development of an LNG export facility (or at least the expansion of an existing facility). Furthermore, such parties may well choose to own and operate the LNG tankers that will be used to deliver gas to Grain. It is also prudent to assume that whoever acquires rights to Grain 3 will assume an increased share of the UK shipping market (use of UK onshore transportation) Before addressing the possible competitive impact in these markets, it is important to understand that the direct effect of Grain 3 is to create a buyer in each of these markets. It does not create an LNG exporter or LNG shipper per se. Just as the addition of capacity to supply a market cannot create an incentive for the withdrawal of more capacity than was added, so the addition of a player’s demand in a market cannot create an incentive for the player to act as more of a monopolist and withdraw more demand than has been added. We do not see the possibility that the creation of incremental buyer demand for these services could lead to problems associated with buyer market power.

48 Frontier Economics | June 2006 |
Competitive assessment
However, the likelihood is that the party or parties acquiring rights at Grain 3 may well satisfy their demand for an LNG supply source / LNG tankers by building, or entering into long term contracts for, new capacity. Under these circumstances such parties become a supplier of the service, not just a buyer. To the extent the new supply matches the quantity to be delivered to Grain, it is possible to argue that this simply adds an element of self supply which has no affect at all on the rest of the market, and can therefore have no detrimental effect.
Notwithstanding this, for the sake of completeness, we analyse the structure of supply in these two markets including self supply. We then assume that in each case the party with the highest market share uses its acquisition of Grain 3 rights to take a larger share of the respective market.
There is also likely to be an impact on the UK gas shipping market. This is discussed as the last of the markets in this subsection.
6.2.1 Global LNG supply
The following figure provides an overview of the existing structure of the market for global LNG supply.
Global LNG supplySonatrach
14%
Shell11%
Petronas8%Total
7%BP6%ExxonMobil
6%
INPEX5%
Gov. of Oman4%
ADNOC4%
Others26%
Qatar Petroleum9%
SonatrachShellQatar PetroleumPetronasTotalBPExxonMobilINPEXGov. of OmanADNOCOthers
Figure 5: Market shares for global LNG supply (2005) Source: Wood MacKenzie
The HHI for the global LNG export market is 667. The party with the highest market share is Sonatrach which is estimated to have 14% of the market. If Sonatrach were to build extra LNG liquefaction capacity to match acquisition of Grain 3 rights, the HHI would increase by 68 to 735.

49 Frontier Economics | June 2006 |
Competitive assessment
HHIs with and without Grain 3 are well beneath the threshold below which there is a presumption of competitiveness.
Qualitative considerations reinforce the view that there is no reason to believe that Grain 3 exemption would be detrimental to competition in the LNG export market:
• as noted above, the connection of any impact to Grain 3 is somewhat tenuous, i.e. it is not a clear consequence;
• on the assumption that the capacity is added to serve Grain 3 it is adding an element of self supply to a market that otherwise remains unaffected;
• competition to acquire LNG exports generally occurs through contracts developed over quite long lead times and purchasers will have the option to negotiate with a party willing to build new capacity. Indeed, because contracts dominate, it may be impossible for a purchaser of LNG exports to buy it all from existing facilities. Negotiating new build could well be the only option. In this case market shares in the existing market are of no direct relevance; and
• LNG export is a fast growing business where the rate of new investment would make the exercise of market power difficult.
On this basis we conclude that exemption of Grain 3 from RTPA will not be detrimental to competition in the global LNG market.
6.2.2 LNG shipping
As noted above the possible impact to consider in this market arises if the acquirer of Grain 3 rights buys tankers to match its needs.
We estimate that there are currently approximately 45 owners of LNG tankers operating worldwide, with no single owner holding more than an 11% market share in terms of capacity. In the following table we present the resulting range of market shares and HHI index for global LNG shipping. It is clear that the LNG shipping market is quite atomistic.
Market shares
Max: (held by Petronas subsidiary) 11.2%
Min: 0.2%
Median: 1.3%
Average: 2.2%
HHI 492
Table 7: LNG shipping market share range and HHI for shipping built up to 2005 Source: EIA, Frontier estimates

50 Frontier Economics | June 2006 |
Competitive assessment
The current structure has an HHI of 492. A subsidiary of Petronas has the largest market share and therefore the worst scenario from the perspective of competition in this market would be for Petronas to acquire Grain 3 rights. If we assume that tankers serving Grain 3 travel the same distance as the average of all other tankers, we can simply translate throughput at Grain into tanker demand by comparing Grain 3 throughput with world LNG production. On this basis the change in Petronas share would be insignificant and the HHI would remain the same.
Given that, with or without any effect consequent on the construction of Grain 3, the structure of this market is very competitive, we conclude that exemption from RTPA for Grain 3 would not cause a detriment to competition in the LNG shipping market.
6.2.3 Gas shipping
As with LNG supply and LNG shipping, Grain 3 will create demand for UK shipping services. However, it is quite likely that the acquirer of Grain 3 rights will choose to self ship and the question we address is whether this could possibly cause any competitive concerns.
There are approximately 120 independent parties in possession of a UK shipping licence34. However, as we noted in Section 4, there are no publicly available data on market shares of the UK shipping market. One report published by the European Commission35 in April 2003 suggests that in 2001 the largest UK shipper may have had a 50% market share. However, in the absence of better data it is difficult to comment meaningfully on overall market structure.
In any event, regardless of any uncertainties concerning market structure, there are, in our view, relatively low barriers to entry in the shipping market. There are some systems costs involved but we do not think that these would inhibit a producer or supplier from becoming their own shipper if they felt that that they were unable to access competitive shipping services. Perhaps just as importantly, there are extremely low barriers to expansion as a shipper. If the shipping market were uncompetitive an existing shipper would be able at very little cost to expand their share of the market virtually overnight. The lack of data on market shares also helps to ensure that it would be difficult for coordination to develop because one shipper’s behaviour cannot easily be observed by others. We therefore conclude that low barriers to both entry and expansion prevent shipping from being an uncompetitive market.
34 Information sourced from the Ofgem website. There are 177 parties with a shipping licence.
However, holders of shipper licences have the right to remain confidential. There could therefore be more than 177 parties registered as gas shippers. Although, an inspection of this list suggests that there may be no more than about 120 independent parties.
35 Commission of the European Communities “Second benchmarking report on the implementation of the internal electricity and gas market”, Commission staff working paper, 7 April 2003.

51 Frontier Economics | June 2006 |
Competitive assessment
6.3 POSSIBLE VERTICALLY RELATED MARKETS
In addition to the markets that may be affected by investment associated with, but not part of, the investment at Grain, there are potentially vertically related markets. Vertical markets are markets that are at different levels in the supply chain for a good or service.
If the primary affected markets are competitive there should be no competitive impact of Grain 3 on vertically related markets. Our analysis suggests that the directly affected relevant markets (wholesale and flexibility) are competitive and therefore there should be no concern. If these markets are competitive, then an increased market share in these confers no material advantage which can be leveraged into other adjacent markets. However, for the sake of completeness we consider hypothetical competitive impacts in three vertically related markets.
The potential concern that could arise out of the proposed expansion at Grain in this context is that it could lead to an increase in the degree of vertical integration of a company. Clearly, the proposed project would not directly increase the degree of vertical integration; rather it could increase a (potentially already vertically integrated) player’s control over the wholesale supply of gas. The primary vertical concern that could arise out of the proposed expansion therefore would relate to the access to gas of players active in the downstream retail supply of gas and the question as to whether acquisition of the additional capacity at Grain could potentially enable the acquiring player to foreclose competing downstream players from access to gas. Clearly, such vertical concerns could only arise if the additional capacity were acquired by a player already vertically integrated with control over a large part of the upstream gas supply in the UK.
Given the small upstream market shares of the relevant parties and the small increment in those market shares added by the proposed capacity expansion at Grain, we do not think that the proposed investment can be expected to give rise to any vertical concerns. Moreover, as we will show below, the competitive conditions downstream are not such that they could cause a vertical relationship with competition concerns.
Clearly, the more competitive the downstream market for the supply of gas to end consumers, the less one would be concerned about competition being inhibited by the expansion at Grain. As we will show in the following three sections, discussing the supply of gas to the three categories of end users discussed in section 5, namely power stations, I&C customers and households, we consider these to be sufficiently competitive for no vertical concerns in relation to the expansion at the Isle of Grain to arise.
6.3.1 Supply of gas to UK Power stations
Table 8 below sets out the market shares of supply to power stations in the UK. Owing to a lack of more recent data, these figures relate to the year 2002. However, we have no reason to suppose that the picture is likely to have changed dramatically in recent years.

52 Frontier Economics | June 2006 |
Competitive assessment
Supplier Market share
BGT/Centrica 24%
BP 16.6%
ConocoPhillips 12.4%
BG 11.5%
Total 8.3%
BHP 7.8%
Shell 5.5%
ExxonMobil 5.3%
Scottish & Southern 3.6%
Chevron Texaco 3.2%
Scottish Power 1.9%
Total 100%
Table 8: Market share for supply to power stations in 2002
Source: Arthur D. Little “Competition in the UK Gas Market: Current and Future Situation”, 16 September 2003.
The HHI for this market structure is 1351, which is above the threshold, under which there is a presumption of a competitive market36. However, it is still relatively low and, more importantly, barriers to entry in supply of gas to power stations are very low indeed. Costs of entry are trivial and anyone with gas to sell could easily enter this market. There are a limited number of customers to sell to and they are all extremely price conscious. We think this is an extremely competitive market and exemption of Grain 3 from RTPA will not be detrimental to competition in this market.
36 However, the European Commission has recently taken a more relaxed view on HHIs, extending
the band of HHIs over which a market is not considered to be highly concentrated. See The Official Journal of the European Union “Guidelines on the assessment of horizontal mergers under the Council Regulation on the control of concentrations between undertakings” (2004/C 31/03).

53 Frontier Economics | June 2006 |
Competitive assessment
6.3.2 Supply of gas to UK I&C customers
The market shares of supply to I&C customers are shown in Table 9.
Supplier Market share
TotalFinaElf 16%
GdF 13%
Shell Gas Direct 12%
Centrica 12%
E.ON UK 11%
Statoil UK 9%
Corona Energy 8%
BP Gas 5%
ENI 5%
RWE npower 4%
SSE 2%
Others 1%
Total 100%
Table 9: Market shares for supply to industrial & commercial customers
Source: Datamonitor proprietary data for 2005
The HHI of the I&C gas supply market amounts to 1099. This is a little over the commonly adopted threshold of 1000, under which there is a general presumption of competition.
Moreover, the characteristics of this market are similar to the power station market. There are very low barriers to entry and therefore similar reasons for regarding this market as competitive.
6.3.3 Supply of gas to domestic customers in the UK
There are currently six gas suppliers of any significance serving the domestic market. Their market shares in terms of residential gas accounts are shown in Table 10.

54 Frontier Economics | June 2006 |
Competitive assessment
Supplier Datamonitor market share (Q4
2005)
Ofgem market shares (June
2005)
Centrica 54% 53%
E.ON UK 13% 14%
SSE 10% 9%
RWE npower 10% 9%
Scottish Power 8% 9%
EDF Energy 5% 5%
Others 1% 0%
Total 100% 99% (rounding)
Table 10: Market shares for supply to domestic customers (accounts)
Source:
Datamonitor proprietary data and
Ofgem, Domestic Retail Market Report – June 2005
The HHI of the domestic market is 3370 on the basis of Datamonitor data and 3273 on the basis of Ofgem data. The key factor in this is the 54% share held by Centrica, the historic incumbent. Centrica’s share in terms of accounts has fallen from 84% in September 1999 to 53% in March 2005 – 10 percentage points below the share at the time of Grain’s earlier exemption application two years ago. Given that these shares are expressed in terms of accounts, this means that customers are continuing to switch away from Centrica.
In terms of barriers to entry, we would expect the need for an established brand to be a potentially significant barrier to entry. However, other metrics suggest active competition among suppliers. Ofgem, in its press release on its most recent review of the domestic electricity and gas markets published in February 2006, commented in respect of both markets that:
‘Despite recent rises in energy bills, research [published by Ofgem] shows that competition is still vigorous.’
Ofgem summarises its findings in its report as follows37: ‘In general, the indicators [in its report] show continued evidence of effective competition between domestic energy suppliers. There is a significant proportion of customers who have yet to switch supplier and there is some evidence of lower switching rates amongst particular groups. However, these findings do not appear to be a result of significant barriers to switching, either for all customers or for particular groups.’
Ofgem concluded that competition is alive and well in the energy market38.
37 Ofgem, Domestic Retail Market Report – June 2005, published in February 2006. 38 Quote from Alistair Buchanan, Chief Executive of Ofgem: “Our message to customers is to be
Energy Smart and take advantage of the strong competition in the energy market…”, Ofgem press release, 7th February 2006.

55 Frontier Economics | June 2006 |
Competitive assessment
On the basis of Ofgem’s analysis, it seems fair to conclude that there would be no particular concern that the changes in the upstream UK markets, associated with the developments at Grain, would interfere with competition in the domestic gas market.
6.4 COMPETITIVE ASSESSMENT CONCLUSIONS
Potential relevant market
HHI before
G3
HHI after G3
(worst case
assumptions)
Conclusion
Directly and indirectly affected markets
UK wholesale market ( no exports)
835 893 Competitive. No Grain 3 detriment
UK wholesale market (export scenario)
803 889 Competitive. No Grain 3 detriment
NW Europe wholesale market
778 808 Competitive. No Grain 3 detriment
Europe wide wholesale market
1042 1081 Moderately competitive. Other market features imply no detriment from Grain 3
UK daily delivery 613 674 Competitive. No Grain 3 detriment
UK seasonal delivery 687 755 Competitive. No Grain 3 detriment
LNG liquefaction 667 735 Competitive. No Grain 3 detriment
LNG shipping 492 492 Competitive. No Grain 3 detriment
UK gas shipping NA NA Very low barriers to entry and expansion very easy – competitive. No Grain 3 detriment
Vertically related markets – no anticipated effect of Grain 3
Gas supply to UK power stations
1351 Very low barriers to entry - competitive. No effect of Grain 3
Gas supply to I&C 1099 Very low barriers to entry - competitive. No effect of Grain 3
Gas supply to domestic consumers
3770 Current structure influenced by legacy before liberalisation but ongoing competition is effective. No effect of Grain 3
Table 11: Summary of competitive assessment


57 Frontier Economics | June 2006 |
Annexe 1: Estimating the future position of parties in the UK wholesale market
Annexe 1: Estimating the future position of parties in the UK wholesale market
Given that the purpose of this report is to gauge the likely impact of the proposed investment on competition and given that the planned expansion is expected to become operational in 2010-11, the competitive assessment requires a view as to what the market will look like in 2010-11 and ideally beyond. This subsection provides a brief overview of how we go about modelling the future position of parties in 2010-11, when the expansion of Grain is currently expected to become operational, if it is granted an exemption.
Two demand scenarios
In our analysis, we consider two demand options:
• UK demand for 2010-11 (from NGG Ten Year Statement); and
• UK demand plus exports.
In the first UK demand option, we allow the Continental interconnectors to import (as last in the merit order).
Under the UK plus exports demand option, we assume that the Continental pipelines are export dedicated (i.e., they do not import). This option reflects the fact that the UK gas market is likely to be “long” in importation capacity in the coming years as a result of the large capacity of planned and forecast gas import projects that are due to come online. Under the second scenario, we will assume that gas supplies to the UK will meet national demand plus demand from exports to Europe. We have capped the exports to Europe to the sum of the maximum capacities of the Bacton and BBL interconnectors (assuming BBL accommodates reverse flow).
The merit order
The model we used to calculate market shares under the two demand options is a gas supply ‘dispatch’ model to meet UK (plus exports) demand according to the following merit order:
• UKCS production;
• Norwegian gas (from the Vesterled, FLAGS and Langeled pipelines);
• LNG imports (Isle of Grain, Dragon, South Hook 1&2, Canvey); and
• continental imports (the Bacton and BBL interconnectors).
We dispatch committed LNG (Isle of Grain, Dragon, South Hook 1&2) and the interconnectors to the Continent as two composite projects with total capacity equivalent to the sum of the relevant underlying projects (i.e. all committed LNG facilities are ‘dispatched’ pro rata and if Continental imports/exports are marginal these are also ‘dispatched’ pro rata).

58 Frontier Economics | June 2006 |
Annexe 1: Estimating the future position of parties in the UK wholesale market
Market share and HHI calculations
From the above dispatch, we obtain supply levels for the different sources of gas that we allocate to market participants on the following basis:
• for UKCS production we have used Wood Mackenzie proprietary data for production market shares by company for 2004-05 (brought forward to 2010-11 production estimates of UKCS fields for that year according to NGG forecasts from the 2005 Ten Year Statement);
• for Norwegian gas we ascribed supply shares according to the equity interests in the pipeline as a proxy;
• for LNG imports we used Grain LNG proprietary data and desktop research to determine the volumes of gas that are to be brought to the market by the various companies; and
• for potential Continental imports we ascribed supply shares according to the equity interests in the pipeline as a proxy.
After the allocation of supply volumes to market participants, we calculated the underlying market shares and HHI levels – for both demand options (i.e., UK demand and UK demand plus export demand to Europe).
ASSUMPTIONS CONCERNING FUTURE GAS INFRASTRUCTURE TO THE UK
This subsection lists the assumptions underlying our model that are made about infrastructure developments for the supply of gas to the UK for the period when the third phase of the Grain project is currently expected to be completed, i.e. the gas year 2010-11.
UKCS production
The NGG Ten Year Statement estimates gas production from UKCS fields to be 60 bcm in 2010-11. We used Wood Mackenzie proprietary production market share data for 2005 (estimated) and, in the absence of better data, have extrapolated this forward to 2010-11, assuming the production decline occurs at the same rate for all fields. These are set out in Table 12.
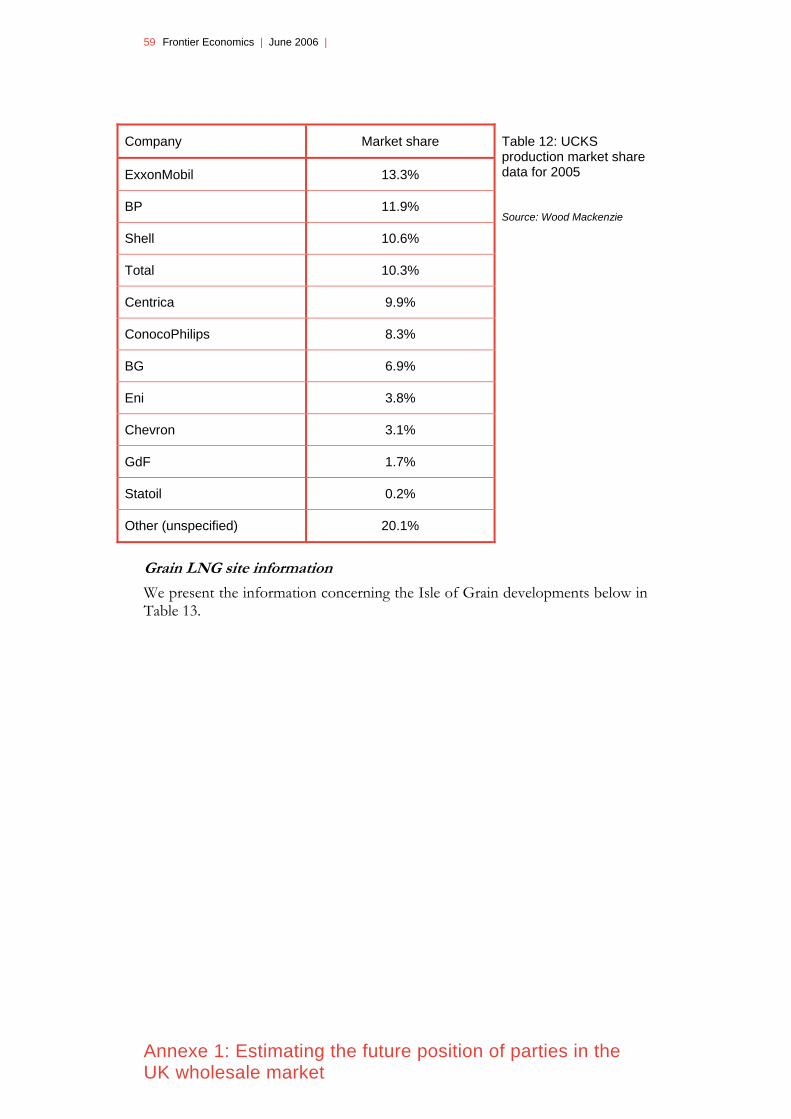
59 Frontier Economics | June 2006 |
Annexe 1: Estimating the future position of parties in the UK wholesale market
Company Market share
ExxonMobil 13.3%
BP 11.9%
Shell 10.6%
Total 10.3%
Centrica 9.9%
ConocoPhilips 8.3%
BG 6.9%
Eni 3.8%
Chevron 3.1%
GdF 1.7%
Statoil 0.2%
Other (unspecified) 20.1%
Table 12: UCKS production market share data for 2005
Source: Wood Mackenzie
Grain LNG site information
We present the information concerning the Isle of Grain developments below in Table 13.
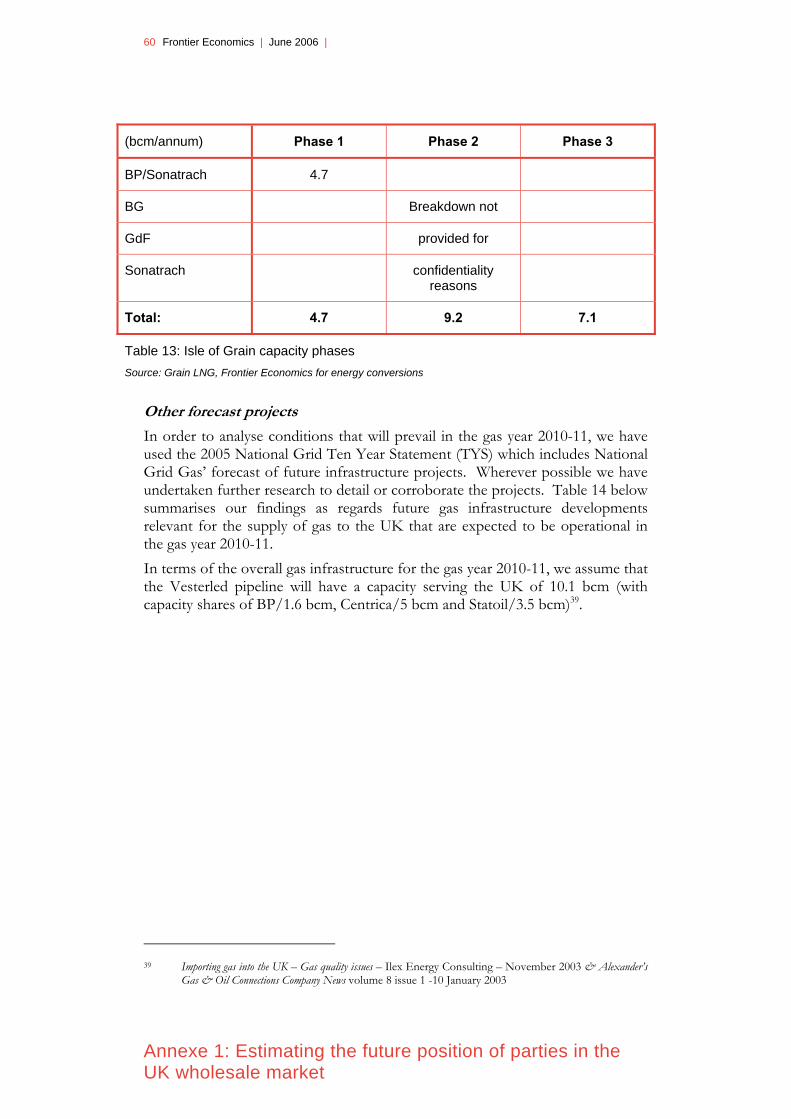
60 Frontier Economics | June 2006 |
Annexe 1: Estimating the future position of parties in the UK wholesale market
(bcm/annum) Phase 1 Phase 2 Phase 3
BP/Sonatrach 4.7
BG Breakdown not
GdF provided for
Sonatrach confidentiality reasons
Total: 4.7 9.2 7.1
Table 13: Isle of Grain capacity phases Source: Grain LNG, Frontier Economics for energy conversions
Other forecast projects
In order to analyse conditions that will prevail in the gas year 2010-11, we have used the 2005 National Grid Ten Year Statement (TYS) which includes National Grid Gas’ forecast of future infrastructure projects. Wherever possible we have undertaken further research to detail or corroborate the projects. Table 14 below summarises our findings as regards future gas infrastructure developments relevant for the supply of gas to the UK that are expected to be operational in the gas year 2010-11. In terms of the overall gas infrastructure for the gas year 2010-11, we assume that the Vesterled pipeline will have a capacity serving the UK of 10.1 bcm (with capacity shares of BP/1.6 bcm, Centrica/5 bcm and Statoil/3.5 bcm)39.
39 Importing gas into the UK – Gas quality issues – Ilex Energy Consulting – November 2003 & Alexander’s
Gas & Oil Connections Company News volume 8 issue 1 -10 January 2003

61 Frontier Economics | June 2006 |
Annexe 1: Estimating the future position of parties in the UK wholesale market
Project name Developer Location Size (bcm/y) Commissioning date Status Capacity split
Dutch Interconnector (BBL)
BBL Balgzand to Bacton 16
(we assume that the BBL will be bi-
directional with capacity 16bcm)
2006-07 Under construction Gasunie = 60%
Eon = 20%
Fluxys = 20%
Belgium Interconnector (IUK) Compression (Phase II)
iUK Zeebrugge to Bacton 23.5 import capacity
20 bcm export capacity
(inclusive of existing capacity)
2007-08 Phase I expansion completed November 2005. Phase II under
construction.
BG = 25%
ConocoPhillips = 10%
Distrigas = 16.4%
ENI = 5%
E.On Ruhrgas = 23.6%
Gazprom = 10%
Total = 10%
Langeled Gassco Sleipner to Easington 20
(of which we assume that 10bcm of the
Ormen Lange field will be diverted directly to
Europe)
2007-08 Under construction, pipeline completion late
2006, first flow from Ormen Lange late 2007
Norsk Hydro = 18%
Statoil = 10%
Norwegian State = 45%
Dong = 10%
Shell = 17%
Tampen Link (FLAGS – Statfjord late life project)
Gassco New link to existing UKCS infrastructure
4 2007-08 Construction contract awarded
Statoil = 43.9%
ExxonMobil = 18.2%
Shell = 12.2%
Norsk Hydro = 10.5%
ConocoPhillips = 8.2%
Petoro = 7%

62 Frontier Economics | June 2006 |
Annexe 1: Estimating the future position of parties in the UK wholesale market
Project name Developer Location Size (bcm/y) Commissioning date Status Capacity split
Dragon LNG Petroplus / BG / Petronas
Milford Haven 6 2007-08 Under construction, possibility of additional
6 bcm in later expansion
BG = 50%
Centrica (through Petronas) = 50%
South Hook LNG (Phase I)
Qatar Petroleum / ExxonMobil
Milford Haven 10.5 2007-08 Under construction ExxonMobil = 30%
Qatar Petroleum = 70%
South Hook LNG (Phase II)
Qatar Petroleum / ExxonMobil
Milford Haven 10.5 2008-09 Construction contract awarded
ExxonMobil = 30%
Qatar Petroleum = 70%
Canvey LNG Calor Gas, Centrica, Japan LNG
Canvey Island 5.4 2010-11 Initial stages of development
Centrica = 20%
Calor = 40%
LNG Japan = 40%
Table 14: Existing and future gas infrastructure developments in the UK up to the gas year 2010-11
Source: National Grid Ten Year Statement 2005, Frontier Economics

63 Frontier Economics | June 2006 |
Annexe 2: Estimation of daily deliverability to the UK wholesale market
Annexe 2: Estimation of daily deliverability to the UK wholesale market
We present here the data we have used in relation to:
• existing storage sites; and
• planned storage sites.
Data on both UKCS production and LNG import facilities were provided in the Annexe 1.
Existing storage sites
Name Type Owner Space (mcm)
Deliverability (mcm/da)
Withdraw cycle days
Rough Depleted field
Centrica 2800 42 67
Hatfield Moor
Depleted field
ScottishPower 116 3 46
Humbly Grove
Producing oil field
Star Energy 300 8 40
Avonmouth LNG Transco 76 15 5
Dynevor Arms LNG
LNG Transco 25 5 5
Glenmavis LNG Transco 51 10 5
Partington LNG Transco 110 22 5
Hole House Salt cavity EDF Trading 30 3 28
Hornsea Salt cavity SSE 322 18 18
Table 15: Data on existing storage sites Source: Wood Mackenzie

64 Frontier Economics | June 2006 |
Annexe 2: Estimation of daily deliverability to the UK wholesale market
Planned storage sites Site Type Status Owner Date Space
(mcm) est.
deliverability (mcm/d)
Aldbrough (ownership split)
Salt cavity Under Construction
Statoil 2007/08 210 9.1
Aldbrough (ownership split)
Salt cavity Under Construction
SSE 2007/08 210 9.1
Hole House (phase 2)
Salt cavity Under Construction
EdF Trading
2006-08 30 1.3
Holford Gas Storage
Salt cavity Under Developmen
t
Eon 2008/09 165 7.2
Welton Producing oil field
Planning permission
pending
Star Energy
2008/09 435 10.9
Albury (Phase I) Producing oil field
Initial Stages Star Energy
2008/09 160 4.0
Albury (Phase II)
Producing oil field
Conceptual Star Energy
2010 715 17.9
Bletchingley Undeveloped field
Conceptual Star Energy
2009 875 21.9
Caythorpe Depleted field
Planning permission
pending
Warwick Energy
2007 200 3.5
Stublach Salt cavity Initial Stages Ineos Enterprise
s
2009 550 23.9
Saltfleetby Producing oil field
Initial Stages Wingas 2009 600 15.0
Portland Salt cavity Initial Stages Egdon Resource
s
2008 300 13.0
Fleetwood Salt cavity Public enquiry
commenced Oct 05
Canatxx 2009/10 1700 73.9
Gainsborough - producing field
Producing oil field
Studies Star Energy
NA 240 6.0
Table 16: Planned storage sites
Source: NGG Ten Year Statement and Wood MacKenzie proprietary data for main data and Frontier Economics estimate for assumed deliverability

Frontier Economics Limited in Europe is a member of the Frontier Economics network, which consists of separate companies based in Europe (London & Cologne) and Australia (Melbourne & Sydney). The companies are independently owned, and legal commitments entered into by any one company do not impose any obligations on other companies in the network. All views expressed in this document are the views of Frontier Economics Limited.

THE FRONTIER ECONOMICS NETWORK LONDON | COLOGNE | MELBOURNE | SYDNEY
Frontier Economics Ltd 71 High Holborn London WC1V 6DA
Tel. +44 (0)20 7031 7000 Fax. +44 (0)20 7031 7001 www.frontier-economics.com