Embed Size (px)
Citation preview
National Survey of Family Growth Cycle 6: 2002-2003, Contextual
Data File
Data for Respondents’ Addresses on Date of Interview
Codebook
U.S. Department of Health and Human Services
Centers for Disease Control and Prevention National Center for Health Statistics
Prepared by
Inter-university Consortium for Political and Social Research (ICPSR)
Institute for Social Research University of Michigan
July 2005
Please Note: Specific states and localities were edited out of this web version of the codebook, as indicated by “XXXX”. These details are included in the codebooks available in the NCHS Research Data Center.
2
Table of Contents Chapter I. Introduction Chapter II. Variable Descriptions Chapter III. Source Documentation and Variable Naming Conventions Chapter IV. Descriptive Statistics Appendix A. Constructed Measures
3
Chapter I. Introduction
The purpose of this contextual data file is to provide an array of community characteristics by which researchers may investigate contextual influences for the fertility-related behaviors studied by the National Survey of Family Growth, Cycle 6: 2002-2003 (NSFG-6). The first of two contextual data files produced by ICPSR for NSFG-6, it contains selected characteristics of the communities in which the NSFG-6 respondents resided when they were interviewed for NSFG-6 during 2002-2003. In contrast, the second file comprises characteristics of the communities in which the NSFG-6 respondents lived on April 1, 2000. The second contextual data file has the same variables as this one, plus two more which show whether the respondent was at the same address on April 1, 2000 (MOVER), and if not, the type of geocoding match for the respondent's address on that date (MATCH). More than a thousand contextual variables have been compiled and calculated from various sources at the state, county, census tract, and block group level. Characteristics covered by the contextual variables include sex, age, race, Hispanic origin, marital status, migration, household type and presence of children, income and poverty, education and school enrollment, labor force participation and work hours, building permits, housing occupancy, housing tenure, housing values and rent, nursing and personal care facilities, Medicare program enrollment, crime, private nonfarm business establishments, manufacturing, wholesale and retail trade, government programs and finances, and the presence of services and facilities for contraception and sexually transmitted diseases. The codebook comprises four chapters and an appendix. The first chapter contains an overview of the contextual data file and describes its missing value codes. Next, variable descriptions are provided in Chapter II, including the formulas that were used to compute the contextual variables from the original data sources. Chapter III describes the original data sources and explains how the contextual variables were named while Chapter IV contains descriptive statistics for every numeric variable in the contextual data file: number of valid cases, number of missing cases, mean, standard deviation, minimum value, and maximum value.1 Finally, Appendix A consists of notes on three constructed measures that were too complex to be covered in Chapter II. For examples of the uses of these data, see the following report which was based on the NSFG Cycle 5 Contextual Data File:
William Mosher, Lionel Deang, and Mathew Bramlett. “Community Environment and Women’s Health Outcomes: Contextual Data.” Vital and Health Statistics, Series 23, No. 23, April 2003. Hyattsville, MD: National Center for Health Statistics.
Structure of the NSFG-6 Contextual File 1 The minimum and maximum values, however, have been omitted from this version of the codebook due to disclosure risk. They are included in the unedited codebooks available in the NCHS Research Data Center.
4
Supplied as a portable SAS CPORT file named nsfg6c02.cpt, this contextual data file can be converted to a SAS dataset with the SAS CIMPORT procedure. The contextual data file contains 12,571 cases, one for each of the 12,571 NSFG-6 respondents. There are 1,052 variables in the contextual data file, all of which are numeric except the first seven which are character variables. The NSFG-6 respondent identification number (CASEID), respondent’s gender (RESP_GENDER), and five geographic identification variables (SRC_BLOCK, STATE, COUNTY, TRACT, and BLKGRP) constitute the character variables. With a few exceptions, the numeric variables consist of various rates, proportions, means, medians, and absolute numbers. About one third of the variables in the contextual data file were computed from variables in the original sources; the others are copies of variables in the original sources. Every variable in the contextual data file has a variable label with a detailed description of the variable. By matching on the common ID variable CASEID, the contextual data file can be merged with the main NSFG-6 survey data. Data Sources and Levels of Observation
The 1,052 variables in the contextual data file were derived from the following sources:
• NSFG-6 survey data • Census of Population and Housing, 2000: Summary File 3 (SF3) • County and City Data Book, 2000 (CCDB) • A data file with variables on contraception and abortion that was prepared by the Alan
Guttmacher Institute (AGI). • A data file with variables on sexually transmitted diseases that was prepared by the Centers
for Disease Control and Prevention (CDC) • Census of Population and Housing, 2000: Special Tabulation STP23 (STP23), which was
submitted to ICPSR by the Alan Guttmacher Institute • 2004 Green Book, Background Material and Data on the Programs within the Jurisdiction
of the Committee on Ways and Means (GB)
Three variables were derived from the NSFG-6 survey data, 620 were derived from STF3, 101 from CCDB, 33 from the AGI file, seven from the CDC file, 280 from STP23, and eight from GB. Multiple levels of observation are represented by the contextual variables. The variables derived from SF3 consist of 232 county level variables, 206 census tract level variables, 178 block group level variables, and four variables with geographic codes which identify the state, county, census tract, and block group. Two of the three variables originating in the NSFG-6 survey data (CASEID and RESP_GENDER) are respondent level variables and one (SRC_BLOCK) contains a geographic code which uniquely identifies the block group. All of the variables
5
derived from GB are state level variables and all of variables originating in CCDB, the AGI file, the CDC file, and STP23 are county level variables. Missing Values This NFSG-6 contextual data file contains 17 missing value codes: the SAS numeric missing value and 16 SAS special numeric missing values. The SAS numeric missing value is a period (.) and the special numeric missing values are .A, .B, .C, .D, .E, .F, .G, .I, .J, .N, .Q, .R, .S, .V, .Y, and .Z. Numeric missing value. This missing value code was generated during the computation of variables AGIr1 to AGIr17, a subset of the variables derived from the AGI file. It indicates that division by zero was attempted when a variable was calculated. Special numeric missing value .R. Reserved for contextual variables originating from the Green Book, .R indicates that a GB table cell had an entry of “NA” (not available) or a state was completely missing from a GB table. Special numeric missing value .S. Of the 16 special numeric missing value codes, .S is the most widely used. It denotes an estimated proportion, rate, mean, or median based on an unacceptably small sample size. Many of the variables in the contextual data file are based on sample data rather than complete enumerations. For the most part, the sample data was collected by the Census 2000 long-form questionnaire, which was administered to one in six household residents overall. Confidence that an estimate reflects an actual population value declines as the size of the sample from which it is calculated becomes smaller. To prevent the use of unreliable estimates based on very small sample sizes, every variable in the contextual data file that is an estimate of a proportion, rate, or mean was recoded to .S if the estimated size of its denominator was smaller than one of two thresholds: 70 for dichotomous variables and 170 for all other variables. To the same end, medians based on an estimated population size less than 170 were also recoded to .S. Applying the overall sampling fraction of 1/6 to an estimate of 170 gives a sample size of about 28 and an estimate of 70 implies a sample size of about 12. Only variables that are estimates of a proportion, rate, mean, or median were subjected to this missing value recode. Variables that are estimates of absolute numbers (e.g., population counts) were never recoded to .S, regardless of their size. Variables with more than 6,000 of the 12,571 cases coded .S were removed from the NSFG-6 contextual data file altogether. Other special numeric missing values. These missing value codes, which are described in Table 1-1 on the next page, indicate that a value in the County and City Data Book, 2000 was problematic for one of the following reasons:
1. a range of values was supplied in CCDB instead of a single value
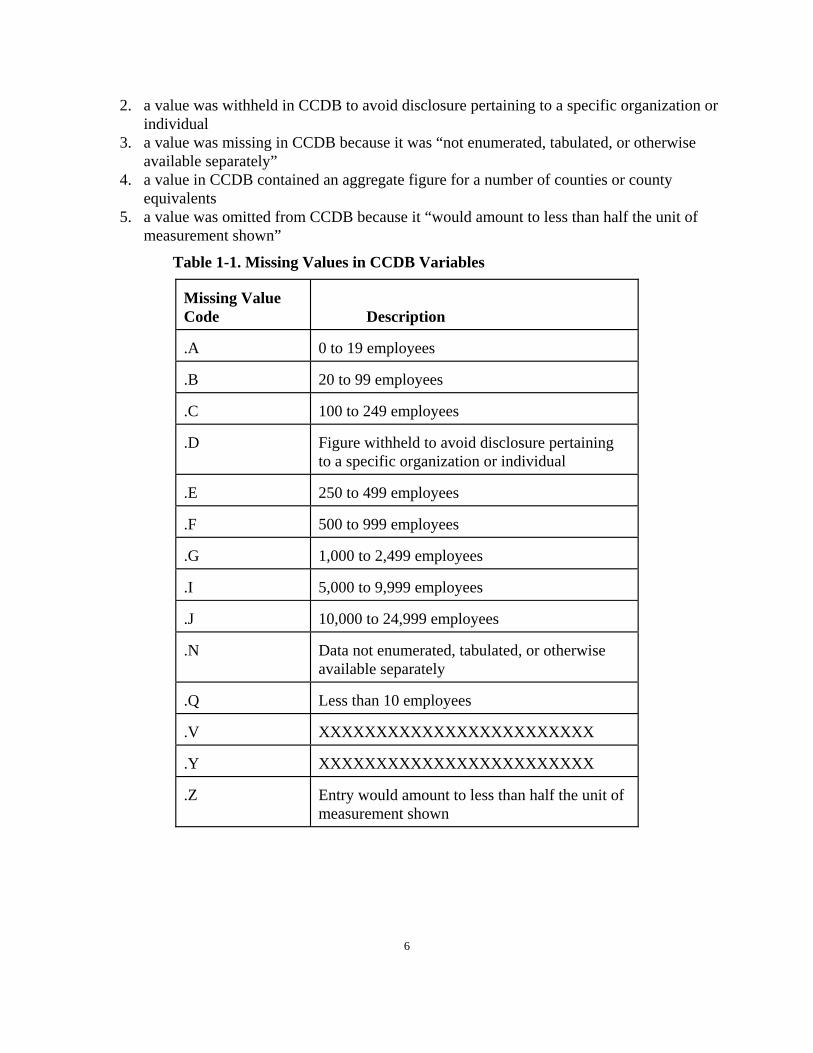
6
2. a value was withheld in CCDB to avoid disclosure pertaining to a specific organization or individual
3. a value was missing in CCDB because it was “not enumerated, tabulated, or otherwise available separately”
4. a value in CCDB contained an aggregate figure for a number of counties or county equivalents
5. a value was omitted from CCDB because it “would amount to less than half the unit of measurement shown”
Table 1-1. Missing Values in CCDB Variables Missing Value Code
Description
.A
0 to 19 employees
.B
20 to 99 employees
.C
100 to 249 employees
.D
Figure withheld to avoid disclosure pertaining to a specific organization or individual
.E
250 to 499 employees
.F
500 to 999 employees
.G
1,000 to 2,499 employees
.I
5,000 to 9,999 employees
.J
10,000 to 24,999 employees
.N
Data not enumerated, tabulated, or otherwise available separately
.Q
Less than 10 employees
.V
XXXXXXXXXXXXXXXXXXXXXXXX
.Y
XXXXXXXXXXXXXXXXXXXXXXXX
.Z
Entry would amount to less than half the unit of measurement shown
1
Chapter II. Variable Descriptions
Chapter II describes all of the NSFG-6 contextual variables, which are listed according to their order in the contextual data file. The name of each variable is presented together with a description of the variable and the formula that was used to compute it. Except for the contextual variables derived from the Green Book, SGB00460 to SGB02657, and some of the contextual variables derived from STP23, mar100_S1 to unmar250_S5, the formulas are given in terms of variables in the original data sources. The former exceptions are defined in terms of GB table columns and the latter in terms of other variables in the contextual data file. In the formulas the SF3 variables are identified by their names in ICPSR’s SAS, SPSS, and Stata setups for SF3 while the other variables are identified by their original names in the data sources. Chapter III contains a crosswalk between the ICPSR setup names and the variable names (data dictionary reference names) used in the original SF3 Census Bureau documentation.
2
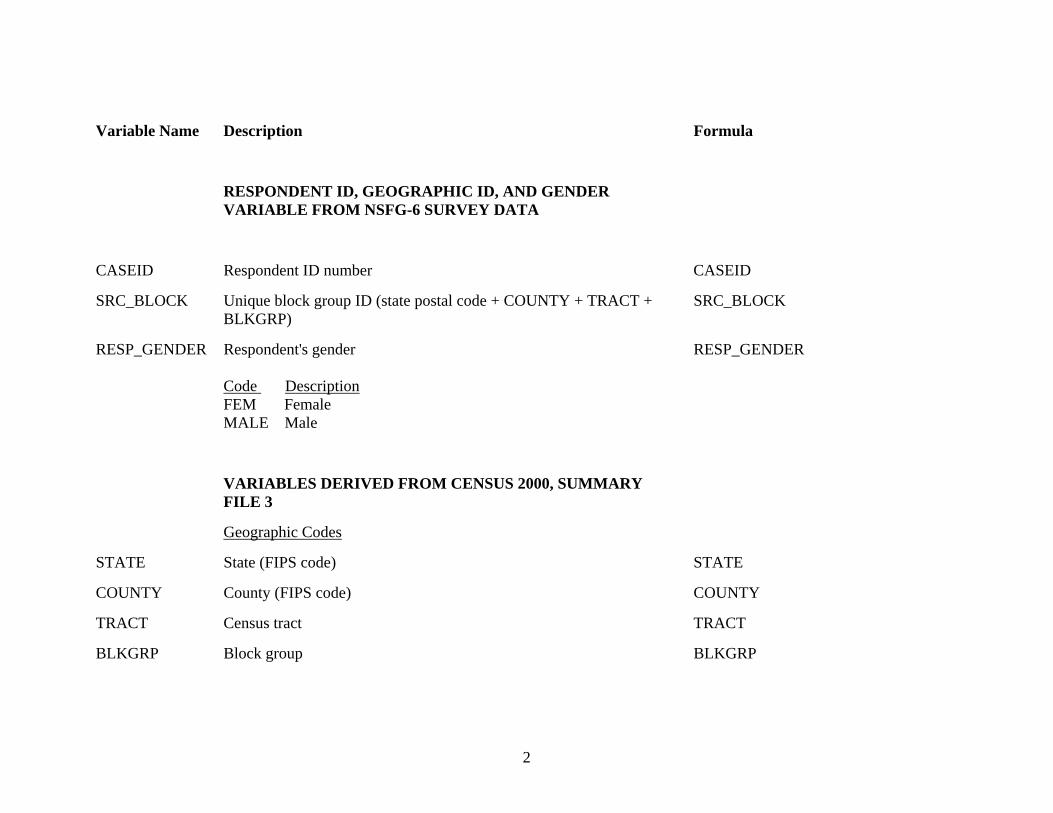
Variable Name Description Formula
RESPONDENT ID, GEOGRAPHIC ID, AND GENDER VARIABLE FROM NSFG-6 SURVEY DATA
CASEID Respondent ID number CASEID
SRC_BLOCK Unique block group ID (state postal code + COUNTY + TRACT + BLKGRP)
SRC_BLOCK
RESP_GENDER Respondent's gender Code Description FEM Female MALE Male
RESP_GENDER
VARIABLES DERIVED FROM CENSUS 2000, SUMMARY FILE 3
Geographic Codes
STATE State (FIPS code) STATE
COUNTY County (FIPS code) COUNTY
TRACT Census tract TRACT
BLKGRP Block group BLKGRP
3
Variable Name Description Formula
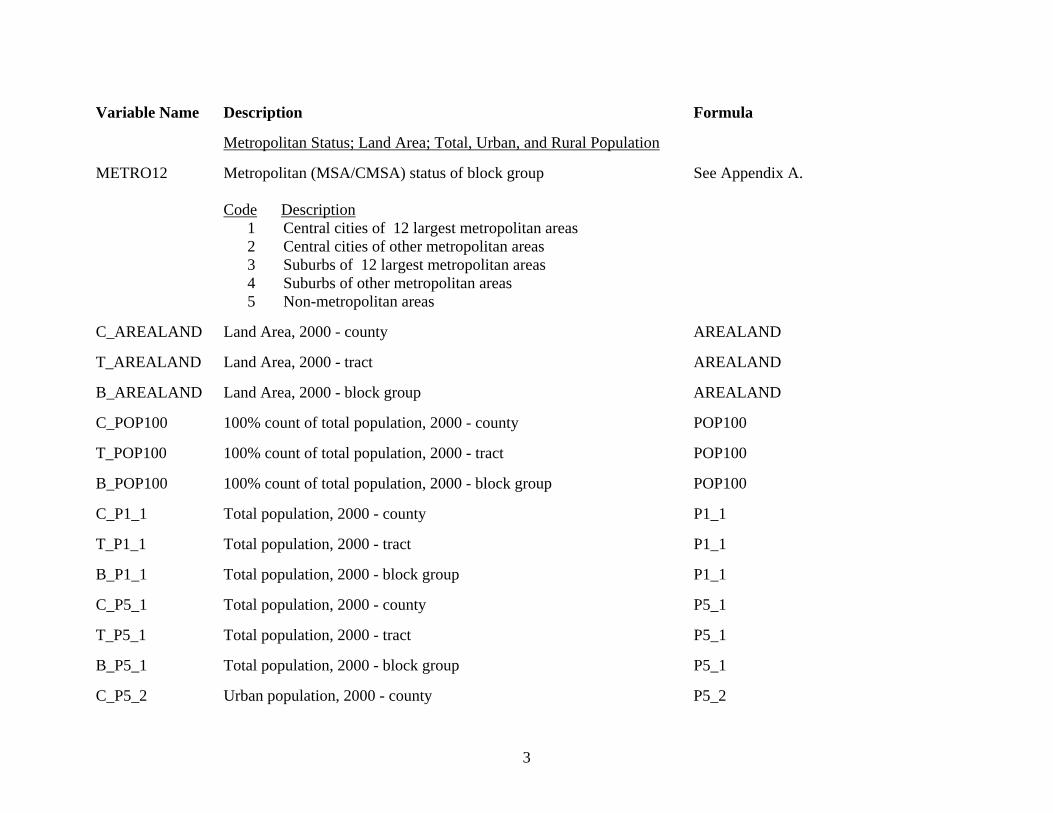
Metropolitan Status; Land Area; Total, Urban, and Rural Population
METRO12 Metropolitan (MSA/CMSA) status of block group Code Description 1 Central cities of 12 largest metropolitan areas 2 Central cities of other metropolitan areas 3 Suburbs of 12 largest metropolitan areas 4 Suburbs of other metropolitan areas 5 Non-metropolitan areas
See Appendix A.
C_AREALAND Land Area, 2000 - county AREALAND
T_AREALAND Land Area, 2000 - tract AREALAND
B_AREALAND Land Area, 2000 - block group AREALAND
C_POP100 100% count of total population, 2000 - county POP100
T_POP100 100% count of total population, 2000 - tract POP100
B_POP100 100% count of total population, 2000 - block group POP100
C_P1_1 Total population, 2000 - county P1_1
T_P1_1 Total population, 2000 - tract P1_1
B_P1_1 Total population, 2000 - block group P1_1
C_P5_1 Total population, 2000 - county P5_1
T_P5_1 Total population, 2000 - tract P5_1
B_P5_1 Total population, 2000 - block group P5_1
C_P5_2 Urban population, 2000 - county P5_2
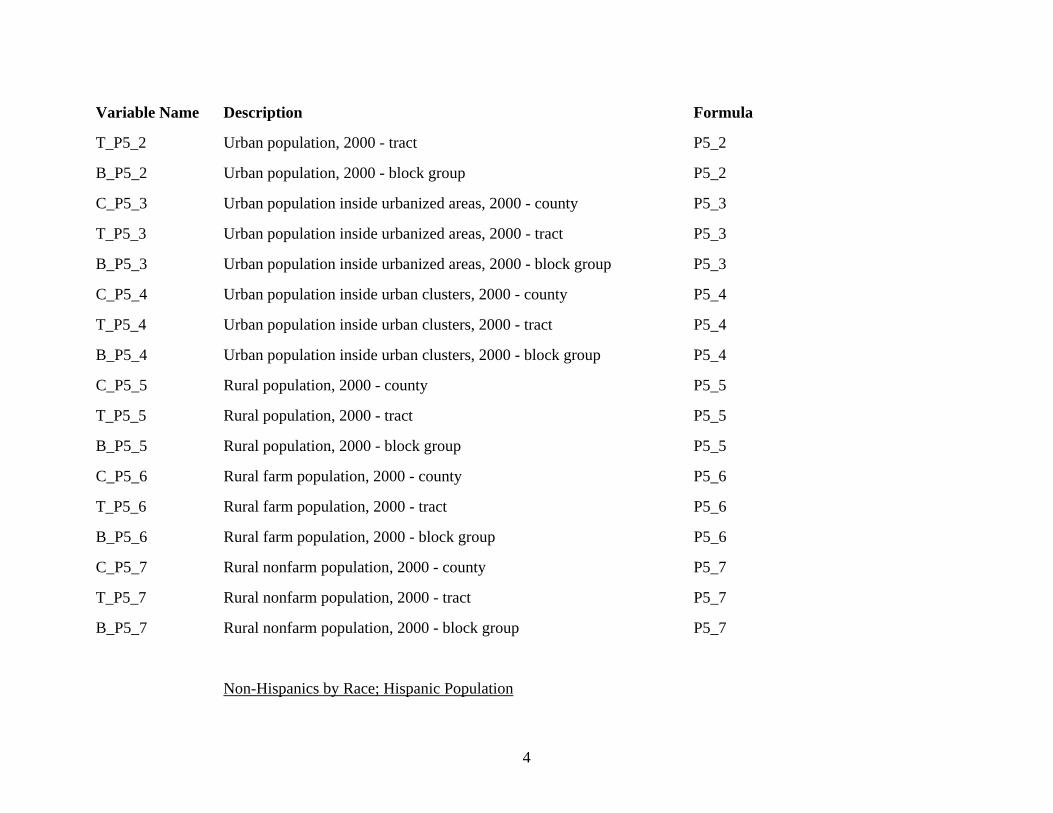
4
Variable Name Description Formula
T_P5_2 Urban population, 2000 - tract P5_2
B_P5_2 Urban population, 2000 - block group P5_2
C_P5_3 Urban population inside urbanized areas, 2000 - county P5_3
T_P5_3 Urban population inside urbanized areas, 2000 - tract P5_3
B_P5_3 Urban population inside urbanized areas, 2000 - block group P5_3
C_P5_4 Urban population inside urban clusters, 2000 - county P5_4
T_P5_4 Urban population inside urban clusters, 2000 - tract P5_4
B_P5_4 Urban population inside urban clusters, 2000 - block group P5_4
C_P5_5 Rural population, 2000 - county P5_5
T_P5_5 Rural population, 2000 - tract P5_5
B_P5_5 Rural population, 2000 - block group P5_5
C_P5_6 Rural farm population, 2000 - county P5_6
T_P5_6 Rural farm population, 2000 - tract P5_6
B_P5_6 Rural farm population, 2000 - block group P5_6
C_P5_7 Rural nonfarm population, 2000 - county P5_7
T_P5_7 Rural nonfarm population, 2000 - tract P5_7
B_P5_7 Rural nonfarm population, 2000 - block group P5_7
Non-Hispanics by Race; Hispanic Population
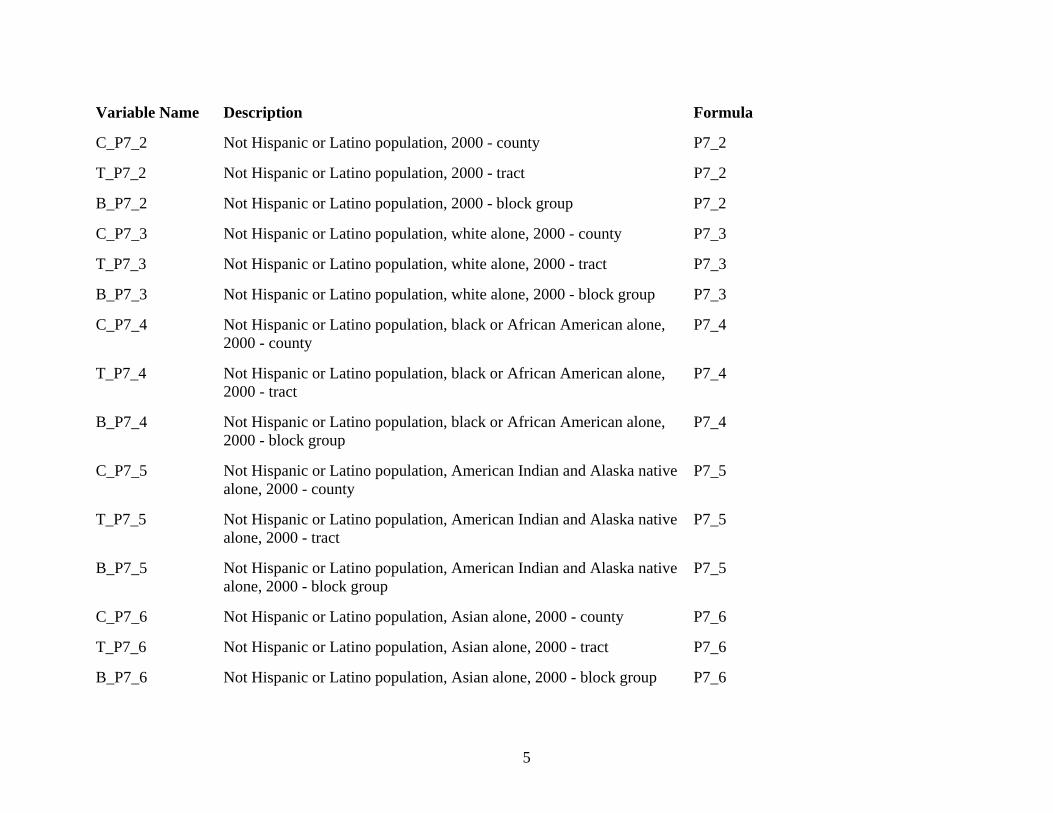
5
Variable Name Description Formula
C_P7_2 Not Hispanic or Latino population, 2000 - county P7_2
T_P7_2 Not Hispanic or Latino population, 2000 - tract P7_2
B_P7_2 Not Hispanic or Latino population, 2000 - block group P7_2
C_P7_3 Not Hispanic or Latino population, white alone, 2000 - county P7_3
T_P7_3 Not Hispanic or Latino population, white alone, 2000 - tract P7_3
B_P7_3 Not Hispanic or Latino population, white alone, 2000 - block group P7_3
C_P7_4 Not Hispanic or Latino population, black or African American alone, 2000 - county
P7_4
T_P7_4 Not Hispanic or Latino population, black or African American alone, 2000 - tract
P7_4
B_P7_4 Not Hispanic or Latino population, black or African American alone, 2000 - block group
P7_4
C_P7_5 Not Hispanic or Latino population, American Indian and Alaska native alone, 2000 - county
P7_5
T_P7_5 Not Hispanic or Latino population, American Indian and Alaska native alone, 2000 - tract
P7_5
B_P7_5 Not Hispanic or Latino population, American Indian and Alaska native alone, 2000 - block group
P7_5
C_P7_6 Not Hispanic or Latino population, Asian alone, 2000 - county P7_6
T_P7_6 Not Hispanic or Latino population, Asian alone, 2000 - tract P7_6
B_P7_6 Not Hispanic or Latino population, Asian alone, 2000 - block group P7_6
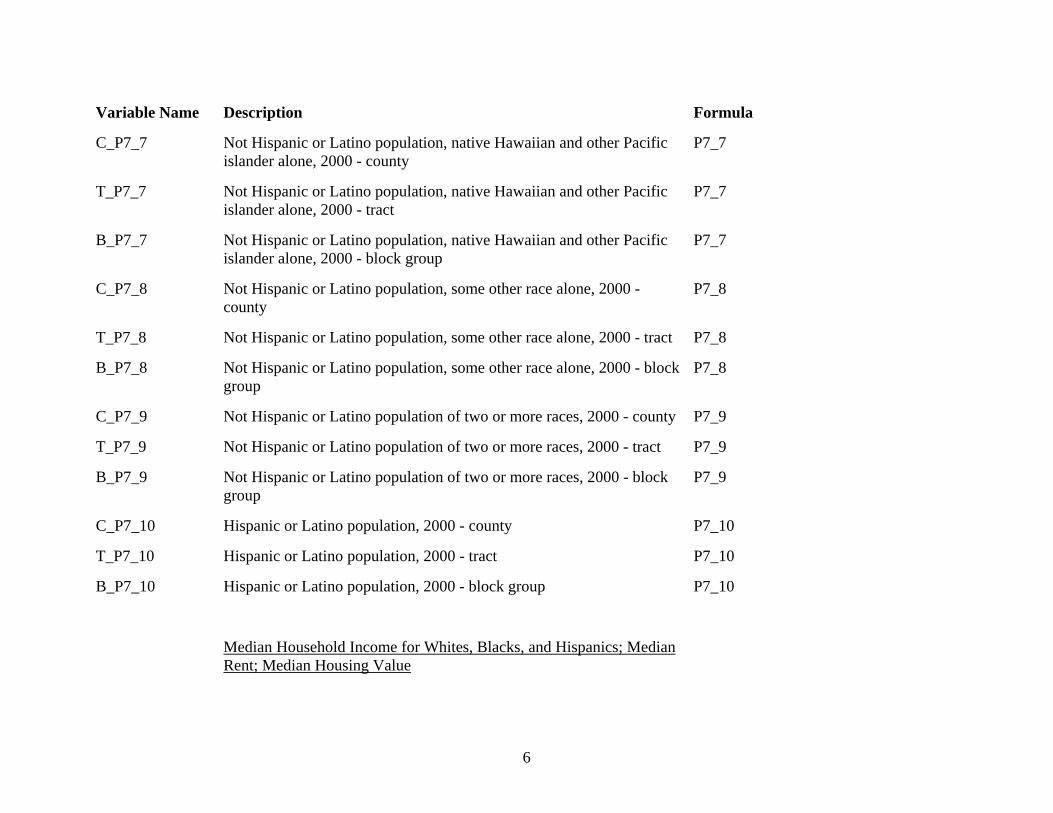
6
Variable Name Description Formula
C_P7_7 Not Hispanic or Latino population, native Hawaiian and other Pacific islander alone, 2000 - county
P7_7
T_P7_7 Not Hispanic or Latino population, native Hawaiian and other Pacific islander alone, 2000 - tract
P7_7
B_P7_7 Not Hispanic or Latino population, native Hawaiian and other Pacific islander alone, 2000 - block group
P7_7
C_P7_8 Not Hispanic or Latino population, some other race alone, 2000 - county
P7_8
T_P7_8 Not Hispanic or Latino population, some other race alone, 2000 - tract P7_8
B_P7_8 Not Hispanic or Latino population, some other race alone, 2000 - block group
P7_8
C_P7_9 Not Hispanic or Latino population of two or more races, 2000 - county P7_9
T_P7_9 Not Hispanic or Latino population of two or more races, 2000 - tract P7_9
B_P7_9 Not Hispanic or Latino population of two or more races, 2000 - block group
P7_9
C_P7_10 Hispanic or Latino population, 2000 - county P7_10
T_P7_10 Hispanic or Latino population, 2000 - tract P7_10
B_P7_10 Hispanic or Latino population, 2000 - block group P7_10
Median Household Income for Whites, Blacks, and Hispanics; Median Rent; Median Housing Value
7
Variable Name Description Formula
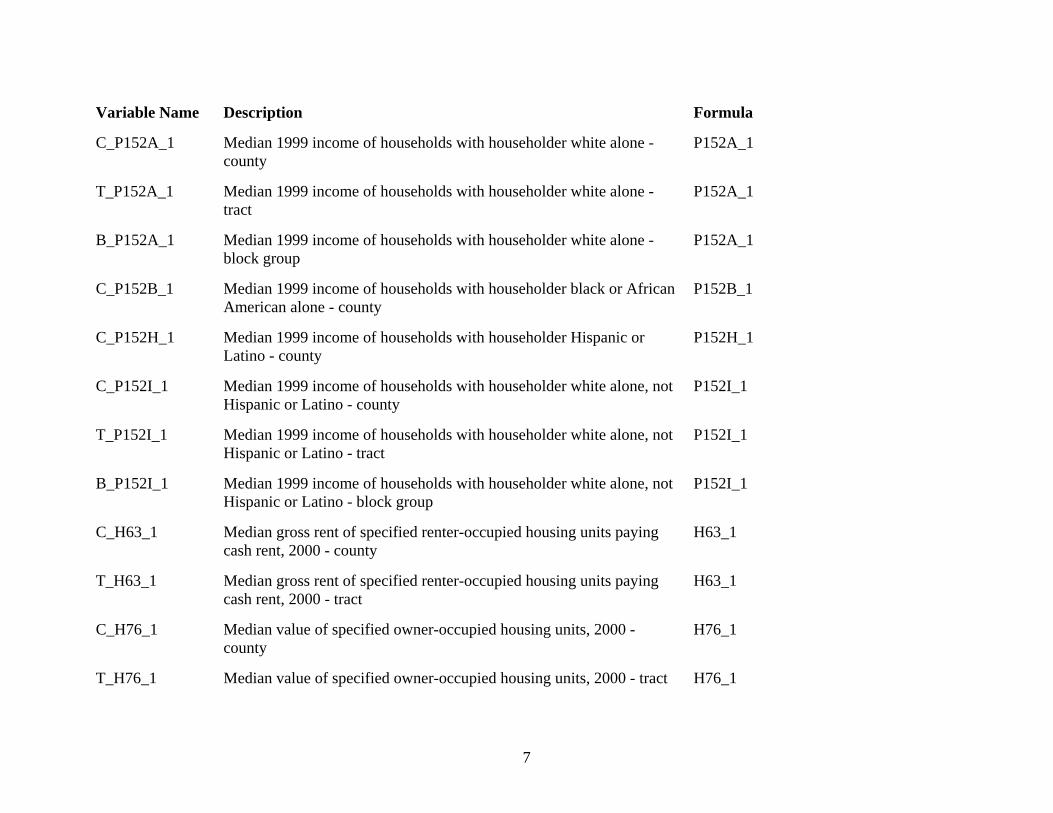
C_P152A_1 Median 1999 income of households with householder white alone - county
P152A_1
T_P152A_1 Median 1999 income of households with householder white alone - tract
P152A_1
B_P152A_1 Median 1999 income of households with householder white alone - block group
P152A_1
C_P152B_1 Median 1999 income of households with householder black or African American alone - county
P152B_1
C_P152H_1 Median 1999 income of households with householder Hispanic or Latino - county
P152H_1
C_P152I_1 Median 1999 income of households with householder white alone, not Hispanic or Latino - county
P152I_1
T_P152I_1 Median 1999 income of households with householder white alone, not Hispanic or Latino - tract
P152I_1
B_P152I_1 Median 1999 income of households with householder white alone, not Hispanic or Latino - block group
P152I_1
C_H63_1 Median gross rent of specified renter-occupied housing units paying cash rent, 2000 - county
H63_1
T_H63_1 Median gross rent of specified renter-occupied housing units paying cash rent, 2000 - tract
H63_1
C_H76_1 Median value of specified owner-occupied housing units, 2000 - county
H76_1
T_H76_1 Median value of specified owner-occupied housing units, 2000 - tract H76_1
8
Variable Name Description Formula
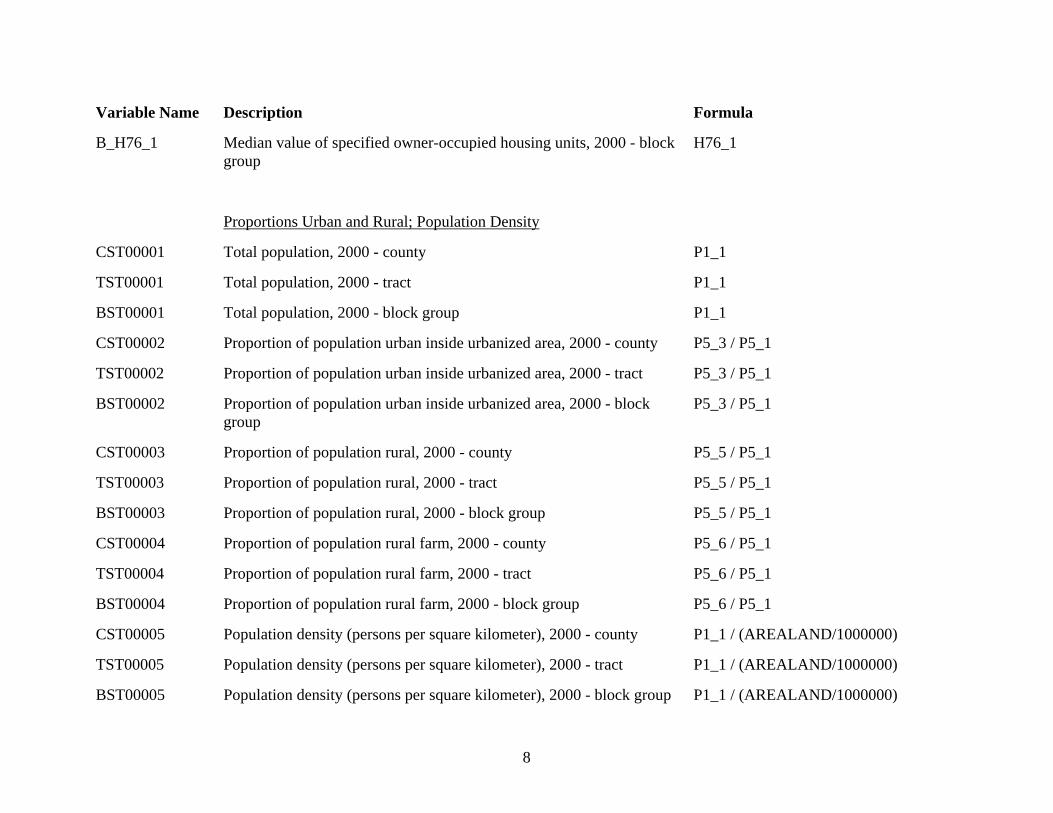
B_H76_1 Median value of specified owner-occupied housing units, 2000 - block group
H76_1
Proportions Urban and Rural; Population Density
CST00001 Total population, 2000 - county P1_1
TST00001 Total population, 2000 - tract P1_1
BST00001 Total population, 2000 - block group P1_1
CST00002 Proportion of population urban inside urbanized area, 2000 - county P5_3 / P5_1
TST00002 Proportion of population urban inside urbanized area, 2000 - tract P5_3 / P5_1
BST00002 Proportion of population urban inside urbanized area, 2000 - block group
P5_3 / P5_1
CST00003 Proportion of population rural, 2000 - county P5_5 / P5_1
TST00003 Proportion of population rural, 2000 - tract P5_5 / P5_1
BST00003 Proportion of population rural, 2000 - block group P5_5 / P5_1
CST00004 Proportion of population rural farm, 2000 - county P5_6 / P5_1
TST00004 Proportion of population rural farm, 2000 - tract P5_6 / P5_1
BST00004 Proportion of population rural farm, 2000 - block group P5_6 / P5_1
CST00005 Population density (persons per square kilometer), 2000 - county P1_1 / (AREALAND/1000000)
TST00005 Population density (persons per square kilometer), 2000 - tract P1_1 / (AREALAND/1000000)
BST00005 Population density (persons per square kilometer), 2000 - block group P1_1 / (AREALAND/1000000)
9
Variable Name Description Formula
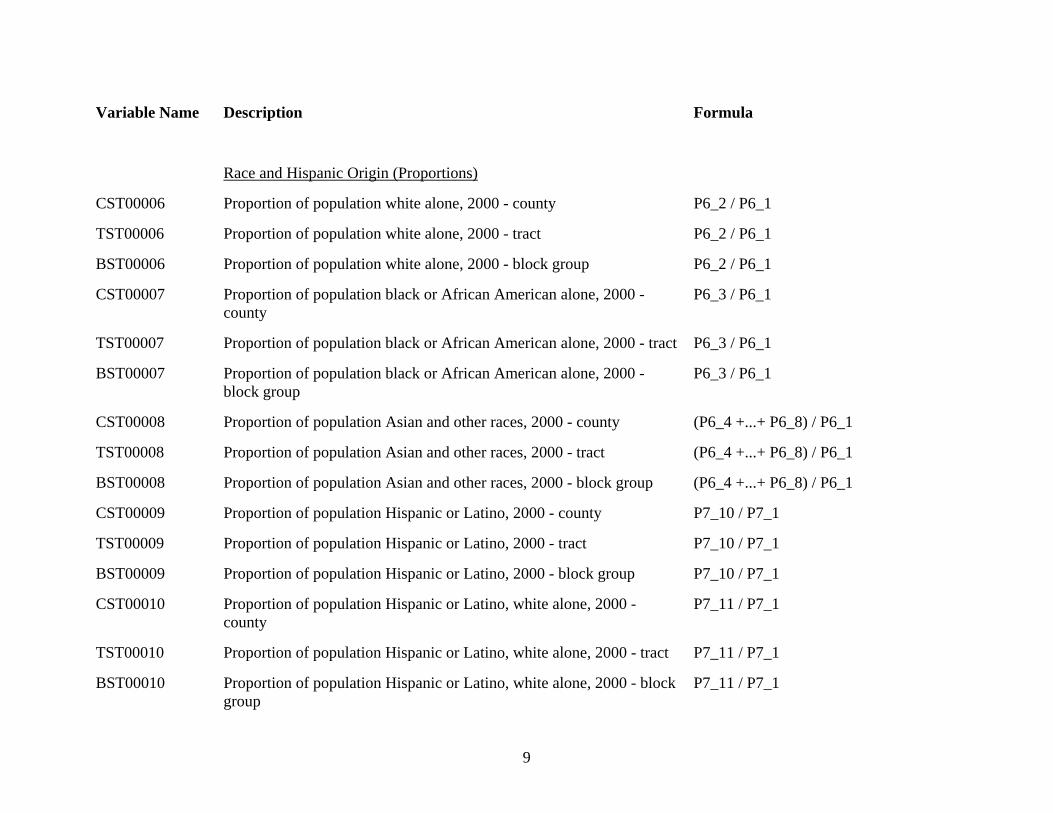
Race and Hispanic Origin (Proportions)
CST00006 Proportion of population white alone, 2000 - county P6_2 / P6_1
TST00006 Proportion of population white alone, 2000 - tract P6_2 / P6_1
BST00006 Proportion of population white alone, 2000 - block group P6_2 / P6_1
CST00007 Proportion of population black or African American alone, 2000 - county
P6_3 / P6_1
TST00007 Proportion of population black or African American alone, 2000 - tract P6_3 / P6_1
BST00007 Proportion of population black or African American alone, 2000 - block group
P6_3 / P6_1
CST00008 Proportion of population Asian and other races, 2000 - county (P6_4 +...+ P6_8) / P6_1
TST00008 Proportion of population Asian and other races, 2000 - tract (P6_4 +...+ P6_8) / P6_1
BST00008 Proportion of population Asian and other races, 2000 - block group (P6_4 +...+ P6_8) / P6_1
CST00009 Proportion of population Hispanic or Latino, 2000 - county P7_10 / P7_1
TST00009 Proportion of population Hispanic or Latino, 2000 - tract P7_10 / P7_1
BST00009 Proportion of population Hispanic or Latino, 2000 - block group P7_10 / P7_1
CST00010 Proportion of population Hispanic or Latino, white alone, 2000 - county
P7_11 / P7_1
TST00010 Proportion of population Hispanic or Latino, white alone, 2000 - tract P7_11 / P7_1
BST00010 Proportion of population Hispanic or Latino, white alone, 2000 - block group
P7_11 / P7_1
10
Variable Name Description Formula
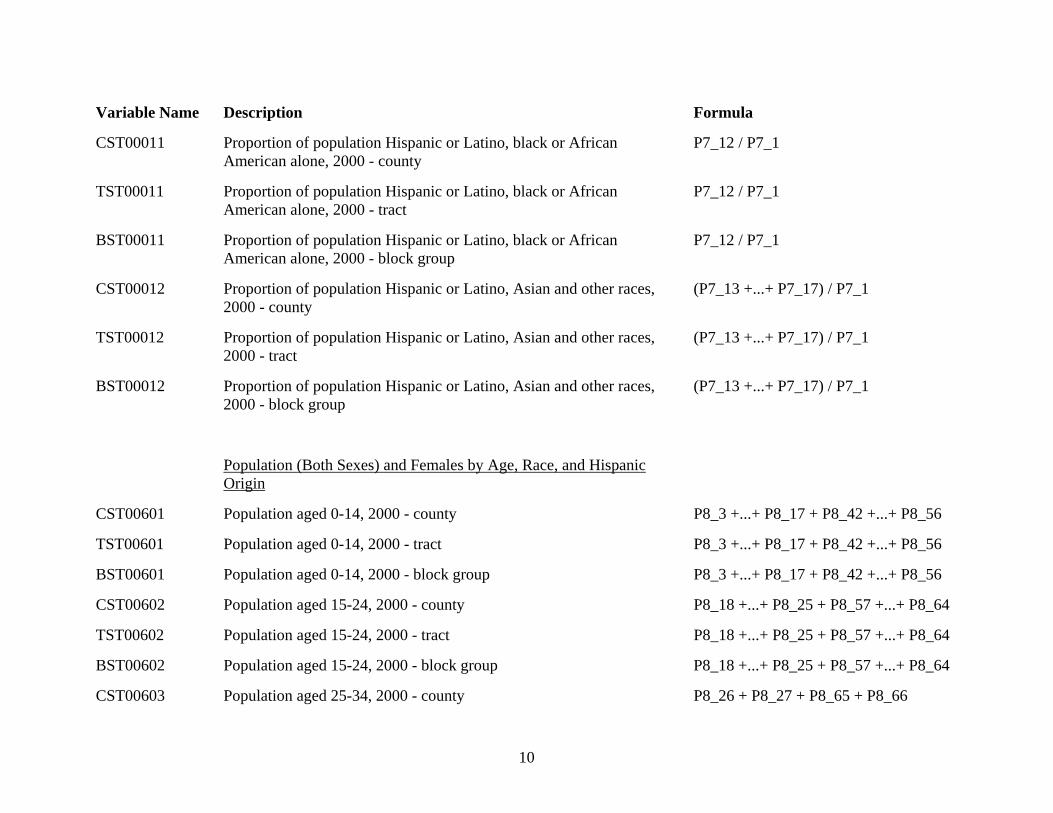
CST00011 Proportion of population Hispanic or Latino, black or African American alone, 2000 - county
P7_12 / P7_1
TST00011 Proportion of population Hispanic or Latino, black or African American alone, 2000 - tract
P7_12 / P7_1
BST00011 Proportion of population Hispanic or Latino, black or African American alone, 2000 - block group
P7_12 / P7_1
CST00012 Proportion of population Hispanic or Latino, Asian and other races, 2000 - county
(P7_13 +...+ P7_17) / P7_1
TST00012 Proportion of population Hispanic or Latino, Asian and other races, 2000 - tract
(P7_13 +...+ P7_17) / P7_1
BST00012 Proportion of population Hispanic or Latino, Asian and other races, 2000 - block group
(P7_13 +...+ P7_17) / P7_1
Population (Both Sexes) and Females by Age, Race, and Hispanic Origin
CST00601 Population aged 0-14, 2000 - county P8_3 +...+ P8_17 + P8_42 +...+ P8_56
TST00601 Population aged 0-14, 2000 - tract P8_3 +...+ P8_17 + P8_42 +...+ P8_56
BST00601 Population aged 0-14, 2000 - block group P8_3 +...+ P8_17 + P8_42 +...+ P8_56
CST00602 Population aged 15-24, 2000 - county P8_18 +...+ P8_25 + P8_57 +...+ P8_64
TST00602 Population aged 15-24, 2000 - tract P8_18 +...+ P8_25 + P8_57 +...+ P8_64
BST00602 Population aged 15-24, 2000 - block group P8_18 +...+ P8_25 + P8_57 +...+ P8_64
CST00603 Population aged 25-34, 2000 - county P8_26 + P8_27 + P8_65 + P8_66
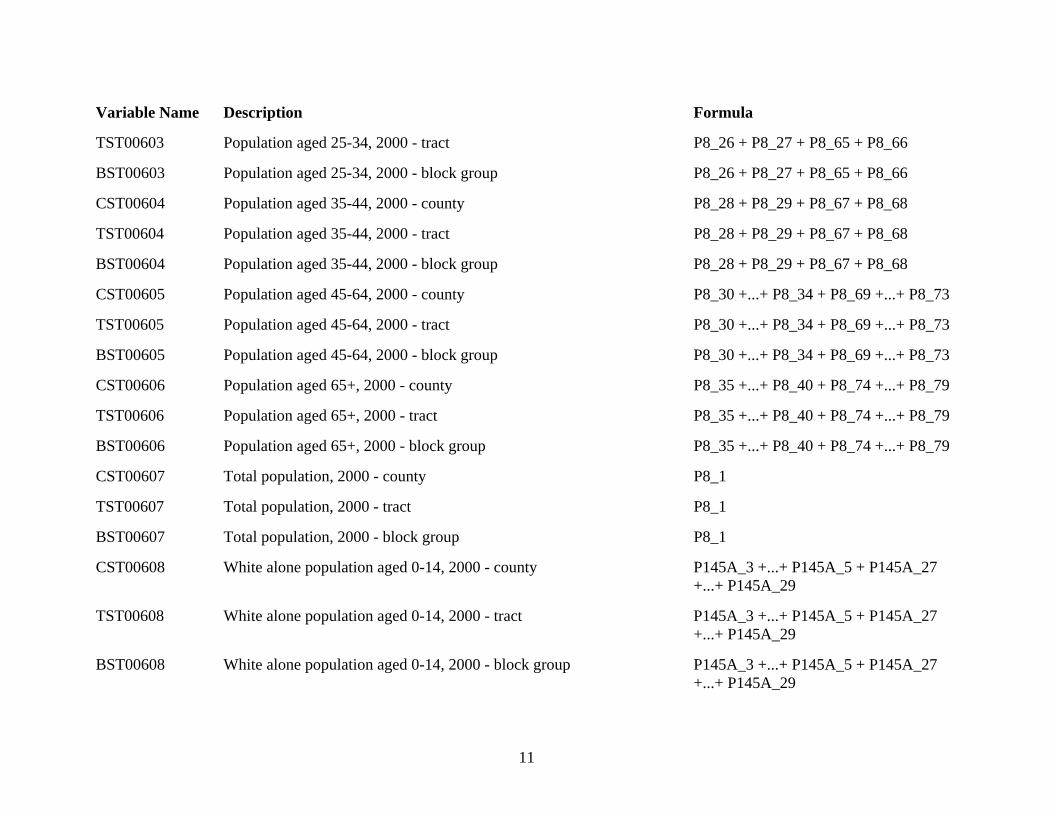
11
Variable Name Description Formula
TST00603 Population aged 25-34, 2000 - tract P8_26 + P8_27 + P8_65 + P8_66
BST00603 Population aged 25-34, 2000 - block group P8_26 + P8_27 + P8_65 + P8_66
CST00604 Population aged 35-44, 2000 - county P8_28 + P8_29 + P8_67 + P8_68
TST00604 Population aged 35-44, 2000 - tract P8_28 + P8_29 + P8_67 + P8_68
BST00604 Population aged 35-44, 2000 - block group P8_28 + P8_29 + P8_67 + P8_68
CST00605 Population aged 45-64, 2000 - county P8_30 +...+ P8_34 + P8_69 +...+ P8_73
TST00605 Population aged 45-64, 2000 - tract P8_30 +...+ P8_34 + P8_69 +...+ P8_73
BST00605 Population aged 45-64, 2000 - block group P8_30 +...+ P8_34 + P8_69 +...+ P8_73
CST00606 Population aged 65+, 2000 - county P8_35 +...+ P8_40 + P8_74 +...+ P8_79
TST00606 Population aged 65+, 2000 - tract P8_35 +...+ P8_40 + P8_74 +...+ P8_79
BST00606 Population aged 65+, 2000 - block group P8_35 +...+ P8_40 + P8_74 +...+ P8_79
CST00607 Total population, 2000 - county P8_1
TST00607 Total population, 2000 - tract P8_1
BST00607 Total population, 2000 - block group P8_1
CST00608 White alone population aged 0-14, 2000 - county P145A_3 +...+ P145A_5 + P145A_27 +...+ P145A_29
TST00608 White alone population aged 0-14, 2000 - tract P145A_3 +...+ P145A_5 + P145A_27 +...+ P145A_29
BST00608 White alone population aged 0-14, 2000 - block group P145A_3 +...+ P145A_5 + P145A_27 +...+ P145A_29
12
Variable Name Description Formula
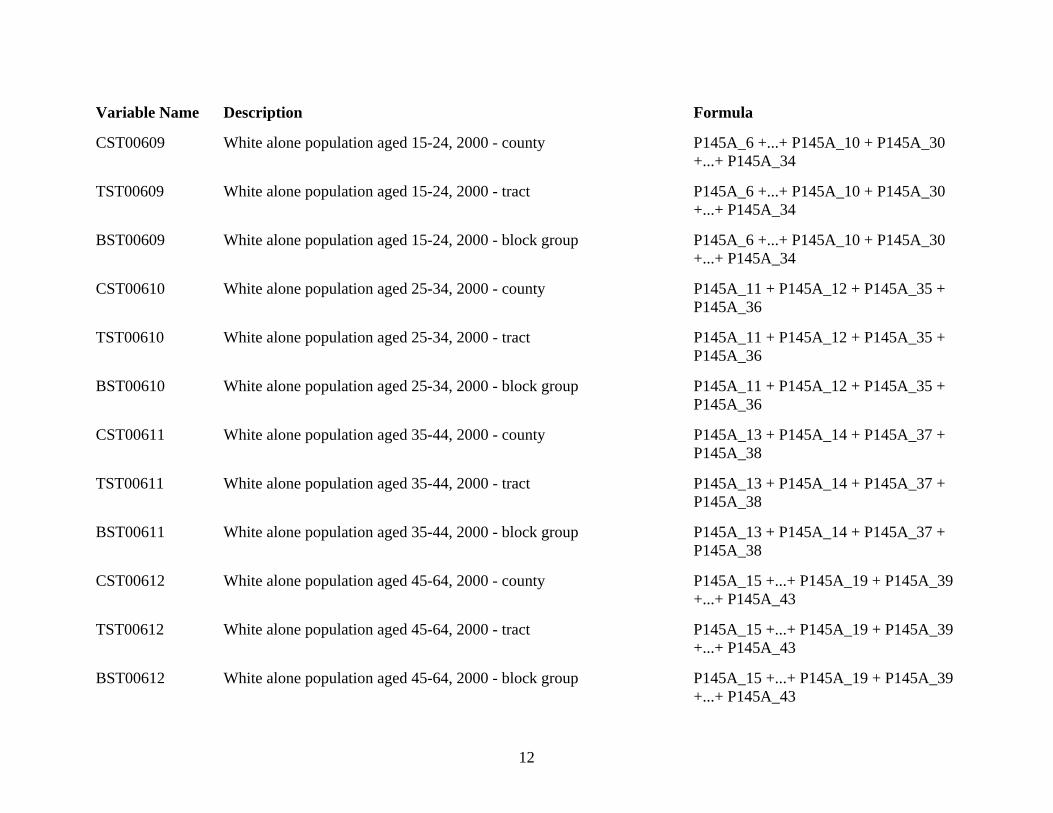
CST00609 White alone population aged 15-24, 2000 - county P145A_6 +...+ P145A_10 + P145A_30 +...+ P145A_34
TST00609 White alone population aged 15-24, 2000 - tract P145A_6 +...+ P145A_10 + P145A_30 +...+ P145A_34
BST00609 White alone population aged 15-24, 2000 - block group P145A_6 +...+ P145A_10 + P145A_30 +...+ P145A_34
CST00610 White alone population aged 25-34, 2000 - county P145A_11 + P145A_12 + P145A_35 + P145A_36
TST00610 White alone population aged 25-34, 2000 - tract P145A_11 + P145A_12 + P145A_35 + P145A_36
BST00610 White alone population aged 25-34, 2000 - block group P145A_11 + P145A_12 + P145A_35 + P145A_36
CST00611 White alone population aged 35-44, 2000 - county P145A_13 + P145A_14 + P145A_37 + P145A_38
TST00611 White alone population aged 35-44, 2000 - tract P145A_13 + P145A_14 + P145A_37 + P145A_38
BST00611 White alone population aged 35-44, 2000 - block group P145A_13 + P145A_14 + P145A_37 + P145A_38
CST00612 White alone population aged 45-64, 2000 - county P145A_15 +...+ P145A_19 + P145A_39 +...+ P145A_43
TST00612 White alone population aged 45-64, 2000 - tract P145A_15 +...+ P145A_19 + P145A_39 +...+ P145A_43
BST00612 White alone population aged 45-64, 2000 - block group P145A_15 +...+ P145A_19 + P145A_39 +...+ P145A_43
13
Variable Name Description Formula
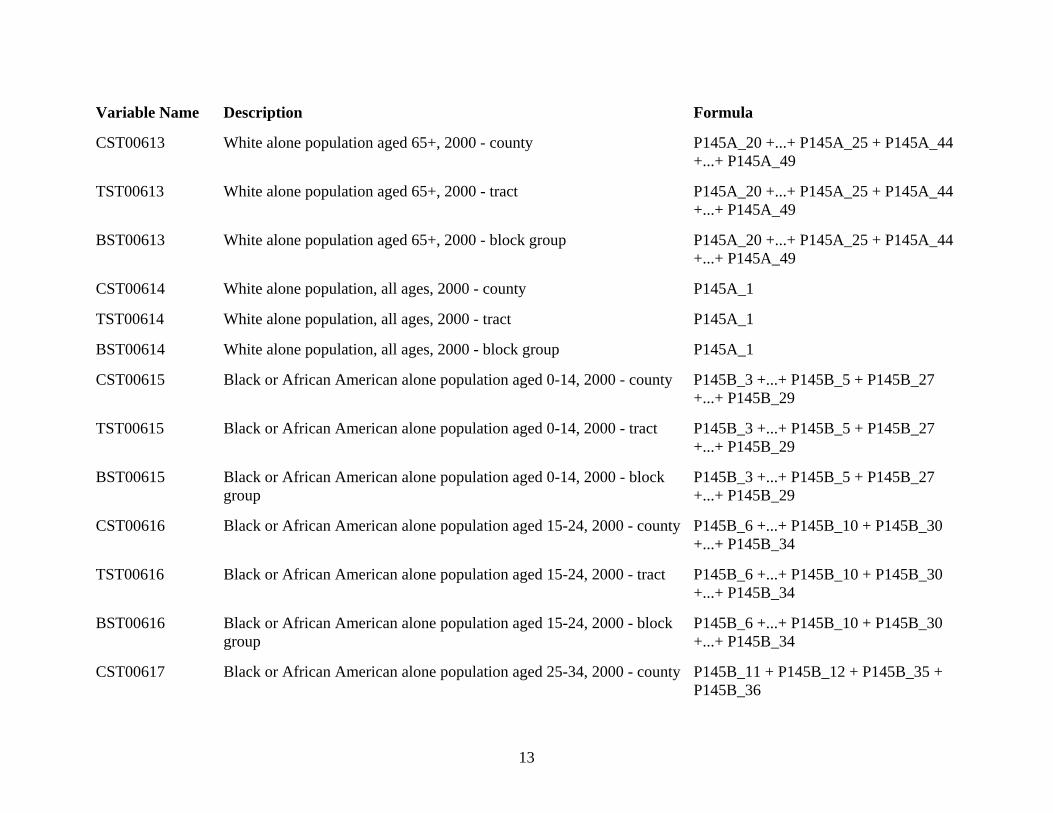
CST00613 White alone population aged 65+, 2000 - county P145A_20 +...+ P145A_25 + P145A_44 +...+ P145A_49
TST00613 White alone population aged 65+, 2000 - tract P145A_20 +...+ P145A_25 + P145A_44 +...+ P145A_49
BST00613 White alone population aged 65+, 2000 - block group P145A_20 +...+ P145A_25 + P145A_44 +...+ P145A_49
CST00614 White alone population, all ages, 2000 - county P145A_1
TST00614 White alone population, all ages, 2000 - tract P145A_1
BST00614 White alone population, all ages, 2000 - block group P145A_1
CST00615 Black or African American alone population aged 0-14, 2000 - county P145B_3 +...+ P145B_5 + P145B_27 +...+ P145B_29
TST00615 Black or African American alone population aged 0-14, 2000 - tract P145B_3 +...+ P145B_5 + P145B_27 +...+ P145B_29
BST00615 Black or African American alone population aged 0-14, 2000 - block group
P145B_3 +...+ P145B_5 + P145B_27 +...+ P145B_29
CST00616 Black or African American alone population aged 15-24, 2000 - county P145B_6 +...+ P145B_10 + P145B_30 +...+ P145B_34
TST00616 Black or African American alone population aged 15-24, 2000 - tract P145B_6 +...+ P145B_10 + P145B_30 +...+ P145B_34
BST00616 Black or African American alone population aged 15-24, 2000 - block group
P145B_6 +...+ P145B_10 + P145B_30 +...+ P145B_34
CST00617 Black or African American alone population aged 25-34, 2000 - county P145B_11 + P145B_12 + P145B_35 + P145B_36
14
Variable Name Description Formula
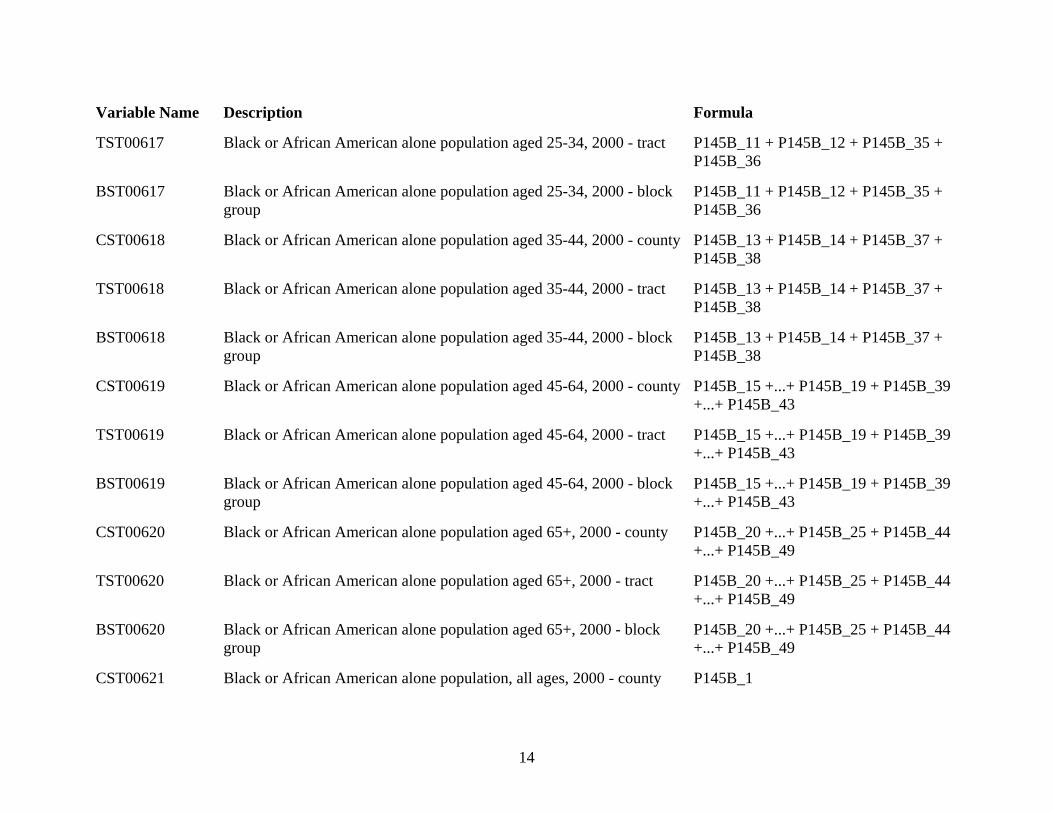
TST00617 Black or African American alone population aged 25-34, 2000 - tract P145B_11 + P145B_12 + P145B_35 + P145B_36
BST00617 Black or African American alone population aged 25-34, 2000 - block group
P145B_11 + P145B_12 + P145B_35 + P145B_36
CST00618 Black or African American alone population aged 35-44, 2000 - county P145B_13 + P145B_14 + P145B_37 + P145B_38
TST00618 Black or African American alone population aged 35-44, 2000 - tract P145B_13 + P145B_14 + P145B_37 + P145B_38
BST00618 Black or African American alone population aged 35-44, 2000 - block group
P145B_13 + P145B_14 + P145B_37 + P145B_38
CST00619 Black or African American alone population aged 45-64, 2000 - county P145B_15 +...+ P145B_19 + P145B_39 +...+ P145B_43
TST00619 Black or African American alone population aged 45-64, 2000 - tract P145B_15 +...+ P145B_19 + P145B_39 +...+ P145B_43
BST00619 Black or African American alone population aged 45-64, 2000 - block group
P145B_15 +...+ P145B_19 + P145B_39 +...+ P145B_43
CST00620 Black or African American alone population aged 65+, 2000 - county P145B_20 +...+ P145B_25 + P145B_44 +...+ P145B_49
TST00620 Black or African American alone population aged 65+, 2000 - tract P145B_20 +...+ P145B_25 + P145B_44 +...+ P145B_49
BST00620 Black or African American alone population aged 65+, 2000 - block group
P145B_20 +...+ P145B_25 + P145B_44 +...+ P145B_49
CST00621 Black or African American alone population, all ages, 2000 - county P145B_1
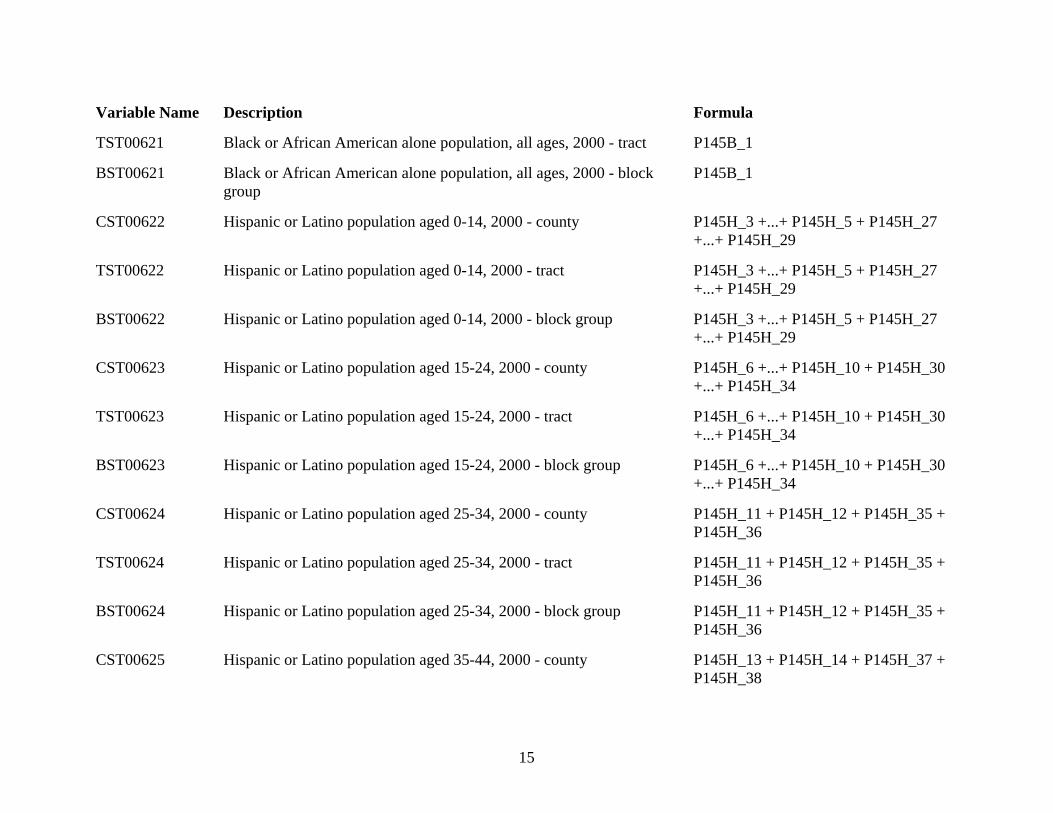
15
Variable Name Description Formula
TST00621 Black or African American alone population, all ages, 2000 - tract P145B_1
BST00621 Black or African American alone population, all ages, 2000 - block group
P145B_1
CST00622 Hispanic or Latino population aged 0-14, 2000 - county P145H_3 +...+ P145H_5 + P145H_27 +...+ P145H_29
TST00622 Hispanic or Latino population aged 0-14, 2000 - tract P145H_3 +...+ P145H_5 + P145H_27 +...+ P145H_29
BST00622 Hispanic or Latino population aged 0-14, 2000 - block group P145H_3 +...+ P145H_5 + P145H_27 +...+ P145H_29
CST00623 Hispanic or Latino population aged 15-24, 2000 - county P145H_6 +...+ P145H_10 + P145H_30 +...+ P145H_34
TST00623 Hispanic or Latino population aged 15-24, 2000 - tract P145H_6 +...+ P145H_10 + P145H_30 +...+ P145H_34
BST00623 Hispanic or Latino population aged 15-24, 2000 - block group P145H_6 +...+ P145H_10 + P145H_30 +...+ P145H_34
CST00624 Hispanic or Latino population aged 25-34, 2000 - county P145H_11 + P145H_12 + P145H_35 + P145H_36
TST00624 Hispanic or Latino population aged 25-34, 2000 - tract P145H_11 + P145H_12 + P145H_35 + P145H_36
BST00624 Hispanic or Latino population aged 25-34, 2000 - block group P145H_11 + P145H_12 + P145H_35 + P145H_36
CST00625 Hispanic or Latino population aged 35-44, 2000 - county P145H_13 + P145H_14 + P145H_37 + P145H_38
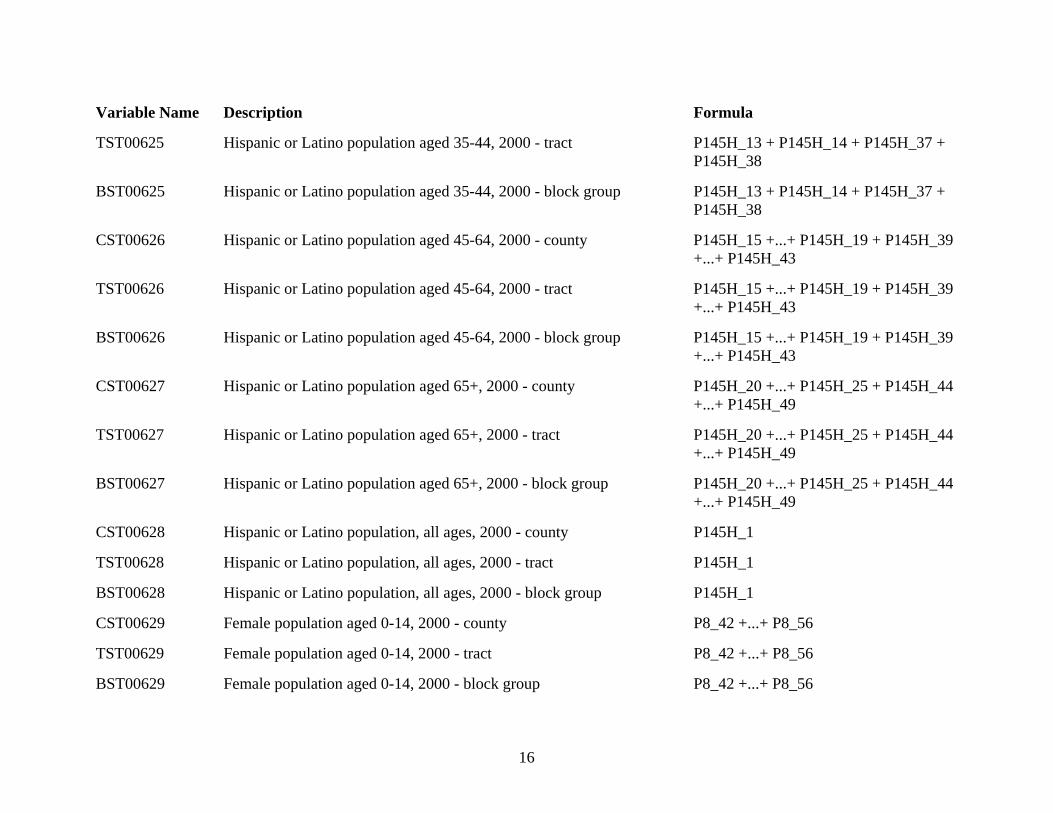
16
Variable Name Description Formula
TST00625 Hispanic or Latino population aged 35-44, 2000 - tract P145H_13 + P145H_14 + P145H_37 + P145H_38
BST00625 Hispanic or Latino population aged 35-44, 2000 - block group P145H_13 + P145H_14 + P145H_37 + P145H_38
CST00626 Hispanic or Latino population aged 45-64, 2000 - county P145H_15 +...+ P145H_19 + P145H_39 +...+ P145H_43
TST00626 Hispanic or Latino population aged 45-64, 2000 - tract P145H_15 +...+ P145H_19 + P145H_39 +...+ P145H_43
BST00626 Hispanic or Latino population aged 45-64, 2000 - block group P145H_15 +...+ P145H_19 + P145H_39 +...+ P145H_43
CST00627 Hispanic or Latino population aged 65+, 2000 - county P145H_20 +...+ P145H_25 + P145H_44 +...+ P145H_49
TST00627 Hispanic or Latino population aged 65+, 2000 - tract P145H_20 +...+ P145H_25 + P145H_44 +...+ P145H_49
BST00627 Hispanic or Latino population aged 65+, 2000 - block group P145H_20 +...+ P145H_25 + P145H_44 +...+ P145H_49
CST00628 Hispanic or Latino population, all ages, 2000 - county P145H_1
TST00628 Hispanic or Latino population, all ages, 2000 - tract P145H_1
BST00628 Hispanic or Latino population, all ages, 2000 - block group P145H_1
CST00629 Female population aged 0-14, 2000 - county P8_42 +...+ P8_56
TST00629 Female population aged 0-14, 2000 - tract P8_42 +...+ P8_56
BST00629 Female population aged 0-14, 2000 - block group P8_42 +...+ P8_56
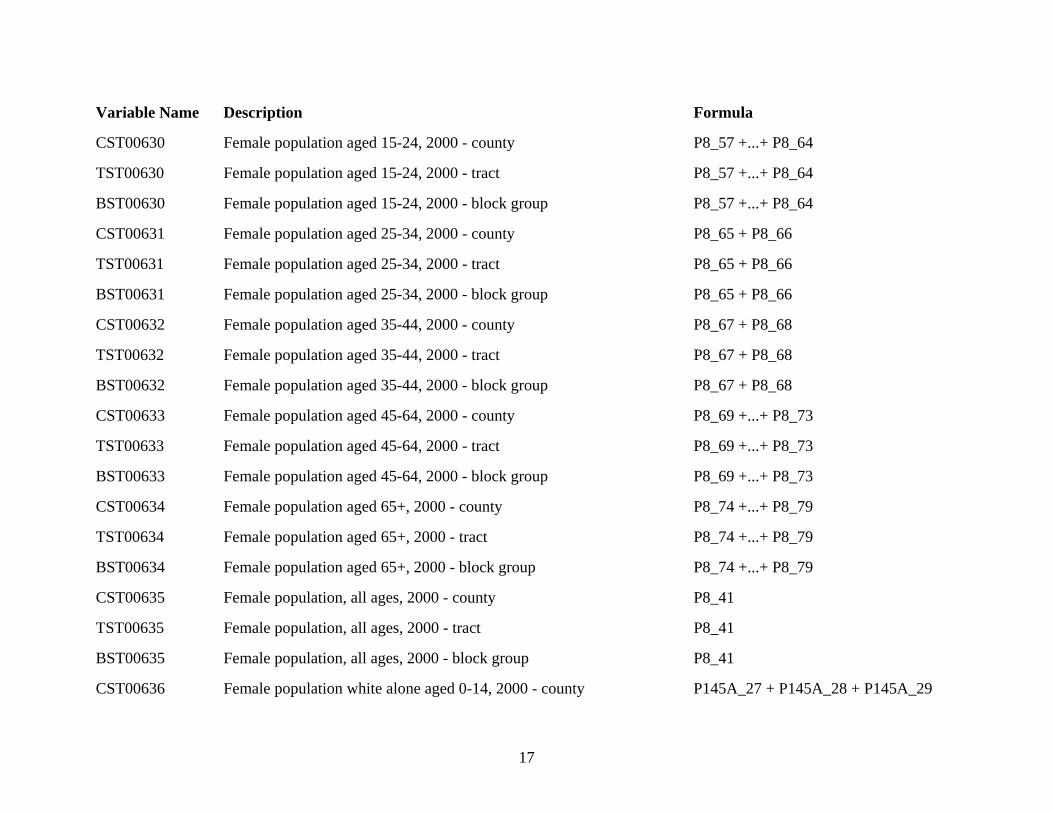
17
Variable Name Description Formula
CST00630 Female population aged 15-24, 2000 - county P8_57 +...+ P8_64
TST00630 Female population aged 15-24, 2000 - tract P8_57 +...+ P8_64
BST00630 Female population aged 15-24, 2000 - block group P8_57 +...+ P8_64
CST00631 Female population aged 25-34, 2000 - county P8_65 + P8_66
TST00631 Female population aged 25-34, 2000 - tract P8_65 + P8_66
BST00631 Female population aged 25-34, 2000 - block group P8_65 + P8_66
CST00632 Female population aged 35-44, 2000 - county P8_67 + P8_68
TST00632 Female population aged 35-44, 2000 - tract P8_67 + P8_68
BST00632 Female population aged 35-44, 2000 - block group P8_67 + P8_68
CST00633 Female population aged 45-64, 2000 - county P8_69 +...+ P8_73
TST00633 Female population aged 45-64, 2000 - tract P8_69 +...+ P8_73
BST00633 Female population aged 45-64, 2000 - block group P8_69 +...+ P8_73
CST00634 Female population aged 65+, 2000 - county P8_74 +...+ P8_79
TST00634 Female population aged 65+, 2000 - tract P8_74 +...+ P8_79
BST00634 Female population aged 65+, 2000 - block group P8_74 +...+ P8_79
CST00635 Female population, all ages, 2000 - county P8_41
TST00635 Female population, all ages, 2000 - tract P8_41
BST00635 Female population, all ages, 2000 - block group P8_41
CST00636 Female population white alone aged 0-14, 2000 - county P145A_27 + P145A_28 + P145A_29
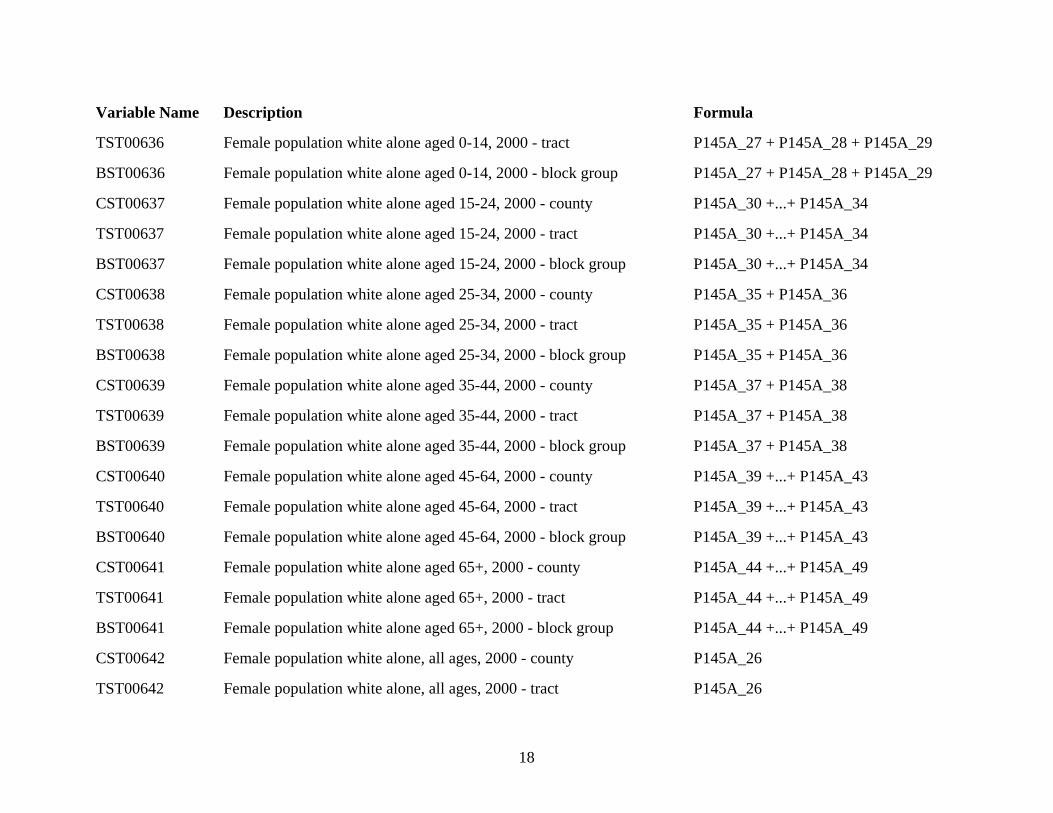
18
Variable Name Description Formula
TST00636 Female population white alone aged 0-14, 2000 - tract P145A_27 + P145A_28 + P145A_29
BST00636 Female population white alone aged 0-14, 2000 - block group P145A_27 + P145A_28 + P145A_29
CST00637 Female population white alone aged 15-24, 2000 - county P145A_30 +...+ P145A_34
TST00637 Female population white alone aged 15-24, 2000 - tract P145A_30 +...+ P145A_34
BST00637 Female population white alone aged 15-24, 2000 - block group P145A_30 +...+ P145A_34
CST00638 Female population white alone aged 25-34, 2000 - county P145A_35 + P145A_36
TST00638 Female population white alone aged 25-34, 2000 - tract P145A_35 + P145A_36
BST00638 Female population white alone aged 25-34, 2000 - block group P145A_35 + P145A_36
CST00639 Female population white alone aged 35-44, 2000 - county P145A_37 + P145A_38
TST00639 Female population white alone aged 35-44, 2000 - tract P145A_37 + P145A_38
BST00639 Female population white alone aged 35-44, 2000 - block group P145A_37 + P145A_38
CST00640 Female population white alone aged 45-64, 2000 - county P145A_39 +...+ P145A_43
TST00640 Female population white alone aged 45-64, 2000 - tract P145A_39 +...+ P145A_43
BST00640 Female population white alone aged 45-64, 2000 - block group P145A_39 +...+ P145A_43
CST00641 Female population white alone aged 65+, 2000 - county P145A_44 +...+ P145A_49
TST00641 Female population white alone aged 65+, 2000 - tract P145A_44 +...+ P145A_49
BST00641 Female population white alone aged 65+, 2000 - block group P145A_44 +...+ P145A_49
CST00642 Female population white alone, all ages, 2000 - county P145A_26
TST00642 Female population white alone, all ages, 2000 - tract P145A_26
19
Variable Name Description Formula
BST00642 Female population white alone, all ages, 2000 - block group P145A_26
CST00643 Female population black or African American alone aged 0-14, 2000 - county
P145B_27 +...+ P145B_29
TST00643 Female population black or African American alone aged 0-14, 2000 - tract
P145B_27 +...+ P145B_29
BST00643 Female population black or African American alone aged 0-14, 2000 - block group
P145B_27 +...+ P145B_29
CST00644 Female population black or African American alone aged 15-24, 2000 - county
P145B_30 +...+ P145B_34
TST00644 Female population black or African American alone aged 15-24, 2000 - tract
P145B_30 +...+ P145B_34
BST00644 Female population black or African American alone aged 15-24, 2000 - block group
P145B_30 +...+ P145B_34
CST00645 Female population black or African American alone aged 25-34, 2000 - county
P145B_35 + P145B_36
TST00645 Female population black or African American alone aged 25-34, 2000 - tract
P145B_35 + P145B_36
BST00645 Female population black or African American alone aged 25-34, 2000 - block group
P145B_35 + P145B_36
CST00646 Female population black or African American alone aged 35-44, 2000 - county
P145B_37 + P145B_38
TST00646 Female population black or African American alone aged 35-44, 2000 - tract
P145B_37 + P145B_38
20
Variable Name Description Formula
BST00646 Female population black or African American alone aged 35-44, 2000 - block group
P145B_37 + P145B_38
CST00647 Female population black or African American alone aged 45-64, 2000 - county
P145B_39 +...+ P145B_43
TST00647 Female population black or African American alone aged 45-64, 2000 - tract
P145B_39 +...+ P145B_43
BST00647 Female population black or African American alone aged 45-64, 2000 - block group
P145B_39 +...+ P145B_43
CST00648 Female population black or African American alone aged 65+, 2000 - county
P145B_44 +...+ P145B_49
TST00648 Female population black or African American alone aged 65+, 2000 - tract
P145B_44 +...+ P145B_49
BST00648 Female population black or African American alone aged 65+, 2000 - block group
P145B_44 +...+ P145B_49
CST00649 Female population black or African American alone, all ages, 2000 - county
P145B_26
TST00649 Female population black or African American alone, all ages, 2000 - tract
P145B_26
BST00649 Female population black or African American alone, all ages, 2000 - block group
P145B_26
CST00650 Female population Hispanic or Latino aged 0-14, 2000 - county P145H_27 +...+ P145H_29
TST00650 Female population Hispanic or Latino aged 0-14, 2000 - tract P145H_27 +...+ P145H_29
BST00650 Female population Hispanic or Latino aged 0-14, 2000 - block group P145H_27 +...+ P145H_29
21
Variable Name Description Formula
CST00651 Female population Hispanic or Latino aged 15-24, 2000 - county P145H_30 +...+ P145H_34
TST00651 Female population Hispanic or Latino aged 15-24, 2000 - tract P145H_30 +...+ P145H_34
BST00651 Female population Hispanic or Latino aged 15-24, 2000 - block group P145H_30 +...+ P145H_34
CST00652 Female population Hispanic or Latino aged 25-34, 2000 - county P145H_35 + P145H_36
TST00652 Female population Hispanic or Latino aged 25-34, 2000 - tract P145H_35 + P145H_36
BST00652 Female population Hispanic or Latino aged 25-34, 2000 - block group P145H_35 + P145H_36
CST00653 Female population Hispanic or Latino aged 35-44, 2000 - county P145H_37 + P145H_38
TST00653 Female population Hispanic or Latino aged 35-44, 2000 - tract P145H_37 + P145H_38
BST00653 Female population Hispanic or Latino aged 35-44, 2000 - block group P145H_37 + P145H_38
CST00654 Female population Hispanic or Latino aged 45-64, 2000 - county P145H_39 +...+ P145H_43
TST00654 Female population Hispanic or Latino aged 45-64, 2000 - tract P145H_39 +...+ P145H_43
BST00654 Female population Hispanic or Latino aged 45-64, 2000 - block group P145H_39 +...+ P145H_43
CST00655 Female population Hispanic or Latino aged 65+, 2000 - county P145H_44 +...+ P145H_49
TST00655 Female population Hispanic or Latino aged 65+, 2000 - tract P145H_44 +...+ P145H_49
BST00655 Female population Hispanic or Latino aged 65+, 2000 - block group P145H_44 +...+ P145H_49
CST00656 Female population Hispanic or Latino, all ages, 2000 - county P145H_26
TST00656 Female population Hispanic or Latino, all ages, 2000 - tract P145H_26
BST00656 Female population Hispanic or Latino, all ages, 2000 - block group P145H_26
22
Variable Name Description Formula
Marital Status, Nonmovers, and Foreign Born Population (Proportions)
CST00127 Proportion of males aged 15+ who were never married, 2000 - county P18_3 / P18_2
TST00127 Proportion of males aged 15+ who were never married, 2000 - tract P18_3 / P18_2
BST00127 Proportion of males aged 15+ who were never married, 2000 - block group
P18_3 / P18_2
CST00128 Proportion of males aged 15+ who are married, spouse present, 2000 - county
P18_5 / P18_2
TST00128 Proportion of males aged 15+ who are married, spouse present, 2000 - tract
P18_5 / P18_2
BST00128 Proportion of males aged 15+ who are married, spouse present, 2000 - block group
P18_5 / P18_2
CST00129 Proportion of males aged 15+ who are separated or divorced, 2000 - county
(P18_7 + P18_10) / P18_2
TST00129 Proportion of males aged 15+ who are separated or divorced, 2000 - tract
(P18_7 + P18_10) / P18_2
BST00129 Proportion of males aged 15+ who are separated or divorced, 2000 - block group
(P18_7 + P18_10) / P18_2
CST00130 Proportion of males aged 15+ ever married who are separated or divorced, 2000 - county
(P18_7 + P18_10) / (P18_4 + P18_9 + P18_10)
TST00130 Proportion of males aged 15+ ever married who are separated or divorced, 2000 - tract
(P18_7 + P18_10) / (P18_4 + P18_9 + P18_10)
BST00130 Proportion of males aged 15+ ever married who are separated or divorced, 2000 - block group
(P18_7 + P18_10) / (P18_4 + P18_9 + P18_10)
23
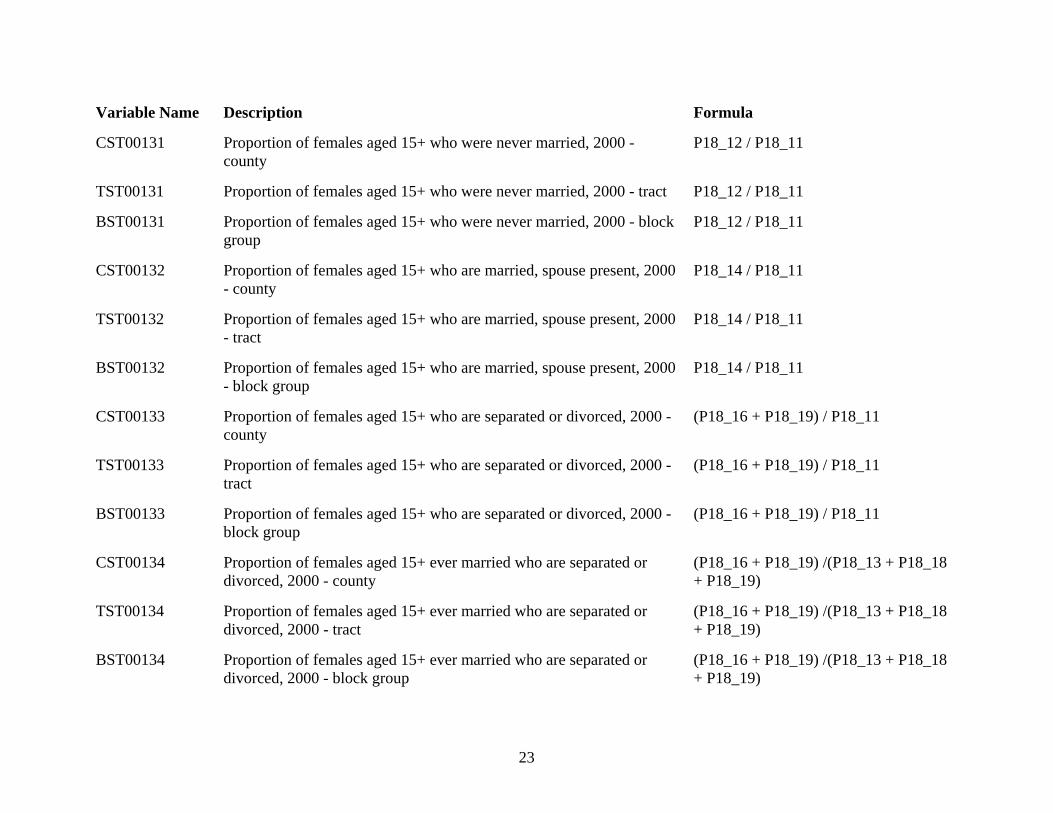
Variable Name Description Formula
CST00131 Proportion of females aged 15+ who were never married, 2000 - county
P18_12 / P18_11
TST00131 Proportion of females aged 15+ who were never married, 2000 - tract P18_12 / P18_11
BST00131 Proportion of females aged 15+ who were never married, 2000 - block group
P18_12 / P18_11
CST00132 Proportion of females aged 15+ who are married, spouse present, 2000 - county
P18_14 / P18_11
TST00132 Proportion of females aged 15+ who are married, spouse present, 2000 - tract
P18_14 / P18_11
BST00132 Proportion of females aged 15+ who are married, spouse present, 2000 - block group
P18_14 / P18_11
CST00133 Proportion of females aged 15+ who are separated or divorced, 2000 - county
(P18_16 + P18_19) / P18_11
TST00133 Proportion of females aged 15+ who are separated or divorced, 2000 - tract
(P18_16 + P18_19) / P18_11
BST00133 Proportion of females aged 15+ who are separated or divorced, 2000 - block group
(P18_16 + P18_19) / P18_11
CST00134 Proportion of females aged 15+ ever married who are separated or divorced, 2000 - county
(P18_16 + P18_19) /(P18_13 + P18_18 + P18_19)
TST00134 Proportion of females aged 15+ ever married who are separated or divorced, 2000 - tract
(P18_16 + P18_19) /(P18_13 + P18_18 + P18_19)
BST00134 Proportion of females aged 15+ ever married who are separated or divorced, 2000 - block group
(P18_16 + P18_19) /(P18_13 + P18_18 + P18_19)
24
Variable Name Description Formula
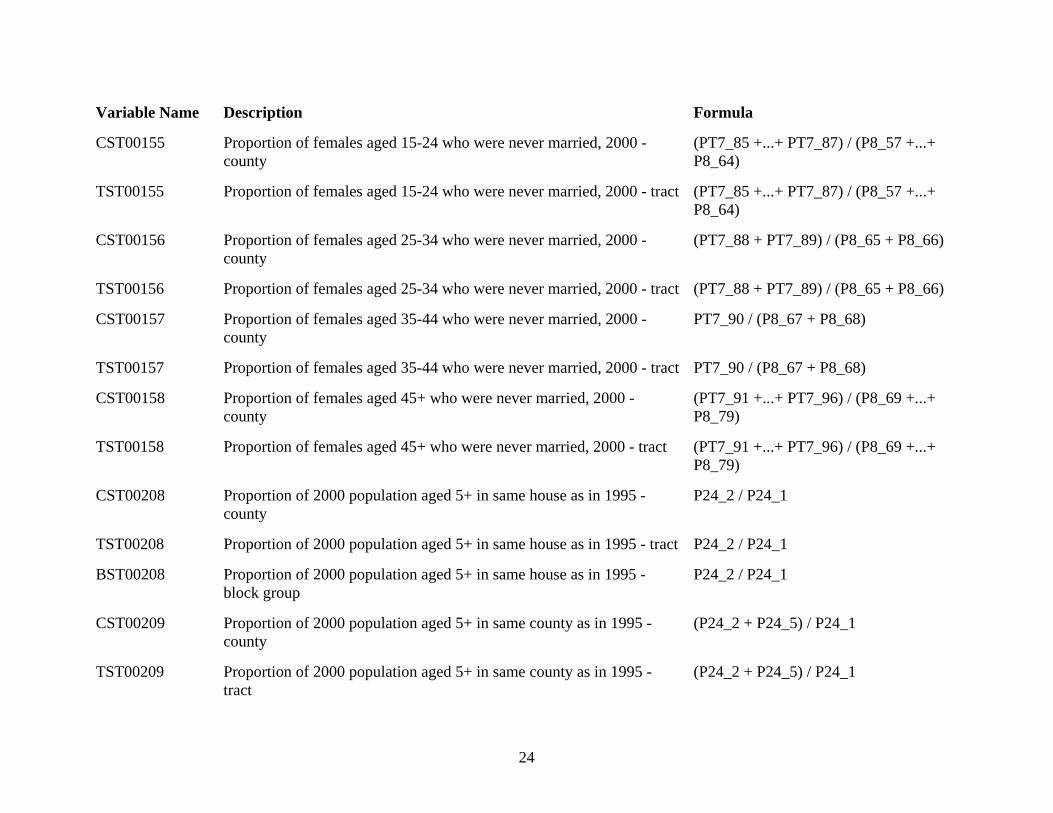
CST00155 Proportion of females aged 15-24 who were never married, 2000 - county
(PT7_85 +...+ PT7_87) / (P8_57 +...+ P8_64)
TST00155 Proportion of females aged 15-24 who were never married, 2000 - tract (PT7_85 +...+ PT7_87) / (P8_57 +...+ P8_64)
CST00156 Proportion of females aged 25-34 who were never married, 2000 - county
(PT7_88 + PT7_89) / (P8_65 + P8_66)
TST00156 Proportion of females aged 25-34 who were never married, 2000 - tract (PT7_88 + PT7_89) / (P8_65 + P8_66)
CST00157 Proportion of females aged 35-44 who were never married, 2000 - county
PT7_90 / (P8_67 + P8_68)
TST00157 Proportion of females aged 35-44 who were never married, 2000 - tract PT7_90 / (P8_67 + P8_68)
CST00158 Proportion of females aged 45+ who were never married, 2000 - county
(PT7_91 +...+ PT7_96) / (P8_69 +...+ P8_79)
TST00158 Proportion of females aged 45+ who were never married, 2000 - tract (PT7_91 +...+ PT7_96) / (P8_69 +...+ P8_79)
CST00208 Proportion of 2000 population aged 5+ in same house as in 1995 - county
P24_2 / P24_1
TST00208 Proportion of 2000 population aged 5+ in same house as in 1995 - tract P24_2 / P24_1
BST00208 Proportion of 2000 population aged 5+ in same house as in 1995 - block group
P24_2 / P24_1
CST00209 Proportion of 2000 population aged 5+ in same county as in 1995 - county
(P24_2 + P24_5) / P24_1
TST00209 Proportion of 2000 population aged 5+ in same county as in 1995 - tract
(P24_2 + P24_5) / P24_1
25
Variable Name Description Formula
BST00209 Proportion of 2000 population aged 5+ in same county as in 1995 - block group
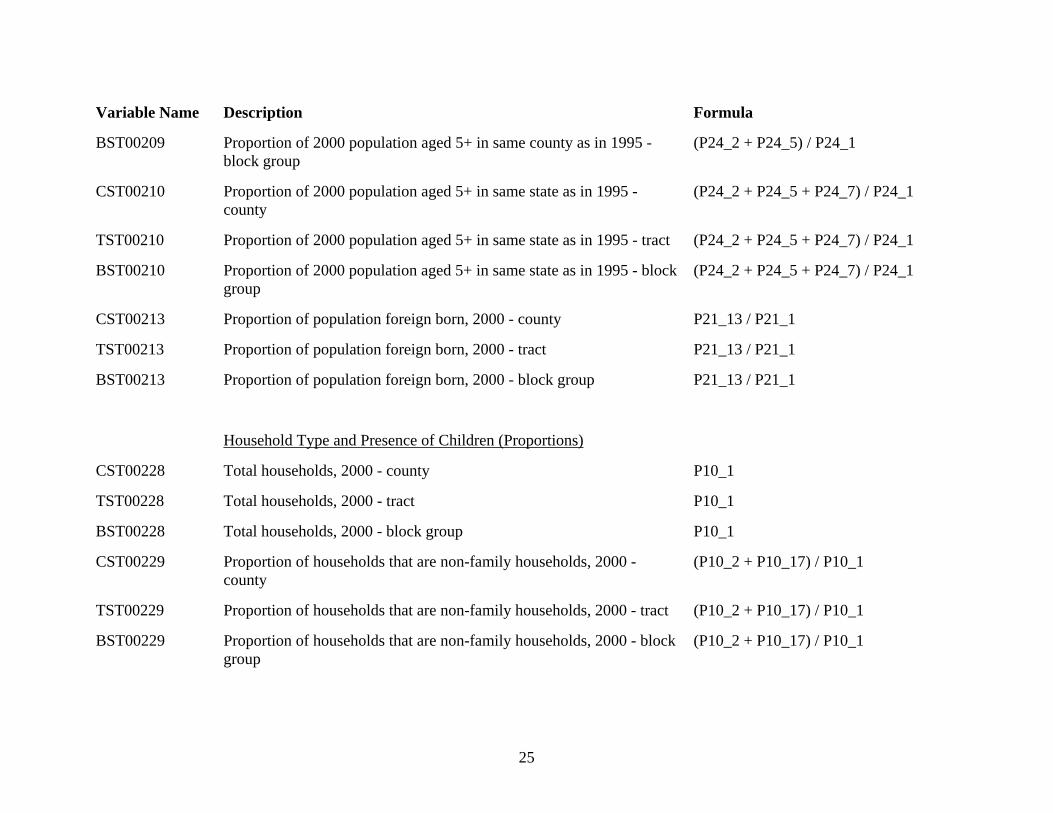
(P24_2 + P24_5) / P24_1
CST00210 Proportion of 2000 population aged 5+ in same state as in 1995 - county
(P24_2 + P24_5 + P24_7) / P24_1
TST00210 Proportion of 2000 population aged 5+ in same state as in 1995 - tract (P24_2 + P24_5 + P24_7) / P24_1
BST00210 Proportion of 2000 population aged 5+ in same state as in 1995 - block group
(P24_2 + P24_5 + P24_7) / P24_1
CST00213 Proportion of population foreign born, 2000 - county P21_13 / P21_1
TST00213 Proportion of population foreign born, 2000 - tract P21_13 / P21_1
BST00213 Proportion of population foreign born, 2000 - block group P21_13 / P21_1
Household Type and Presence of Children (Proportions)
CST00228 Total households, 2000 - county P10_1
TST00228 Total households, 2000 - tract P10_1
BST00228 Total households, 2000 - block group P10_1
CST00229 Proportion of households that are non-family households, 2000 - county
(P10_2 + P10_17) / P10_1
TST00229 Proportion of households that are non-family households, 2000 - tract (P10_2 + P10_17) / P10_1
BST00229 Proportion of households that are non-family households, 2000 - block group
(P10_2 + P10_17) / P10_1
26
Variable Name Description Formula
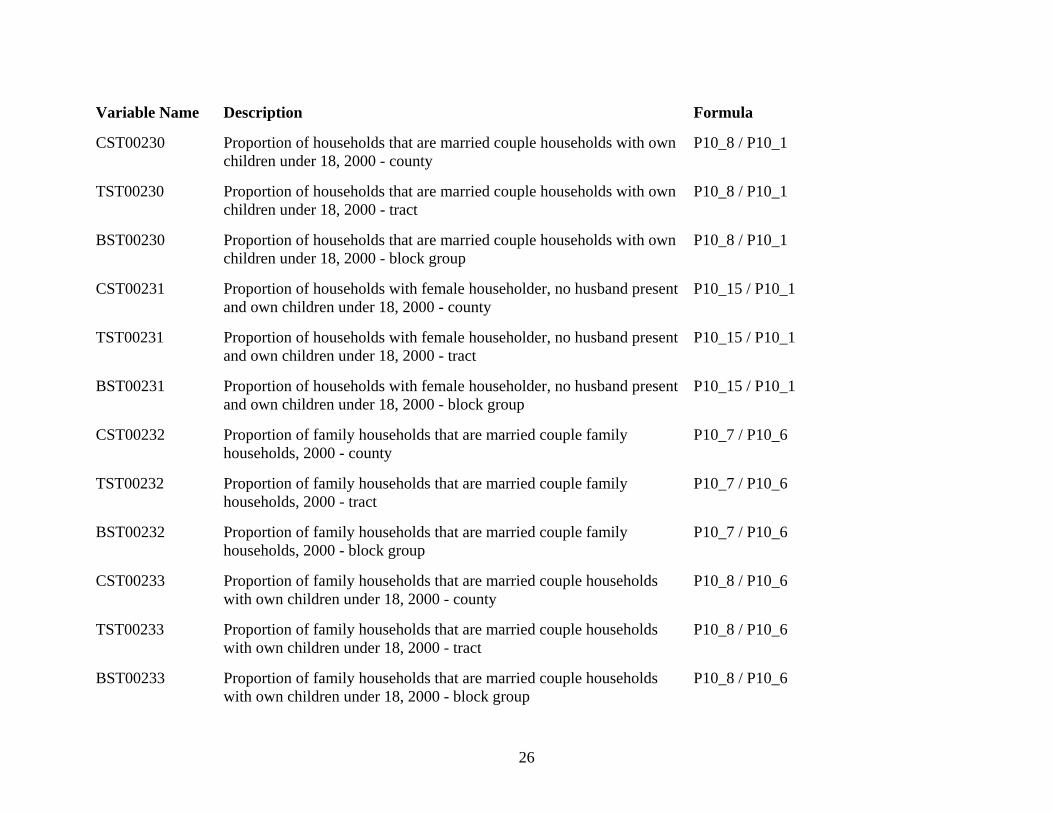
CST00230 Proportion of households that are married couple households with own children under 18, 2000 - county
P10_8 / P10_1
TST00230 Proportion of households that are married couple households with own children under 18, 2000 - tract
P10_8 / P10_1
BST00230 Proportion of households that are married couple households with own children under 18, 2000 - block group
P10_8 / P10_1
CST00231 Proportion of households with female householder, no husband present and own children under 18, 2000 - county
P10_15 / P10_1
TST00231 Proportion of households with female householder, no husband present and own children under 18, 2000 - tract
P10_15 / P10_1
BST00231 Proportion of households with female householder, no husband present and own children under 18, 2000 - block group
P10_15 / P10_1
CST00232 Proportion of family households that are married couple family households, 2000 - county
P10_7 / P10_6
TST00232 Proportion of family households that are married couple family households, 2000 - tract
P10_7 / P10_6
BST00232 Proportion of family households that are married couple family households, 2000 - block group
P10_7 / P10_6
CST00233 Proportion of family households that are married couple households with own children under 18, 2000 - county
P10_8 / P10_6
TST00233 Proportion of family households that are married couple households with own children under 18, 2000 - tract
P10_8 / P10_6
BST00233 Proportion of family households that are married couple households with own children under 18, 2000 - block group
P10_8 / P10_6
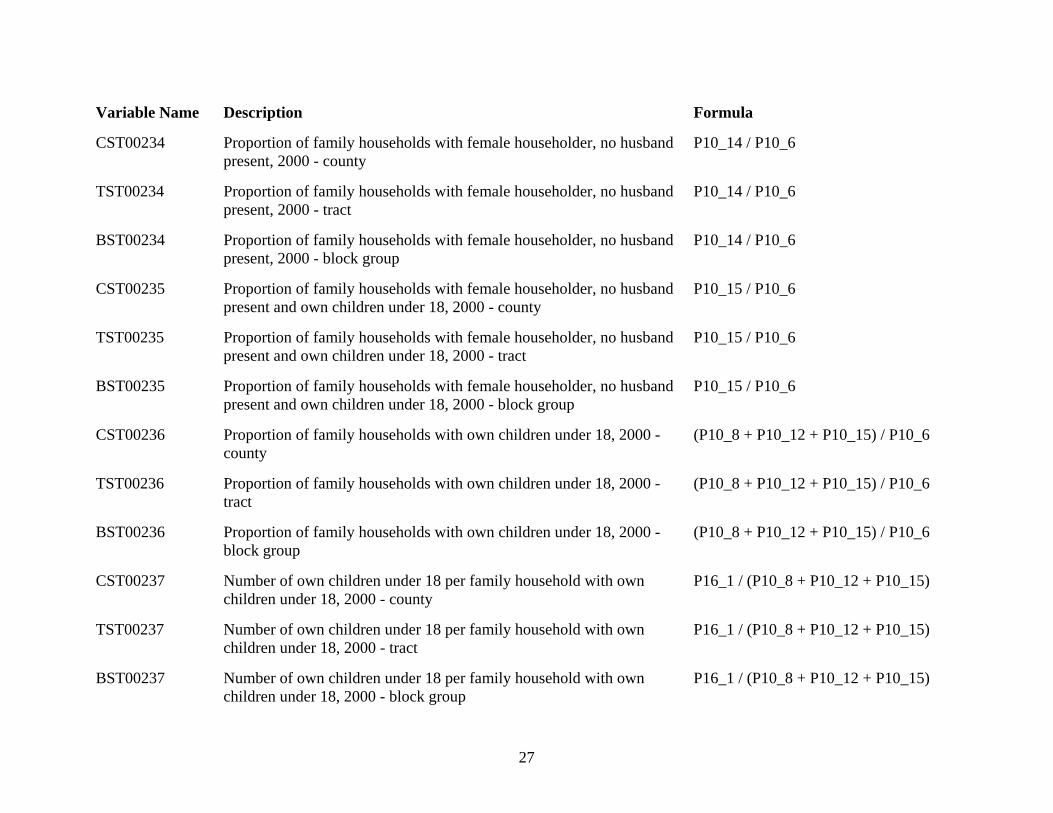
27
Variable Name Description Formula
CST00234 Proportion of family households with female householder, no husband present, 2000 - county
P10_14 / P10_6
TST00234 Proportion of family households with female householder, no husband present, 2000 - tract
P10_14 / P10_6
BST00234 Proportion of family households with female householder, no husband present, 2000 - block group
P10_14 / P10_6
CST00235 Proportion of family households with female householder, no husband present and own children under 18, 2000 - county
P10_15 / P10_6
TST00235 Proportion of family households with female householder, no husband present and own children under 18, 2000 - tract
P10_15 / P10_6
BST00235 Proportion of family households with female householder, no husband present and own children under 18, 2000 - block group
P10_15 / P10_6
CST00236 Proportion of family households with own children under 18, 2000 - county
(P10_8 + P10_12 + P10_15) / P10_6
TST00236 Proportion of family households with own children under 18, 2000 - tract
(P10_8 + P10_12 + P10_15) / P10_6
BST00236 Proportion of family households with own children under 18, 2000 - block group
(P10_8 + P10_12 + P10_15) / P10_6
CST00237 Number of own children under 18 per family household with own children under 18, 2000 - county
P16_1 / (P10_8 + P10_12 + P10_15)
TST00237 Number of own children under 18 per family household with own children under 18, 2000 - tract
P16_1 / (P10_8 + P10_12 + P10_15)
BST00237 Number of own children under 18 per family household with own children under 18, 2000 - block group
P16_1 / (P10_8 + P10_12 + P10_15)
28
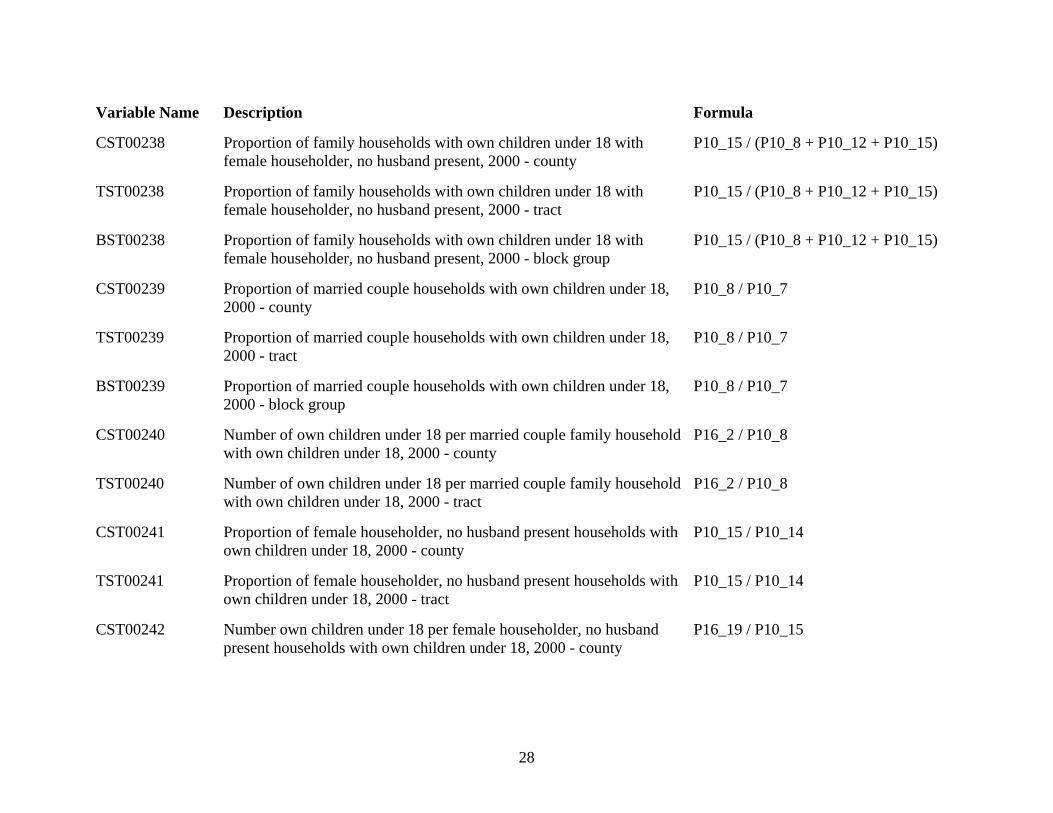
Variable Name Description Formula
CST00238 Proportion of family households with own children under 18 with female householder, no husband present, 2000 - county
P10_15 / (P10_8 + P10_12 + P10_15)
TST00238 Proportion of family households with own children under 18 with female householder, no husband present, 2000 - tract
P10_15 / (P10_8 + P10_12 + P10_15)
BST00238 Proportion of family households with own children under 18 with female householder, no husband present, 2000 - block group
P10_15 / (P10_8 + P10_12 + P10_15)
CST00239 Proportion of married couple households with own children under 18, 2000 - county
P10_8 / P10_7
TST00239 Proportion of married couple households with own children under 18, 2000 - tract
P10_8 / P10_7
BST00239 Proportion of married couple households with own children under 18, 2000 - block group
P10_8 / P10_7
CST00240 Number of own children under 18 per married couple family household with own children under 18, 2000 - county
P16_2 / P10_8
TST00240 Number of own children under 18 per married couple family household with own children under 18, 2000 - tract
P16_2 / P10_8
CST00241 Proportion of female householder, no husband present households with own children under 18, 2000 - county
P10_15 / P10_14
TST00241 Proportion of female householder, no husband present households with own children under 18, 2000 - tract
P10_15 / P10_14
CST00242 Number own children under 18 per female householder, no husband present households with own children under 18, 2000 - county
P16_19 / P10_15
29
Variable Name Description Formula
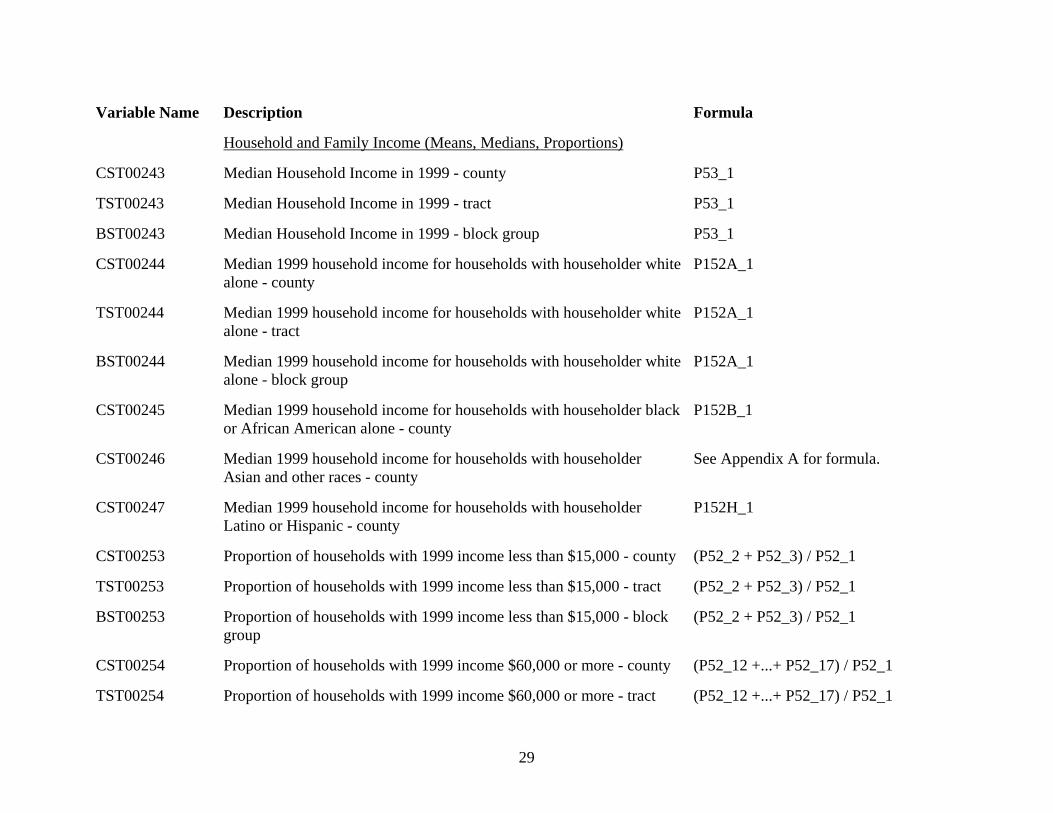
Household and Family Income (Means, Medians, Proportions)
CST00243 Median Household Income in 1999 - county P53_1
TST00243 Median Household Income in 1999 - tract P53_1
BST00243 Median Household Income in 1999 - block group P53_1
CST00244 Median 1999 household income for households with householder white alone - county
P152A_1
TST00244 Median 1999 household income for households with householder white alone - tract
P152A_1
BST00244 Median 1999 household income for households with householder white alone - block group
P152A_1
CST00245 Median 1999 household income for households with householder black or African American alone - county
P152B_1
CST00246 Median 1999 household income for households with householder Asian and other races - county
See Appendix A for formula.
CST00247 Median 1999 household income for households with householder Latino or Hispanic - county
P152H_1
CST00253 Proportion of households with 1999 income less than $15,000 - county (P52_2 + P52_3) / P52_1
TST00253 Proportion of households with 1999 income less than $15,000 - tract (P52_2 + P52_3) / P52_1
BST00253 Proportion of households with 1999 income less than $15,000 - block group
(P52_2 + P52_3) / P52_1
CST00254 Proportion of households with 1999 income $60,000 or more - county (P52_12 +...+ P52_17) / P52_1
TST00254 Proportion of households with 1999 income $60,000 or more - tract (P52_12 +...+ P52_17) / P52_1
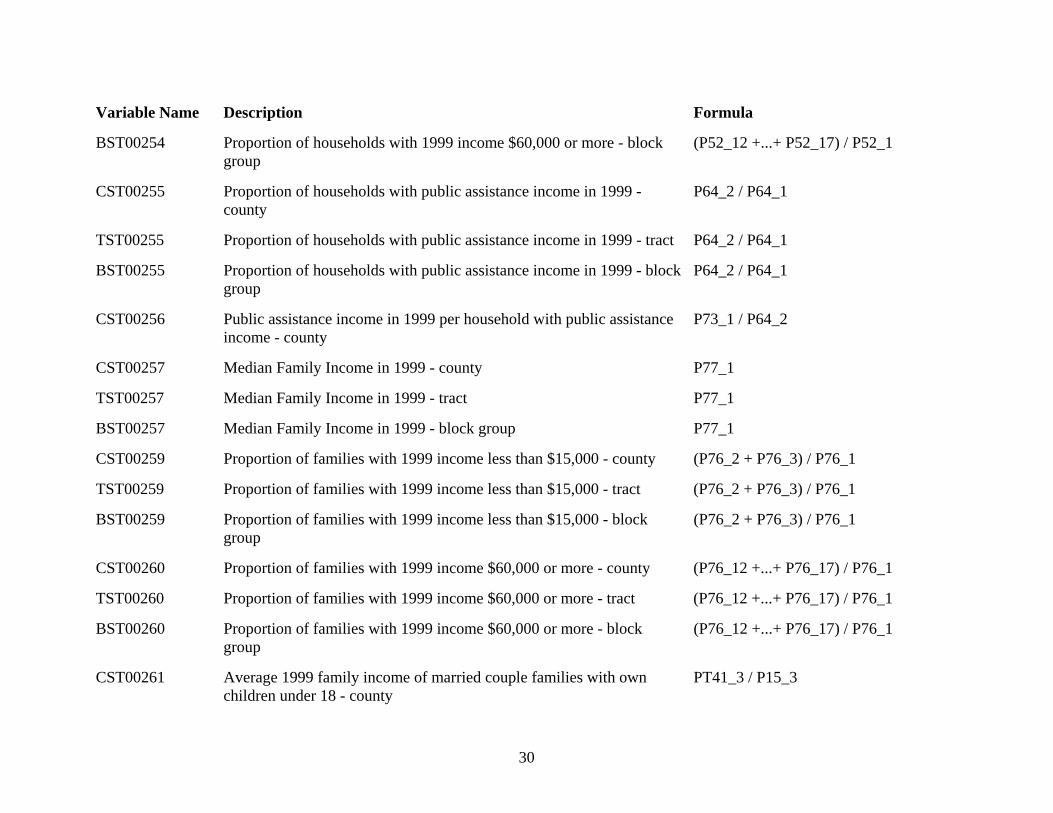
30
Variable Name Description Formula
BST00254 Proportion of households with 1999 income $60,000 or more - block group
(P52_12 +...+ P52_17) / P52_1
CST00255 Proportion of households with public assistance income in 1999 - county
P64_2 / P64_1
TST00255 Proportion of households with public assistance income in 1999 - tract P64_2 / P64_1
BST00255 Proportion of households with public assistance income in 1999 - block group
P64_2 / P64_1
CST00256 Public assistance income in 1999 per household with public assistance income - county
P73_1 / P64_2
CST00257 Median Family Income in 1999 - county P77_1
TST00257 Median Family Income in 1999 - tract P77_1
BST00257 Median Family Income in 1999 - block group P77_1
CST00259 Proportion of families with 1999 income less than $15,000 - county (P76_2 + P76_3) / P76_1
TST00259 Proportion of families with 1999 income less than $15,000 - tract (P76_2 + P76_3) / P76_1
BST00259 Proportion of families with 1999 income less than $15,000 - block group
(P76_2 + P76_3) / P76_1
CST00260 Proportion of families with 1999 income $60,000 or more - county (P76_12 +...+ P76_17) / P76_1
TST00260 Proportion of families with 1999 income $60,000 or more - tract (P76_12 +...+ P76_17) / P76_1
BST00260 Proportion of families with 1999 income $60,000 or more - block group
(P76_12 +...+ P76_17) / P76_1
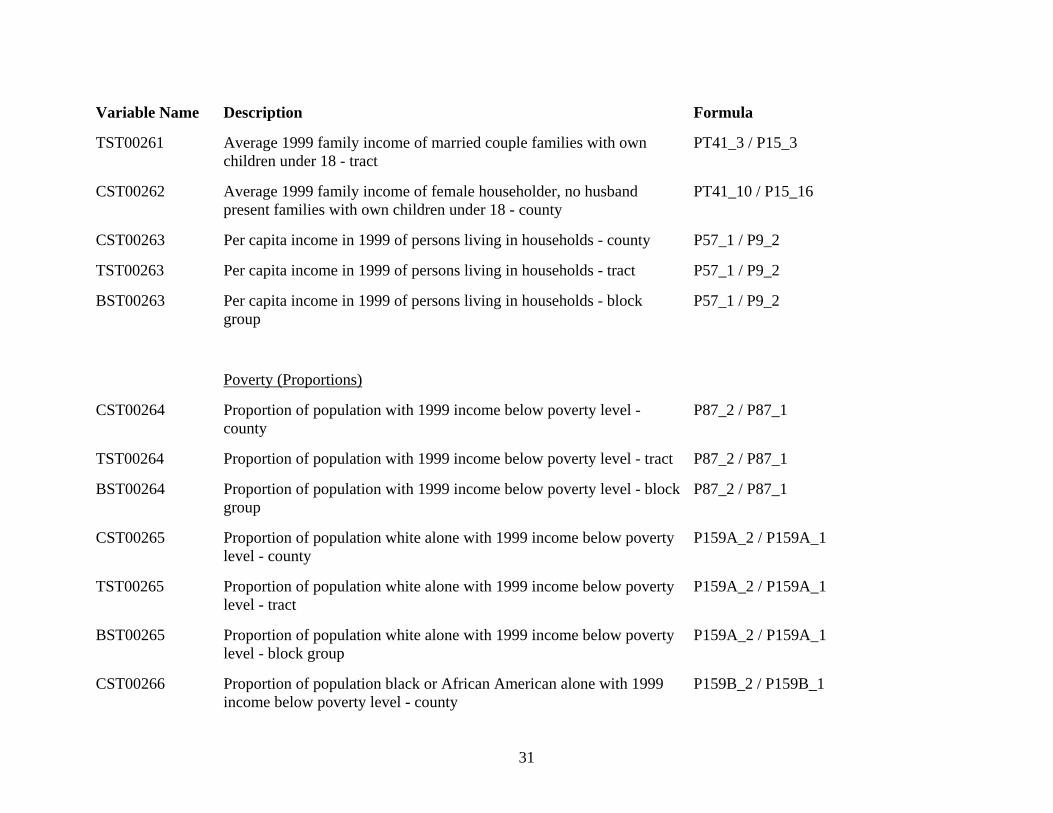
CST00261 Average 1999 family income of married couple families with own children under 18 - county
PT41_3 / P15_3
31
Variable Name Description Formula
TST00261 Average 1999 family income of married couple families with own children under 18 - tract
PT41_3 / P15_3
CST00262 Average 1999 family income of female householder, no husband present families with own children under 18 - county
PT41_10 / P15_16
CST00263 Per capita income in 1999 of persons living in households - county P57_1 / P9_2
TST00263 Per capita income in 1999 of persons living in households - tract P57_1 / P9_2
BST00263 Per capita income in 1999 of persons living in households - block group
P57_1 / P9_2
Poverty (Proportions)
CST00264 Proportion of population with 1999 income below poverty level - county
P87_2 / P87_1
TST00264 Proportion of population with 1999 income below poverty level - tract P87_2 / P87_1
BST00264 Proportion of population with 1999 income below poverty level - block group
P87_2 / P87_1
CST00265 Proportion of population white alone with 1999 income below poverty level - county
P159A_2 / P159A_1
TST00265 Proportion of population white alone with 1999 income below poverty level - tract
P159A_2 / P159A_1
BST00265 Proportion of population white alone with 1999 income below poverty level - block group
P159A_2 / P159A_1
CST00266 Proportion of population black or African American alone with 1999 income below poverty level - county
P159B_2 / P159B_1
32
Variable Name Description Formula
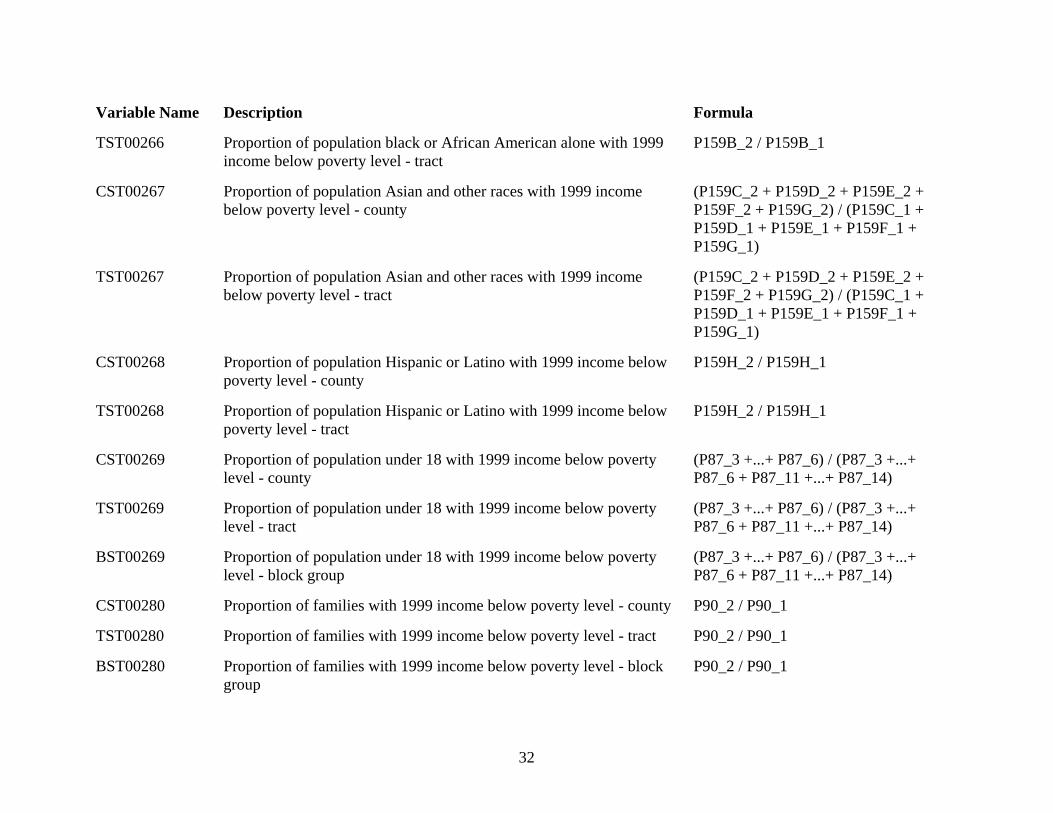
TST00266 Proportion of population black or African American alone with 1999 income below poverty level - tract
P159B_2 / P159B_1
CST00267 Proportion of population Asian and other races with 1999 income below poverty level - county
(P159C_2 + P159D_2 + P159E_2 + P159F_2 + P159G_2) / (P159C_1 + P159D_1 + P159E_1 + P159F_1 + P159G_1)
TST00267 Proportion of population Asian and other races with 1999 income below poverty level - tract
(P159C_2 + P159D_2 + P159E_2 + P159F_2 + P159G_2) / (P159C_1 + P159D_1 + P159E_1 + P159F_1 + P159G_1)
CST00268 Proportion of population Hispanic or Latino with 1999 income below poverty level - county
P159H_2 / P159H_1
TST00268 Proportion of population Hispanic or Latino with 1999 income below poverty level - tract
P159H_2 / P159H_1
CST00269 Proportion of population under 18 with 1999 income below poverty level - county
(P87_3 +...+ P87_6) / (P87_3 +...+ P87_6 + P87_11 +...+ P87_14)
TST00269 Proportion of population under 18 with 1999 income below poverty level - tract
(P87_3 +...+ P87_6) / (P87_3 +...+ P87_6 + P87_11 +...+ P87_14)
BST00269 Proportion of population under 18 with 1999 income below poverty level - block group
(P87_3 +...+ P87_6) / (P87_3 +...+ P87_6 + P87_11 +...+ P87_14)
CST00280 Proportion of families with 1999 income below poverty level - county P90_2 / P90_1
TST00280 Proportion of families with 1999 income below poverty level - tract P90_2 / P90_1
BST00280 Proportion of families with 1999 income below poverty level - block group
P90_2 / P90_1
33
Variable Name Description Formula
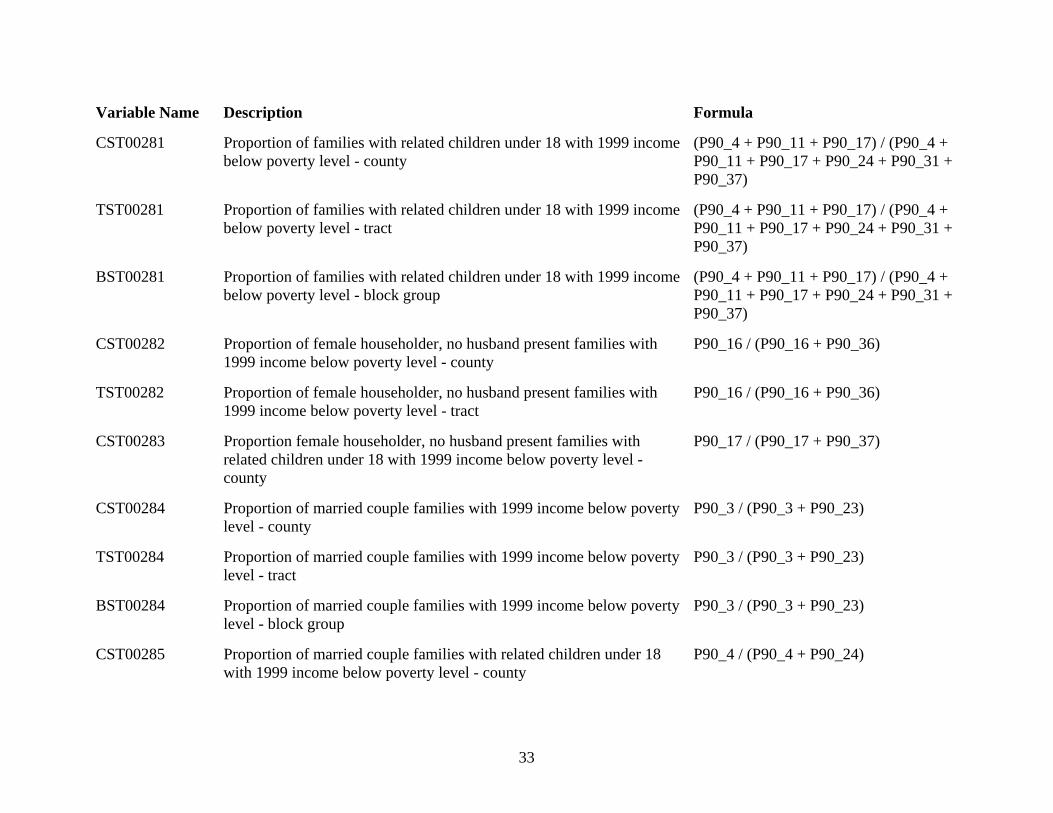
CST00281 Proportion of families with related children under 18 with 1999 income below poverty level - county
(P90_4 + P90_11 + P90_17) / (P90_4 + P90_11 + P90_17 + P90_24 + P90_31 + P90_37)
TST00281 Proportion of families with related children under 18 with 1999 income below poverty level - tract
(P90_4 + P90_11 + P90_17) / (P90_4 + P90_11 + P90_17 + P90_24 + P90_31 + P90_37)
BST00281 Proportion of families with related children under 18 with 1999 income below poverty level - block group
(P90_4 + P90_11 + P90_17) / (P90_4 + P90_11 + P90_17 + P90_24 + P90_31 + P90_37)
CST00282 Proportion of female householder, no husband present families with 1999 income below poverty level - county
P90_16 / (P90_16 + P90_36)
TST00282 Proportion of female householder, no husband present families with 1999 income below poverty level - tract
P90_16 / (P90_16 + P90_36)
CST00283 Proportion female householder, no husband present families with related children under 18 with 1999 income below poverty level - county
P90_17 / (P90_17 + P90_37)
CST00284 Proportion of married couple families with 1999 income below poverty level - county
P90_3 / (P90_3 + P90_23)
TST00284 Proportion of married couple families with 1999 income below poverty level - tract
P90_3 / (P90_3 + P90_23)
BST00284 Proportion of married couple families with 1999 income below poverty level - block group
P90_3 / (P90_3 + P90_23)
CST00285 Proportion of married couple families with related children under 18 with 1999 income below poverty level - county
P90_4 / (P90_4 + P90_24)
34
Variable Name Description Formula
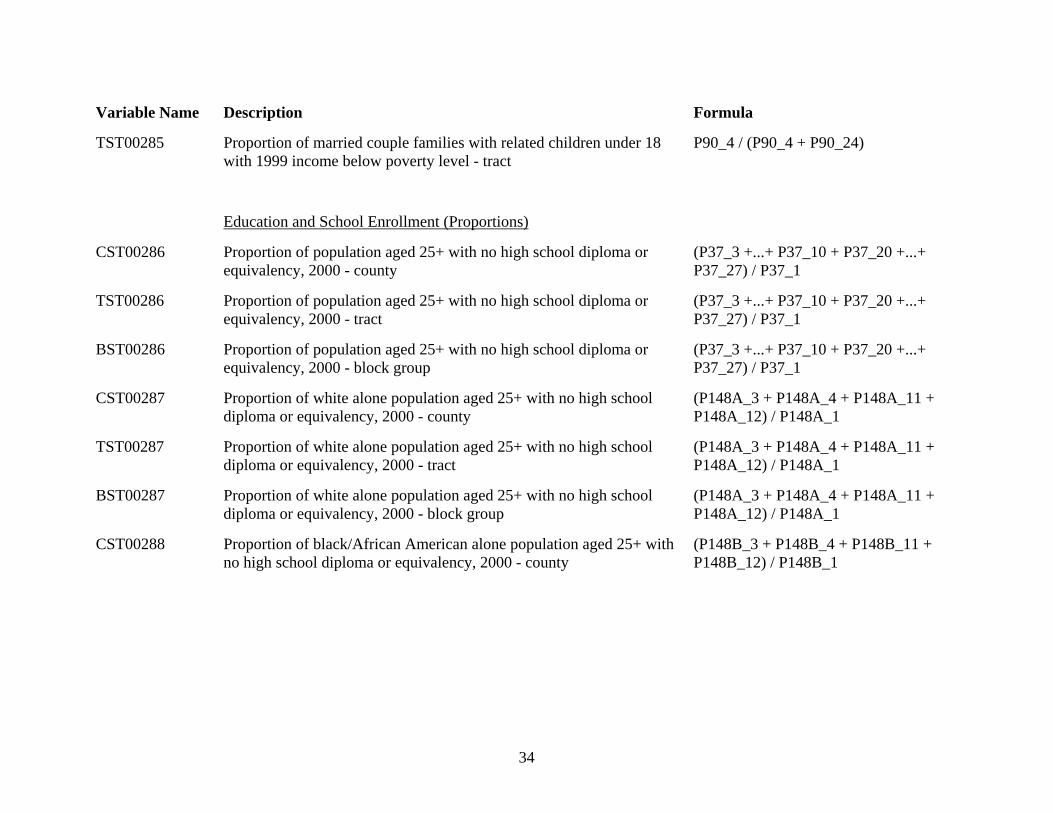
TST00285 Proportion of married couple families with related children under 18 with 1999 income below poverty level - tract
P90_4 / (P90_4 + P90_24)
Education and School Enrollment (Proportions)
CST00286 Proportion of population aged 25+ with no high school diploma or equivalency, 2000 - county
(P37_3 +...+ P37_10 + P37_20 +...+ P37_27) / P37_1
TST00286 Proportion of population aged 25+ with no high school diploma or equivalency, 2000 - tract
(P37_3 +...+ P37_10 + P37_20 +...+ P37_27) / P37_1
BST00286 Proportion of population aged 25+ with no high school diploma or equivalency, 2000 - block group
(P37_3 +...+ P37_10 + P37_20 +...+ P37_27) / P37_1
CST00287 Proportion of white alone population aged 25+ with no high school diploma or equivalency, 2000 - county
(P148A_3 + P148A_4 + P148A_11 + P148A_12) / P148A_1
TST00287 Proportion of white alone population aged 25+ with no high school diploma or equivalency, 2000 - tract
(P148A_3 + P148A_4 + P148A_11 + P148A_12) / P148A_1
BST00287 Proportion of white alone population aged 25+ with no high school diploma or equivalency, 2000 - block group
(P148A_3 + P148A_4 + P148A_11 + P148A_12) / P148A_1
CST00288 Proportion of black/African American alone population aged 25+ with no high school diploma or equivalency, 2000 - county
(P148B_3 + P148B_4 + P148B_11 + P148B_12) / P148B_1
35
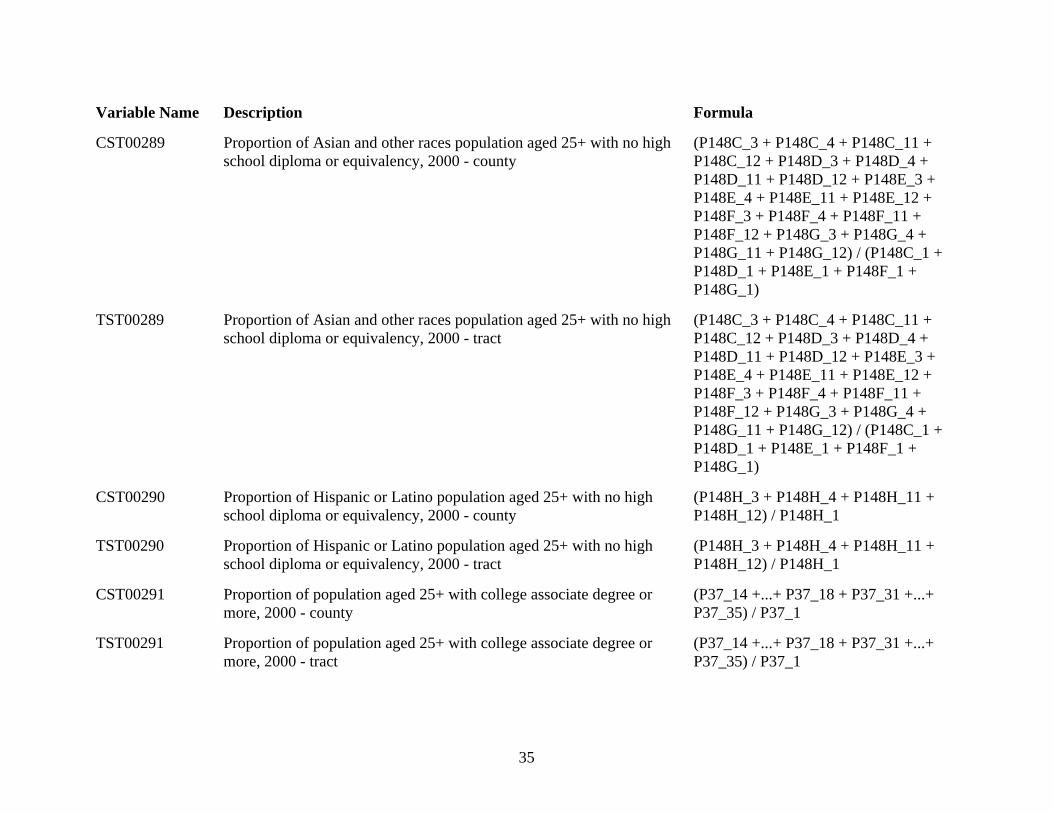
Variable Name Description Formula
CST00289 Proportion of Asian and other races population aged 25+ with no high school diploma or equivalency, 2000 - county
(P148C_3 + P148C_4 + P148C_11 + P148C_12 + P148D_3 + P148D_4 + P148D_11 + P148D_12 + P148E_3 + P148E_4 + P148E_11 + P148E_12 + P148F_3 + P148F_4 + P148F_11 + P148F_12 + P148G_3 + P148G_4 + P148G_11 + P148G_12) / (P148C_1 + P148D_1 + P148E_1 + P148F_1 + P148G_1)
TST00289 Proportion of Asian and other races population aged 25+ with no high school diploma or equivalency, 2000 - tract
(P148C_3 + P148C_4 + P148C_11 + P148C_12 + P148D_3 + P148D_4 + P148D_11 + P148D_12 + P148E_3 + P148E_4 + P148E_11 + P148E_12 + P148F_3 + P148F_4 + P148F_11 + P148F_12 + P148G_3 + P148G_4 + P148G_11 + P148G_12) / (P148C_1 + P148D_1 + P148E_1 + P148F_1 + P148G_1)
CST00290 Proportion of Hispanic or Latino population aged 25+ with no high school diploma or equivalency, 2000 - county
(P148H_3 + P148H_4 + P148H_11 + P148H_12) / P148H_1
TST00290 Proportion of Hispanic or Latino population aged 25+ with no high school diploma or equivalency, 2000 - tract
(P148H_3 + P148H_4 + P148H_11 + P148H_12) / P148H_1
CST00291 Proportion of population aged 25+ with college associate degree or more, 2000 - county
(P37_14 +...+ P37_18 + P37_31 +...+ P37_35) / P37_1
TST00291 Proportion of population aged 25+ with college associate degree or more, 2000 - tract
(P37_14 +...+ P37_18 + P37_31 +...+ P37_35) / P37_1
36
Variable Name Description Formula
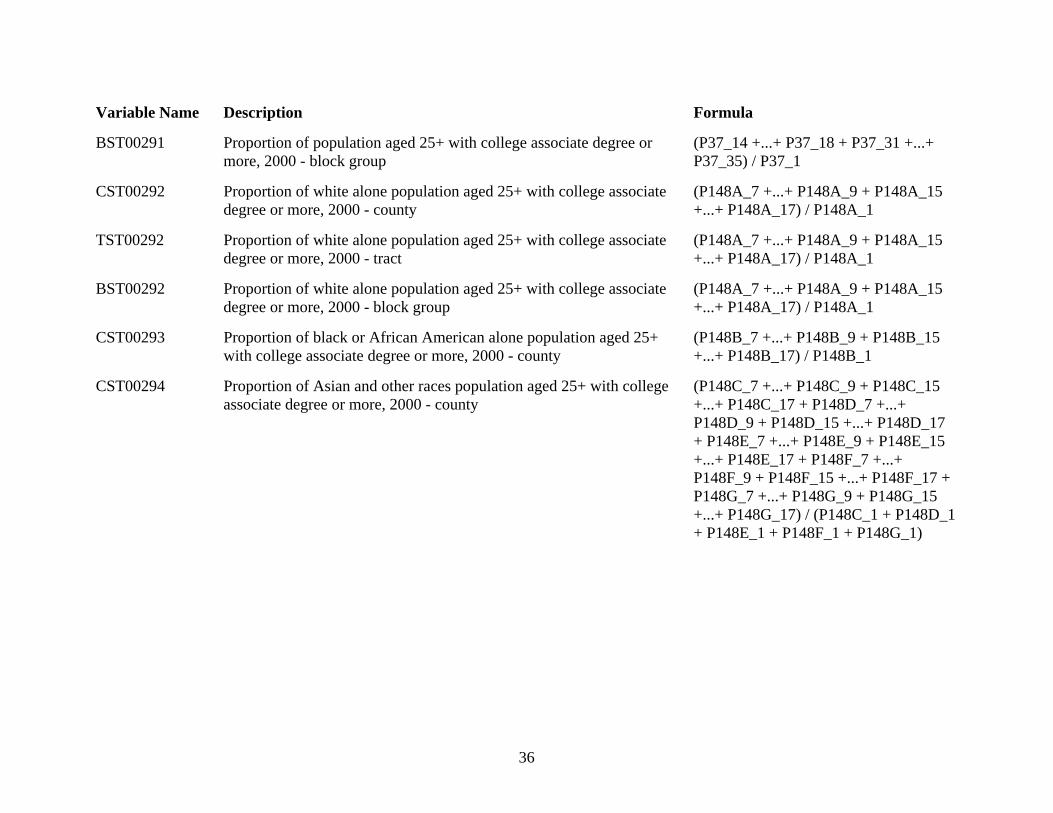
BST00291 Proportion of population aged 25+ with college associate degree or more, 2000 - block group
(P37_14 +...+ P37_18 + P37_31 +...+ P37_35) / P37_1
CST00292 Proportion of white alone population aged 25+ with college associate degree or more, 2000 - county
(P148A_7 +...+ P148A_9 + P148A_15 +...+ P148A_17) / P148A_1
TST00292 Proportion of white alone population aged 25+ with college associate degree or more, 2000 - tract
(P148A_7 +...+ P148A_9 + P148A_15 +...+ P148A_17) / P148A_1
BST00292 Proportion of white alone population aged 25+ with college associate degree or more, 2000 - block group
(P148A_7 +...+ P148A_9 + P148A_15 +...+ P148A_17) / P148A_1
CST00293 Proportion of black or African American alone population aged 25+ with college associate degree or more, 2000 - county
(P148B_7 +...+ P148B_9 + P148B_15 +...+ P148B_17) / P148B_1
CST00294 Proportion of Asian and other races population aged 25+ with college associate degree or more, 2000 - county
(P148C_7 +...+ P148C_9 + P148C_15 +...+ P148C_17 + P148D_7 +...+ P148D_9 + P148D_15 +...+ P148D_17 + P148E_7 +...+ P148E_9 + P148E_15 +...+ P148E_17 + P148F_7 +...+ P148F_9 + P148F_15 +...+ P148F_17 + P148G_7 +...+ P148G_9 + P148G_15 +...+ P148G_17) / (P148C_1 + P148D_1 + P148E_1 + P148F_1 + P148G_1)
37
Variable Name Description Formula
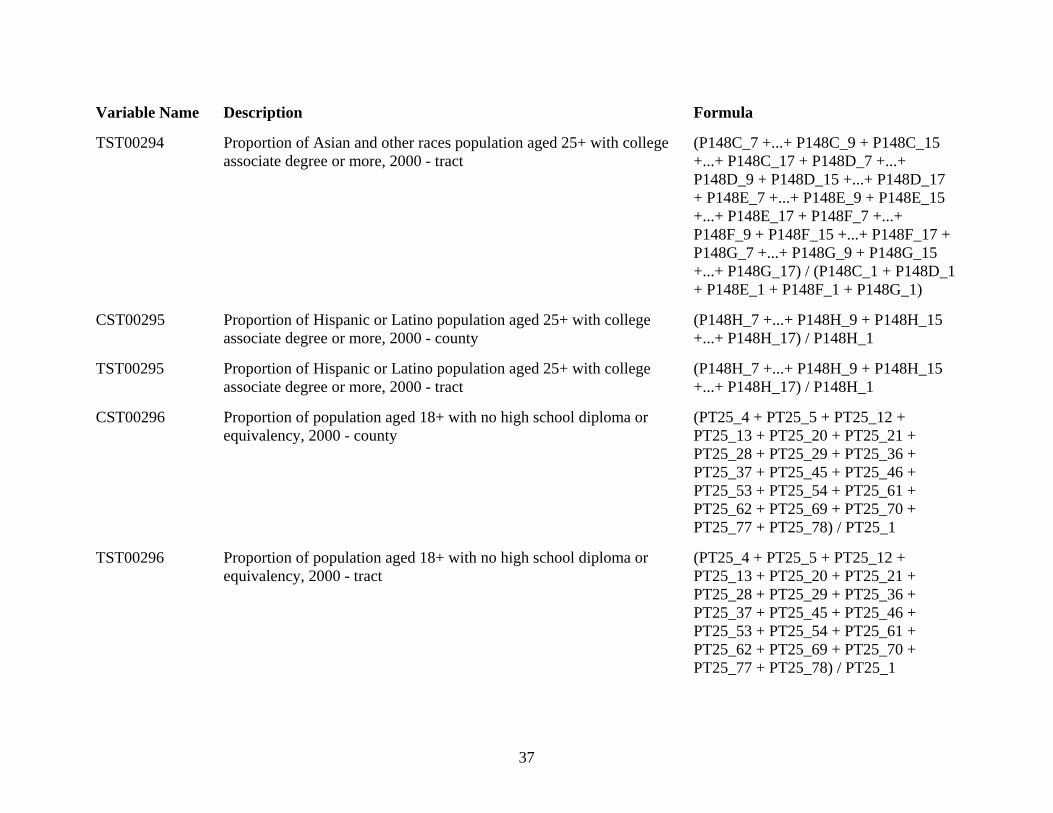
TST00294 Proportion of Asian and other races population aged 25+ with college associate degree or more, 2000 - tract
(P148C_7 +...+ P148C_9 + P148C_15 +...+ P148C_17 + P148D_7 +...+ P148D_9 + P148D_15 +...+ P148D_17 + P148E_7 +...+ P148E_9 + P148E_15 +...+ P148E_17 + P148F_7 +...+ P148F_9 + P148F_15 +...+ P148F_17 + P148G_7 +...+ P148G_9 + P148G_15 +...+ P148G_17) / (P148C_1 + P148D_1 + P148E_1 + P148F_1 + P148G_1)
CST00295 Proportion of Hispanic or Latino population aged 25+ with college associate degree or more, 2000 - county
(P148H_7 +...+ P148H_9 + P148H_15 +...+ P148H_17) / P148H_1
TST00295 Proportion of Hispanic or Latino population aged 25+ with college associate degree or more, 2000 - tract
(P148H_7 +...+ P148H_9 + P148H_15 +...+ P148H_17) / P148H_1
CST00296 Proportion of population aged 18+ with no high school diploma or equivalency, 2000 - county
(PT25_4 + PT25_5 + PT25_12 + PT25_13 + PT25_20 + PT25_21 + PT25_28 + PT25_29 + PT25_36 + PT25_37 + PT25_45 + PT25_46 + PT25_53 + PT25_54 + PT25_61 + PT25_62 + PT25_69 + PT25_70 + PT25_77 + PT25_78) / PT25_1
TST00296 Proportion of population aged 18+ with no high school diploma or equivalency, 2000 - tract
(PT25_4 + PT25_5 + PT25_12 + PT25_13 + PT25_20 + PT25_21 + PT25_28 + PT25_29 + PT25_36 + PT25_37 + PT25_45 + PT25_46 + PT25_53 + PT25_54 + PT25_61 + PT25_62 + PT25_69 + PT25_70 + PT25_77 + PT25_78) / PT25_1
38
Variable Name Description Formula
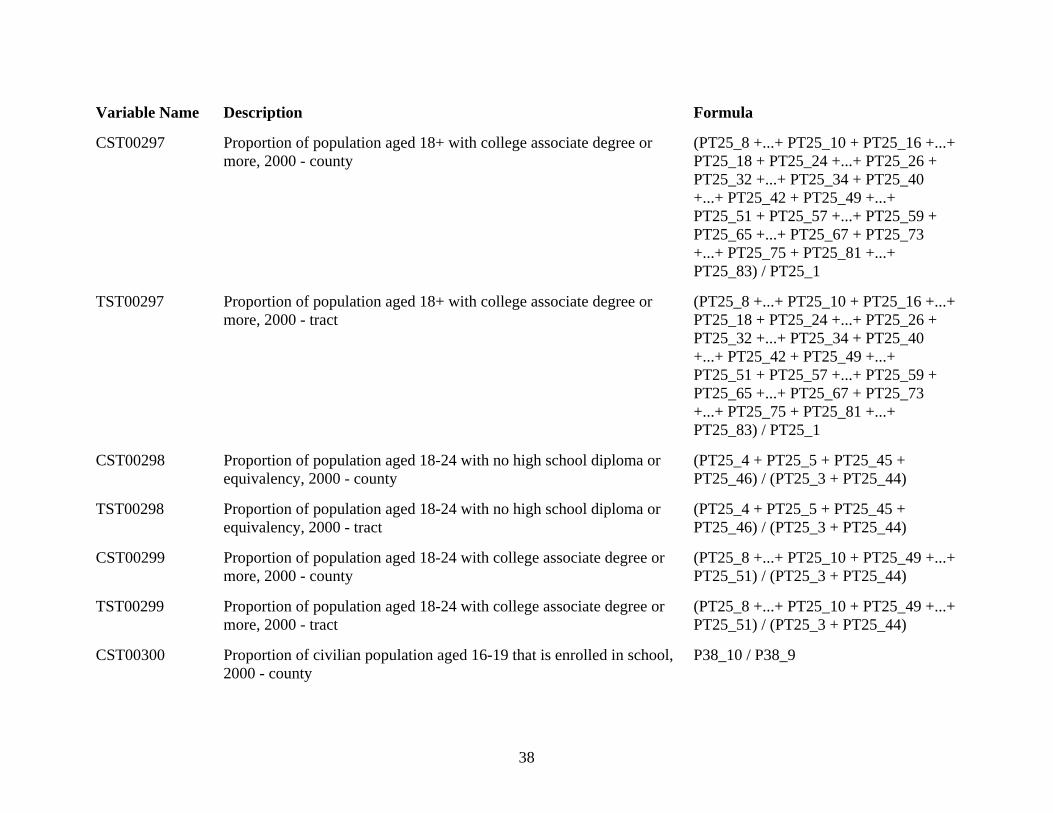
CST00297 Proportion of population aged 18+ with college associate degree or more, 2000 - county
(PT25_8 +...+ PT25_10 + PT25_16 +...+ PT25_18 + PT25_24 +...+ PT25_26 + PT25_32 +...+ PT25_34 + PT25_40 +...+ PT25_42 + PT25_49 +...+ PT25_51 + PT25_57 +...+ PT25_59 + PT25_65 +...+ PT25_67 + PT25_73 +...+ PT25_75 + PT25_81 +...+ PT25_83) / PT25_1
TST00297 Proportion of population aged 18+ with college associate degree or more, 2000 - tract
(PT25_8 +...+ PT25_10 + PT25_16 +...+ PT25_18 + PT25_24 +...+ PT25_26 + PT25_32 +...+ PT25_34 + PT25_40 +...+ PT25_42 + PT25_49 +...+ PT25_51 + PT25_57 +...+ PT25_59 + PT25_65 +...+ PT25_67 + PT25_73 +...+ PT25_75 + PT25_81 +...+ PT25_83) / PT25_1
CST00298 Proportion of population aged 18-24 with no high school diploma or equivalency, 2000 - county
(PT25_4 + PT25_5 + PT25_45 + PT25_46) / (PT25_3 + PT25_44)
TST00298 Proportion of population aged 18-24 with no high school diploma or equivalency, 2000 - tract
(PT25_4 + PT25_5 + PT25_45 + PT25_46) / (PT25_3 + PT25_44)
CST00299 Proportion of population aged 18-24 with college associate degree or more, 2000 - county
(PT25_8 +...+ PT25_10 + PT25_49 +...+ PT25_51) / (PT25_3 + PT25_44)
TST00299 Proportion of population aged 18-24 with college associate degree or more, 2000 - tract
(PT25_8 +...+ PT25_10 + PT25_49 +...+ PT25_51) / (PT25_3 + PT25_44)
CST00300 Proportion of civilian population aged 16-19 that is enrolled in school, 2000 - county
P38_10 / P38_9
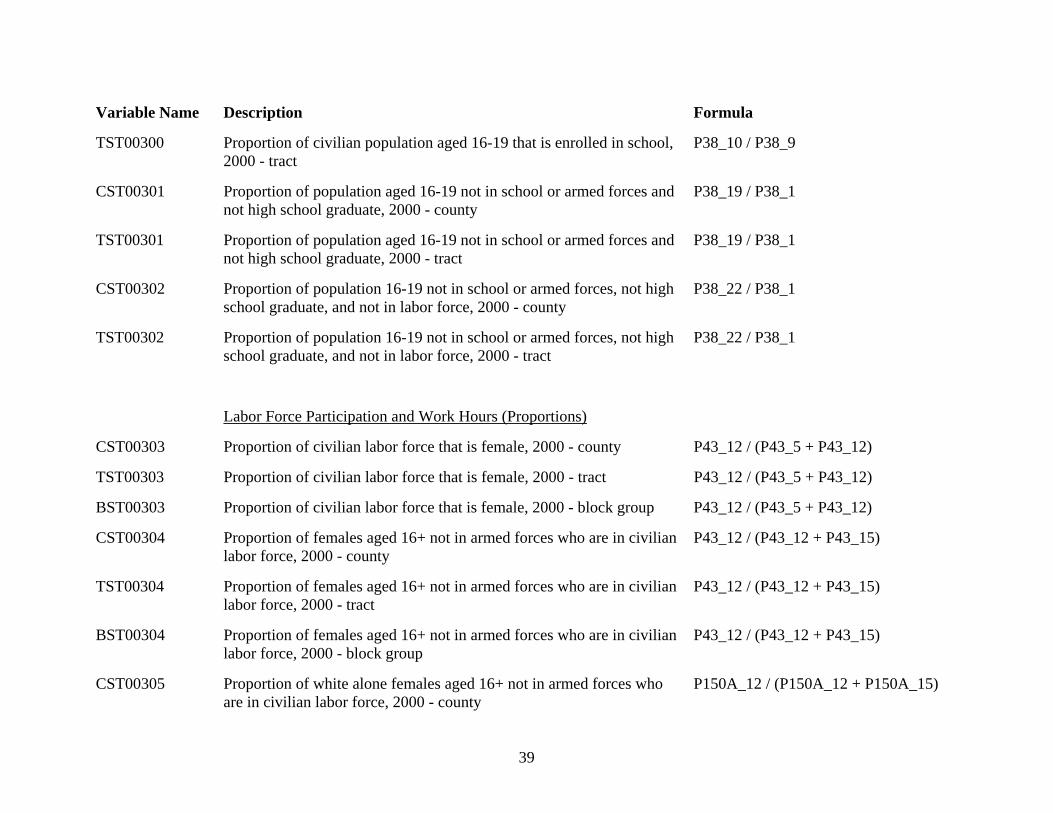
39
Variable Name Description Formula
TST00300 Proportion of civilian population aged 16-19 that is enrolled in school, 2000 - tract
P38_10 / P38_9
CST00301 Proportion of population aged 16-19 not in school or armed forces and not high school graduate, 2000 - county
P38_19 / P38_1
TST00301 Proportion of population aged 16-19 not in school or armed forces and not high school graduate, 2000 - tract
P38_19 / P38_1
CST00302 Proportion of population 16-19 not in school or armed forces, not high school graduate, and not in labor force, 2000 - county
P38_22 / P38_1
TST00302 Proportion of population 16-19 not in school or armed forces, not high school graduate, and not in labor force, 2000 - tract
P38_22 / P38_1
Labor Force Participation and Work Hours (Proportions)
CST00303 Proportion of civilian labor force that is female, 2000 - county P43_12 / (P43_5 + P43_12)
TST00303 Proportion of civilian labor force that is female, 2000 - tract P43_12 / (P43_5 + P43_12)
BST00303 Proportion of civilian labor force that is female, 2000 - block group P43_12 / (P43_5 + P43_12)
CST00304 Proportion of females aged 16+ not in armed forces who are in civilian labor force, 2000 - county
P43_12 / (P43_12 + P43_15)
TST00304 Proportion of females aged 16+ not in armed forces who are in civilian labor force, 2000 - tract
P43_12 / (P43_12 + P43_15)
BST00304 Proportion of females aged 16+ not in armed forces who are in civilian labor force, 2000 - block group
P43_12 / (P43_12 + P43_15)
CST00305 Proportion of white alone females aged 16+ not in armed forces who are in civilian labor force, 2000 - county
P150A_12 / (P150A_12 + P150A_15)
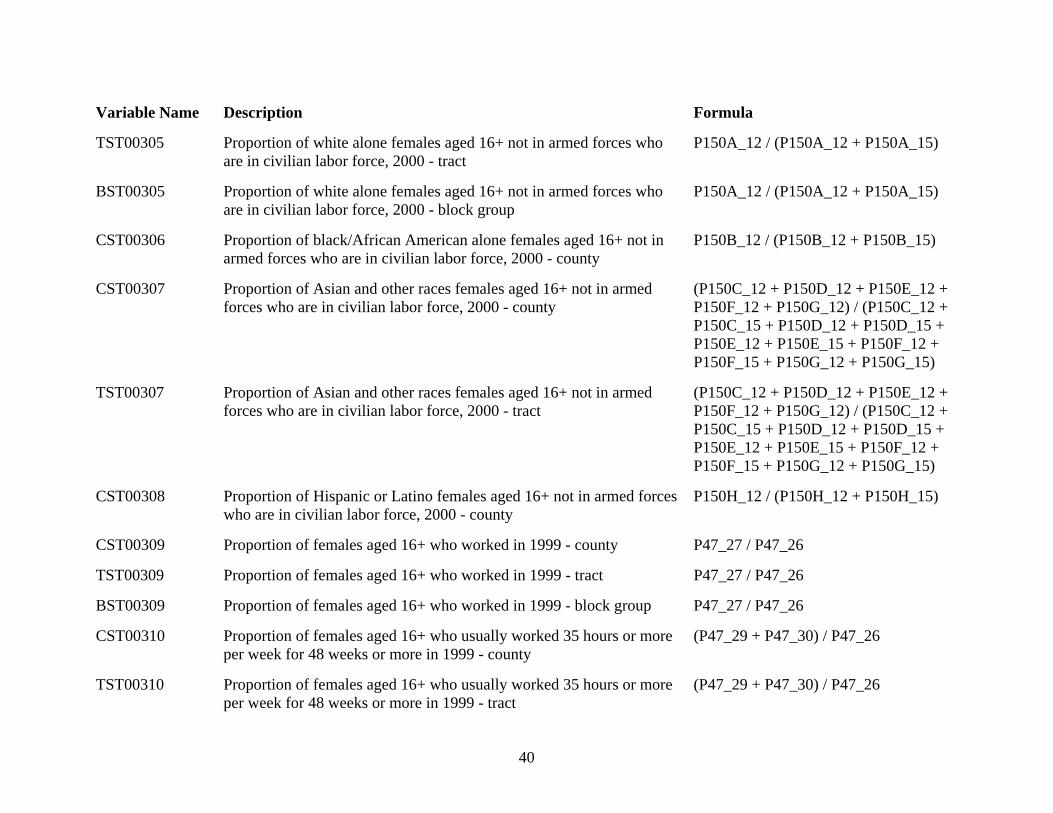
40
Variable Name Description Formula
TST00305 Proportion of white alone females aged 16+ not in armed forces who are in civilian labor force, 2000 - tract
P150A_12 / (P150A_12 + P150A_15)
BST00305 Proportion of white alone females aged 16+ not in armed forces who are in civilian labor force, 2000 - block group
P150A_12 / (P150A_12 + P150A_15)
CST00306 Proportion of black/African American alone females aged 16+ not in armed forces who are in civilian labor force, 2000 - county
P150B_12 / (P150B_12 + P150B_15)
CST00307 Proportion of Asian and other races females aged 16+ not in armed forces who are in civilian labor force, 2000 - county
(P150C_12 + P150D_12 + P150E_12 + P150F_12 + P150G_12) / (P150C_12 + P150C_15 + P150D_12 + P150D_15 + P150E_12 + P150E_15 + P150F_12 + P150F_15 + P150G_12 + P150G_15)
TST00307 Proportion of Asian and other races females aged 16+ not in armed forces who are in civilian labor force, 2000 - tract
(P150C_12 + P150D_12 + P150E_12 + P150F_12 + P150G_12) / (P150C_12 + P150C_15 + P150D_12 + P150D_15 + P150E_12 + P150E_15 + P150F_12 + P150F_15 + P150G_12 + P150G_15)
CST00308 Proportion of Hispanic or Latino females aged 16+ not in armed forces who are in civilian labor force, 2000 - county
P150H_12 / (P150H_12 + P150H_15)
CST00309 Proportion of females aged 16+ who worked in 1999 - county P47_27 / P47_26
TST00309 Proportion of females aged 16+ who worked in 1999 - tract P47_27 / P47_26
BST00309 Proportion of females aged 16+ who worked in 1999 - block group P47_27 / P47_26
CST00310 Proportion of females aged 16+ who usually worked 35 hours or more per week for 48 weeks or more in 1999 - county
(P47_29 + P47_30) / P47_26
TST00310 Proportion of females aged 16+ who usually worked 35 hours or more per week for 48 weeks or more in 1999 - tract
(P47_29 + P47_30) / P47_26
41
Variable Name Description Formula
BST00310 Proportion of females aged 16+ who usually worked 35 hours or more per week for 48 weeks or more in 1999 - block group
(P47_29 + P47_30) / P47_26
CST00311 Proportion of females aged 16+ who usually worked 15-34 hours per week for 48 weeks or more in 1999 - county
(P47_36 + P47_37) / P47_26
TST00311 Proportion of females aged 16+ who usually worked 15-34 hours per week for 48 weeks or more in 1999 - tract
(P47_36 + P47_37) / P47_26
BST00311 Proportion of females aged 16+ who usually worked 15-34 hours per week for 48 weeks or more in 1999 - block group
(P47_36 + P47_37) / P47_26
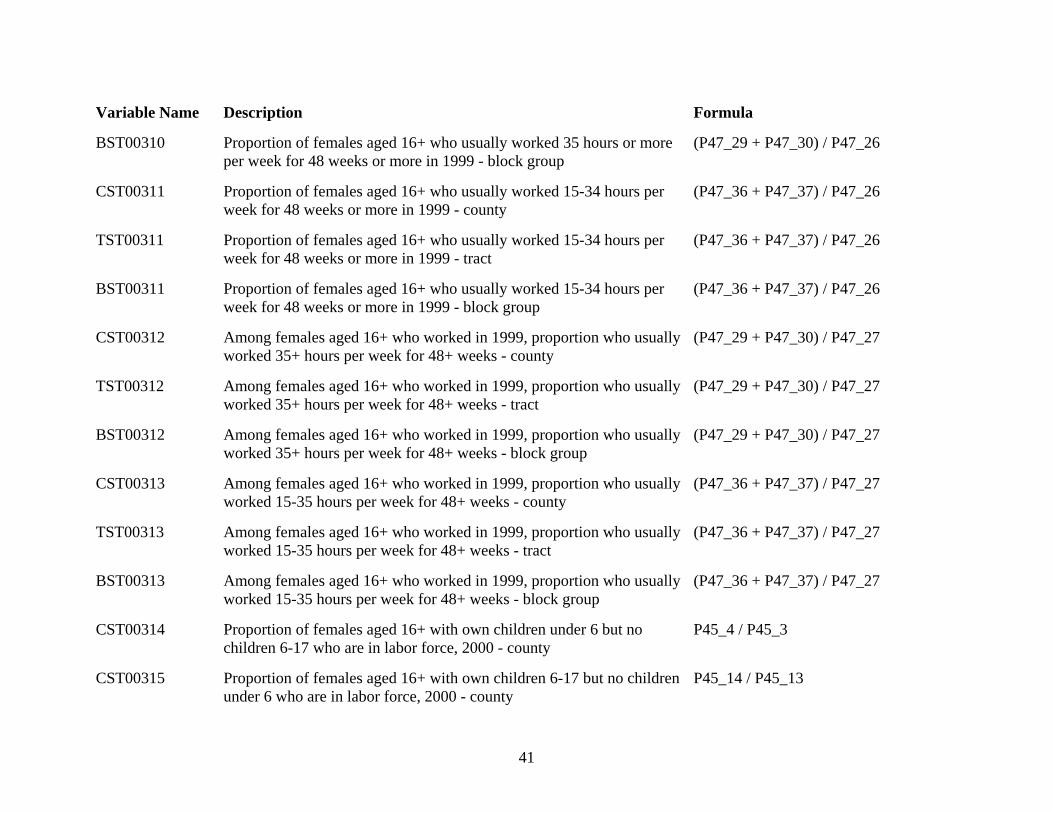
CST00312 Among females aged 16+ who worked in 1999, proportion who usually worked 35+ hours per week for 48+ weeks - county
(P47_29 + P47_30) / P47_27
TST00312 Among females aged 16+ who worked in 1999, proportion who usually worked 35+ hours per week for 48+ weeks - tract
(P47_29 + P47_30) / P47_27
BST00312 Among females aged 16+ who worked in 1999, proportion who usually worked 35+ hours per week for 48+ weeks - block group
(P47_29 + P47_30) / P47_27
CST00313 Among females aged 16+ who worked in 1999, proportion who usually worked 15-35 hours per week for 48+ weeks - county
(P47_36 + P47_37) / P47_27
TST00313 Among females aged 16+ who worked in 1999, proportion who usually worked 15-35 hours per week for 48+ weeks - tract
(P47_36 + P47_37) / P47_27
BST00313 Among females aged 16+ who worked in 1999, proportion who usually worked 15-35 hours per week for 48+ weeks - block group
(P47_36 + P47_37) / P47_27
CST00314 Proportion of females aged 16+ with own children under 6 but no children 6-17 who are in labor force, 2000 - county
P45_4 / P45_3
CST00315 Proportion of females aged 16+ with own children 6-17 but no children under 6 who are in labor force, 2000 - county
P45_14 / P45_13
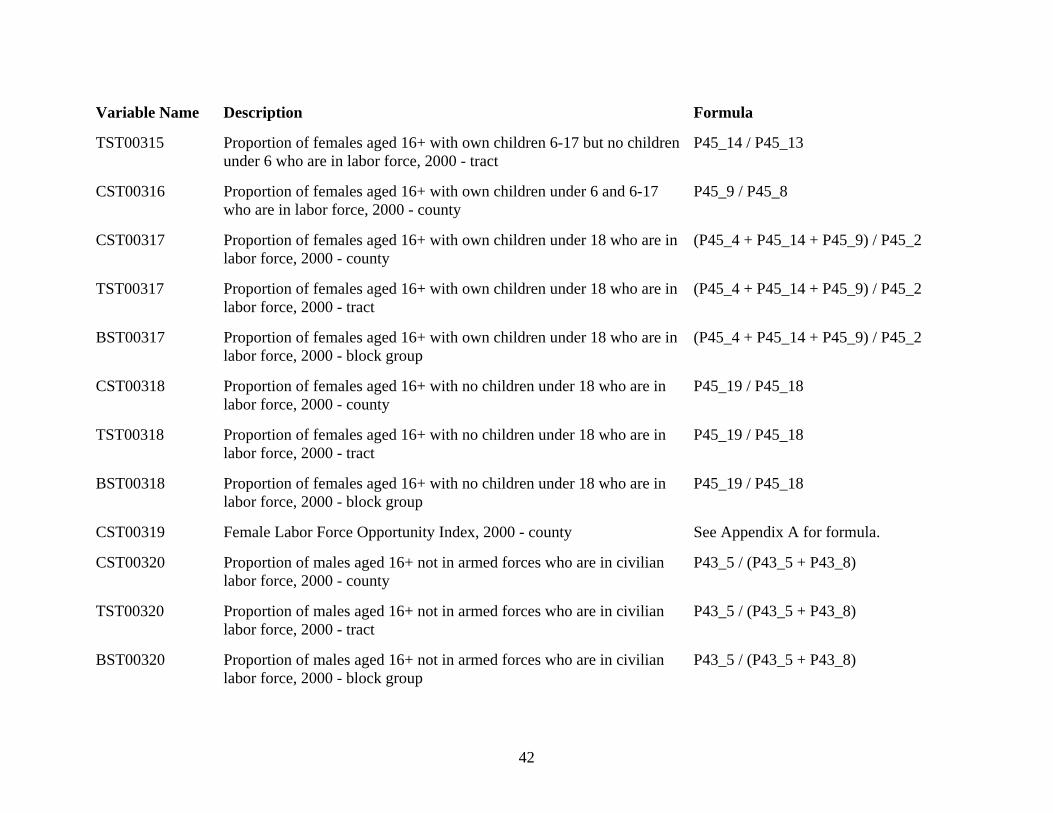
42
Variable Name Description Formula
TST00315 Proportion of females aged 16+ with own children 6-17 but no children under 6 who are in labor force, 2000 - tract
P45_14 / P45_13
CST00316 Proportion of females aged 16+ with own children under 6 and 6-17 who are in labor force, 2000 - county
P45_9 / P45_8
CST00317 Proportion of females aged 16+ with own children under 18 who are in labor force, 2000 - county
(P45_4 + P45_14 + P45_9) / P45_2
TST00317 Proportion of females aged 16+ with own children under 18 who are in labor force, 2000 - tract
(P45_4 + P45_14 + P45_9) / P45_2
BST00317 Proportion of females aged 16+ with own children under 18 who are in labor force, 2000 - block group
(P45_4 + P45_14 + P45_9) / P45_2
CST00318 Proportion of females aged 16+ with no children under 18 who are in labor force, 2000 - county
P45_19 / P45_18
TST00318 Proportion of females aged 16+ with no children under 18 who are in labor force, 2000 - tract
P45_19 / P45_18
BST00318 Proportion of females aged 16+ with no children under 18 who are in labor force, 2000 - block group
P45_19 / P45_18
CST00319 Female Labor Force Opportunity Index, 2000 - county See Appendix A for formula.
CST00320 Proportion of males aged 16+ not in armed forces who are in civilian labor force, 2000 - county
P43_5 / (P43_5 + P43_8)
TST00320 Proportion of males aged 16+ not in armed forces who are in civilian labor force, 2000 - tract
P43_5 / (P43_5 + P43_8)
BST00320 Proportion of males aged 16+ not in armed forces who are in civilian labor force, 2000 - block group
P43_5 / (P43_5 + P43_8)
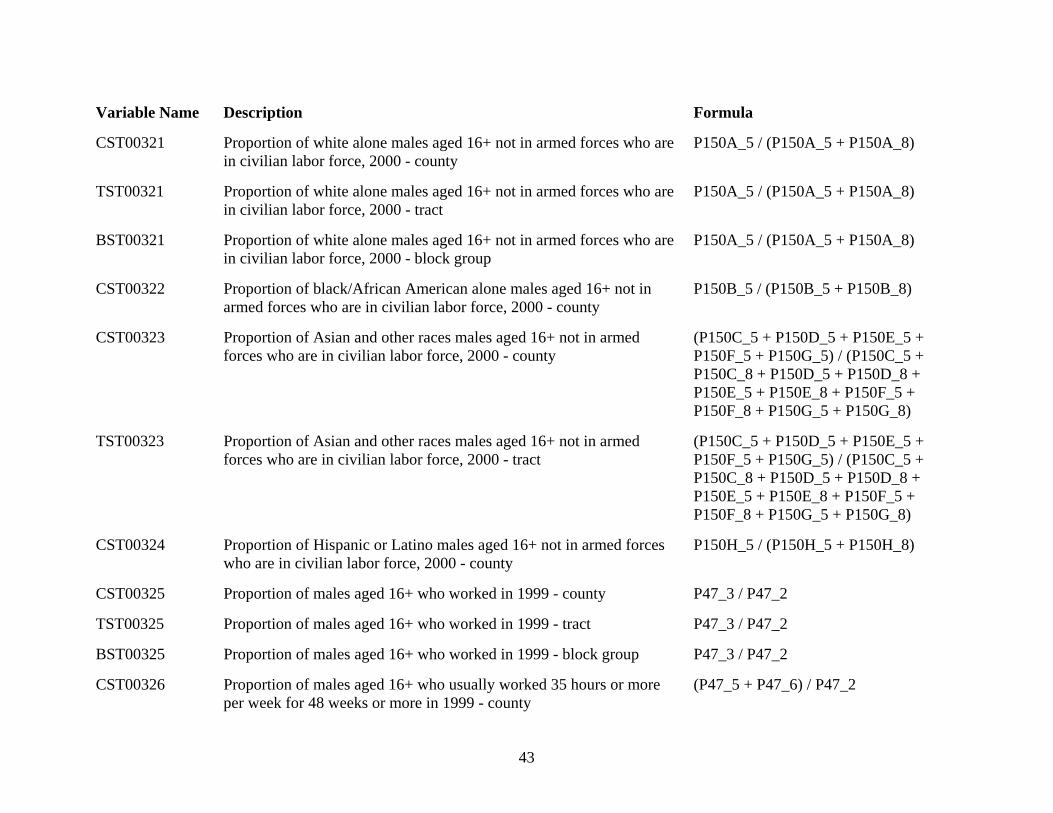
43
Variable Name Description Formula
CST00321 Proportion of white alone males aged 16+ not in armed forces who are in civilian labor force, 2000 - county
P150A_5 / (P150A_5 + P150A_8)
TST00321 Proportion of white alone males aged 16+ not in armed forces who are in civilian labor force, 2000 - tract
P150A_5 / (P150A_5 + P150A_8)
BST00321 Proportion of white alone males aged 16+ not in armed forces who are in civilian labor force, 2000 - block group
P150A_5 / (P150A_5 + P150A_8)
CST00322 Proportion of black/African American alone males aged 16+ not in armed forces who are in civilian labor force, 2000 - county
P150B_5 / (P150B_5 + P150B_8)
CST00323 Proportion of Asian and other races males aged 16+ not in armed forces who are in civilian labor force, 2000 - county
(P150C_5 + P150D_5 + P150E_5 + P150F_5 + P150G_5) / (P150C_5 + P150C_8 + P150D_5 + P150D_8 + P150E_5 + P150E_8 + P150F_5 + P150F_8 + P150G_5 + P150G_8)
TST00323 Proportion of Asian and other races males aged 16+ not in armed forces who are in civilian labor force, 2000 - tract
(P150C_5 + P150D_5 + P150E_5 + P150F_5 + P150G_5) / (P150C_5 + P150C_8 + P150D_5 + P150D_8 + P150E_5 + P150E_8 + P150F_5 + P150F_8 + P150G_5 + P150G_8)
CST00324 Proportion of Hispanic or Latino males aged 16+ not in armed forces who are in civilian labor force, 2000 - county
P150H_5 / (P150H_5 + P150H_8)
CST00325 Proportion of males aged 16+ who worked in 1999 - county P47_3 / P47_2
TST00325 Proportion of males aged 16+ who worked in 1999 - tract P47_3 / P47_2
BST00325 Proportion of males aged 16+ who worked in 1999 - block group P47_3 / P47_2
CST00326 Proportion of males aged 16+ who usually worked 35 hours or more per week for 48 weeks or more in 1999 - county
(P47_5 + P47_6) / P47_2
44
Variable Name Description Formula
TST00326 Proportion of males aged 16+ who usually worked 35 hours or more per week for 48 weeks or more in 1999 - tract
(P47_5 + P47_6) / P47_2
BST00326 Proportion of males aged 16+ who usually worked 35 hours or more per week for 48 weeks or more in 1999 - block group
(P47_5 + P47_6) / P47_2
CST00327 Among males aged 16+ who worked in 1999, proportion who usually worked 35+ hours per week for 48+ weeks - county
(P47_5 + P47_6) / P47_3
TST00327 Among males aged 16+ who worked in 1999, proportion who usually worked 35+ hours per week for 48+ weeks - tract
(P47_5 + P47_6) / P47_3
BST00327 Among males aged 16+ who worked in 1999, proportion who usually worked 35+ hours per week for 48+ weeks - block group
(P47_5 + P47_6) / P47_3
CST00328 Proportion of persons aged 16+ in the labor force who are in armed forces, 2000 - county
(P43_4 + P43_11) / (P43_3 + P43_10)
TST00328 Proportion of persons aged 16+ in the labor force who are in armed forces, 2000 - tract
(P43_4 + P43_11) / (P43_3 + P43_10)
BST00328 Proportion of persons aged 16+ in the labor force who are in armed forces, 2000 - block group
(P43_4 + P43_11) / (P43_3 + P43_10)
CST00329 Proportion of males aged 16+ in the labor force who are in armed forces, 2000 - county
P43_4 / P43_3
TST00329 Proportion of males aged 16+ in the labor force who are in armed forces, 2000 - tract
P43_4 / P43_3
BST00329 Proportion of males aged 16+ in the labor force who are in armed forces, 2000 - block group
P43_4 / P43_3
CST00330 Proportion of females aged 16+ in the labor force who are in armed forces, 2000 - county
P43_11 / P43_10
45
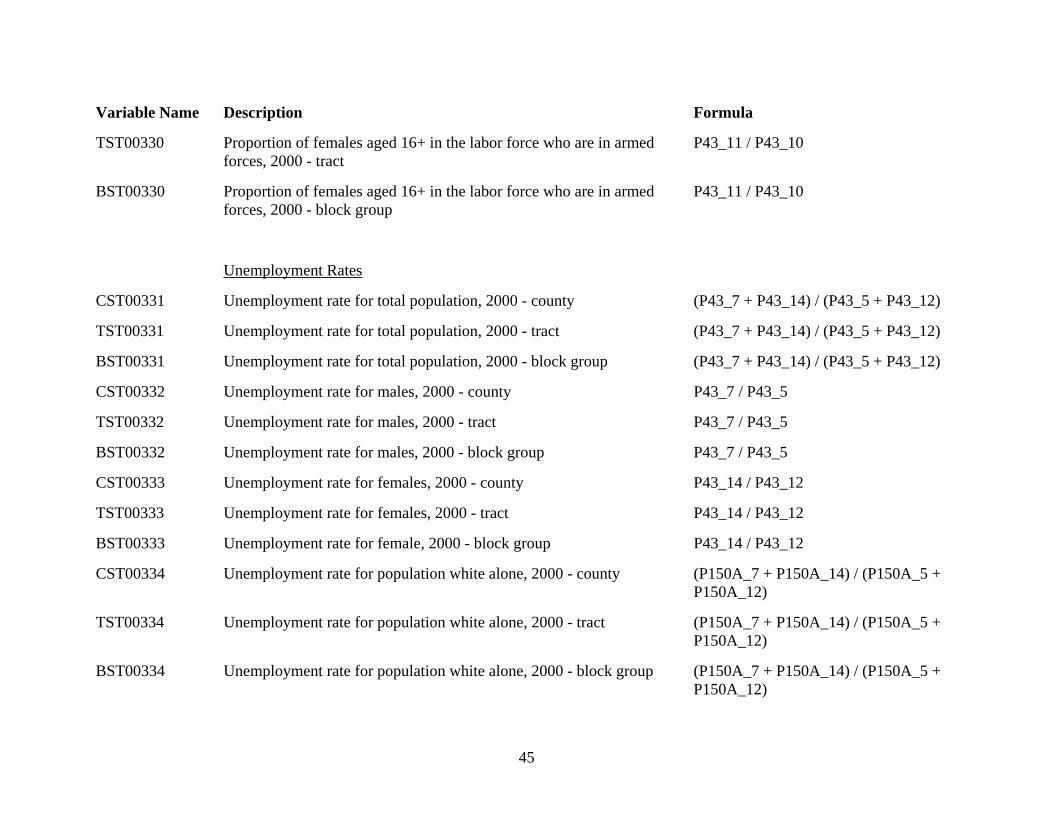
Variable Name Description Formula
TST00330 Proportion of females aged 16+ in the labor force who are in armed forces, 2000 - tract
P43_11 / P43_10
BST00330 Proportion of females aged 16+ in the labor force who are in armed forces, 2000 - block group
P43_11 / P43_10
Unemployment Rates
CST00331 Unemployment rate for total population, 2000 - county (P43_7 + P43_14) / (P43_5 + P43_12)
TST00331 Unemployment rate for total population, 2000 - tract (P43_7 + P43_14) / (P43_5 + P43_12)
BST00331 Unemployment rate for total population, 2000 - block group (P43_7 + P43_14) / (P43_5 + P43_12)
CST00332 Unemployment rate for males, 2000 - county P43_7 / P43_5
TST00332 Unemployment rate for males, 2000 - tract P43_7 / P43_5
BST00332 Unemployment rate for males, 2000 - block group P43_7 / P43_5
CST00333 Unemployment rate for females, 2000 - county P43_14 / P43_12
TST00333 Unemployment rate for females, 2000 - tract P43_14 / P43_12
BST00333 Unemployment rate for female, 2000 - block group P43_14 / P43_12
CST00334 Unemployment rate for population white alone, 2000 - county (P150A_7 + P150A_14) / (P150A_5 + P150A_12)
TST00334 Unemployment rate for population white alone, 2000 - tract (P150A_7 + P150A_14) / (P150A_5 + P150A_12)
BST00334 Unemployment rate for population white alone, 2000 - block group (P150A_7 + P150A_14) / (P150A_5 + P150A_12)
46
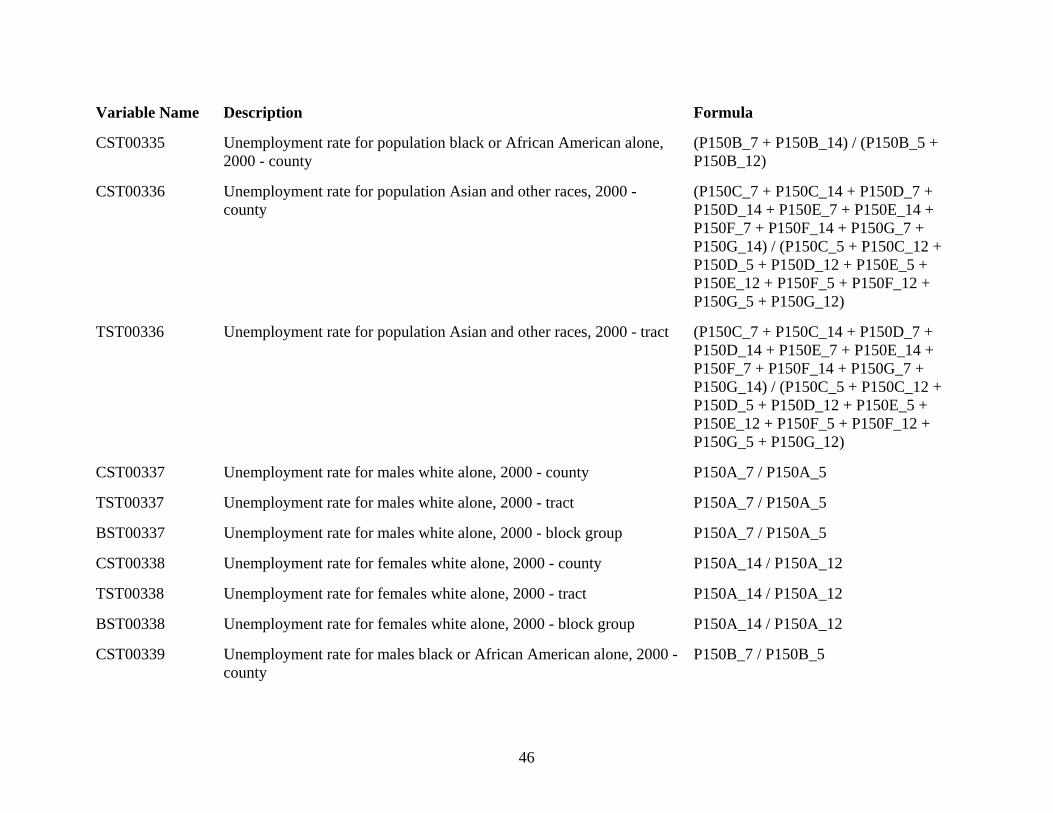
Variable Name Description Formula
CST00335 Unemployment rate for population black or African American alone, 2000 - county
(P150B_7 + P150B_14) / (P150B_5 + P150B_12)
CST00336 Unemployment rate for population Asian and other races, 2000 - county
(P150C_7 + P150C_14 + P150D_7 + P150D_14 + P150E_7 + P150E_14 + P150F_7 + P150F_14 + P150G_7 + P150G_14) / (P150C_5 + P150C_12 + P150D_5 + P150D_12 + P150E_5 + P150E_12 + P150F_5 + P150F_12 + P150G_5 + P150G_12)
TST00336 Unemployment rate for population Asian and other races, 2000 - tract (P150C_7 + P150C_14 + P150D_7 + P150D_14 + P150E_7 + P150E_14 + P150F_7 + P150F_14 + P150G_7 + P150G_14) / (P150C_5 + P150C_12 + P150D_5 + P150D_12 + P150E_5 + P150E_12 + P150F_5 + P150F_12 + P150G_5 + P150G_12)
CST00337 Unemployment rate for males white alone, 2000 - county P150A_7 / P150A_5
TST00337 Unemployment rate for males white alone, 2000 - tract P150A_7 / P150A_5
BST00337 Unemployment rate for males white alone, 2000 - block group P150A_7 / P150A_5
CST00338 Unemployment rate for females white alone, 2000 - county P150A_14 / P150A_12
TST00338 Unemployment rate for females white alone, 2000 - tract P150A_14 / P150A_12
BST00338 Unemployment rate for females white alone, 2000 - block group P150A_14 / P150A_12
CST00339 Unemployment rate for males black or African American alone, 2000 - county
P150B_7 / P150B_5
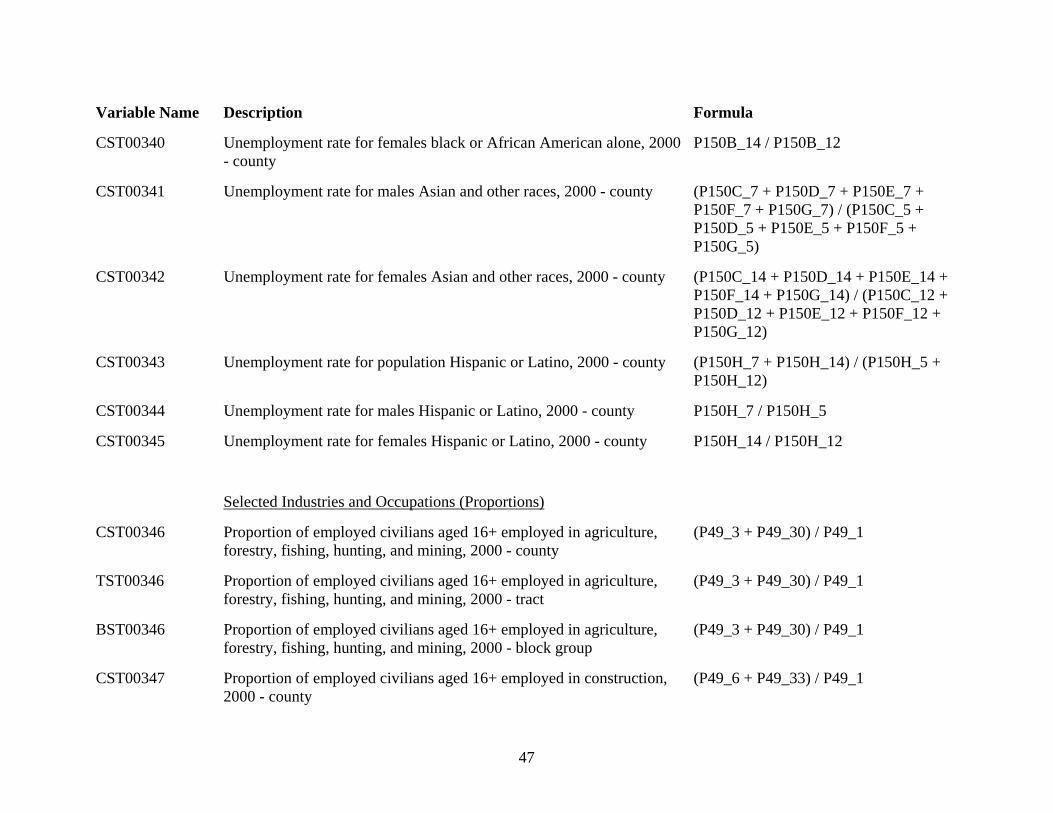
47
Variable Name Description Formula
CST00340 Unemployment rate for females black or African American alone, 2000 - county
P150B_14 / P150B_12
CST00341 Unemployment rate for males Asian and other races, 2000 - county (P150C_7 + P150D_7 + P150E_7 + P150F_7 + P150G_7) / (P150C_5 + P150D_5 + P150E_5 + P150F_5 + P150G_5)
CST00342 Unemployment rate for females Asian and other races, 2000 - county (P150C_14 + P150D_14 + P150E_14 + P150F_14 + P150G_14) / (P150C_12 + P150D_12 + P150E_12 + P150F_12 + P150G_12)
CST00343 Unemployment rate for population Hispanic or Latino, 2000 - county (P150H_7 + P150H_14) / (P150H_5 + P150H_12)
CST00344 Unemployment rate for males Hispanic or Latino, 2000 - county P150H_7 / P150H_5
CST00345 Unemployment rate for females Hispanic or Latino, 2000 - county P150H_14 / P150H_12
Selected Industries and Occupations (Proportions)
CST00346 Proportion of employed civilians aged 16+ employed in agriculture, forestry, fishing, hunting, and mining, 2000 - county
(P49_3 + P49_30) / P49_1
TST00346 Proportion of employed civilians aged 16+ employed in agriculture, forestry, fishing, hunting, and mining, 2000 - tract
(P49_3 + P49_30) / P49_1
BST00346 Proportion of employed civilians aged 16+ employed in agriculture, forestry, fishing, hunting, and mining, 2000 - block group
(P49_3 + P49_30) / P49_1
CST00347 Proportion of employed civilians aged 16+ employed in construction, 2000 - county
(P49_6 + P49_33) / P49_1
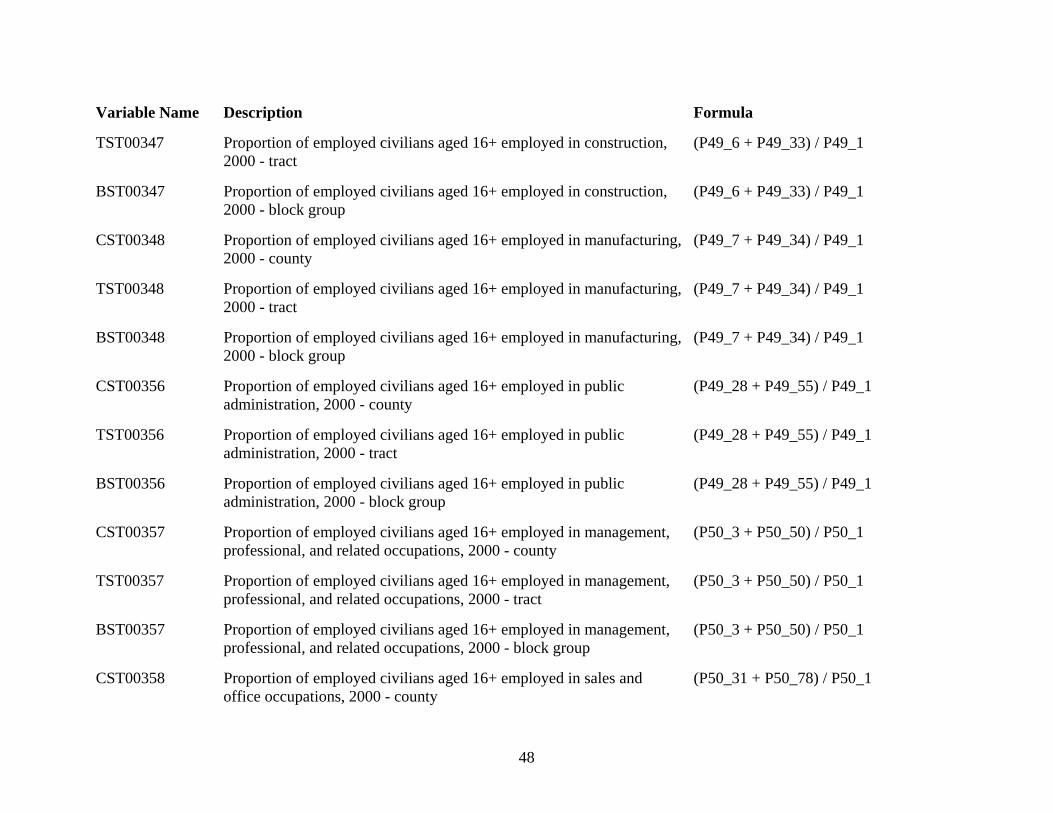
48
Variable Name Description Formula
TST00347 Proportion of employed civilians aged 16+ employed in construction, 2000 - tract
(P49_6 + P49_33) / P49_1
BST00347 Proportion of employed civilians aged 16+ employed in construction, 2000 - block group
(P49_6 + P49_33) / P49_1
CST00348 Proportion of employed civilians aged 16+ employed in manufacturing, 2000 - county
(P49_7 + P49_34) / P49_1
TST00348 Proportion of employed civilians aged 16+ employed in manufacturing, 2000 - tract
(P49_7 + P49_34) / P49_1
BST00348 Proportion of employed civilians aged 16+ employed in manufacturing, 2000 - block group
(P49_7 + P49_34) / P49_1
CST00356 Proportion of employed civilians aged 16+ employed in public administration, 2000 - county
(P49_28 + P49_55) / P49_1
TST00356 Proportion of employed civilians aged 16+ employed in public administration, 2000 - tract
(P49_28 + P49_55) / P49_1
BST00356 Proportion of employed civilians aged 16+ employed in public administration, 2000 - block group
(P49_28 + P49_55) / P49_1
CST00357 Proportion of employed civilians aged 16+ employed in management, professional, and related occupations, 2000 - county
(P50_3 + P50_50) / P50_1
TST00357 Proportion of employed civilians aged 16+ employed in management, professional, and related occupations, 2000 - tract
(P50_3 + P50_50) / P50_1
BST00357 Proportion of employed civilians aged 16+ employed in management, professional, and related occupations, 2000 - block group
(P50_3 + P50_50) / P50_1
CST00358 Proportion of employed civilians aged 16+ employed in sales and office occupations, 2000 - county
(P50_31 + P50_78) / P50_1
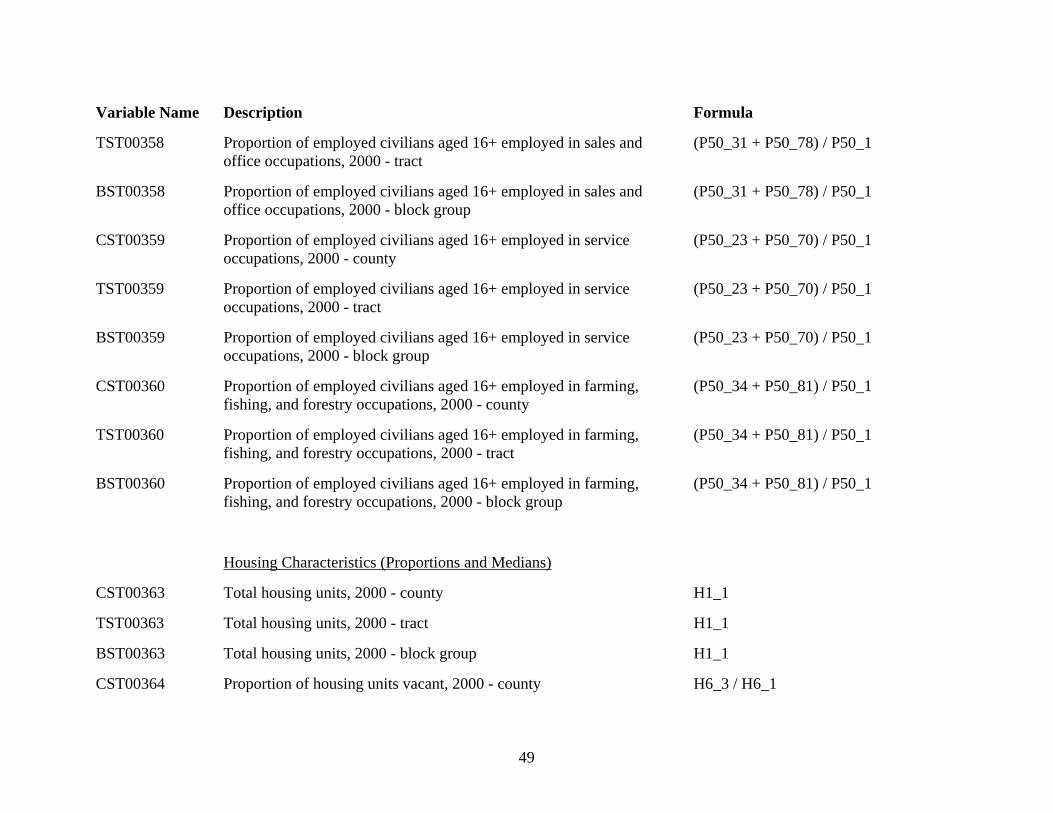
49
Variable Name Description Formula
TST00358 Proportion of employed civilians aged 16+ employed in sales and office occupations, 2000 - tract
(P50_31 + P50_78) / P50_1
BST00358 Proportion of employed civilians aged 16+ employed in sales and office occupations, 2000 - block group
(P50_31 + P50_78) / P50_1
CST00359 Proportion of employed civilians aged 16+ employed in service occupations, 2000 - county
(P50_23 + P50_70) / P50_1
TST00359 Proportion of employed civilians aged 16+ employed in service occupations, 2000 - tract
(P50_23 + P50_70) / P50_1
BST00359 Proportion of employed civilians aged 16+ employed in service occupations, 2000 - block group
(P50_23 + P50_70) / P50_1
CST00360 Proportion of employed civilians aged 16+ employed in farming, fishing, and forestry occupations, 2000 - county
(P50_34 + P50_81) / P50_1
TST00360 Proportion of employed civilians aged 16+ employed in farming, fishing, and forestry occupations, 2000 - tract
(P50_34 + P50_81) / P50_1
BST00360 Proportion of employed civilians aged 16+ employed in farming, fishing, and forestry occupations, 2000 - block group
(P50_34 + P50_81) / P50_1
Housing Characteristics (Proportions and Medians)
CST00363 Total housing units, 2000 - county H1_1
TST00363 Total housing units, 2000 - tract H1_1
BST00363 Total housing units, 2000 - block group H1_1
CST00364 Proportion of housing units vacant, 2000 - county H6_3 / H6_1
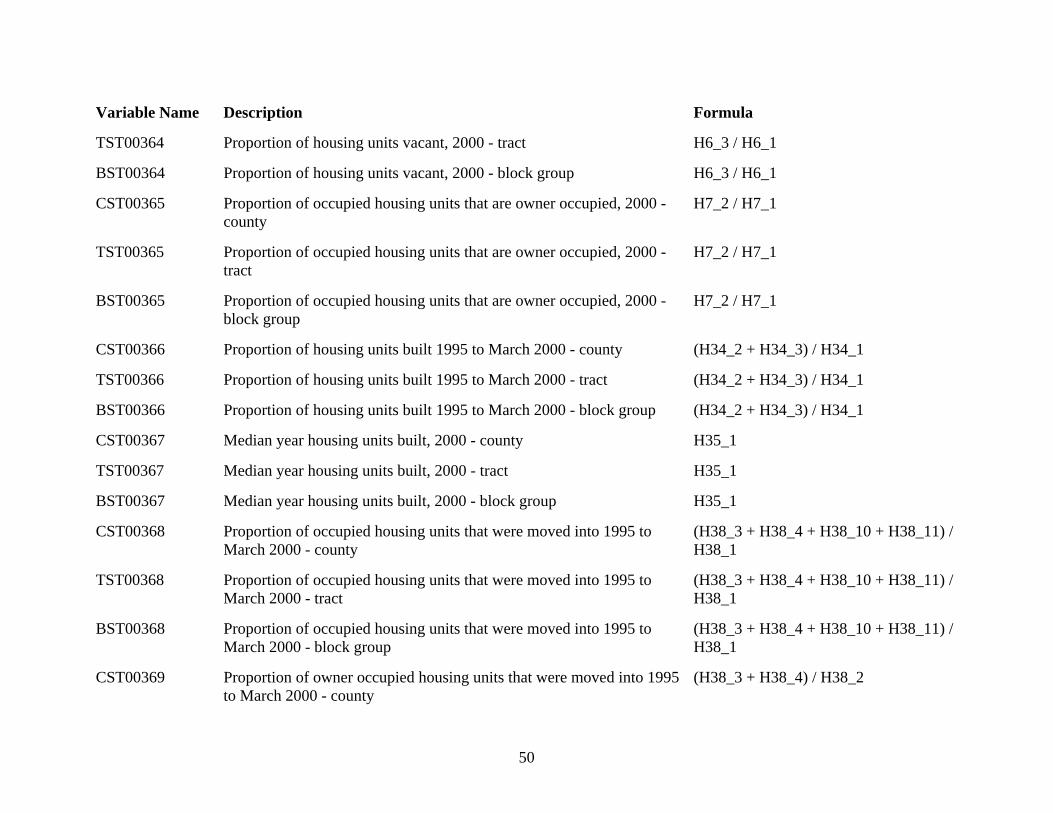
50
Variable Name Description Formula
TST00364 Proportion of housing units vacant, 2000 - tract H6_3 / H6_1
BST00364 Proportion of housing units vacant, 2000 - block group H6_3 / H6_1
CST00365 Proportion of occupied housing units that are owner occupied, 2000 - county
H7_2 / H7_1
TST00365 Proportion of occupied housing units that are owner occupied, 2000 - tract
H7_2 / H7_1
BST00365 Proportion of occupied housing units that are owner occupied, 2000 - block group
H7_2 / H7_1
CST00366 Proportion of housing units built 1995 to March 2000 - county (H34_2 + H34_3) / H34_1
TST00366 Proportion of housing units built 1995 to March 2000 - tract (H34_2 + H34_3) / H34_1
BST00366 Proportion of housing units built 1995 to March 2000 - block group (H34_2 + H34_3) / H34_1
CST00367 Median year housing units built, 2000 - county H35_1
TST00367 Median year housing units built, 2000 - tract H35_1
BST00367 Median year housing units built, 2000 - block group H35_1
CST00368 Proportion of occupied housing units that were moved into 1995 to March 2000 - county
(H38_3 + H38_4 + H38_10 + H38_11) / H38_1
TST00368 Proportion of occupied housing units that were moved into 1995 to March 2000 - tract
(H38_3 + H38_4 + H38_10 + H38_11) / H38_1
BST00368 Proportion of occupied housing units that were moved into 1995 to March 2000 - block group
(H38_3 + H38_4 + H38_10 + H38_11) / H38_1
CST00369 Proportion of owner occupied housing units that were moved into 1995 to March 2000 - county
(H38_3 + H38_4) / H38_2
51
Variable Name Description Formula
TST00369 Proportion of owner occupied housing units that were moved into 1995 to March 2000 - tract
(H38_3 + H38_4) / H38_2
BST00369 Proportion of owner occupied housing units that were moved into 1995 to March 2000 - block group
(H38_3 + H38_4) / H38_2
CST00370 Proportion of renter occupied housing units that were moved into 1995 to March 2000 - county
(H38_10 + H38_11) / H38_9
TST00370 Proportion of renter occupied housing units that were moved into 1995 to March 2000 - tract
(H38_10 + H38_11) / H38_9
BST00370 Proportion of renter occupied housing units that were moved into 1995 to March 2000 - block group
(H38_10 + H38_11) / H38_9
CST00371 Median gross rent of specified renter-occupied housing units paying cash rent, 2000 - county
H63_1
TST00371 Median gross rent of specified renter-occupied housing units paying cash rent, 2000 - tract
H63_1
CST00373 Median value of specified owner-occupied housing units, 2000 - county
H76_1
TST00373 Median value of specified owner-occupied housing units, 2000 - tract H76_1
BST00373 Median value of specified owner-occupied housing units, 2000 - block group
H76_1
CST00375 Proportion of housing units lacking complete plumbing facilities, 2000 - county
H47_3 / H47_1
TST00375 Proportion of housing units lacking complete plumbing facilities, 2000 - tract
H47_3 / H47_1
52
Variable Name Description Formula
BST00375 Proportion of housing units lacking complete plumbing facilities, 2000 - block group
H47_3 / H47_1
CST00376 Proportion of owner occupied housing units lacking complete plumbing facilities, 2000 - county
H48_4 / H48_2
TST00376 Proportion of owner occupied housing units lacking complete plumbing facilities, 2000 - tract
H48_4 / H48_2
BST00376 Proportion of owner occupied housing units lacking complete plumbing facilities, 2000 - block group
H48_4 / H48_2
CST00377 Proportion of renter occupied housing units lacking complete plumbing facilities, 2000 - county
H48_7 / H48_5
TST00377 Proportion of renter occupied housing units lacking complete plumbing facilities, 2000 - tract
H48_7 / H48_5
BST00377 Proportion of renter occupied housing units lacking complete plumbing facilities, 2000 - block group
H48_7 / H48_5
VARIABLES FROM THE COUNTY AND CITY DATA BOOK, 2000
Vital Statistics, Nursing and Personal Care Facilities, and Medicare Program Enrollment
B4_vst01 Population, 1997 (July 1) for birth and death rates - county B4-vst01
B4_vst02 Births, 1997 - county B4-vst02
B4_vst03 Birth rate (per 1,000 population), 1997 - county B4-vst03
B4_vst04 Deaths, 1997 - county B4-vst04
53
Variable Name Description Formula
B4_vst05 Death rate (per 1,000 population), 1997 - county B4-vst05
B4_vst06 Infant deaths (infants under 1 year old), 1997 - county B4-vst06
B4_vst07 Infant death rate (per 1,000 live births), 1997 - county B4-vst07
B4_hlt06 Nursing and personal care facility establishments, 1997 - county B4-hlt06
B4_hlt07 Nursing and personal care facility employees, 1997 - county B4-hlt07
B4_hlt08 Total Medicare program enrollment, 1999 - county B4-hlt08
B4_hlt09 Aged Medicare program enrollment (persons aged 65+), 1999 - county B4-hlt09
Crime, Housing, and Building Permits
B6_crm01 Total serious crimes known to police (as reported to FBI), 1999 - county
B6-crm01
B6_crm02 Serious violent crimes known to police (as reported to FBI), 1999 - county
B6-crm02
B6_crm03 Serious property crimes known to police (as reported to FBI), 1999 - county
B6-crm03
B6_crm04 Total serious crimes known to police (as reported to FBI), 1990 - county
B6-crm04
B6_crm05 FBI population, 1999 - county B6-crm05
B6_crm06 Crime rate (per 100,000 resident population provided by FBI), 1999 - county
B6-crm06
B6_crm07 FBI population, 1990 - county B6-crm07
54
Variable Name Description Formula
B6_crm08 Crime rate (per 100,000 resident population provided by FBI), 1990 - county
B6-crm08
B6_hsg01 Total housing units, 2000 - county B6-hsg01
B6_hsg02 Percent change in housing units, 1990-2000 - county B6-hsg02
B6_hsg03 Occupied housing units, 2000 - county B6-hsg03
B6_hsg04 Owner occupied housing units, 2000 - county B6-hsg04
B6_hsg05 Percent of occupied housing units that are owner occupied, 2000 - county
B6-hsg05
B6_bld01 New private housing units authorized by building permits, 2000 - county
B6-bld01
B6_bld02 New private housing units authorized by building permits in structures with one unit, 2000 - county
B6-bld02
B6_bld03 Percent of new private housing units authorized by building permits in structures with one unit, 2000 - county
B6-bld03
B6_bld04 New private housing units authorized by building permits in structures with 5+ units, 2000 - county
B6-bld04
B6_bld05 Percent of new private housing units authorized by building permits in structures with 5+ units, 2000 - county
B6-bld05
B6_bld06 Valuation ($1,000s) of new private housing units authorized by building permits, 2000 - county
B6-bld06
Labor Force and Private Business Establishments and Employment
55
Variable Name Description Formula
B7_clf01 Civilian labor force, 2000 - county B7-clf01
B7_clf02 Civilian labor force, 1999 - county B7-clf02
B7_clf03 Percent change of civilian labor force, 1999-2000 - county B7-clf03
B7_clf04 Unemployed civilian labor force, 2000 - county B7-clf04
B7_clf05 Unemployment rate (percent), 2000 - county B7-clf05
B7_bus01 Private nonfarm business establishments, 1998 - county B7-bus01
B7_bus02 Percent change in number of private nonfarm business establishments, 1990-1998 - county
B7-bus02
B7_bus03 Private nonfarm business establishments, 1995 - county B7-bus03
B7_bus04 Private nonfarm business establishments, 1990 - county B7-bus04
B7_bus05 Employment in private nonfarm businesses, 1998 - county B7-bus05
B7_bus06 Percent change of employment in private nonfarm businesses, 1990-1998 - county
B7-bus06
B7_bus07 Employment in private nonfarm businesses, 1995 - county B7-bus07
B7_bus08 Employment in private nonfarm businesses, 1990 - county B7-bus08
B7_bus09 Annual payroll per employee in private nonfarm businesses, 1998 - county
B7-bus09
B7_bus10 Annual payroll per employee in private nonfarm businesses as percent of national average, 1998 - county
B7-bus10
Manufacturing
56
Variable Name Description Formula
B9_man01 Manufacturing (NAICS 31-33) establishments, 1997 - county B9-man01
B9_man02 Manufacturing (NAICS 31-33) establishments with 20+ employees, 1997 - county
B9-man02
B9_man03 Percent of manufacturing (NAICS 31-33) establishments with 20+ employees, 1997 - county
B9-man03
B9_man04 Manufacturing (NAICS 31-33) employees, 1997 - county B9-man04
B9_man05 Annual payroll ($1,000s) of manufacturing (NAICS 31-33) employees, 1997 - county
B9-man05
B9_man06 Manufacturing (NAICS 31-33) production workers, 1997 - county B9-man06
B9_man07 Wages ($1,000s) of manufacturing (NAICS 31-33) production workers, 1997 - county
B9-man07
B9_man08 Value added ($1,000s) by manufacture (NAICS 31-33), 1997 - county B9-man08
B9_man09 Value ($1,000s) of manufacturing (NAICS 31-33) shipments, 1997 - county
B9-man09
Wholesale Trade and Retail Trade
B11_whs01 Wholesale trade (NAICS 42) establishments, 1997 - county B11-whs01
B11_whs02 Wholesale trade (NAICS 42) sales ($1,000s), 1997 - county B11-whs02
B11_whs03 Merchant wholesalers sales ($1,000s), 1997 - county B11-whs03
B11_whs04 Wholesale trade (NAICS 42) paid employees 1997 - county B11-whs04
B11_whs05 Wholesale trade (NAICS 42) annual payroll ($1,000s), 1997 - county B11-whs05
57
Variable Name Description Formula
B11_whs06 Wholesale trade (NAICS 42) operating expenses ($1,000s), 1997 - county
B11-whs06
B11_rtl01 Retail trade (NAICS 44-45) establishments, 1997 - county B11-rtl01
B11_rtl02 Retail trade (NAICS 44-45) sales ($1,000s), 1997 - county B11-rtl02
B11_rtl03 Population, 1997 (July 1) - county B11-rtl03
B11_rtl04 Per capita retail trade (NAICS 44-45) sales, 1997 - county B11-rtl04
B11_rtl05 Per capita retail trade (NAICS 44-45) sales as percent of national average, 1997 - county
B11-rtl05
B11_rtl06 General merchandise stores sales ($1,000s), 1997 - county B11-rtl06
B11_rtl07 Percent of retail trade (NAICS 44-45) sales from general merchandise stores, 1997 - county
B11-rtl07
B11_rtl08 Retail trade (NAICS 44-45) paid employees, 1997 - county B11-rtl08
B11_rtl09 Retail trade (NAICS 44-45) annual payroll ($1,000s), 1997 - county B11-rtl09
B11_trl10 Retail trade (NAICS 44-45) annual payroll paid per paid employee, 1997 - county
B11-trl10
Federal Funds
B12_fed01 Total expenditures or obligations ($1,000s) of federal funds and grants, 1999 - county
B12-fed01
B12_fed02 Total expenditures or obligations ($1,000s) of federal funds and grants, 1990 - county
B12-fed02
58
Variable Name Description Formula
B12_fed03 Percent change in federal funds and grants, 1990-1999 - county B12-fed03
B12_fed04 Population, 1999 (July 1) - county B12-fed04
B12_fed05 Total per capita federal funds and grants, 1999 - county B12-fed05
B12_fed06 Per capita federal funds and grants direct payments for individuals, 1999 - county
B12-fed06
B12_fed07 Federal funds and grants direct payments for individuals ($1,000s), 1999 - county
B12-fed07
B12_fed08 Per capita federal funds and grants procurement contract awards, 1999 - county
B12-fed08
B12_fed09 Federal funds and grants procurement contract awards ($1,000s), 1999 - county
B12-fed09
B12_fed10 Per capita federal funds and grants salaries and wages, 1999 - county B12-fed10
B12_fed11 Federal funds and grants salaries and wages ($1,000s), 1999 - county B12-fed11
B12_fed12 Per capita federal funds and grants grant awards, 1999 - county B12-fed12
B12_fed13 Federal funds and grants grant awards ($1,000s), 1999 - county B12-fed13
Government Programs, Employment, and Finances
B13_pop01 Population for rate, 1999 (July 1) - county B13-pop01
B13_soc01 Social Security Program beneficiaries, December 1999 - county B13-soc01
B13_soc02 Social Security Program beneficiaries, 1990 - county B13-soc02
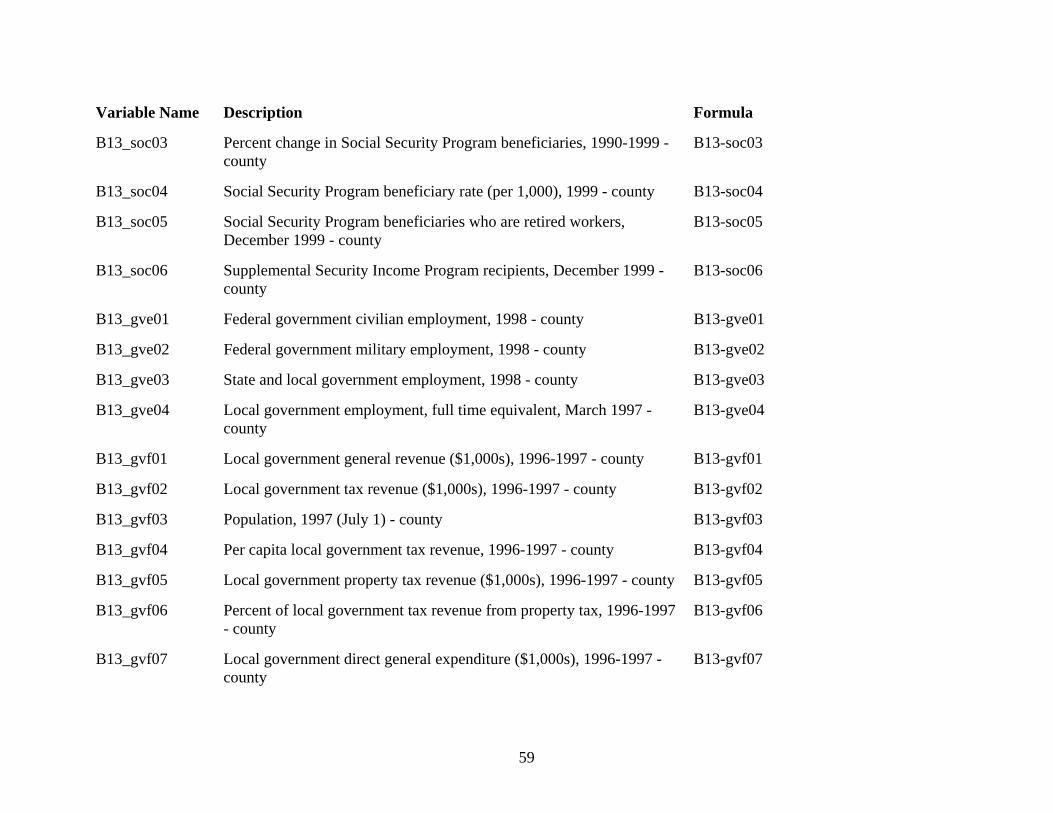
59
Variable Name Description Formula
B13_soc03 Percent change in Social Security Program beneficiaries, 1990-1999 - county
B13-soc03
B13_soc04 Social Security Program beneficiary rate (per 1,000), 1999 - county B13-soc04
B13_soc05 Social Security Program beneficiaries who are retired workers, December 1999 - county
B13-soc05
B13_soc06 Supplemental Security Income Program recipients, December 1999 - county
B13-soc06
B13_gve01 Federal government civilian employment, 1998 - county B13-gve01
B13_gve02 Federal government military employment, 1998 - county B13-gve02
B13_gve03 State and local government employment, 1998 - county B13-gve03
B13_gve04 Local government employment, full time equivalent, March 1997 - county
B13-gve04
B13_gvf01 Local government general revenue ($1,000s), 1996-1997 - county B13-gvf01
B13_gvf02 Local government tax revenue ($1,000s), 1996-1997 - county B13-gvf02
B13_gvf03 Population, 1997 (July 1) - county B13-gvf03
B13_gvf04 Per capita local government tax revenue, 1996-1997 - county B13-gvf04
B13_gvf05 Local government property tax revenue ($1,000s), 1996-1997 - county B13-gvf05
B13_gvf06 Percent of local government tax revenue from property tax, 1996-1997 - county
B13-gvf06
B13_gvf07 Local government direct general expenditure ($1,000s), 1996-1997 - county
B13-gvf07
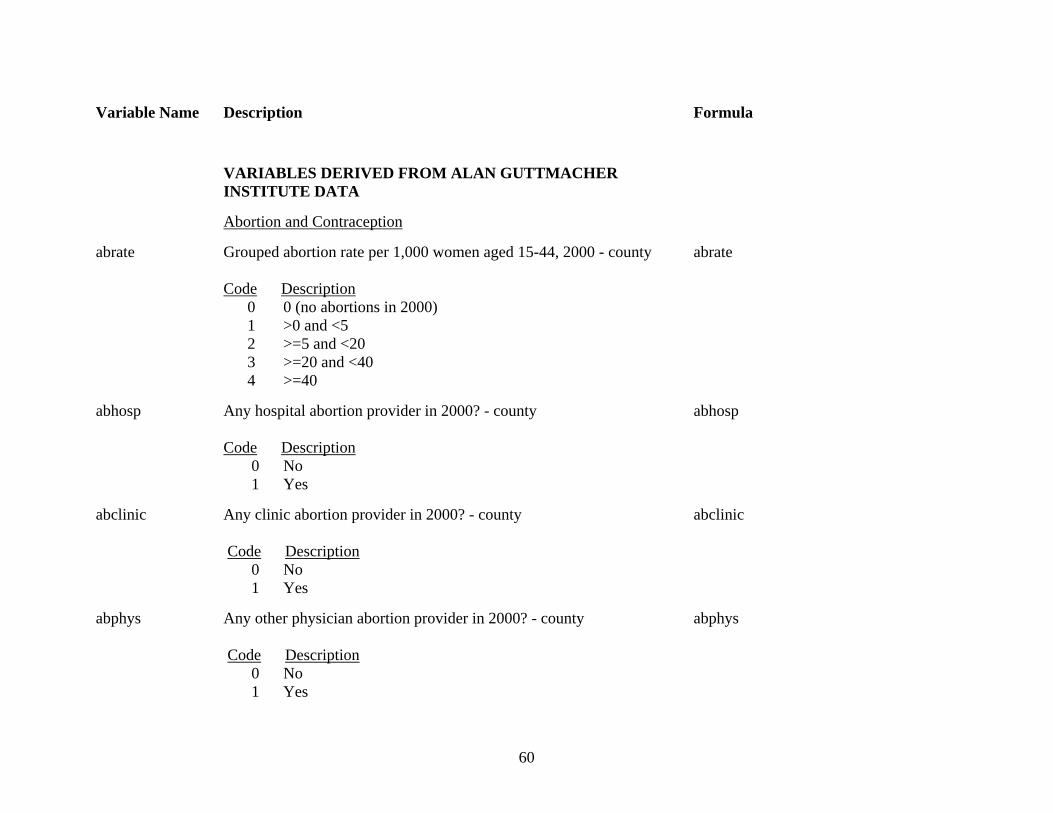
60
Variable Name Description Formula
VARIABLES DERIVED FROM ALAN GUTTMACHER INSTITUTE DATA
Abortion and Contraception
abrate Grouped abortion rate per 1,000 women aged 15-44, 2000 - county Code Description 0 0 (no abortions in 2000) 1 >0 and <5 2 >=5 and <20 3 >=20 and <40 4 >=40
abrate
abhosp Any hospital abortion provider in 2000? - county Code Description 0 No 1 Yes
abhosp
abclinic Any clinic abortion provider in 2000? - county Code Description 0 No 1 Yes
abclinic
abphys Any other physician abortion provider in 2000? - county Code Description 0 No 1 Yes
abphys
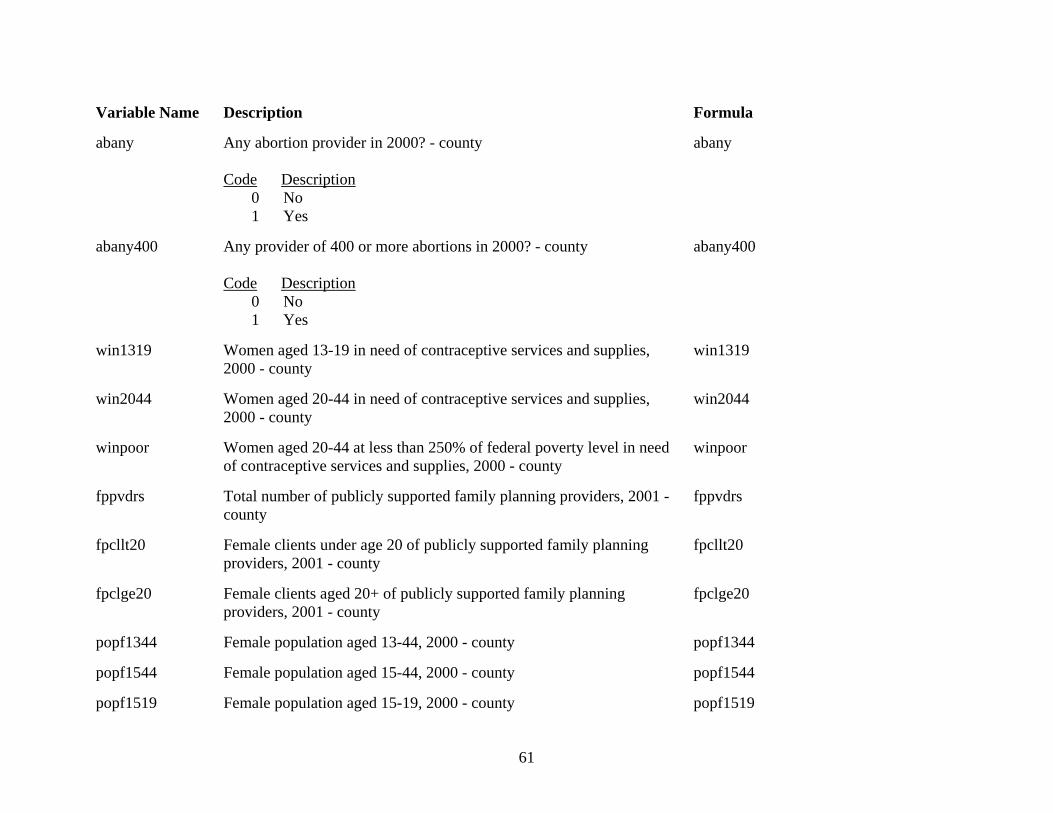
61
Variable Name Description Formula
abany Any abortion provider in 2000? - county Code Description 0 No 1 Yes
abany
abany400 Any provider of 400 or more abortions in 2000? - county Code Description 0 No 1 Yes
abany400
win1319 Women aged 13-19 in need of contraceptive services and supplies, 2000 - county
win1319
win2044 Women aged 20-44 in need of contraceptive services and supplies, 2000 - county
win2044
winpoor Women aged 20-44 at less than 250% of federal poverty level in need of contraceptive services and supplies, 2000 - county
winpoor
fppvdrs Total number of publicly supported family planning providers, 2001 - county
fppvdrs
fpcllt20 Female clients under age 20 of publicly supported family planning providers, 2001 - county
fpcllt20
fpclge20 Female clients aged 20+ of publicly supported family planning providers, 2001 - county
fpclge20
popf1344 Female population aged 13-44, 2000 - county popf1344
popf1544 Female population aged 15-44, 2000 - county popf1544
popf1519 Female population aged 15-19, 2000 - county popf1519
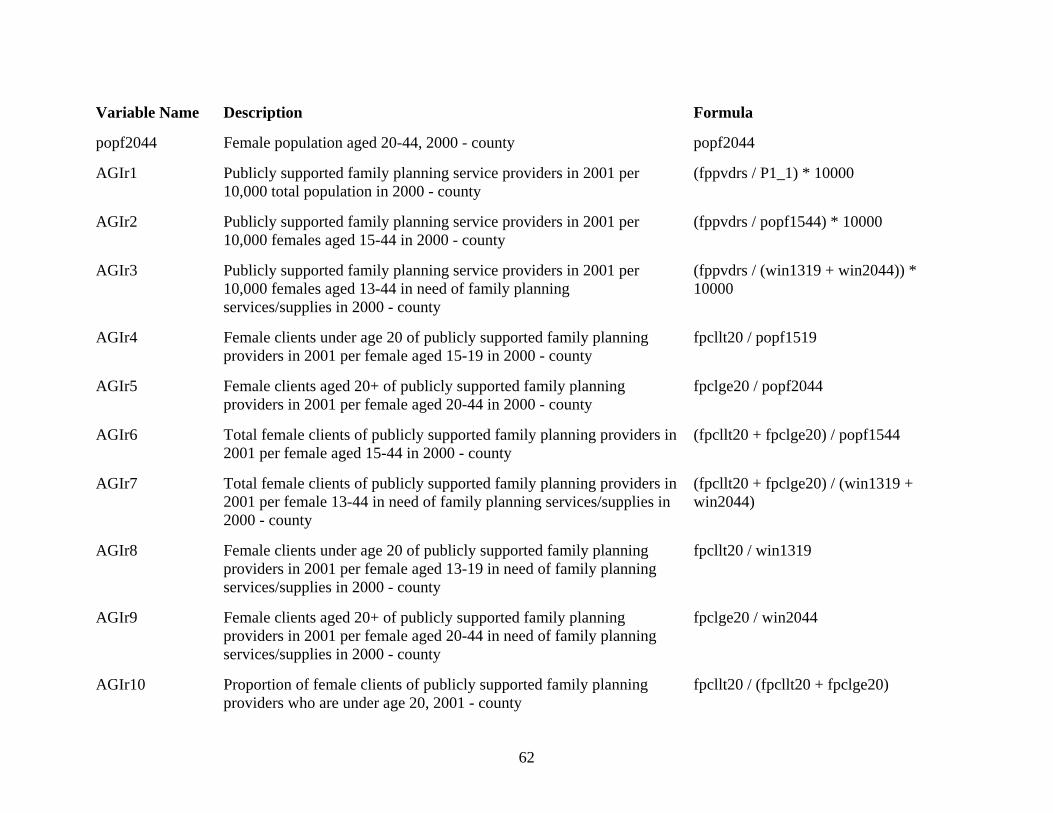
62
Variable Name Description Formula
popf2044 Female population aged 20-44, 2000 - county popf2044
AGIr1 Publicly supported family planning service providers in 2001 per 10,000 total population in 2000 - county
(fppvdrs / P1_1) * 10000
AGIr2 Publicly supported family planning service providers in 2001 per 10,000 females aged 15-44 in 2000 - county
(fppvdrs / popf1544) * 10000
AGIr3 Publicly supported family planning service providers in 2001 per 10,000 females aged 13-44 in need of family planning services/supplies in 2000 - county
(fppvdrs / (win1319 + win2044)) * 10000
AGIr4 Female clients under age 20 of publicly supported family planning providers in 2001 per female aged 15-19 in 2000 - county
fpcllt20 / popf1519
AGIr5 Female clients aged 20+ of publicly supported family planning providers in 2001 per female aged 20-44 in 2000 - county
fpclge20 / popf2044
AGIr6 Total female clients of publicly supported family planning providers in 2001 per female aged 15-44 in 2000 - county
(fpcllt20 + fpclge20) / popf1544
AGIr7 Total female clients of publicly supported family planning providers in 2001 per female 13-44 in need of family planning services/supplies in 2000 - county
(fpcllt20 + fpclge20) / (win1319 + win2044)
AGIr8 Female clients under age 20 of publicly supported family planning providers in 2001 per female aged 13-19 in need of family planning services/supplies in 2000 - county
fpcllt20 / win1319
AGIr9 Female clients aged 20+ of publicly supported family planning providers in 2001 per female aged 20-44 in need of family planning services/supplies in 2000 - county
fpclge20 / win2044
AGIr10 Proportion of female clients of publicly supported family planning providers who are under age 20, 2001 - county
fpcllt20 / (fpcllt20 + fpclge20)
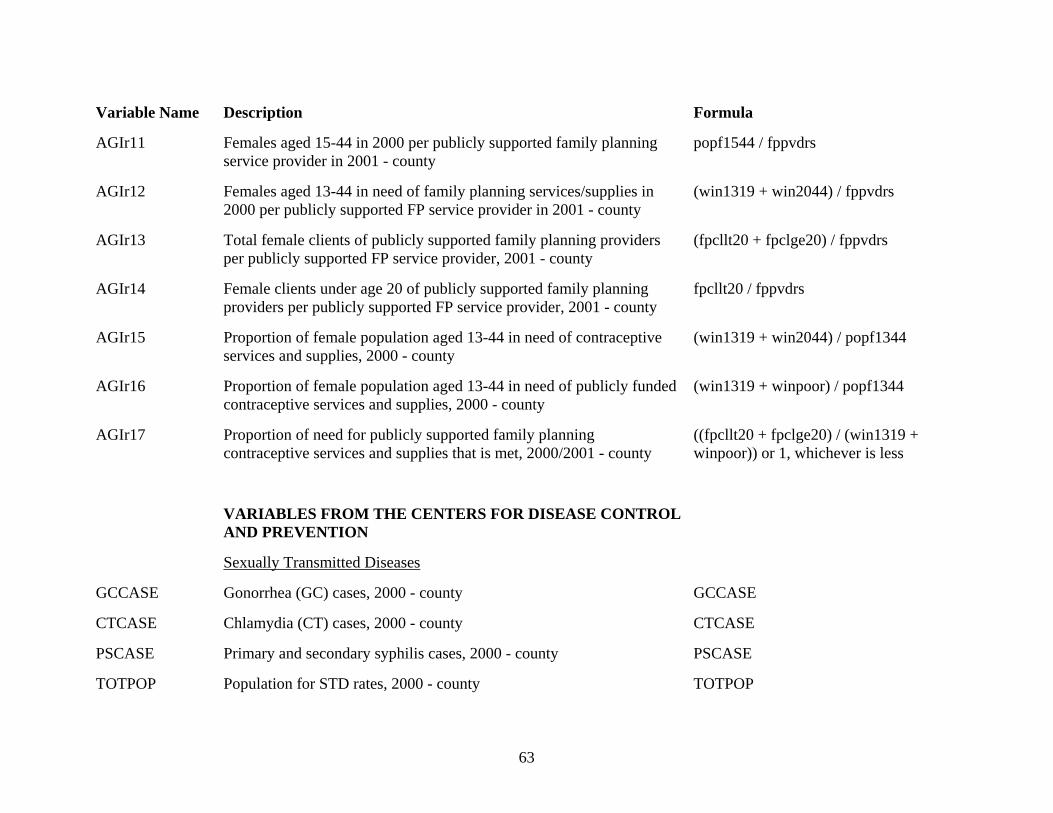
63
Variable Name Description Formula
AGIr11 Females aged 15-44 in 2000 per publicly supported family planning service provider in 2001 - county
popf1544 / fppvdrs
AGIr12 Females aged 13-44 in need of family planning services/supplies in 2000 per publicly supported FP service provider in 2001 - county
(win1319 + win2044) / fppvdrs
AGIr13 Total female clients of publicly supported family planning providers per publicly supported FP service provider, 2001 - county
(fpcllt20 + fpclge20) / fppvdrs
AGIr14 Female clients under age 20 of publicly supported family planning providers per publicly supported FP service provider, 2001 - county
fpcllt20 / fppvdrs
AGIr15 Proportion of female population aged 13-44 in need of contraceptive services and supplies, 2000 - county
(win1319 + win2044) / popf1344
AGIr16 Proportion of female population aged 13-44 in need of publicly funded contraceptive services and supplies, 2000 - county
(win1319 + winpoor) / popf1344
AGIr17 Proportion of need for publicly supported family planning contraceptive services and supplies that is met, 2000/2001 - county
((fpcllt20 + fpclge20) / (win1319 + winpoor)) or 1, whichever is less
VARIABLES FROM THE CENTERS FOR DISEASE CONTROL AND PREVENTION
Sexually Transmitted Diseases
GCCASE Gonorrhea (GC) cases, 2000 - county GCCASE
CTCASE Chlamydia (CT) cases, 2000 - county CTCASE
PSCASE Primary and secondary syphilis cases, 2000 - county PSCASE
TOTPOP Population for STD rates, 2000 - county TOTPOP
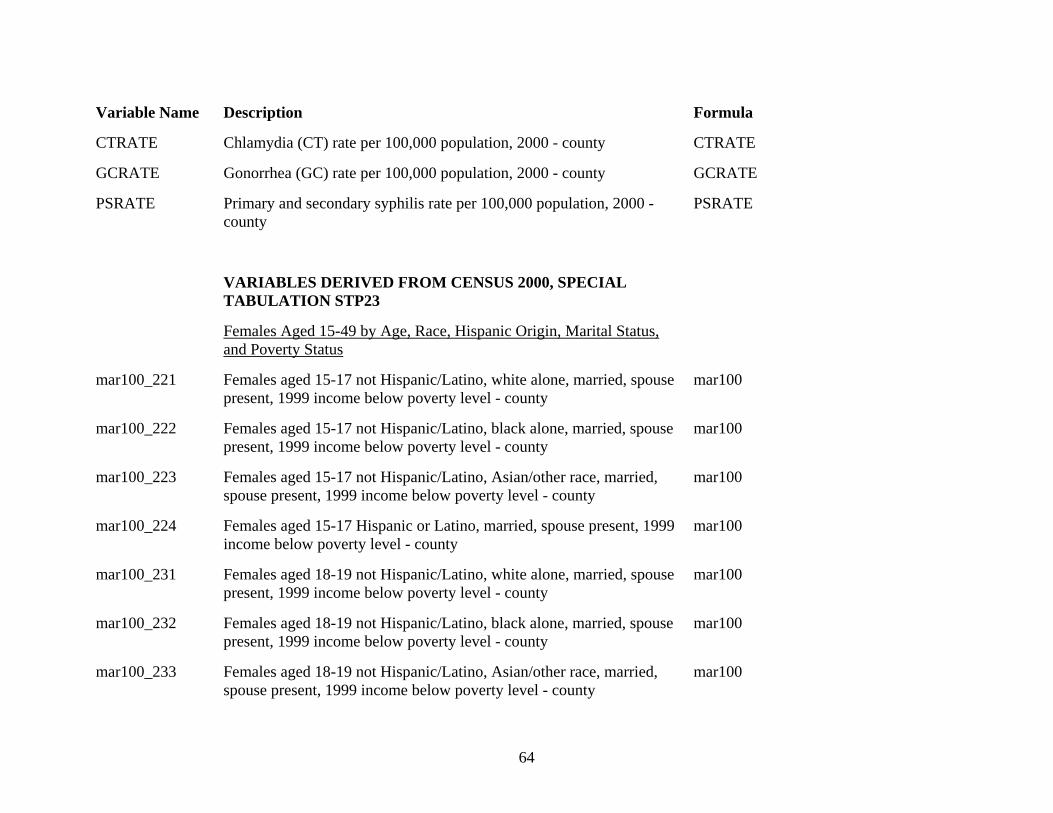
64
Variable Name Description Formula
CTRATE Chlamydia (CT) rate per 100,000 population, 2000 - county CTRATE
GCRATE Gonorrhea (GC) rate per 100,000 population, 2000 - county GCRATE
PSRATE Primary and secondary syphilis rate per 100,000 population, 2000 - county
PSRATE
VARIABLES DERIVED FROM CENSUS 2000, SPECIAL TABULATION STP23
Females Aged 15-49 by Age, Race, Hispanic Origin, Marital Status, and Poverty Status
mar100_221 Females aged 15-17 not Hispanic/Latino, white alone, married, spouse present, 1999 income below poverty level - county
mar100
mar100_222 Females aged 15-17 not Hispanic/Latino, black alone, married, spouse present, 1999 income below poverty level - county
mar100
mar100_223 Females aged 15-17 not Hispanic/Latino, Asian/other race, married, spouse present, 1999 income below poverty level - county
mar100
mar100_224 Females aged 15-17 Hispanic or Latino, married, spouse present, 1999 income below poverty level - county
mar100
mar100_231 Females aged 18-19 not Hispanic/Latino, white alone, married, spouse present, 1999 income below poverty level - county
mar100
mar100_232 Females aged 18-19 not Hispanic/Latino, black alone, married, spouse present, 1999 income below poverty level - county
mar100
mar100_233 Females aged 18-19 not Hispanic/Latino, Asian/other race, married, spouse present, 1999 income below poverty level - county
mar100
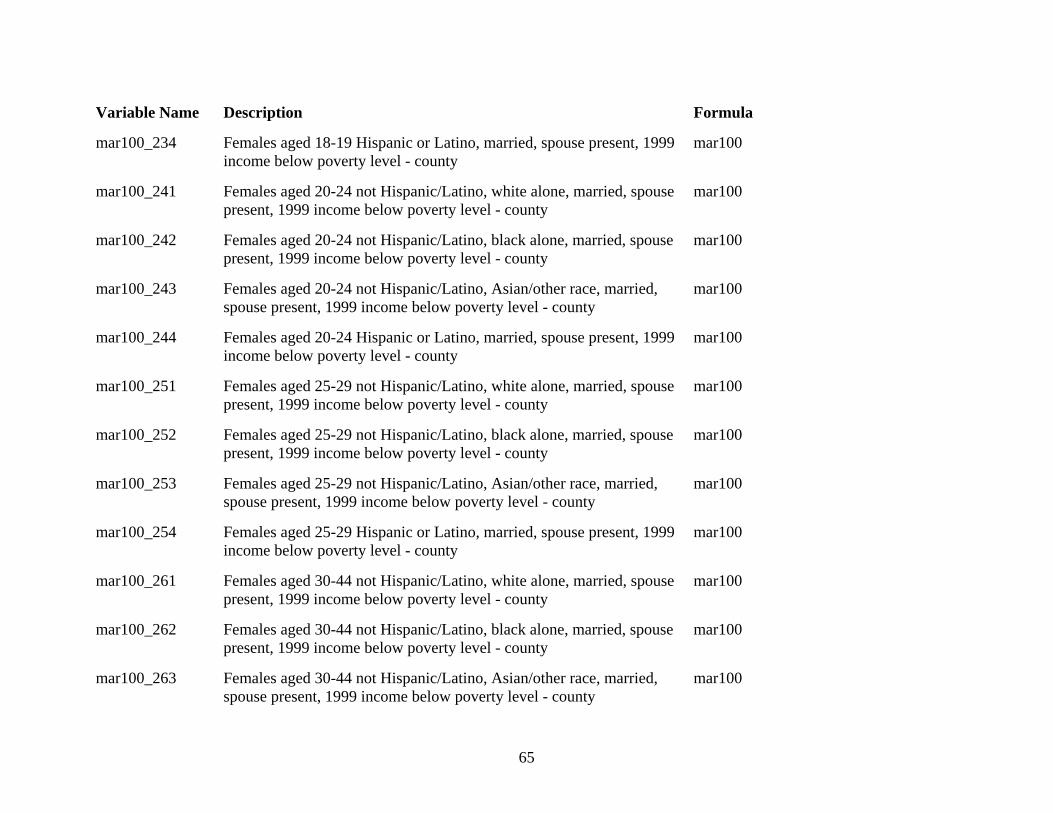
65
Variable Name Description Formula
mar100_234 Females aged 18-19 Hispanic or Latino, married, spouse present, 1999 income below poverty level - county
mar100
mar100_241 Females aged 20-24 not Hispanic/Latino, white alone, married, spouse present, 1999 income below poverty level - county
mar100
mar100_242 Females aged 20-24 not Hispanic/Latino, black alone, married, spouse present, 1999 income below poverty level - county
mar100
mar100_243 Females aged 20-24 not Hispanic/Latino, Asian/other race, married, spouse present, 1999 income below poverty level - county
mar100
mar100_244 Females aged 20-24 Hispanic or Latino, married, spouse present, 1999 income below poverty level - county
mar100
mar100_251 Females aged 25-29 not Hispanic/Latino, white alone, married, spouse present, 1999 income below poverty level - county
mar100
mar100_252 Females aged 25-29 not Hispanic/Latino, black alone, married, spouse present, 1999 income below poverty level - county
mar100
mar100_253 Females aged 25-29 not Hispanic/Latino, Asian/other race, married, spouse present, 1999 income below poverty level - county
mar100
mar100_254 Females aged 25-29 Hispanic or Latino, married, spouse present, 1999 income below poverty level - county
mar100
mar100_261 Females aged 30-44 not Hispanic/Latino, white alone, married, spouse present, 1999 income below poverty level - county
mar100
mar100_262 Females aged 30-44 not Hispanic/Latino, black alone, married, spouse present, 1999 income below poverty level - county
mar100
mar100_263 Females aged 30-44 not Hispanic/Latino, Asian/other race, married, spouse present, 1999 income below poverty level - county
mar100
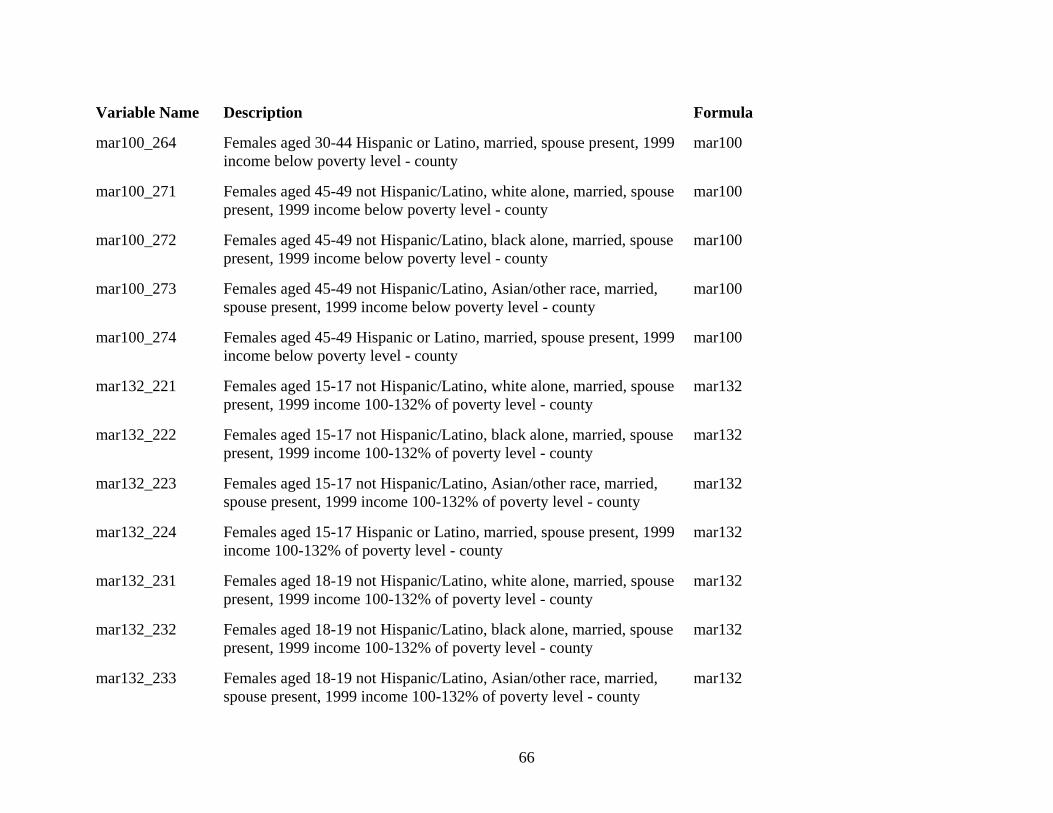
66
Variable Name Description Formula
mar100_264 Females aged 30-44 Hispanic or Latino, married, spouse present, 1999 income below poverty level - county
mar100
mar100_271 Females aged 45-49 not Hispanic/Latino, white alone, married, spouse present, 1999 income below poverty level - county
mar100
mar100_272 Females aged 45-49 not Hispanic/Latino, black alone, married, spouse present, 1999 income below poverty level - county
mar100
mar100_273 Females aged 45-49 not Hispanic/Latino, Asian/other race, married, spouse present, 1999 income below poverty level - county
mar100
mar100_274 Females aged 45-49 Hispanic or Latino, married, spouse present, 1999 income below poverty level - county
mar100
mar132_221 Females aged 15-17 not Hispanic/Latino, white alone, married, spouse present, 1999 income 100-132% of poverty level - county
mar132
mar132_222 Females aged 15-17 not Hispanic/Latino, black alone, married, spouse present, 1999 income 100-132% of poverty level - county
mar132
mar132_223 Females aged 15-17 not Hispanic/Latino, Asian/other race, married, spouse present, 1999 income 100-132% of poverty level - county
mar132
mar132_224 Females aged 15-17 Hispanic or Latino, married, spouse present, 1999 income 100-132% of poverty level - county
mar132
mar132_231 Females aged 18-19 not Hispanic/Latino, white alone, married, spouse present, 1999 income 100-132% of poverty level - county
mar132
mar132_232 Females aged 18-19 not Hispanic/Latino, black alone, married, spouse present, 1999 income 100-132% of poverty level - county
mar132
mar132_233 Females aged 18-19 not Hispanic/Latino, Asian/other race, married, spouse present, 1999 income 100-132% of poverty level - county
mar132

67
Variable Name Description Formula
mar132_234 Females aged 18-19 Hispanic or Latino, married, spouse present, 1999 income 100-132% of poverty level - county
mar132
mar132_241 Females aged 20-24 not Hispanic/Latino, white alone, married, spouse present, 1999 income 100-132% of poverty level - county
mar132
mar132_242 Females aged 20-24 not Hispanic/Latino, black alone, married, spouse present, 1999 income 100-132% of poverty level - county
mar132
mar132_243 Females aged 20-24 not Hispanic/Latino, Asian/other race, married, spouse present, 1999 income 100-132% of poverty level - county
mar132
mar132_244 Females aged 20-24 Hispanic or Latino, married, spouse present, 1999 income 100-132% of poverty level - county
mar132
mar132_251 Females aged 25-29 not Hispanic/Latino, white alone, married, spouse present, 1999 income 100-132% of poverty level - county
mar132
mar132_252 Females aged 25-29 not Hispanic/Latino, black alone, married, spouse present, 1999 income 100-132% of poverty level - county
mar132
mar132_253 Females aged 25-29 not Hispanic/Latino, Asian/other race, married, spouse present, 1999 income 100-132% of poverty level - county
mar132
mar132_254 Females aged 25-29 Hispanic or Latino, married, spouse present, 1999 income 100-132% of poverty level - county
mar132
mar132_261 Females aged 30-44 not Hispanic/Latino, white alone, married, spouse present, 1999 income 100-132% of poverty level - county
mar132
mar132_262 Females aged 30-44 not Hispanic/Latino, black alone, married, spouse present, 1999 income 100-132% of poverty level - county
mar132
mar132_263 Females aged 30-44 not Hispanic/Latino, Asian/other race, married, spouse present, 1999 income 100-132% of poverty level - county
mar132
68
Variable Name Description Formula
mar132_264 Females aged 30-44 Hispanic or Latino, married, spouse present, 1999 income 100-132% of poverty level - county
mar132
mar132_271 Females aged 45-49 not Hispanic/Latino, white alone, married, spouse present, 1999 income 100-132% of poverty level - county
mar132
mar132_272 Females aged 45-49 not Hispanic/Latino, black alone, married, spouse present, 1999 income 100-132% of poverty level - county
mar132
mar132_273 Females aged 45-49 not Hispanic/Latino, Asian/other race, married, spouse present, 1999 income 100-132% of poverty level - county
mar132
mar132_274 Females aged 45-49 Hispanic or Latino, married, spouse present, 1999 income 100-132% of poverty level - county
mar132
mar184_221 Females aged 15-17 not Hispanic/Latino, white alone, married, spouse present, 1999 income 133-184% of poverty level - county
mar184
mar184_222 Females aged 15-17 not Hispanic/Latino, black alone, married, spouse present, 1999 income 133-184% of poverty level - county
mar184
mar184_223 Females aged 15-17 not Hispanic/Latino, Asian/other race, married, spouse present, 1999 income 133-184% of poverty level - county
mar184
mar184_224 Females aged 15-17 Hispanic or Latino, married, spouse present, 1999 income 133-184% of poverty level - county
mar184
mar184_231 Females aged 18-19 not Hispanic/Latino, white alone, married, spouse present, 1999 income 133-184% of poverty level - county
mar184
mar184_232 Females aged 18-19 not Hispanic/Latino, black alone, married, spouse present, 1999 income 133-184% of poverty level - county
mar184
mar184_233 Females aged 18-19 not Hispanic/Latino, Asian/other race, married, spouse present, 1999 income 133-184% of poverty level - county
mar184
69
Variable Name Description Formula
mar184_234 Females aged 18-19 Hispanic or Latino, married, spouse present, 1999 income 133-184% of poverty level - county
mar184
mar184_241 Females aged 20-24 not Hispanic/Latino, white alone, married, spouse present, 1999 income 133-184% of poverty level - county
mar184
mar184_242 Females aged 20-24 not Hispanic/Latino, black alone, married, spouse present, 1999 income 133-184% of poverty level - county
mar184
mar184_243 Females aged 20-24 not Hispanic/Latino, Asian/other race, married, spouse present, 1999 income 133-184% of poverty level - county
mar184
mar184_244 Females aged 20-24 Hispanic or Latino, married, spouse present, 1999 income 133-184% of poverty level - county
mar184
mar184_251 Females aged 25-29 not Hispanic/Latino, white alone, married, spouse present, 1999 income 133-184% of poverty level - county
mar184
mar184_252 Females aged 25-29 not Hispanic/Latino, black alone, married, spouse present, 1999 income 133-184% of poverty level - county
mar184
mar184_253 Females aged 25-29 not Hispanic/Latino, Asian/other race, married, spouse present, 1999 income 133-184% of poverty level - county
mar184
mar184_254 Females aged 25-29 Hispanic or Latino, married, spouse present, 1999 income 133-184% of poverty level - county
mar184
mar184_261 Females aged 30-44 not Hispanic/Latino, white alone, married, spouse present, 1999 income 133-184% of poverty level - county
mar184
mar184_262 Females aged 30-44 not Hispanic/Latino, black alone, married, spouse present, 1999 income 133-184% of poverty level - county
mar184
mar184_263 Females aged 30-44 not Hispanic/Latino, Asian/other race, married, spouse present, 1999 income 133-184% of poverty level - county
mar184

70
Variable Name Description Formula
mar184_264 Females aged 30-44 Hispanic or Latino, married, spouse present, 1999 income 133-184% of poverty level - county
mar184
mar184_271 Females aged 45-49 not Hispanic/Latino, white alone, married, spouse present, 1999 income 133-184% of poverty level - county
mar184
mar184_272 Females aged 45-49 not Hispanic/Latino, black alone, married, spouse present, 1999 income 133-184% of poverty level - county
mar184
mar184_273 Females aged 45-49 not Hispanic/Latino, Asian/other race, married, spouse present, 1999 income 133-184% of poverty level - county
mar184
mar184_274 Females aged 45-49 Hispanic or Latino, married, spouse present, 1999 income 133-184% of poverty level - county
mar184
mar249_221 Females aged 15-17 not Hispanic/Latino, white alone, married, spouse present, 1999 income 185-249% of poverty level - county
mar249
mar249_222 Females aged 15-17 not Hispanic/Latino, black alone, married, spouse present, 1999 income 185-249% of poverty level - county
mar249
mar249_223 Females aged 15-17 not Hispanic/Latino, Asian/other race, married, spouse present, 1999 income 185-249% of poverty level - county
mar249
mar249_224 Females aged 15-17 Hispanic or Latino, married, spouse present, 1999 income 185-249% of poverty level - county
mar249
mar249_231 Females aged 18-19 not Hispanic/Latino, white alone, married, spouse present, 1999 income 185-249% of poverty level - county
mar249
mar249_232 Females aged 18-19 not Hispanic/Latino, black alone, married, spouse present, 1999 income 185-249% of poverty level - county
mar249
mar249_233 Females aged 18-19 not Hispanic/Latino, Asian/other race, married, spouse present, 1999 income 185-249% of poverty level - county
mar249

71
Variable Name Description Formula
mar249_234 Females aged 18-19 Hispanic or Latino, married, spouse present, 1999 income 185-249% of poverty level - county
mar249
mar249_241 Females aged 20-24 not Hispanic/Latino, white alone, married, spouse present, 1999 income 185-249% of poverty level - county
mar249
mar249_242 Females aged 20-24 not Hispanic/Latino, black alone, married, spouse present, 1999 income 185-249% of poverty level - county
mar249
mar249_243 Females aged 20-24 not Hispanic/Latino, Asian/other race, married, spouse present, 1999 income 185-249% of poverty level - county
mar249
mar249_244 Females aged 20-24 Hispanic or Latino, married, spouse present, 1999 income 185-249% of poverty level - county
mar249
mar249_251 Females aged 25-29 not Hispanic/Latino, white alone, married, spouse present, 1999 income 185-249% of poverty level - county
mar249
mar249_252 Females aged 25-29 not Hispanic/Latino, black alone, married, spouse present, 1999 income 185-249% of poverty level - county
mar249
mar249_253 Females aged 25-29 not Hispanic/Latino, Asian/other race, married, spouse present, 1999 income 185-249% of poverty level - county
mar249
mar249_254 Females aged 25-29 Hispanic or Latino, married, spouse present, 1999 income 185-249% of poverty level - county
mar249
mar249_261 Females aged 30-44 not Hispanic/Latino, white alone, married, spouse present, 1999 income 185-249% of poverty level - county
mar249
mar249_262 Females aged 30-44 not Hispanic/Latino, black alone, married, spouse present, 1999 income 185-249% of poverty level - county
mar249
mar249_263 Females aged 30-44 not Hispanic/Latino, Asian/other race, married, spouse present, 1999 income 185-249% of poverty level - county
mar249
72
Variable Name Description Formula
mar249_264 Females aged 30-44 Hispanic or Latino, married, spouse present, 1999 income 185-249% of poverty level - county
mar249
mar249_271 Females aged 45-49 not Hispanic/Latino, white alone, married, spouse present, 1999 income 185-249% of poverty level - county
mar249
mar249_272 Females aged 45-49 not Hispanic/Latino, black alone, married, spouse present, 1999 income 185-249% of poverty level - county
mar249
mar249_273 Females aged 45-49 not Hispanic/Latino, Asian/other race, married, spouse present, 1999 income 185-249% of poverty level - county
mar249
mar249_274 Females aged 45-49 Hispanic or Latino, married, spouse present, 1999 income 185-249% of poverty level - county
mar249
mar250_221 Females aged 15-17 not Hispanic/Latino, white alone, married, spouse present, 1999 income 250%+ of poverty level - county
mar250
mar250_222 Females aged 15-17 not Hispanic/Latino, black alone, married, spouse present, 1999 income 250%+ of poverty level - county
mar250
mar250_223 Females aged 15-17 not Hispanic/Latino, Asian/other race, married, spouse present, 1999 income 250%+ of poverty level - county
mar250
mar250_224 Females aged 15-17 Hispanic or Latino, married, spouse present, 1999 income 250%+ of poverty level - county
mar250
mar250_231 Females aged 18-19 not Hispanic/Latino, white alone, married, spouse present, 1999 income 250%+ of poverty level - county
mar250
mar250_232 Females aged 18-19 not Hispanic/Latino, black alone, married, spouse present, 1999 income 250%+ of poverty level - county
mar250
mar250_233 Females aged 18-19 not Hispanic/Latino, Asian/other race, married, spouse present, 1999 income 250%+ of poverty level - county
mar250
73
Variable Name Description Formula
mar250_234 Females aged 18-19 Hispanic or Latino, married, spouse present, 1999 income 250%+ of poverty level - county
mar250
mar250_241 Females aged 20-24 not Hispanic/Latino, white alone, married, spouse present, 1999 income 250%+ of poverty level - county
mar250
mar250_242 Females aged 20-24 not Hispanic/Latino, black alone, married, spouse present, 1999 income 250%+ of poverty level - county
mar250
mar250_243 Females aged 20-24 not Hispanic/Latino, Asian/other race, married, spouse present, 1999 income 250%+ of poverty level - county
mar250
mar250_244 Females aged 20-24 Hispanic or Latino, married, spouse present, 1999 income 250%+ of poverty level - county
mar250
mar250_251 Females aged 25-29 not Hispanic/Latino, white alone, married, spouse present, 1999 income 250%+ of poverty level - county
mar250
mar250_252 Females aged 25-29 not Hispanic/Latino, black alone, married, spouse present, 1999 income 250%+ of poverty level - county
mar250
mar250_253 Females aged 25-29 not Hispanic/Latino, Asian/other race, married, spouse present, 1999 income 250%+ of poverty level - county
mar250
mar250_254 Females aged 25-29 Hispanic or Latino, married, spouse present, 1999 income 250%+ of poverty level - county
mar250
mar250_261 Females aged 30-44 not Hispanic/Latino, white alone, married, spouse present, 1999 income 250%+ of poverty level - county
mar250
mar250_262 Females aged 30-44 not Hispanic/Latino, black alone, married, spouse present, 1999 income 250%+ of poverty level - county
mar250
mar250_263 Females aged 30-44 not Hispanic/Latino, Asian/other race, married, spouse present, 1999 income 250%+ of poverty level - county
mar250
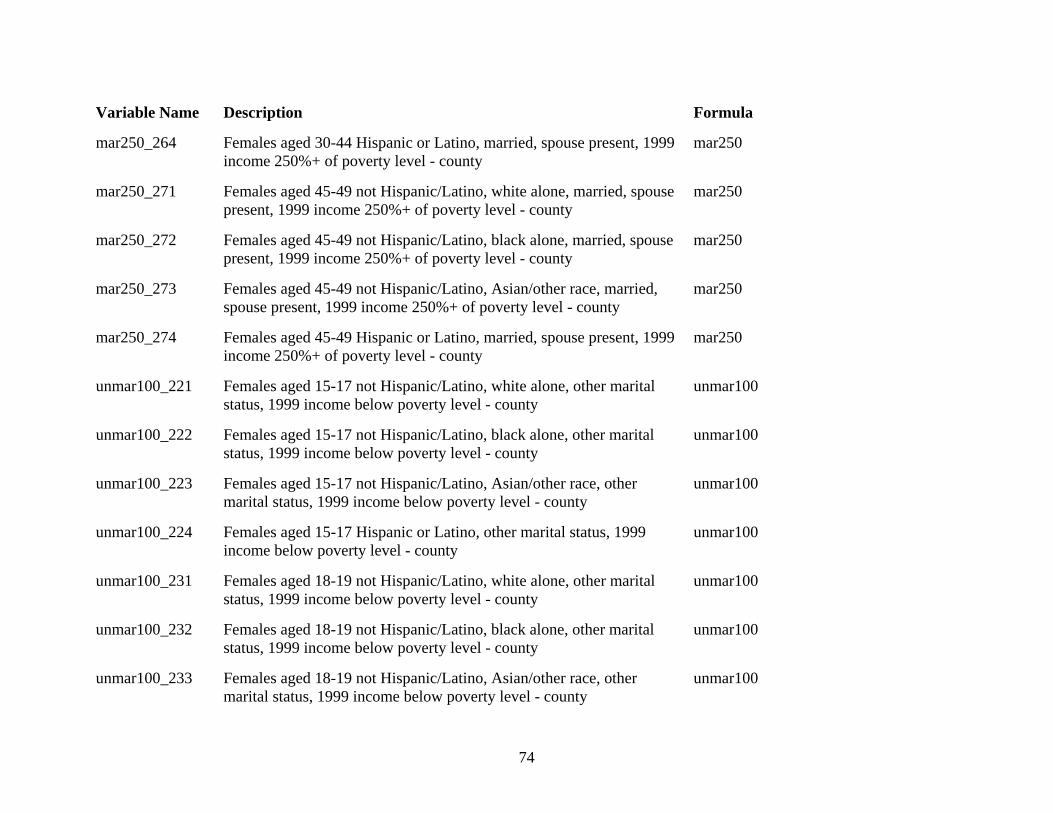
74
Variable Name Description Formula
mar250_264 Females aged 30-44 Hispanic or Latino, married, spouse present, 1999 income 250%+ of poverty level - county
mar250
mar250_271 Females aged 45-49 not Hispanic/Latino, white alone, married, spouse present, 1999 income 250%+ of poverty level - county
mar250
mar250_272 Females aged 45-49 not Hispanic/Latino, black alone, married, spouse present, 1999 income 250%+ of poverty level - county
mar250
mar250_273 Females aged 45-49 not Hispanic/Latino, Asian/other race, married, spouse present, 1999 income 250%+ of poverty level - county
mar250
mar250_274 Females aged 45-49 Hispanic or Latino, married, spouse present, 1999 income 250%+ of poverty level - county
mar250
unmar100_221 Females aged 15-17 not Hispanic/Latino, white alone, other marital status, 1999 income below poverty level - county
unmar100
unmar100_222 Females aged 15-17 not Hispanic/Latino, black alone, other marital status, 1999 income below poverty level - county
unmar100
unmar100_223 Females aged 15-17 not Hispanic/Latino, Asian/other race, other marital status, 1999 income below poverty level - county
unmar100
unmar100_224 Females aged 15-17 Hispanic or Latino, other marital status, 1999 income below poverty level - county
unmar100
unmar100_231 Females aged 18-19 not Hispanic/Latino, white alone, other marital status, 1999 income below poverty level - county
unmar100
unmar100_232 Females aged 18-19 not Hispanic/Latino, black alone, other marital status, 1999 income below poverty level - county
unmar100
unmar100_233 Females aged 18-19 not Hispanic/Latino, Asian/other race, other marital status, 1999 income below poverty level - county
unmar100

75
Variable Name Description Formula
unmar100_234 Females aged 18-19 Hispanic or Latino, other marital status, 1999 income below poverty level - county
unmar100
unmar100_241 Females aged 20-24 not Hispanic/Latino, white alone, other marital status, 1999 income below poverty level - county
unmar100
unmar100_242 Females aged 20-24 not Hispanic/Latino, black alone, other marital status, 1999 income below poverty level - county
unmar100
unmar100_243 Females aged 20-24 not Hispanic/Latino, Asian/other race, other marital status, 1999 income below poverty level - county
unmar100
unmar100_244 Females aged 20-24 Hispanic or Latino, other marital status, 1999 income below poverty level - county
unmar100
unmar100_251 Females aged 25-29 not Hispanic/Latino, white alone, other marital status, 1999 income below poverty level - county
unmar100
unmar100_252 Females aged 25-29 not Hispanic/Latino, black alone, other marital status, 1999 income below poverty level - county
unmar100
unmar100_253 Females aged 25-29 not Hispanic/Latino, Asian/other race, other marital status, 1999 income below poverty level - county
unmar100
unmar100_254 Females aged 25-29 Hispanic or Latino, other marital status, 1999 income below poverty level - county
unmar100
unmar100_261 Females aged 30-44 not Hispanic/Latino, white alone, other marital status, 1999 income below poverty level - county
unmar100
unmar100_262 Females aged 30-44 not Hispanic/Latino, black alone, other marital status, 1999 income below poverty level - county
unmar100
unmar100_263 Females aged 30-44 not Hispanic/Latino, Asian/other race, other marital status, 1999 income below poverty level - county
unmar100
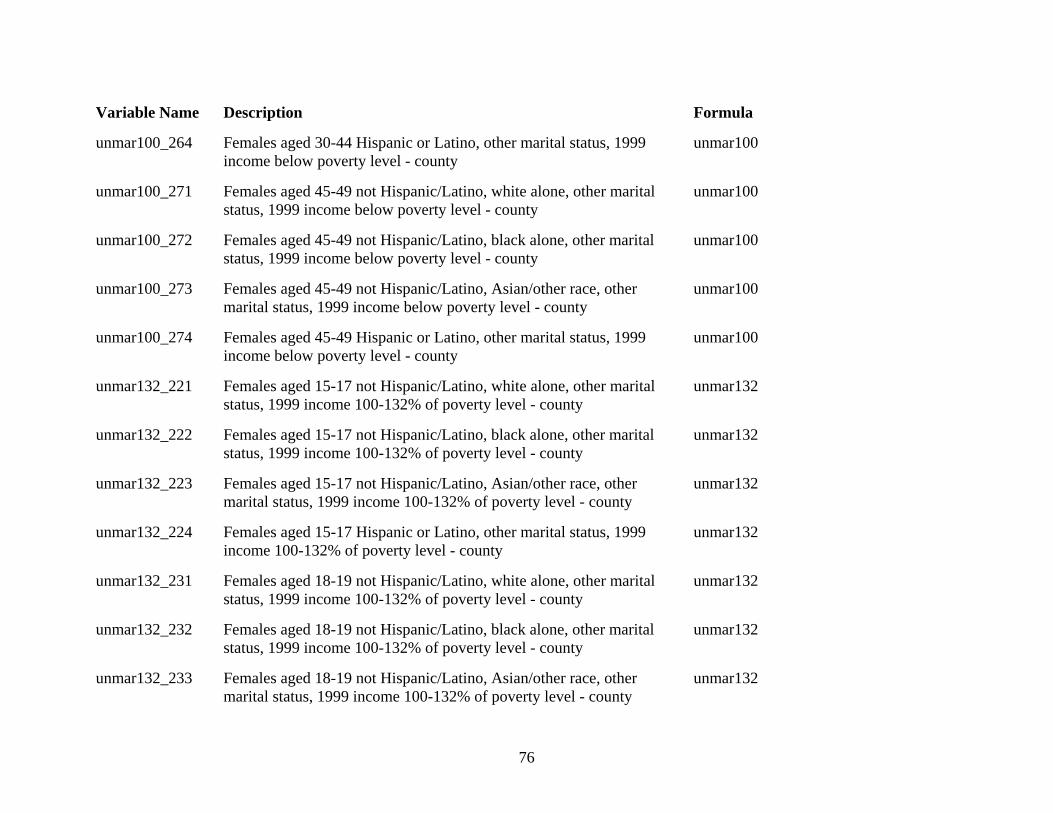
76
Variable Name Description Formula
unmar100_264 Females aged 30-44 Hispanic or Latino, other marital status, 1999 income below poverty level - county
unmar100
unmar100_271 Females aged 45-49 not Hispanic/Latino, white alone, other marital status, 1999 income below poverty level - county
unmar100
unmar100_272 Females aged 45-49 not Hispanic/Latino, black alone, other marital status, 1999 income below poverty level - county
unmar100
unmar100_273 Females aged 45-49 not Hispanic/Latino, Asian/other race, other marital status, 1999 income below poverty level - county
unmar100
unmar100_274 Females aged 45-49 Hispanic or Latino, other marital status, 1999 income below poverty level - county
unmar100
unmar132_221 Females aged 15-17 not Hispanic/Latino, white alone, other marital status, 1999 income 100-132% of poverty level - county
unmar132
unmar132_222 Females aged 15-17 not Hispanic/Latino, black alone, other marital status, 1999 income 100-132% of poverty level - county
unmar132
unmar132_223 Females aged 15-17 not Hispanic/Latino, Asian/other race, other marital status, 1999 income 100-132% of poverty level - county
unmar132
unmar132_224 Females aged 15-17 Hispanic or Latino, other marital status, 1999 income 100-132% of poverty level - county
unmar132
unmar132_231 Females aged 18-19 not Hispanic/Latino, white alone, other marital status, 1999 income 100-132% of poverty level - county
unmar132
unmar132_232 Females aged 18-19 not Hispanic/Latino, black alone, other marital status, 1999 income 100-132% of poverty level - county
unmar132
unmar132_233 Females aged 18-19 not Hispanic/Latino, Asian/other race, other marital status, 1999 income 100-132% of poverty level - county
unmar132

77
Variable Name Description Formula
unmar132_234 Females aged 18-19 Hispanic or Latino, other marital status, 1999 income 100-132% of poverty level - county
unmar132
unmar132_241 Females aged 20-24 not Hispanic/Latino, white alone, other marital status, 1999 income 100-132% of poverty level - county
unmar132
unmar132_242 Females aged 20-24 not Hispanic/Latino, black alone, other marital status, 1999 income 100-132% of poverty level - county
unmar132
unmar132_243 Females aged 20-24 not Hispanic/Latino, Asian/other race, other marital status, 1999 income 100-132% of poverty level - county
unmar132
unmar132_244 Females aged 20-24 Hispanic or Latino, other marital status, 1999 income 100-132% of poverty level - county
unmar132
unmar132_251 Females aged 25-29 not Hispanic/Latino, white alone, other marital status, 1999 income 100-132% of poverty level - county
unmar132
unmar132_252 Females aged 25-29 not Hispanic/Latino, black alone, other marital status, 1999 income 100-132% of poverty level - county
unmar132
unmar132_253 Females aged 25-29 not Hispanic/Latino, Asian/other race, other marital status, 1999 income 100-132% of poverty level - county
unmar132
unmar132_254 Females aged 25-29 Hispanic or Latino, other marital status, 1999 income 100-132% of poverty level - county
unmar132
unmar132_261 Females aged 30-44 not Hispanic/Latino, white alone, other marital status, 1999 income 100-132% of poverty level - county
unmar132
unmar132_262 Females aged 30-44 not Hispanic/Latino, black alone, other marital status, 1999 income 100-132% of poverty level - county
unmar132
unmar132_263 Females aged 30-44 not Hispanic/Latino, Asian/other race, other marital status, 1999 income 100-132% of poverty level - county
unmar132
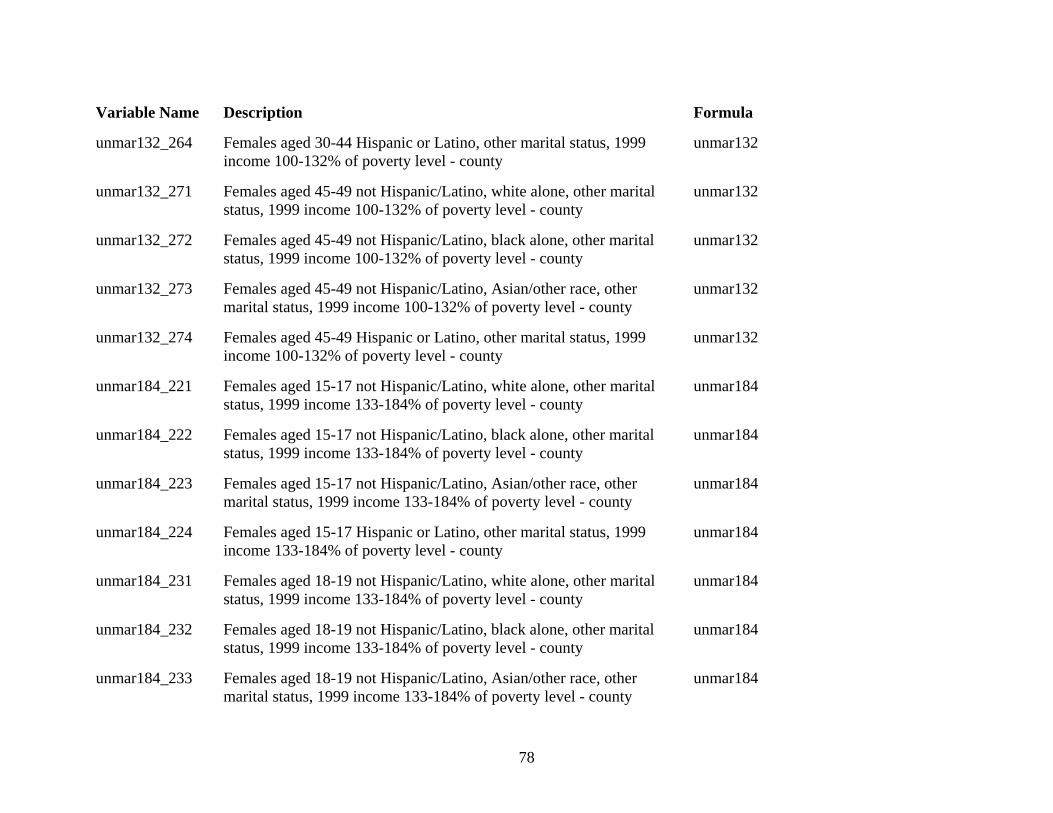
78
Variable Name Description Formula
unmar132_264 Females aged 30-44 Hispanic or Latino, other marital status, 1999 income 100-132% of poverty level - county
unmar132
unmar132_271 Females aged 45-49 not Hispanic/Latino, white alone, other marital status, 1999 income 100-132% of poverty level - county
unmar132
unmar132_272 Females aged 45-49 not Hispanic/Latino, black alone, other marital status, 1999 income 100-132% of poverty level - county
unmar132
unmar132_273 Females aged 45-49 not Hispanic/Latino, Asian/other race, other marital status, 1999 income 100-132% of poverty level - county
unmar132
unmar132_274 Females aged 45-49 Hispanic or Latino, other marital status, 1999 income 100-132% of poverty level - county
unmar132
unmar184_221 Females aged 15-17 not Hispanic/Latino, white alone, other marital status, 1999 income 133-184% of poverty level - county
unmar184
unmar184_222 Females aged 15-17 not Hispanic/Latino, black alone, other marital status, 1999 income 133-184% of poverty level - county
unmar184
unmar184_223 Females aged 15-17 not Hispanic/Latino, Asian/other race, other marital status, 1999 income 133-184% of poverty level - county
unmar184
unmar184_224 Females aged 15-17 Hispanic or Latino, other marital status, 1999 income 133-184% of poverty level - county
unmar184
unmar184_231 Females aged 18-19 not Hispanic/Latino, white alone, other marital status, 1999 income 133-184% of poverty level - county
unmar184
unmar184_232 Females aged 18-19 not Hispanic/Latino, black alone, other marital status, 1999 income 133-184% of poverty level - county
unmar184
unmar184_233 Females aged 18-19 not Hispanic/Latino, Asian/other race, other marital status, 1999 income 133-184% of poverty level - county
unmar184

79
Variable Name Description Formula
unmar184_234 Females aged 18-19 Hispanic or Latino, other marital status, 1999 income 133-184% of poverty level - county
unmar184
unmar184_241 Females aged 20-24 not Hispanic/Latino, white alone, other marital status, 1999 income 133-184% of poverty level - county
unmar184
unmar184_242 Females aged 20-24 not Hispanic/Latino, black alone, other marital status, 1999 income 133-184% of poverty level - county
unmar184
unmar184_243 Females aged 20-24 not Hispanic/Latino, Asian/other race, other marital status, 1999 income 133-184% of poverty level - county
unmar184
unmar184_244 Females aged 20-24 Hispanic or Latino, other marital status, 1999 income 133-184% of poverty level - county
unmar184
unmar184_251 Females aged 25-29 not Hispanic/Latino, white alone, other marital status, 1999 income 133-184% of poverty level - county
unmar184
unmar184_252 Females aged 25-29 not Hispanic/Latino, black alone, other marital status, 1999 income 133-184% of poverty level - county
unmar184
unmar184_253 Females aged 25-29 not Hispanic/Latino, Asian/other race, other marital status, 1999 income 133-184% of poverty level - county
unmar184
unmar184_254 Females aged 25-29 Hispanic or Latino, other marital status, 1999 income 133-184% of poverty level - county
unmar184
unmar184_261 Females aged 30-44 not Hispanic/Latino, white alone, other marital status, 1999 income 133-184% of poverty level - county
unmar184
unmar184_262 Females aged 30-44 not Hispanic/Latino, black alone, other marital status, 1999 income 133-184% of poverty level - county
unmar184
unmar184_263 Females aged 30-44 not Hispanic/Latino, Asian/other race, other marital status, 1999 income 133-184% of poverty level - county
unmar184
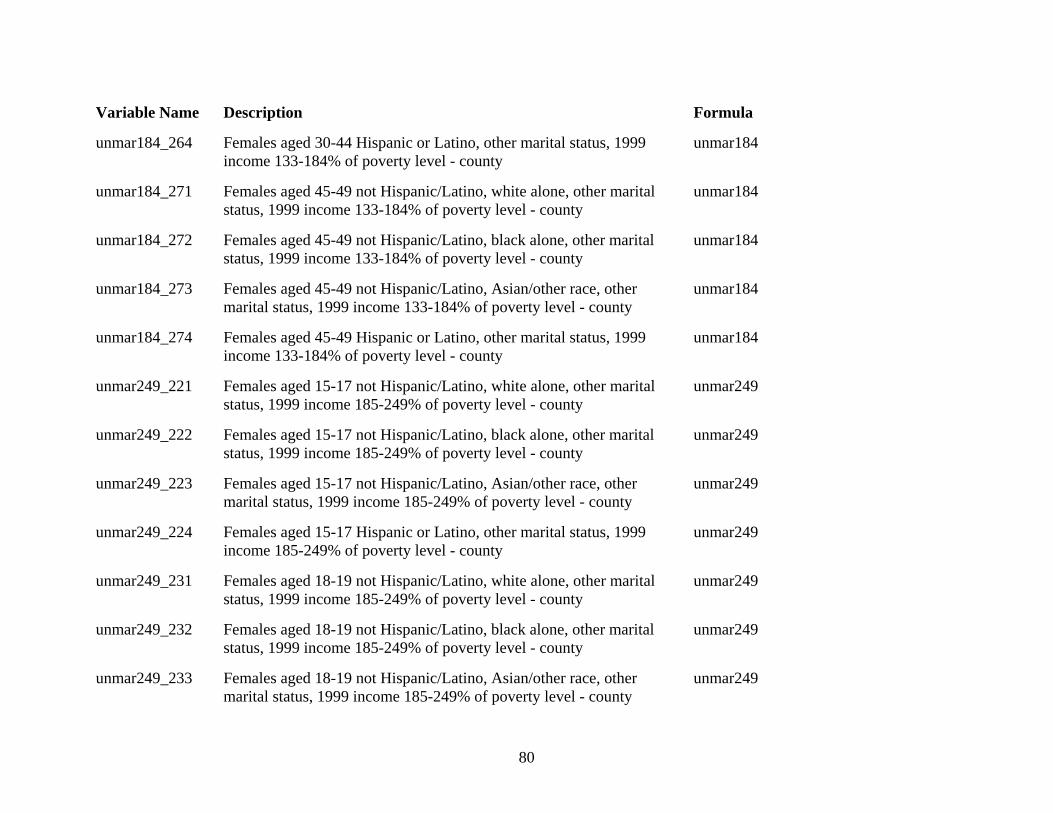
80
Variable Name Description Formula
unmar184_264 Females aged 30-44 Hispanic or Latino, other marital status, 1999 income 133-184% of poverty level - county
unmar184
unmar184_271 Females aged 45-49 not Hispanic/Latino, white alone, other marital status, 1999 income 133-184% of poverty level - county
unmar184
unmar184_272 Females aged 45-49 not Hispanic/Latino, black alone, other marital status, 1999 income 133-184% of poverty level - county
unmar184
unmar184_273 Females aged 45-49 not Hispanic/Latino, Asian/other race, other marital status, 1999 income 133-184% of poverty level - county
unmar184
unmar184_274 Females aged 45-49 Hispanic or Latino, other marital status, 1999 income 133-184% of poverty level - county
unmar184
unmar249_221 Females aged 15-17 not Hispanic/Latino, white alone, other marital status, 1999 income 185-249% of poverty level - county
unmar249
unmar249_222 Females aged 15-17 not Hispanic/Latino, black alone, other marital status, 1999 income 185-249% of poverty level - county
unmar249
unmar249_223 Females aged 15-17 not Hispanic/Latino, Asian/other race, other marital status, 1999 income 185-249% of poverty level - county
unmar249
unmar249_224 Females aged 15-17 Hispanic or Latino, other marital status, 1999 income 185-249% of poverty level - county
unmar249
unmar249_231 Females aged 18-19 not Hispanic/Latino, white alone, other marital status, 1999 income 185-249% of poverty level - county
unmar249
unmar249_232 Females aged 18-19 not Hispanic/Latino, black alone, other marital status, 1999 income 185-249% of poverty level - county
unmar249
unmar249_233 Females aged 18-19 not Hispanic/Latino, Asian/other race, other marital status, 1999 income 185-249% of poverty level - county
unmar249
81
Variable Name Description Formula
unmar249_234 Females aged 18-19 Hispanic or Latino, other marital status, 1999 income 185-249% of poverty level - county
unmar249
unmar249_241 Females aged 20-24 not Hispanic/Latino, white alone, other marital status, 1999 income 185-249% of poverty level - county
unmar249
unmar249_242 Females aged 20-24 not Hispanic/Latino, black alone, other marital status, 1999 income 185-249% of poverty level - county
unmar249
unmar249_243 Females aged 20-24 not Hispanic/Latino, Asian/other race, other marital status, 1999 income 185-249% of poverty level - county
unmar249
unmar249_244 Females aged 20-24 Hispanic or Latino, other marital status, 1999 income 185-249% of poverty level - county
unmar249
unmar249_251 Females aged 25-29 not Hispanic/Latino, white alone, other marital status, 1999 income 185-249% of poverty level - county
unmar249
unmar249_252 Females aged 25-29 not Hispanic/Latino, black alone, other marital status, 1999 income 185-249% of poverty level - county
unmar249
unmar249_253 Females aged 25-29 not Hispanic/Latino, Asian/other race, other marital status, 1999 income 185-249% of poverty level - county
unmar249
unmar249_254 Females aged 25-29 Hispanic or Latino, other marital status, 1999 income 185-249% of poverty level - county
unmar249
unmar249_261 Females aged 30-44 not Hispanic/Latino, white alone, other marital status, 1999 income 185-249% of poverty level - county
unmar249
unmar249_262 Females aged 30-44 not Hispanic/Latino, black alone, other marital status, 1999 income 185-249% of poverty level - county
unmar249
unmar249_263 Females aged 30-44 not Hispanic/Latino, Asian/other race, other marital status, 1999 income 185-249% of poverty level - county
unmar249
82
Variable Name Description Formula
unmar249_264 Females aged 30-44 Hispanic or Latino, other marital status, 1999 income 185-249% of poverty level - county
unmar249
unmar249_271 Females aged 45-49 not Hispanic/Latino, white alone, other marital status, 1999 income 185-249% of poverty level - county
unmar249
unmar249_272 Females aged 45-49 not Hispanic/Latino, black alone, other marital status, 1999 income 185-249% of poverty level - county
unmar249
unmar249_273 Females aged 45-49 not Hispanic/Latino, Asian/other race, other marital status, 1999 income 185-249% of poverty level - county
unmar249
unmar249_274 Females aged 45-49 Hispanic or Latino, other marital status, 1999 income 185-249% of poverty level - county
unmar249
unmar250_221 Females aged 15-17 not Hispanic/Latino, white alone, other marital status, 1999 income 250%+ of poverty level - county
unmar250
unmar250_222 Females aged 15-17 not Hispanic/Latino, black alone, other marital status, 1999 income 250%+ of poverty level - county
unmar250
unmar250_223 Females aged 15-17 not Hispanic/Latino, Asian/other race, other marital status, 1999 income 250%+ of poverty level - county
unmar250
unmar250_224 Females aged 15-17 Hispanic or Latino, other marital status, 1999 income 250%+ of poverty level - county
unmar250
unmar250_231 Females aged 18-19 not Hispanic/Latino, white alone, other marital status, 1999 income 250%+ of poverty level - county
unmar250
unmar250_232 Females aged 18-19 not Hispanic/Latino, black alone, other marital status, 1999 income 250%+ of poverty level - county
unmar250
unmar250_233 Females aged 18-19 not Hispanic/Latino, Asian/other race, other marital status, 1999 income 250%+ of poverty level - county
unmar250
83
Variable Name Description Formula
unmar250_234 Females aged 18-19 Hispanic or Latino, other marital status, 1999 income 250%+ of poverty level - county
unmar250
unmar250_241 Females aged 20-24 not Hispanic/Latino, white alone, other marital status, 1999 income 250%+ of poverty level - county
unmar250
unmar250_242 Females aged 20-24 not Hispanic/Latino, black alone, other marital status, 1999 income 250%+ of poverty level - county
unmar250
unmar250_243 Females aged 20-24 not Hispanic/Latino, Asian/other race, other marital status, 1999 income 250%+ of poverty level - county
unmar250
unmar250_244 Females aged 20-24 Hispanic or Latino, other marital status, 1999 income 250%+ of poverty level - county
unmar250
unmar250_251 Females aged 25-29 not Hispanic/Latino, white alone, other marital status, 1999 income 250%+ of poverty level - county
unmar250
unmar250_252 Females aged 25-29 not Hispanic/Latino, black alone, other marital status, 1999 income 250%+ of poverty level - county
unmar250
unmar250_253 Females aged 25-29 not Hispanic/Latino, Asian/other race, other marital status, 1999 income 250%+ of poverty level - county
unmar250
unmar250_254 Females aged 25-29 Hispanic or Latino, other marital status, 1999 income 250%+ of poverty level - county
unmar250
unmar250_261 Females aged 30-44 not Hispanic/Latino, white alone, other marital status, 1999 income 250%+ of poverty level - county
unmar250
unmar250_262 Females aged 30-44 not Hispanic/Latino, black alone, other marital status, 1999 income 250%+ of poverty level - county
unmar250
unmar250_263 Females aged 30-44 not Hispanic/Latino, Asian/other race, other marital status, 1999 income 250%+ of poverty level - county
unmar250
84
Variable Name Description Formula
unmar250_264 Females aged 30-44 Hispanic or Latino, other marital status, 1999 income 250%+ of poverty level - county
unmar250
unmar250_271 Females aged 45-49 not Hispanic/Latino, white alone, other marital status, 1999 income 250%+ of poverty level - county
unmar250
unmar250_272 Females aged 45-49 not Hispanic/Latino, black alone, other marital status, 1999 income 250%+ of poverty level - county
unmar250
unmar250_273 Females aged 45-49 not Hispanic/Latino, Asian/other race, other marital status, 1999 income 250%+ of poverty level - county
unmar250
unmar250_274 Females aged 45-49 Hispanic or Latino, other marital status, 1999 income 250%+ of poverty level - county
unmar250
Females Aged 15-44 by Race, Hispanic Origin, Marital Status, and Poverty Status
mar100_S1 Females aged 15-44 not Hispanic/Latino, white alone, married, spouse present, 1999 income below poverty level - county
mar100_221 + mar100_231 + mar100_241 + mar100_251 + mar100_261
mar100_S2 Females aged 15-44 not Hispanic/Latino, black alone, married, spouse present, 1999 income below poverty level - county
mar100_222 + mar100_232 + mar100_242 + mar100_252 + mar100_262
mar100_S4 Females aged 15-44 Hispanic or Latino, married, spouse present, 1999 income below poverty level - county
mar100_224 + mar100_234 + mar100_244 + mar100_254 + mar100_264

85
Variable Name Description Formula
mar100_S5 Females aged 15-44 of all races, married, spouse present, 1999 income below poverty level - county
mar100_221 + mar100_231 + mar100_241 + mar100_251 + mar100_261 + mar100_222 + mar100_232 + mar100_242 + mar100_252 + mar100_262 + mar100_223 + mar100_233 + mar100_243 + mar100_253 + mar100_263 + mar100_224 + mar100_234 + mar100_244 + mar100_254 + mar100_264
mar132_S1 Females aged 15-44 not Hispanic/Latino, white alone, married, spouse present, 1999 income 100-132% of poverty level - county
mar132_221 + mar132_231 + mar132_241 + mar132_251 + mar132_261
mar132_S2 Females aged 15-44 not Hispanic/Latino, black alone, married, spouse present, 1999 income 100-132% of poverty level - county
mar132_222 + mar132_232 + mar132_242 + mar132_252 + mar132_262
mar132_S4 Females aged 15-44 Hispanic or Latino, married, spouse present, 1999 income 100-132% of poverty level - county
mar132_224 + mar132_234 + mar132_244 + mar132_254 + mar132_264

86
Variable Name Description Formula
mar132_S5 Females aged 15-44 of all races, married, spouse present, 1999 income 100-132% of poverty level - county
mar132_221 + mar132_231 + mar132_241 + mar132_251 + mar132_261 + mar132_222 + mar132_232 + mar132_242 + mar132_252 + mar132_262 + mar132_223 + mar132_233 + mar132_243 + mar132_253 + mar132_263 + mar132_224 + mar132_234 + mar132_244 + mar132_254 + mar132_264
mar184_S1 Females aged 15-44 not Hispanic/Latino, white alone, married, spouse present, 1999 income 133-184% of poverty level - county
mar184_221 + mar184_231 + mar184_241 + mar184_251 + mar184_261
mar184_S2 Females aged 15-44 not Hispanic/Latino, black alone, married, spouse present, 1999 income 133-184% of poverty level - county
mar184_222 + mar184_232 + mar184_242 + mar184_252 + mar184_262
mar184_S4 Females aged 15-44 Hispanic or Latino, married, spouse present, 1999 income 133-184% of poverty level - county
mar184_224 + mar184_234 + mar184_244 + mar184_254 + mar184_264
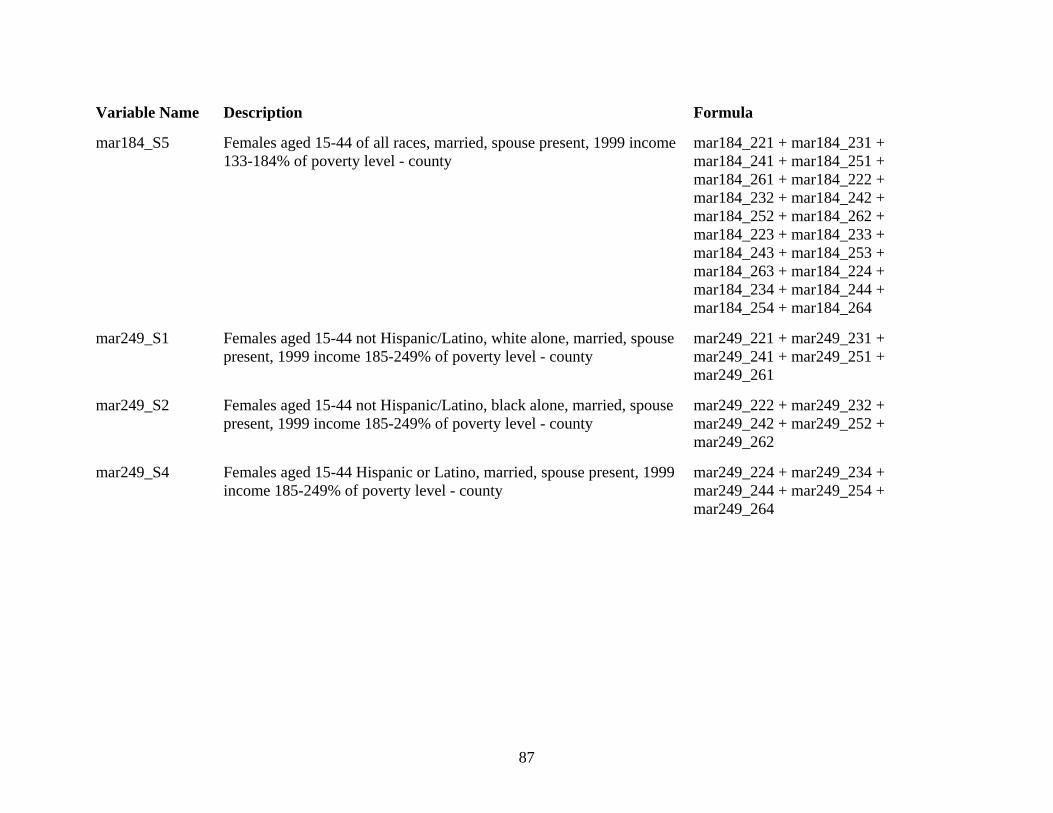
87
Variable Name Description Formula
mar184_S5 Females aged 15-44 of all races, married, spouse present, 1999 income 133-184% of poverty level - county
mar184_221 + mar184_231 + mar184_241 + mar184_251 + mar184_261 + mar184_222 + mar184_232 + mar184_242 + mar184_252 + mar184_262 + mar184_223 + mar184_233 + mar184_243 + mar184_253 + mar184_263 + mar184_224 + mar184_234 + mar184_244 + mar184_254 + mar184_264
mar249_S1 Females aged 15-44 not Hispanic/Latino, white alone, married, spouse present, 1999 income 185-249% of poverty level - county
mar249_221 + mar249_231 + mar249_241 + mar249_251 + mar249_261
mar249_S2 Females aged 15-44 not Hispanic/Latino, black alone, married, spouse present, 1999 income 185-249% of poverty level - county
mar249_222 + mar249_232 + mar249_242 + mar249_252 + mar249_262
mar249_S4 Females aged 15-44 Hispanic or Latino, married, spouse present, 1999 income 185-249% of poverty level - county
mar249_224 + mar249_234 + mar249_244 + mar249_254 + mar249_264

88
Variable Name Description Formula
mar249_S5 Females aged 15-44 of all races, married, spouse present, 1999 income 185-249% of poverty level - county
mar249_221 + mar249_231 + mar249_241 + mar249_251 + mar249_261 + mar249_222 + mar249_232 + mar249_242 + mar249_252 + mar249_262 + mar249_223 + mar249_233 + mar249_243 + mar249_253 + mar249_263 + mar249_224 + mar249_234 + mar249_244 + mar249_254 + mar249_264
mar250_S1 Females aged 15-44 not Hispanic/Latino, white alone, married, spouse present, 1999 income 250%+ of poverty level - county
mar250_221 + mar250_231 + mar250_241 + mar250_251 + mar250_261
mar250_S2 Females aged 15-44 not Hispanic/Latino, black alone, married, spouse present, 1999 income 250%+ of poverty level - county
mar250_222 + mar250_232 + mar250_242 + mar250_252 + mar250_262
mar250_S4 Females aged 15-44 Hispanic or Latino, married, spouse present, 1999 income 250%+ of poverty level - county
mar250_224 + mar250_234 + mar250_244 + mar250_254 + mar250_264

89
Variable Name Description Formula
mar250_S5 Females aged 15-44 of all races, married, spouse present, 1999 income 250%+ of poverty level - county
mar250_221 + mar250_231 + mar250_241 + mar250_251 + mar250_261 + mar250_222 + mar250_232 + mar250_242 + mar250_252 + mar250_262 + mar250_223 + mar250_233 + mar250_243 + mar250_253 + mar250_263 + mar250_224 + mar250_234 + mar250_244 + mar250_254 + mar250_264
unmar100_S1 Females aged 15-44 not Hispanic/Latino, white alone, other marital status, 1999 income below poverty level - county
unmar100_221 + unmar100_231 + unmar100_241 + unmar100_251 + unmar100_261
unmar100_S2 Females aged 15-44 not Hispanic/Latino, black alone, other marital status, 1999 income below poverty level - county
unmar100_222 + unmar100_232 + unmar100_242 + unmar100_252 + unmar100_262
unmar100_S4 Females aged 15-44 Hispanic or Latino, other marital status, 1999 income below poverty level - county
unmar100_224 + unmar100_234 + unmar100_244 + unmar100_254 + unmar100_264
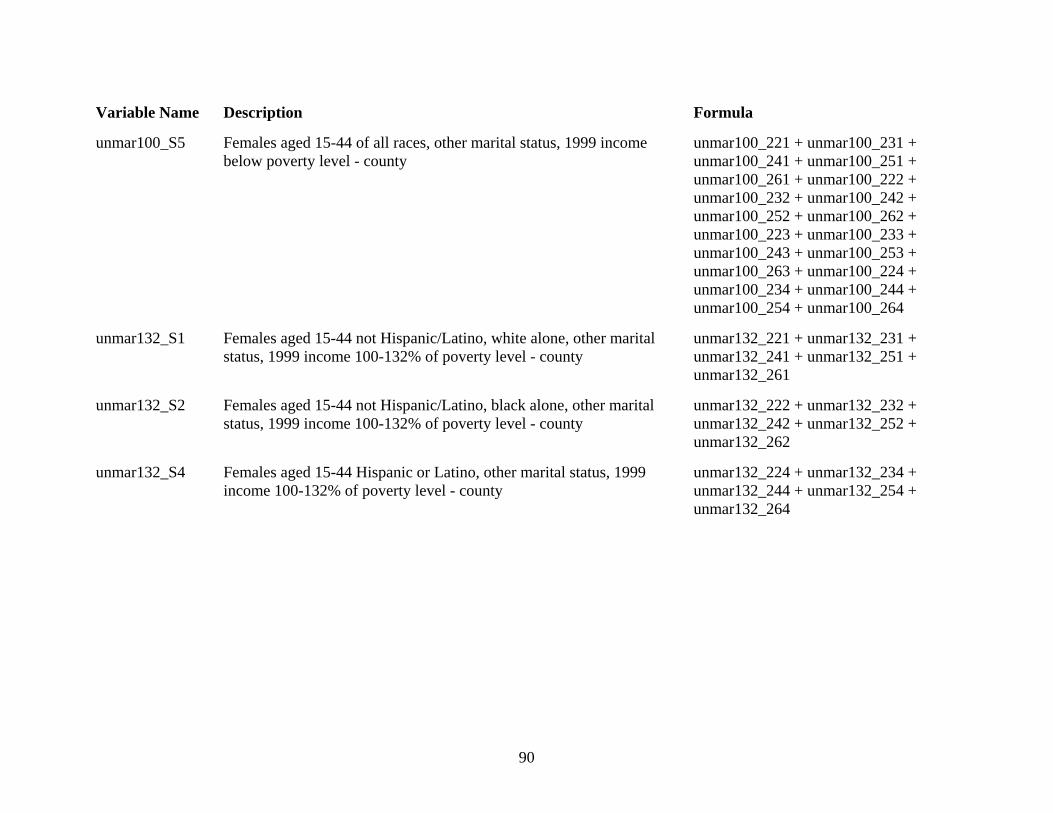
90
Variable Name Description Formula
unmar100_S5 Females aged 15-44 of all races, other marital status, 1999 income below poverty level - county
unmar100_221 + unmar100_231 + unmar100_241 + unmar100_251 + unmar100_261 + unmar100_222 + unmar100_232 + unmar100_242 + unmar100_252 + unmar100_262 + unmar100_223 + unmar100_233 + unmar100_243 + unmar100_253 + unmar100_263 + unmar100_224 + unmar100_234 + unmar100_244 + unmar100_254 + unmar100_264
unmar132_S1 Females aged 15-44 not Hispanic/Latino, white alone, other marital status, 1999 income 100-132% of poverty level - county
unmar132_221 + unmar132_231 + unmar132_241 + unmar132_251 + unmar132_261
unmar132_S2 Females aged 15-44 not Hispanic/Latino, black alone, other marital status, 1999 income 100-132% of poverty level - county
unmar132_222 + unmar132_232 + unmar132_242 + unmar132_252 + unmar132_262
unmar132_S4 Females aged 15-44 Hispanic or Latino, other marital status, 1999 income 100-132% of poverty level - county
unmar132_224 + unmar132_234 + unmar132_244 + unmar132_254 + unmar132_264

91
Variable Name Description Formula
unmar132_S5 Females aged 15-44 of all races, other marital status, 1999 income 100-132% of poverty level - county
unmar132_221 + unmar132_231 + unmar132_241 + unmar132_251 + unmar132_261 + unmar132_222 + unmar132_232 + unmar132_242 + unmar132_252 + unmar132_262 + unmar132_223 + unmar132_233 + unmar132_243 + unmar132_253 + unmar132_263 + unmar132_224 + unmar132_234 + unmar132_244 + unmar132_254 + unmar132_264
unmar184_S1 Females aged 15-44 not Hispanic/Latino, white alone, other marital status, 1999 income 133-184% of poverty level - county
unmar184_221 + unmar184_231 + unmar184_241 + unmar184_251 + unmar184_261
unmar184_S2 Females aged 15-44 not Hispanic/Latino, black alone, other marital status, 1999 income 133-184% of poverty level - county
unmar184_222 + unmar184_232 + unmar184_242 + unmar184_252 + unmar184_262
unmar184_S4 Females aged 15-44 Hispanic or Latino, other marital status, 1999 income 133-184% of poverty level - county
unmar184_224 + unmar184_234 + unmar184_244 + unmar184_254 + unmar184_264

92
Variable Name Description Formula
unmar184_S5 Females aged 15-44 of all races, other marital status, 1999 income 133-184% of poverty level - county
unmar184_221 + unmar184_231 + unmar184_241 + unmar184_251 + unmar184_261 + unmar184_222 + unmar184_232 + unmar184_242 + unmar184_252 + unmar184_262 + unmar184_223 + unmar184_233 + unmar184_243 + unmar184_253 + unmar184_263 + unmar184_224 + unmar184_234 + unmar184_244 + unmar184_254 + unmar184_264
unmar249_S1 Females aged 15-44 not Hispanic/Latino, white alone, other marital status, 1999 income 185-249% of poverty level - county
unmar249_221 + unmar249_231 + unmar249_241 + unmar249_251 + unmar249_261
unmar249_S2 Females aged 15-44 not Hispanic/Latino, black alone, other marital status, 1999 income 185-249% of poverty level - county
unmar249_222 + unmar249_232 + unmar249_242 + unmar249_252 + unmar249_262
unmar249_S4 Females aged 15-44 Hispanic or Latino, other marital status, 1999 income 185-249% of poverty level - county
unmar249_224 + unmar249_234 + unmar249_244 + unmar249_254 + unmar249_264
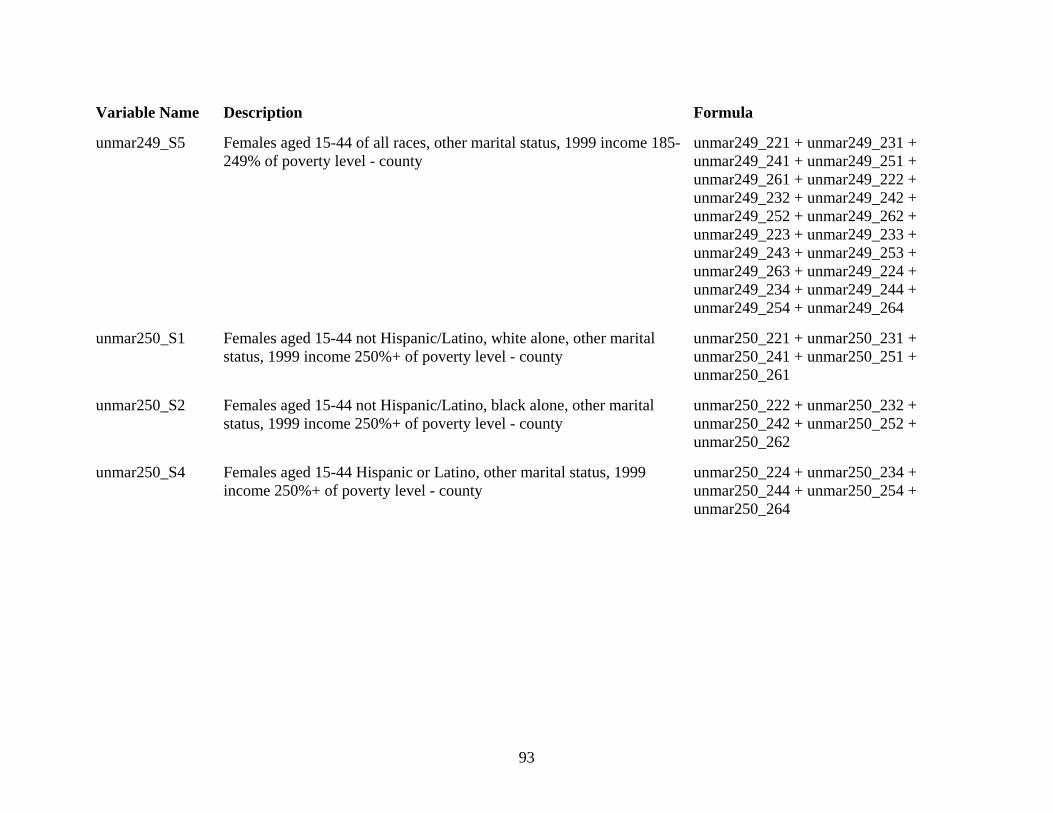
93
Variable Name Description Formula
unmar249_S5 Females aged 15-44 of all races, other marital status, 1999 income 185-249% of poverty level - county
unmar249_221 + unmar249_231 + unmar249_241 + unmar249_251 + unmar249_261 + unmar249_222 + unmar249_232 + unmar249_242 + unmar249_252 + unmar249_262 + unmar249_223 + unmar249_233 + unmar249_243 + unmar249_253 + unmar249_263 + unmar249_224 + unmar249_234 + unmar249_244 + unmar249_254 + unmar249_264
unmar250_S1 Females aged 15-44 not Hispanic/Latino, white alone, other marital status, 1999 income 250%+ of poverty level - county
unmar250_221 + unmar250_231 + unmar250_241 + unmar250_251 + unmar250_261
unmar250_S2 Females aged 15-44 not Hispanic/Latino, black alone, other marital status, 1999 income 250%+ of poverty level - county
unmar250_222 + unmar250_232 + unmar250_242 + unmar250_252 + unmar250_262
unmar250_S4 Females aged 15-44 Hispanic or Latino, other marital status, 1999 income 250%+ of poverty level - county
unmar250_224 + unmar250_234 + unmar250_244 + unmar250_254 + unmar250_264
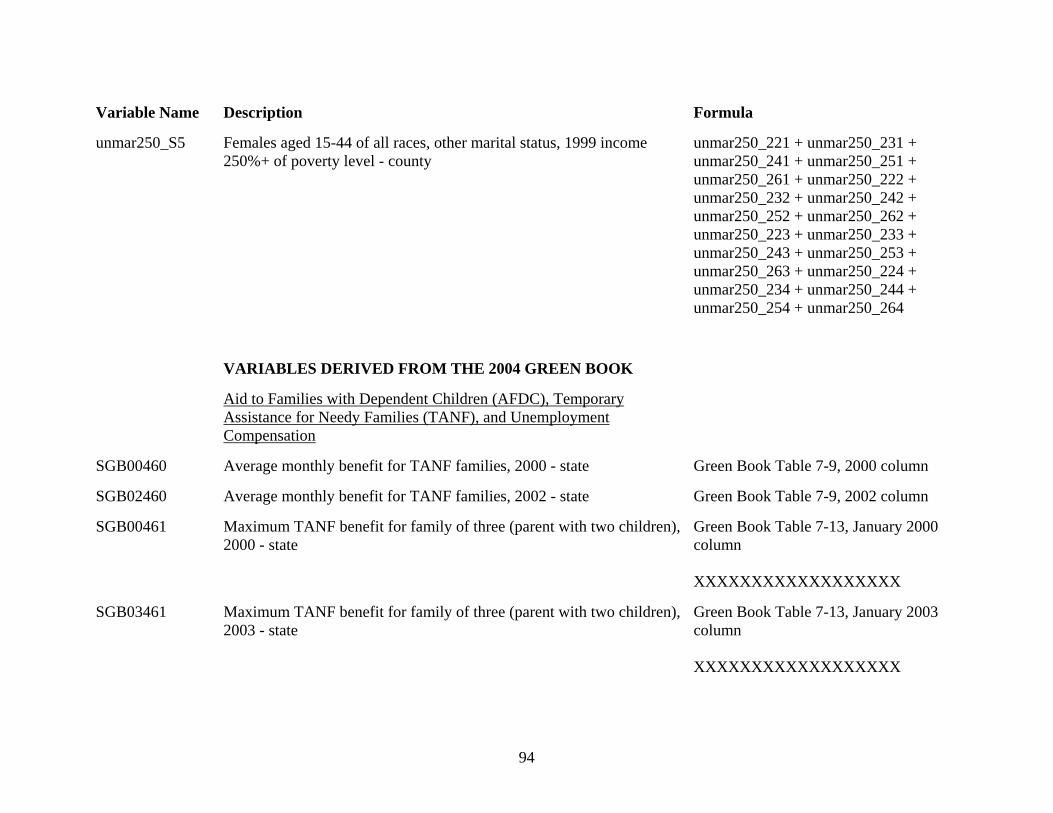
94
Variable Name Description Formula
unmar250_S5 Females aged 15-44 of all races, other marital status, 1999 income 250%+ of poverty level - county
unmar250_221 + unmar250_231 + unmar250_241 + unmar250_251 + unmar250_261 + unmar250_222 + unmar250_232 + unmar250_242 + unmar250_252 + unmar250_262 + unmar250_223 + unmar250_233 + unmar250_243 + unmar250_253 + unmar250_263 + unmar250_224 + unmar250_234 + unmar250_244 + unmar250_254 + unmar250_264
VARIABLES DERIVED FROM THE 2004 GREEN BOOK
Aid to Families with Dependent Children (AFDC), Temporary Assistance for Needy Families (TANF), and Unemployment Compensation
SGB00460 Average monthly benefit for TANF families, 2000 - state Green Book Table 7-9, 2000 column
SGB02460 Average monthly benefit for TANF families, 2002 - state Green Book Table 7-9, 2002 column
SGB00461 Maximum TANF benefit for family of three (parent with two children), 2000 - state
Green Book Table 7-13, January 2000 column XXXXXXXXXXXXXXXXXX
SGB03461 Maximum TANF benefit for family of three (parent with two children), 2003 - state
Green Book Table 7-13, January 2003 column XXXXXXXXXXXXXXXXXX

95
Variable Name Description Formula
SGB03462 Monthly earnings limit at 12th month of employment for continued TANF eligibility for single-parent family with two children, 2003 - state
Green Book Table 7-16, 12th month of employment column XXXXXXXXXXXXXXXXXX
SGB02464 Unemployment compensation: Average weekly benefit for total unemployment under regular state programs, 2002 - state
Green Book Table 4-5, 2002 average weekly benefit column
SGB95657 AFDC families, monthly average for fiscal year 1995 (families in thousands) - state
Green Book Table 7-7, 1995 column
SGB02657 TANF families, monthly average for fiscal year 2002 (families in thousands) - state
Green Book Table 7-7, 2002 column
1
Chapter III. Source Documentation and Variable Naming Conventions This chapter describes the data sources that were used to construct the NSFG-6 contextual variables and explains how the contextual variables were named.
2
Census of Population and Housing, 2000: Summary File 3 Summary File 3 contains detailed tabulations of population and housing characteristics generated from the 2000 decennial census. It contains 813 tables, one variable per table cell (16,603 variables in all), that provide information on sex, age, race, Hispanic origin, marital status, migration, year moved into residence, education, labor force participation, unemployment, income in 1999, poverty status, occupation, industry, household type, housing value, plumbing facilities, year structure built, and other characteristics. The tables are presented for the nation and manifold subdivisions of the nation down to the block group. Derived from the 2000 Census long-form questionnaire which, overall, was sent to approximately 1/6 of the housing units in the United States, variables in SF3 are based on sample data that have been weighed up to represent the total population. Three different methods were used to name the contextual variables derived from SF3. I. Variables C_AREALAND to B_H76_1 were named by prepending “C_,” “T_,” or “B_” to the variable names used in ICPSR’s SAS, SPSS, and Stata setups for SF3 (e.g. see Census of Population and Housing, 2000 [United States]: Selected Subsets from Summary File 3 (ICPSR 13402)). “C_” denotes county level variables, “T_” tract level variables, and “B_” block group level variables . II. Variables STATE, COUNTY, and BLKGRP have the same names as in ICPSR’s SF3 setups. III. Variables CST00001 to BST00377, which constitute most of the SF3 variables, were named according to the convention that was used in the NSFG Cycle 5 contextual data file. These variable names have eight characters. The first character identifies the level of observation, “C” for county, “T” for tract, and “B” for block group. The next four characters contain the string “ST00” which identifies the data source and the year of the source: “ST” denotes SF3 and “00” the year 2000. A three digit sequence number completes the variable name. If a variable had a counterpart or an approximate counterpart in the NSFG Cycle 5 contextual data file, then it was assigned the same sequence number as in Cycle 5. Variables without a counterpart in Cycle 5 were arbitrarily assigned a sequence number from 601 to 656. In Chapter II, the contextual variables are defined as functions of the original SF3 variables, which are identified by their names in ICPSR’s SF3 setups. Table 3-1 contains a crosswalk between the variable names shown in the formulas in chapter II and the names (data dictionary reference names) used in the Census Bureau’s technical documentation for SF3.
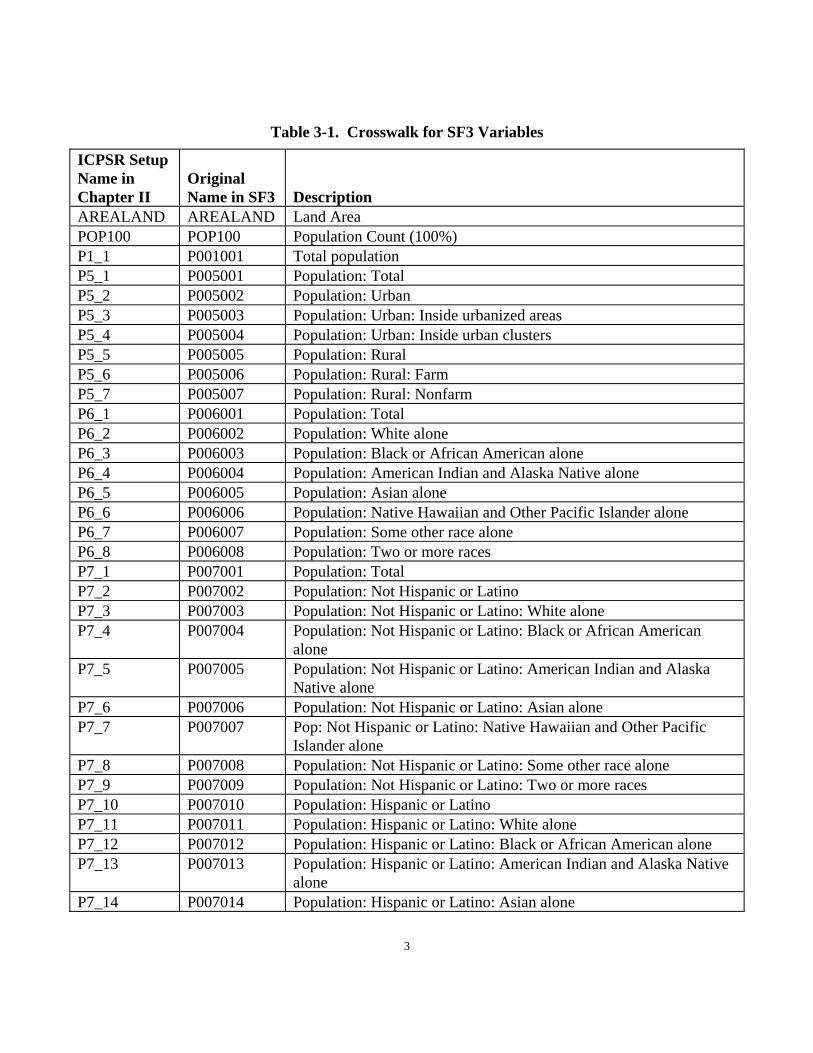
3
Table 3-1. Crosswalk for SF3 Variables
ICPSR Setup Name in Chapter II
Original Name in SF3 Description
AREALAND AREALAND Land Area POP100 POP100 Population Count (100%) P1_1 P001001 Total population P5_1 P005001 Population: Total P5_2 P005002 Population: Urban P5_3 P005003 Population: Urban: Inside urbanized areas P5_4 P005004 Population: Urban: Inside urban clusters P5_5 P005005 Population: Rural P5_6 P005006 Population: Rural: Farm P5_7 P005007 Population: Rural: Nonfarm P6_1 P006001 Population: Total P6_2 P006002 Population: White alone P6_3 P006003 Population: Black or African American alone P6_4 P006004 Population: American Indian and Alaska Native alone P6_5 P006005 Population: Asian alone P6_6 P006006 Population: Native Hawaiian and Other Pacific Islander alone P6_7 P006007 Population: Some other race alone P6_8 P006008 Population: Two or more races P7_1 P007001 Population: Total P7_2 P007002 Population: Not Hispanic or Latino P7_3 P007003 Population: Not Hispanic or Latino: White alone P7_4 P007004 Population: Not Hispanic or Latino: Black or African American
alone P7_5 P007005 Population: Not Hispanic or Latino: American Indian and Alaska
Native alone P7_6 P007006 Population: Not Hispanic or Latino: Asian alone P7_7 P007007 Pop: Not Hispanic or Latino: Native Hawaiian and Other Pacific
Islander alone P7_8 P007008 Population: Not Hispanic or Latino: Some other race alone P7_9 P007009 Population: Not Hispanic or Latino: Two or more races P7_10 P007010 Population: Hispanic or Latino P7_11 P007011 Population: Hispanic or Latino: White alone P7_12 P007012 Population: Hispanic or Latino: Black or African American alone P7_13 P007013 Population: Hispanic or Latino: American Indian and Alaska Native
alone P7_14 P007014 Population: Hispanic or Latino: Asian alone
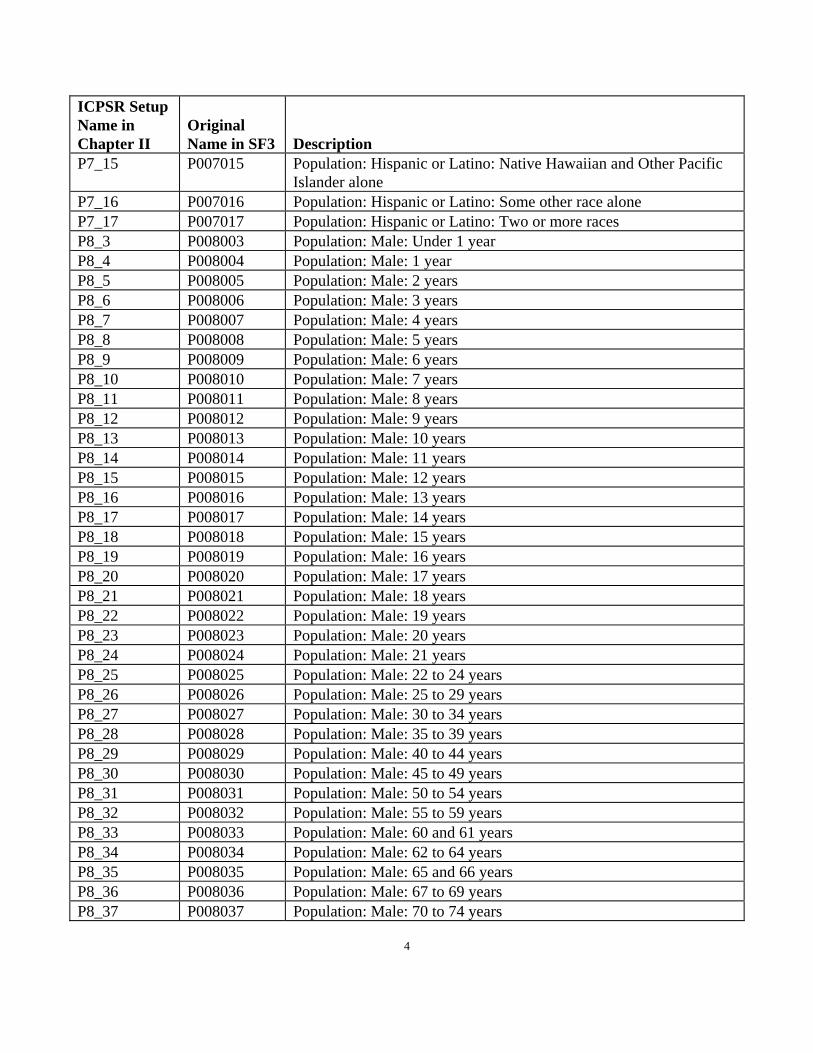
4
ICPSR Setup Name in Chapter II
Original Name in SF3 Description
P7_15 P007015 Population: Hispanic or Latino: Native Hawaiian and Other Pacific Islander alone
P7_16 P007016 Population: Hispanic or Latino: Some other race alone P7_17 P007017 Population: Hispanic or Latino: Two or more races P8_3 P008003 Population: Male: Under 1 year P8_4 P008004 Population: Male: 1 year P8_5 P008005 Population: Male: 2 years P8_6 P008006 Population: Male: 3 years P8_7 P008007 Population: Male: 4 years P8_8 P008008 Population: Male: 5 years P8_9 P008009 Population: Male: 6 years P8_10 P008010 Population: Male: 7 years P8_11 P008011 Population: Male: 8 years P8_12 P008012 Population: Male: 9 years P8_13 P008013 Population: Male: 10 years P8_14 P008014 Population: Male: 11 years P8_15 P008015 Population: Male: 12 years P8_16 P008016 Population: Male: 13 years P8_17 P008017 Population: Male: 14 years P8_18 P008018 Population: Male: 15 years P8_19 P008019 Population: Male: 16 years P8_20 P008020 Population: Male: 17 years P8_21 P008021 Population: Male: 18 years P8_22 P008022 Population: Male: 19 years P8_23 P008023 Population: Male: 20 years P8_24 P008024 Population: Male: 21 years P8_25 P008025 Population: Male: 22 to 24 years P8_26 P008026 Population: Male: 25 to 29 years P8_27 P008027 Population: Male: 30 to 34 years P8_28 P008028 Population: Male: 35 to 39 years P8_29 P008029 Population: Male: 40 to 44 years P8_30 P008030 Population: Male: 45 to 49 years P8_31 P008031 Population: Male: 50 to 54 years P8_32 P008032 Population: Male: 55 to 59 years P8_33 P008033 Population: Male: 60 and 61 years P8_34 P008034 Population: Male: 62 to 64 years P8_35 P008035 Population: Male: 65 and 66 years P8_36 P008036 Population: Male: 67 to 69 years P8_37 P008037 Population: Male: 70 to 74 years
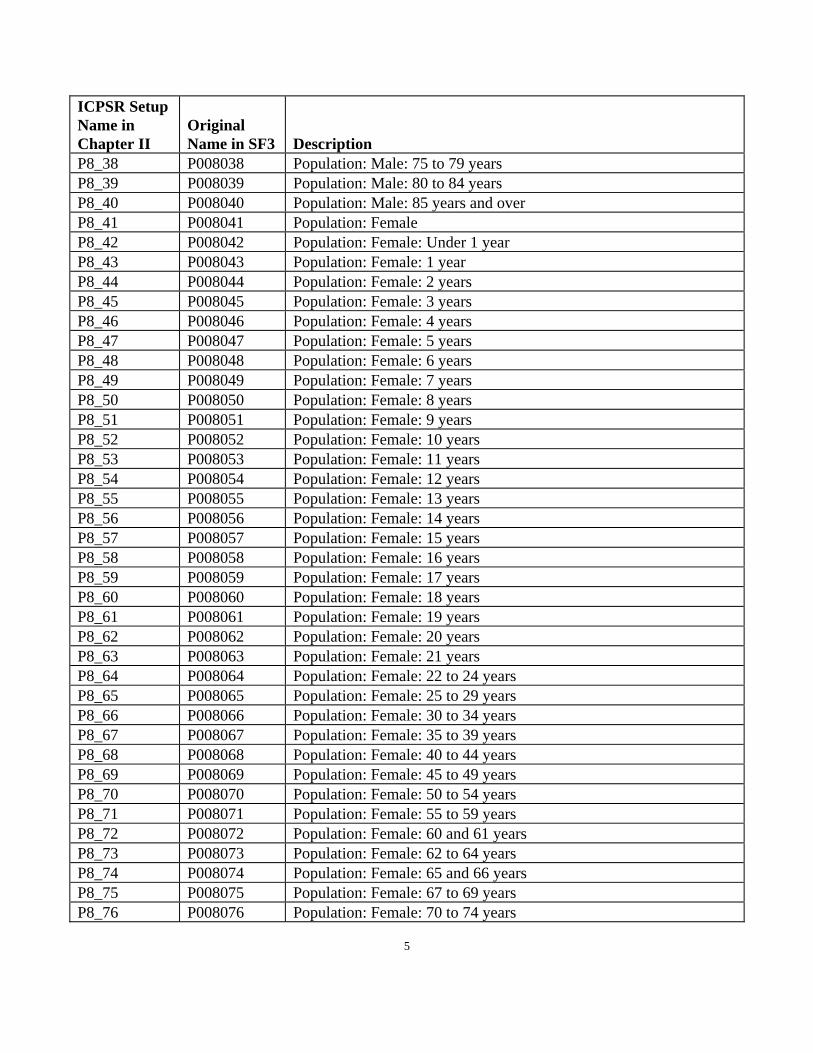
5
ICPSR Setup Name in Chapter II
Original Name in SF3 Description
P8_38 P008038 Population: Male: 75 to 79 years P8_39 P008039 Population: Male: 80 to 84 years P8_40 P008040 Population: Male: 85 years and over P8_41 P008041 Population: Female P8_42 P008042 Population: Female: Under 1 year P8_43 P008043 Population: Female: 1 year P8_44 P008044 Population: Female: 2 years P8_45 P008045 Population: Female: 3 years P8_46 P008046 Population: Female: 4 years P8_47 P008047 Population: Female: 5 years P8_48 P008048 Population: Female: 6 years P8_49 P008049 Population: Female: 7 years P8_50 P008050 Population: Female: 8 years P8_51 P008051 Population: Female: 9 years P8_52 P008052 Population: Female: 10 years P8_53 P008053 Population: Female: 11 years P8_54 P008054 Population: Female: 12 years P8_55 P008055 Population: Female: 13 years P8_56 P008056 Population: Female: 14 years P8_57 P008057 Population: Female: 15 years P8_58 P008058 Population: Female: 16 years P8_59 P008059 Population: Female: 17 years P8_60 P008060 Population: Female: 18 years P8_61 P008061 Population: Female: 19 years P8_62 P008062 Population: Female: 20 years P8_63 P008063 Population: Female: 21 years P8_64 P008064 Population: Female: 22 to 24 years P8_65 P008065 Population: Female: 25 to 29 years P8_66 P008066 Population: Female: 30 to 34 years P8_67 P008067 Population: Female: 35 to 39 years P8_68 P008068 Population: Female: 40 to 44 years P8_69 P008069 Population: Female: 45 to 49 years P8_70 P008070 Population: Female: 50 to 54 years P8_71 P008071 Population: Female: 55 to 59 years P8_72 P008072 Population: Female: 60 and 61 years P8_73 P008073 Population: Female: 62 to 64 years P8_74 P008074 Population: Female: 65 and 66 years P8_75 P008075 Population: Female: 67 to 69 years P8_76 P008076 Population: Female: 70 to 74 years
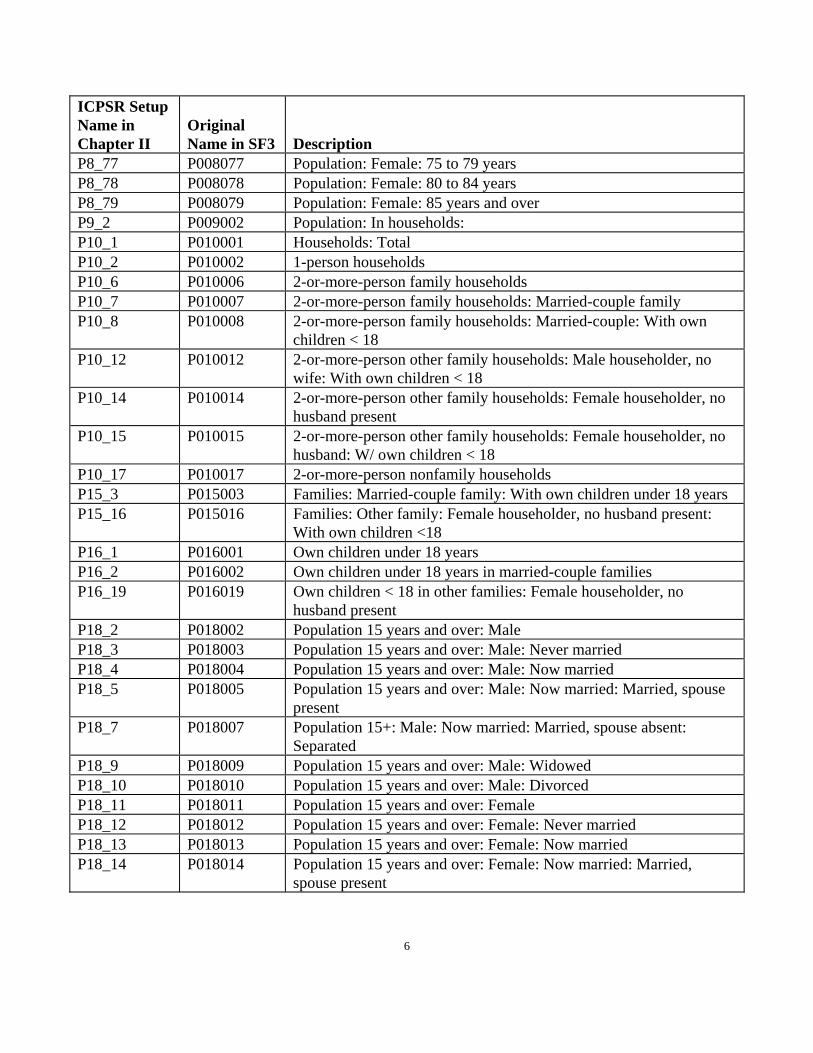
6
ICPSR Setup Name in Chapter II
Original Name in SF3 Description
P8_77 P008077 Population: Female: 75 to 79 years P8_78 P008078 Population: Female: 80 to 84 years P8_79 P008079 Population: Female: 85 years and over P9_2 P009002 Population: In households: P10_1 P010001 Households: Total P10_2 P010002 1-person households P10_6 P010006 2-or-more-person family households P10_7 P010007 2-or-more-person family households: Married-couple family P10_8 P010008 2-or-more-person family households: Married-couple: With own
children < 18 P10_12 P010012 2-or-more-person other family households: Male householder, no
wife: With own children < 18 P10_14 P010014 2-or-more-person other family households: Female householder, no
husband present P10_15 P010015 2-or-more-person other family households: Female householder, no
husband: W/ own children < 18 P10_17 P010017 2-or-more-person nonfamily households P15_3 P015003 Families: Married-couple family: With own children under 18 years P15_16 P015016 Families: Other family: Female householder, no husband present:
With own children <18 P16_1 P016001 Own children under 18 years P16_2 P016002 Own children under 18 years in married-couple families P16_19 P016019 Own children < 18 in other families: Female householder, no
husband present P18_2 P018002 Population 15 years and over: Male P18_3 P018003 Population 15 years and over: Male: Never married P18_4 P018004 Population 15 years and over: Male: Now married P18_5 P018005 Population 15 years and over: Male: Now married: Married, spouse
present P18_7 P018007 Population 15+: Male: Now married: Married, spouse absent:
Separated P18_9 P018009 Population 15 years and over: Male: Widowed P18_10 P018010 Population 15 years and over: Male: Divorced P18_11 P018011 Population 15 years and over: Female P18_12 P018012 Population 15 years and over: Female: Never married P18_13 P018013 Population 15 years and over: Female: Now married P18_14 P018014 Population 15 years and over: Female: Now married: Married,
spouse present
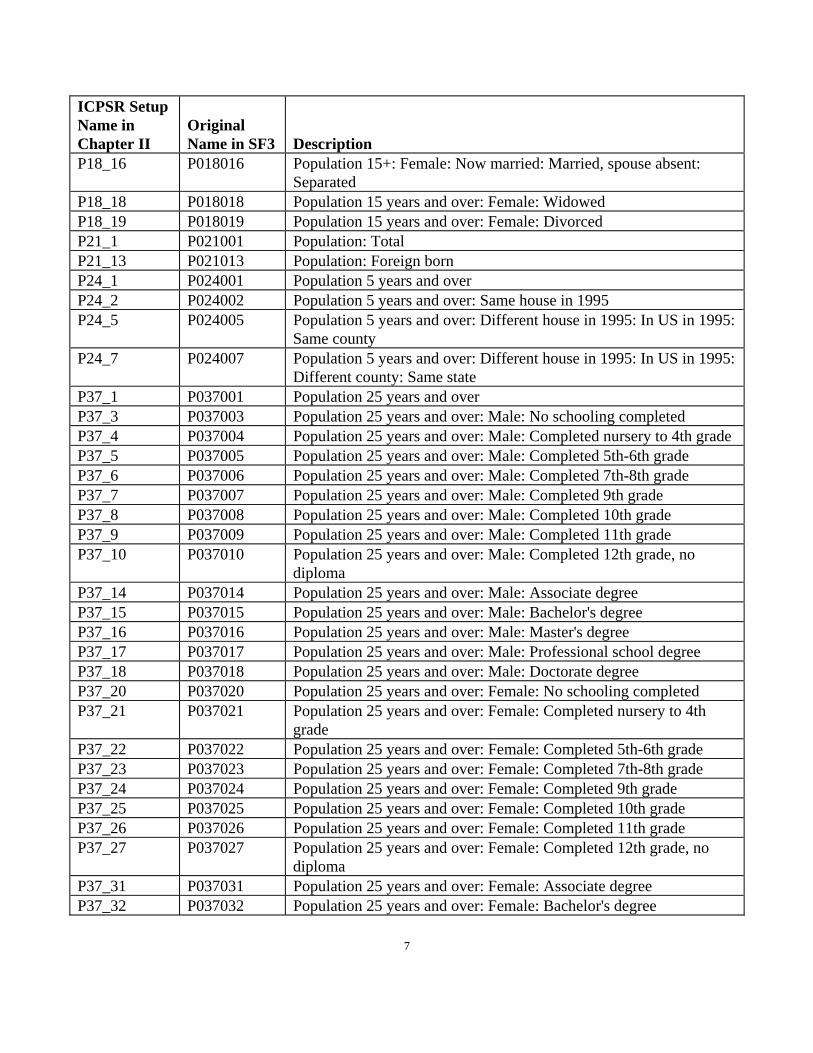
7
ICPSR Setup Name in Chapter II
Original Name in SF3 Description
P18_16 P018016 Population 15+: Female: Now married: Married, spouse absent: Separated
P18_18 P018018 Population 15 years and over: Female: Widowed P18_19 P018019 Population 15 years and over: Female: Divorced P21_1 P021001 Population: Total P21_13 P021013 Population: Foreign born P24_1 P024001 Population 5 years and over P24_2 P024002 Population 5 years and over: Same house in 1995 P24_5 P024005 Population 5 years and over: Different house in 1995: In US in 1995:
Same county P24_7 P024007 Population 5 years and over: Different house in 1995: In US in 1995:
Different county: Same state P37_1 P037001 Population 25 years and over P37_3 P037003 Population 25 years and over: Male: No schooling completed P37_4 P037004 Population 25 years and over: Male: Completed nursery to 4th grade P37_5 P037005 Population 25 years and over: Male: Completed 5th-6th grade P37_6 P037006 Population 25 years and over: Male: Completed 7th-8th grade P37_7 P037007 Population 25 years and over: Male: Completed 9th grade P37_8 P037008 Population 25 years and over: Male: Completed 10th grade P37_9 P037009 Population 25 years and over: Male: Completed 11th grade P37_10 P037010 Population 25 years and over: Male: Completed 12th grade, no
diploma P37_14 P037014 Population 25 years and over: Male: Associate degree P37_15 P037015 Population 25 years and over: Male: Bachelor's degree P37_16 P037016 Population 25 years and over: Male: Master's degree P37_17 P037017 Population 25 years and over: Male: Professional school degree P37_18 P037018 Population 25 years and over: Male: Doctorate degree P37_20 P037020 Population 25 years and over: Female: No schooling completed P37_21 P037021 Population 25 years and over: Female: Completed nursery to 4th
grade P37_22 P037022 Population 25 years and over: Female: Completed 5th-6th grade P37_23 P037023 Population 25 years and over: Female: Completed 7th-8th grade P37_24 P037024 Population 25 years and over: Female: Completed 9th grade P37_25 P037025 Population 25 years and over: Female: Completed 10th grade P37_26 P037026 Population 25 years and over: Female: Completed 11th grade P37_27 P037027 Population 25 years and over: Female: Completed 12th grade, no
diploma P37_31 P037031 Population 25 years and over: Female: Associate degree P37_32 P037032 Population 25 years and over: Female: Bachelor's degree
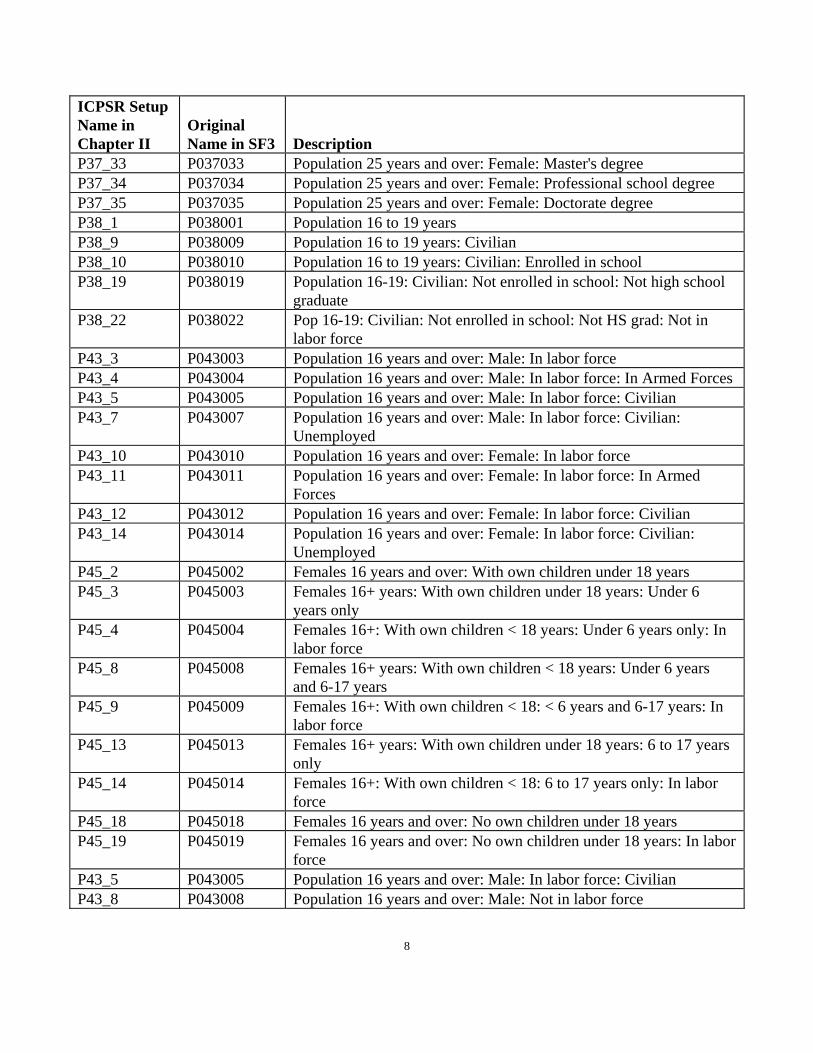
8
ICPSR Setup Name in Chapter II
Original Name in SF3 Description
P37_33 P037033 Population 25 years and over: Female: Master's degree P37_34 P037034 Population 25 years and over: Female: Professional school degree P37_35 P037035 Population 25 years and over: Female: Doctorate degree P38_1 P038001 Population 16 to 19 years P38_9 P038009 Population 16 to 19 years: Civilian P38_10 P038010 Population 16 to 19 years: Civilian: Enrolled in school P38_19 P038019 Population 16-19: Civilian: Not enrolled in school: Not high school
graduate P38_22 P038022 Pop 16-19: Civilian: Not enrolled in school: Not HS grad: Not in
labor force P43_3 P043003 Population 16 years and over: Male: In labor force P43_4 P043004 Population 16 years and over: Male: In labor force: In Armed Forces P43_5 P043005 Population 16 years and over: Male: In labor force: Civilian P43_7 P043007 Population 16 years and over: Male: In labor force: Civilian:
Unemployed P43_10 P043010 Population 16 years and over: Female: In labor force P43_11 P043011 Population 16 years and over: Female: In labor force: In Armed
Forces P43_12 P043012 Population 16 years and over: Female: In labor force: Civilian P43_14 P043014 Population 16 years and over: Female: In labor force: Civilian:
Unemployed P45_2 P045002 Females 16 years and over: With own children under 18 years P45_3 P045003 Females 16+ years: With own children under 18 years: Under 6
years only P45_4 P045004 Females 16+: With own children < 18 years: Under 6 years only: In
labor force P45_8 P045008 Females 16+ years: With own children < 18 years: Under 6 years
and 6-17 years P45_9 P045009 Females 16+: With own children < 18: < 6 years and 6-17 years: In
labor force P45_13 P045013 Females 16+ years: With own children under 18 years: 6 to 17 years
only P45_14 P045014 Females 16+: With own children < 18: 6 to 17 years only: In labor
force P45_18 P045018 Females 16 years and over: No own children under 18 years P45_19 P045019 Females 16 years and over: No own children under 18 years: In labor
force P43_5 P043005 Population 16 years and over: Male: In labor force: Civilian P43_8 P043008 Population 16 years and over: Male: Not in labor force
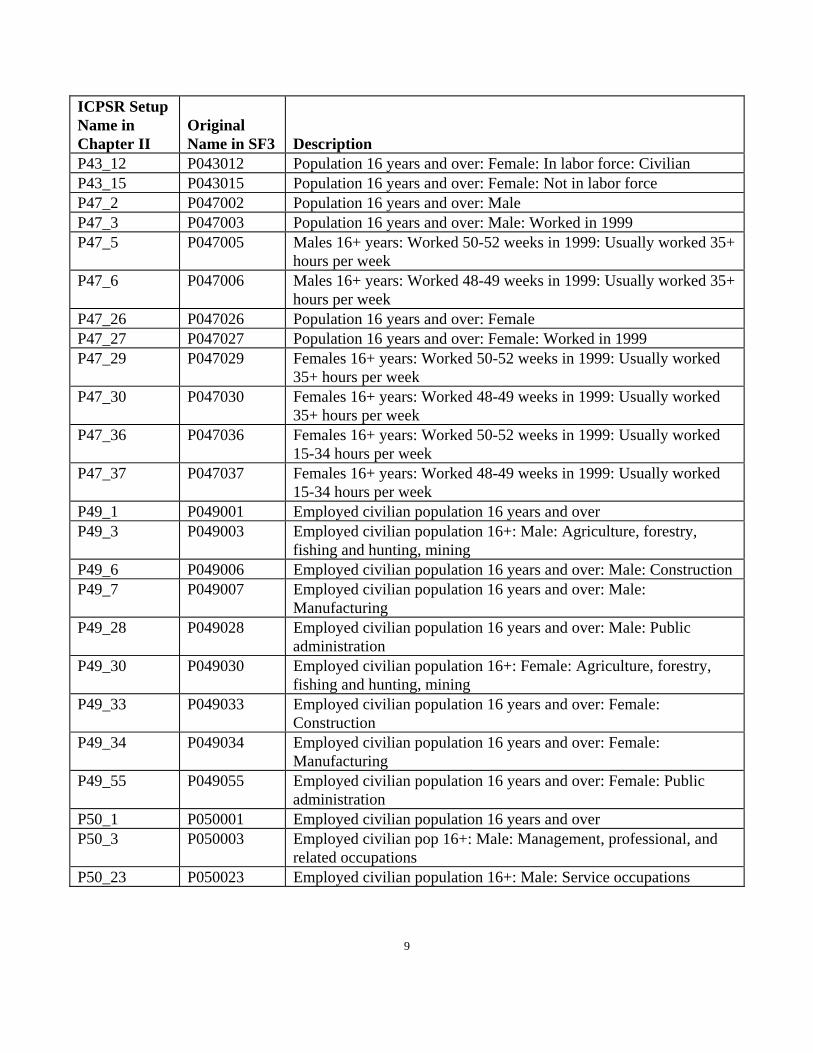
9
ICPSR Setup Name in Chapter II
Original Name in SF3 Description
P43_12 P043012 Population 16 years and over: Female: In labor force: Civilian P43_15 P043015 Population 16 years and over: Female: Not in labor force P47_2 P047002 Population 16 years and over: Male P47_3 P047003 Population 16 years and over: Male: Worked in 1999 P47_5 P047005 Males 16+ years: Worked 50-52 weeks in 1999: Usually worked 35+
hours per week P47_6 P047006 Males 16+ years: Worked 48-49 weeks in 1999: Usually worked 35+
hours per week P47_26 P047026 Population 16 years and over: Female P47_27 P047027 Population 16 years and over: Female: Worked in 1999 P47_29 P047029 Females 16+ years: Worked 50-52 weeks in 1999: Usually worked
35+ hours per week P47_30 P047030 Females 16+ years: Worked 48-49 weeks in 1999: Usually worked
35+ hours per week P47_36 P047036 Females 16+ years: Worked 50-52 weeks in 1999: Usually worked
15-34 hours per week P47_37 P047037 Females 16+ years: Worked 48-49 weeks in 1999: Usually worked
15-34 hours per week P49_1 P049001 Employed civilian population 16 years and over P49_3 P049003 Employed civilian population 16+: Male: Agriculture, forestry,
fishing and hunting, mining P49_6 P049006 Employed civilian population 16 years and over: Male: Construction P49_7 P049007 Employed civilian population 16 years and over: Male:
Manufacturing P49_28 P049028 Employed civilian population 16 years and over: Male: Public
administration P49_30 P049030 Employed civilian population 16+: Female: Agriculture, forestry,
fishing and hunting, mining P49_33 P049033 Employed civilian population 16 years and over: Female:
Construction P49_34 P049034 Employed civilian population 16 years and over: Female:
Manufacturing P49_55 P049055 Employed civilian population 16 years and over: Female: Public
administration P50_1 P050001 Employed civilian population 16 years and over P50_3 P050003 Employed civilian pop 16+: Male: Management, professional, and
related occupations P50_23 P050023 Employed civilian population 16+: Male: Service occupations
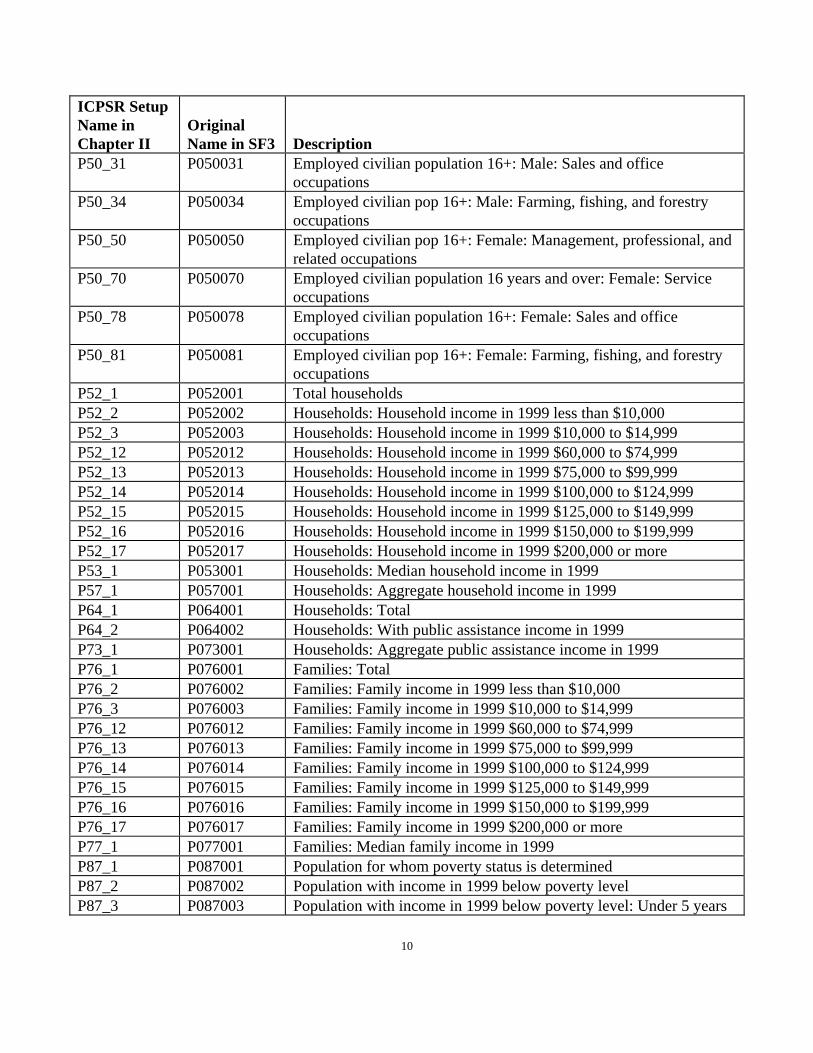
10
ICPSR Setup Name in Chapter II
Original Name in SF3 Description
P50_31 P050031 Employed civilian population 16+: Male: Sales and office occupations
P50_34 P050034 Employed civilian pop 16+: Male: Farming, fishing, and forestry occupations
P50_50 P050050 Employed civilian pop 16+: Female: Management, professional, and related occupations
P50_70 P050070 Employed civilian population 16 years and over: Female: Service occupations
P50_78 P050078 Employed civilian population 16+: Female: Sales and office occupations
P50_81 P050081 Employed civilian pop 16+: Female: Farming, fishing, and forestry occupations
P52_1 P052001 Total households P52_2 P052002 Households: Household income in 1999 less than $10,000 P52_3 P052003 Households: Household income in 1999 $10,000 to $14,999 P52_12 P052012 Households: Household income in 1999 $60,000 to $74,999 P52_13 P052013 Households: Household income in 1999 $75,000 to $99,999 P52_14 P052014 Households: Household income in 1999 $100,000 to $124,999 P52_15 P052015 Households: Household income in 1999 $125,000 to $149,999 P52_16 P052016 Households: Household income in 1999 $150,000 to $199,999 P52_17 P052017 Households: Household income in 1999 $200,000 or more P53_1 P053001 Households: Median household income in 1999 P57_1 P057001 Households: Aggregate household income in 1999 P64_1 P064001 Households: Total P64_2 P064002 Households: With public assistance income in 1999 P73_1 P073001 Households: Aggregate public assistance income in 1999 P76_1 P076001 Families: Total P76_2 P076002 Families: Family income in 1999 less than $10,000 P76_3 P076003 Families: Family income in 1999 $10,000 to $14,999 P76_12 P076012 Families: Family income in 1999 $60,000 to $74,999 P76_13 P076013 Families: Family income in 1999 $75,000 to $99,999 P76_14 P076014 Families: Family income in 1999 $100,000 to $124,999 P76_15 P076015 Families: Family income in 1999 $125,000 to $149,999 P76_16 P076016 Families: Family income in 1999 $150,000 to $199,999 P76_17 P076017 Families: Family income in 1999 $200,000 or more P77_1 P077001 Families: Median family income in 1999 P87_1 P087001 Population for whom poverty status is determined P87_2 P087002 Population with income in 1999 below poverty level P87_3 P087003 Population with income in 1999 below poverty level: Under 5 years
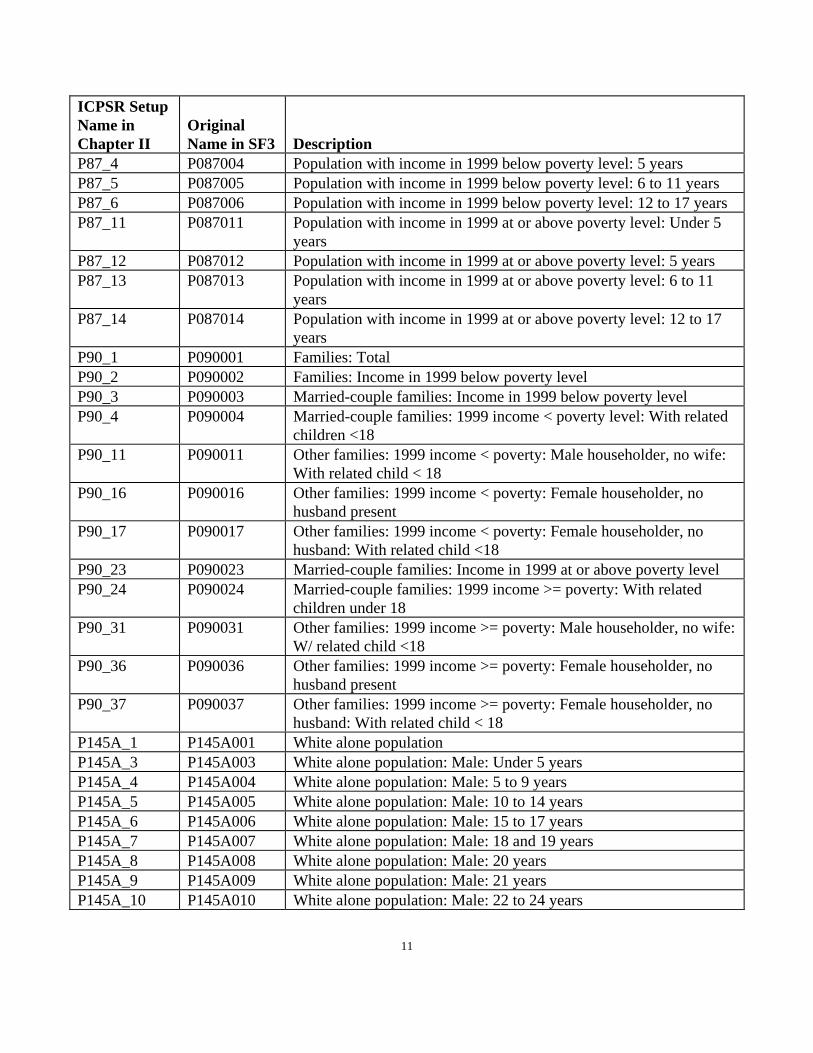
11
ICPSR Setup Name in Chapter II
Original Name in SF3 Description
P87_4 P087004 Population with income in 1999 below poverty level: 5 years P87_5 P087005 Population with income in 1999 below poverty level: 6 to 11 years P87_6 P087006 Population with income in 1999 below poverty level: 12 to 17 years P87_11 P087011 Population with income in 1999 at or above poverty level: Under 5
years P87_12 P087012 Population with income in 1999 at or above poverty level: 5 years P87_13 P087013 Population with income in 1999 at or above poverty level: 6 to 11
years P87_14 P087014 Population with income in 1999 at or above poverty level: 12 to 17
years P90_1 P090001 Families: Total P90_2 P090002 Families: Income in 1999 below poverty level P90_3 P090003 Married-couple families: Income in 1999 below poverty level P90_4 P090004 Married-couple families: 1999 income < poverty level: With related
children <18 P90_11 P090011 Other families: 1999 income < poverty: Male householder, no wife:
With related child < 18 P90_16 P090016 Other families: 1999 income < poverty: Female householder, no
husband present P90_17 P090017 Other families: 1999 income < poverty: Female householder, no
husband: With related child <18 P90_23 P090023 Married-couple families: Income in 1999 at or above poverty level P90_24 P090024 Married-couple families: 1999 income >= poverty: With related
children under 18 P90_31 P090031 Other families: 1999 income >= poverty: Male householder, no wife:
W/ related child <18 P90_36 P090036 Other families: 1999 income >= poverty: Female householder, no
husband present P90_37 P090037 Other families: 1999 income >= poverty: Female householder, no
husband: With related child < 18 P145A_1 P145A001 White alone population P145A_3 P145A003 White alone population: Male: Under 5 years P145A_4 P145A004 White alone population: Male: 5 to 9 years P145A_5 P145A005 White alone population: Male: 10 to 14 years P145A_6 P145A006 White alone population: Male: 15 to 17 years P145A_7 P145A007 White alone population: Male: 18 and 19 years P145A_8 P145A008 White alone population: Male: 20 years P145A_9 P145A009 White alone population: Male: 21 years P145A_10 P145A010 White alone population: Male: 22 to 24 years
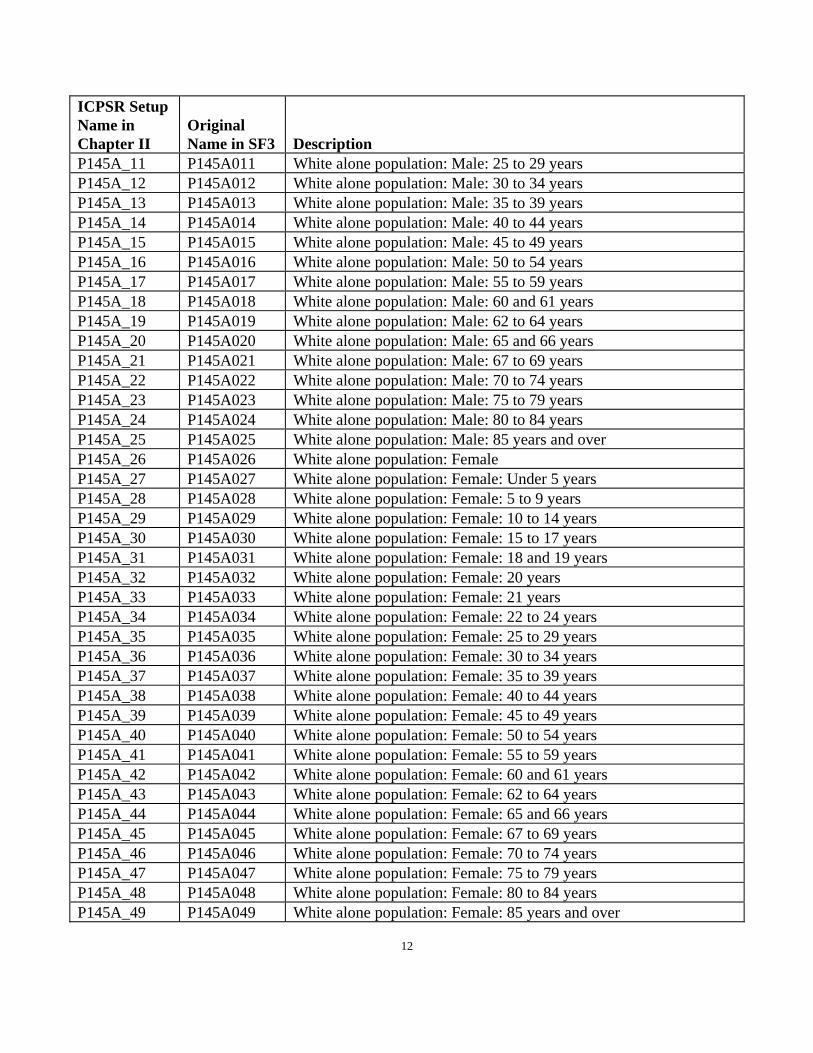
12
ICPSR Setup Name in Chapter II
Original Name in SF3 Description
P145A_11 P145A011 White alone population: Male: 25 to 29 years P145A_12 P145A012 White alone population: Male: 30 to 34 years P145A_13 P145A013 White alone population: Male: 35 to 39 years P145A_14 P145A014 White alone population: Male: 40 to 44 years P145A_15 P145A015 White alone population: Male: 45 to 49 years P145A_16 P145A016 White alone population: Male: 50 to 54 years P145A_17 P145A017 White alone population: Male: 55 to 59 years P145A_18 P145A018 White alone population: Male: 60 and 61 years P145A_19 P145A019 White alone population: Male: 62 to 64 years P145A_20 P145A020 White alone population: Male: 65 and 66 years P145A_21 P145A021 White alone population: Male: 67 to 69 years P145A_22 P145A022 White alone population: Male: 70 to 74 years P145A_23 P145A023 White alone population: Male: 75 to 79 years P145A_24 P145A024 White alone population: Male: 80 to 84 years P145A_25 P145A025 White alone population: Male: 85 years and over P145A_26 P145A026 White alone population: Female P145A_27 P145A027 White alone population: Female: Under 5 years P145A_28 P145A028 White alone population: Female: 5 to 9 years P145A_29 P145A029 White alone population: Female: 10 to 14 years P145A_30 P145A030 White alone population: Female: 15 to 17 years P145A_31 P145A031 White alone population: Female: 18 and 19 years P145A_32 P145A032 White alone population: Female: 20 years P145A_33 P145A033 White alone population: Female: 21 years P145A_34 P145A034 White alone population: Female: 22 to 24 years P145A_35 P145A035 White alone population: Female: 25 to 29 years P145A_36 P145A036 White alone population: Female: 30 to 34 years P145A_37 P145A037 White alone population: Female: 35 to 39 years P145A_38 P145A038 White alone population: Female: 40 to 44 years P145A_39 P145A039 White alone population: Female: 45 to 49 years P145A_40 P145A040 White alone population: Female: 50 to 54 years P145A_41 P145A041 White alone population: Female: 55 to 59 years P145A_42 P145A042 White alone population: Female: 60 and 61 years P145A_43 P145A043 White alone population: Female: 62 to 64 years P145A_44 P145A044 White alone population: Female: 65 and 66 years P145A_45 P145A045 White alone population: Female: 67 to 69 years P145A_46 P145A046 White alone population: Female: 70 to 74 years P145A_47 P145A047 White alone population: Female: 75 to 79 years P145A_48 P145A048 White alone population: Female: 80 to 84 years P145A_49 P145A049 White alone population: Female: 85 years and over
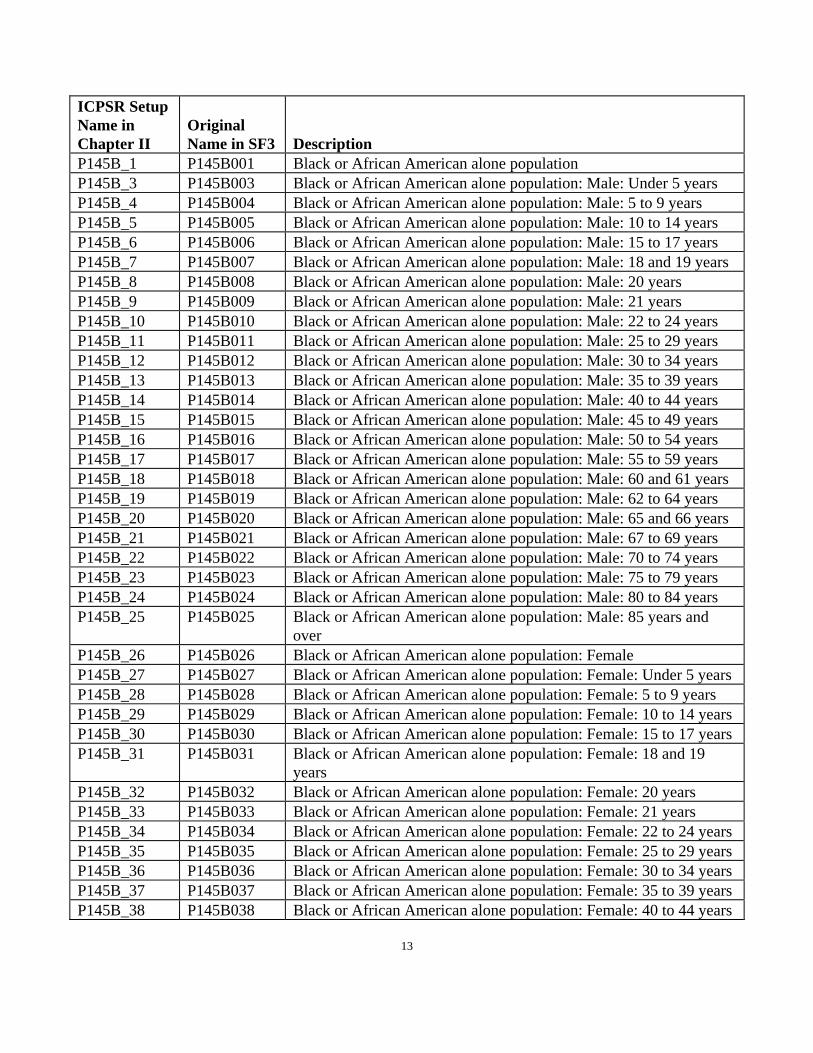
13
ICPSR Setup Name in Chapter II
Original Name in SF3 Description
P145B_1 P145B001 Black or African American alone population P145B_3 P145B003 Black or African American alone population: Male: Under 5 years P145B_4 P145B004 Black or African American alone population: Male: 5 to 9 years P145B_5 P145B005 Black or African American alone population: Male: 10 to 14 years P145B_6 P145B006 Black or African American alone population: Male: 15 to 17 years P145B_7 P145B007 Black or African American alone population: Male: 18 and 19 years P145B_8 P145B008 Black or African American alone population: Male: 20 years P145B_9 P145B009 Black or African American alone population: Male: 21 years P145B_10 P145B010 Black or African American alone population: Male: 22 to 24 years P145B_11 P145B011 Black or African American alone population: Male: 25 to 29 years P145B_12 P145B012 Black or African American alone population: Male: 30 to 34 years P145B_13 P145B013 Black or African American alone population: Male: 35 to 39 years P145B_14 P145B014 Black or African American alone population: Male: 40 to 44 years P145B_15 P145B015 Black or African American alone population: Male: 45 to 49 years P145B_16 P145B016 Black or African American alone population: Male: 50 to 54 years P145B_17 P145B017 Black or African American alone population: Male: 55 to 59 years P145B_18 P145B018 Black or African American alone population: Male: 60 and 61 years P145B_19 P145B019 Black or African American alone population: Male: 62 to 64 years P145B_20 P145B020 Black or African American alone population: Male: 65 and 66 years P145B_21 P145B021 Black or African American alone population: Male: 67 to 69 years P145B_22 P145B022 Black or African American alone population: Male: 70 to 74 years P145B_23 P145B023 Black or African American alone population: Male: 75 to 79 years P145B_24 P145B024 Black or African American alone population: Male: 80 to 84 years P145B_25 P145B025 Black or African American alone population: Male: 85 years and
over P145B_26 P145B026 Black or African American alone population: Female P145B_27 P145B027 Black or African American alone population: Female: Under 5 years P145B_28 P145B028 Black or African American alone population: Female: 5 to 9 years P145B_29 P145B029 Black or African American alone population: Female: 10 to 14 years P145B_30 P145B030 Black or African American alone population: Female: 15 to 17 years P145B_31 P145B031 Black or African American alone population: Female: 18 and 19
years P145B_32 P145B032 Black or African American alone population: Female: 20 years P145B_33 P145B033 Black or African American alone population: Female: 21 years P145B_34 P145B034 Black or African American alone population: Female: 22 to 24 years P145B_35 P145B035 Black or African American alone population: Female: 25 to 29 years P145B_36 P145B036 Black or African American alone population: Female: 30 to 34 years P145B_37 P145B037 Black or African American alone population: Female: 35 to 39 years P145B_38 P145B038 Black or African American alone population: Female: 40 to 44 years
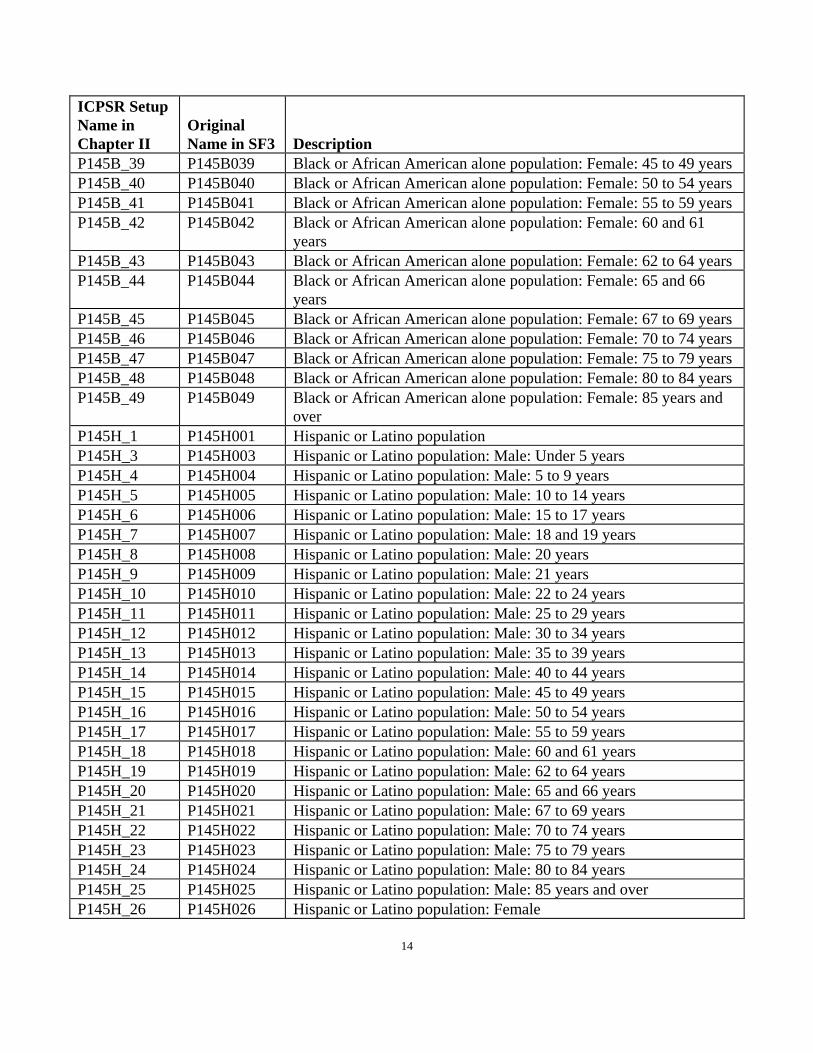
14
ICPSR Setup Name in Chapter II
Original Name in SF3 Description
P145B_39 P145B039 Black or African American alone population: Female: 45 to 49 years P145B_40 P145B040 Black or African American alone population: Female: 50 to 54 years P145B_41 P145B041 Black or African American alone population: Female: 55 to 59 years P145B_42 P145B042 Black or African American alone population: Female: 60 and 61
years P145B_43 P145B043 Black or African American alone population: Female: 62 to 64 years P145B_44 P145B044 Black or African American alone population: Female: 65 and 66
years P145B_45 P145B045 Black or African American alone population: Female: 67 to 69 years P145B_46 P145B046 Black or African American alone population: Female: 70 to 74 years P145B_47 P145B047 Black or African American alone population: Female: 75 to 79 years P145B_48 P145B048 Black or African American alone population: Female: 80 to 84 years P145B_49 P145B049 Black or African American alone population: Female: 85 years and
over P145H_1 P145H001 Hispanic or Latino population P145H_3 P145H003 Hispanic or Latino population: Male: Under 5 years P145H_4 P145H004 Hispanic or Latino population: Male: 5 to 9 years P145H_5 P145H005 Hispanic or Latino population: Male: 10 to 14 years P145H_6 P145H006 Hispanic or Latino population: Male: 15 to 17 years P145H_7 P145H007 Hispanic or Latino population: Male: 18 and 19 years P145H_8 P145H008 Hispanic or Latino population: Male: 20 years P145H_9 P145H009 Hispanic or Latino population: Male: 21 years P145H_10 P145H010 Hispanic or Latino population: Male: 22 to 24 years P145H_11 P145H011 Hispanic or Latino population: Male: 25 to 29 years P145H_12 P145H012 Hispanic or Latino population: Male: 30 to 34 years P145H_13 P145H013 Hispanic or Latino population: Male: 35 to 39 years P145H_14 P145H014 Hispanic or Latino population: Male: 40 to 44 years P145H_15 P145H015 Hispanic or Latino population: Male: 45 to 49 years P145H_16 P145H016 Hispanic or Latino population: Male: 50 to 54 years P145H_17 P145H017 Hispanic or Latino population: Male: 55 to 59 years P145H_18 P145H018 Hispanic or Latino population: Male: 60 and 61 years P145H_19 P145H019 Hispanic or Latino population: Male: 62 to 64 years P145H_20 P145H020 Hispanic or Latino population: Male: 65 and 66 years P145H_21 P145H021 Hispanic or Latino population: Male: 67 to 69 years P145H_22 P145H022 Hispanic or Latino population: Male: 70 to 74 years P145H_23 P145H023 Hispanic or Latino population: Male: 75 to 79 years P145H_24 P145H024 Hispanic or Latino population: Male: 80 to 84 years P145H_25 P145H025 Hispanic or Latino population: Male: 85 years and over P145H_26 P145H026 Hispanic or Latino population: Female
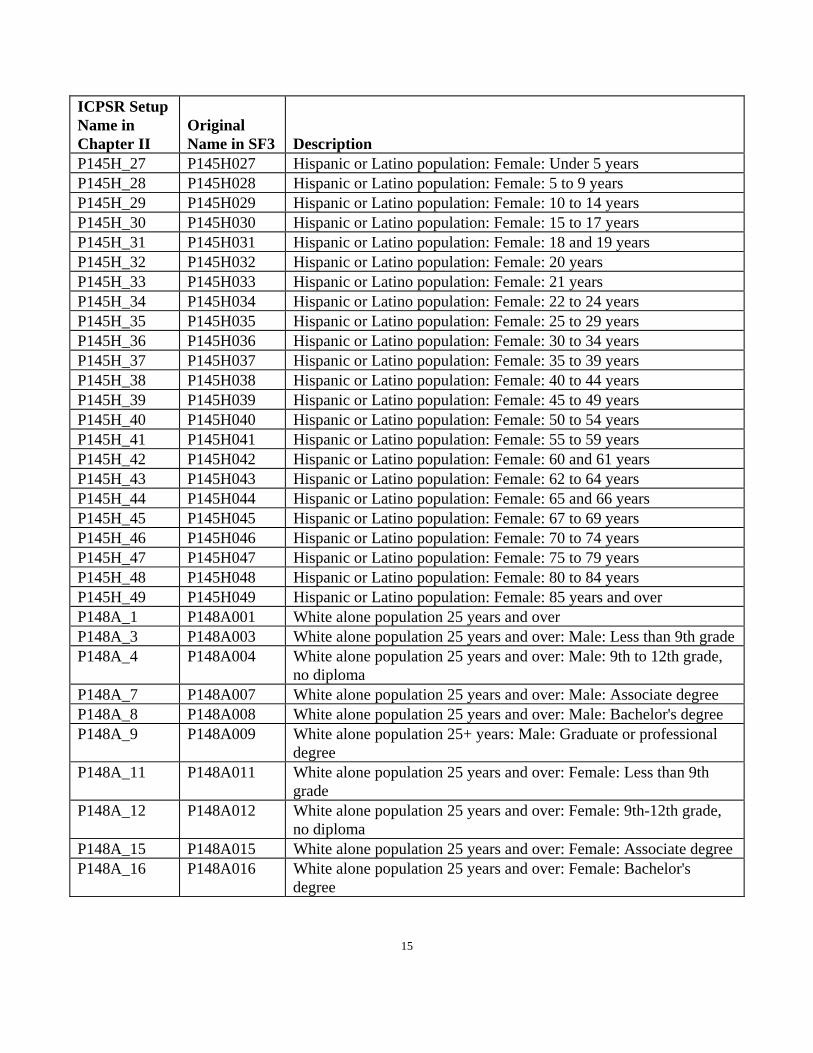
15
ICPSR Setup Name in Chapter II
Original Name in SF3 Description
P145H_27 P145H027 Hispanic or Latino population: Female: Under 5 years P145H_28 P145H028 Hispanic or Latino population: Female: 5 to 9 years P145H_29 P145H029 Hispanic or Latino population: Female: 10 to 14 years P145H_30 P145H030 Hispanic or Latino population: Female: 15 to 17 years P145H_31 P145H031 Hispanic or Latino population: Female: 18 and 19 years P145H_32 P145H032 Hispanic or Latino population: Female: 20 years P145H_33 P145H033 Hispanic or Latino population: Female: 21 years P145H_34 P145H034 Hispanic or Latino population: Female: 22 to 24 years P145H_35 P145H035 Hispanic or Latino population: Female: 25 to 29 years P145H_36 P145H036 Hispanic or Latino population: Female: 30 to 34 years P145H_37 P145H037 Hispanic or Latino population: Female: 35 to 39 years P145H_38 P145H038 Hispanic or Latino population: Female: 40 to 44 years P145H_39 P145H039 Hispanic or Latino population: Female: 45 to 49 years P145H_40 P145H040 Hispanic or Latino population: Female: 50 to 54 years P145H_41 P145H041 Hispanic or Latino population: Female: 55 to 59 years P145H_42 P145H042 Hispanic or Latino population: Female: 60 and 61 years P145H_43 P145H043 Hispanic or Latino population: Female: 62 to 64 years P145H_44 P145H044 Hispanic or Latino population: Female: 65 and 66 years P145H_45 P145H045 Hispanic or Latino population: Female: 67 to 69 years P145H_46 P145H046 Hispanic or Latino population: Female: 70 to 74 years P145H_47 P145H047 Hispanic or Latino population: Female: 75 to 79 years P145H_48 P145H048 Hispanic or Latino population: Female: 80 to 84 years P145H_49 P145H049 Hispanic or Latino population: Female: 85 years and over P148A_1 P148A001 White alone population 25 years and over P148A_3 P148A003 White alone population 25 years and over: Male: Less than 9th grade P148A_4 P148A004 White alone population 25 years and over: Male: 9th to 12th grade,
no diploma P148A_7 P148A007 White alone population 25 years and over: Male: Associate degree P148A_8 P148A008 White alone population 25 years and over: Male: Bachelor's degree P148A_9 P148A009 White alone population 25+ years: Male: Graduate or professional
degree P148A_11 P148A011 White alone population 25 years and over: Female: Less than 9th
grade P148A_12 P148A012 White alone population 25 years and over: Female: 9th-12th grade,
no diploma P148A_15 P148A015 White alone population 25 years and over: Female: Associate degree P148A_16 P148A016 White alone population 25 years and over: Female: Bachelor's
degree
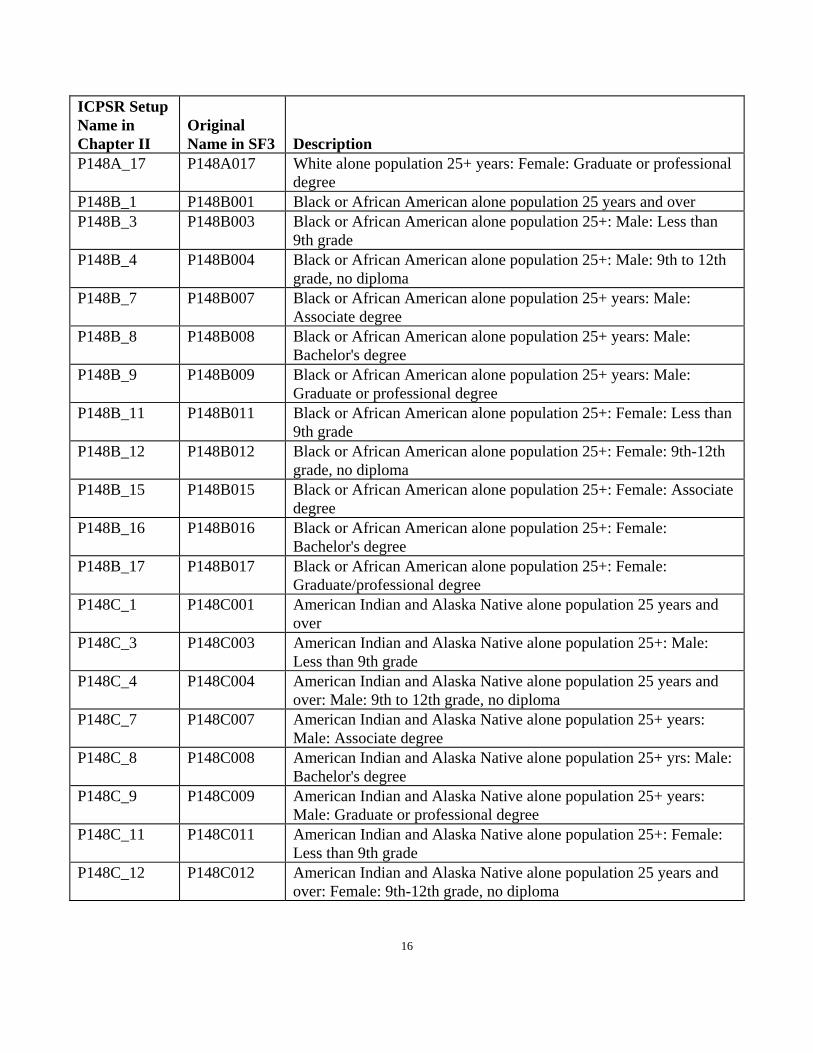
16
ICPSR Setup Name in Chapter II
Original Name in SF3 Description
P148A_17 P148A017 White alone population 25+ years: Female: Graduate or professional degree
P148B_1 P148B001 Black or African American alone population 25 years and over P148B_3 P148B003 Black or African American alone population 25+: Male: Less than
9th grade P148B_4 P148B004 Black or African American alone population 25+: Male: 9th to 12th
grade, no diploma P148B_7 P148B007 Black or African American alone population 25+ years: Male:
Associate degree P148B_8 P148B008 Black or African American alone population 25+ years: Male:
Bachelor's degree P148B_9 P148B009 Black or African American alone population 25+ years: Male:
Graduate or professional degree P148B_11 P148B011 Black or African American alone population 25+: Female: Less than
9th grade P148B_12 P148B012 Black or African American alone population 25+: Female: 9th-12th
grade, no diploma P148B_15 P148B015 Black or African American alone population 25+: Female: Associate
degree P148B_16 P148B016 Black or African American alone population 25+: Female:
Bachelor's degree P148B_17 P148B017 Black or African American alone population 25+: Female:
Graduate/professional degree P148C_1 P148C001 American Indian and Alaska Native alone population 25 years and
over P148C_3 P148C003 American Indian and Alaska Native alone population 25+: Male:
Less than 9th grade P148C_4 P148C004 American Indian and Alaska Native alone population 25 years and
over: Male: 9th to 12th grade, no diploma P148C_7 P148C007 American Indian and Alaska Native alone population 25+ years:
Male: Associate degree P148C_8 P148C008 American Indian and Alaska Native alone population 25+ yrs: Male:
Bachelor's degree P148C_9 P148C009 American Indian and Alaska Native alone population 25+ years:
Male: Graduate or professional degree P148C_11 P148C011 American Indian and Alaska Native alone population 25+: Female:
Less than 9th grade P148C_12 P148C012 American Indian and Alaska Native alone population 25 years and
over: Female: 9th-12th grade, no diploma
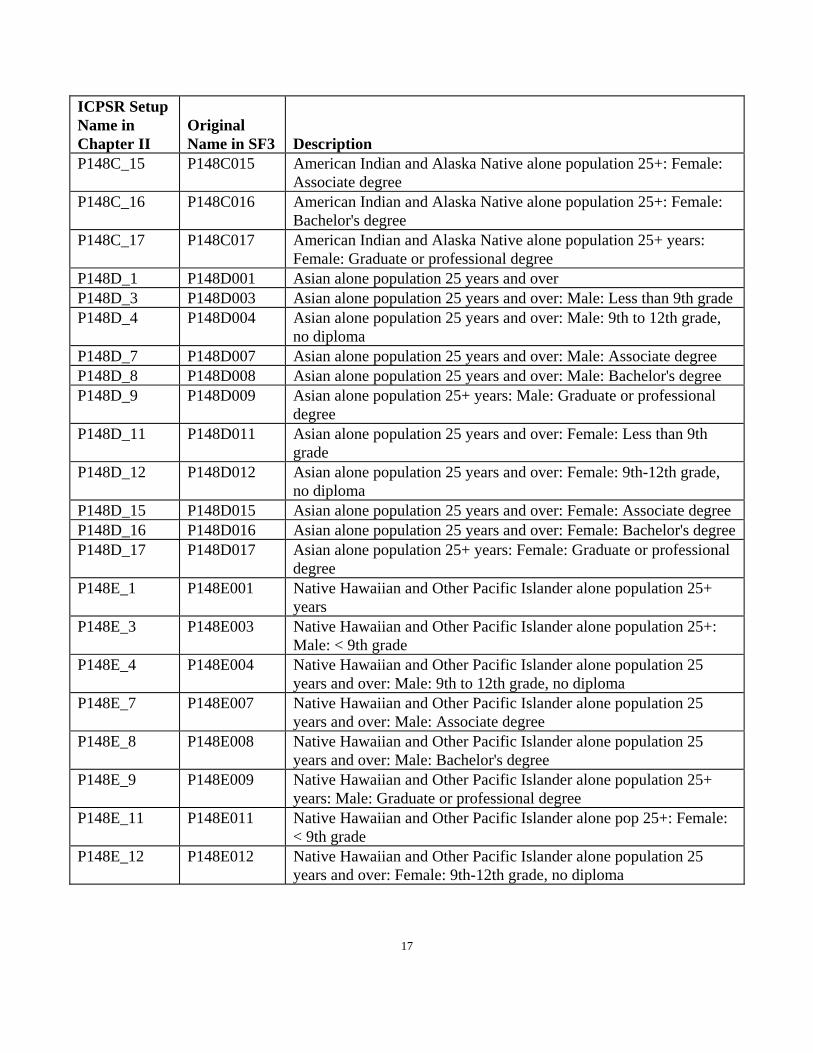
17
ICPSR Setup Name in Chapter II
Original Name in SF3 Description
P148C_15 P148C015 American Indian and Alaska Native alone population 25+: Female: Associate degree
P148C_16 P148C016 American Indian and Alaska Native alone population 25+: Female: Bachelor's degree
P148C_17 P148C017 American Indian and Alaska Native alone population 25+ years: Female: Graduate or professional degree
P148D_1 P148D001 Asian alone population 25 years and over P148D_3 P148D003 Asian alone population 25 years and over: Male: Less than 9th grade P148D_4 P148D004 Asian alone population 25 years and over: Male: 9th to 12th grade,
no diploma P148D_7 P148D007 Asian alone population 25 years and over: Male: Associate degree P148D_8 P148D008 Asian alone population 25 years and over: Male: Bachelor's degree P148D_9 P148D009 Asian alone population 25+ years: Male: Graduate or professional
degree P148D_11 P148D011 Asian alone population 25 years and over: Female: Less than 9th
grade P148D_12 P148D012 Asian alone population 25 years and over: Female: 9th-12th grade,
no diploma P148D_15 P148D015 Asian alone population 25 years and over: Female: Associate degree P148D_16 P148D016 Asian alone population 25 years and over: Female: Bachelor's degree P148D_17 P148D017 Asian alone population 25+ years: Female: Graduate or professional
degree P148E_1 P148E001 Native Hawaiian and Other Pacific Islander alone population 25+
years P148E_3 P148E003 Native Hawaiian and Other Pacific Islander alone population 25+:
Male: < 9th grade P148E_4 P148E004 Native Hawaiian and Other Pacific Islander alone population 25
years and over: Male: 9th to 12th grade, no diploma P148E_7 P148E007 Native Hawaiian and Other Pacific Islander alone population 25
years and over: Male: Associate degree P148E_8 P148E008 Native Hawaiian and Other Pacific Islander alone population 25
years and over: Male: Bachelor's degree P148E_9 P148E009 Native Hawaiian and Other Pacific Islander alone population 25+
years: Male: Graduate or professional degree P148E_11 P148E011 Native Hawaiian and Other Pacific Islander alone pop 25+: Female:
< 9th grade P148E_12 P148E012 Native Hawaiian and Other Pacific Islander alone population 25
years and over: Female: 9th-12th grade, no diploma
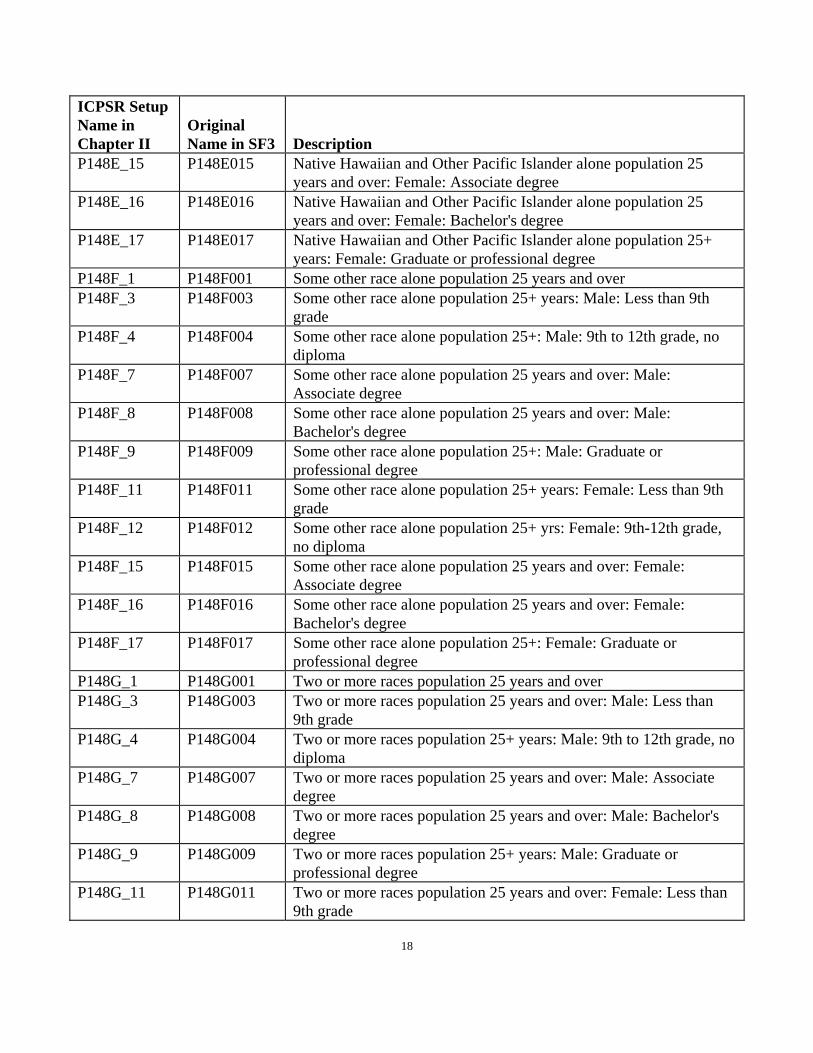
18
ICPSR Setup Name in Chapter II
Original Name in SF3 Description
P148E_15 P148E015 Native Hawaiian and Other Pacific Islander alone population 25 years and over: Female: Associate degree
P148E_16 P148E016 Native Hawaiian and Other Pacific Islander alone population 25 years and over: Female: Bachelor's degree
P148E_17 P148E017 Native Hawaiian and Other Pacific Islander alone population 25+ years: Female: Graduate or professional degree
P148F_1 P148F001 Some other race alone population 25 years and over P148F_3 P148F003 Some other race alone population 25+ years: Male: Less than 9th
grade P148F_4 P148F004 Some other race alone population 25+: Male: 9th to 12th grade, no
diploma P148F_7 P148F007 Some other race alone population 25 years and over: Male:
Associate degree P148F_8 P148F008 Some other race alone population 25 years and over: Male:
Bachelor's degree P148F_9 P148F009 Some other race alone population 25+: Male: Graduate or
professional degree P148F_11 P148F011 Some other race alone population 25+ years: Female: Less than 9th
grade P148F_12 P148F012 Some other race alone population 25+ yrs: Female: 9th-12th grade,
no diploma P148F_15 P148F015 Some other race alone population 25 years and over: Female:
Associate degree P148F_16 P148F016 Some other race alone population 25 years and over: Female:
Bachelor's degree P148F_17 P148F017 Some other race alone population 25+: Female: Graduate or
professional degree P148G_1 P148G001 Two or more races population 25 years and over P148G_3 P148G003 Two or more races population 25 years and over: Male: Less than
9th grade P148G_4 P148G004 Two or more races population 25+ years: Male: 9th to 12th grade, no
diploma P148G_7 P148G007 Two or more races population 25 years and over: Male: Associate
degree P148G_8 P148G008 Two or more races population 25 years and over: Male: Bachelor's
degree P148G_9 P148G009 Two or more races population 25+ years: Male: Graduate or
professional degree P148G_11 P148G011 Two or more races population 25 years and over: Female: Less than
9th grade
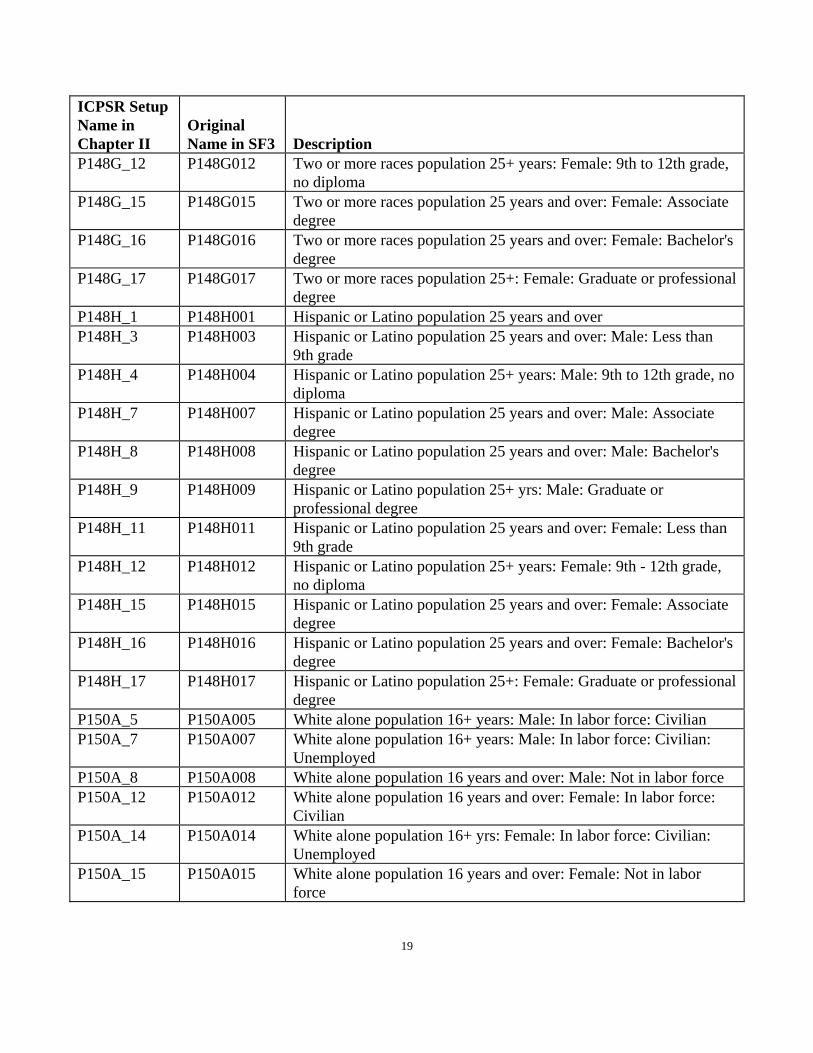
19
ICPSR Setup Name in Chapter II
Original Name in SF3 Description
P148G_12 P148G012 Two or more races population 25+ years: Female: 9th to 12th grade, no diploma
P148G_15 P148G015 Two or more races population 25 years and over: Female: Associate degree
P148G_16 P148G016 Two or more races population 25 years and over: Female: Bachelor's degree
P148G_17 P148G017 Two or more races population 25+: Female: Graduate or professional degree
P148H_1 P148H001 Hispanic or Latino population 25 years and over P148H_3 P148H003 Hispanic or Latino population 25 years and over: Male: Less than
9th grade P148H_4 P148H004 Hispanic or Latino population 25+ years: Male: 9th to 12th grade, no
diploma P148H_7 P148H007 Hispanic or Latino population 25 years and over: Male: Associate
degree P148H_8 P148H008 Hispanic or Latino population 25 years and over: Male: Bachelor's
degree P148H_9 P148H009 Hispanic or Latino population 25+ yrs: Male: Graduate or
professional degree P148H_11 P148H011 Hispanic or Latino population 25 years and over: Female: Less than
9th grade P148H_12 P148H012 Hispanic or Latino population 25+ years: Female: 9th - 12th grade,
no diploma P148H_15 P148H015 Hispanic or Latino population 25 years and over: Female: Associate
degree P148H_16 P148H016 Hispanic or Latino population 25 years and over: Female: Bachelor's
degree P148H_17 P148H017 Hispanic or Latino population 25+: Female: Graduate or professional
degree P150A_5 P150A005 White alone population 16+ years: Male: In labor force: Civilian P150A_7 P150A007 White alone population 16+ years: Male: In labor force: Civilian:
Unemployed P150A_8 P150A008 White alone population 16 years and over: Male: Not in labor force P150A_12 P150A012 White alone population 16 years and over: Female: In labor force:
Civilian P150A_14 P150A014 White alone population 16+ yrs: Female: In labor force: Civilian:
Unemployed P150A_15 P150A015 White alone population 16 years and over: Female: Not in labor
force
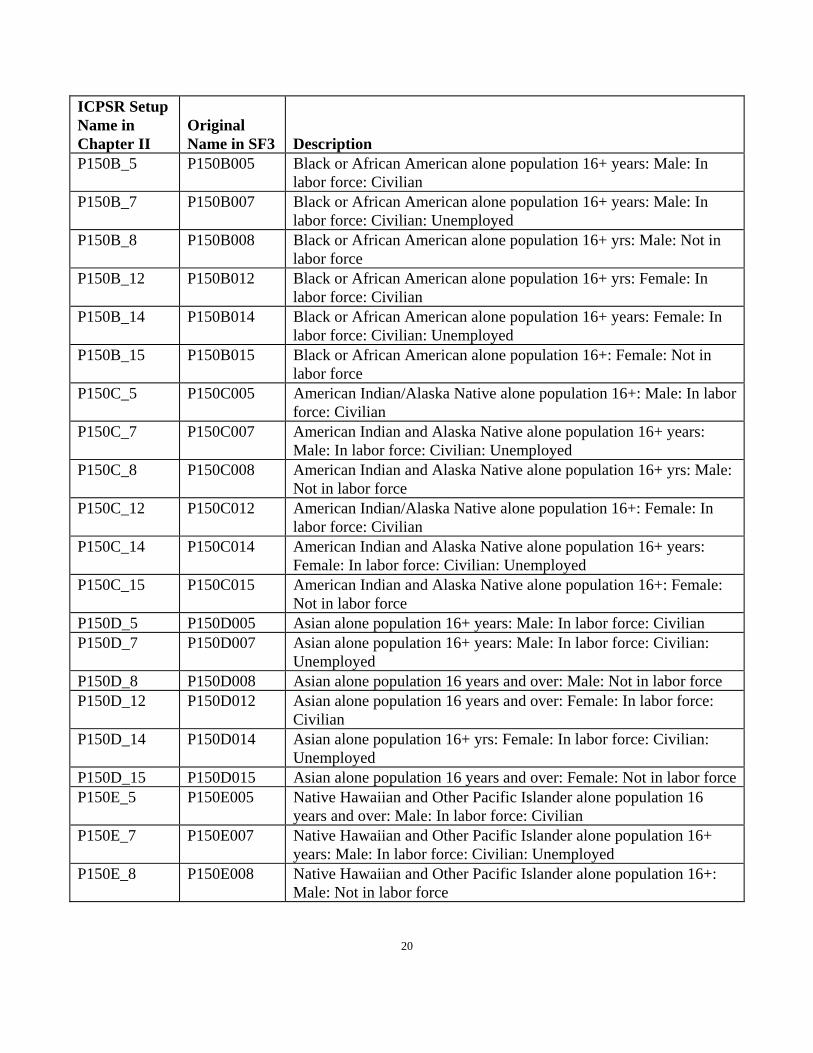
20
ICPSR Setup Name in Chapter II
Original Name in SF3 Description
P150B_5 P150B005 Black or African American alone population 16+ years: Male: In labor force: Civilian
P150B_7 P150B007 Black or African American alone population 16+ years: Male: In labor force: Civilian: Unemployed
P150B_8 P150B008 Black or African American alone population 16+ yrs: Male: Not in labor force
P150B_12 P150B012 Black or African American alone population 16+ yrs: Female: In labor force: Civilian
P150B_14 P150B014 Black or African American alone population 16+ years: Female: In labor force: Civilian: Unemployed
P150B_15 P150B015 Black or African American alone population 16+: Female: Not in labor force
P150C_5 P150C005 American Indian/Alaska Native alone population 16+: Male: In labor force: Civilian
P150C_7 P150C007 American Indian and Alaska Native alone population 16+ years: Male: In labor force: Civilian: Unemployed
P150C_8 P150C008 American Indian and Alaska Native alone population 16+ yrs: Male: Not in labor force
P150C_12 P150C012 American Indian/Alaska Native alone population 16+: Female: In labor force: Civilian
P150C_14 P150C014 American Indian and Alaska Native alone population 16+ years: Female: In labor force: Civilian: Unemployed
P150C_15 P150C015 American Indian and Alaska Native alone population 16+: Female: Not in labor force
P150D_5 P150D005 Asian alone population 16+ years: Male: In labor force: Civilian P150D_7 P150D007 Asian alone population 16+ years: Male: In labor force: Civilian:
Unemployed P150D_8 P150D008 Asian alone population 16 years and over: Male: Not in labor force P150D_12 P150D012 Asian alone population 16 years and over: Female: In labor force:
Civilian P150D_14 P150D014 Asian alone population 16+ yrs: Female: In labor force: Civilian:
Unemployed P150D_15 P150D015 Asian alone population 16 years and over: Female: Not in labor force P150E_5 P150E005 Native Hawaiian and Other Pacific Islander alone population 16
years and over: Male: In labor force: Civilian P150E_7 P150E007 Native Hawaiian and Other Pacific Islander alone population 16+
years: Male: In labor force: Civilian: Unemployed P150E_8 P150E008 Native Hawaiian and Other Pacific Islander alone population 16+:
Male: Not in labor force
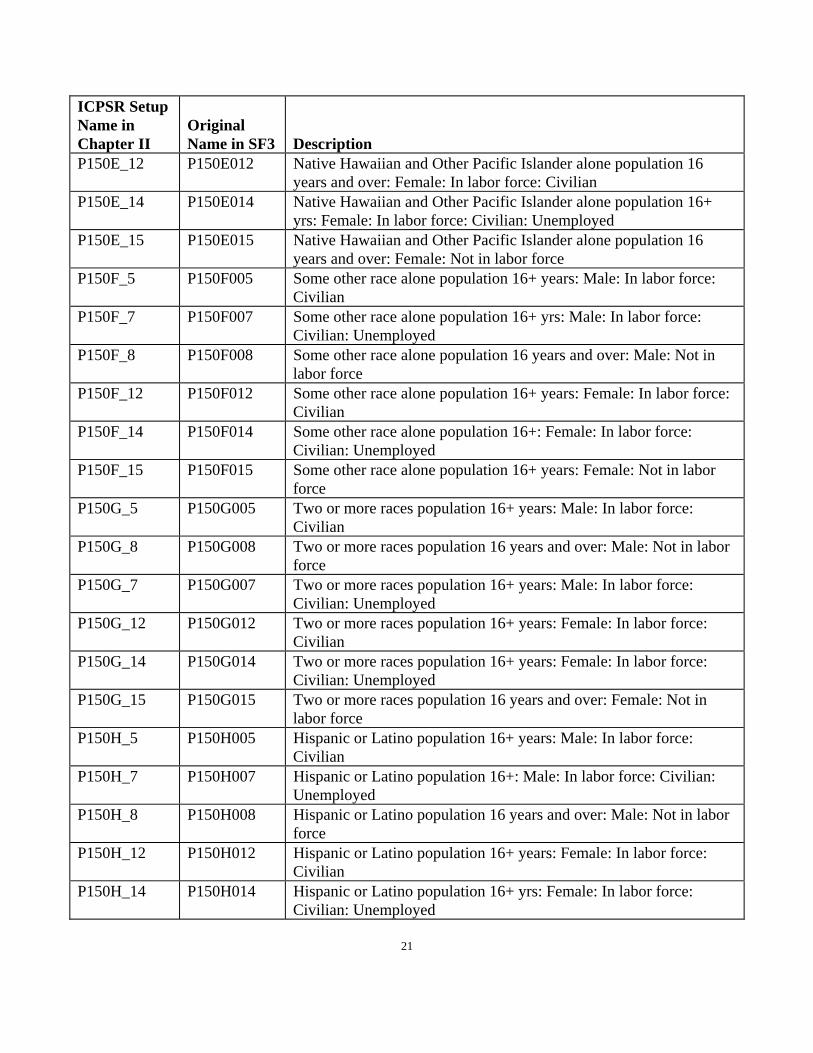
21
ICPSR Setup Name in Chapter II
Original Name in SF3 Description
P150E_12 P150E012 Native Hawaiian and Other Pacific Islander alone population 16 years and over: Female: In labor force: Civilian
P150E_14 P150E014 Native Hawaiian and Other Pacific Islander alone population 16+ yrs: Female: In labor force: Civilian: Unemployed
P150E_15 P150E015 Native Hawaiian and Other Pacific Islander alone population 16 years and over: Female: Not in labor force
P150F_5 P150F005 Some other race alone population 16+ years: Male: In labor force: Civilian
P150F_7 P150F007 Some other race alone population 16+ yrs: Male: In labor force: Civilian: Unemployed
P150F_8 P150F008 Some other race alone population 16 years and over: Male: Not in labor force
P150F_12 P150F012 Some other race alone population 16+ years: Female: In labor force: Civilian
P150F_14 P150F014 Some other race alone population 16+: Female: In labor force: Civilian: Unemployed
P150F_15 P150F015 Some other race alone population 16+ years: Female: Not in labor force
P150G_5 P150G005 Two or more races population 16+ years: Male: In labor force: Civilian
P150G_8 P150G008 Two or more races population 16 years and over: Male: Not in labor force
P150G_7 P150G007 Two or more races population 16+ years: Male: In labor force: Civilian: Unemployed
P150G_12 P150G012 Two or more races population 16+ years: Female: In labor force: Civilian
P150G_14 P150G014 Two or more races population 16+ years: Female: In labor force: Civilian: Unemployed
P150G_15 P150G015 Two or more races population 16 years and over: Female: Not in labor force
P150H_5 P150H005 Hispanic or Latino population 16+ years: Male: In labor force: Civilian
P150H_7 P150H007 Hispanic or Latino population 16+: Male: In labor force: Civilian: Unemployed
P150H_8 P150H008 Hispanic or Latino population 16 years and over: Male: Not in labor force
P150H_12 P150H012 Hispanic or Latino population 16+ years: Female: In labor force: Civilian
P150H_14 P150H014 Hispanic or Latino population 16+ yrs: Female: In labor force: Civilian: Unemployed
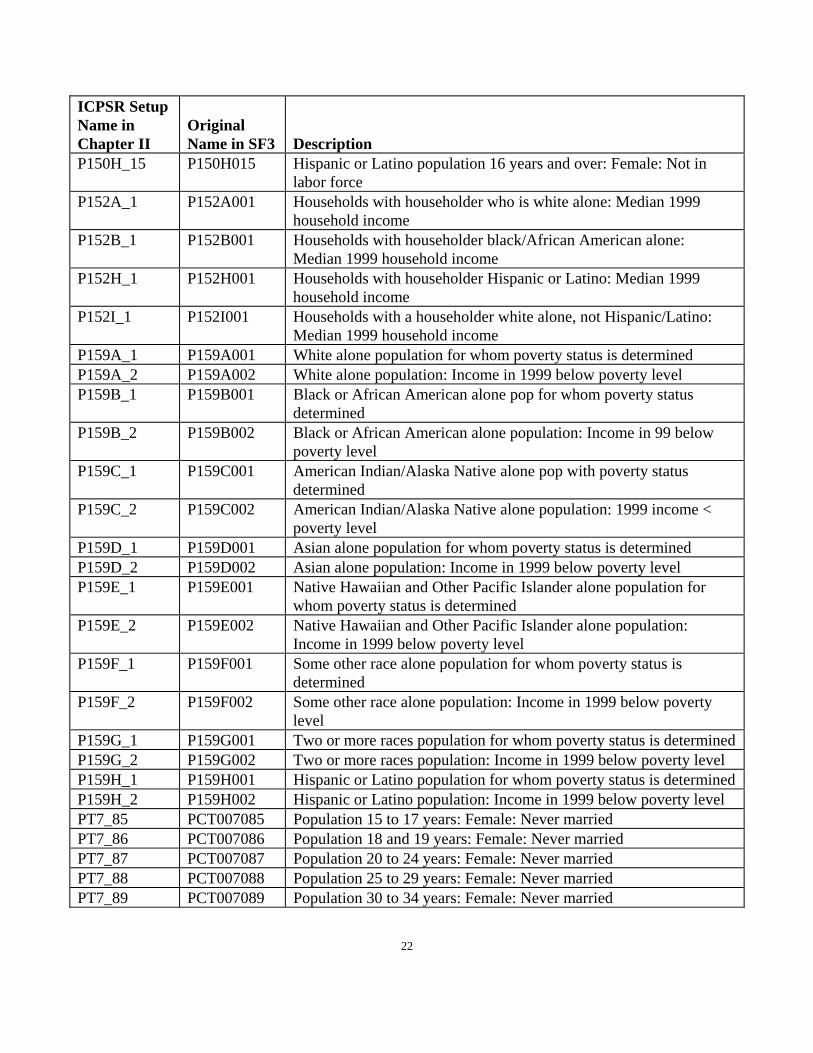
22
ICPSR Setup Name in Chapter II
Original Name in SF3 Description
P150H_15 P150H015 Hispanic or Latino population 16 years and over: Female: Not in labor force
P152A_1 P152A001 Households with householder who is white alone: Median 1999 household income
P152B_1 P152B001 Households with householder black/African American alone: Median 1999 household income
P152H_1 P152H001 Households with householder Hispanic or Latino: Median 1999 household income
P152I_1 P152I001 Households with a householder white alone, not Hispanic/Latino: Median 1999 household income
P159A_1 P159A001 White alone population for whom poverty status is determined P159A_2 P159A002 White alone population: Income in 1999 below poverty level P159B_1 P159B001 Black or African American alone pop for whom poverty status
determined P159B_2 P159B002 Black or African American alone population: Income in 99 below
poverty level P159C_1 P159C001 American Indian/Alaska Native alone pop with poverty status
determined P159C_2 P159C002 American Indian/Alaska Native alone population: 1999 income <
poverty level P159D_1 P159D001 Asian alone population for whom poverty status is determined P159D_2 P159D002 Asian alone population: Income in 1999 below poverty level P159E_1 P159E001 Native Hawaiian and Other Pacific Islander alone population for
whom poverty status is determined P159E_2 P159E002 Native Hawaiian and Other Pacific Islander alone population:
Income in 1999 below poverty level P159F_1 P159F001 Some other race alone population for whom poverty status is
determined P159F_2 P159F002 Some other race alone population: Income in 1999 below poverty
level P159G_1 P159G001 Two or more races population for whom poverty status is determined P159G_2 P159G002 Two or more races population: Income in 1999 below poverty level P159H_1 P159H001 Hispanic or Latino population for whom poverty status is determined P159H_2 P159H002 Hispanic or Latino population: Income in 1999 below poverty level PT7_85 PCT007085 Population 15 to 17 years: Female: Never married PT7_86 PCT007086 Population 18 and 19 years: Female: Never married PT7_87 PCT007087 Population 20 to 24 years: Female: Never married PT7_88 PCT007088 Population 25 to 29 years: Female: Never married PT7_89 PCT007089 Population 30 to 34 years: Female: Never married
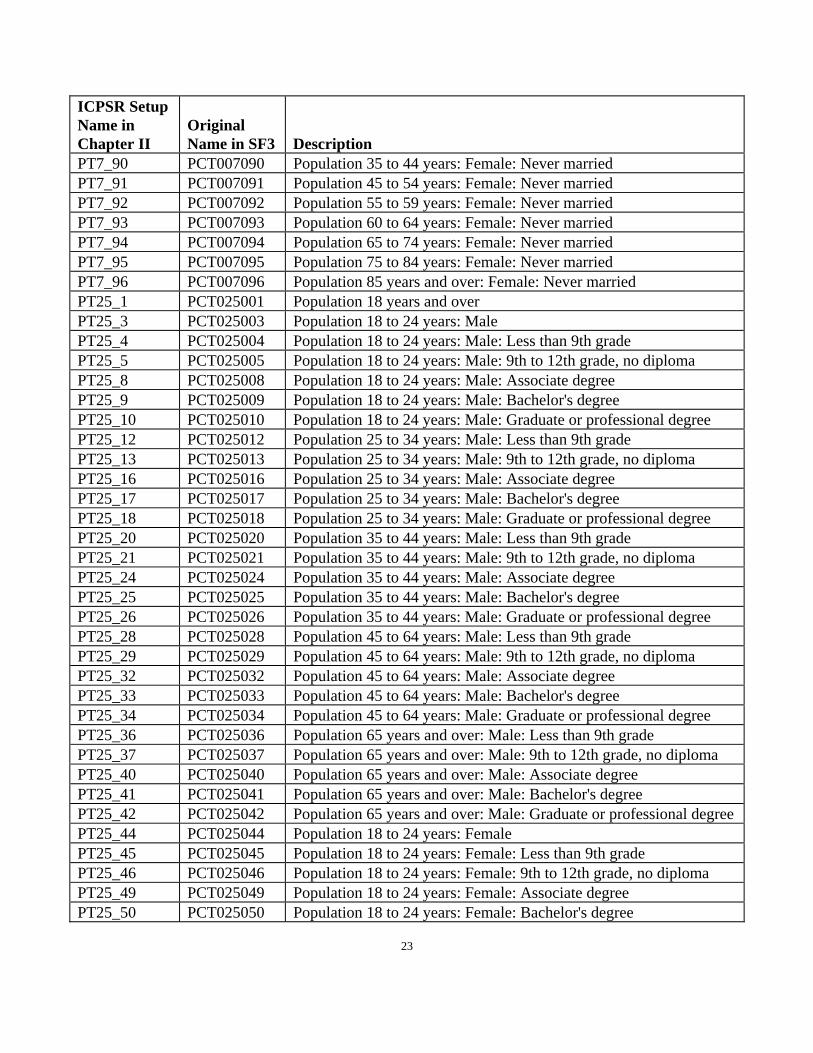
23
ICPSR Setup Name in Chapter II
Original Name in SF3 Description
PT7_90 PCT007090 Population 35 to 44 years: Female: Never married PT7_91 PCT007091 Population 45 to 54 years: Female: Never married PT7_92 PCT007092 Population 55 to 59 years: Female: Never married PT7_93 PCT007093 Population 60 to 64 years: Female: Never married PT7_94 PCT007094 Population 65 to 74 years: Female: Never married PT7_95 PCT007095 Population 75 to 84 years: Female: Never married PT7_96 PCT007096 Population 85 years and over: Female: Never married PT25_1 PCT025001 Population 18 years and over PT25_3 PCT025003 Population 18 to 24 years: Male PT25_4 PCT025004 Population 18 to 24 years: Male: Less than 9th grade PT25_5 PCT025005 Population 18 to 24 years: Male: 9th to 12th grade, no diploma PT25_8 PCT025008 Population 18 to 24 years: Male: Associate degree PT25_9 PCT025009 Population 18 to 24 years: Male: Bachelor's degree PT25_10 PCT025010 Population 18 to 24 years: Male: Graduate or professional degree PT25_12 PCT025012 Population 25 to 34 years: Male: Less than 9th grade PT25_13 PCT025013 Population 25 to 34 years: Male: 9th to 12th grade, no diploma PT25_16 PCT025016 Population 25 to 34 years: Male: Associate degree PT25_17 PCT025017 Population 25 to 34 years: Male: Bachelor's degree PT25_18 PCT025018 Population 25 to 34 years: Male: Graduate or professional degree PT25_20 PCT025020 Population 35 to 44 years: Male: Less than 9th grade PT25_21 PCT025021 Population 35 to 44 years: Male: 9th to 12th grade, no diploma PT25_24 PCT025024 Population 35 to 44 years: Male: Associate degree PT25_25 PCT025025 Population 35 to 44 years: Male: Bachelor's degree PT25_26 PCT025026 Population 35 to 44 years: Male: Graduate or professional degree PT25_28 PCT025028 Population 45 to 64 years: Male: Less than 9th grade PT25_29 PCT025029 Population 45 to 64 years: Male: 9th to 12th grade, no diploma PT25_32 PCT025032 Population 45 to 64 years: Male: Associate degree PT25_33 PCT025033 Population 45 to 64 years: Male: Bachelor's degree PT25_34 PCT025034 Population 45 to 64 years: Male: Graduate or professional degree PT25_36 PCT025036 Population 65 years and over: Male: Less than 9th grade PT25_37 PCT025037 Population 65 years and over: Male: 9th to 12th grade, no diploma PT25_40 PCT025040 Population 65 years and over: Male: Associate degree PT25_41 PCT025041 Population 65 years and over: Male: Bachelor's degree PT25_42 PCT025042 Population 65 years and over: Male: Graduate or professional degree PT25_44 PCT025044 Population 18 to 24 years: Female PT25_45 PCT025045 Population 18 to 24 years: Female: Less than 9th grade PT25_46 PCT025046 Population 18 to 24 years: Female: 9th to 12th grade, no diploma PT25_49 PCT025049 Population 18 to 24 years: Female: Associate degree PT25_50 PCT025050 Population 18 to 24 years: Female: Bachelor's degree
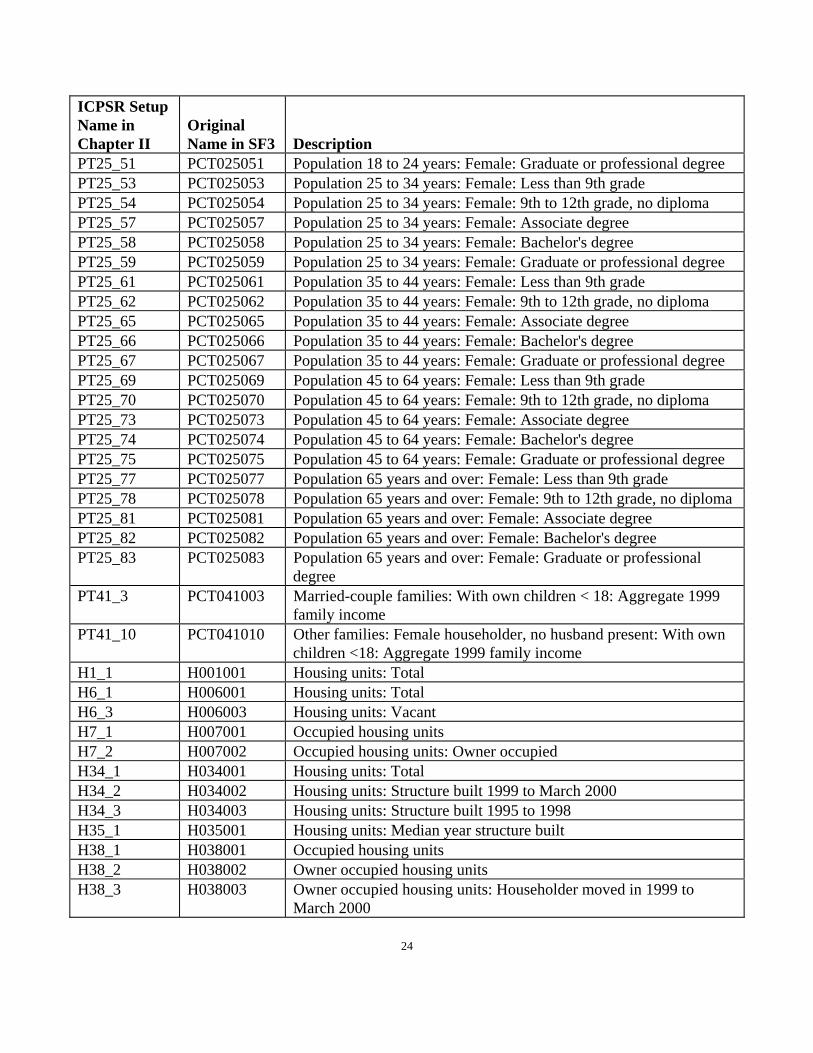
24
ICPSR Setup Name in Chapter II
Original Name in SF3 Description
PT25_51 PCT025051 Population 18 to 24 years: Female: Graduate or professional degree PT25_53 PCT025053 Population 25 to 34 years: Female: Less than 9th grade PT25_54 PCT025054 Population 25 to 34 years: Female: 9th to 12th grade, no diploma PT25_57 PCT025057 Population 25 to 34 years: Female: Associate degree PT25_58 PCT025058 Population 25 to 34 years: Female: Bachelor's degree PT25_59 PCT025059 Population 25 to 34 years: Female: Graduate or professional degree PT25_61 PCT025061 Population 35 to 44 years: Female: Less than 9th grade PT25_62 PCT025062 Population 35 to 44 years: Female: 9th to 12th grade, no diploma PT25_65 PCT025065 Population 35 to 44 years: Female: Associate degree PT25_66 PCT025066 Population 35 to 44 years: Female: Bachelor's degree PT25_67 PCT025067 Population 35 to 44 years: Female: Graduate or professional degree PT25_69 PCT025069 Population 45 to 64 years: Female: Less than 9th grade PT25_70 PCT025070 Population 45 to 64 years: Female: 9th to 12th grade, no diploma PT25_73 PCT025073 Population 45 to 64 years: Female: Associate degree PT25_74 PCT025074 Population 45 to 64 years: Female: Bachelor's degree PT25_75 PCT025075 Population 45 to 64 years: Female: Graduate or professional degree PT25_77 PCT025077 Population 65 years and over: Female: Less than 9th grade PT25_78 PCT025078 Population 65 years and over: Female: 9th to 12th grade, no diploma PT25_81 PCT025081 Population 65 years and over: Female: Associate degree PT25_82 PCT025082 Population 65 years and over: Female: Bachelor's degree PT25_83 PCT025083 Population 65 years and over: Female: Graduate or professional
degree PT41_3 PCT041003 Married-couple families: With own children < 18: Aggregate 1999
family income PT41_10 PCT041010 Other families: Female householder, no husband present: With own
children <18: Aggregate 1999 family income H1_1 H001001 Housing units: Total H6_1 H006001 Housing units: Total H6_3 H006003 Housing units: Vacant H7_1 H007001 Occupied housing units H7_2 H007002 Occupied housing units: Owner occupied H34_1 H034001 Housing units: Total H34_2 H034002 Housing units: Structure built 1999 to March 2000 H34_3 H034003 Housing units: Structure built 1995 to 1998 H35_1 H035001 Housing units: Median year structure built H38_1 H038001 Occupied housing units H38_2 H038002 Owner occupied housing units H38_3 H038003 Owner occupied housing units: Householder moved in 1999 to
March 2000
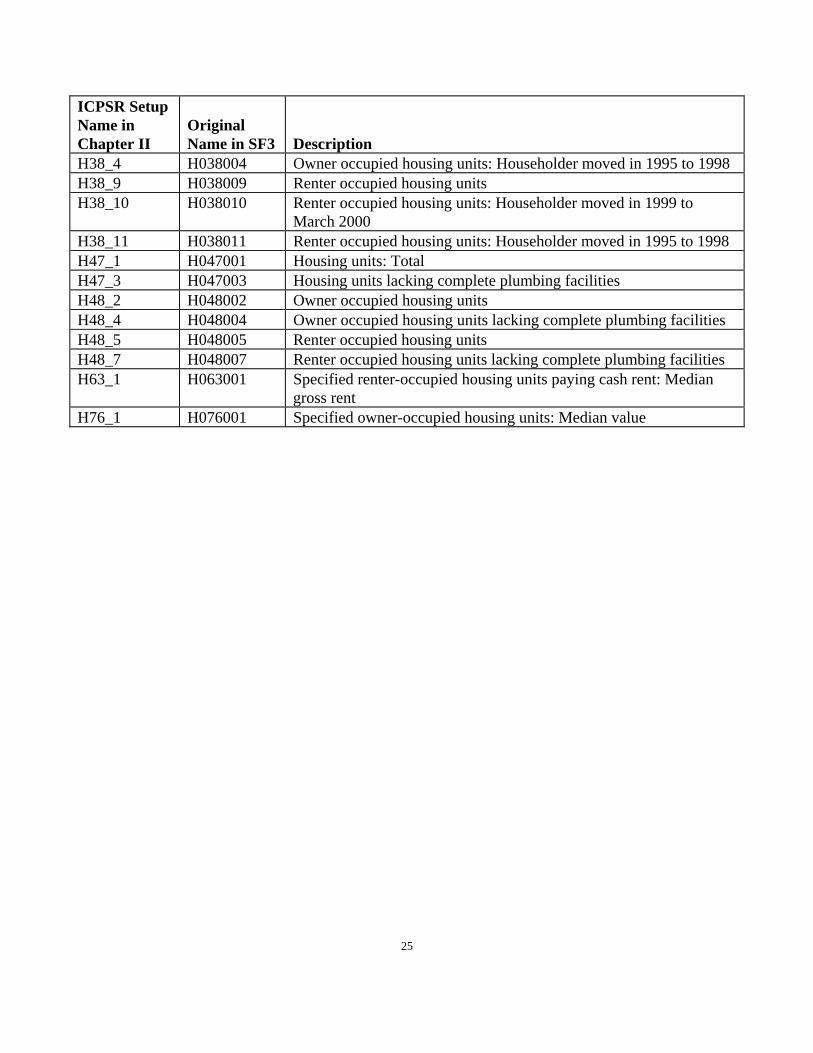
25
ICPSR Setup Name in Chapter II
Original Name in SF3 Description
H38_4 H038004 Owner occupied housing units: Householder moved in 1995 to 1998 H38_9 H038009 Renter occupied housing units H38_10 H038010 Renter occupied housing units: Householder moved in 1999 to
March 2000 H38_11 H038011 Renter occupied housing units: Householder moved in 1995 to 1998 H47_1 H047001 Housing units: Total H47_3 H047003 Housing units lacking complete plumbing facilities H48_2 H048002 Owner occupied housing units H48_4 H048004 Owner occupied housing units lacking complete plumbing facilities H48_5 H048005 Renter occupied housing units H48_7 H048007 Renter occupied housing units lacking complete plumbing facilities H63_1 H063001 Specified renter-occupied housing units paying cash rent: Median
gross rent H76_1 H076001 Specified owner-occupied housing units: Median value
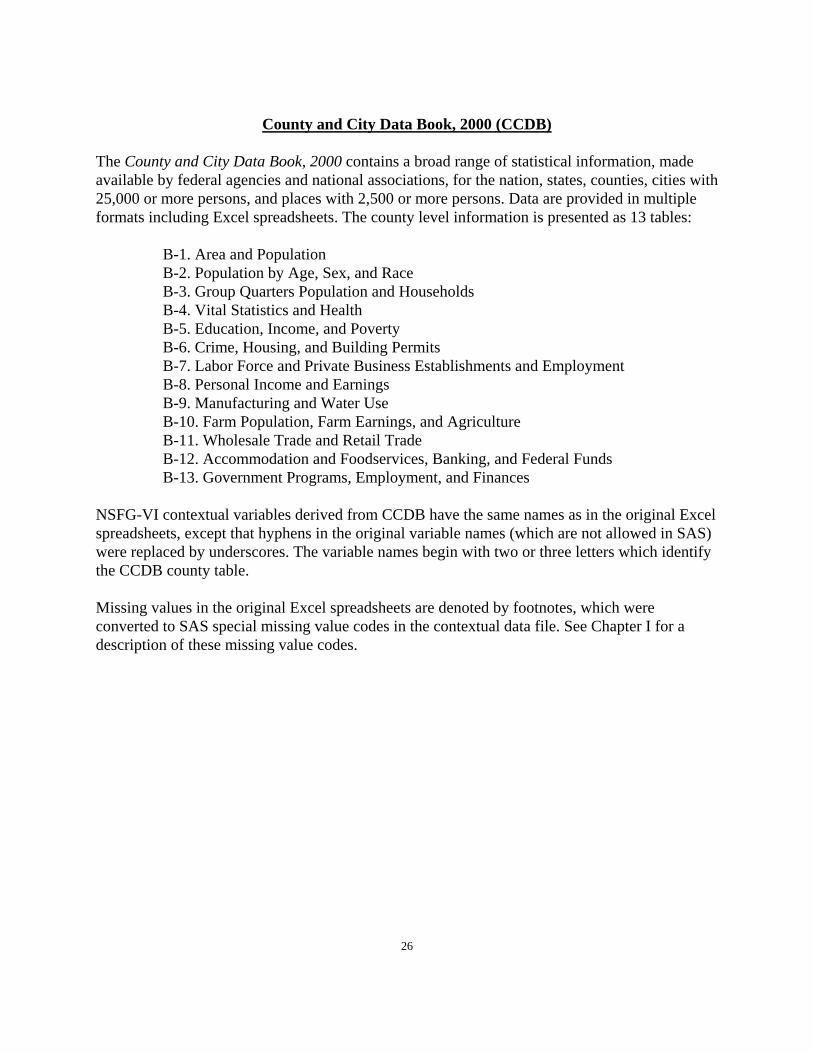
26
County and City Data Book, 2000 (CCDB)
The County and City Data Book, 2000 contains a broad range of statistical information, made available by federal agencies and national associations, for the nation, states, counties, cities with 25,000 or more persons, and places with 2,500 or more persons. Data are provided in multiple formats including Excel spreadsheets. The county level information is presented as 13 tables:
B-1. Area and Population B-2. Population by Age, Sex, and Race B-3. Group Quarters Population and Households B-4. Vital Statistics and Health B-5. Education, Income, and Poverty B-6. Crime, Housing, and Building Permits B-7. Labor Force and Private Business Establishments and Employment B-8. Personal Income and Earnings B-9. Manufacturing and Water Use B-10. Farm Population, Farm Earnings, and Agriculture B-11. Wholesale Trade and Retail Trade B-12. Accommodation and Foodservices, Banking, and Federal Funds B-13. Government Programs, Employment, and Finances
NSFG-VI contextual variables derived from CCDB have the same names as in the original Excel spreadsheets, except that hyphens in the original variable names (which are not allowed in SAS) were replaced by underscores. The variable names begin with two or three letters which identify the CCDB county table. Missing values in the original Excel spreadsheets are denoted by footnotes, which were converted to SAS special missing value codes in the contextual data file. See Chapter I for a description of these missing value codes.
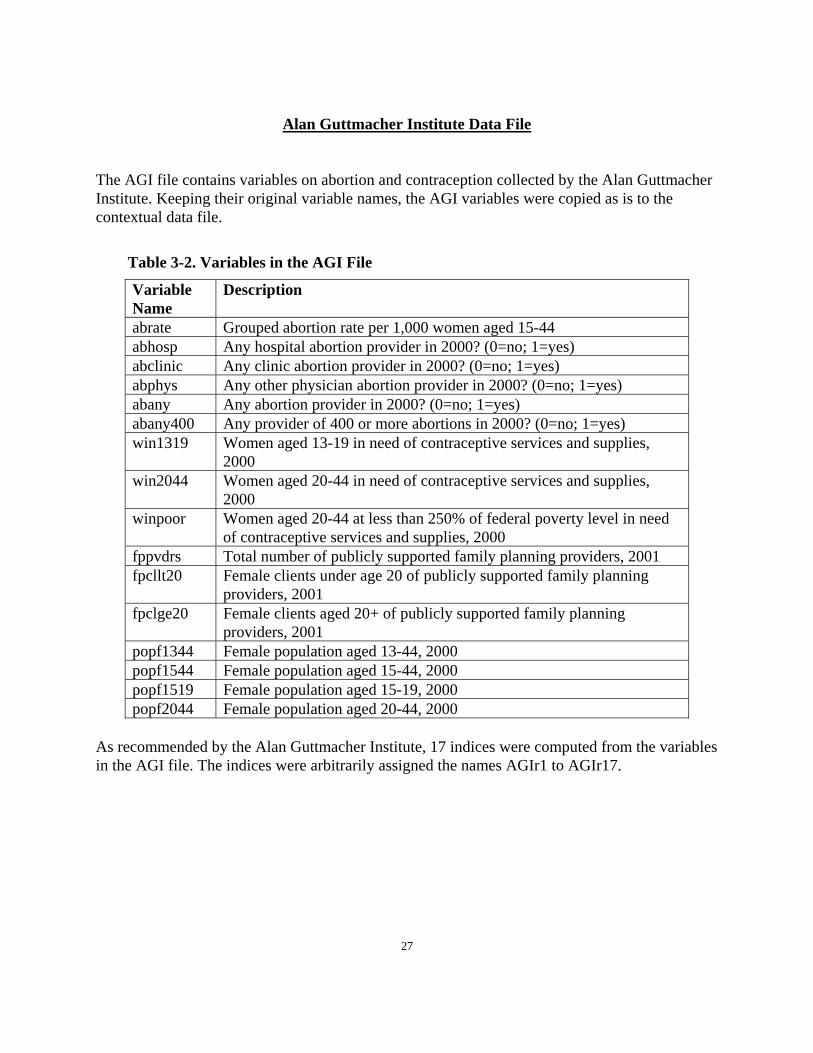
27
Alan Guttmacher Institute Data File
The AGI file contains variables on abortion and contraception collected by the Alan Guttmacher Institute. Keeping their original variable names, the AGI variables were copied as is to the contextual data file.
Table 3-2. Variables in the AGI File
Variable Name
Description
abrate Grouped abortion rate per 1,000 women aged 15-44 abhosp Any hospital abortion provider in 2000? (0=no; 1=yes) abclinic Any clinic abortion provider in 2000? (0=no; 1=yes) abphys Any other physician abortion provider in 2000? (0=no; 1=yes) abany Any abortion provider in 2000? (0=no; 1=yes) abany400 Any provider of 400 or more abortions in 2000? (0=no; 1=yes) win1319 Women aged 13-19 in need of contraceptive services and supplies,
2000 win2044 Women aged 20-44 in need of contraceptive services and supplies,
2000 winpoor Women aged 20-44 at less than 250% of federal poverty level in need
of contraceptive services and supplies, 2000 fppvdrs Total number of publicly supported family planning providers, 2001 fpcllt20 Female clients under age 20 of publicly supported family planning
providers, 2001 fpclge20 Female clients aged 20+ of publicly supported family planning
providers, 2001 popf1344 Female population aged 13-44, 2000 popf1544 Female population aged 15-44, 2000 popf1519 Female population aged 15-19, 2000 popf2044 Female population aged 20-44, 2000
As recommended by the Alan Guttmacher Institute, 17 indices were computed from the variables in the AGI file. The indices were arbitrarily assigned the names AGIr1 to AGIr17.
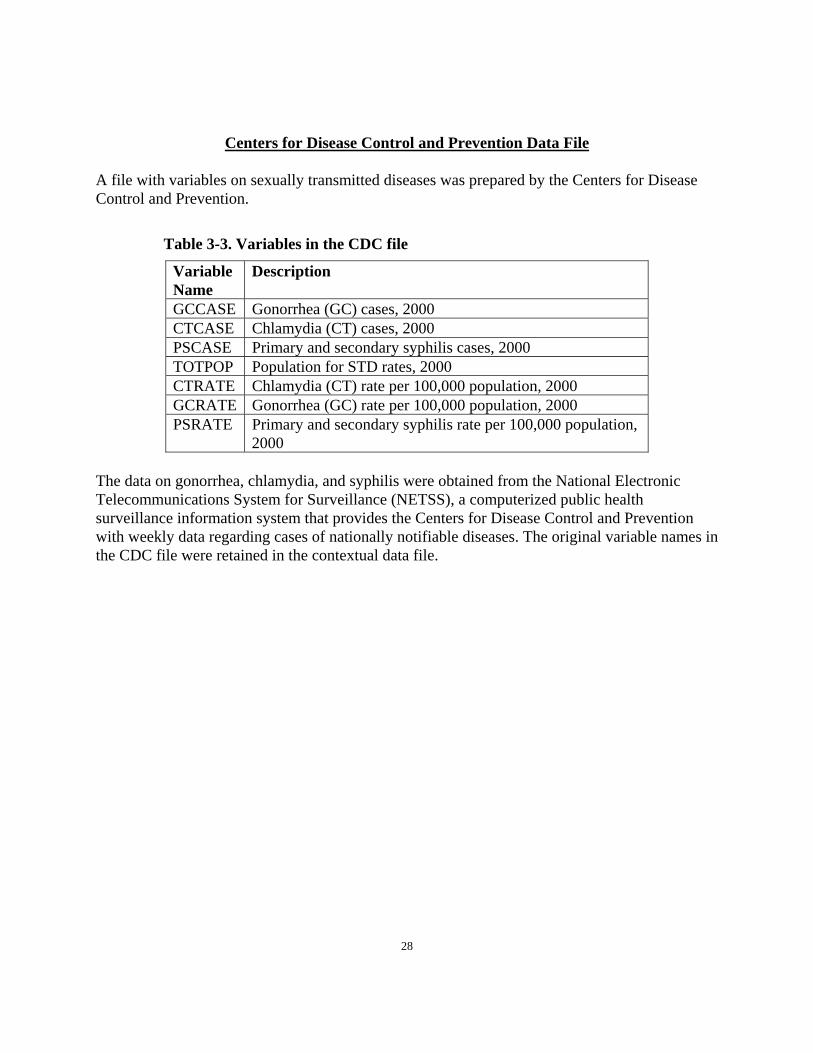
28
Centers for Disease Control and Prevention Data File A file with variables on sexually transmitted diseases was prepared by the Centers for Disease Control and Prevention.
Table 3-3. Variables in the CDC file
Variable Name
Description
GCCASE Gonorrhea (GC) cases, 2000 CTCASE Chlamydia (CT) cases, 2000 PSCASE Primary and secondary syphilis cases, 2000 TOTPOP Population for STD rates, 2000 CTRATE Chlamydia (CT) rate per 100,000 population, 2000 GCRATE Gonorrhea (GC) rate per 100,000 population, 2000 PSRATE Primary and secondary syphilis rate per 100,000 population,
2000 The data on gonorrhea, chlamydia, and syphilis were obtained from the National Electronic Telecommunications System for Surveillance (NETSS), a computerized public health surveillance information system that provides the Centers for Disease Control and Prevention with weekly data regarding cases of nationally notifiable diseases. The original variable names in the CDC file were retained in the contextual data file.
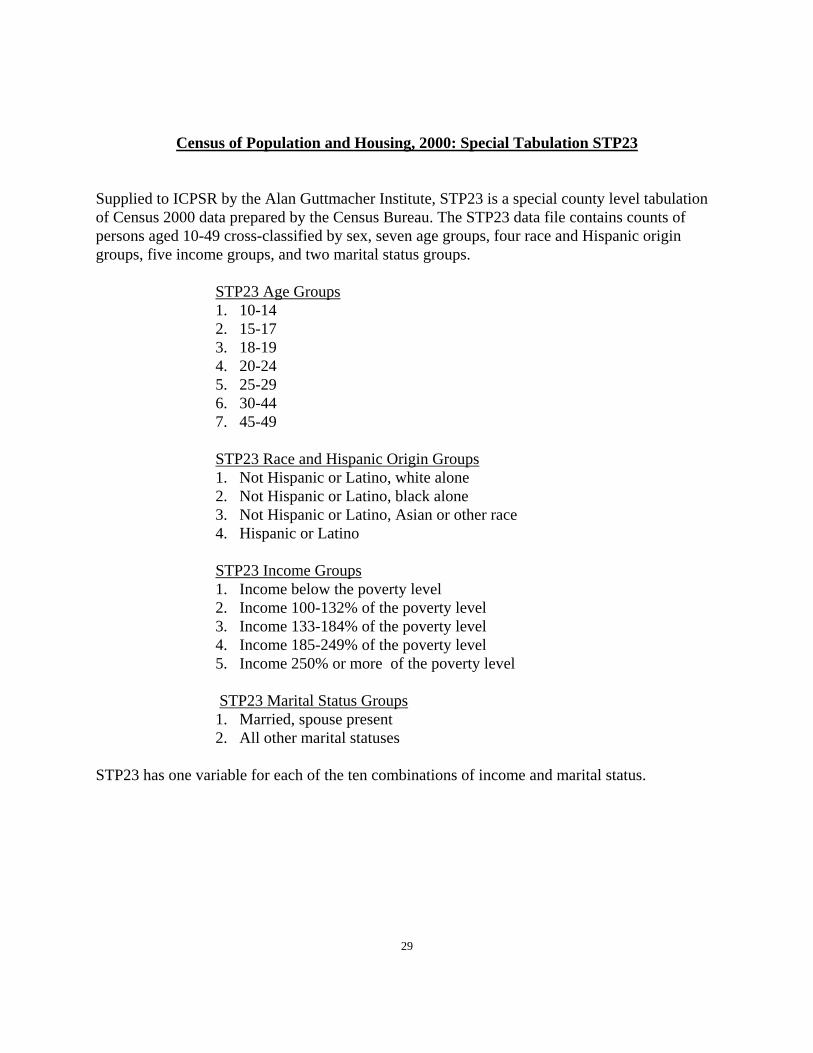
29
Census of Population and Housing, 2000: Special Tabulation STP23
Supplied to ICPSR by the Alan Guttmacher Institute, STP23 is a special county level tabulation of Census 2000 data prepared by the Census Bureau. The STP23 data file contains counts of persons aged 10-49 cross-classified by sex, seven age groups, four race and Hispanic origin groups, five income groups, and two marital status groups. STP23 Age Groups
1. 10-14 2. 15-17 3. 18-19 4. 20-24 5. 25-29 6. 30-44 7. 45-49
STP23 Race and Hispanic Origin Groups
1. Not Hispanic or Latino, white alone 2. Not Hispanic or Latino, black alone 3. Not Hispanic or Latino, Asian or other race 4. Hispanic or Latino
STP23 Income Groups
1. Income below the poverty level 2. Income 100-132% of the poverty level 3. Income 133-184% of the poverty level 4. Income 185-249% of the poverty level 5. Income 250% or more of the poverty level
STP23 Marital Status Groups
1. Married, spouse present 2. All other marital statuses
STP23 has one variable for each of the ten combinations of income and marital status.
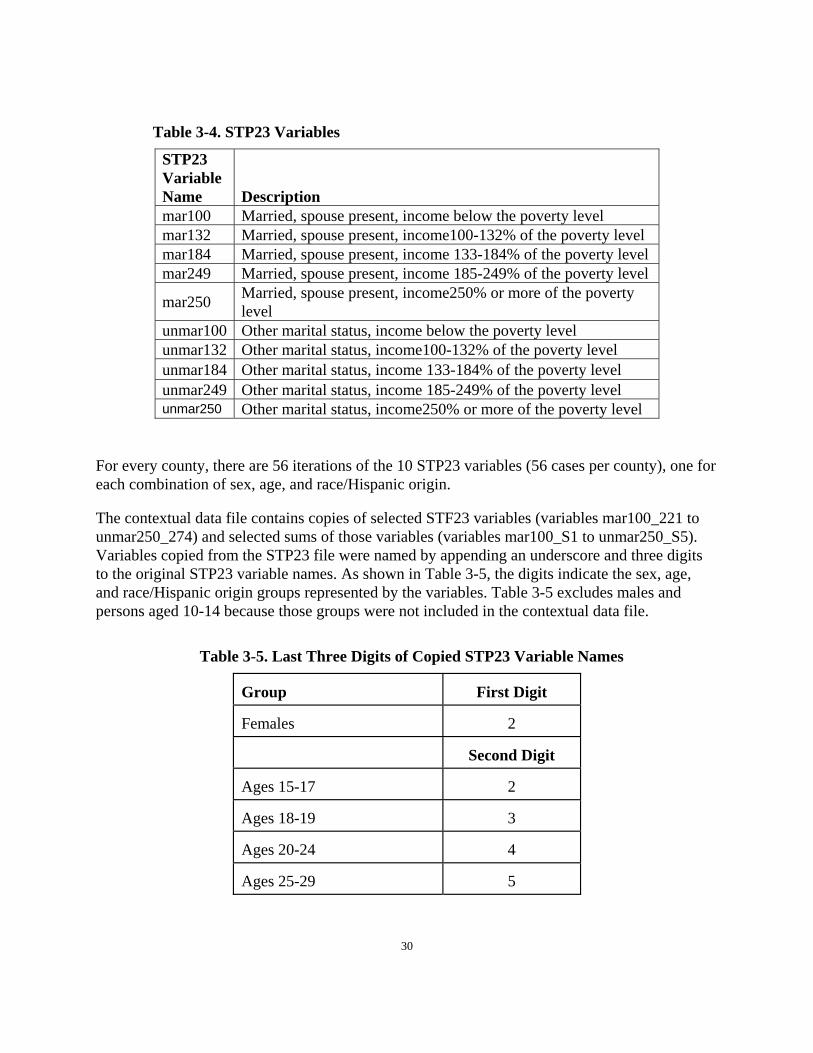
30
Table 3-4. STP23 Variables
STP23 Variable Name Description mar100 Married, spouse present, income below the poverty level mar132 Married, spouse present, income100-132% of the poverty level mar184 Married, spouse present, income 133-184% of the poverty level mar249 Married, spouse present, income 185-249% of the poverty level
mar250 Married, spouse present, income250% or more of the poverty level
unmar100 Other marital status, income below the poverty level unmar132 Other marital status, income100-132% of the poverty level unmar184 Other marital status, income 133-184% of the poverty level unmar249 Other marital status, income 185-249% of the poverty level unmar250 Other marital status, income250% or more of the poverty level
For every county, there are 56 iterations of the 10 STP23 variables (56 cases per county), one for each combination of sex, age, and race/Hispanic origin. The contextual data file contains copies of selected STF23 variables (variables mar100_221 to unmar250_274) and selected sums of those variables (variables mar100_S1 to unmar250_S5). Variables copied from the STP23 file were named by appending an underscore and three digits to the original STP23 variable names. As shown in Table 3-5, the digits indicate the sex, age, and race/Hispanic origin groups represented by the variables. Table 3-5 excludes males and persons aged 10-14 because those groups were not included in the contextual data file.
Table 3-5. Last Three Digits of Copied STP23 Variable Names Group
First Digit
Females
2
Second Digit
Ages 15-17
2
Ages 18-19
3
Ages 20-24
4
Ages 25-29
5
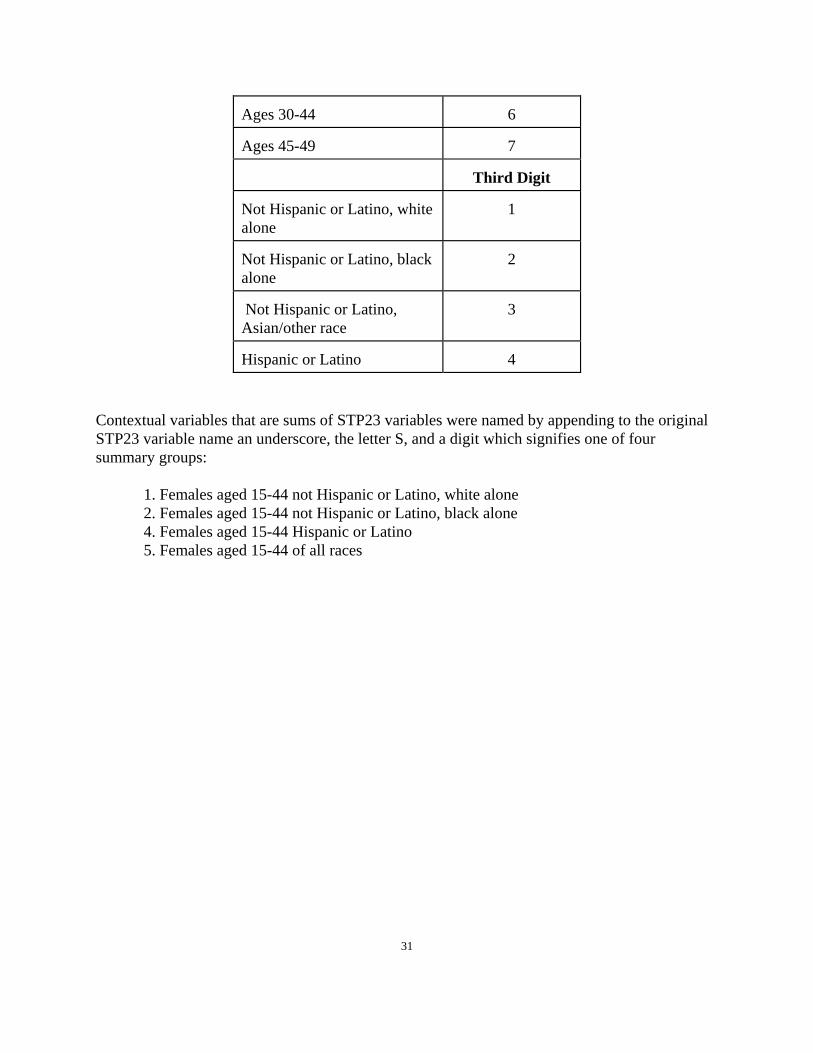
31
Ages 30-44
6
Ages 45-49
7
Third Digit
Not Hispanic or Latino, white alone
1
Not Hispanic or Latino, black alone
2
Not Hispanic or Latino, Asian/other race
3
Hispanic or Latino
4
Contextual variables that are sums of STP23 variables were named by appending to the original STP23 variable name an underscore, the letter S, and a digit which signifies one of four summary groups:
1. Females aged 15-44 not Hispanic or Latino, white alone 2. Females aged 15-44 not Hispanic or Latino, black alone 4. Females aged 15-44 Hispanic or Latino 5. Females aged 15-44 of all races
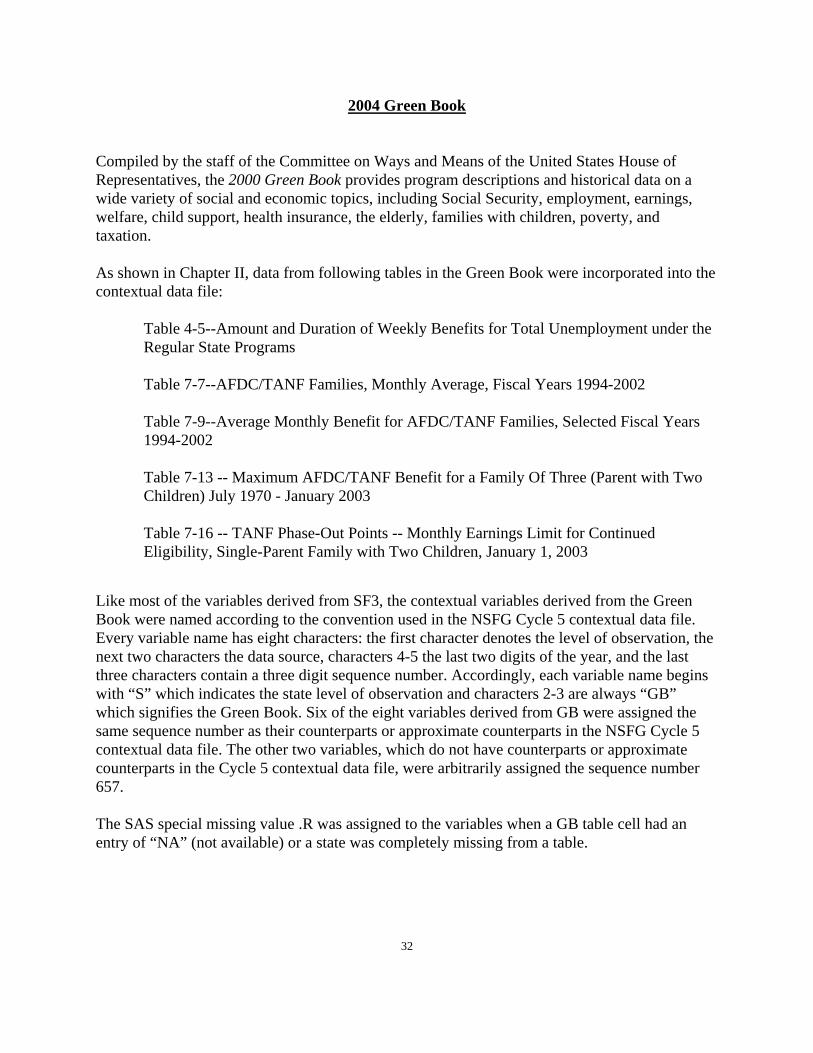
32
2004 Green Book Compiled by the staff of the Committee on Ways and Means of the United States House of Representatives, the 2000 Green Book provides program descriptions and historical data on a wide variety of social and economic topics, including Social Security, employment, earnings, welfare, child support, health insurance, the elderly, families with children, poverty, and taxation. As shown in Chapter II, data from following tables in the Green Book were incorporated into the contextual data file:
Table 4-5--Amount and Duration of Weekly Benefits for Total Unemployment under the Regular State Programs Table 7-7--AFDC/TANF Families, Monthly Average, Fiscal Years 1994-2002 Table 7-9--Average Monthly Benefit for AFDC/TANF Families, Selected Fiscal Years 1994-2002 Table 7-13 -- Maximum AFDC/TANF Benefit for a Family Of Three (Parent with Two Children) July 1970 - January 2003 Table 7-16 -- TANF Phase-Out Points -- Monthly Earnings Limit for Continued Eligibility, Single-Parent Family with Two Children, January 1, 2003
Like most of the variables derived from SF3, the contextual variables derived from the Green Book were named according to the convention used in the NSFG Cycle 5 contextual data file. Every variable name has eight characters: the first character denotes the level of observation, the next two characters the data source, characters 4-5 the last two digits of the year, and the last three characters contain a three digit sequence number. Accordingly, each variable name begins with “S” which indicates the state level of observation and characters 2-3 are always “GB” which signifies the Green Book. Six of the eight variables derived from GB were assigned the same sequence number as their counterparts or approximate counterparts in the NSFG Cycle 5 contextual data file. The other two variables, which do not have counterparts or approximate counterparts in the Cycle 5 contextual data file, were arbitrarily assigned the sequence number 657. The SAS special missing value .R was assigned to the variables when a GB table cell had an entry of “NA” (not available) or a state was completely missing from a table.
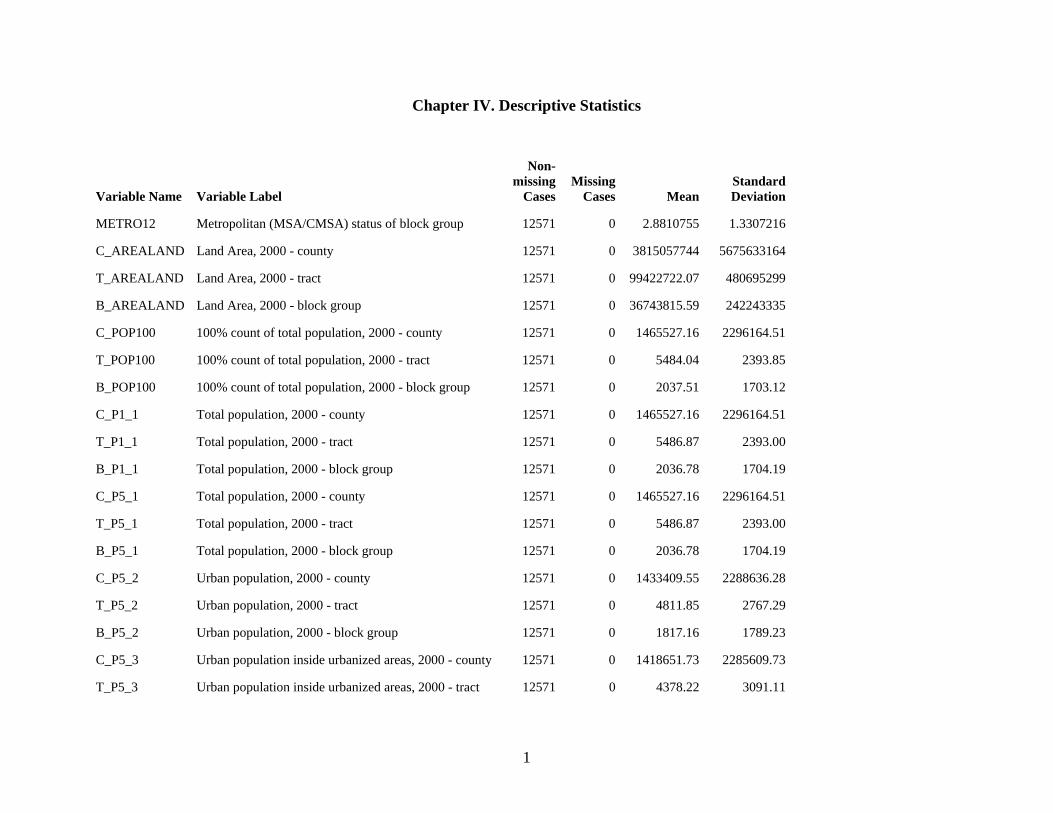
1
Chapter IV. Descriptive Statistics
Variable Name Variable Label
Non-missing
CasesMissing
Cases MeanStandard Deviation
METRO12 Metropolitan (MSA/CMSA) status of block group 12571 0 2.8810755 1.3307216
C_AREALAND Land Area, 2000 - county 12571 0 3815057744 5675633164
T_AREALAND Land Area, 2000 - tract 12571 0 99422722.07 480695299
B_AREALAND Land Area, 2000 - block group 12571 0 36743815.59 242243335
C_POP100 100% count of total population, 2000 - county 12571 0 1465527.16 2296164.51
T_POP100 100% count of total population, 2000 - tract 12571 0 5484.04 2393.85
B_POP100 100% count of total population, 2000 - block group 12571 0 2037.51 1703.12
C_P1_1 Total population, 2000 - county 12571 0 1465527.16 2296164.51
T_P1_1 Total population, 2000 - tract 12571 0 5486.87 2393.00
B_P1_1 Total population, 2000 - block group 12571 0 2036.78 1704.19
C_P5_1 Total population, 2000 - county 12571 0 1465527.16 2296164.51
T_P5_1 Total population, 2000 - tract 12571 0 5486.87 2393.00
B_P5_1 Total population, 2000 - block group 12571 0 2036.78 1704.19
C_P5_2 Urban population, 2000 - county 12571 0 1433409.55 2288636.28
T_P5_2 Urban population, 2000 - tract 12571 0 4811.85 2767.29
B_P5_2 Urban population, 2000 - block group 12571 0 1817.16 1789.23
C_P5_3 Urban population inside urbanized areas, 2000 - county 12571 0 1418651.73 2285609.73
T_P5_3 Urban population inside urbanized areas, 2000 - tract 12571 0 4378.22 3091.11
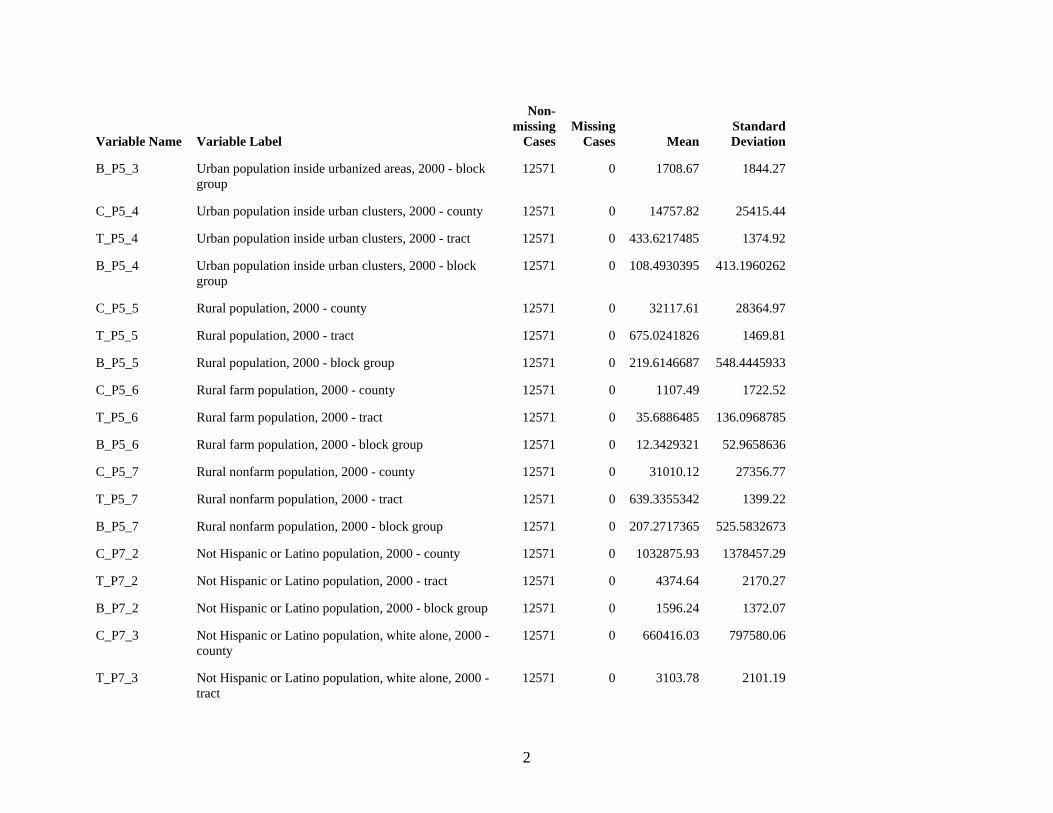
2
Variable Name Variable Label
Non-missing
CasesMissing
Cases MeanStandard Deviation
B_P5_3 Urban population inside urbanized areas, 2000 - block group
12571 0 1708.67 1844.27
C_P5_4 Urban population inside urban clusters, 2000 - county 12571 0 14757.82 25415.44
T_P5_4 Urban population inside urban clusters, 2000 - tract 12571 0 433.6217485 1374.92
B_P5_4 Urban population inside urban clusters, 2000 - block group
12571 0 108.4930395 413.1960262
C_P5_5 Rural population, 2000 - county 12571 0 32117.61 28364.97
T_P5_5 Rural population, 2000 - tract 12571 0 675.0241826 1469.81
B_P5_5 Rural population, 2000 - block group 12571 0 219.6146687 548.4445933
C_P5_6 Rural farm population, 2000 - county 12571 0 1107.49 1722.52
T_P5_6 Rural farm population, 2000 - tract 12571 0 35.6886485 136.0968785
B_P5_6 Rural farm population, 2000 - block group 12571 0 12.3429321 52.9658636
C_P5_7 Rural nonfarm population, 2000 - county 12571 0 31010.12 27356.77
T_P5_7 Rural nonfarm population, 2000 - tract 12571 0 639.3355342 1399.22
B_P5_7 Rural nonfarm population, 2000 - block group 12571 0 207.2717365 525.5832673
C_P7_2 Not Hispanic or Latino population, 2000 - county 12571 0 1032875.93 1378457.29
T_P7_2 Not Hispanic or Latino population, 2000 - tract 12571 0 4374.64 2170.27
B_P7_2 Not Hispanic or Latino population, 2000 - block group 12571 0 1596.24 1372.07
C_P7_3 Not Hispanic or Latino population, white alone, 2000 - county
12571 0 660416.03 797580.06
T_P7_3 Not Hispanic or Latino population, white alone, 2000 - tract
12571 0 3103.78 2101.19
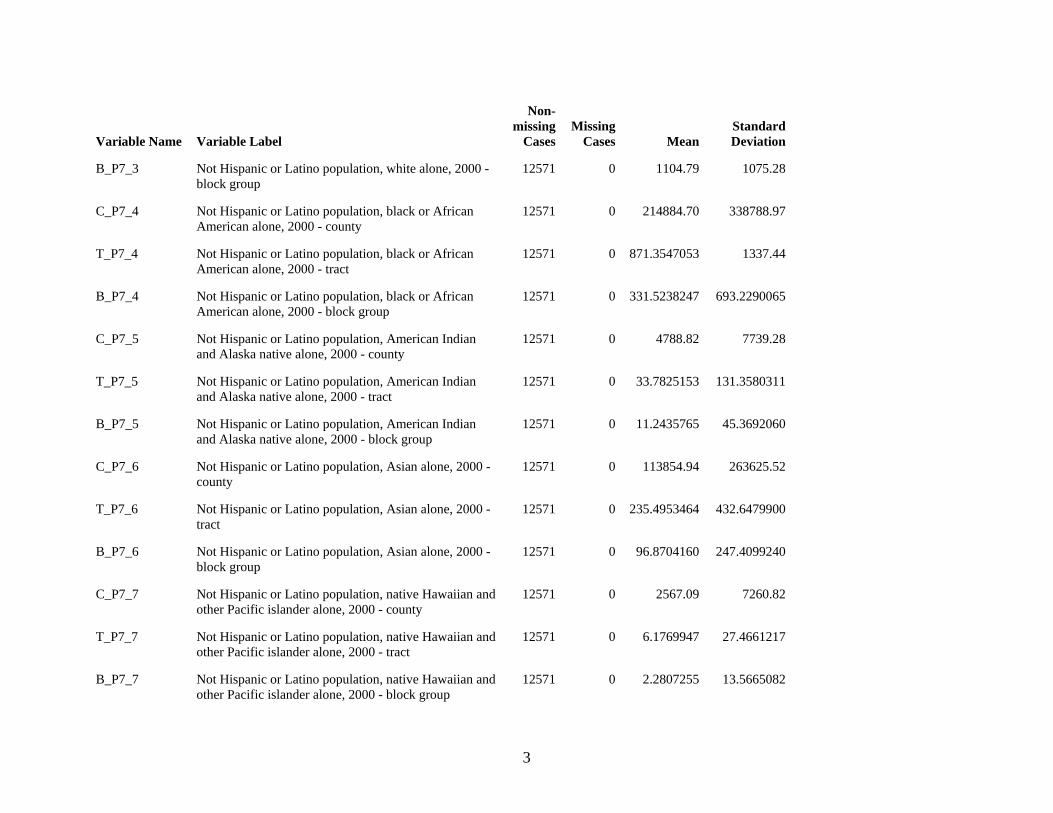
3
Variable Name Variable Label
Non-missing
CasesMissing
Cases MeanStandard Deviation
B_P7_3 Not Hispanic or Latino population, white alone, 2000 - block group
12571 0 1104.79 1075.28
C_P7_4 Not Hispanic or Latino population, black or African American alone, 2000 - county
12571 0 214884.70 338788.97
T_P7_4 Not Hispanic or Latino population, black or African American alone, 2000 - tract
12571 0 871.3547053 1337.44
B_P7_4 Not Hispanic or Latino population, black or African American alone, 2000 - block group
12571 0 331.5238247 693.2290065
C_P7_5 Not Hispanic or Latino population, American Indian and Alaska native alone, 2000 - county
12571 0 4788.82 7739.28
T_P7_5 Not Hispanic or Latino population, American Indian and Alaska native alone, 2000 - tract
12571 0 33.7825153 131.3580311
B_P7_5 Not Hispanic or Latino population, American Indian and Alaska native alone, 2000 - block group
12571 0 11.2435765 45.3692060
C_P7_6 Not Hispanic or Latino population, Asian alone, 2000 - county
12571 0 113854.94 263625.52
T_P7_6 Not Hispanic or Latino population, Asian alone, 2000 - tract
12571 0 235.4953464 432.6479900
B_P7_6 Not Hispanic or Latino population, Asian alone, 2000 - block group
12571 0 96.8704160 247.4099240
C_P7_7 Not Hispanic or Latino population, native Hawaiian and other Pacific islander alone, 2000 - county
12571 0 2567.09 7260.82
T_P7_7 Not Hispanic or Latino population, native Hawaiian and other Pacific islander alone, 2000 - tract
12571 0 6.1769947 27.4661217
B_P7_7 Not Hispanic or Latino population, native Hawaiian and other Pacific islander alone, 2000 - block group
12571 0 2.2807255 13.5665082
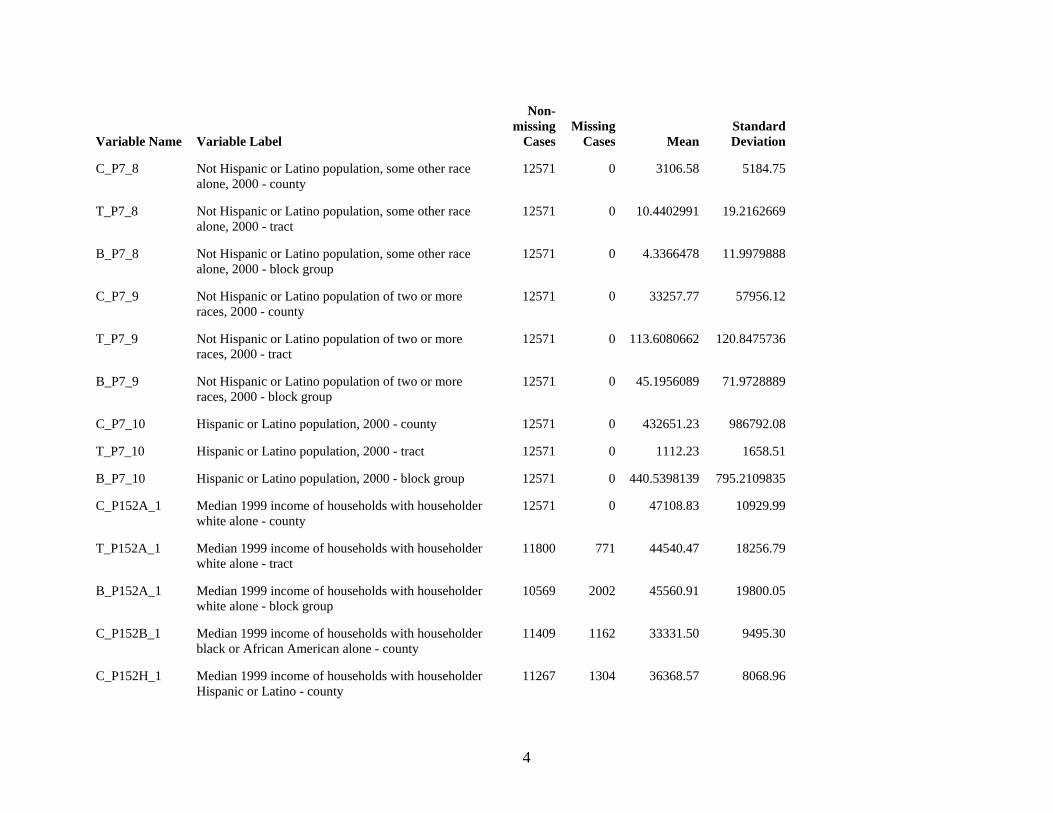
4
Variable Name Variable Label
Non-missing
CasesMissing
Cases MeanStandard Deviation
C_P7_8 Not Hispanic or Latino population, some other race alone, 2000 - county
12571 0 3106.58 5184.75
T_P7_8 Not Hispanic or Latino population, some other race alone, 2000 - tract
12571 0 10.4402991 19.2162669
B_P7_8 Not Hispanic or Latino population, some other race alone, 2000 - block group
12571 0 4.3366478 11.9979888
C_P7_9 Not Hispanic or Latino population of two or more races, 2000 - county
12571 0 33257.77 57956.12
T_P7_9 Not Hispanic or Latino population of two or more races, 2000 - tract
12571 0 113.6080662 120.8475736
B_P7_9 Not Hispanic or Latino population of two or more races, 2000 - block group
12571 0 45.1956089 71.9728889
C_P7_10 Hispanic or Latino population, 2000 - county 12571 0 432651.23 986792.08
T_P7_10 Hispanic or Latino population, 2000 - tract 12571 0 1112.23 1658.51
B_P7_10 Hispanic or Latino population, 2000 - block group 12571 0 440.5398139 795.2109835
C_P152A_1 Median 1999 income of households with householder white alone - county
12571 0 47108.83 10929.99
T_P152A_1 Median 1999 income of households with householder white alone - tract
11800 771 44540.47 18256.79
B_P152A_1 Median 1999 income of households with householder white alone - block group
10569 2002 45560.91 19800.05
C_P152B_1 Median 1999 income of households with householder black or African American alone - county
11409 1162 33331.50 9495.30
C_P152H_1 Median 1999 income of households with householder Hispanic or Latino - county
11267 1304 36368.57 8068.96
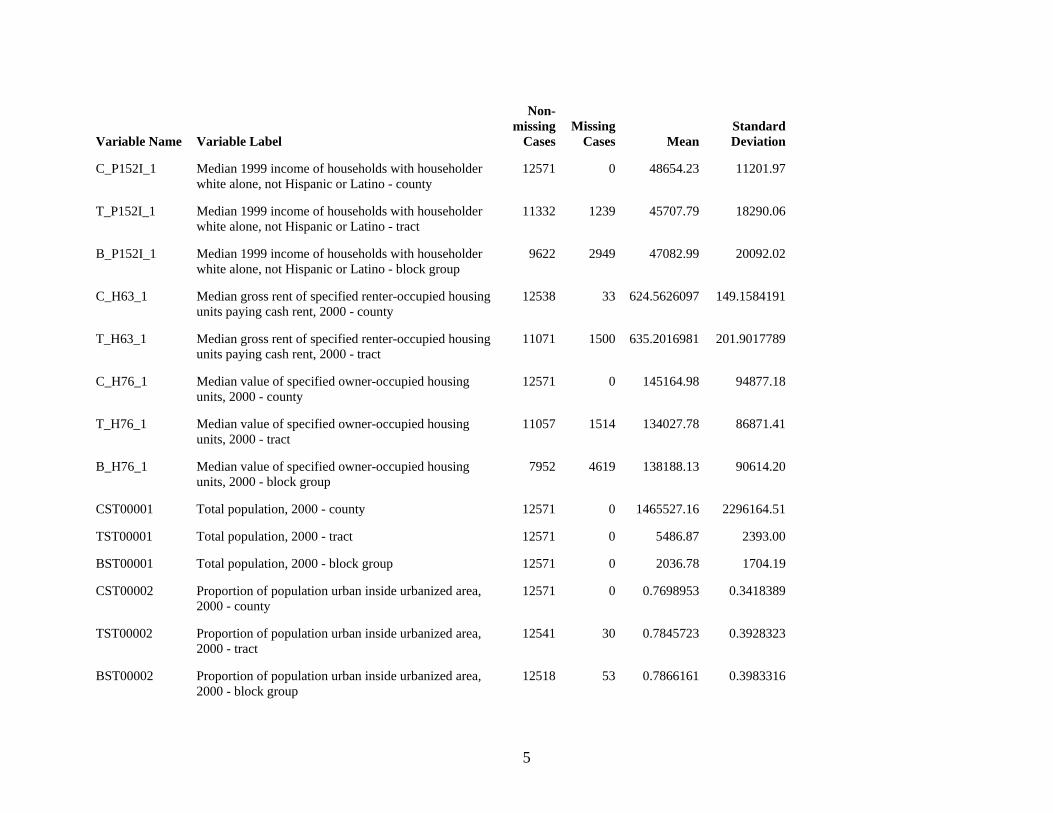
5
Variable Name Variable Label
Non-missing
CasesMissing
Cases MeanStandard Deviation
C_P152I_1 Median 1999 income of households with householder white alone, not Hispanic or Latino - county
12571 0 48654.23 11201.97
T_P152I_1 Median 1999 income of households with householder white alone, not Hispanic or Latino - tract
11332 1239 45707.79 18290.06
B_P152I_1 Median 1999 income of households with householder white alone, not Hispanic or Latino - block group
9622 2949 47082.99 20092.02
C_H63_1 Median gross rent of specified renter-occupied housing units paying cash rent, 2000 - county
12538 33 624.5626097 149.1584191
T_H63_1 Median gross rent of specified renter-occupied housing units paying cash rent, 2000 - tract
11071 1500 635.2016981 201.9017789
C_H76_1 Median value of specified owner-occupied housing units, 2000 - county
12571 0 145164.98 94877.18
T_H76_1 Median value of specified owner-occupied housing units, 2000 - tract
11057 1514 134027.78 86871.41
B_H76_1 Median value of specified owner-occupied housing units, 2000 - block group
7952 4619 138188.13 90614.20
CST00001 Total population, 2000 - county 12571 0 1465527.16 2296164.51
TST00001 Total population, 2000 - tract 12571 0 5486.87 2393.00
BST00001 Total population, 2000 - block group 12571 0 2036.78 1704.19
CST00002 Proportion of population urban inside urbanized area, 2000 - county
12571 0 0.7698953 0.3418389
TST00002 Proportion of population urban inside urbanized area, 2000 - tract
12541 30 0.7845723 0.3928323
BST00002 Proportion of population urban inside urbanized area, 2000 - block group
12518 53 0.7866161 0.3983316
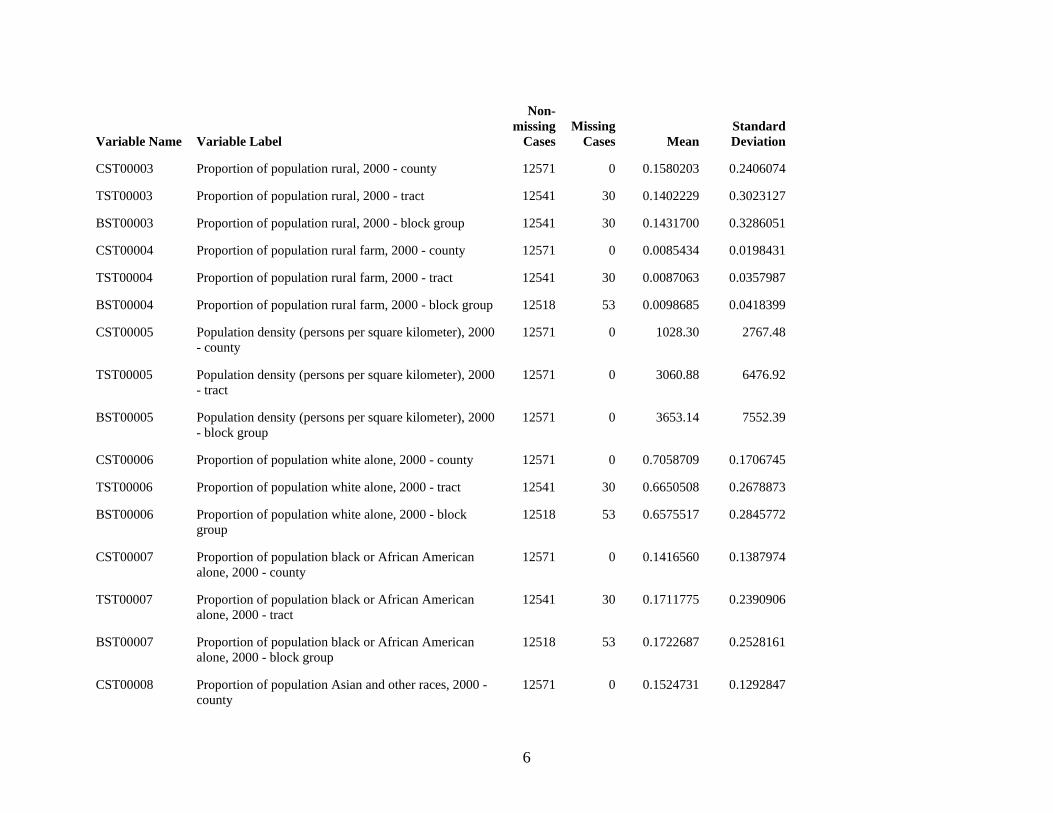
6
Variable Name Variable Label
Non-missing
CasesMissing
Cases MeanStandard Deviation
CST00003 Proportion of population rural, 2000 - county 12571 0 0.1580203 0.2406074
TST00003 Proportion of population rural, 2000 - tract 12541 30 0.1402229 0.3023127
BST00003 Proportion of population rural, 2000 - block group 12541 30 0.1431700 0.3286051
CST00004 Proportion of population rural farm, 2000 - county 12571 0 0.0085434 0.0198431
TST00004 Proportion of population rural farm, 2000 - tract 12541 30 0.0087063 0.0357987
BST00004 Proportion of population rural farm, 2000 - block group 12518 53 0.0098685 0.0418399
CST00005 Population density (persons per square kilometer), 2000 - county
12571 0 1028.30 2767.48
TST00005 Population density (persons per square kilometer), 2000 - tract
12571 0 3060.88 6476.92
BST00005 Population density (persons per square kilometer), 2000 - block group
12571 0 3653.14 7552.39
CST00006 Proportion of population white alone, 2000 - county 12571 0 0.7058709 0.1706745
TST00006 Proportion of population white alone, 2000 - tract 12541 30 0.6650508 0.2678873
BST00006 Proportion of population white alone, 2000 - block group
12518 53 0.6575517 0.2845772
CST00007 Proportion of population black or African American alone, 2000 - county
12571 0 0.1416560 0.1387974
TST00007 Proportion of population black or African American alone, 2000 - tract
12541 30 0.1711775 0.2390906
BST00007 Proportion of population black or African American alone, 2000 - block group
12518 53 0.1722687 0.2528161
CST00008 Proportion of population Asian and other races, 2000 - county
12571 0 0.1524731 0.1292847
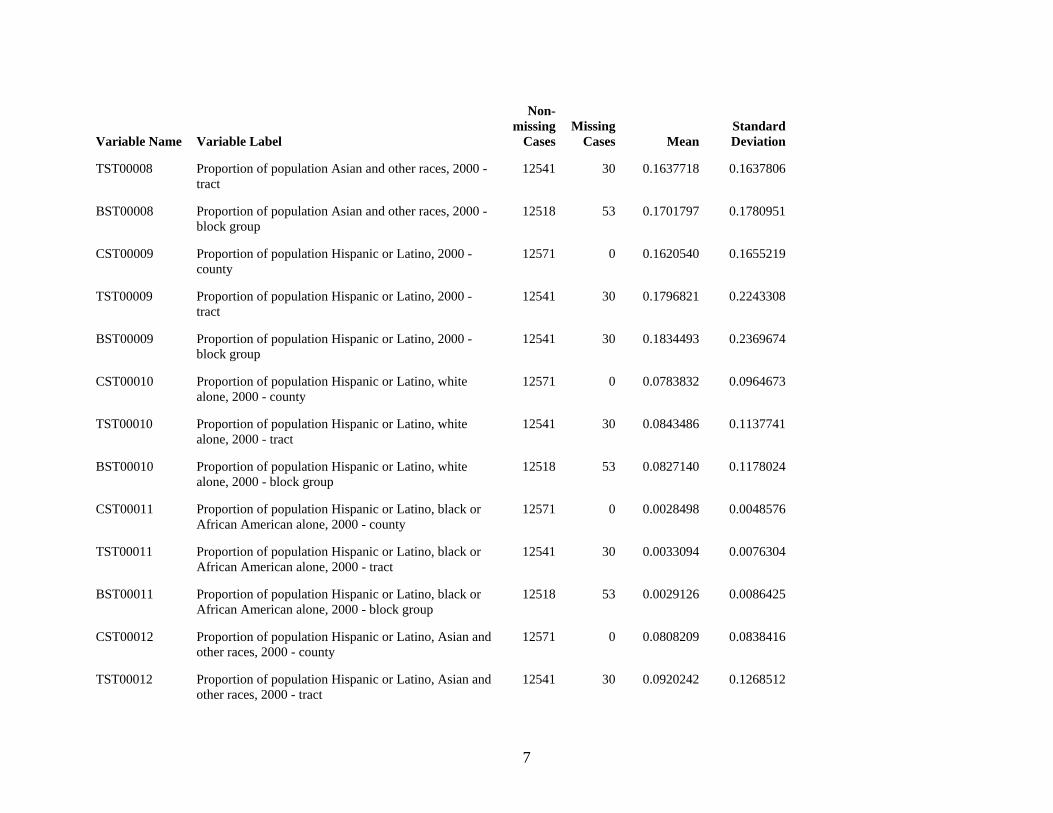
7
Variable Name Variable Label
Non-missing
CasesMissing
Cases MeanStandard Deviation
TST00008 Proportion of population Asian and other races, 2000 - tract
12541 30 0.1637718 0.1637806
BST00008 Proportion of population Asian and other races, 2000 - block group
12518 53 0.1701797 0.1780951
CST00009 Proportion of population Hispanic or Latino, 2000 - county
12571 0 0.1620540 0.1655219
TST00009 Proportion of population Hispanic or Latino, 2000 - tract
12541 30 0.1796821 0.2243308
BST00009 Proportion of population Hispanic or Latino, 2000 - block group
12541 30 0.1834493 0.2369674
CST00010 Proportion of population Hispanic or Latino, white alone, 2000 - county
12571 0 0.0783832 0.0964673
TST00010 Proportion of population Hispanic or Latino, white alone, 2000 - tract
12541 30 0.0843486 0.1137741
BST00010 Proportion of population Hispanic or Latino, white alone, 2000 - block group
12518 53 0.0827140 0.1178024
CST00011 Proportion of population Hispanic or Latino, black or African American alone, 2000 - county
12571 0 0.0028498 0.0048576
TST00011 Proportion of population Hispanic or Latino, black or African American alone, 2000 - tract
12541 30 0.0033094 0.0076304
BST00011 Proportion of population Hispanic or Latino, black or African American alone, 2000 - block group
12518 53 0.0029126 0.0086425
CST00012 Proportion of population Hispanic or Latino, Asian and other races, 2000 - county
12571 0 0.0808209 0.0838416
TST00012 Proportion of population Hispanic or Latino, Asian and other races, 2000 - tract
12541 30 0.0920242 0.1268512
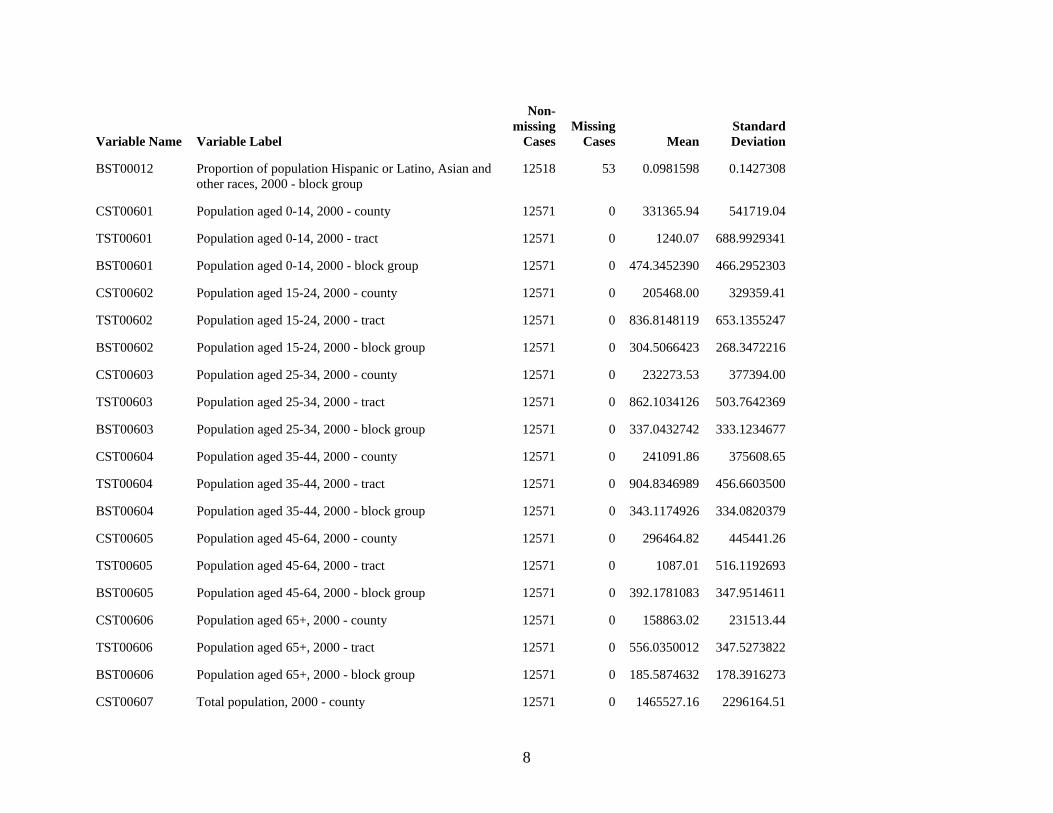
8
Variable Name Variable Label
Non-missing
CasesMissing
Cases MeanStandard Deviation
BST00012 Proportion of population Hispanic or Latino, Asian and other races, 2000 - block group
12518 53 0.0981598 0.1427308
CST00601 Population aged 0-14, 2000 - county 12571 0 331365.94 541719.04
TST00601 Population aged 0-14, 2000 - tract 12571 0 1240.07 688.9929341
BST00601 Population aged 0-14, 2000 - block group 12571 0 474.3452390 466.2952303
CST00602 Population aged 15-24, 2000 - county 12571 0 205468.00 329359.41
TST00602 Population aged 15-24, 2000 - tract 12571 0 836.8148119 653.1355247
BST00602 Population aged 15-24, 2000 - block group 12571 0 304.5066423 268.3472216
CST00603 Population aged 25-34, 2000 - county 12571 0 232273.53 377394.00
TST00603 Population aged 25-34, 2000 - tract 12571 0 862.1034126 503.7642369
BST00603 Population aged 25-34, 2000 - block group 12571 0 337.0432742 333.1234677
CST00604 Population aged 35-44, 2000 - county 12571 0 241091.86 375608.65
TST00604 Population aged 35-44, 2000 - tract 12571 0 904.8346989 456.6603500
BST00604 Population aged 35-44, 2000 - block group 12571 0 343.1174926 334.0820379
CST00605 Population aged 45-64, 2000 - county 12571 0 296464.82 445441.26
TST00605 Population aged 45-64, 2000 - tract 12571 0 1087.01 516.1192693
BST00605 Population aged 45-64, 2000 - block group 12571 0 392.1781083 347.9514611
CST00606 Population aged 65+, 2000 - county 12571 0 158863.02 231513.44
TST00606 Population aged 65+, 2000 - tract 12571 0 556.0350012 347.5273822
BST00606 Population aged 65+, 2000 - block group 12571 0 185.5874632 178.3916273
CST00607 Total population, 2000 - county 12571 0 1465527.16 2296164.51
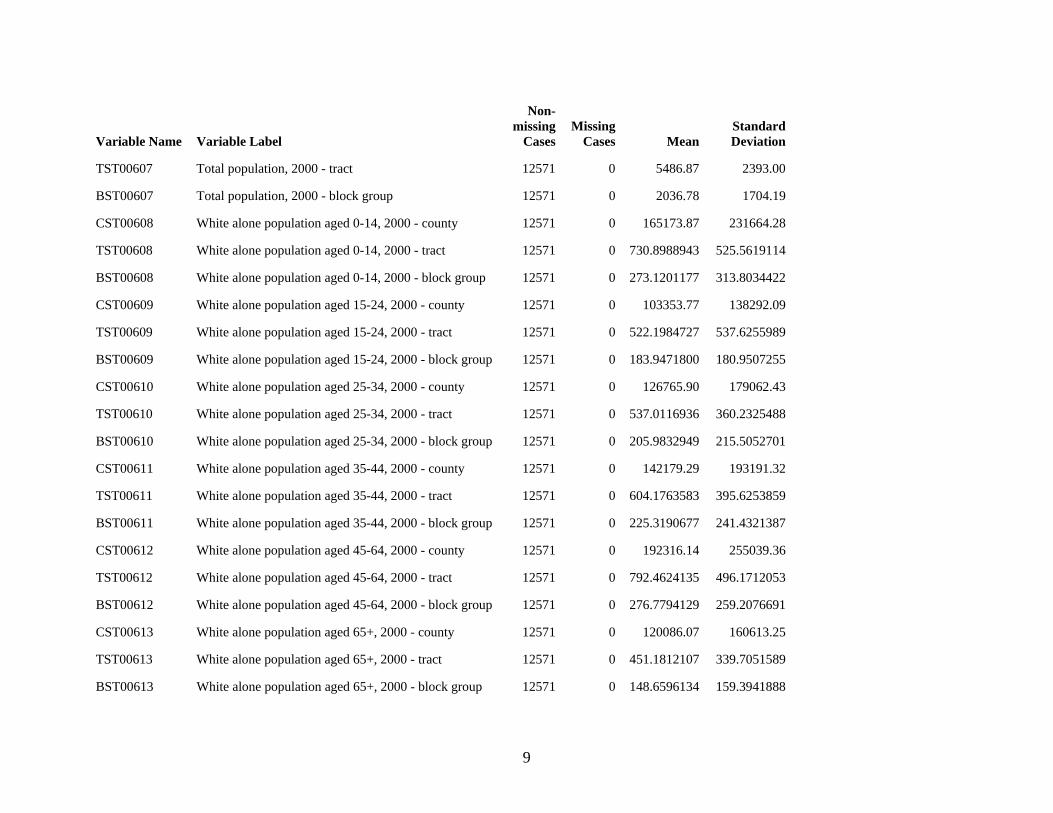
9
Variable Name Variable Label
Non-missing
CasesMissing
Cases MeanStandard Deviation
TST00607 Total population, 2000 - tract 12571 0 5486.87 2393.00
BST00607 Total population, 2000 - block group 12571 0 2036.78 1704.19
CST00608 White alone population aged 0-14, 2000 - county 12571 0 165173.87 231664.28
TST00608 White alone population aged 0-14, 2000 - tract 12571 0 730.8988943 525.5619114
BST00608 White alone population aged 0-14, 2000 - block group 12571 0 273.1201177 313.8034422
CST00609 White alone population aged 15-24, 2000 - county 12571 0 103353.77 138292.09
TST00609 White alone population aged 15-24, 2000 - tract 12571 0 522.1984727 537.6255989
BST00609 White alone population aged 15-24, 2000 - block group 12571 0 183.9471800 180.9507255
CST00610 White alone population aged 25-34, 2000 - county 12571 0 126765.90 179062.43
TST00610 White alone population aged 25-34, 2000 - tract 12571 0 537.0116936 360.2325488
BST00610 White alone population aged 25-34, 2000 - block group 12571 0 205.9832949 215.5052701
CST00611 White alone population aged 35-44, 2000 - county 12571 0 142179.29 193191.32
TST00611 White alone population aged 35-44, 2000 - tract 12571 0 604.1763583 395.6253859
BST00611 White alone population aged 35-44, 2000 - block group 12571 0 225.3190677 241.4321387
CST00612 White alone population aged 45-64, 2000 - county 12571 0 192316.14 255039.36
TST00612 White alone population aged 45-64, 2000 - tract 12571 0 792.4624135 496.1712053
BST00612 White alone population aged 45-64, 2000 - block group 12571 0 276.7794129 259.2076691
CST00613 White alone population aged 65+, 2000 - county 12571 0 120086.07 160613.25
TST00613 White alone population aged 65+, 2000 - tract 12571 0 451.1812107 339.7051589
BST00613 White alone population aged 65+, 2000 - block group 12571 0 148.6596134 159.3941888
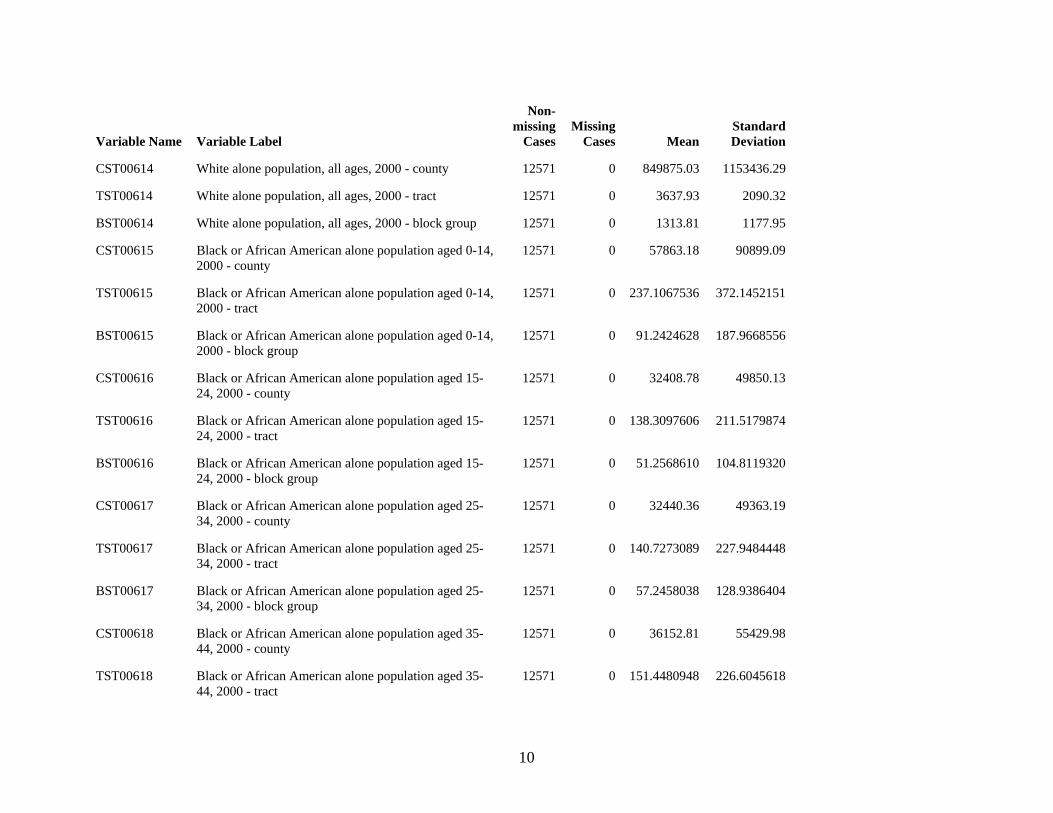
10
Variable Name Variable Label
Non-missing
CasesMissing
Cases MeanStandard Deviation
CST00614 White alone population, all ages, 2000 - county 12571 0 849875.03 1153436.29
TST00614 White alone population, all ages, 2000 - tract 12571 0 3637.93 2090.32
BST00614 White alone population, all ages, 2000 - block group 12571 0 1313.81 1177.95
CST00615 Black or African American alone population aged 0-14, 2000 - county
12571 0 57863.18 90899.09
TST00615 Black or African American alone population aged 0-14, 2000 - tract
12571 0 237.1067536 372.1452151
BST00615 Black or African American alone population aged 0-14, 2000 - block group
12571 0 91.2424628 187.9668556
CST00616 Black or African American alone population aged 15-24, 2000 - county
12571 0 32408.78 49850.13
TST00616 Black or African American alone population aged 15-24, 2000 - tract
12571 0 138.3097606 211.5179874
BST00616 Black or African American alone population aged 15-24, 2000 - block group
12571 0 51.2568610 104.8119320
CST00617 Black or African American alone population aged 25-34, 2000 - county
12571 0 32440.36 49363.19
TST00617 Black or African American alone population aged 25-34, 2000 - tract
12571 0 140.7273089 227.9484448
BST00617 Black or African American alone population aged 25-34, 2000 - block group
12571 0 57.2458038 128.9386404
CST00618 Black or African American alone population aged 35-44, 2000 - county
12571 0 36152.81 55429.98
TST00618 Black or African American alone population aged 35-44, 2000 - tract
12571 0 151.4480948 226.6045618
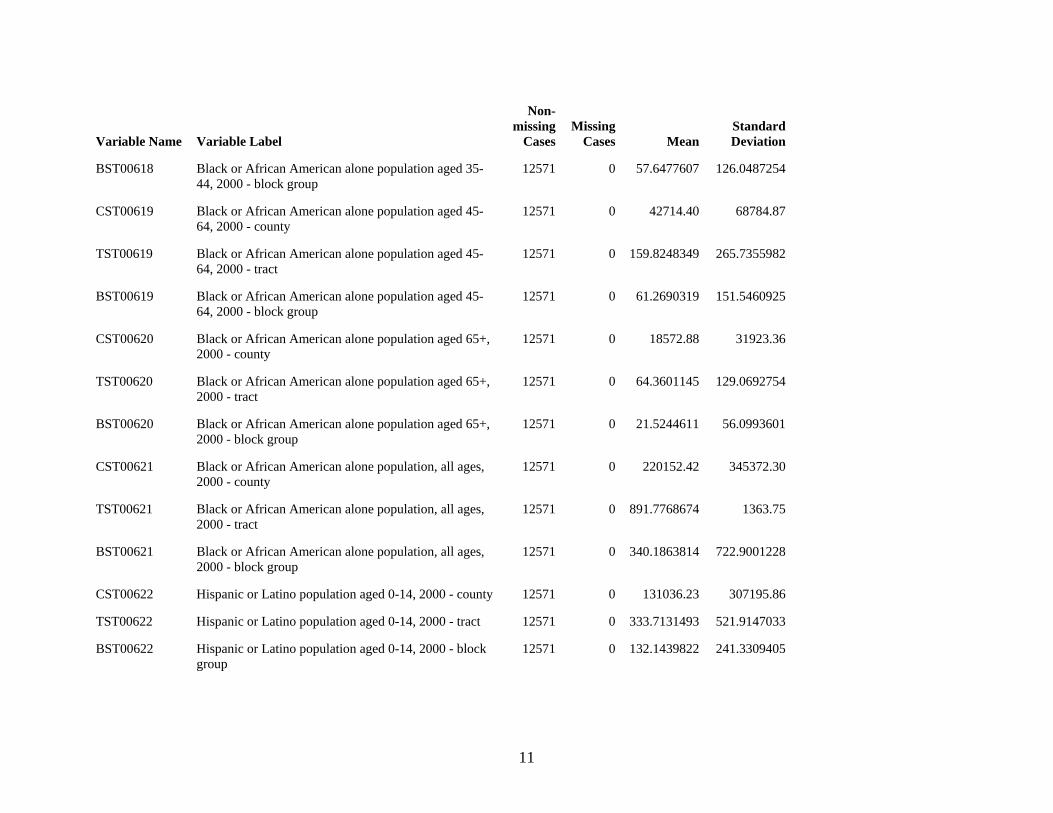
11
Variable Name Variable Label
Non-missing
CasesMissing
Cases MeanStandard Deviation
BST00618 Black or African American alone population aged 35-44, 2000 - block group
12571 0 57.6477607 126.0487254
CST00619 Black or African American alone population aged 45-64, 2000 - county
12571 0 42714.40 68784.87
TST00619 Black or African American alone population aged 45-64, 2000 - tract
12571 0 159.8248349 265.7355982
BST00619 Black or African American alone population aged 45-64, 2000 - block group
12571 0 61.2690319 151.5460925
CST00620 Black or African American alone population aged 65+, 2000 - county
12571 0 18572.88 31923.36
TST00620 Black or African American alone population aged 65+, 2000 - tract
12571 0 64.3601145 129.0692754
BST00620 Black or African American alone population aged 65+, 2000 - block group
12571 0 21.5244611 56.0993601
CST00621 Black or African American alone population, all ages, 2000 - county
12571 0 220152.42 345372.30
TST00621 Black or African American alone population, all ages, 2000 - tract
12571 0 891.7768674 1363.75
BST00621 Black or African American alone population, all ages, 2000 - block group
12571 0 340.1863814 722.9001228
CST00622 Hispanic or Latino population aged 0-14, 2000 - county 12571 0 131036.23 307195.86
TST00622 Hispanic or Latino population aged 0-14, 2000 - tract 12571 0 333.7131493 521.9147033
BST00622 Hispanic or Latino population aged 0-14, 2000 - block group
12571 0 132.1439822 241.3309405
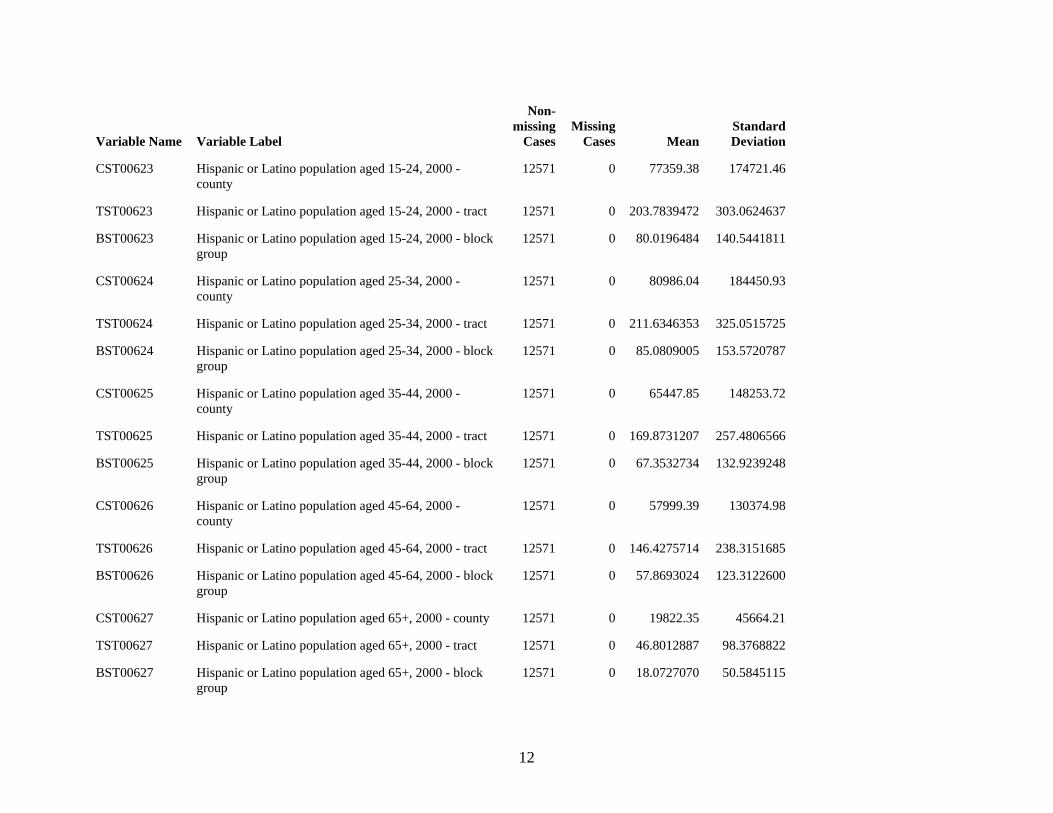
12
Variable Name Variable Label
Non-missing
CasesMissing
Cases MeanStandard Deviation
CST00623 Hispanic or Latino population aged 15-24, 2000 - county
12571 0 77359.38 174721.46
TST00623 Hispanic or Latino population aged 15-24, 2000 - tract 12571 0 203.7839472 303.0624637
BST00623 Hispanic or Latino population aged 15-24, 2000 - block group
12571 0 80.0196484 140.5441811
CST00624 Hispanic or Latino population aged 25-34, 2000 - county
12571 0 80986.04 184450.93
TST00624 Hispanic or Latino population aged 25-34, 2000 - tract 12571 0 211.6346353 325.0515725
BST00624 Hispanic or Latino population aged 25-34, 2000 - block group
12571 0 85.0809005 153.5720787
CST00625 Hispanic or Latino population aged 35-44, 2000 - county
12571 0 65447.85 148253.72
TST00625 Hispanic or Latino population aged 35-44, 2000 - tract 12571 0 169.8731207 257.4806566
BST00625 Hispanic or Latino population aged 35-44, 2000 - block group
12571 0 67.3532734 132.9239248
CST00626 Hispanic or Latino population aged 45-64, 2000 - county
12571 0 57999.39 130374.98
TST00626 Hispanic or Latino population aged 45-64, 2000 - tract 12571 0 146.4275714 238.3151685
BST00626 Hispanic or Latino population aged 45-64, 2000 - block group
12571 0 57.8693024 123.3122600
CST00627 Hispanic or Latino population aged 65+, 2000 - county 12571 0 19822.35 45664.21
TST00627 Hispanic or Latino population aged 65+, 2000 - tract 12571 0 46.8012887 98.3768822
BST00627 Hispanic or Latino population aged 65+, 2000 - block group
12571 0 18.0727070 50.5845115
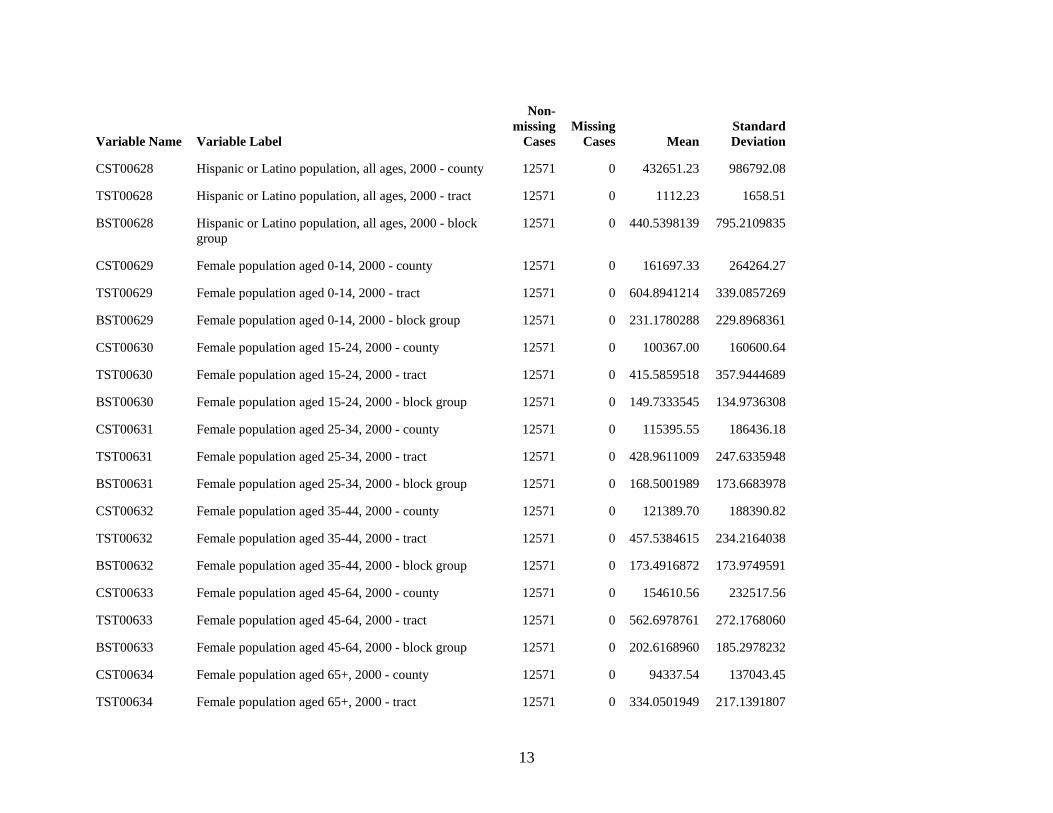
13
Variable Name Variable Label
Non-missing
CasesMissing
Cases MeanStandard Deviation
CST00628 Hispanic or Latino population, all ages, 2000 - county 12571 0 432651.23 986792.08
TST00628 Hispanic or Latino population, all ages, 2000 - tract 12571 0 1112.23 1658.51
BST00628 Hispanic or Latino population, all ages, 2000 - block group
12571 0 440.5398139 795.2109835
CST00629 Female population aged 0-14, 2000 - county 12571 0 161697.33 264264.27
TST00629 Female population aged 0-14, 2000 - tract 12571 0 604.8941214 339.0857269
BST00629 Female population aged 0-14, 2000 - block group 12571 0 231.1780288 229.8968361
CST00630 Female population aged 15-24, 2000 - county 12571 0 100367.00 160600.64
TST00630 Female population aged 15-24, 2000 - tract 12571 0 415.5859518 357.9444689
BST00630 Female population aged 15-24, 2000 - block group 12571 0 149.7333545 134.9736308
CST00631 Female population aged 25-34, 2000 - county 12571 0 115395.55 186436.18
TST00631 Female population aged 25-34, 2000 - tract 12571 0 428.9611009 247.6335948
BST00631 Female population aged 25-34, 2000 - block group 12571 0 168.5001989 173.6683978
CST00632 Female population aged 35-44, 2000 - county 12571 0 121389.70 188390.82
TST00632 Female population aged 35-44, 2000 - tract 12571 0 457.5384615 234.2164038
BST00632 Female population aged 35-44, 2000 - block group 12571 0 173.4916872 173.9749591
CST00633 Female population aged 45-64, 2000 - county 12571 0 154610.56 232517.56
TST00633 Female population aged 45-64, 2000 - tract 12571 0 562.6978761 272.1768060
BST00633 Female population aged 45-64, 2000 - block group 12571 0 202.6168960 185.2978232
CST00634 Female population aged 65+, 2000 - county 12571 0 94337.54 137043.45
TST00634 Female population aged 65+, 2000 - tract 12571 0 334.0501949 217.1391807
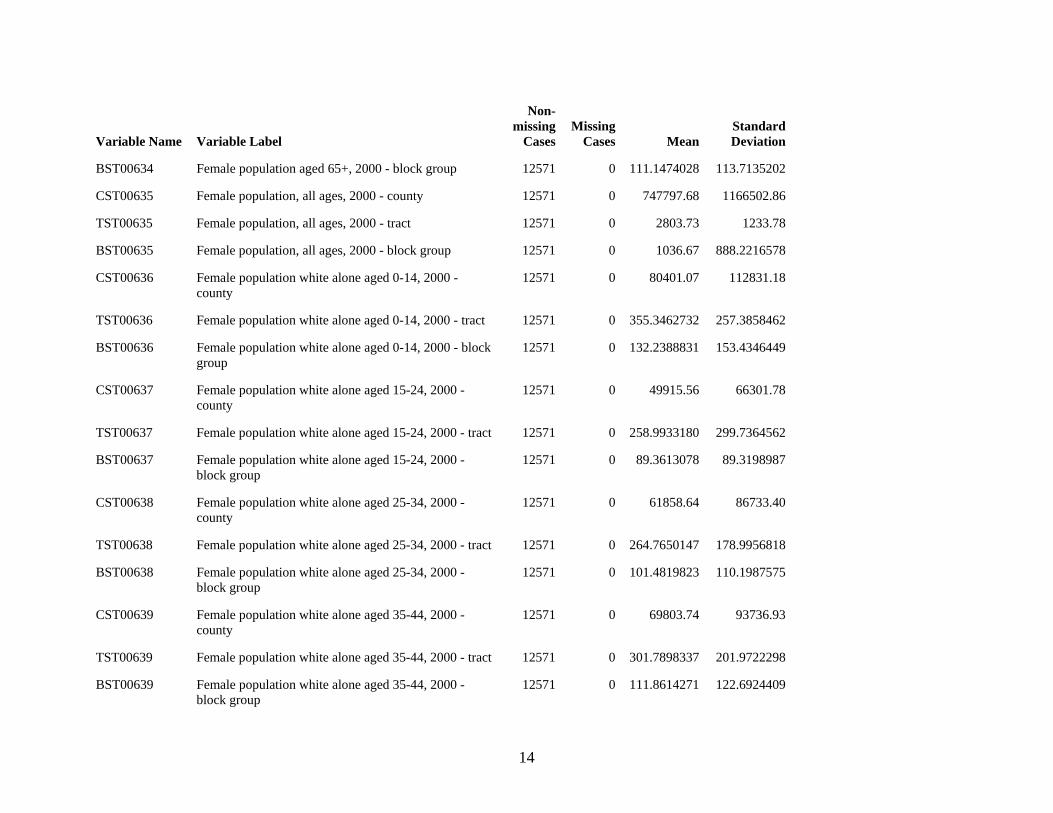
14
Variable Name Variable Label
Non-missing
CasesMissing
Cases MeanStandard Deviation
BST00634 Female population aged 65+, 2000 - block group 12571 0 111.1474028 113.7135202
CST00635 Female population, all ages, 2000 - county 12571 0 747797.68 1166502.86
TST00635 Female population, all ages, 2000 - tract 12571 0 2803.73 1233.78
BST00635 Female population, all ages, 2000 - block group 12571 0 1036.67 888.2216578
CST00636 Female population white alone aged 0-14, 2000 - county
12571 0 80401.07 112831.18
TST00636 Female population white alone aged 0-14, 2000 - tract 12571 0 355.3462732 257.3858462
BST00636 Female population white alone aged 0-14, 2000 - block group
12571 0 132.2388831 153.4346449
CST00637 Female population white alone aged 15-24, 2000 - county
12571 0 49915.56 66301.78
TST00637 Female population white alone aged 15-24, 2000 - tract 12571 0 258.9933180 299.7364562
BST00637 Female population white alone aged 15-24, 2000 - block group
12571 0 89.3613078 89.3198987
CST00638 Female population white alone aged 25-34, 2000 - county
12571 0 61858.64 86733.40
TST00638 Female population white alone aged 25-34, 2000 - tract 12571 0 264.7650147 178.9956818
BST00638 Female population white alone aged 25-34, 2000 - block group
12571 0 101.4819823 110.1987575
CST00639 Female population white alone aged 35-44, 2000 - county
12571 0 69803.74 93736.93
TST00639 Female population white alone aged 35-44, 2000 - tract 12571 0 301.7898337 201.9722298
BST00639 Female population white alone aged 35-44, 2000 - block group
12571 0 111.8614271 122.6924409
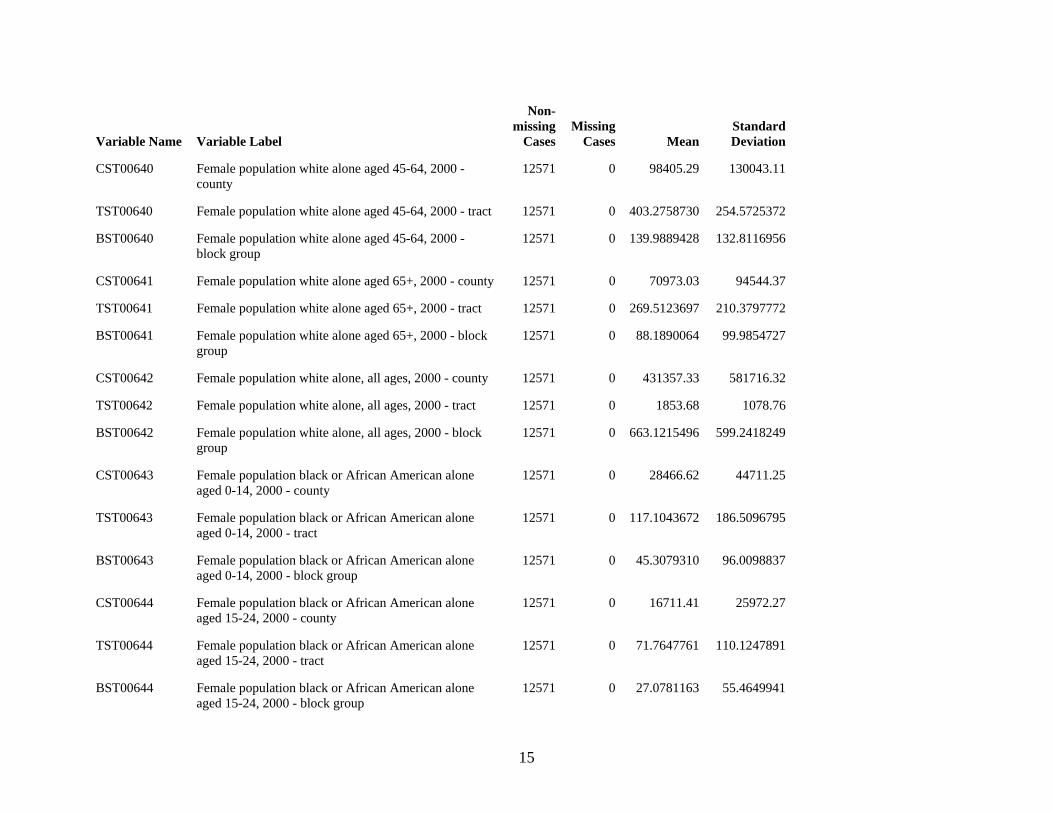
15
Variable Name Variable Label
Non-missing
CasesMissing
Cases MeanStandard Deviation
CST00640 Female population white alone aged 45-64, 2000 - county
12571 0 98405.29 130043.11
TST00640 Female population white alone aged 45-64, 2000 - tract 12571 0 403.2758730 254.5725372
BST00640 Female population white alone aged 45-64, 2000 - block group
12571 0 139.9889428 132.8116956
CST00641 Female population white alone aged 65+, 2000 - county 12571 0 70973.03 94544.37
TST00641 Female population white alone aged 65+, 2000 - tract 12571 0 269.5123697 210.3797772
BST00641 Female population white alone aged 65+, 2000 - block group
12571 0 88.1890064 99.9854727
CST00642 Female population white alone, all ages, 2000 - county 12571 0 431357.33 581716.32
TST00642 Female population white alone, all ages, 2000 - tract 12571 0 1853.68 1078.76
BST00642 Female population white alone, all ages, 2000 - block group
12571 0 663.1215496 599.2418249
CST00643 Female population black or African American alone aged 0-14, 2000 - county
12571 0 28466.62 44711.25
TST00643 Female population black or African American alone aged 0-14, 2000 - tract
12571 0 117.1043672 186.5096795
BST00643 Female population black or African American alone aged 0-14, 2000 - block group
12571 0 45.3079310 96.0098837
CST00644 Female population black or African American alone aged 15-24, 2000 - county
12571 0 16711.41 25972.27
TST00644 Female population black or African American alone aged 15-24, 2000 - tract
12571 0 71.7647761 110.1247891
BST00644 Female population black or African American alone aged 15-24, 2000 - block group
12571 0 27.0781163 55.4649941
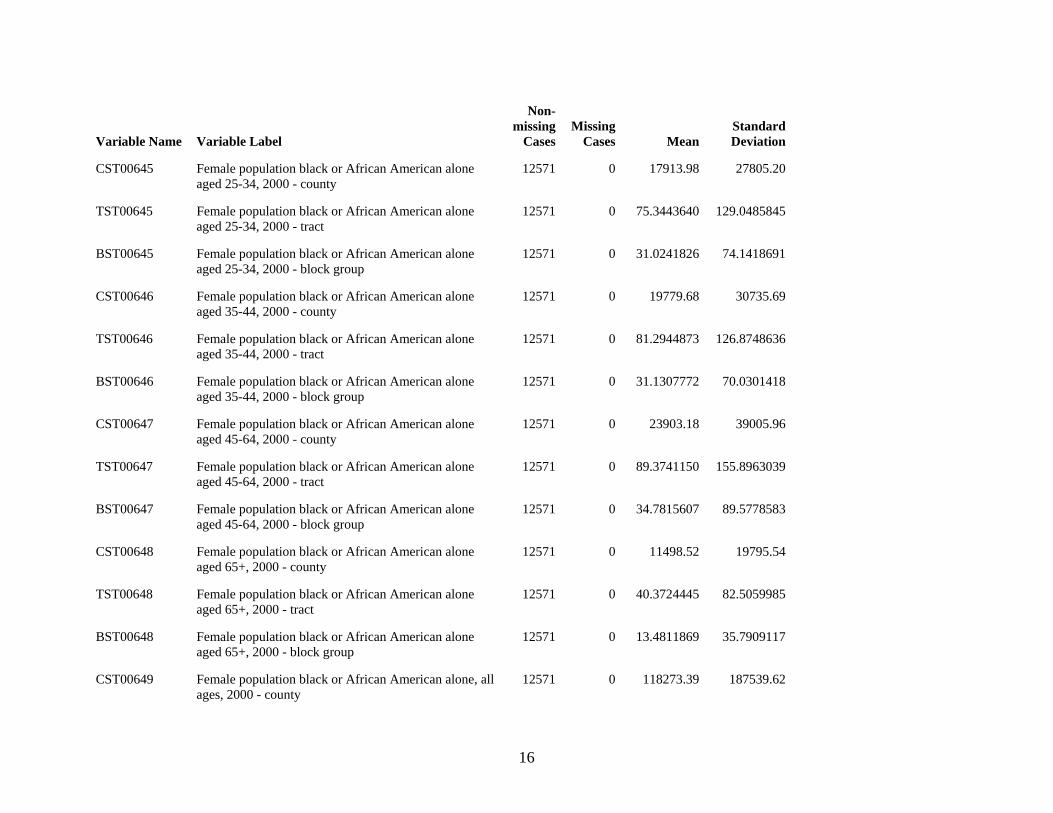
16
Variable Name Variable Label
Non-missing
CasesMissing
Cases MeanStandard Deviation
CST00645 Female population black or African American alone aged 25-34, 2000 - county
12571 0 17913.98 27805.20
TST00645 Female population black or African American alone aged 25-34, 2000 - tract
12571 0 75.3443640 129.0485845
BST00645 Female population black or African American alone aged 25-34, 2000 - block group
12571 0 31.0241826 74.1418691
CST00646 Female population black or African American alone aged 35-44, 2000 - county
12571 0 19779.68 30735.69
TST00646 Female population black or African American alone aged 35-44, 2000 - tract
12571 0 81.2944873 126.8748636
BST00646 Female population black or African American alone aged 35-44, 2000 - block group
12571 0 31.1307772 70.0301418
CST00647 Female population black or African American alone aged 45-64, 2000 - county
12571 0 23903.18 39005.96
TST00647 Female population black or African American alone aged 45-64, 2000 - tract
12571 0 89.3741150 155.8963039
BST00647 Female population black or African American alone aged 45-64, 2000 - block group
12571 0 34.7815607 89.5778583
CST00648 Female population black or African American alone aged 65+, 2000 - county
12571 0 11498.52 19795.54
TST00648 Female population black or African American alone aged 65+, 2000 - tract
12571 0 40.3724445 82.5059985
BST00648 Female population black or African American alone aged 65+, 2000 - block group
12571 0 13.4811869 35.7909117
CST00649 Female population black or African American alone, all ages, 2000 - county
12571 0 118273.39 187539.62
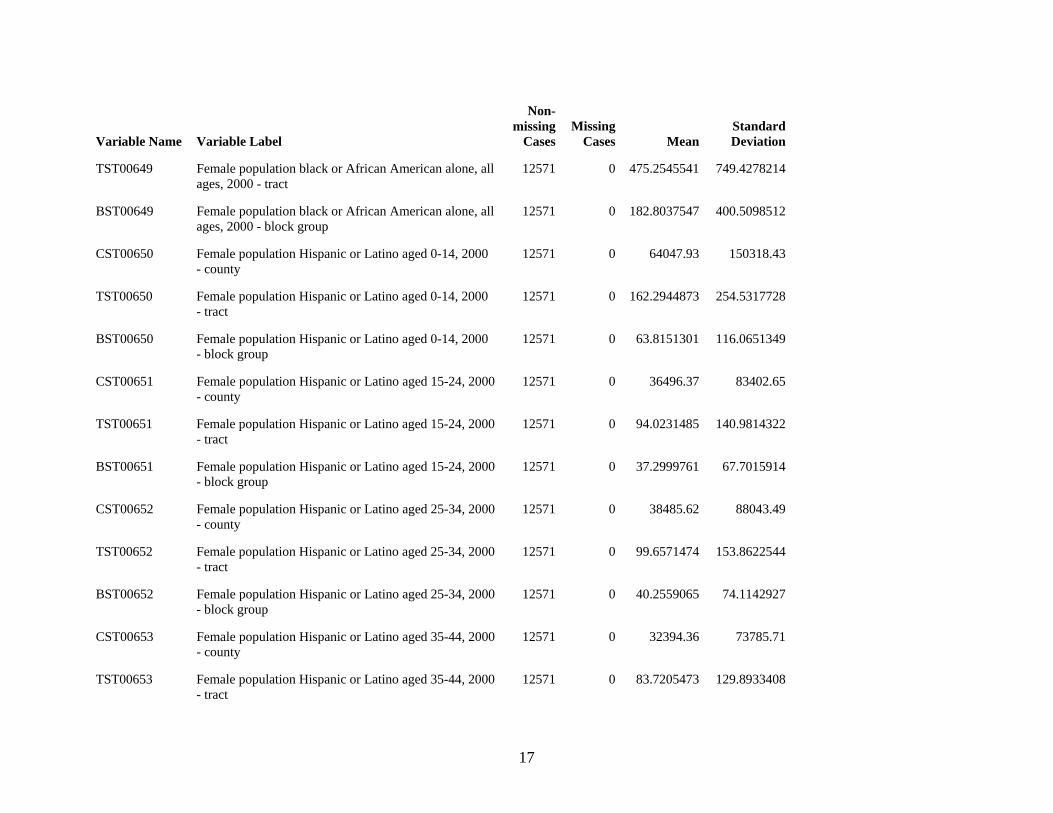
17
Variable Name Variable Label
Non-missing
CasesMissing
Cases MeanStandard Deviation
TST00649 Female population black or African American alone, all ages, 2000 - tract
12571 0 475.2545541 749.4278214
BST00649 Female population black or African American alone, all ages, 2000 - block group
12571 0 182.8037547 400.5098512
CST00650 Female population Hispanic or Latino aged 0-14, 2000 - county
12571 0 64047.93 150318.43
TST00650 Female population Hispanic or Latino aged 0-14, 2000 - tract
12571 0 162.2944873 254.5317728
BST00650 Female population Hispanic or Latino aged 0-14, 2000 - block group
12571 0 63.8151301 116.0651349
CST00651 Female population Hispanic or Latino aged 15-24, 2000 - county
12571 0 36496.37 83402.65
TST00651 Female population Hispanic or Latino aged 15-24, 2000 - tract
12571 0 94.0231485 140.9814322
BST00651 Female population Hispanic or Latino aged 15-24, 2000 - block group
12571 0 37.2999761 67.7015914
CST00652 Female population Hispanic or Latino aged 25-34, 2000 - county
12571 0 38485.62 88043.49
TST00652 Female population Hispanic or Latino aged 25-34, 2000 - tract
12571 0 99.6571474 153.8622544
BST00652 Female population Hispanic or Latino aged 25-34, 2000 - block group
12571 0 40.2559065 74.1142927
CST00653 Female population Hispanic or Latino aged 35-44, 2000 - county
12571 0 32394.36 73785.71
TST00653 Female population Hispanic or Latino aged 35-44, 2000 - tract
12571 0 83.7205473 129.8933408
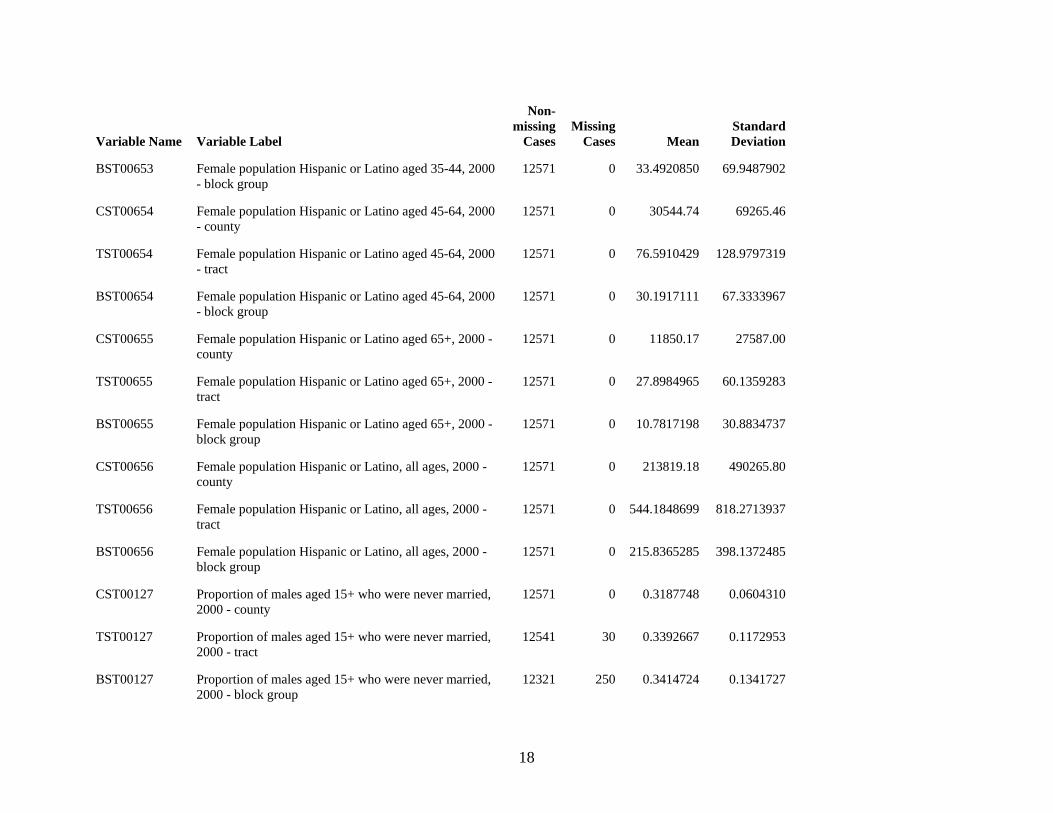
18
Variable Name Variable Label
Non-missing
CasesMissing
Cases MeanStandard Deviation
BST00653 Female population Hispanic or Latino aged 35-44, 2000 - block group
12571 0 33.4920850 69.9487902
CST00654 Female population Hispanic or Latino aged 45-64, 2000 - county
12571 0 30544.74 69265.46
TST00654 Female population Hispanic or Latino aged 45-64, 2000 - tract
12571 0 76.5910429 128.9797319
BST00654 Female population Hispanic or Latino aged 45-64, 2000 - block group
12571 0 30.1917111 67.3333967
CST00655 Female population Hispanic or Latino aged 65+, 2000 - county
12571 0 11850.17 27587.00
TST00655 Female population Hispanic or Latino aged 65+, 2000 - tract
12571 0 27.8984965 60.1359283
BST00655 Female population Hispanic or Latino aged 65+, 2000 - block group
12571 0 10.7817198 30.8834737
CST00656 Female population Hispanic or Latino, all ages, 2000 - county
12571 0 213819.18 490265.80
TST00656 Female population Hispanic or Latino, all ages, 2000 - tract
12571 0 544.1848699 818.2713937
BST00656 Female population Hispanic or Latino, all ages, 2000 - block group
12571 0 215.8365285 398.1372485
CST00127 Proportion of males aged 15+ who were never married, 2000 - county
12571 0 0.3187748 0.0604310
TST00127 Proportion of males aged 15+ who were never married, 2000 - tract
12541 30 0.3392667 0.1172953
BST00127 Proportion of males aged 15+ who were never married, 2000 - block group
12321 250 0.3414724 0.1341727
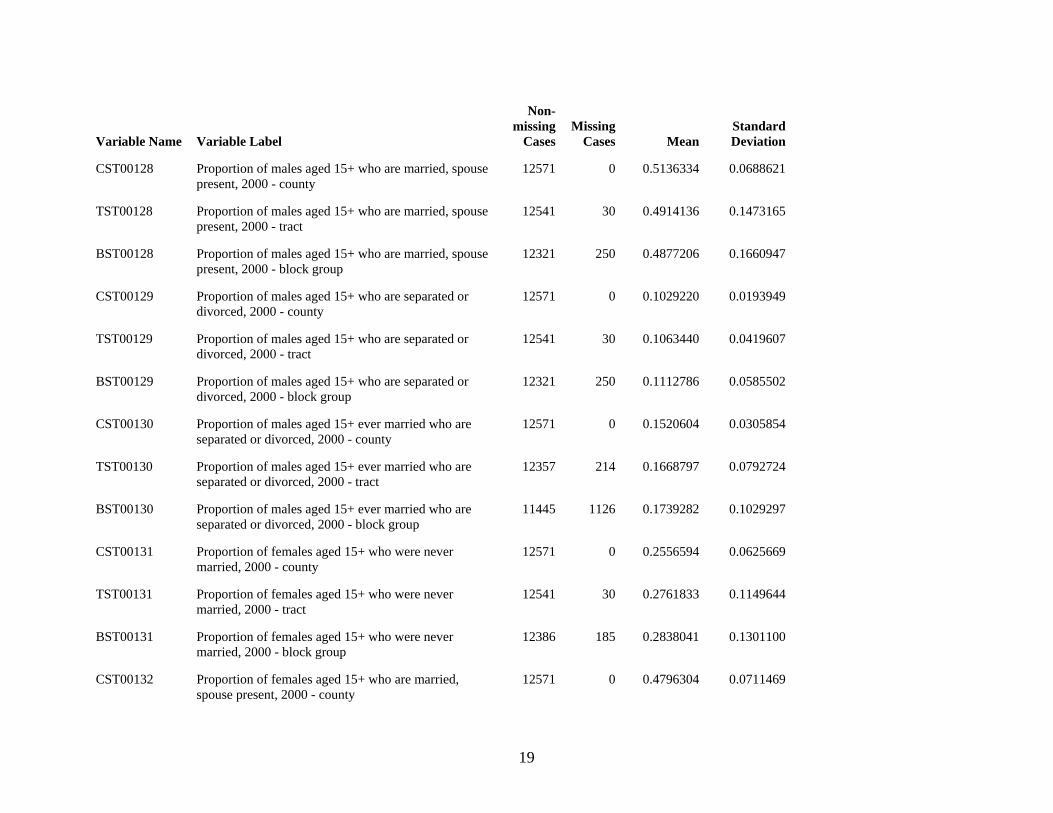
19
Variable Name Variable Label
Non-missing
CasesMissing
Cases MeanStandard Deviation
CST00128 Proportion of males aged 15+ who are married, spouse present, 2000 - county
12571 0 0.5136334 0.0688621
TST00128 Proportion of males aged 15+ who are married, spouse present, 2000 - tract
12541 30 0.4914136 0.1473165
BST00128 Proportion of males aged 15+ who are married, spouse present, 2000 - block group
12321 250 0.4877206 0.1660947
CST00129 Proportion of males aged 15+ who are separated or divorced, 2000 - county
12571 0 0.1029220 0.0193949
TST00129 Proportion of males aged 15+ who are separated or divorced, 2000 - tract
12541 30 0.1063440 0.0419607
BST00129 Proportion of males aged 15+ who are separated or divorced, 2000 - block group
12321 250 0.1112786 0.0585502
CST00130 Proportion of males aged 15+ ever married who are separated or divorced, 2000 - county
12571 0 0.1520604 0.0305854
TST00130 Proportion of males aged 15+ ever married who are separated or divorced, 2000 - tract
12357 214 0.1668797 0.0792724
BST00130 Proportion of males aged 15+ ever married who are separated or divorced, 2000 - block group
11445 1126 0.1739282 0.1029297
CST00131 Proportion of females aged 15+ who were never married, 2000 - county
12571 0 0.2556594 0.0625669
TST00131 Proportion of females aged 15+ who were never married, 2000 - tract
12541 30 0.2761833 0.1149644
BST00131 Proportion of females aged 15+ who were never married, 2000 - block group
12386 185 0.2838041 0.1301100
CST00132 Proportion of females aged 15+ who are married, spouse present, 2000 - county
12571 0 0.4796304 0.0711469
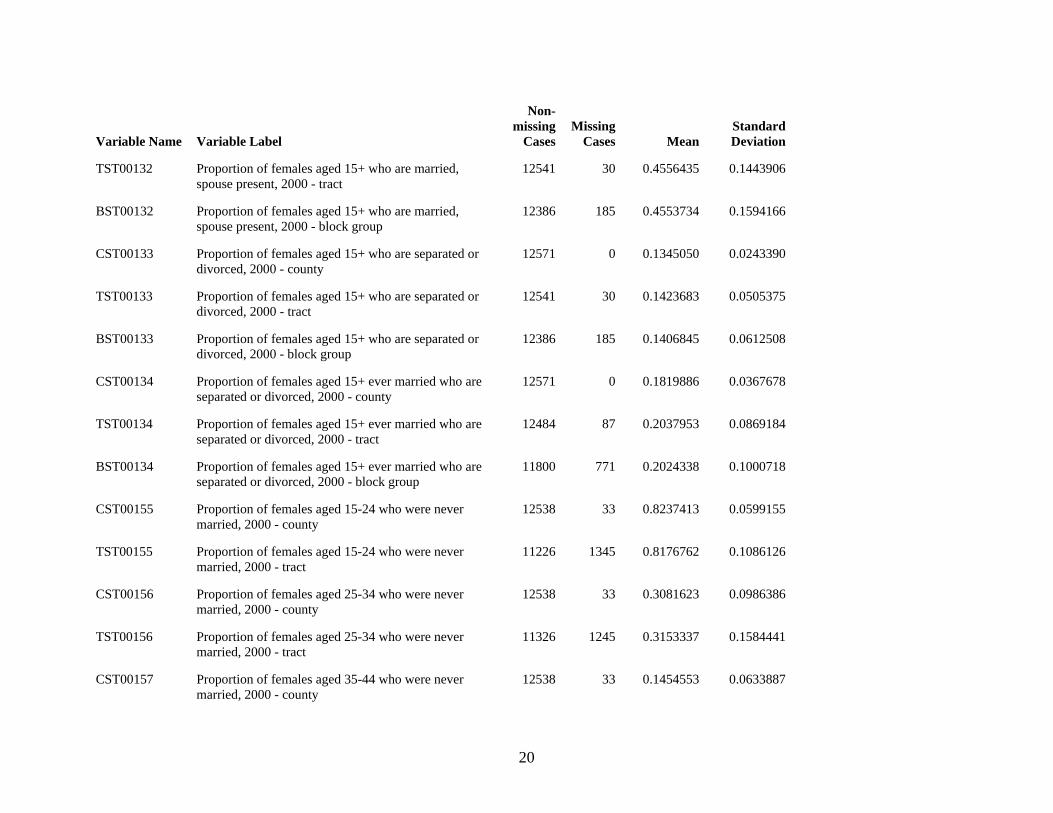
20
Variable Name Variable Label
Non-missing
CasesMissing
Cases MeanStandard Deviation
TST00132 Proportion of females aged 15+ who are married, spouse present, 2000 - tract
12541 30 0.4556435 0.1443906
BST00132 Proportion of females aged 15+ who are married, spouse present, 2000 - block group
12386 185 0.4553734 0.1594166
CST00133 Proportion of females aged 15+ who are separated or divorced, 2000 - county
12571 0 0.1345050 0.0243390
TST00133 Proportion of females aged 15+ who are separated or divorced, 2000 - tract
12541 30 0.1423683 0.0505375
BST00133 Proportion of females aged 15+ who are separated or divorced, 2000 - block group
12386 185 0.1406845 0.0612508
CST00134 Proportion of females aged 15+ ever married who are separated or divorced, 2000 - county
12571 0 0.1819886 0.0367678
TST00134 Proportion of females aged 15+ ever married who are separated or divorced, 2000 - tract
12484 87 0.2037953 0.0869184
BST00134 Proportion of females aged 15+ ever married who are separated or divorced, 2000 - block group
11800 771 0.2024338 0.1000718
CST00155 Proportion of females aged 15-24 who were never married, 2000 - county
12538 33 0.8237413 0.0599155
TST00155 Proportion of females aged 15-24 who were never married, 2000 - tract
11226 1345 0.8176762 0.1086126
CST00156 Proportion of females aged 25-34 who were never married, 2000 - county
12538 33 0.3081623 0.0986386
TST00156 Proportion of females aged 25-34 who were never married, 2000 - tract
11326 1245 0.3153337 0.1584441
CST00157 Proportion of females aged 35-44 who were never married, 2000 - county
12538 33 0.1454553 0.0633887
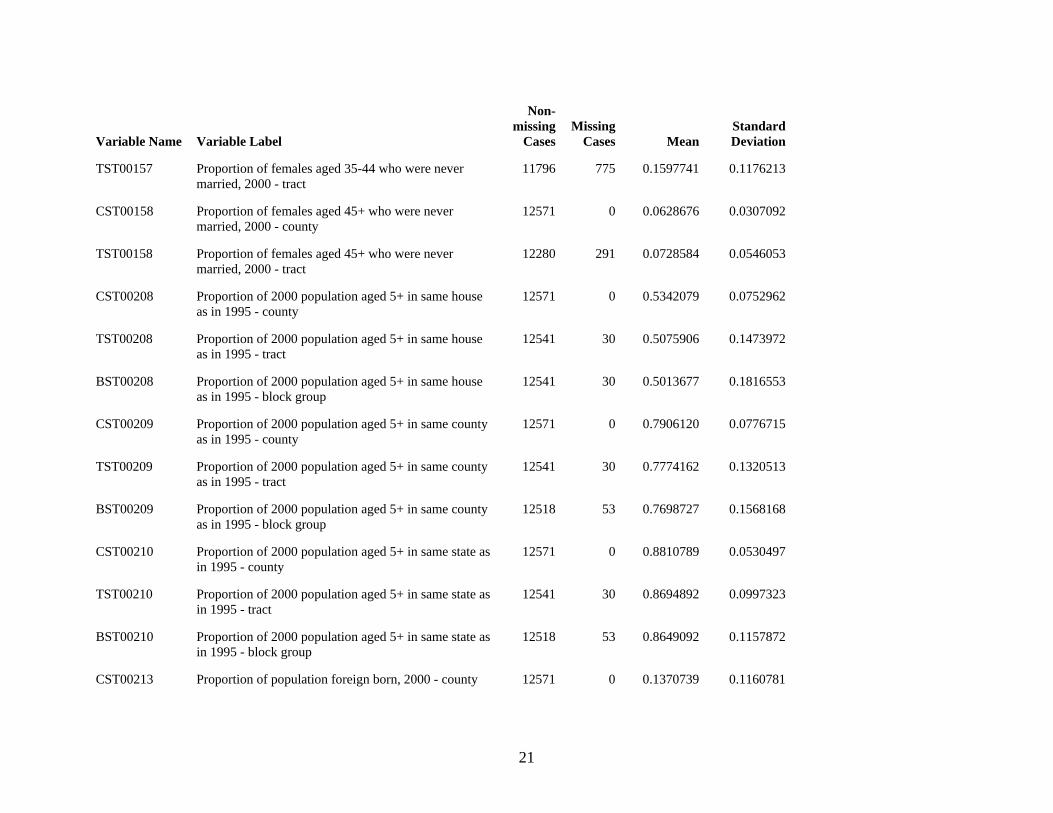
21
Variable Name Variable Label
Non-missing
CasesMissing
Cases MeanStandard Deviation
TST00157 Proportion of females aged 35-44 who were never married, 2000 - tract
11796 775 0.1597741 0.1176213
CST00158 Proportion of females aged 45+ who were never married, 2000 - county
12571 0 0.0628676 0.0307092
TST00158 Proportion of females aged 45+ who were never married, 2000 - tract
12280 291 0.0728584 0.0546053
CST00208 Proportion of 2000 population aged 5+ in same house as in 1995 - county
12571 0 0.5342079 0.0752962
TST00208 Proportion of 2000 population aged 5+ in same house as in 1995 - tract
12541 30 0.5075906 0.1473972
BST00208 Proportion of 2000 population aged 5+ in same house as in 1995 - block group
12541 30 0.5013677 0.1816553
CST00209 Proportion of 2000 population aged 5+ in same county as in 1995 - county
12571 0 0.7906120 0.0776715
TST00209 Proportion of 2000 population aged 5+ in same county as in 1995 - tract
12541 30 0.7774162 0.1320513
BST00209 Proportion of 2000 population aged 5+ in same county as in 1995 - block group
12518 53 0.7698727 0.1568168
CST00210 Proportion of 2000 population aged 5+ in same state as in 1995 - county
12571 0 0.8810789 0.0530497
TST00210 Proportion of 2000 population aged 5+ in same state as in 1995 - tract
12541 30 0.8694892 0.0997323
BST00210 Proportion of 2000 population aged 5+ in same state as in 1995 - block group
12518 53 0.8649092 0.1157872
CST00213 Proportion of population foreign born, 2000 - county 12571 0 0.1370739 0.1160781
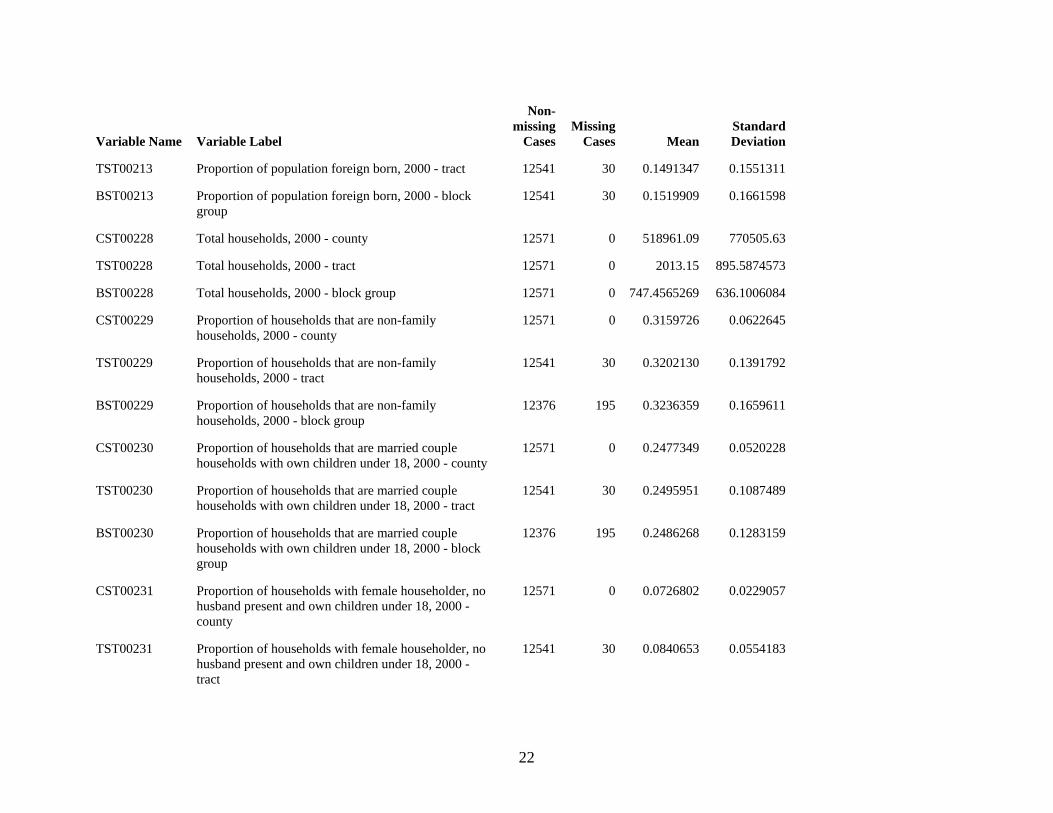
22
Variable Name Variable Label
Non-missing
CasesMissing
Cases MeanStandard Deviation
TST00213 Proportion of population foreign born, 2000 - tract 12541 30 0.1491347 0.1551311
BST00213 Proportion of population foreign born, 2000 - block group
12541 30 0.1519909 0.1661598
CST00228 Total households, 2000 - county 12571 0 518961.09 770505.63
TST00228 Total households, 2000 - tract 12571 0 2013.15 895.5874573
BST00228 Total households, 2000 - block group 12571 0 747.4565269 636.1006084
CST00229 Proportion of households that are non-family households, 2000 - county
12571 0 0.3159726 0.0622645
TST00229 Proportion of households that are non-family households, 2000 - tract
12541 30 0.3202130 0.1391792
BST00229 Proportion of households that are non-family households, 2000 - block group
12376 195 0.3236359 0.1659611
CST00230 Proportion of households that are married couple households with own children under 18, 2000 - county
12571 0 0.2477349 0.0520228
TST00230 Proportion of households that are married couple households with own children under 18, 2000 - tract
12541 30 0.2495951 0.1087489
BST00230 Proportion of households that are married couple households with own children under 18, 2000 - block group
12376 195 0.2486268 0.1283159
CST00231 Proportion of households with female householder, no husband present and own children under 18, 2000 - county
12571 0 0.0726802 0.0229057
TST00231 Proportion of households with female householder, no husband present and own children under 18, 2000 - tract
12541 30 0.0840653 0.0554183
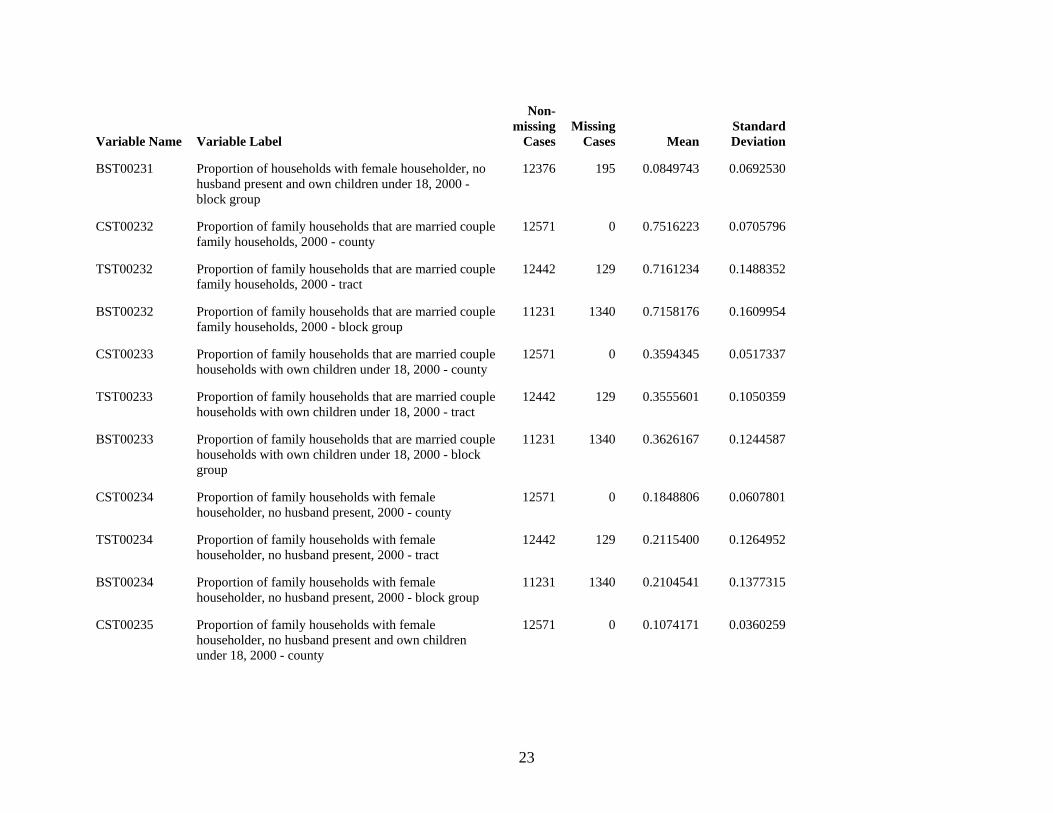
23
Variable Name Variable Label
Non-missing
CasesMissing
Cases MeanStandard Deviation
BST00231 Proportion of households with female householder, no husband present and own children under 18, 2000 - block group
12376 195 0.0849743 0.0692530
CST00232 Proportion of family households that are married couple family households, 2000 - county
12571 0 0.7516223 0.0705796
TST00232 Proportion of family households that are married couple family households, 2000 - tract
12442 129 0.7161234 0.1488352
BST00232 Proportion of family households that are married couple family households, 2000 - block group
11231 1340 0.7158176 0.1609954
CST00233 Proportion of family households that are married couple households with own children under 18, 2000 - county
12571 0 0.3594345 0.0517337
TST00233 Proportion of family households that are married couple households with own children under 18, 2000 - tract
12442 129 0.3555601 0.1050359
BST00233 Proportion of family households that are married couple households with own children under 18, 2000 - block group
11231 1340 0.3626167 0.1244587
CST00234 Proportion of family households with female householder, no husband present, 2000 - county
12571 0 0.1848806 0.0607801
TST00234 Proportion of family households with female householder, no husband present, 2000 - tract
12442 129 0.2115400 0.1264952
BST00234 Proportion of family households with female householder, no husband present, 2000 - block group
11231 1340 0.2104541 0.1377315
CST00235 Proportion of family households with female householder, no husband present and own children under 18, 2000 - county
12571 0 0.1074171 0.0360259
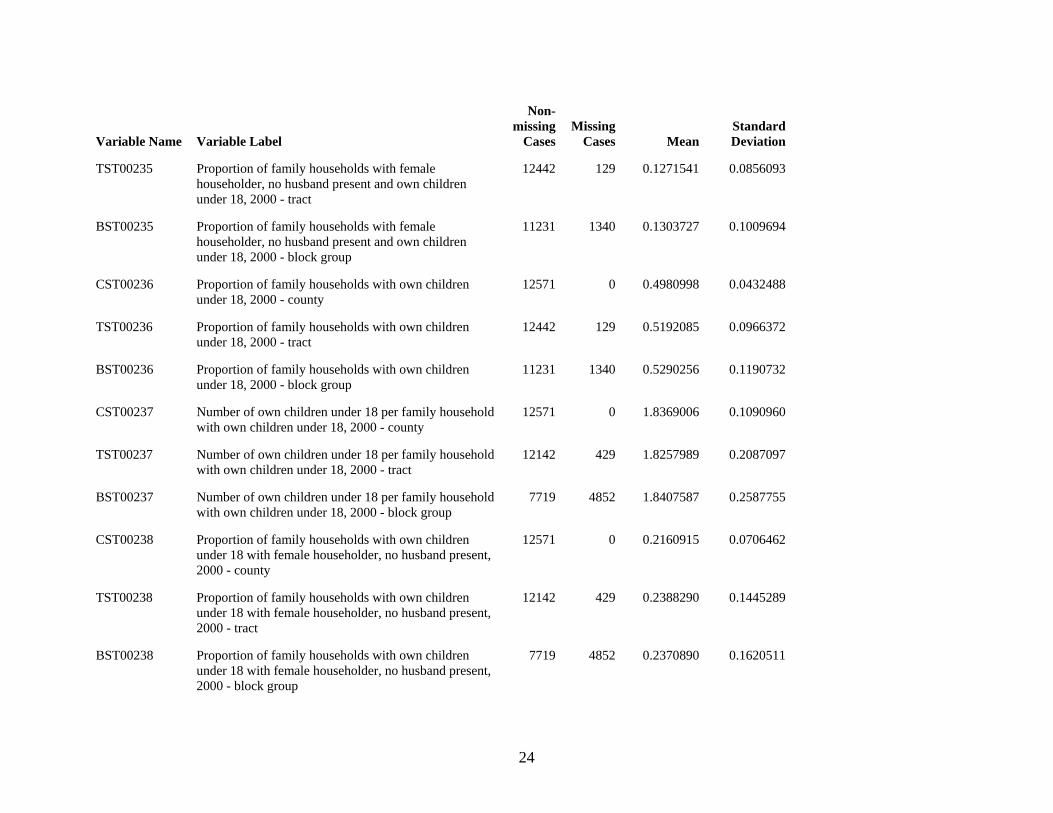
24
Variable Name Variable Label
Non-missing
CasesMissing
Cases MeanStandard Deviation
TST00235 Proportion of family households with female householder, no husband present and own children under 18, 2000 - tract
12442 129 0.1271541 0.0856093
BST00235 Proportion of family households with female householder, no husband present and own children under 18, 2000 - block group
11231 1340 0.1303727 0.1009694
CST00236 Proportion of family households with own children under 18, 2000 - county
12571 0 0.4980998 0.0432488
TST00236 Proportion of family households with own children under 18, 2000 - tract
12442 129 0.5192085 0.0966372
BST00236 Proportion of family households with own children under 18, 2000 - block group
11231 1340 0.5290256 0.1190732
CST00237 Number of own children under 18 per family household with own children under 18, 2000 - county
12571 0 1.8369006 0.1090960
TST00237 Number of own children under 18 per family household with own children under 18, 2000 - tract
12142 429 1.8257989 0.2087097
BST00237 Number of own children under 18 per family household with own children under 18, 2000 - block group
7719 4852 1.8407587 0.2587755
CST00238 Proportion of family households with own children under 18 with female householder, no husband present, 2000 - county
12571 0 0.2160915 0.0706462
TST00238 Proportion of family households with own children under 18 with female householder, no husband present, 2000 - tract
12142 429 0.2388290 0.1445289
BST00238 Proportion of family households with own children under 18 with female householder, no husband present, 2000 - block group
7719 4852 0.2370890 0.1620511
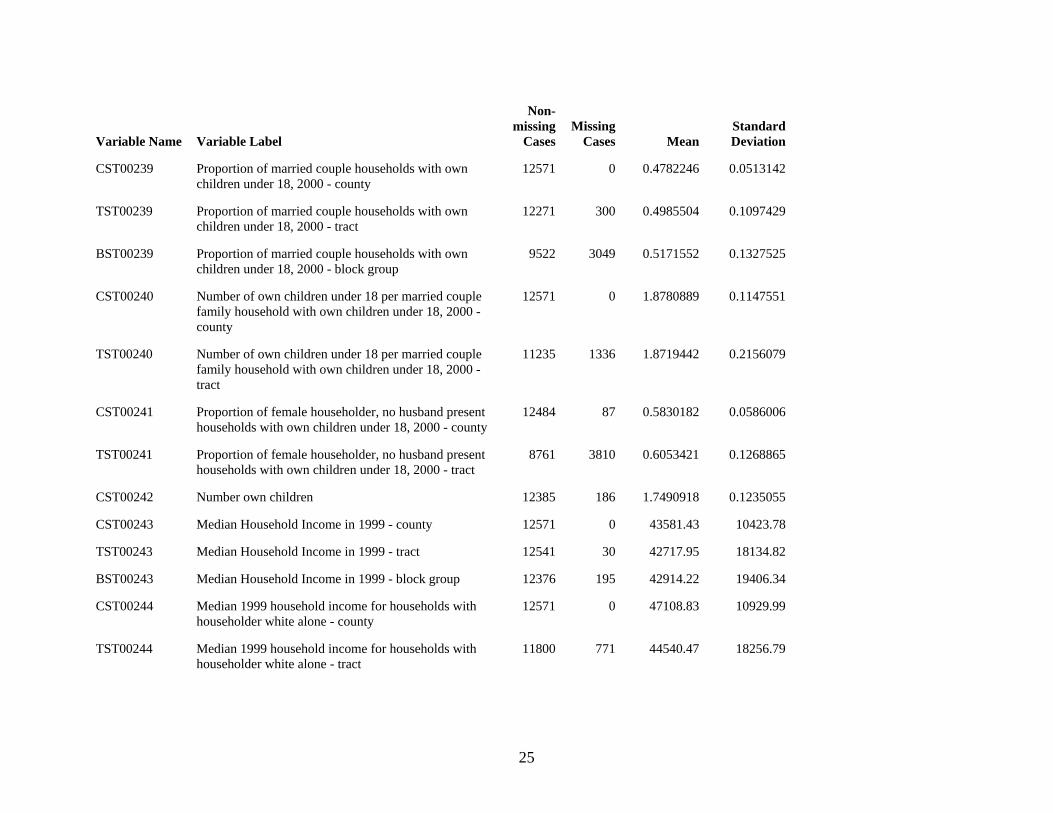
25
Variable Name Variable Label
Non-missing
CasesMissing
Cases MeanStandard Deviation
CST00239 Proportion of married couple households with own children under 18, 2000 - county
12571 0 0.4782246 0.0513142
TST00239 Proportion of married couple households with own children under 18, 2000 - tract
12271 300 0.4985504 0.1097429
BST00239 Proportion of married couple households with own children under 18, 2000 - block group
9522 3049 0.5171552 0.1327525
CST00240 Number of own children under 18 per married couple family household with own children under 18, 2000 - county
12571 0 1.8780889 0.1147551
TST00240 Number of own children under 18 per married couple family household with own children under 18, 2000 - tract
11235 1336 1.8719442 0.2156079
CST00241 Proportion of female householder, no husband present households with own children under 18, 2000 - county
12484 87 0.5830182 0.0586006
TST00241 Proportion of female householder, no husband present households with own children under 18, 2000 - tract
8761 3810 0.6053421 0.1268865
CST00242 Number own children 12385 186 1.7490918 0.1235055
CST00243 Median Household Income in 1999 - county 12571 0 43581.43 10423.78
TST00243 Median Household Income in 1999 - tract 12541 30 42717.95 18134.82
BST00243 Median Household Income in 1999 - block group 12376 195 42914.22 19406.34
CST00244 Median 1999 household income for households with householder white alone - county
12571 0 47108.83 10929.99
TST00244 Median 1999 household income for households with householder white alone - tract
11800 771 44540.47 18256.79
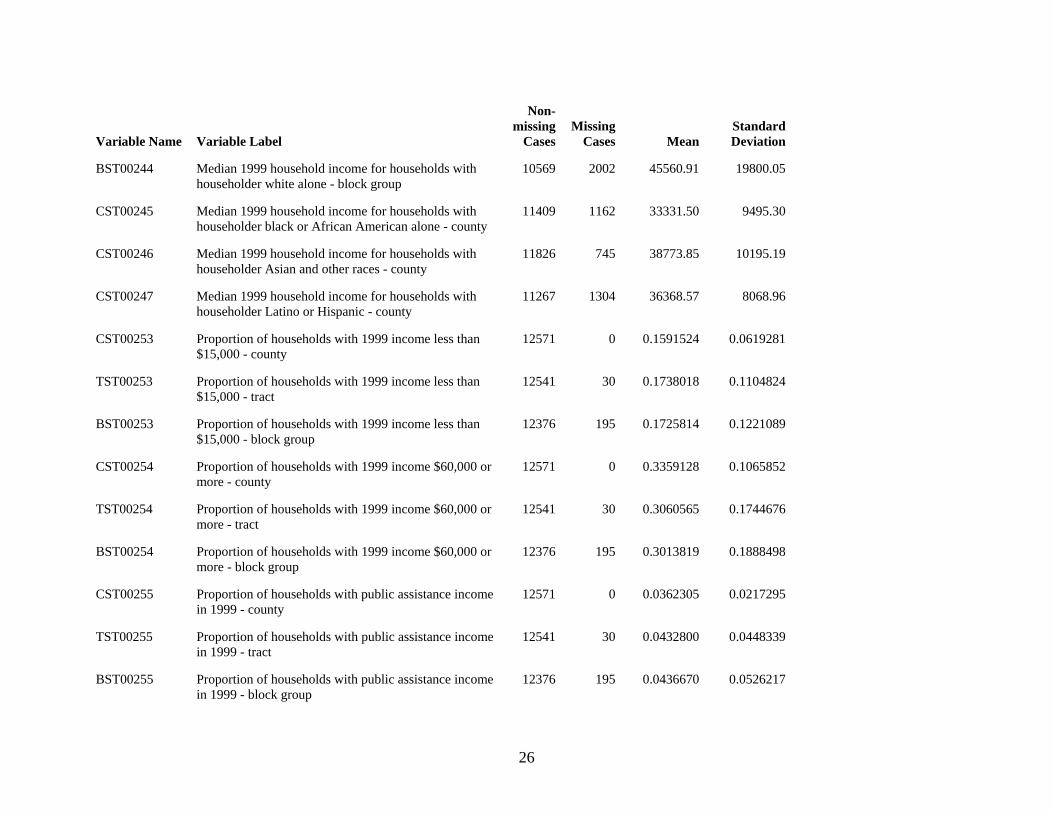
26
Variable Name Variable Label
Non-missing
CasesMissing
Cases MeanStandard Deviation
BST00244 Median 1999 household income for households with householder white alone - block group
10569 2002 45560.91 19800.05
CST00245 Median 1999 household income for households with householder black or African American alone - county
11409 1162 33331.50 9495.30
CST00246 Median 1999 household income for households with householder Asian and other races - county
11826 745 38773.85 10195.19
CST00247 Median 1999 household income for households with householder Latino or Hispanic - county
11267 1304 36368.57 8068.96
CST00253 Proportion of households with 1999 income less than $15,000 - county
12571 0 0.1591524 0.0619281
TST00253 Proportion of households with 1999 income less than $15,000 - tract
12541 30 0.1738018 0.1104824
BST00253 Proportion of households with 1999 income less than $15,000 - block group
12376 195 0.1725814 0.1221089
CST00254 Proportion of households with 1999 income $60,000 or more - county
12571 0 0.3359128 0.1065852
TST00254 Proportion of households with 1999 income $60,000 or more - tract
12541 30 0.3060565 0.1744676
BST00254 Proportion of households with 1999 income $60,000 or more - block group
12376 195 0.3013819 0.1888498
CST00255 Proportion of households with public assistance income in 1999 - county
12571 0 0.0362305 0.0217295
TST00255 Proportion of households with public assistance income in 1999 - tract
12541 30 0.0432800 0.0448339
BST00255 Proportion of households with public assistance income in 1999 - block group
12376 195 0.0436670 0.0526217
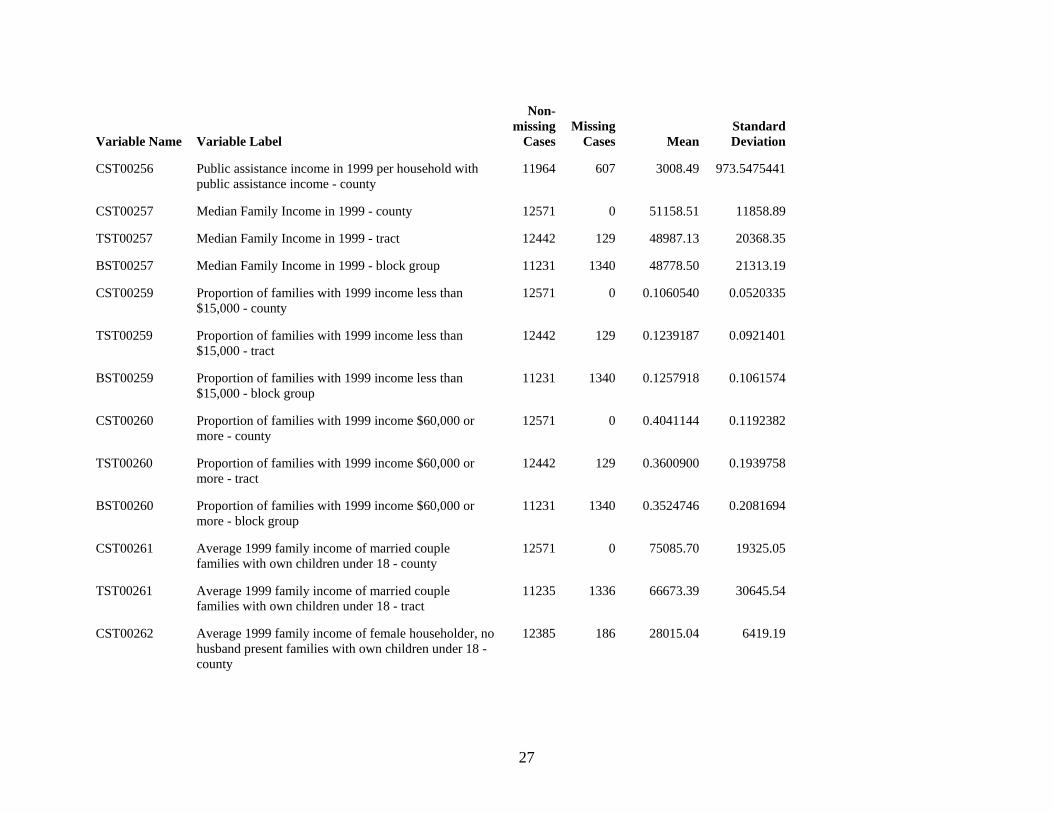
27
Variable Name Variable Label
Non-missing
CasesMissing
Cases MeanStandard Deviation
CST00256 Public assistance income in 1999 per household with public assistance income - county
11964 607 3008.49 973.5475441
CST00257 Median Family Income in 1999 - county 12571 0 51158.51 11858.89
TST00257 Median Family Income in 1999 - tract 12442 129 48987.13 20368.35
BST00257 Median Family Income in 1999 - block group 11231 1340 48778.50 21313.19
CST00259 Proportion of families with 1999 income less than $15,000 - county
12571 0 0.1060540 0.0520335
TST00259 Proportion of families with 1999 income less than $15,000 - tract
12442 129 0.1239187 0.0921401
BST00259 Proportion of families with 1999 income less than $15,000 - block group
11231 1340 0.1257918 0.1061574
CST00260 Proportion of families with 1999 income $60,000 or more - county
12571 0 0.4041144 0.1192382
TST00260 Proportion of families with 1999 income $60,000 or more - tract
12442 129 0.3600900 0.1939758
BST00260 Proportion of families with 1999 income $60,000 or more - block group
11231 1340 0.3524746 0.2081694
CST00261 Average 1999 family income of married couple families with own children under 18 - county
12571 0 75085.70 19325.05
TST00261 Average 1999 family income of married couple families with own children under 18 - tract
11235 1336 66673.39 30645.54
CST00262 Average 1999 family income of female householder, no husband present families with own children under 18 - county
12385 186 28015.04 6419.19
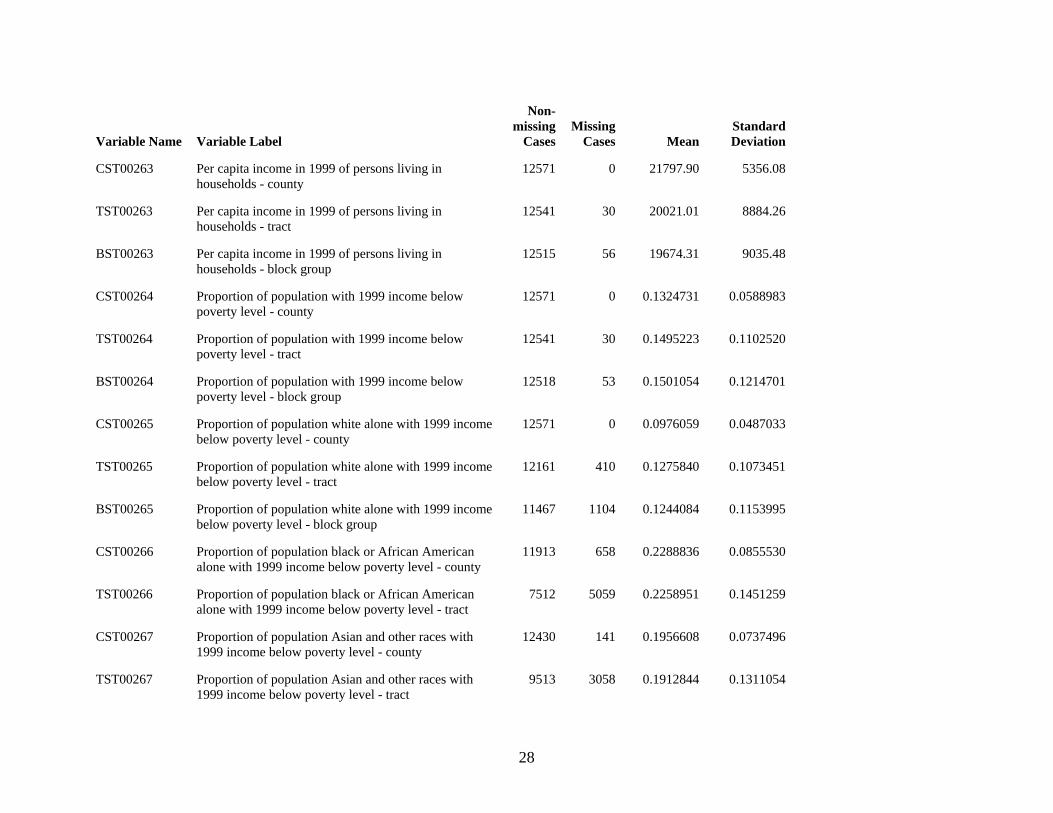
28
Variable Name Variable Label
Non-missing
CasesMissing
Cases MeanStandard Deviation
CST00263 Per capita income in 1999 of persons living in households - county
12571 0 21797.90 5356.08
TST00263 Per capita income in 1999 of persons living in households - tract
12541 30 20021.01 8884.26
BST00263 Per capita income in 1999 of persons living in households - block group
12515 56 19674.31 9035.48
CST00264 Proportion of population with 1999 income below poverty level - county
12571 0 0.1324731 0.0588983
TST00264 Proportion of population with 1999 income below poverty level - tract
12541 30 0.1495223 0.1102520
BST00264 Proportion of population with 1999 income below poverty level - block group
12518 53 0.1501054 0.1214701
CST00265 Proportion of population white alone with 1999 income below poverty level - county
12571 0 0.0976059 0.0487033
TST00265 Proportion of population white alone with 1999 income below poverty level - tract
12161 410 0.1275840 0.1073451
BST00265 Proportion of population white alone with 1999 income below poverty level - block group
11467 1104 0.1244084 0.1153995
CST00266 Proportion of population black or African American alone with 1999 income below poverty level - county
11913 658 0.2288836 0.0855530
TST00266 Proportion of population black or African American alone with 1999 income below poverty level - tract
7512 5059 0.2258951 0.1451259
CST00267 Proportion of population Asian and other races with 1999 income below poverty level - county
12430 141 0.1956608 0.0737496
TST00267 Proportion of population Asian and other races with 1999 income below poverty level - tract
9513 3058 0.1912844 0.1311054
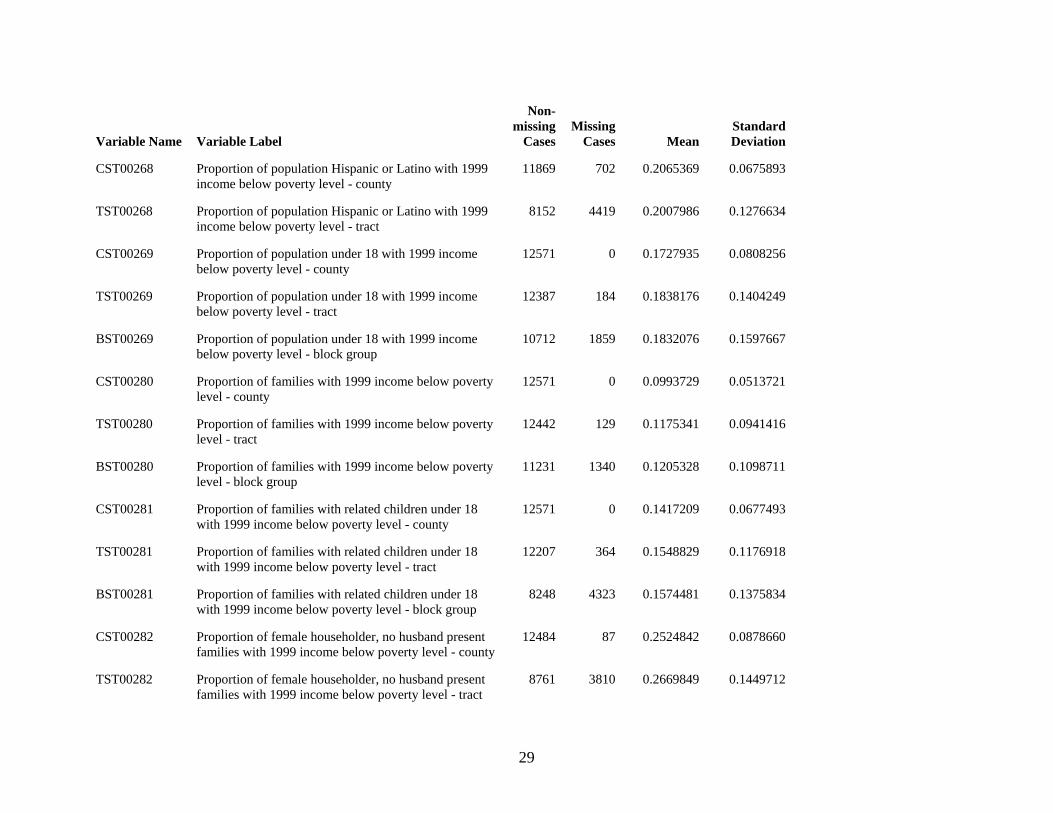
29
Variable Name Variable Label
Non-missing
CasesMissing
Cases MeanStandard Deviation
CST00268 Proportion of population Hispanic or Latino with 1999 income below poverty level - county
11869 702 0.2065369 0.0675893
TST00268 Proportion of population Hispanic or Latino with 1999 income below poverty level - tract
8152 4419 0.2007986 0.1276634
CST00269 Proportion of population under 18 with 1999 income below poverty level - county
12571 0 0.1727935 0.0808256
TST00269 Proportion of population under 18 with 1999 income below poverty level - tract
12387 184 0.1838176 0.1404249
BST00269 Proportion of population under 18 with 1999 income below poverty level - block group
10712 1859 0.1832076 0.1597667
CST00280 Proportion of families with 1999 income below poverty level - county
12571 0 0.0993729 0.0513721
TST00280 Proportion of families with 1999 income below poverty level - tract
12442 129 0.1175341 0.0941416
BST00280 Proportion of families with 1999 income below poverty level - block group
11231 1340 0.1205328 0.1098711
CST00281 Proportion of families with related children under 18 with 1999 income below poverty level - county
12571 0 0.1417209 0.0677493
TST00281 Proportion of families with related children under 18 with 1999 income below poverty level - tract
12207 364 0.1548829 0.1176918
BST00281 Proportion of families with related children under 18 with 1999 income below poverty level - block group
8248 4323 0.1574481 0.1375834
CST00282 Proportion of female householder, no husband present families with 1999 income below poverty level - county
12484 87 0.2524842 0.0878660
TST00282 Proportion of female householder, no husband present families with 1999 income below poverty level - tract
8761 3810 0.2669849 0.1449712
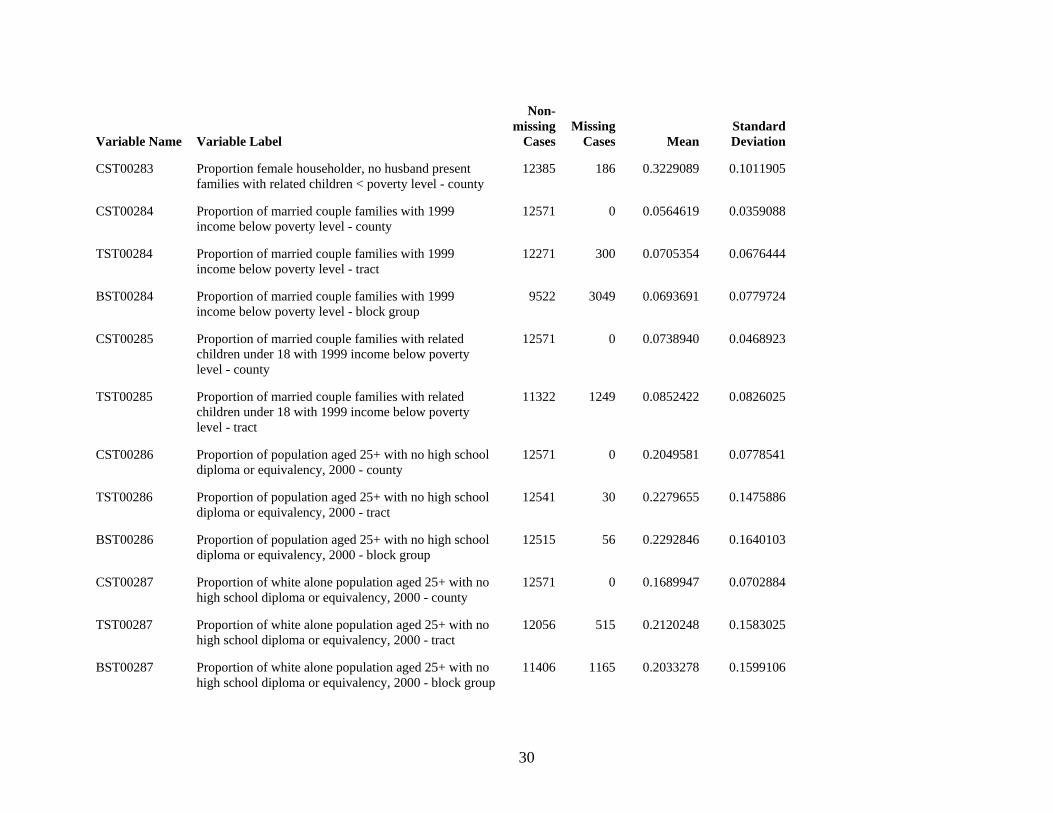
30
Variable Name Variable Label
Non-missing
CasesMissing
Cases MeanStandard Deviation
CST00283 Proportion female householder, no husband present families with related children < poverty level - county
12385 186 0.3229089 0.1011905
CST00284 Proportion of married couple families with 1999 income below poverty level - county
12571 0 0.0564619 0.0359088
TST00284 Proportion of married couple families with 1999 income below poverty level - tract
12271 300 0.0705354 0.0676444
BST00284 Proportion of married couple families with 1999 income below poverty level - block group
9522 3049 0.0693691 0.0779724
CST00285 Proportion of married couple families with related children under 18 with 1999 income below poverty level - county
12571 0 0.0738940 0.0468923
TST00285 Proportion of married couple families with related children under 18 with 1999 income below poverty level - tract
11322 1249 0.0852422 0.0826025
CST00286 Proportion of population aged 25+ with no high school diploma or equivalency, 2000 - county
12571 0 0.2049581 0.0778541
TST00286 Proportion of population aged 25+ with no high school diploma or equivalency, 2000 - tract
12541 30 0.2279655 0.1475886
BST00286 Proportion of population aged 25+ with no high school diploma or equivalency, 2000 - block group
12515 56 0.2292846 0.1640103
CST00287 Proportion of white alone population aged 25+ with no high school diploma or equivalency, 2000 - county
12571 0 0.1689947 0.0702884
TST00287 Proportion of white alone population aged 25+ with no high school diploma or equivalency, 2000 - tract
12056 515 0.2120248 0.1583025
BST00287 Proportion of white alone population aged 25+ with no high school diploma or equivalency, 2000 - block group
11406 1165 0.2033278 0.1599106
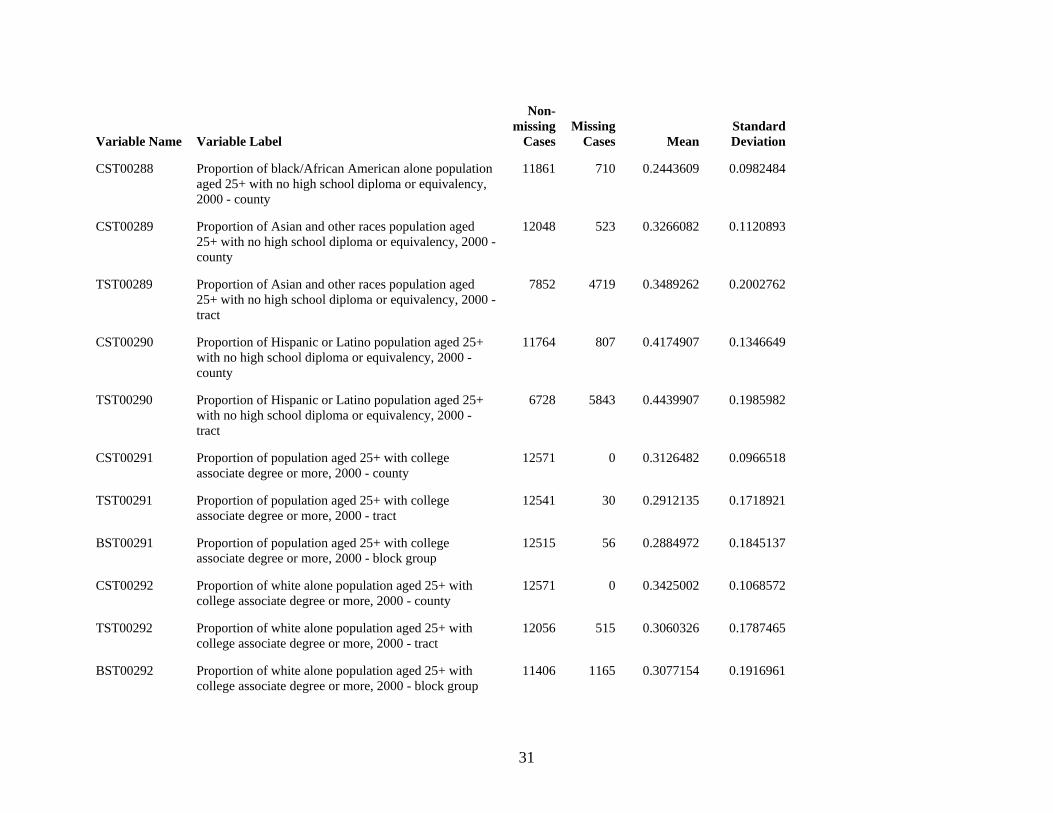
31
Variable Name Variable Label
Non-missing
CasesMissing
Cases MeanStandard Deviation
CST00288 Proportion of black/African American alone population aged 25+ with no high school diploma or equivalency, 2000 - county
11861 710 0.2443609 0.0982484
CST00289 Proportion of Asian and other races population aged 25+ with no high school diploma or equivalency, 2000 - county
12048 523 0.3266082 0.1120893
TST00289 Proportion of Asian and other races population aged 25+ with no high school diploma or equivalency, 2000 - tract
7852 4719 0.3489262 0.2002762
CST00290 Proportion of Hispanic or Latino population aged 25+ with no high school diploma or equivalency, 2000 - county
11764 807 0.4174907 0.1346649
TST00290 Proportion of Hispanic or Latino population aged 25+ with no high school diploma or equivalency, 2000 - tract
6728 5843 0.4439907 0.1985982
CST00291 Proportion of population aged 25+ with college associate degree or more, 2000 - county
12571 0 0.3126482 0.0966518
TST00291 Proportion of population aged 25+ with college associate degree or more, 2000 - tract
12541 30 0.2912135 0.1718921
BST00291 Proportion of population aged 25+ with college associate degree or more, 2000 - block group
12515 56 0.2884972 0.1845137
CST00292 Proportion of white alone population aged 25+ with college associate degree or more, 2000 - county
12571 0 0.3425002 0.1068572
TST00292 Proportion of white alone population aged 25+ with college associate degree or more, 2000 - tract
12056 515 0.3060326 0.1787465
BST00292 Proportion of white alone population aged 25+ with college associate degree or more, 2000 - block group
11406 1165 0.3077154 0.1916961
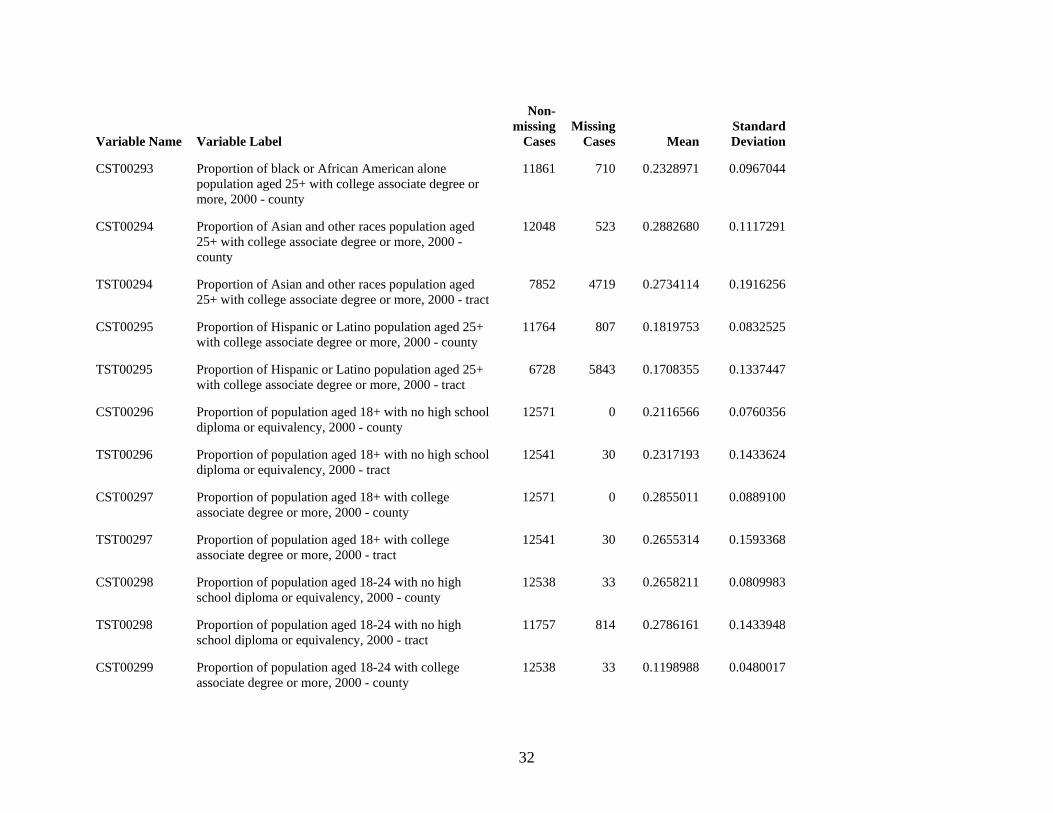
32
Variable Name Variable Label
Non-missing
CasesMissing
Cases MeanStandard Deviation
CST00293 Proportion of black or African American alone population aged 25+ with college associate degree or more, 2000 - county
11861 710 0.2328971 0.0967044
CST00294 Proportion of Asian and other races population aged 25+ with college associate degree or more, 2000 - county
12048 523 0.2882680 0.1117291
TST00294 Proportion of Asian and other races population aged 25+ with college associate degree or more, 2000 - tract
7852 4719 0.2734114 0.1916256
CST00295 Proportion of Hispanic or Latino population aged 25+ with college associate degree or more, 2000 - county
11764 807 0.1819753 0.0832525
TST00295 Proportion of Hispanic or Latino population aged 25+ with college associate degree or more, 2000 - tract
6728 5843 0.1708355 0.1337447
CST00296 Proportion of population aged 18+ with no high school diploma or equivalency, 2000 - county
12571 0 0.2116566 0.0760356
TST00296 Proportion of population aged 18+ with no high school diploma or equivalency, 2000 - tract
12541 30 0.2317193 0.1433624
CST00297 Proportion of population aged 18+ with college associate degree or more, 2000 - county
12571 0 0.2855011 0.0889100
TST00297 Proportion of population aged 18+ with college associate degree or more, 2000 - tract
12541 30 0.2655314 0.1593368
CST00298 Proportion of population aged 18-24 with no high school diploma or equivalency, 2000 - county
12538 33 0.2658211 0.0809983
TST00298 Proportion of population aged 18-24 with no high school diploma or equivalency, 2000 - tract
11757 814 0.2786161 0.1433948
CST00299 Proportion of population aged 18-24 with college associate degree or more, 2000 - county
12538 33 0.1198988 0.0480017
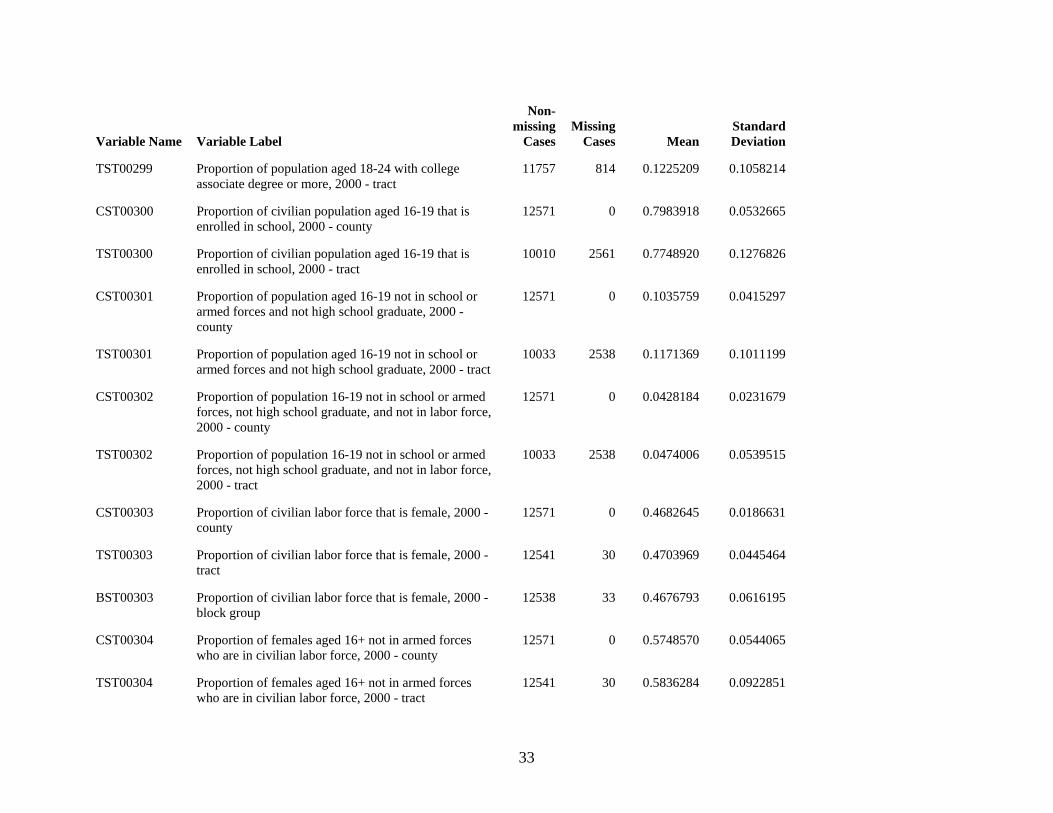
33
Variable Name Variable Label
Non-missing
CasesMissing
Cases MeanStandard Deviation
TST00299 Proportion of population aged 18-24 with college associate degree or more, 2000 - tract
11757 814 0.1225209 0.1058214
CST00300 Proportion of civilian population aged 16-19 that is enrolled in school, 2000 - county
12571 0 0.7983918 0.0532665
TST00300 Proportion of civilian population aged 16-19 that is enrolled in school, 2000 - tract
10010 2561 0.7748920 0.1276826
CST00301 Proportion of population aged 16-19 not in school or armed forces and not high school graduate, 2000 - county
12571 0 0.1035759 0.0415297
TST00301 Proportion of population aged 16-19 not in school or armed forces and not high school graduate, 2000 - tract
10033 2538 0.1171369 0.1011199
CST00302 Proportion of population 16-19 not in school or armed forces, not high school graduate, and not in labor force, 2000 - county
12571 0 0.0428184 0.0231679
TST00302 Proportion of population 16-19 not in school or armed forces, not high school graduate, and not in labor force, 2000 - tract
10033 2538 0.0474006 0.0539515
CST00303 Proportion of civilian labor force that is female, 2000 - county
12571 0 0.4682645 0.0186631
TST00303 Proportion of civilian labor force that is female, 2000 - tract
12541 30 0.4703969 0.0445464
BST00303 Proportion of civilian labor force that is female, 2000 - block group
12538 33 0.4676793 0.0616195
CST00304 Proportion of females aged 16+ not in armed forces who are in civilian labor force, 2000 - county
12571 0 0.5748570 0.0544065
TST00304 Proportion of females aged 16+ not in armed forces who are in civilian labor force, 2000 - tract
12541 30 0.5836284 0.0922851
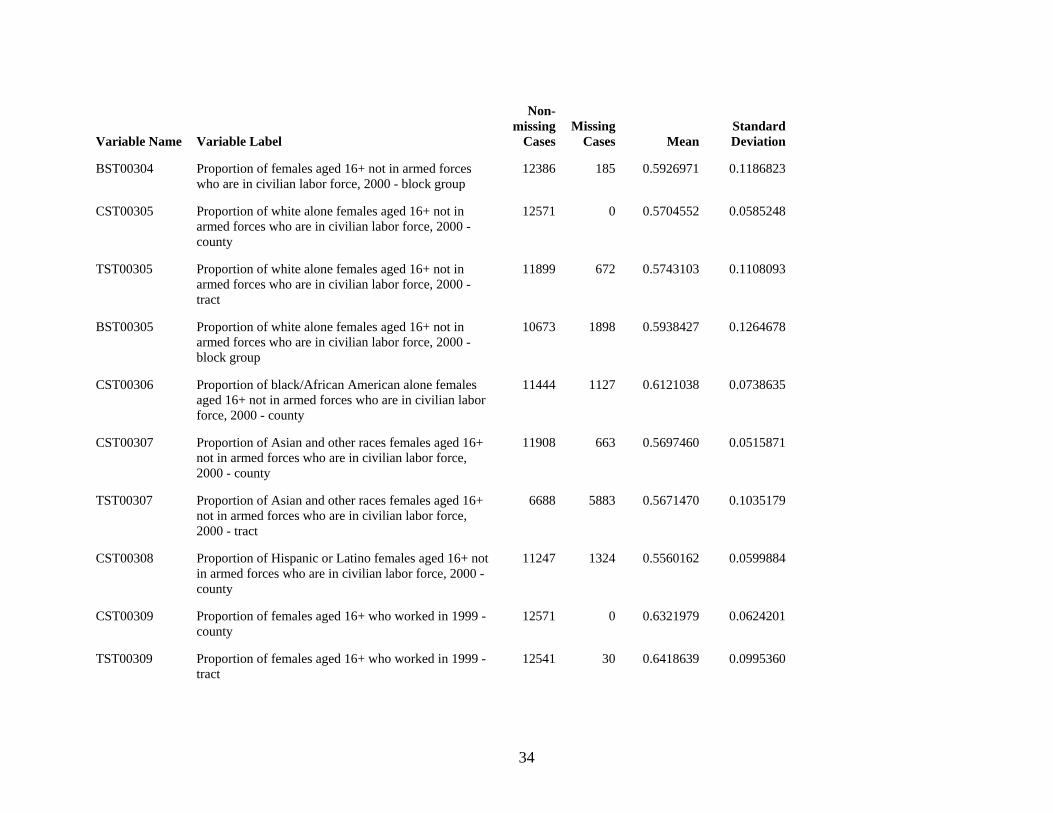
34
Variable Name Variable Label
Non-missing
CasesMissing
Cases MeanStandard Deviation
BST00304 Proportion of females aged 16+ not in armed forces who are in civilian labor force, 2000 - block group
12386 185 0.5926971 0.1186823
CST00305 Proportion of white alone females aged 16+ not in armed forces who are in civilian labor force, 2000 - county
12571 0 0.5704552 0.0585248
TST00305 Proportion of white alone females aged 16+ not in armed forces who are in civilian labor force, 2000 - tract
11899 672 0.5743103 0.1108093
BST00305 Proportion of white alone females aged 16+ not in armed forces who are in civilian labor force, 2000 - block group
10673 1898 0.5938427 0.1264678
CST00306 Proportion of black/African American alone females aged 16+ not in armed forces who are in civilian labor force, 2000 - county
11444 1127 0.6121038 0.0738635
CST00307 Proportion of Asian and other races females aged 16+ not in armed forces who are in civilian labor force, 2000 - county
11908 663 0.5697460 0.0515871
TST00307 Proportion of Asian and other races females aged 16+ not in armed forces who are in civilian labor force, 2000 - tract
6688 5883 0.5671470 0.1035179
CST00308 Proportion of Hispanic or Latino females aged 16+ not in armed forces who are in civilian labor force, 2000 - county
11247 1324 0.5560162 0.0599884
CST00309 Proportion of females aged 16+ who worked in 1999 - county
12571 0 0.6321979 0.0624201
TST00309 Proportion of females aged 16+ who worked in 1999 - tract
12541 30 0.6418639 0.0995360
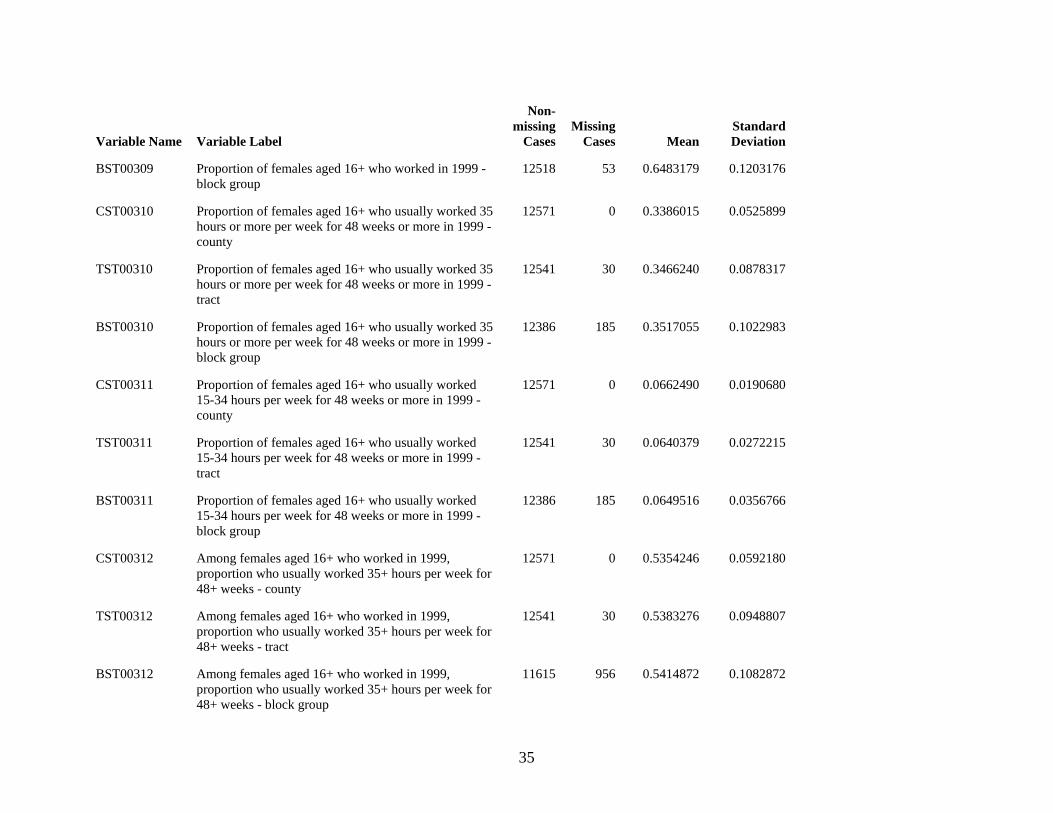
35
Variable Name Variable Label
Non-missing
CasesMissing
Cases MeanStandard Deviation
BST00309 Proportion of females aged 16+ who worked in 1999 - block group
12518 53 0.6483179 0.1203176
CST00310 Proportion of females aged 16+ who usually worked 35 hours or more per week for 48 weeks or more in 1999 - county
12571 0 0.3386015 0.0525899
TST00310 Proportion of females aged 16+ who usually worked 35 hours or more per week for 48 weeks or more in 1999 - tract
12541 30 0.3466240 0.0878317
BST00310 Proportion of females aged 16+ who usually worked 35 hours or more per week for 48 weeks or more in 1999 - block group
12386 185 0.3517055 0.1022983
CST00311 Proportion of females aged 16+ who usually worked 15-34 hours per week for 48 weeks or more in 1999 - county
12571 0 0.0662490 0.0190680
TST00311 Proportion of females aged 16+ who usually worked 15-34 hours per week for 48 weeks or more in 1999 - tract
12541 30 0.0640379 0.0272215
BST00311 Proportion of females aged 16+ who usually worked 15-34 hours per week for 48 weeks or more in 1999 - block group
12386 185 0.0649516 0.0356766
CST00312 Among females aged 16+ who worked in 1999, proportion who usually worked 35+ hours per week for 48+ weeks - county
12571 0 0.5354246 0.0592180
TST00312 Among females aged 16+ who worked in 1999, proportion who usually worked 35+ hours per week for 48+ weeks - tract
12541 30 0.5383276 0.0948807
BST00312 Among females aged 16+ who worked in 1999, proportion who usually worked 35+ hours per week for 48+ weeks - block group
11615 956 0.5414872 0.1082872
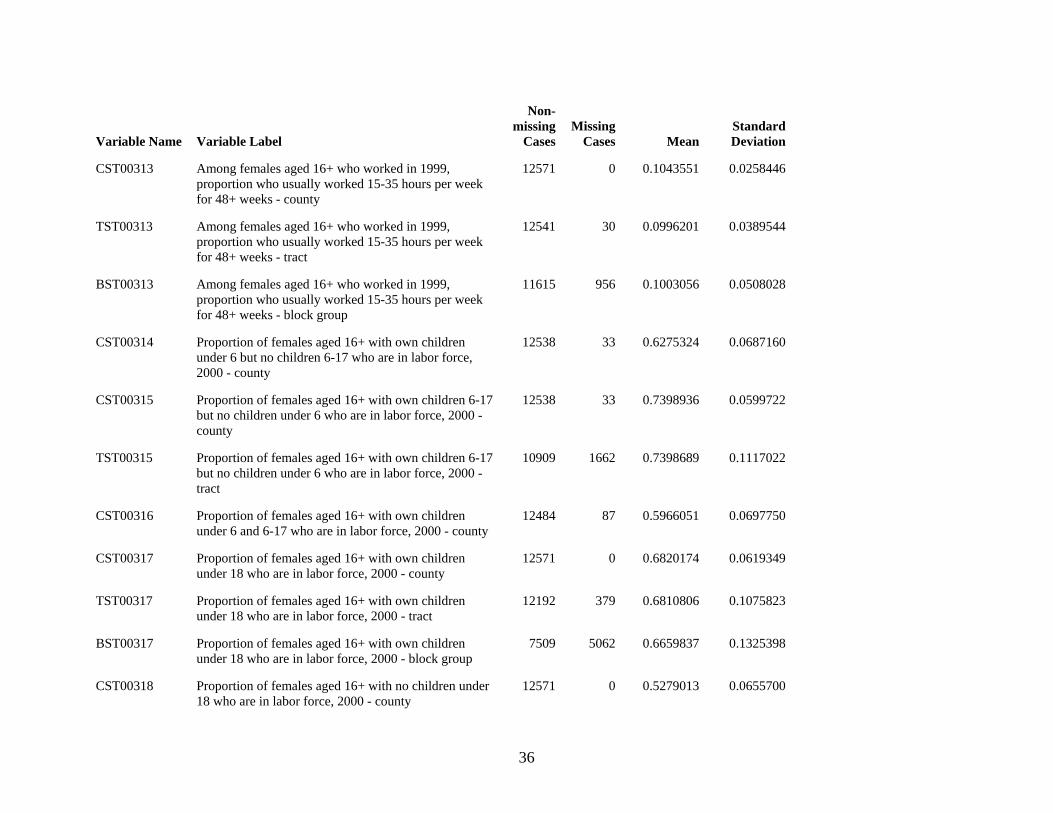
36
Variable Name Variable Label
Non-missing
CasesMissing
Cases MeanStandard Deviation
CST00313 Among females aged 16+ who worked in 1999, proportion who usually worked 15-35 hours per week for 48+ weeks - county
12571 0 0.1043551 0.0258446
TST00313 Among females aged 16+ who worked in 1999, proportion who usually worked 15-35 hours per week for 48+ weeks - tract
12541 30 0.0996201 0.0389544
BST00313 Among females aged 16+ who worked in 1999, proportion who usually worked 15-35 hours per week for 48+ weeks - block group
11615 956 0.1003056 0.0508028
CST00314 Proportion of females aged 16+ with own children under 6 but no children 6-17 who are in labor force, 2000 - county
12538 33 0.6275324 0.0687160
CST00315 Proportion of females aged 16+ with own children 6-17 but no children under 6 who are in labor force, 2000 - county
12538 33 0.7398936 0.0599722
TST00315 Proportion of females aged 16+ with own children 6-17 but no children under 6 who are in labor force, 2000 - tract
10909 1662 0.7398689 0.1117022
CST00316 Proportion of females aged 16+ with own children under 6 and 6-17 who are in labor force, 2000 - county
12484 87 0.5966051 0.0697750
CST00317 Proportion of females aged 16+ with own children under 18 who are in labor force, 2000 - county
12571 0 0.6820174 0.0619349
TST00317 Proportion of females aged 16+ with own children under 18 who are in labor force, 2000 - tract
12192 379 0.6810806 0.1075823
BST00317 Proportion of females aged 16+ with own children under 18 who are in labor force, 2000 - block group
7509 5062 0.6659837 0.1325398
CST00318 Proportion of females aged 16+ with no children under 18 who are in labor force, 2000 - county
12571 0 0.5279013 0.0655700
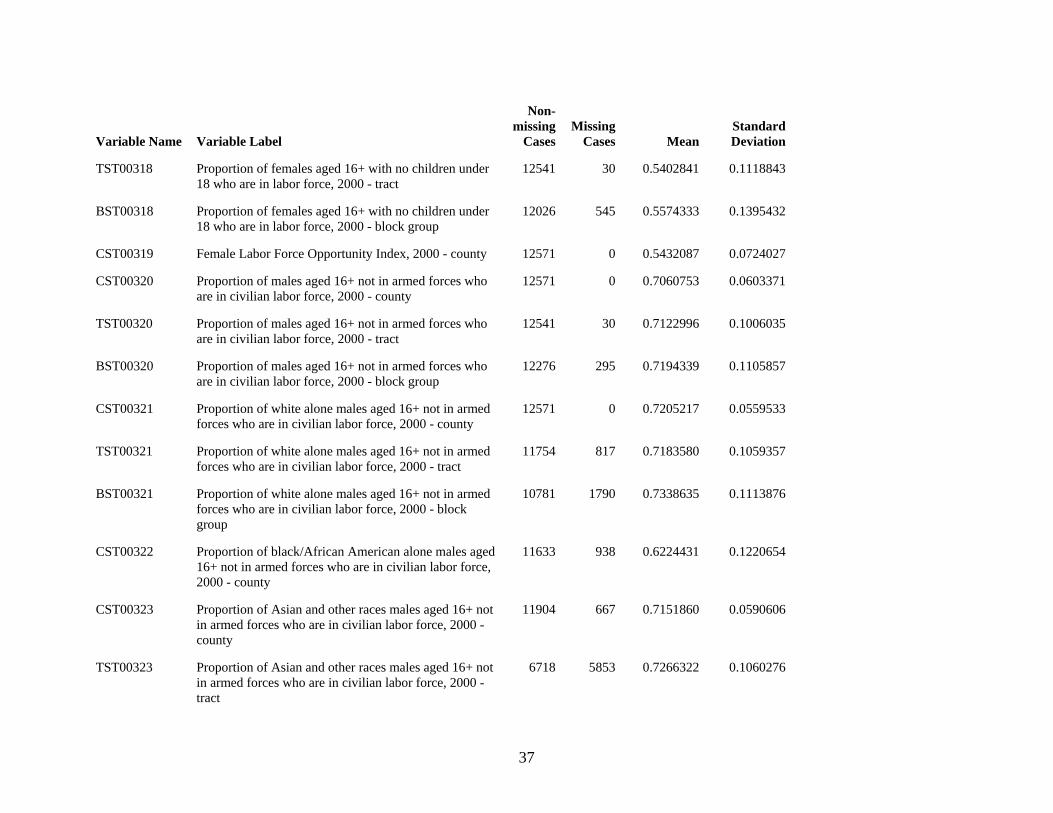
37
Variable Name Variable Label
Non-missing
CasesMissing
Cases MeanStandard Deviation
TST00318 Proportion of females aged 16+ with no children under 18 who are in labor force, 2000 - tract
12541 30 0.5402841 0.1118843
BST00318 Proportion of females aged 16+ with no children under 18 who are in labor force, 2000 - block group
12026 545 0.5574333 0.1395432
CST00319 Female Labor Force Opportunity Index, 2000 - county 12571 0 0.5432087 0.0724027
CST00320 Proportion of males aged 16+ not in armed forces who are in civilian labor force, 2000 - county
12571 0 0.7060753 0.0603371
TST00320 Proportion of males aged 16+ not in armed forces who are in civilian labor force, 2000 - tract
12541 30 0.7122996 0.1006035
BST00320 Proportion of males aged 16+ not in armed forces who are in civilian labor force, 2000 - block group
12276 295 0.7194339 0.1105857
CST00321 Proportion of white alone males aged 16+ not in armed forces who are in civilian labor force, 2000 - county
12571 0 0.7205217 0.0559533
TST00321 Proportion of white alone males aged 16+ not in armed forces who are in civilian labor force, 2000 - tract
11754 817 0.7183580 0.1059357
BST00321 Proportion of white alone males aged 16+ not in armed forces who are in civilian labor force, 2000 - block group
10781 1790 0.7338635 0.1113876
CST00322 Proportion of black/African American alone males aged 16+ not in armed forces who are in civilian labor force, 2000 - county
11633 938 0.6224431 0.1220654
CST00323 Proportion of Asian and other races males aged 16+ not in armed forces who are in civilian labor force, 2000 - county
11904 667 0.7151860 0.0590606
TST00323 Proportion of Asian and other races males aged 16+ not in armed forces who are in civilian labor force, 2000 - tract
6718 5853 0.7266322 0.1060276
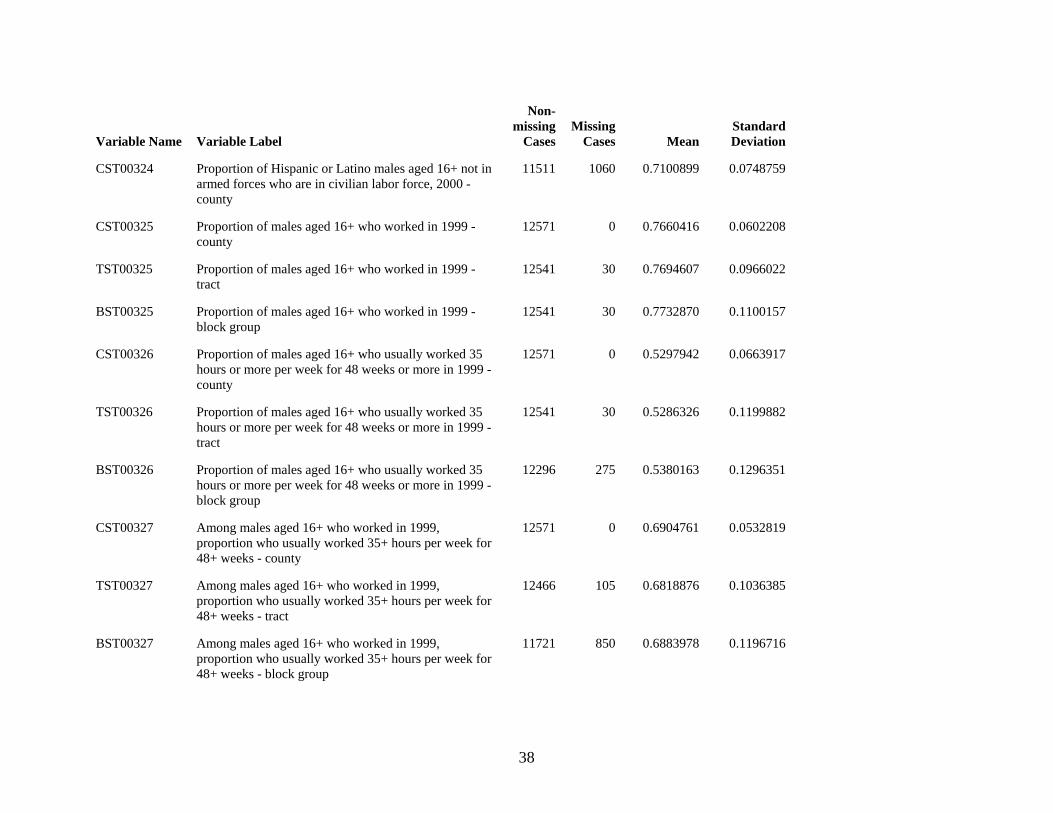
38
Variable Name Variable Label
Non-missing
CasesMissing
Cases MeanStandard Deviation
CST00324 Proportion of Hispanic or Latino males aged 16+ not in armed forces who are in civilian labor force, 2000 - county
11511 1060 0.7100899 0.0748759
CST00325 Proportion of males aged 16+ who worked in 1999 - county
12571 0 0.7660416 0.0602208
TST00325 Proportion of males aged 16+ who worked in 1999 - tract
12541 30 0.7694607 0.0966022
BST00325 Proportion of males aged 16+ who worked in 1999 - block group
12541 30 0.7732870 0.1100157
CST00326 Proportion of males aged 16+ who usually worked 35 hours or more per week for 48 weeks or more in 1999 - county
12571 0 0.5297942 0.0663917
TST00326 Proportion of males aged 16+ who usually worked 35 hours or more per week for 48 weeks or more in 1999 - tract
12541 30 0.5286326 0.1199882
BST00326 Proportion of males aged 16+ who usually worked 35 hours or more per week for 48 weeks or more in 1999 - block group
12296 275 0.5380163 0.1296351
CST00327 Among males aged 16+ who worked in 1999, proportion who usually worked 35+ hours per week for 48+ weeks - county
12571 0 0.6904761 0.0532819
TST00327 Among males aged 16+ who worked in 1999, proportion who usually worked 35+ hours per week for 48+ weeks - tract
12466 105 0.6818876 0.1036385
BST00327 Among males aged 16+ who worked in 1999, proportion who usually worked 35+ hours per week for 48+ weeks - block group
11721 850 0.6883978 0.1196716
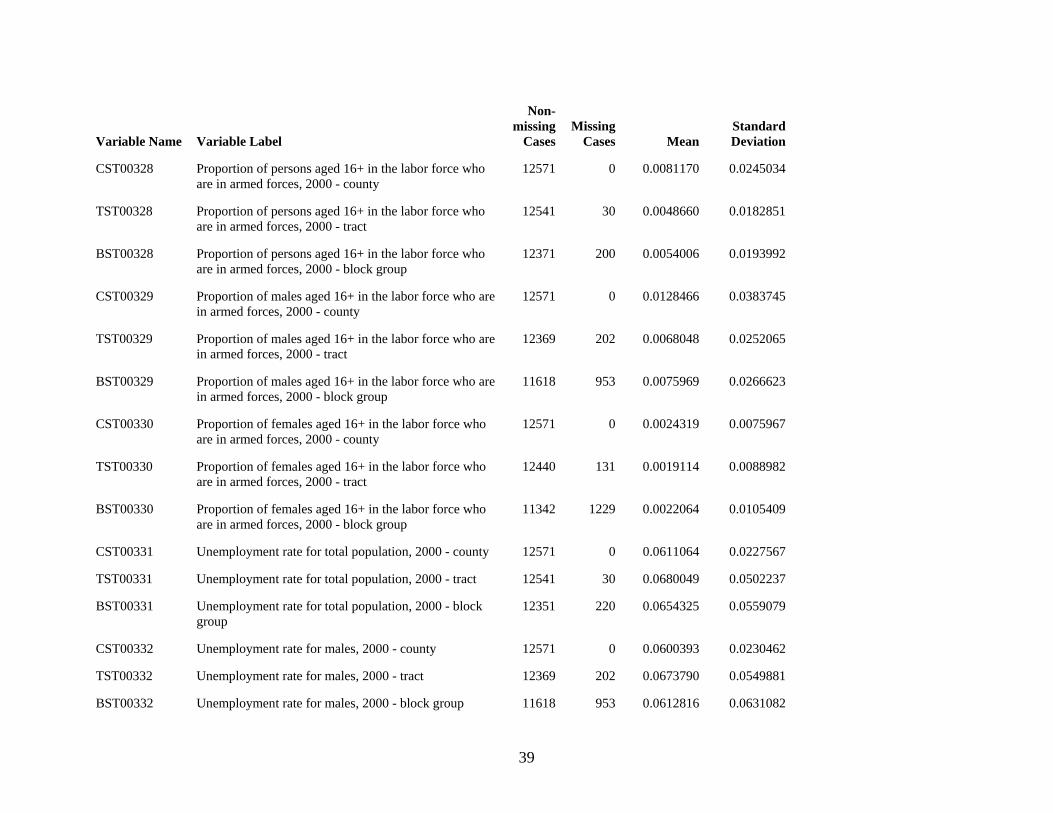
39
Variable Name Variable Label
Non-missing
CasesMissing
Cases MeanStandard Deviation
CST00328 Proportion of persons aged 16+ in the labor force who are in armed forces, 2000 - county
12571 0 0.0081170 0.0245034
TST00328 Proportion of persons aged 16+ in the labor force who are in armed forces, 2000 - tract
12541 30 0.0048660 0.0182851
BST00328 Proportion of persons aged 16+ in the labor force who are in armed forces, 2000 - block group
12371 200 0.0054006 0.0193992
CST00329 Proportion of males aged 16+ in the labor force who are in armed forces, 2000 - county
12571 0 0.0128466 0.0383745
TST00329 Proportion of males aged 16+ in the labor force who are in armed forces, 2000 - tract
12369 202 0.0068048 0.0252065
BST00329 Proportion of males aged 16+ in the labor force who are in armed forces, 2000 - block group
11618 953 0.0075969 0.0266623
CST00330 Proportion of females aged 16+ in the labor force who are in armed forces, 2000 - county
12571 0 0.0024319 0.0075967
TST00330 Proportion of females aged 16+ in the labor force who are in armed forces, 2000 - tract
12440 131 0.0019114 0.0088982
BST00330 Proportion of females aged 16+ in the labor force who are in armed forces, 2000 - block group
11342 1229 0.0022064 0.0105409
CST00331 Unemployment rate for total population, 2000 - county 12571 0 0.0611064 0.0227567
TST00331 Unemployment rate for total population, 2000 - tract 12541 30 0.0680049 0.0502237
BST00331 Unemployment rate for total population, 2000 - block group
12351 220 0.0654325 0.0559079
CST00332 Unemployment rate for males, 2000 - county 12571 0 0.0600393 0.0230462
TST00332 Unemployment rate for males, 2000 - tract 12369 202 0.0673790 0.0549881
BST00332 Unemployment rate for males, 2000 - block group 11618 953 0.0612816 0.0631082
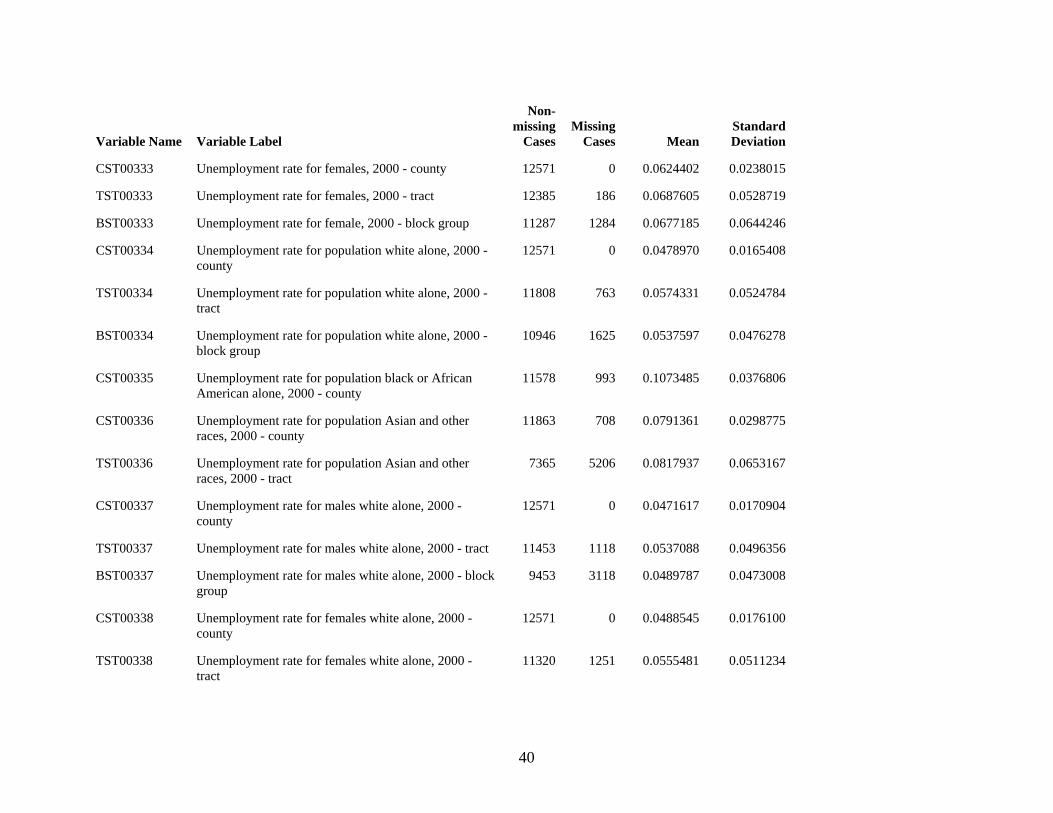
40
Variable Name Variable Label
Non-missing
CasesMissing
Cases MeanStandard Deviation
CST00333 Unemployment rate for females, 2000 - county 12571 0 0.0624402 0.0238015
TST00333 Unemployment rate for females, 2000 - tract 12385 186 0.0687605 0.0528719
BST00333 Unemployment rate for female, 2000 - block group 11287 1284 0.0677185 0.0644246
CST00334 Unemployment rate for population white alone, 2000 - county
12571 0 0.0478970 0.0165408
TST00334 Unemployment rate for population white alone, 2000 - tract
11808 763 0.0574331 0.0524784
BST00334 Unemployment rate for population white alone, 2000 - block group
10946 1625 0.0537597 0.0476278
CST00335 Unemployment rate for population black or African American alone, 2000 - county
11578 993 0.1073485 0.0376806
CST00336 Unemployment rate for population Asian and other races, 2000 - county
11863 708 0.0791361 0.0298775
TST00336 Unemployment rate for population Asian and other races, 2000 - tract
7365 5206 0.0817937 0.0653167
CST00337 Unemployment rate for males white alone, 2000 - county
12571 0 0.0471617 0.0170904
TST00337 Unemployment rate for males white alone, 2000 - tract 11453 1118 0.0537088 0.0496356
BST00337 Unemployment rate for males white alone, 2000 - block group
9453 3118 0.0489787 0.0473008
CST00338 Unemployment rate for females white alone, 2000 - county
12571 0 0.0488545 0.0176100
TST00338 Unemployment rate for females white alone, 2000 - tract
11320 1251 0.0555481 0.0511234
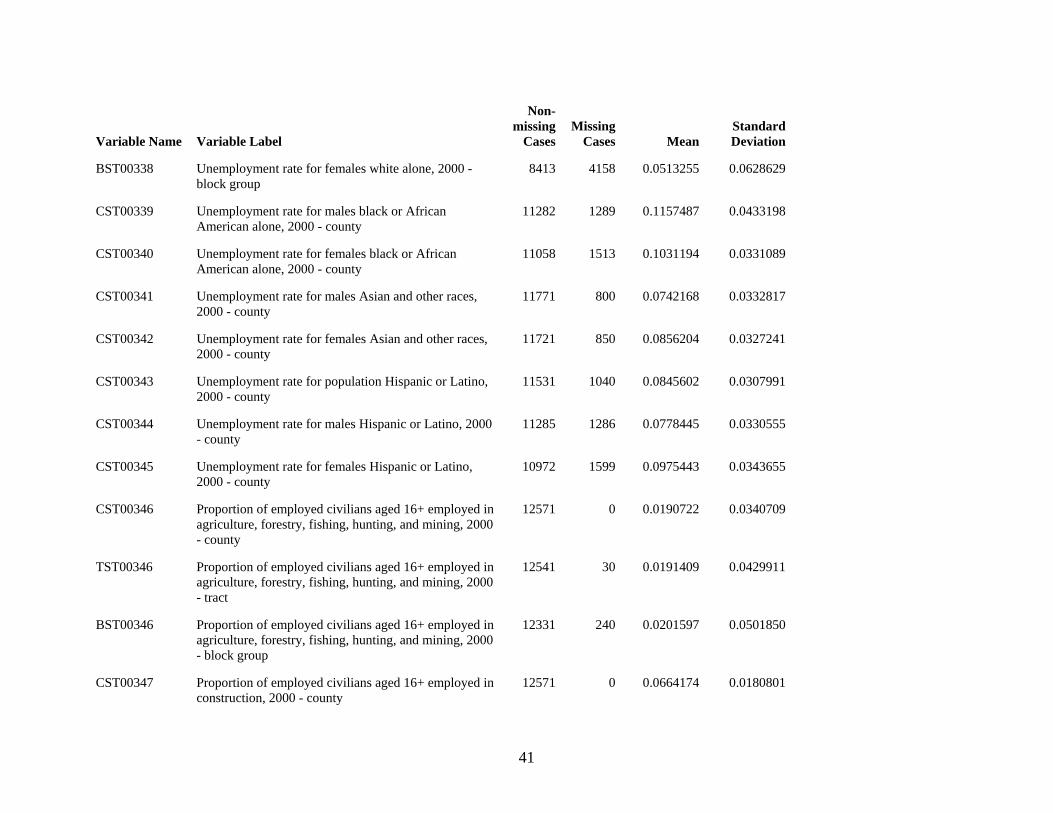
41
Variable Name Variable Label
Non-missing
CasesMissing
Cases MeanStandard Deviation
BST00338 Unemployment rate for females white alone, 2000 - block group
8413 4158 0.0513255 0.0628629
CST00339 Unemployment rate for males black or African American alone, 2000 - county
11282 1289 0.1157487 0.0433198
CST00340 Unemployment rate for females black or African American alone, 2000 - county
11058 1513 0.1031194 0.0331089
CST00341 Unemployment rate for males Asian and other races, 2000 - county
11771 800 0.0742168 0.0332817
CST00342 Unemployment rate for females Asian and other races, 2000 - county
11721 850 0.0856204 0.0327241
CST00343 Unemployment rate for population Hispanic or Latino, 2000 - county
11531 1040 0.0845602 0.0307991
CST00344 Unemployment rate for males Hispanic or Latino, 2000 - county
11285 1286 0.0778445 0.0330555
CST00345 Unemployment rate for females Hispanic or Latino, 2000 - county
10972 1599 0.0975443 0.0343655
CST00346 Proportion of employed civilians aged 16+ employed in agriculture, forestry, fishing, hunting, and mining, 2000 - county
12571 0 0.0190722 0.0340709
TST00346 Proportion of employed civilians aged 16+ employed in agriculture, forestry, fishing, hunting, and mining, 2000 - tract
12541 30 0.0191409 0.0429911
BST00346 Proportion of employed civilians aged 16+ employed in agriculture, forestry, fishing, hunting, and mining, 2000 - block group
12331 240 0.0201597 0.0501850
CST00347 Proportion of employed civilians aged 16+ employed in construction, 2000 - county
12571 0 0.0664174 0.0180801
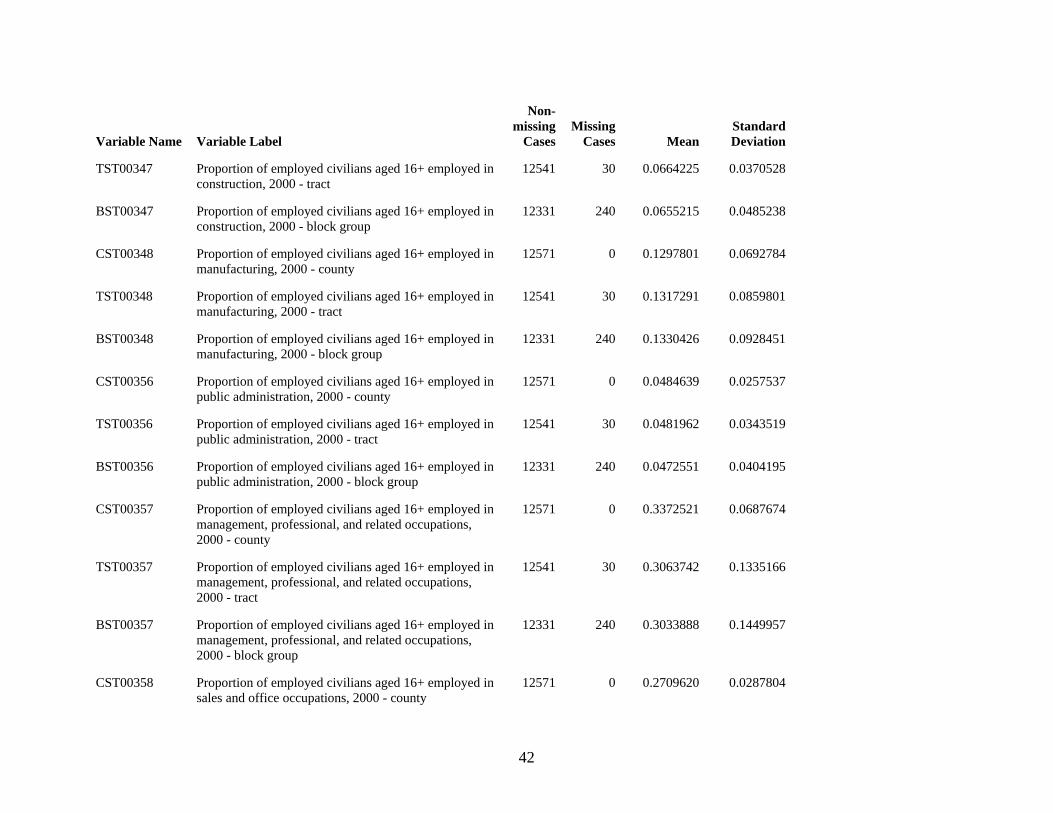
42
Variable Name Variable Label
Non-missing
CasesMissing
Cases MeanStandard Deviation
TST00347 Proportion of employed civilians aged 16+ employed in construction, 2000 - tract
12541 30 0.0664225 0.0370528
BST00347 Proportion of employed civilians aged 16+ employed in construction, 2000 - block group
12331 240 0.0655215 0.0485238
CST00348 Proportion of employed civilians aged 16+ employed in manufacturing, 2000 - county
12571 0 0.1297801 0.0692784
TST00348 Proportion of employed civilians aged 16+ employed in manufacturing, 2000 - tract
12541 30 0.1317291 0.0859801
BST00348 Proportion of employed civilians aged 16+ employed in manufacturing, 2000 - block group
12331 240 0.1330426 0.0928451
CST00356 Proportion of employed civilians aged 16+ employed in public administration, 2000 - county
12571 0 0.0484639 0.0257537
TST00356 Proportion of employed civilians aged 16+ employed in public administration, 2000 - tract
12541 30 0.0481962 0.0343519
BST00356 Proportion of employed civilians aged 16+ employed in public administration, 2000 - block group
12331 240 0.0472551 0.0404195
CST00357 Proportion of employed civilians aged 16+ employed in management, professional, and related occupations, 2000 - county
12571 0 0.3372521 0.0687674
TST00357 Proportion of employed civilians aged 16+ employed in management, professional, and related occupations, 2000 - tract
12541 30 0.3063742 0.1335166
BST00357 Proportion of employed civilians aged 16+ employed in management, professional, and related occupations, 2000 - block group
12331 240 0.3033888 0.1449957
CST00358 Proportion of employed civilians aged 16+ employed in sales and office occupations, 2000 - county
12571 0 0.2709620 0.0287804
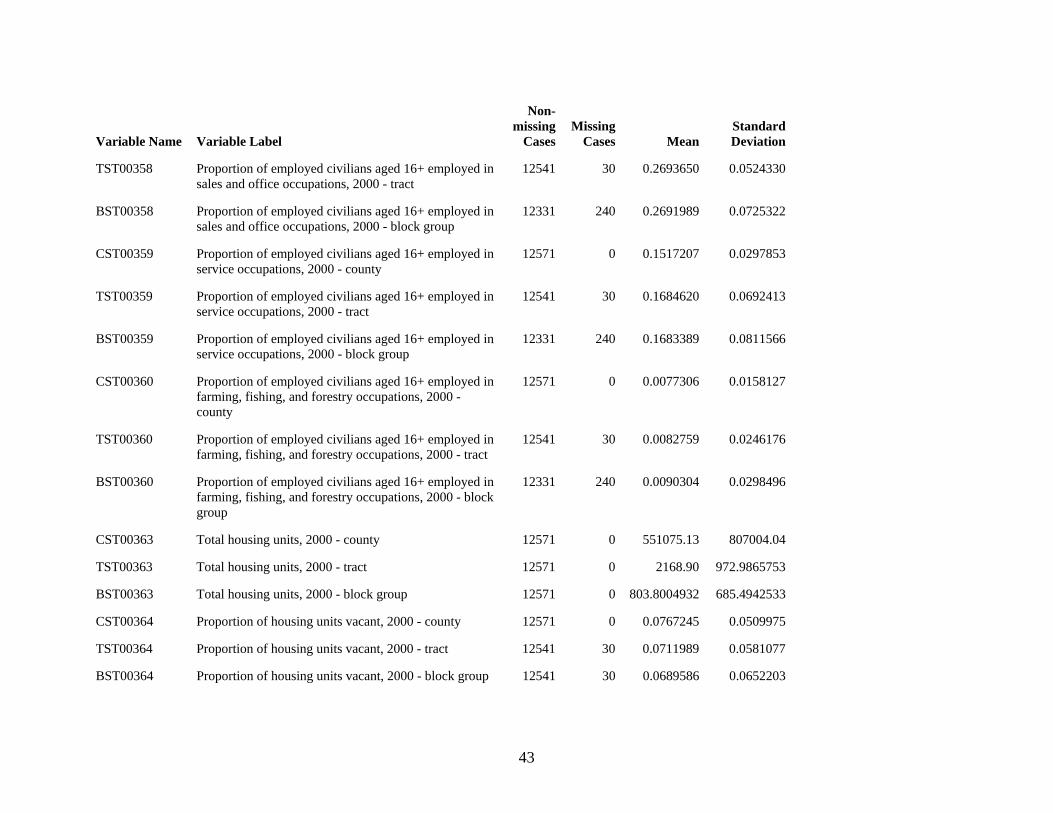
43
Variable Name Variable Label
Non-missing
CasesMissing
Cases MeanStandard Deviation
TST00358 Proportion of employed civilians aged 16+ employed in sales and office occupations, 2000 - tract
12541 30 0.2693650 0.0524330
BST00358 Proportion of employed civilians aged 16+ employed in sales and office occupations, 2000 - block group
12331 240 0.2691989 0.0725322
CST00359 Proportion of employed civilians aged 16+ employed in service occupations, 2000 - county
12571 0 0.1517207 0.0297853
TST00359 Proportion of employed civilians aged 16+ employed in service occupations, 2000 - tract
12541 30 0.1684620 0.0692413
BST00359 Proportion of employed civilians aged 16+ employed in service occupations, 2000 - block group
12331 240 0.1683389 0.0811566
CST00360 Proportion of employed civilians aged 16+ employed in farming, fishing, and forestry occupations, 2000 - county
12571 0 0.0077306 0.0158127
TST00360 Proportion of employed civilians aged 16+ employed in farming, fishing, and forestry occupations, 2000 - tract
12541 30 0.0082759 0.0246176
BST00360 Proportion of employed civilians aged 16+ employed in farming, fishing, and forestry occupations, 2000 - block group
12331 240 0.0090304 0.0298496
CST00363 Total housing units, 2000 - county 12571 0 551075.13 807004.04
TST00363 Total housing units, 2000 - tract 12571 0 2168.90 972.9865753
BST00363 Total housing units, 2000 - block group 12571 0 803.8004932 685.4942533
CST00364 Proportion of housing units vacant, 2000 - county 12571 0 0.0767245 0.0509975
TST00364 Proportion of housing units vacant, 2000 - tract 12541 30 0.0711989 0.0581077
BST00364 Proportion of housing units vacant, 2000 - block group 12541 30 0.0689586 0.0652203
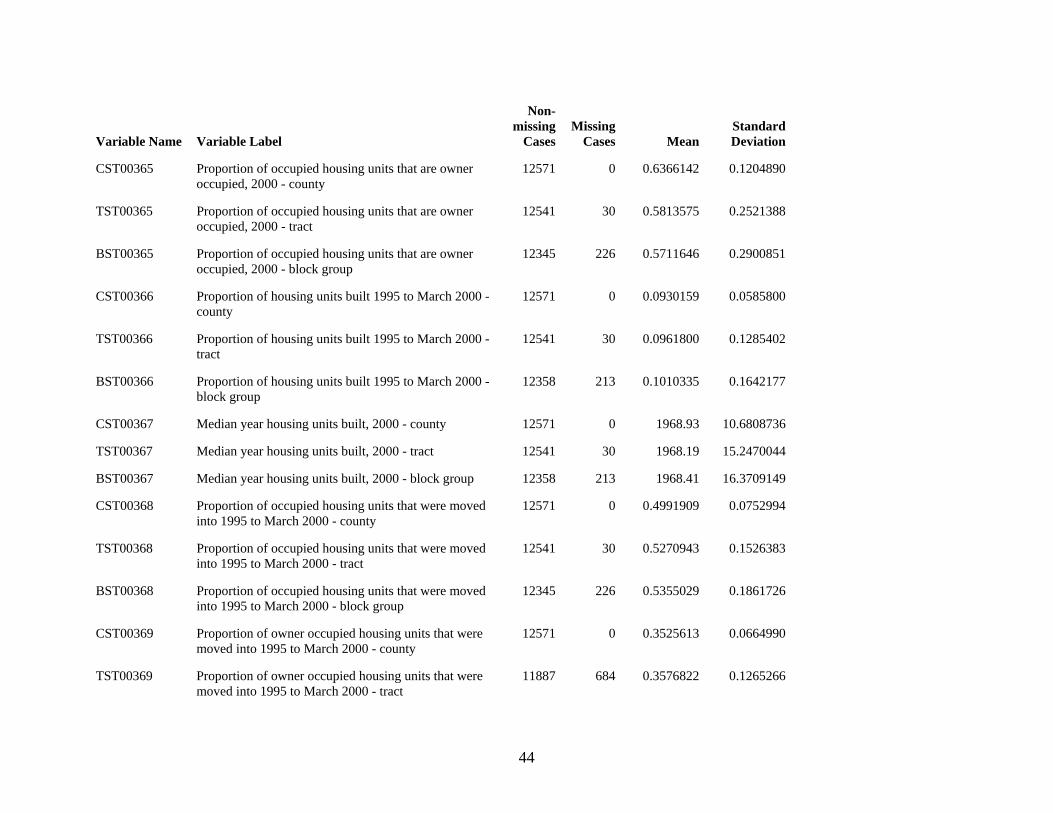
44
Variable Name Variable Label
Non-missing
CasesMissing
Cases MeanStandard Deviation
CST00365 Proportion of occupied housing units that are owner occupied, 2000 - county
12571 0 0.6366142 0.1204890
TST00365 Proportion of occupied housing units that are owner occupied, 2000 - tract
12541 30 0.5813575 0.2521388
BST00365 Proportion of occupied housing units that are owner occupied, 2000 - block group
12345 226 0.5711646 0.2900851
CST00366 Proportion of housing units built 1995 to March 2000 - county
12571 0 0.0930159 0.0585800
TST00366 Proportion of housing units built 1995 to March 2000 - tract
12541 30 0.0961800 0.1285402
BST00366 Proportion of housing units built 1995 to March 2000 - block group
12358 213 0.1010335 0.1642177
CST00367 Median year housing units built, 2000 - county 12571 0 1968.93 10.6808736
TST00367 Median year housing units built, 2000 - tract 12541 30 1968.19 15.2470044
BST00367 Median year housing units built, 2000 - block group 12358 213 1968.41 16.3709149
CST00368 Proportion of occupied housing units that were moved into 1995 to March 2000 - county
12571 0 0.4991909 0.0752994
TST00368 Proportion of occupied housing units that were moved into 1995 to March 2000 - tract
12541 30 0.5270943 0.1526383
BST00368 Proportion of occupied housing units that were moved into 1995 to March 2000 - block group
12345 226 0.5355029 0.1861726
CST00369 Proportion of owner occupied housing units that were moved into 1995 to March 2000 - county
12571 0 0.3525613 0.0664990
TST00369 Proportion of owner occupied housing units that were moved into 1995 to March 2000 - tract
11887 684 0.3576822 0.1265266
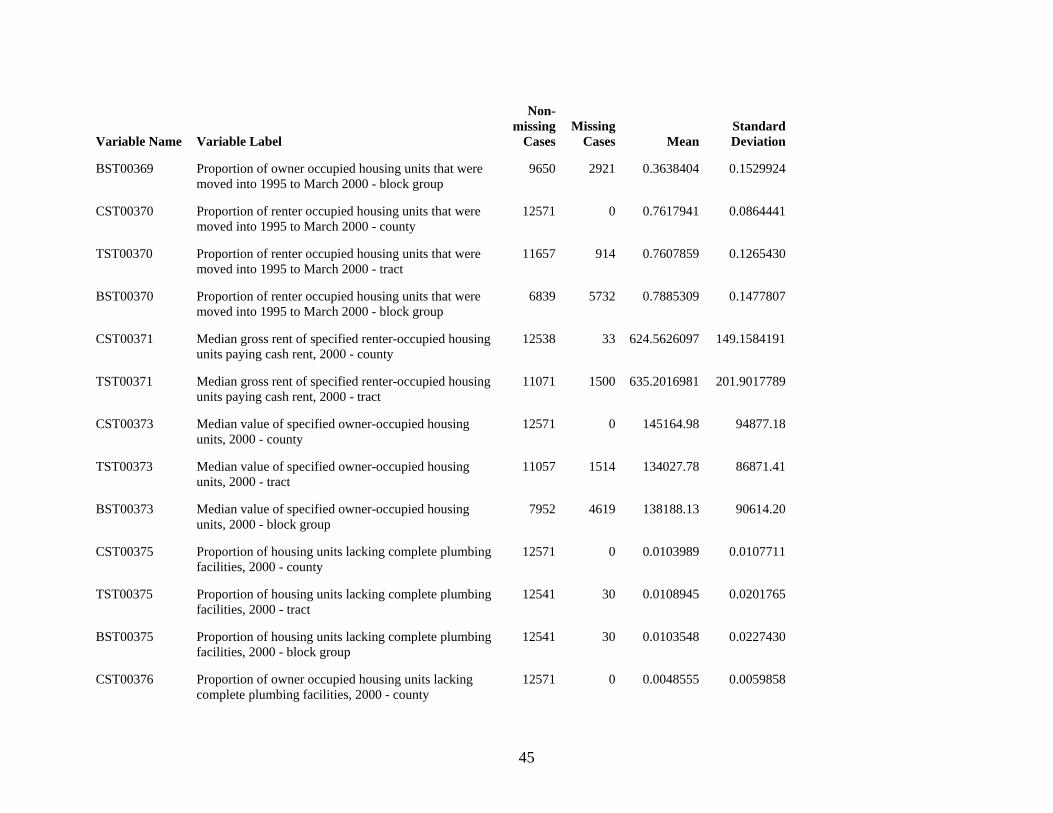
45
Variable Name Variable Label
Non-missing
CasesMissing
Cases MeanStandard Deviation
BST00369 Proportion of owner occupied housing units that were moved into 1995 to March 2000 - block group
9650 2921 0.3638404 0.1529924
CST00370 Proportion of renter occupied housing units that were moved into 1995 to March 2000 - county
12571 0 0.7617941 0.0864441
TST00370 Proportion of renter occupied housing units that were moved into 1995 to March 2000 - tract
11657 914 0.7607859 0.1265430
BST00370 Proportion of renter occupied housing units that were moved into 1995 to March 2000 - block group
6839 5732 0.7885309 0.1477807
CST00371 Median gross rent of specified renter-occupied housing units paying cash rent, 2000 - county
12538 33 624.5626097 149.1584191
TST00371 Median gross rent of specified renter-occupied housing units paying cash rent, 2000 - tract
11071 1500 635.2016981 201.9017789
CST00373 Median value of specified owner-occupied housing units, 2000 - county
12571 0 145164.98 94877.18
TST00373 Median value of specified owner-occupied housing units, 2000 - tract
11057 1514 134027.78 86871.41
BST00373 Median value of specified owner-occupied housing units, 2000 - block group
7952 4619 138188.13 90614.20
CST00375 Proportion of housing units lacking complete plumbing facilities, 2000 - county
12571 0 0.0103989 0.0107711
TST00375 Proportion of housing units lacking complete plumbing facilities, 2000 - tract
12541 30 0.0108945 0.0201765
BST00375 Proportion of housing units lacking complete plumbing facilities, 2000 - block group
12541 30 0.0103548 0.0227430
CST00376 Proportion of owner occupied housing units lacking complete plumbing facilities, 2000 - county
12571 0 0.0048555 0.0059858
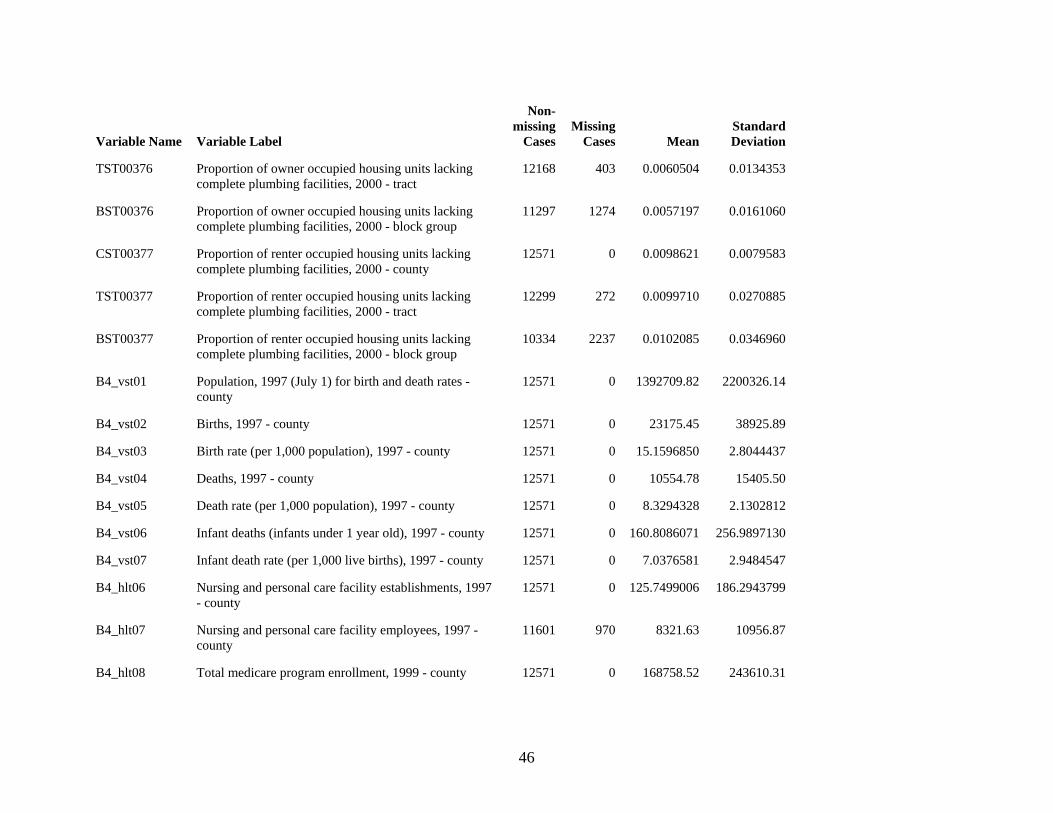
46
Variable Name Variable Label
Non-missing
CasesMissing
Cases MeanStandard Deviation
TST00376 Proportion of owner occupied housing units lacking complete plumbing facilities, 2000 - tract
12168 403 0.0060504 0.0134353
BST00376 Proportion of owner occupied housing units lacking complete plumbing facilities, 2000 - block group
11297 1274 0.0057197 0.0161060
CST00377 Proportion of renter occupied housing units lacking complete plumbing facilities, 2000 - county
12571 0 0.0098621 0.0079583
TST00377 Proportion of renter occupied housing units lacking complete plumbing facilities, 2000 - tract
12299 272 0.0099710 0.0270885
BST00377 Proportion of renter occupied housing units lacking complete plumbing facilities, 2000 - block group
10334 2237 0.0102085 0.0346960
B4_vst01 Population, 1997 (July 1) for birth and death rates - county
12571 0 1392709.82 2200326.14
B4_vst02 Births, 1997 - county 12571 0 23175.45 38925.89
B4_vst03 Birth rate (per 1,000 population), 1997 - county 12571 0 15.1596850 2.8044437
B4_vst04 Deaths, 1997 - county 12571 0 10554.78 15405.50
B4_vst05 Death rate (per 1,000 population), 1997 - county 12571 0 8.3294328 2.1302812
B4_vst06 Infant deaths (infants under 1 year old), 1997 - county 12571 0 160.8086071 256.9897130
B4_vst07 Infant death rate (per 1,000 live births), 1997 - county 12571 0 7.0376581 2.9484547
B4_hlt06 Nursing and personal care facility establishments, 1997 - county
12571 0 125.7499006 186.2943799
B4_hlt07 Nursing and personal care facility employees, 1997 - county
11601 970 8321.63 10956.87
B4_hlt08 Total medicare program enrollment, 1999 - county 12571 0 168758.52 243610.31
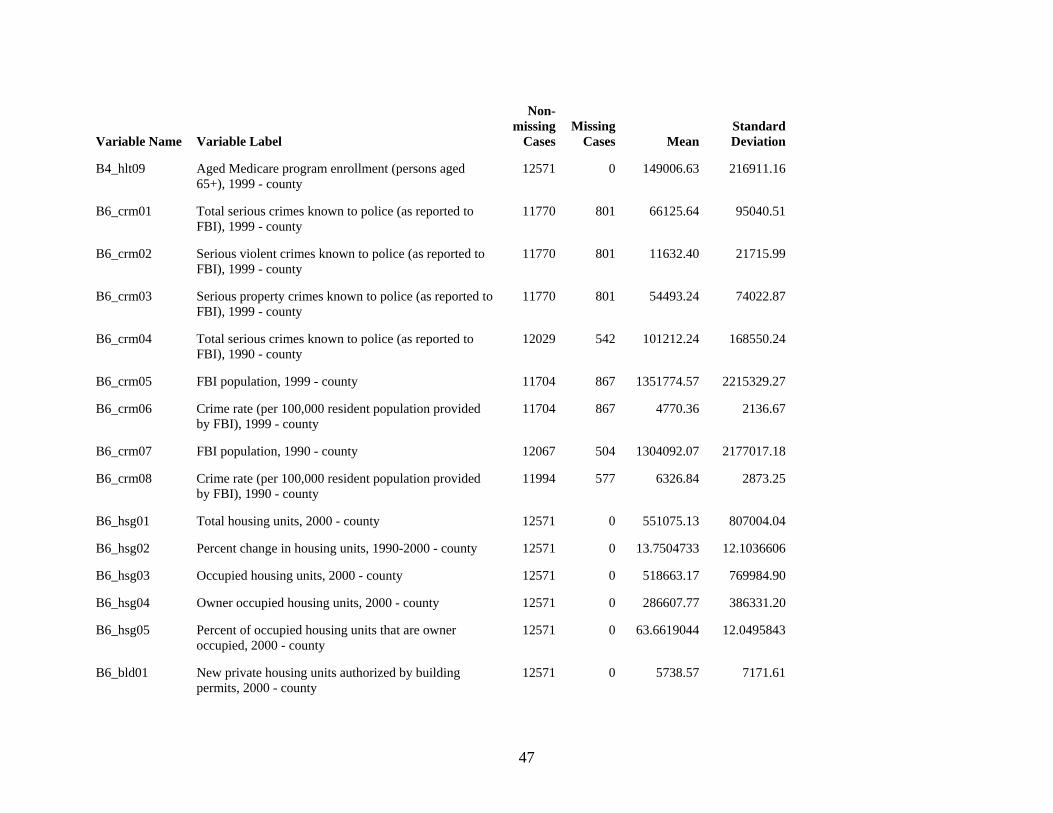
47
Variable Name Variable Label
Non-missing
CasesMissing
Cases MeanStandard Deviation
B4_hlt09 Aged Medicare program enrollment (persons aged 65+), 1999 - county
12571 0 149006.63 216911.16
B6_crm01 Total serious crimes known to police (as reported to FBI), 1999 - county
11770 801 66125.64 95040.51
B6_crm02 Serious violent crimes known to police (as reported to FBI), 1999 - county
11770 801 11632.40 21715.99
B6_crm03 Serious property crimes known to police (as reported to FBI), 1999 - county
11770 801 54493.24 74022.87
B6_crm04 Total serious crimes known to police (as reported to FBI), 1990 - county
12029 542 101212.24 168550.24
B6_crm05 FBI population, 1999 - county 11704 867 1351774.57 2215329.27
B6_crm06 Crime rate (per 100,000 resident population provided by FBI), 1999 - county
11704 867 4770.36 2136.67
B6_crm07 FBI population, 1990 - county 12067 504 1304092.07 2177017.18
B6_crm08 Crime rate (per 100,000 resident population provided by FBI), 1990 - county
11994 577 6326.84 2873.25
B6_hsg01 Total housing units, 2000 - county 12571 0 551075.13 807004.04
B6_hsg02 Percent change in housing units, 1990-2000 - county 12571 0 13.7504733 12.1036606
B6_hsg03 Occupied housing units, 2000 - county 12571 0 518663.17 769984.90
B6_hsg04 Owner occupied housing units, 2000 - county 12571 0 286607.77 386331.20
B6_hsg05 Percent of occupied housing units that are owner occupied, 2000 - county
12571 0 63.6619044 12.0495843
B6_bld01 New private housing units authorized by building permits, 2000 - county
12571 0 5738.57 7171.61
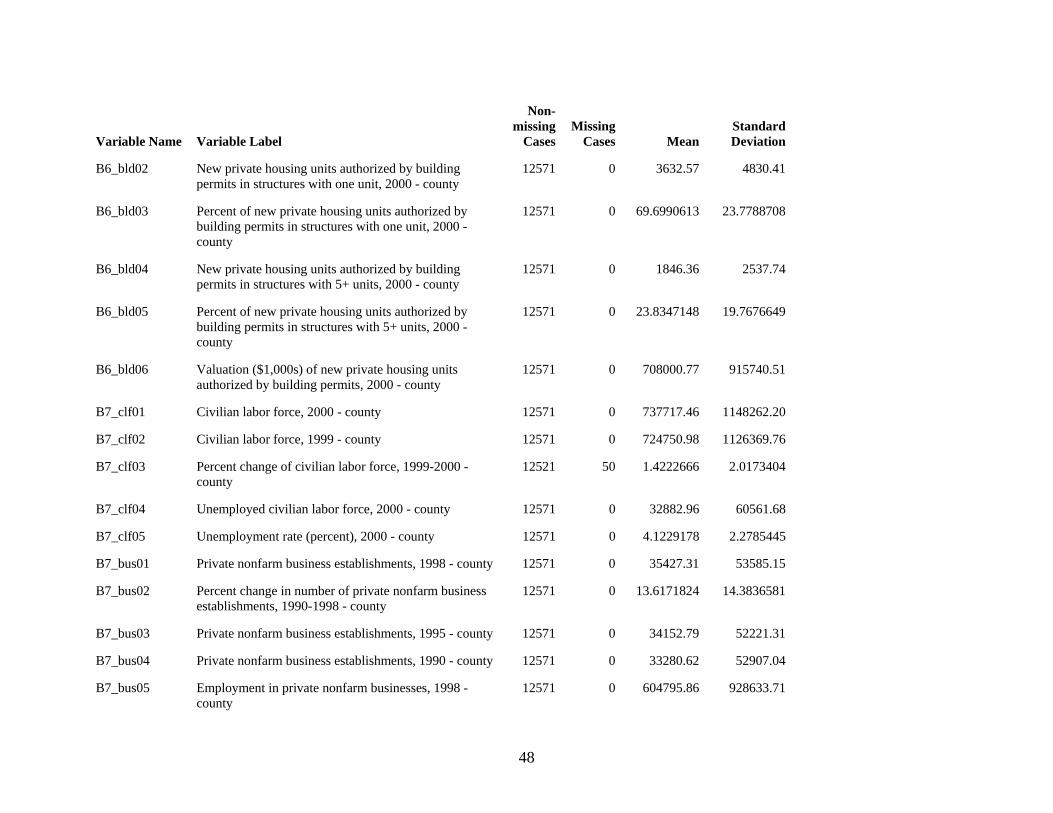
48
Variable Name Variable Label
Non-missing
CasesMissing
Cases MeanStandard Deviation
B6_bld02 New private housing units authorized by building permits in structures with one unit, 2000 - county
12571 0 3632.57 4830.41
B6_bld03 Percent of new private housing units authorized by building permits in structures with one unit, 2000 - county
12571 0 69.6990613 23.7788708
B6_bld04 New private housing units authorized by building permits in structures with 5+ units, 2000 - county
12571 0 1846.36 2537.74
B6_bld05 Percent of new private housing units authorized by building permits in structures with 5+ units, 2000 - county
12571 0 23.8347148 19.7676649
B6_bld06 Valuation ($1,000s) of new private housing units authorized by building permits, 2000 - county
12571 0 708000.77 915740.51
B7_clf01 Civilian labor force, 2000 - county 12571 0 737717.46 1148262.20
B7_clf02 Civilian labor force, 1999 - county 12571 0 724750.98 1126369.76
B7_clf03 Percent change of civilian labor force, 1999-2000 - county
12521 50 1.4222666 2.0173404
B7_clf04 Unemployed civilian labor force, 2000 - county 12571 0 32882.96 60561.68
B7_clf05 Unemployment rate (percent), 2000 - county 12571 0 4.1229178 2.2785445
B7_bus01 Private nonfarm business establishments, 1998 - county 12571 0 35427.31 53585.15
B7_bus02 Percent change in number of private nonfarm business establishments, 1990-1998 - county
12571 0 13.6171824 14.3836581
B7_bus03 Private nonfarm business establishments, 1995 - county 12571 0 34152.79 52221.31
B7_bus04 Private nonfarm business establishments, 1990 - county 12571 0 33280.62 52907.04
B7_bus05 Employment in private nonfarm businesses, 1998 - county
12571 0 604795.86 928633.71
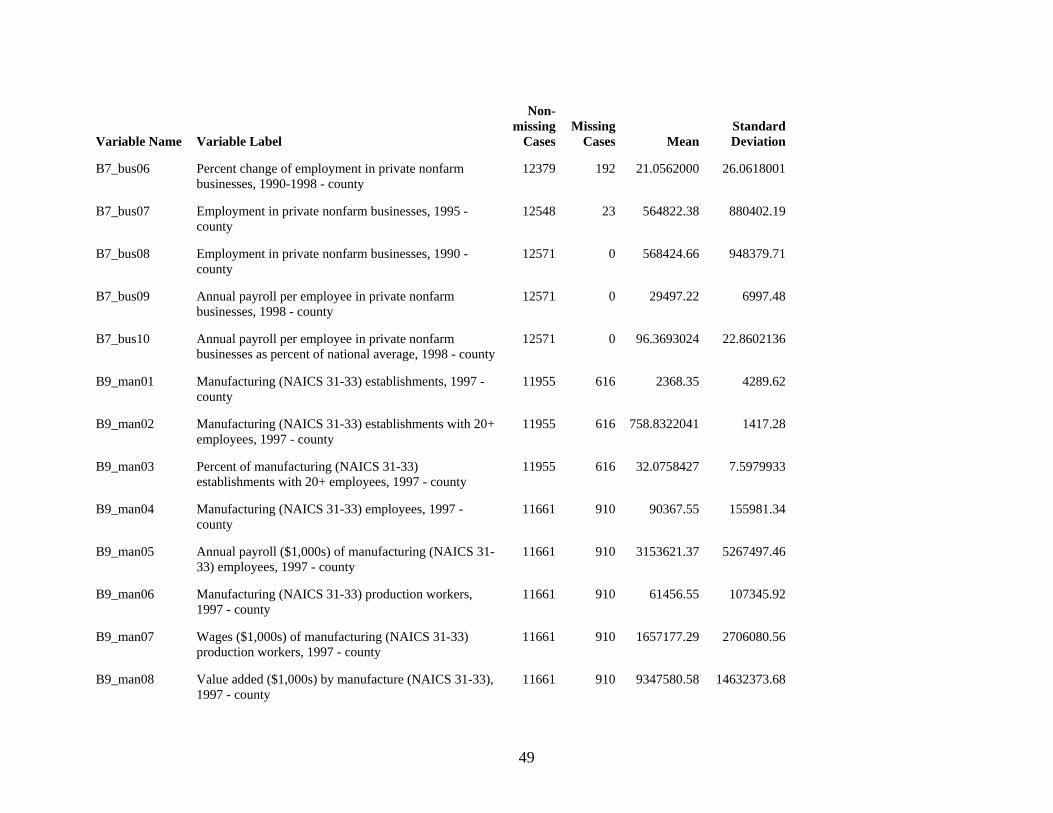
49
Variable Name Variable Label
Non-missing
CasesMissing
Cases MeanStandard Deviation
B7_bus06 Percent change of employment in private nonfarm businesses, 1990-1998 - county
12379 192 21.0562000 26.0618001
B7_bus07 Employment in private nonfarm businesses, 1995 - county
12548 23 564822.38 880402.19
B7_bus08 Employment in private nonfarm businesses, 1990 - county
12571 0 568424.66 948379.71
B7_bus09 Annual payroll per employee in private nonfarm businesses, 1998 - county
12571 0 29497.22 6997.48
B7_bus10 Annual payroll per employee in private nonfarm businesses as percent of national average, 1998 - county
12571 0 96.3693024 22.8602136
B9_man01 Manufacturing (NAICS 31-33) establishments, 1997 - county
11955 616 2368.35 4289.62
B9_man02 Manufacturing (NAICS 31-33) establishments with 20+ employees, 1997 - county
11955 616 758.8322041 1417.28
B9_man03 Percent of manufacturing (NAICS 31-33) establishments with 20+ employees, 1997 - county
11955 616 32.0758427 7.5979933
B9_man04 Manufacturing (NAICS 31-33) employees, 1997 - county
11661 910 90367.55 155981.34
B9_man05 Annual payroll ($1,000s) of manufacturing (NAICS 31-33) employees, 1997 - county
11661 910 3153621.37 5267497.46
B9_man06 Manufacturing (NAICS 31-33) production workers, 1997 - county
11661 910 61456.55 107345.92
B9_man07 Wages ($1,000s) of manufacturing (NAICS 31-33) production workers, 1997 - county
11661 910 1657177.29 2706080.56
B9_man08 Value added ($1,000s) by manufacture (NAICS 31-33), 1997 - county
11661 910 9347580.58 14632373.68
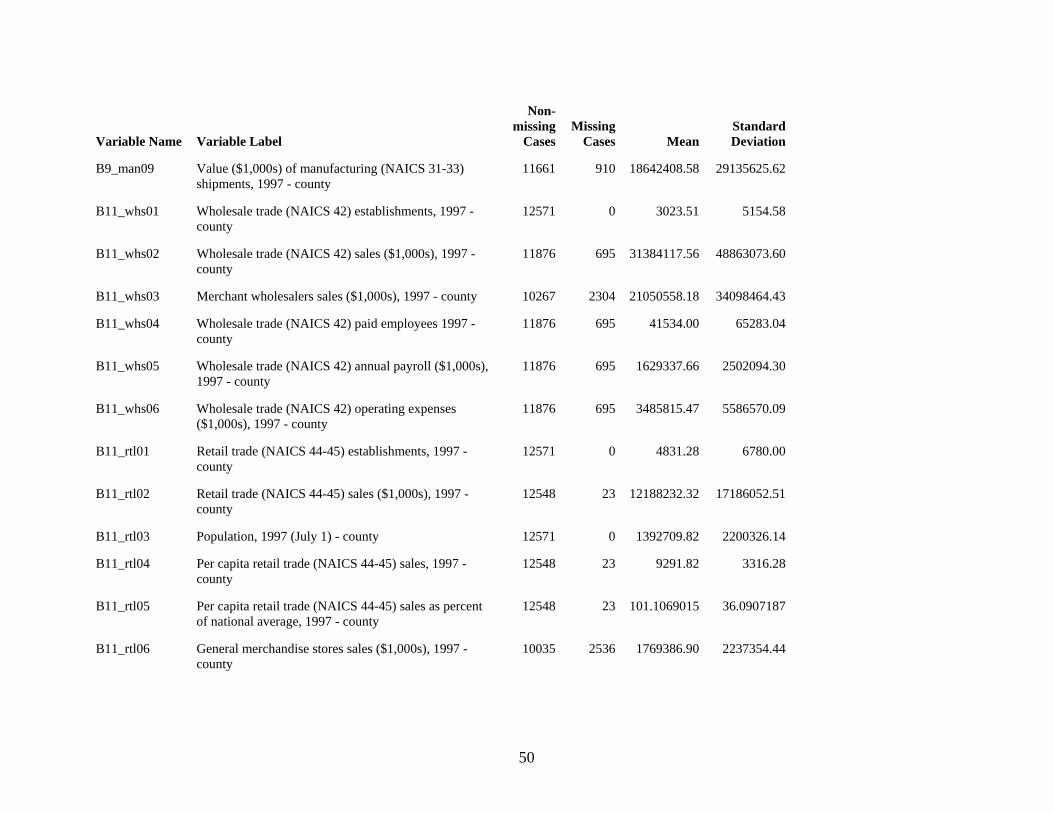
50
Variable Name Variable Label
Non-missing
CasesMissing
Cases MeanStandard Deviation
B9_man09 Value ($1,000s) of manufacturing (NAICS 31-33) shipments, 1997 - county
11661 910 18642408.58 29135625.62
B11_whs01 Wholesale trade (NAICS 42) establishments, 1997 - county
12571 0 3023.51 5154.58
B11_whs02 Wholesale trade (NAICS 42) sales ($1,000s), 1997 - county
11876 695 31384117.56 48863073.60
B11_whs03 Merchant wholesalers sales ($1,000s), 1997 - county 10267 2304 21050558.18 34098464.43
B11_whs04 Wholesale trade (NAICS 42) paid employees 1997 - county
11876 695 41534.00 65283.04
B11_whs05 Wholesale trade (NAICS 42) annual payroll ($1,000s), 1997 - county
11876 695 1629337.66 2502094.30
B11_whs06 Wholesale trade (NAICS 42) operating expenses ($1,000s), 1997 - county
11876 695 3485815.47 5586570.09
B11_rtl01 Retail trade (NAICS 44-45) establishments, 1997 - county
12571 0 4831.28 6780.00
B11_rtl02 Retail trade (NAICS 44-45) sales ($1,000s), 1997 - county
12548 23 12188232.32 17186052.51
B11_rtl03 Population, 1997 (July 1) - county 12571 0 1392709.82 2200326.14
B11_rtl04 Per capita retail trade (NAICS 44-45) sales, 1997 - county
12548 23 9291.82 3316.28
B11_rtl05 Per capita retail trade (NAICS 44-45) sales as percent of national average, 1997 - county
12548 23 101.1069015 36.0907187
B11_rtl06 General merchandise stores sales ($1,000s), 1997 - county
10035 2536 1769386.90 2237354.44
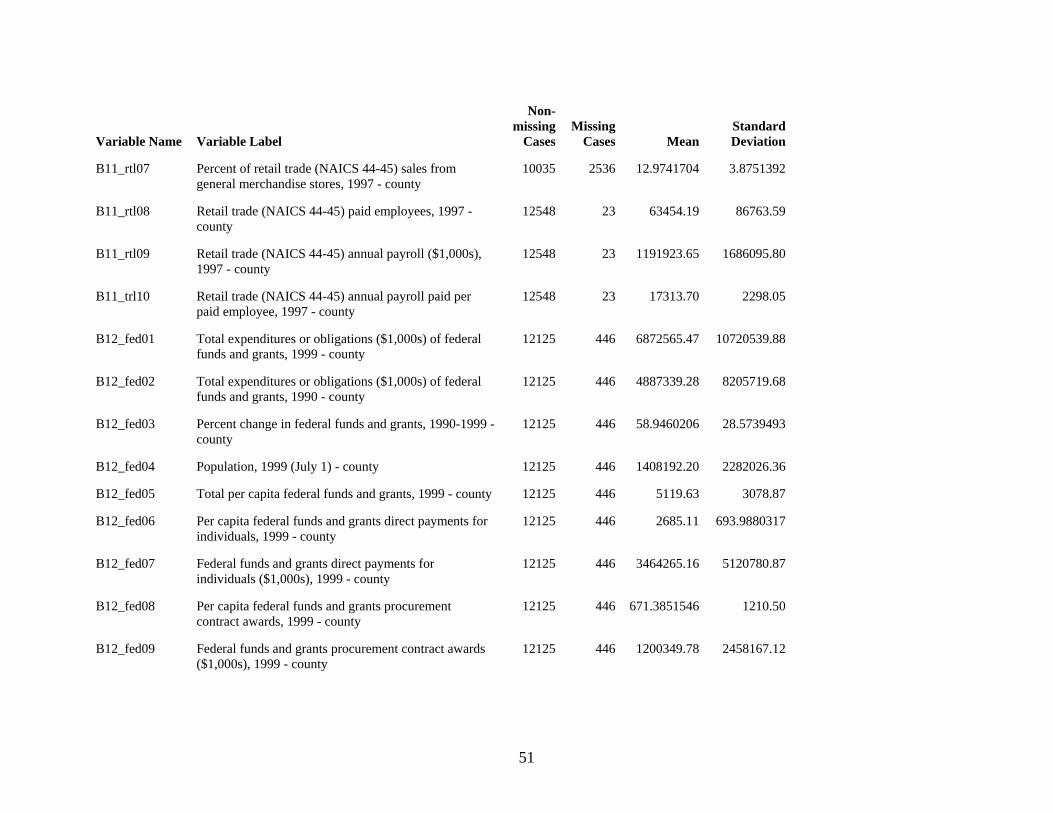
51
Variable Name Variable Label
Non-missing
CasesMissing
Cases MeanStandard Deviation
B11_rtl07 Percent of retail trade (NAICS 44-45) sales from general merchandise stores, 1997 - county
10035 2536 12.9741704 3.8751392
B11_rtl08 Retail trade (NAICS 44-45) paid employees, 1997 - county
12548 23 63454.19 86763.59
B11_rtl09 Retail trade (NAICS 44-45) annual payroll ($1,000s), 1997 - county
12548 23 1191923.65 1686095.80
B11_trl10 Retail trade (NAICS 44-45) annual payroll paid per paid employee, 1997 - county
12548 23 17313.70 2298.05
B12_fed01 Total expenditures or obligations ($1,000s) of federal funds and grants, 1999 - county
12125 446 6872565.47 10720539.88
B12_fed02 Total expenditures or obligations ($1,000s) of federal funds and grants, 1990 - county
12125 446 4887339.28 8205719.68
B12_fed03 Percent change in federal funds and grants, 1990-1999 - county
12125 446 58.9460206 28.5739493
B12_fed04 Population, 1999 (July 1) - county 12125 446 1408192.20 2282026.36
B12_fed05 Total per capita federal funds and grants, 1999 - county 12125 446 5119.63 3078.87
B12_fed06 Per capita federal funds and grants direct payments for individuals, 1999 - county
12125 446 2685.11 693.9880317
B12_fed07 Federal funds and grants direct payments for individuals ($1,000s), 1999 - county
12125 446 3464265.16 5120780.87
B12_fed08 Per capita federal funds and grants procurement contract awards, 1999 - county
12125 446 671.3851546 1210.50
B12_fed09 Federal funds and grants procurement contract awards ($1,000s), 1999 - county
12125 446 1200349.78 2458167.12
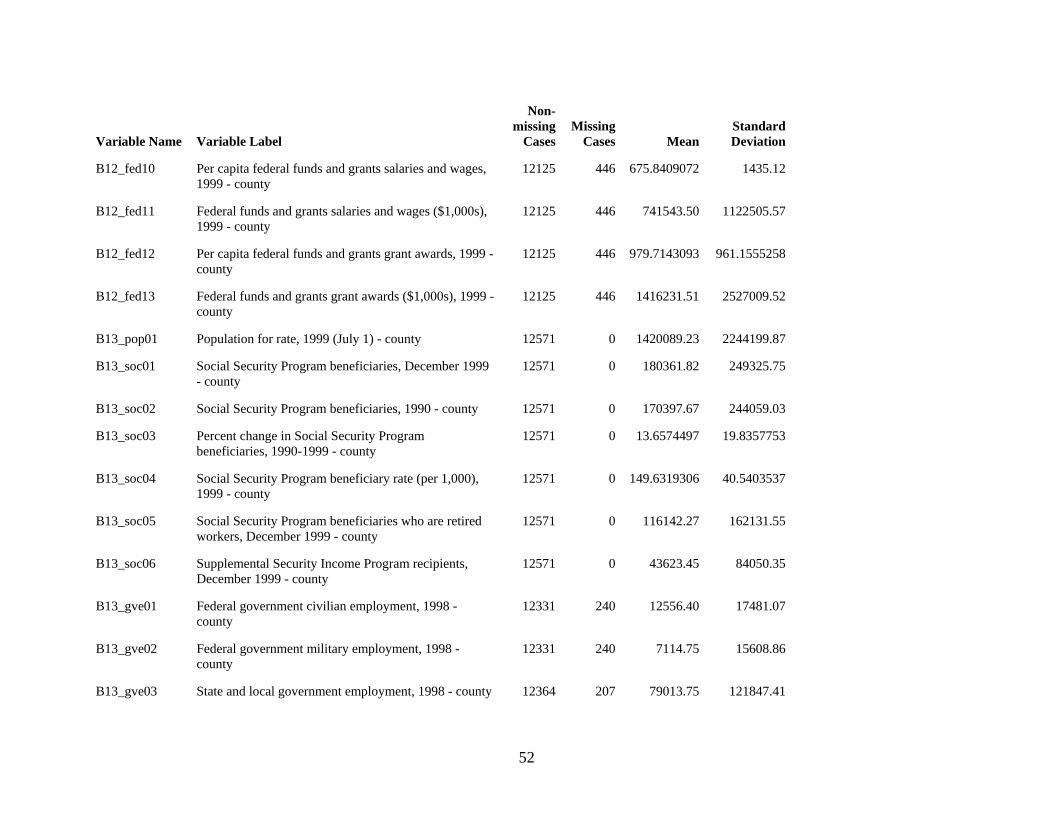
52
Variable Name Variable Label
Non-missing
CasesMissing
Cases MeanStandard Deviation
B12_fed10 Per capita federal funds and grants salaries and wages, 1999 - county
12125 446 675.8409072 1435.12
B12_fed11 Federal funds and grants salaries and wages ($1,000s), 1999 - county
12125 446 741543.50 1122505.57
B12_fed12 Per capita federal funds and grants grant awards, 1999 - county
12125 446 979.7143093 961.1555258
B12_fed13 Federal funds and grants grant awards ($1,000s), 1999 - county
12125 446 1416231.51 2527009.52
B13_pop01 Population for rate, 1999 (July 1) - county 12571 0 1420089.23 2244199.87
B13_soc01 Social Security Program beneficiaries, December 1999 - county
12571 0 180361.82 249325.75
B13_soc02 Social Security Program beneficiaries, 1990 - county 12571 0 170397.67 244059.03
B13_soc03 Percent change in Social Security Program beneficiaries, 1990-1999 - county
12571 0 13.6574497 19.8357753
B13_soc04 Social Security Program beneficiary rate (per 1,000), 1999 - county
12571 0 149.6319306 40.5403537
B13_soc05 Social Security Program beneficiaries who are retired workers, December 1999 - county
12571 0 116142.27 162131.55
B13_soc06 Supplemental Security Income Program recipients, December 1999 - county
12571 0 43623.45 84050.35
B13_gve01 Federal government civilian employment, 1998 - county
12331 240 12556.40 17481.07
B13_gve02 Federal government military employment, 1998 - county
12331 240 7114.75 15608.86
B13_gve03 State and local government employment, 1998 - county 12364 207 79013.75 121847.41
53
Variable Name Variable Label
Non-missing
CasesMissing
Cases MeanStandard Deviation
B13_gve04 Local government employment, full time equivalent, March 1997 - county
12125 446 52788.02 86184.54
B13_gvf01 Local government general revenue ($1,000s), 1996-1997 - county
12125 446 4551613.81 8146795.92
B13_gvf02 Local government tax revenue ($1,000s), 1996-1997 - county
12125 446 1533806.35 2402195.19
B13_gvf03 Population, 1997 (July 1) - county 12125 446 1380096.60 2237178.12
B13_gvf04 Per capita local government tax revenue, 1996-1997 - county
12125 446 1022.55 498.5470122
B13_gvf05 Local government property tax revenue ($1,000s), 1996-1997 - county
12125 446 1094359.15 1655903.38
B13_gvf06 Percent of local government tax revenue from property tax, 1996-1997 - county
12125 446 74.5768247 15.9421306
B13_gvf07 Local government direct general expenditure ($1,000s), 1996-1997 - county
12125 446 4282474.19 7507117.88
abrate Grouped abortion rate per 1,000 women aged 15-44 (0: 0; 1: >0 to =5 to =20 to
12571 0 2.1646647 1.5202987
abhosp Any hospital abortion provider in 2000? (0=no; 1=yes) - county
12571 0 0.5938271 0.4911371
abclinic Any clinic abortion provider in 2000? (0=no; 1=yes) - county
12571 0 0.6784663 0.4670836
abphys Any other physician abortion provider in 2000? (0=no; 1=yes) - county
12571 0 0.4005250 0.4900243
abany Any abortion provider in 2000? (0=no; 1=yes) - county 12571 0 0.7167290 0.4506048
54
Variable Name Variable Label
Non-missing
CasesMissing
Cases MeanStandard Deviation
abany400 Any provider of 400 or more abortions in 2000? (0=no; 1=yes) - county
12571 0 0.6550792 0.4753614
win1319 Women aged 13-19 in need of contraceptive services and supplies, 2000 - county
12571 0 25077.67 40334.61
win2044 Women aged 20-44 in need of contraceptive services and supplies, 2000 - county
12571 0 167692.13 266986.64
winpoor Women aged 20-44 at less than 250% of federal poverty level in need of contraceptive services and supplies, 2000 - county
12571 0 69880.22 124001.64
fppvdrs Total number of publicly supported family planning providers, 2001 - county
12571 0 24.0306260 37.4157566
fpcllt20 Female clients under age 20 of publicly supported family planning providers, 2001 - county
12571 0 6783.93 8510.70
fpclge20 Female clients aged 20+ of publicly supported family planning providers, 2001 - county
12571 0 24149.50 39744.03
popf1344 Female population aged 13-44, 2000 - county 12571 0 355903.58 564428.28
popf1544 Female population aged 15-44, 2000 - county 12571 0 332666.16 528857.81
popf1519 Female population aged 15-19, 2000 - county 12571 0 46868.06 74945.11
popf2044 Female population aged 20-44, 2000 - county 12571 0 285798.09 454007.41
AGIr1 Publicly supported family planning service providers in 2001 per 10,000 total population in 2000 - county
12571 0 0.2629937 0.3715706
AGIr2 Publicly supported family planning service providers in 2001 per 10,000 females aged 15-44 in 2000 - county
12571 0 1.2382296 1.8241673
55
Variable Name Variable Label
Non-missing
CasesMissing
Cases MeanStandard Deviation
AGIr3 Publicly supported FP service providers in 2001 per 10,000 females aged 13-44 in need of FP services/supplies in 2000 - county
12538 33 2.3862087 3.9918555
AGIr4 Female clients under age 20 of publicly supported family planning providers in 2001 per female aged 15-19 in 2000 - county
12538 33 0.2010260 0.1459941
AGIr5 Female clients aged 20+ of publicly supported family planning providers in 2001 per female aged 20-44 in 2000 - county
12571 0 0.0915357 0.0597133
AGIr6 Total female clients of publicly supported family planning providers in 2001 per female aged 15-44 in 2000 - county
12571 0 0.1073235 0.0697484
AGIr7 Total female clients of publicly supported FP providers in 2001 per female 13-44 in need of FP services/supplies in 2000 - county
12538 33 0.1930909 0.1295874
AGIr8 Female clients 12449 122 0.3707166 0.2489462
AGIr9 Female clients 20+ of publicly supported FP providers in 2001 per female 20-44 in need of FP services/supplies in 2000 - county
12538 33 0.1646323 0.1138169
AGIr10 Proportion of female clients of publicly supported family planning providers who are under age 20, 2001 - county
12140 431 0.2748759 0.0734722
AGIr11 Females aged 15-44 in 2000 per publicly supported family planning service provider in 2001 - county
12140 431 16418.49 13094.52
AGIr12 Females aged 13-44 in need of FP services/supplies in 2000 per publicly supported FP service provider in 2001 - county
12140 431 9359.88 7298.47
56
Variable Name Variable Label
Non-missing
CasesMissing
Cases MeanStandard Deviation
AGIr13 Total female clients of publicly supported FP providers per publicly supported FP service provider, 2001 - county
12140 431 1320.83 685.0578871
AGIr14 Female clients under age 20 of publicly supported FP providers per publicly supported FP service provider, 2001 - county
12140 431 354.7769547 208.0846200
AGIr15 Proportion of female population aged 13-44 in need of contraceptive services and supplies, 2000 - county
12571 0 0.5208135 0.0486171
AGIr16 Proportion of female population aged 13-44 in need of publicly funded contraceptive services and supplies, 2000 - county
12571 0 0.2540704 0.0552726
AGIr17 Proportion of need for publicly supported family planning contraceptive services and supplies that is met, 2000/2001 - county
12538 33 0.3861252 0.2175864
GCCASE Gonorrhea (GC) cases, 2000 - county 12571 0 2212.97 3810.11
CTCASE Chlamydia (CT) cases, 2000 - county 12571 0 4931.40 8615.30
PSCASE Primary and secondary syphilis cases, 2000 - county 12571 0 39.9417707 76.9261925
TOTPOP Population for STD rates, 2000 - county 12571 0 1469892.57 2302649.17
CTRATE Chlamydia (CT) rate per 100,000 population, 2000 - county
12571 0 267.7841620 166.9339165
GCRATE Gonorrhea (GC) rate per 100,000 population, 2000 - county
12571 0 136.8442129 142.4124407
PSRATE Primary and secondary syphilis rate per 100,000 population, 2000 - county
12571 0 2.2409037 3.6940319
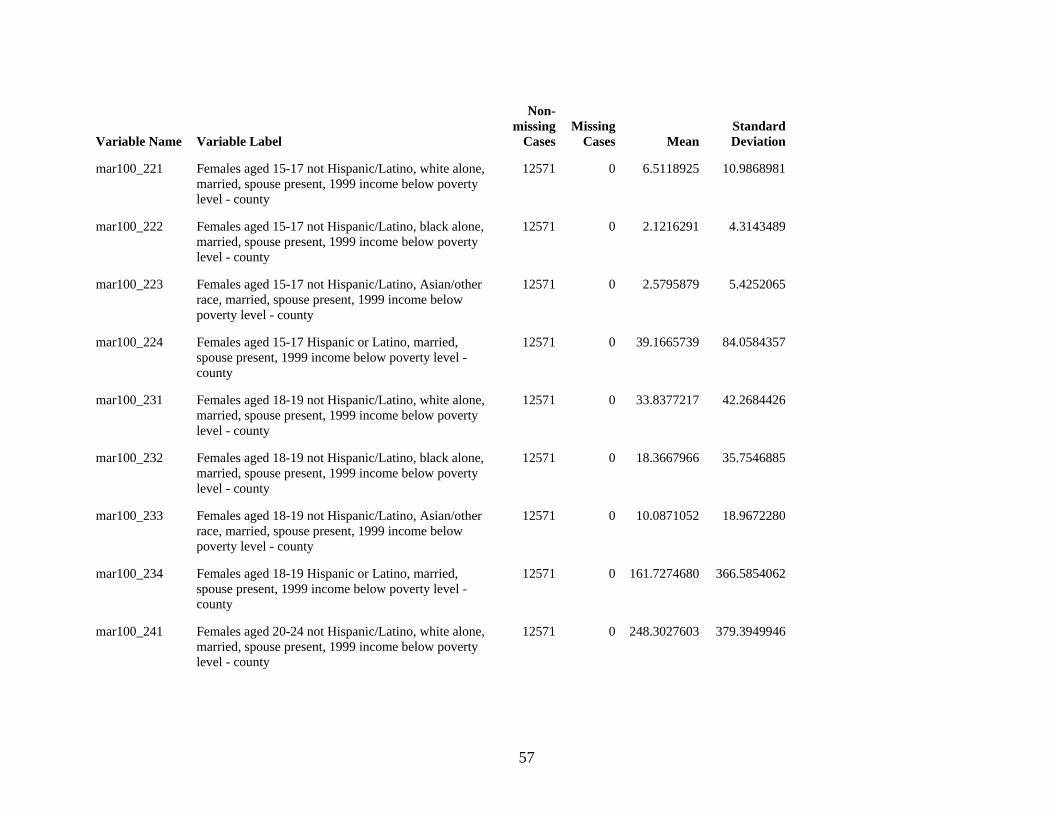
57
Variable Name Variable Label
Non-missing
CasesMissing
Cases MeanStandard Deviation
mar100_221 Females aged 15-17 not Hispanic/Latino, white alone, married, spouse present, 1999 income below poverty level - county
12571 0 6.5118925 10.9868981
mar100_222 Females aged 15-17 not Hispanic/Latino, black alone, married, spouse present, 1999 income below poverty level - county
12571 0 2.1216291 4.3143489
mar100_223 Females aged 15-17 not Hispanic/Latino, Asian/other race, married, spouse present, 1999 income below poverty level - county
12571 0 2.5795879 5.4252065
mar100_224 Females aged 15-17 Hispanic or Latino, married, spouse present, 1999 income below poverty level - county
12571 0 39.1665739 84.0584357
mar100_231 Females aged 18-19 not Hispanic/Latino, white alone, married, spouse present, 1999 income below poverty level - county
12571 0 33.8377217 42.2684426
mar100_232 Females aged 18-19 not Hispanic/Latino, black alone, married, spouse present, 1999 income below poverty level - county
12571 0 18.3667966 35.7546885
mar100_233 Females aged 18-19 not Hispanic/Latino, Asian/other race, married, spouse present, 1999 income below poverty level - county
12571 0 10.0871052 18.9672280
mar100_234 Females aged 18-19 Hispanic or Latino, married, spouse present, 1999 income below poverty level - county
12571 0 161.7274680 366.5854062
mar100_241 Females aged 20-24 not Hispanic/Latino, white alone, married, spouse present, 1999 income below poverty level - county
12571 0 248.3027603 379.3949946

58
Variable Name Variable Label
Non-missing
CasesMissing
Cases MeanStandard Deviation
mar100_242 Females aged 20-24 not Hispanic/Latino, black alone, married, spouse present, 1999 income below poverty level - county
12571 0 106.9180654 163.2636392
mar100_243 Females aged 20-24 not Hispanic/Latino, Asian/other race, married, spouse present, 1999 income below poverty level - county
12571 0 96.4815051 162.5137249
mar100_244 Females aged 20-24 Hispanic or Latino, married, spouse present, 1999 income below poverty level - county
12571 0 1072.50 2475.53
mar100_251 Females aged 25-29 not Hispanic/Latino, white alone, married, spouse present, 1999 income below poverty level - county
12571 0 359.1699149 518.1596068
mar100_252 Females aged 25-29 not Hispanic/Latino, black alone, married, spouse present, 1999 income below poverty level - county
12571 0 177.6191234 280.3980507
mar100_253 Females aged 25-29 not Hispanic/Latino, Asian/other race, married, spouse present, 1999 income below poverty level - county
12571 0 270.4910508 530.6721399
mar100_254 Females aged 25-29 Hispanic or Latino, married, spouse present, 1999 income below poverty level - county
12571 0 1811.17 4494.30
mar100_261 Females aged 30-44 not Hispanic/Latino, white alone, married, spouse present, 1999 income below poverty level - county
12571 0 1412.30 2114.56
mar100_262 Females aged 30-44 not Hispanic/Latino, black alone, married, spouse present, 1999 income below poverty level - county
12571 0 690.1264816 1097.84
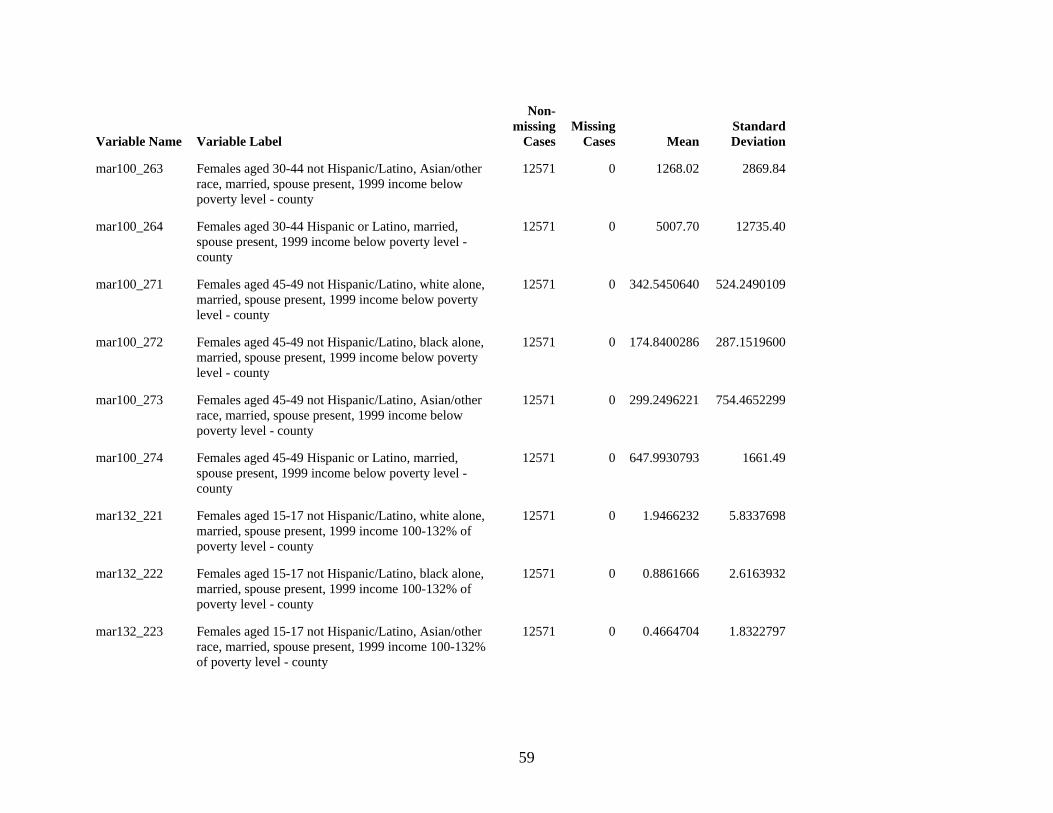
59
Variable Name Variable Label
Non-missing
CasesMissing
Cases MeanStandard Deviation
mar100_263 Females aged 30-44 not Hispanic/Latino, Asian/other race, married, spouse present, 1999 income below poverty level - county
12571 0 1268.02 2869.84
mar100_264 Females aged 30-44 Hispanic or Latino, married, spouse present, 1999 income below poverty level - county
12571 0 5007.70 12735.40
mar100_271 Females aged 45-49 not Hispanic/Latino, white alone, married, spouse present, 1999 income below poverty level - county
12571 0 342.5450640 524.2490109
mar100_272 Females aged 45-49 not Hispanic/Latino, black alone, married, spouse present, 1999 income below poverty level - county
12571 0 174.8400286 287.1519600
mar100_273 Females aged 45-49 not Hispanic/Latino, Asian/other race, married, spouse present, 1999 income below poverty level - county
12571 0 299.2496221 754.4652299
mar100_274 Females aged 45-49 Hispanic or Latino, married, spouse present, 1999 income below poverty level - county
12571 0 647.9930793 1661.49
mar132_221 Females aged 15-17 not Hispanic/Latino, white alone, married, spouse present, 1999 income 100-132% of poverty level - county
12571 0 1.9466232 5.8337698
mar132_222 Females aged 15-17 not Hispanic/Latino, black alone, married, spouse present, 1999 income 100-132% of poverty level - county
12571 0 0.8861666 2.6163932
mar132_223 Females aged 15-17 not Hispanic/Latino, Asian/other race, married, spouse present, 1999 income 100-132% of poverty level - county
12571 0 0.4664704 1.8322797
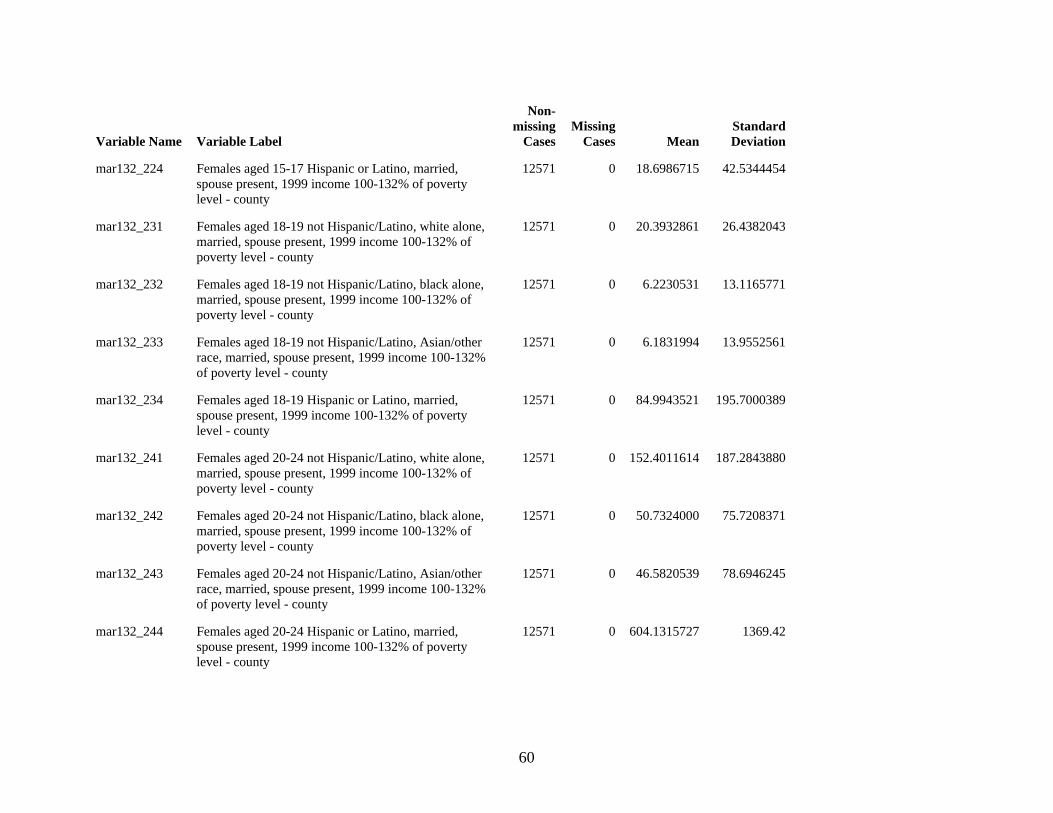
60
Variable Name Variable Label
Non-missing
CasesMissing
Cases MeanStandard Deviation
mar132_224 Females aged 15-17 Hispanic or Latino, married, spouse present, 1999 income 100-132% of poverty level - county
12571 0 18.6986715 42.5344454
mar132_231 Females aged 18-19 not Hispanic/Latino, white alone, married, spouse present, 1999 income 100-132% of poverty level - county
12571 0 20.3932861 26.4382043
mar132_232 Females aged 18-19 not Hispanic/Latino, black alone, married, spouse present, 1999 income 100-132% of poverty level - county
12571 0 6.2230531 13.1165771
mar132_233 Females aged 18-19 not Hispanic/Latino, Asian/other race, married, spouse present, 1999 income 100-132% of poverty level - county
12571 0 6.1831994 13.9552561
mar132_234 Females aged 18-19 Hispanic or Latino, married, spouse present, 1999 income 100-132% of poverty level - county
12571 0 84.9943521 195.7000389
mar132_241 Females aged 20-24 not Hispanic/Latino, white alone, married, spouse present, 1999 income 100-132% of poverty level - county
12571 0 152.4011614 187.2843880
mar132_242 Females aged 20-24 not Hispanic/Latino, black alone, married, spouse present, 1999 income 100-132% of poverty level - county
12571 0 50.7324000 75.7208371
mar132_243 Females aged 20-24 not Hispanic/Latino, Asian/other race, married, spouse present, 1999 income 100-132% of poverty level - county
12571 0 46.5820539 78.6946245
mar132_244 Females aged 20-24 Hispanic or Latino, married, spouse present, 1999 income 100-132% of poverty level - county
12571 0 604.1315727 1369.42
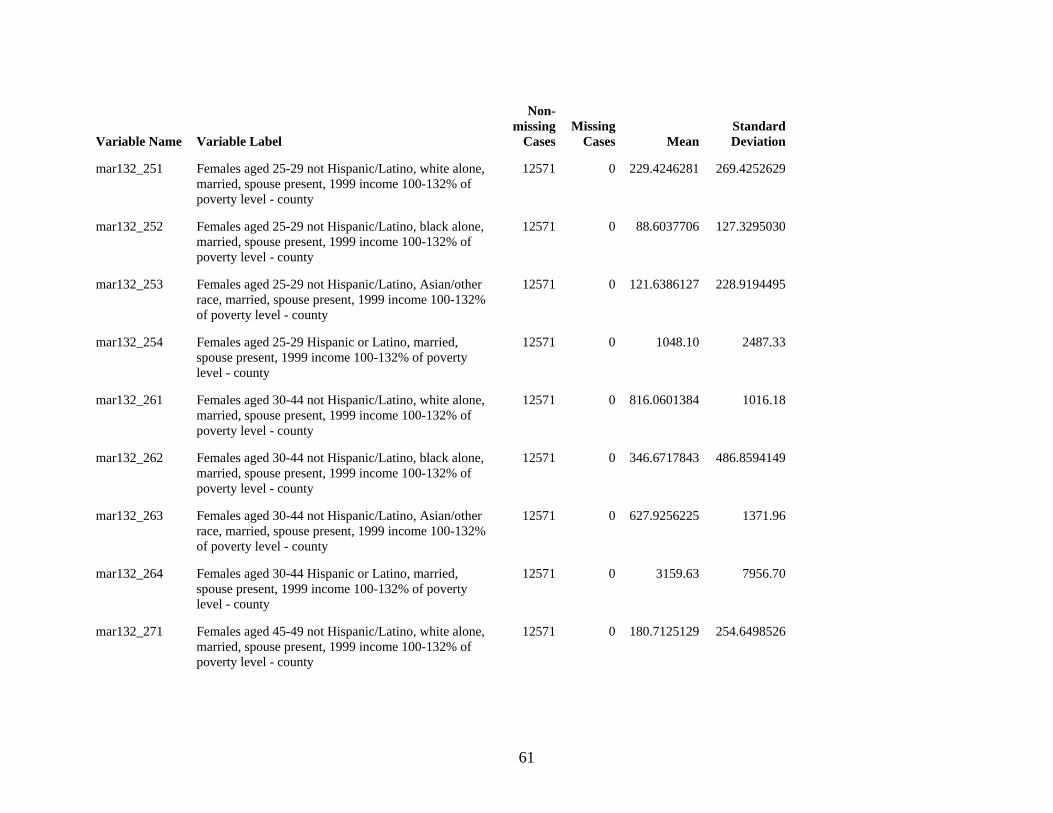
61
Variable Name Variable Label
Non-missing
CasesMissing
Cases MeanStandard Deviation
mar132_251 Females aged 25-29 not Hispanic/Latino, white alone, married, spouse present, 1999 income 100-132% of poverty level - county
12571 0 229.4246281 269.4252629
mar132_252 Females aged 25-29 not Hispanic/Latino, black alone, married, spouse present, 1999 income 100-132% of poverty level - county
12571 0 88.6037706 127.3295030
mar132_253 Females aged 25-29 not Hispanic/Latino, Asian/other race, married, spouse present, 1999 income 100-132% of poverty level - county
12571 0 121.6386127 228.9194495
mar132_254 Females aged 25-29 Hispanic or Latino, married, spouse present, 1999 income 100-132% of poverty level - county
12571 0 1048.10 2487.33
mar132_261 Females aged 30-44 not Hispanic/Latino, white alone, married, spouse present, 1999 income 100-132% of poverty level - county
12571 0 816.0601384 1016.18
mar132_262 Females aged 30-44 not Hispanic/Latino, black alone, married, spouse present, 1999 income 100-132% of poverty level - county
12571 0 346.6717843 486.8594149
mar132_263 Females aged 30-44 not Hispanic/Latino, Asian/other race, married, spouse present, 1999 income 100-132% of poverty level - county
12571 0 627.9256225 1371.96
mar132_264 Females aged 30-44 Hispanic or Latino, married, spouse present, 1999 income 100-132% of poverty level - county
12571 0 3159.63 7956.70
mar132_271 Females aged 45-49 not Hispanic/Latino, white alone, married, spouse present, 1999 income 100-132% of poverty level - county
12571 0 180.7125129 254.6498526
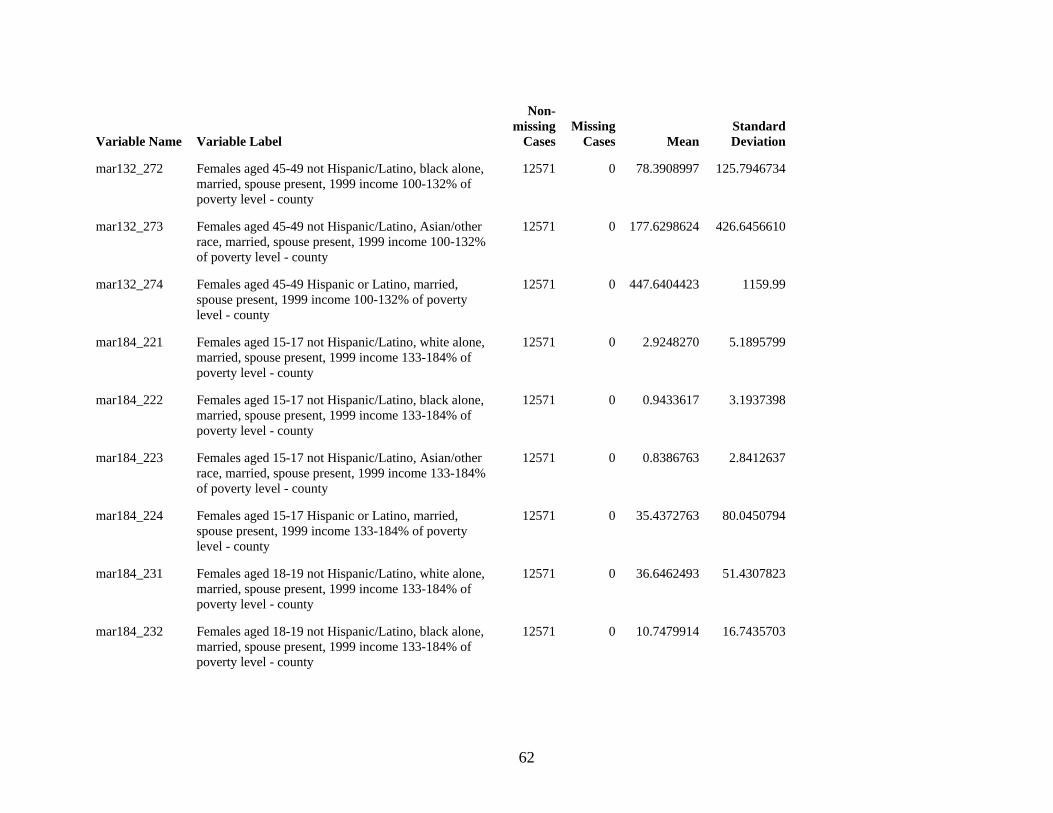
62
Variable Name Variable Label
Non-missing
CasesMissing
Cases MeanStandard Deviation
mar132_272 Females aged 45-49 not Hispanic/Latino, black alone, married, spouse present, 1999 income 100-132% of poverty level - county
12571 0 78.3908997 125.7946734
mar132_273 Females aged 45-49 not Hispanic/Latino, Asian/other race, married, spouse present, 1999 income 100-132% of poverty level - county
12571 0 177.6298624 426.6456610
mar132_274 Females aged 45-49 Hispanic or Latino, married, spouse present, 1999 income 100-132% of poverty level - county
12571 0 447.6404423 1159.99
mar184_221 Females aged 15-17 not Hispanic/Latino, white alone, married, spouse present, 1999 income 133-184% of poverty level - county
12571 0 2.9248270 5.1895799
mar184_222 Females aged 15-17 not Hispanic/Latino, black alone, married, spouse present, 1999 income 133-184% of poverty level - county
12571 0 0.9433617 3.1937398
mar184_223 Females aged 15-17 not Hispanic/Latino, Asian/other race, married, spouse present, 1999 income 133-184% of poverty level - county
12571 0 0.8386763 2.8412637
mar184_224 Females aged 15-17 Hispanic or Latino, married, spouse present, 1999 income 133-184% of poverty level - county
12571 0 35.4372763 80.0450794
mar184_231 Females aged 18-19 not Hispanic/Latino, white alone, married, spouse present, 1999 income 133-184% of poverty level - county
12571 0 36.6462493 51.4307823
mar184_232 Females aged 18-19 not Hispanic/Latino, black alone, married, spouse present, 1999 income 133-184% of poverty level - county
12571 0 10.7479914 16.7435703
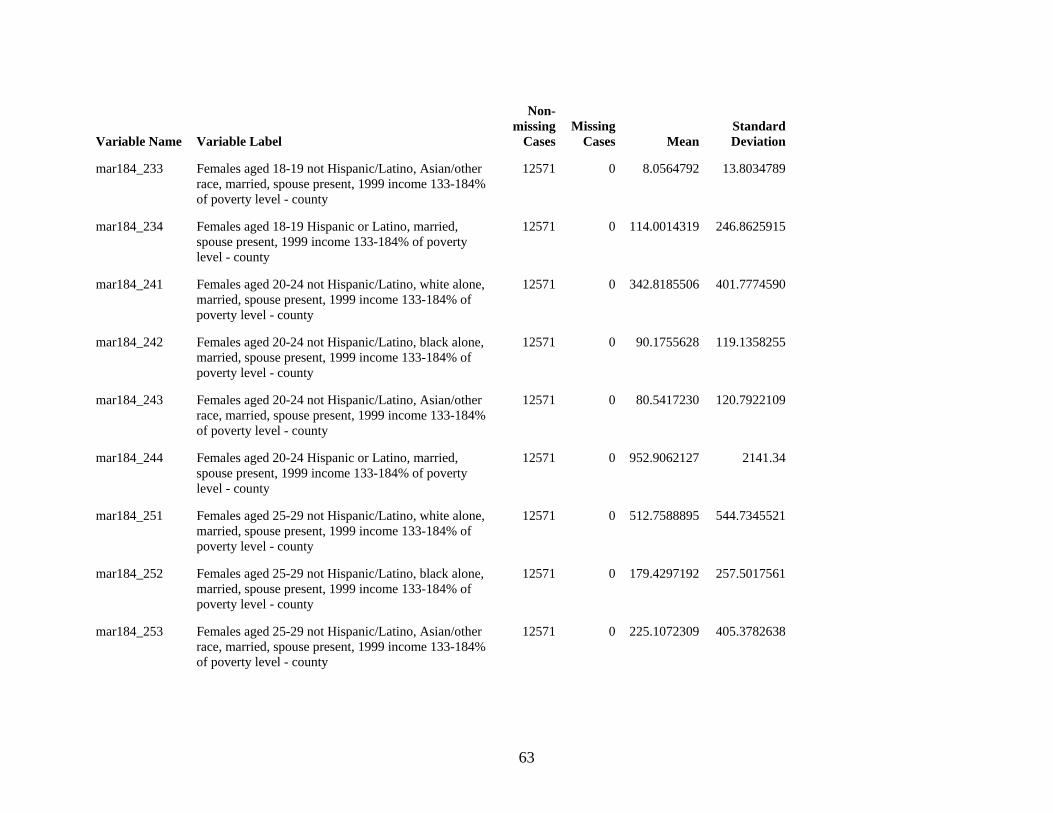
63
Variable Name Variable Label
Non-missing
CasesMissing
Cases MeanStandard Deviation
mar184_233 Females aged 18-19 not Hispanic/Latino, Asian/other race, married, spouse present, 1999 income 133-184% of poverty level - county
12571 0 8.0564792 13.8034789
mar184_234 Females aged 18-19 Hispanic or Latino, married, spouse present, 1999 income 133-184% of poverty level - county
12571 0 114.0014319 246.8625915
mar184_241 Females aged 20-24 not Hispanic/Latino, white alone, married, spouse present, 1999 income 133-184% of poverty level - county
12571 0 342.8185506 401.7774590
mar184_242 Females aged 20-24 not Hispanic/Latino, black alone, married, spouse present, 1999 income 133-184% of poverty level - county
12571 0 90.1755628 119.1358255
mar184_243 Females aged 20-24 not Hispanic/Latino, Asian/other race, married, spouse present, 1999 income 133-184% of poverty level - county
12571 0 80.5417230 120.7922109
mar184_244 Females aged 20-24 Hispanic or Latino, married, spouse present, 1999 income 133-184% of poverty level - county
12571 0 952.9062127 2141.34
mar184_251 Females aged 25-29 not Hispanic/Latino, white alone, married, spouse present, 1999 income 133-184% of poverty level - county
12571 0 512.7588895 544.7345521
mar184_252 Females aged 25-29 not Hispanic/Latino, black alone, married, spouse present, 1999 income 133-184% of poverty level - county
12571 0 179.4297192 257.5017561
mar184_253 Females aged 25-29 not Hispanic/Latino, Asian/other race, married, spouse present, 1999 income 133-184% of poverty level - county
12571 0 225.1072309 405.3782638
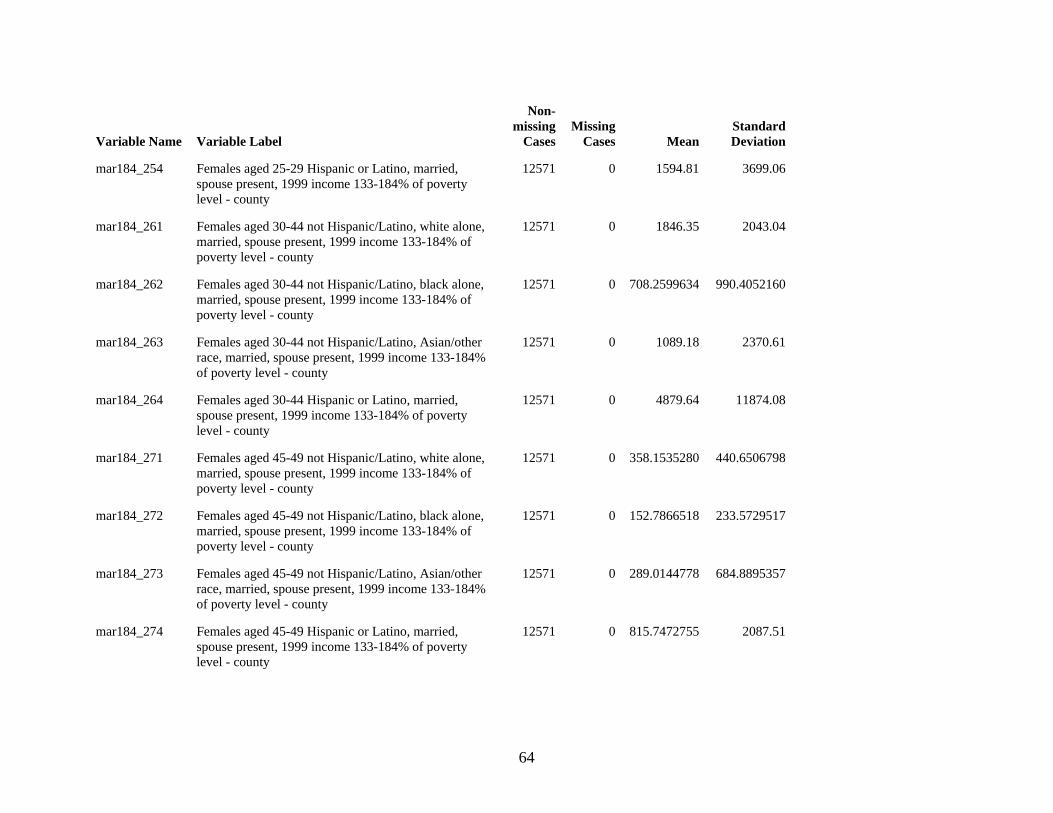
64
Variable Name Variable Label
Non-missing
CasesMissing
Cases MeanStandard Deviation
mar184_254 Females aged 25-29 Hispanic or Latino, married, spouse present, 1999 income 133-184% of poverty level - county
12571 0 1594.81 3699.06
mar184_261 Females aged 30-44 not Hispanic/Latino, white alone, married, spouse present, 1999 income 133-184% of poverty level - county
12571 0 1846.35 2043.04
mar184_262 Females aged 30-44 not Hispanic/Latino, black alone, married, spouse present, 1999 income 133-184% of poverty level - county
12571 0 708.2599634 990.4052160
mar184_263 Females aged 30-44 not Hispanic/Latino, Asian/other race, married, spouse present, 1999 income 133-184% of poverty level - county
12571 0 1089.18 2370.61
mar184_264 Females aged 30-44 Hispanic or Latino, married, spouse present, 1999 income 133-184% of poverty level - county
12571 0 4879.64 11874.08
mar184_271 Females aged 45-49 not Hispanic/Latino, white alone, married, spouse present, 1999 income 133-184% of poverty level - county
12571 0 358.1535280 440.6506798
mar184_272 Females aged 45-49 not Hispanic/Latino, black alone, married, spouse present, 1999 income 133-184% of poverty level - county
12571 0 152.7866518 233.5729517
mar184_273 Females aged 45-49 not Hispanic/Latino, Asian/other race, married, spouse present, 1999 income 133-184% of poverty level - county
12571 0 289.0144778 684.8895357
mar184_274 Females aged 45-49 Hispanic or Latino, married, spouse present, 1999 income 133-184% of poverty level - county
12571 0 815.7472755 2087.51
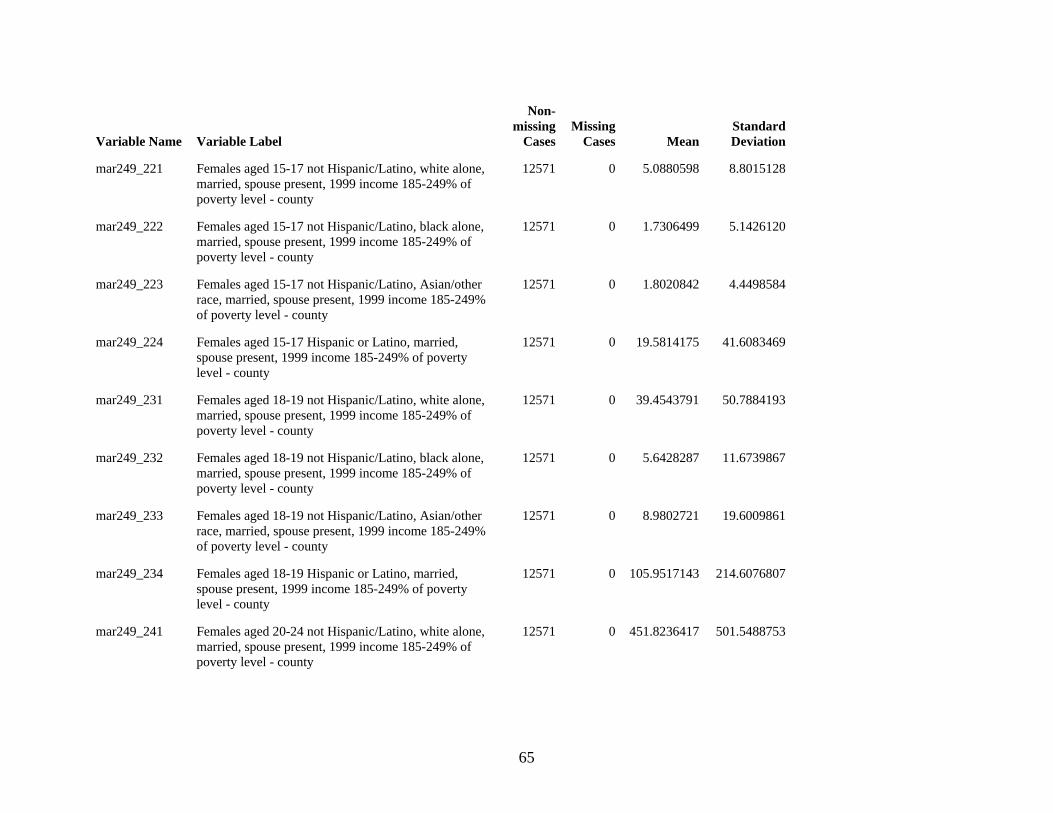
65
Variable Name Variable Label
Non-missing
CasesMissing
Cases MeanStandard Deviation
mar249_221 Females aged 15-17 not Hispanic/Latino, white alone, married, spouse present, 1999 income 185-249% of poverty level - county
12571 0 5.0880598 8.8015128
mar249_222 Females aged 15-17 not Hispanic/Latino, black alone, married, spouse present, 1999 income 185-249% of poverty level - county
12571 0 1.7306499 5.1426120
mar249_223 Females aged 15-17 not Hispanic/Latino, Asian/other race, married, spouse present, 1999 income 185-249% of poverty level - county
12571 0 1.8020842 4.4498584
mar249_224 Females aged 15-17 Hispanic or Latino, married, spouse present, 1999 income 185-249% of poverty level - county
12571 0 19.5814175 41.6083469
mar249_231 Females aged 18-19 not Hispanic/Latino, white alone, married, spouse present, 1999 income 185-249% of poverty level - county
12571 0 39.4543791 50.7884193
mar249_232 Females aged 18-19 not Hispanic/Latino, black alone, married, spouse present, 1999 income 185-249% of poverty level - county
12571 0 5.6428287 11.6739867
mar249_233 Females aged 18-19 not Hispanic/Latino, Asian/other race, married, spouse present, 1999 income 185-249% of poverty level - county
12571 0 8.9802721 19.6009861
mar249_234 Females aged 18-19 Hispanic or Latino, married, spouse present, 1999 income 185-249% of poverty level - county
12571 0 105.9517143 214.6076807
mar249_241 Females aged 20-24 not Hispanic/Latino, white alone, married, spouse present, 1999 income 185-249% of poverty level - county
12571 0 451.8236417 501.5488753
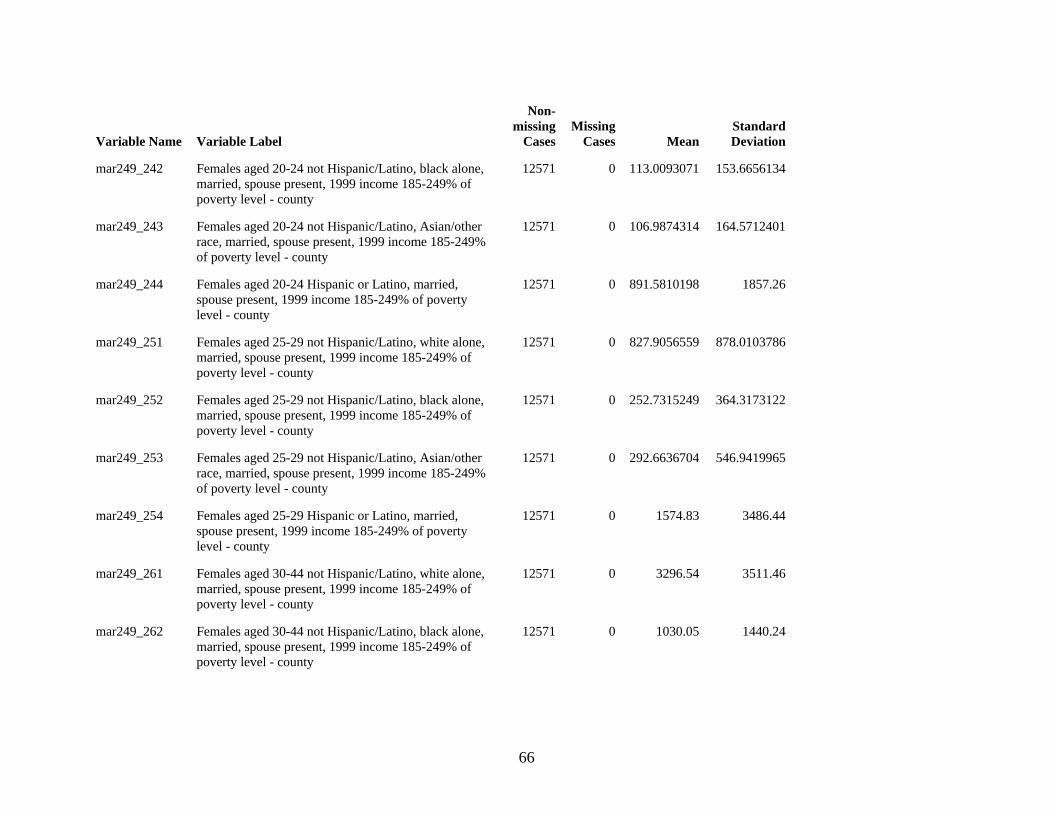
66
Variable Name Variable Label
Non-missing
CasesMissing
Cases MeanStandard Deviation
mar249_242 Females aged 20-24 not Hispanic/Latino, black alone, married, spouse present, 1999 income 185-249% of poverty level - county
12571 0 113.0093071 153.6656134
mar249_243 Females aged 20-24 not Hispanic/Latino, Asian/other race, married, spouse present, 1999 income 185-249% of poverty level - county
12571 0 106.9874314 164.5712401
mar249_244 Females aged 20-24 Hispanic or Latino, married, spouse present, 1999 income 185-249% of poverty level - county
12571 0 891.5810198 1857.26
mar249_251 Females aged 25-29 not Hispanic/Latino, white alone, married, spouse present, 1999 income 185-249% of poverty level - county
12571 0 827.9056559 878.0103786
mar249_252 Females aged 25-29 not Hispanic/Latino, black alone, married, spouse present, 1999 income 185-249% of poverty level - county
12571 0 252.7315249 364.3173122
mar249_253 Females aged 25-29 not Hispanic/Latino, Asian/other race, married, spouse present, 1999 income 185-249% of poverty level - county
12571 0 292.6636704 546.9419965
mar249_254 Females aged 25-29 Hispanic or Latino, married, spouse present, 1999 income 185-249% of poverty level - county
12571 0 1574.83 3486.44
mar249_261 Females aged 30-44 not Hispanic/Latino, white alone, married, spouse present, 1999 income 185-249% of poverty level - county
12571 0 3296.54 3511.46
mar249_262 Females aged 30-44 not Hispanic/Latino, black alone, married, spouse present, 1999 income 185-249% of poverty level - county
12571 0 1030.05 1440.24
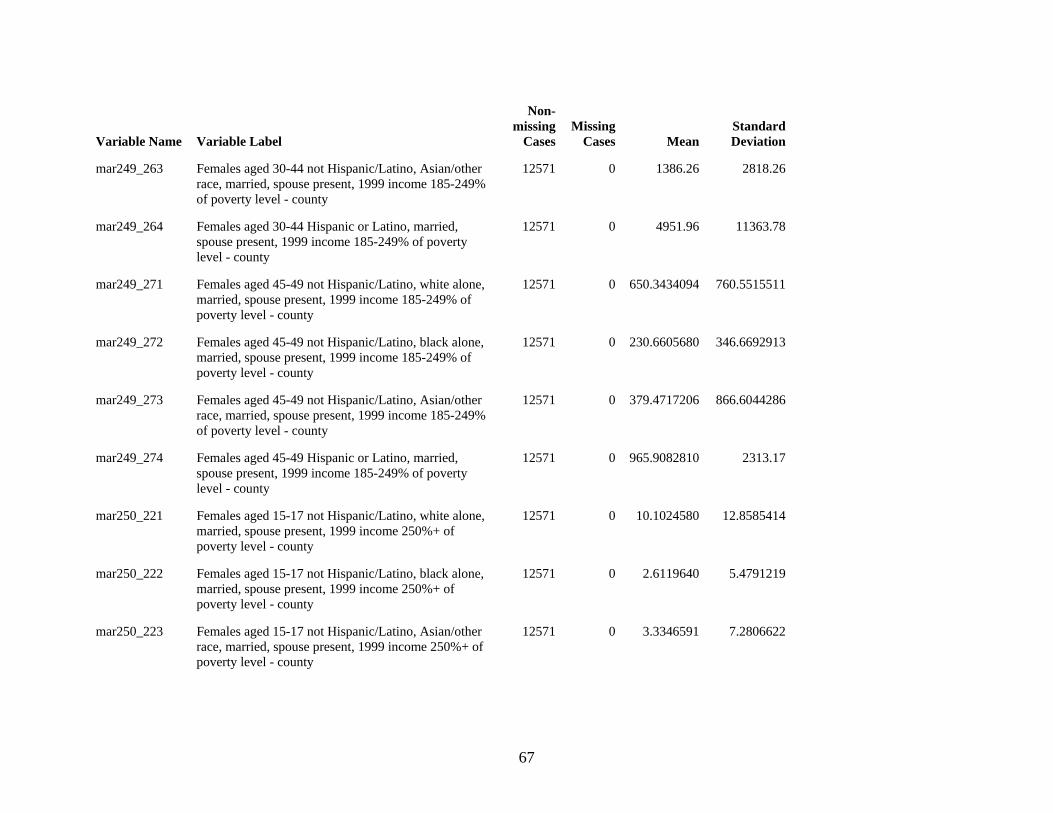
67
Variable Name Variable Label
Non-missing
CasesMissing
Cases MeanStandard Deviation
mar249_263 Females aged 30-44 not Hispanic/Latino, Asian/other race, married, spouse present, 1999 income 185-249% of poverty level - county
12571 0 1386.26 2818.26
mar249_264 Females aged 30-44 Hispanic or Latino, married, spouse present, 1999 income 185-249% of poverty level - county
12571 0 4951.96 11363.78
mar249_271 Females aged 45-49 not Hispanic/Latino, white alone, married, spouse present, 1999 income 185-249% of poverty level - county
12571 0 650.3434094 760.5515511
mar249_272 Females aged 45-49 not Hispanic/Latino, black alone, married, spouse present, 1999 income 185-249% of poverty level - county
12571 0 230.6605680 346.6692913
mar249_273 Females aged 45-49 not Hispanic/Latino, Asian/other race, married, spouse present, 1999 income 185-249% of poverty level - county
12571 0 379.4717206 866.6044286
mar249_274 Females aged 45-49 Hispanic or Latino, married, spouse present, 1999 income 185-249% of poverty level - county
12571 0 965.9082810 2313.17
mar250_221 Females aged 15-17 not Hispanic/Latino, white alone, married, spouse present, 1999 income 250%+ of poverty level - county
12571 0 10.1024580 12.8585414
mar250_222 Females aged 15-17 not Hispanic/Latino, black alone, married, spouse present, 1999 income 250%+ of poverty level - county
12571 0 2.6119640 5.4791219
mar250_223 Females aged 15-17 not Hispanic/Latino, Asian/other race, married, spouse present, 1999 income 250%+ of poverty level - county
12571 0 3.3346591 7.2806622

68
Variable Name Variable Label
Non-missing
CasesMissing
Cases MeanStandard Deviation
mar250_224 Females aged 15-17 Hispanic or Latino, married, spouse present, 1999 income 250%+ of poverty level - county
12571 0 27.0621271 52.5795533
mar250_231 Females aged 18-19 not Hispanic/Latino, white alone, married, spouse present, 1999 income 250%+ of poverty level - county
12571 0 95.5472118 113.7227773
mar250_232 Females aged 18-19 not Hispanic/Latino, black alone, married, spouse present, 1999 income 250%+ of poverty level - county
12571 0 12.6047252 18.4034319
mar250_233 Females aged 18-19 not Hispanic/Latino, Asian/other race, married, spouse present, 1999 income 250%+ of poverty level - county
12571 0 20.3903429 33.4853149
mar250_234 Females aged 18-19 Hispanic or Latino, married, spouse present, 1999 income 250%+ of poverty level - county
12571 0 137.6562724 278.8068352
mar250_241 Females aged 20-24 not Hispanic/Latino, white alone, married, spouse present, 1999 income 250%+ of poverty level - county
12571 0 2122.30 2336.83
mar250_242 Females aged 20-24 not Hispanic/Latino, black alone, married, spouse present, 1999 income 250%+ of poverty level - county
12571 0 308.5485642 420.7029938
mar250_243 Females aged 20-24 not Hispanic/Latino, Asian/other race, married, spouse present, 1999 income 250%+ of poverty level - county
12571 0 486.3509665 793.2539164
mar250_244 Females aged 20-24 Hispanic or Latino, married, spouse present, 1999 income 250%+ of poverty level - county
12571 0 1640.99 3297.87
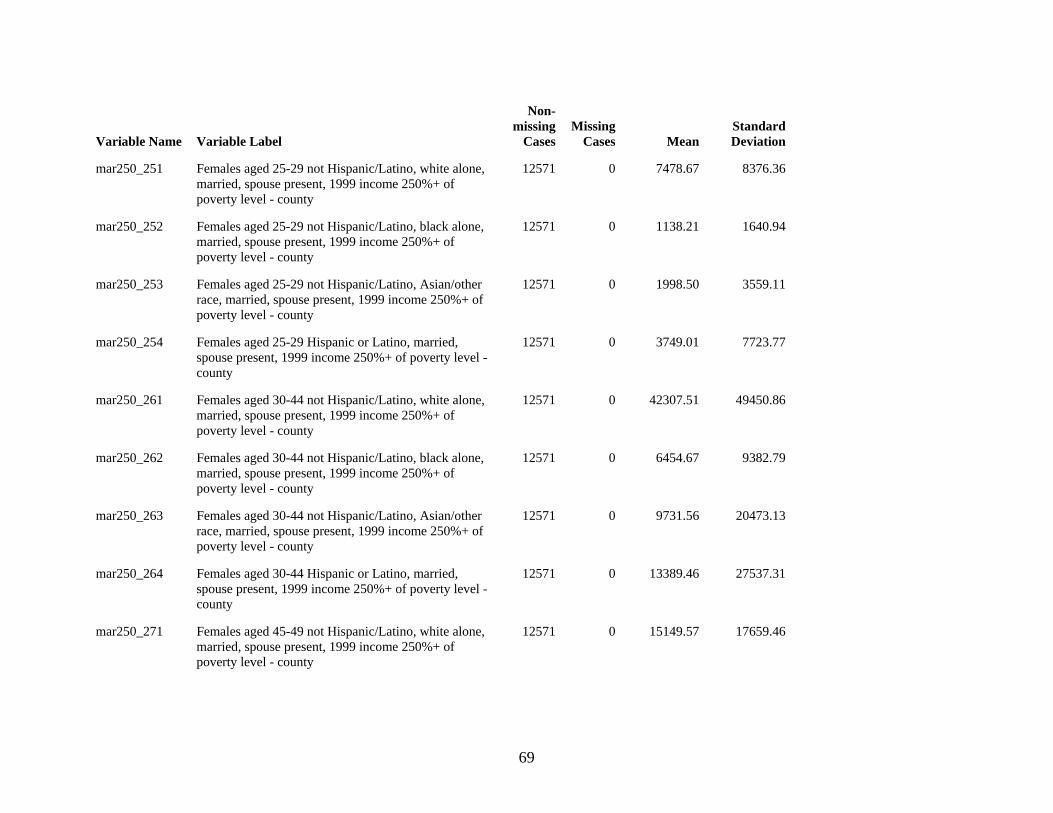
69
Variable Name Variable Label
Non-missing
CasesMissing
Cases MeanStandard Deviation
mar250_251 Females aged 25-29 not Hispanic/Latino, white alone, married, spouse present, 1999 income 250%+ of poverty level - county
12571 0 7478.67 8376.36
mar250_252 Females aged 25-29 not Hispanic/Latino, black alone, married, spouse present, 1999 income 250%+ of poverty level - county
12571 0 1138.21 1640.94
mar250_253 Females aged 25-29 not Hispanic/Latino, Asian/other race, married, spouse present, 1999 income 250%+ of poverty level - county
12571 0 1998.50 3559.11
mar250_254 Females aged 25-29 Hispanic or Latino, married, spouse present, 1999 income 250%+ of poverty level - county
12571 0 3749.01 7723.77
mar250_261 Females aged 30-44 not Hispanic/Latino, white alone, married, spouse present, 1999 income 250%+ of poverty level - county
12571 0 42307.51 49450.86
mar250_262 Females aged 30-44 not Hispanic/Latino, black alone, married, spouse present, 1999 income 250%+ of poverty level - county
12571 0 6454.67 9382.79
mar250_263 Females aged 30-44 not Hispanic/Latino, Asian/other race, married, spouse present, 1999 income 250%+ of poverty level - county
12571 0 9731.56 20473.13
mar250_264 Females aged 30-44 Hispanic or Latino, married, spouse present, 1999 income 250%+ of poverty level - county
12571 0 13389.46 27537.31
mar250_271 Females aged 45-49 not Hispanic/Latino, white alone, married, spouse present, 1999 income 250%+ of poverty level - county
12571 0 15149.57 17659.46
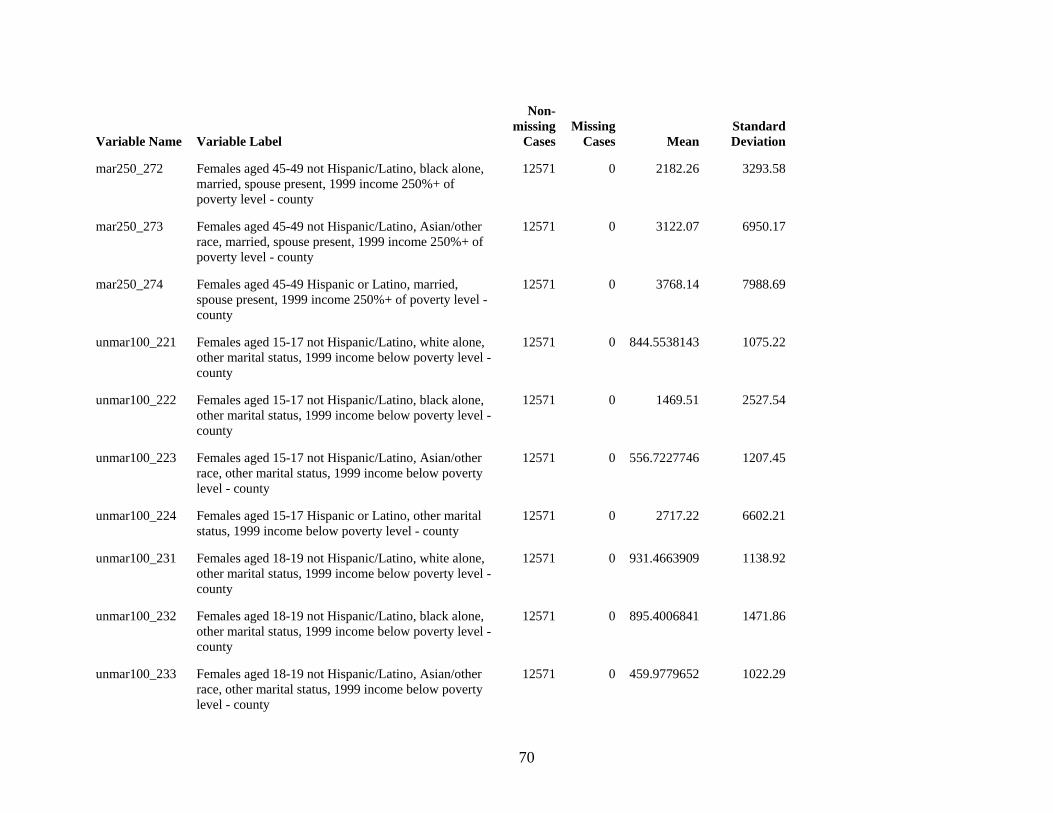
70
Variable Name Variable Label
Non-missing
CasesMissing
Cases MeanStandard Deviation
mar250_272 Females aged 45-49 not Hispanic/Latino, black alone, married, spouse present, 1999 income 250%+ of poverty level - county
12571 0 2182.26 3293.58
mar250_273 Females aged 45-49 not Hispanic/Latino, Asian/other race, married, spouse present, 1999 income 250%+ of poverty level - county
12571 0 3122.07 6950.17
mar250_274 Females aged 45-49 Hispanic or Latino, married, spouse present, 1999 income 250%+ of poverty level - county
12571 0 3768.14 7988.69
unmar100_221 Females aged 15-17 not Hispanic/Latino, white alone, other marital status, 1999 income below poverty level - county
12571 0 844.5538143 1075.22
unmar100_222 Females aged 15-17 not Hispanic/Latino, black alone, other marital status, 1999 income below poverty level - county
12571 0 1469.51 2527.54
unmar100_223 Females aged 15-17 not Hispanic/Latino, Asian/other race, other marital status, 1999 income below poverty level - county
12571 0 556.7227746 1207.45
unmar100_224 Females aged 15-17 Hispanic or Latino, other marital status, 1999 income below poverty level - county
12571 0 2717.22 6602.21
unmar100_231 Females aged 18-19 not Hispanic/Latino, white alone, other marital status, 1999 income below poverty level - county
12571 0 931.4663909 1138.92
unmar100_232 Females aged 18-19 not Hispanic/Latino, black alone, other marital status, 1999 income below poverty level - county
12571 0 895.4006841 1471.86
unmar100_233 Females aged 18-19 not Hispanic/Latino, Asian/other race, other marital status, 1999 income below poverty level - county
12571 0 459.9779652 1022.29
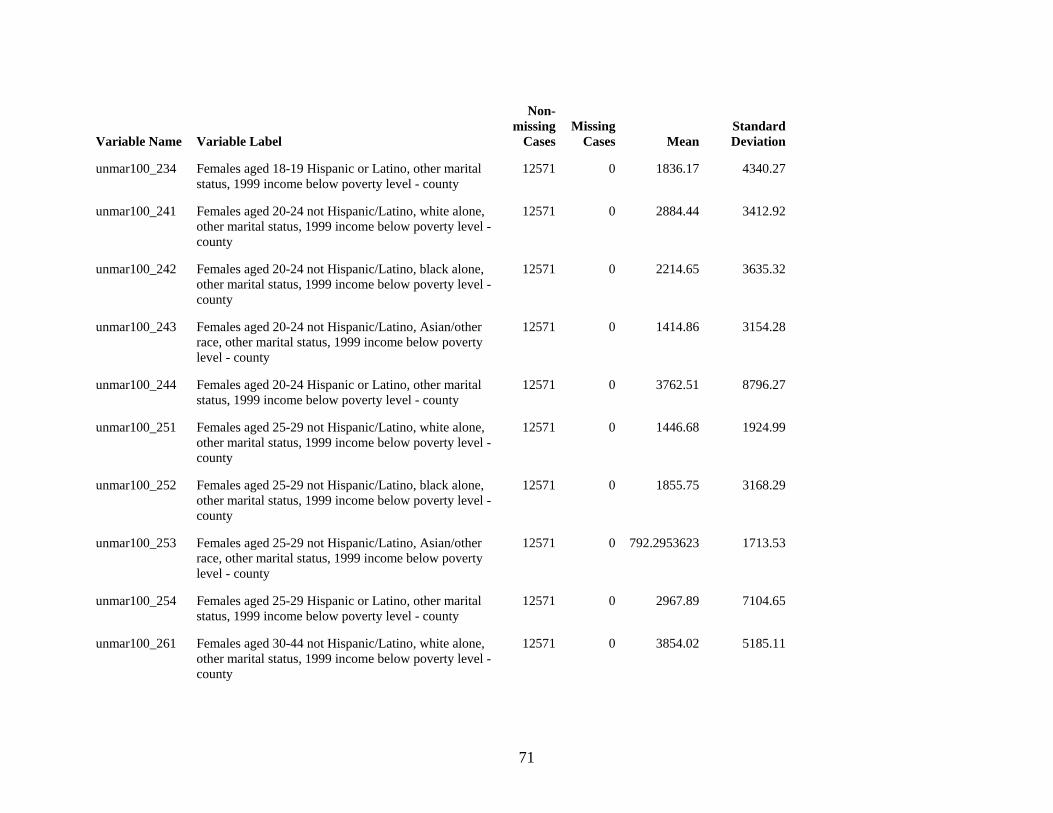
71
Variable Name Variable Label
Non-missing
CasesMissing
Cases MeanStandard Deviation
unmar100_234 Females aged 18-19 Hispanic or Latino, other marital status, 1999 income below poverty level - county
12571 0 1836.17 4340.27
unmar100_241 Females aged 20-24 not Hispanic/Latino, white alone, other marital status, 1999 income below poverty level - county
12571 0 2884.44 3412.92
unmar100_242 Females aged 20-24 not Hispanic/Latino, black alone, other marital status, 1999 income below poverty level - county
12571 0 2214.65 3635.32
unmar100_243 Females aged 20-24 not Hispanic/Latino, Asian/other race, other marital status, 1999 income below poverty level - county
12571 0 1414.86 3154.28
unmar100_244 Females aged 20-24 Hispanic or Latino, other marital status, 1999 income below poverty level - county
12571 0 3762.51 8796.27
unmar100_251 Females aged 25-29 not Hispanic/Latino, white alone, other marital status, 1999 income below poverty level - county
12571 0 1446.68 1924.99
unmar100_252 Females aged 25-29 not Hispanic/Latino, black alone, other marital status, 1999 income below poverty level - county
12571 0 1855.75 3168.29
unmar100_253 Females aged 25-29 not Hispanic/Latino, Asian/other race, other marital status, 1999 income below poverty level - county
12571 0 792.2953623 1713.53
unmar100_254 Females aged 25-29 Hispanic or Latino, other marital status, 1999 income below poverty level - county
12571 0 2967.89 7104.65
unmar100_261 Females aged 30-44 not Hispanic/Latino, white alone, other marital status, 1999 income below poverty level - county
12571 0 3854.02 5185.11
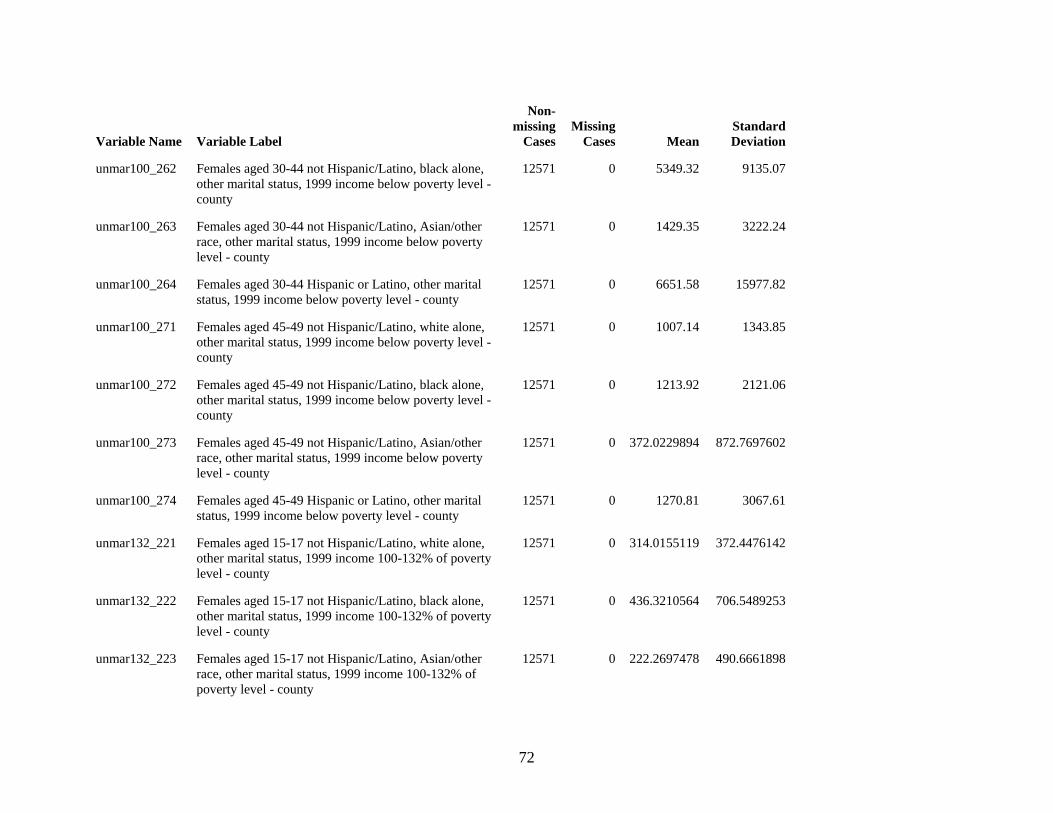
72
Variable Name Variable Label
Non-missing
CasesMissing
Cases MeanStandard Deviation
unmar100_262 Females aged 30-44 not Hispanic/Latino, black alone, other marital status, 1999 income below poverty level - county
12571 0 5349.32 9135.07
unmar100_263 Females aged 30-44 not Hispanic/Latino, Asian/other race, other marital status, 1999 income below poverty level - county
12571 0 1429.35 3222.24
unmar100_264 Females aged 30-44 Hispanic or Latino, other marital status, 1999 income below poverty level - county
12571 0 6651.58 15977.82
unmar100_271 Females aged 45-49 not Hispanic/Latino, white alone, other marital status, 1999 income below poverty level - county
12571 0 1007.14 1343.85
unmar100_272 Females aged 45-49 not Hispanic/Latino, black alone, other marital status, 1999 income below poverty level - county
12571 0 1213.92 2121.06
unmar100_273 Females aged 45-49 not Hispanic/Latino, Asian/other race, other marital status, 1999 income below poverty level - county
12571 0 372.0229894 872.7697602
unmar100_274 Females aged 45-49 Hispanic or Latino, other marital status, 1999 income below poverty level - county
12571 0 1270.81 3067.61
unmar132_221 Females aged 15-17 not Hispanic/Latino, white alone, other marital status, 1999 income 100-132% of poverty level - county
12571 0 314.0155119 372.4476142
unmar132_222 Females aged 15-17 not Hispanic/Latino, black alone, other marital status, 1999 income 100-132% of poverty level - county
12571 0 436.3210564 706.5489253
unmar132_223 Females aged 15-17 not Hispanic/Latino, Asian/other race, other marital status, 1999 income 100-132% of poverty level - county
12571 0 222.2697478 490.6661898
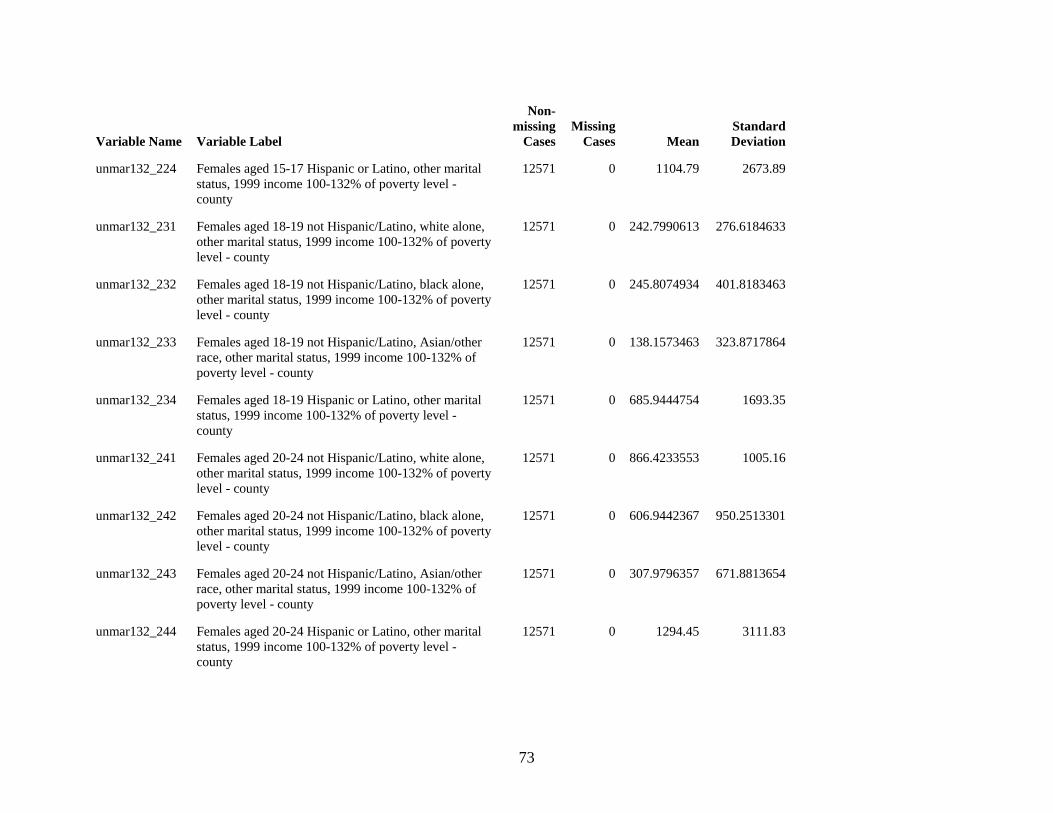
73
Variable Name Variable Label
Non-missing
CasesMissing
Cases MeanStandard Deviation
unmar132_224 Females aged 15-17 Hispanic or Latino, other marital status, 1999 income 100-132% of poverty level - county
12571 0 1104.79 2673.89
unmar132_231 Females aged 18-19 not Hispanic/Latino, white alone, other marital status, 1999 income 100-132% of poverty level - county
12571 0 242.7990613 276.6184633
unmar132_232 Females aged 18-19 not Hispanic/Latino, black alone, other marital status, 1999 income 100-132% of poverty level - county
12571 0 245.8074934 401.8183463
unmar132_233 Females aged 18-19 not Hispanic/Latino, Asian/other race, other marital status, 1999 income 100-132% of poverty level - county
12571 0 138.1573463 323.8717864
unmar132_234 Females aged 18-19 Hispanic or Latino, other marital status, 1999 income 100-132% of poverty level - county
12571 0 685.9444754 1693.35
unmar132_241 Females aged 20-24 not Hispanic/Latino, white alone, other marital status, 1999 income 100-132% of poverty level - county
12571 0 866.4233553 1005.16
unmar132_242 Females aged 20-24 not Hispanic/Latino, black alone, other marital status, 1999 income 100-132% of poverty level - county
12571 0 606.9442367 950.2513301
unmar132_243 Females aged 20-24 not Hispanic/Latino, Asian/other race, other marital status, 1999 income 100-132% of poverty level - county
12571 0 307.9796357 671.8813654
unmar132_244 Females aged 20-24 Hispanic or Latino, other marital status, 1999 income 100-132% of poverty level - county
12571 0 1294.45 3111.83
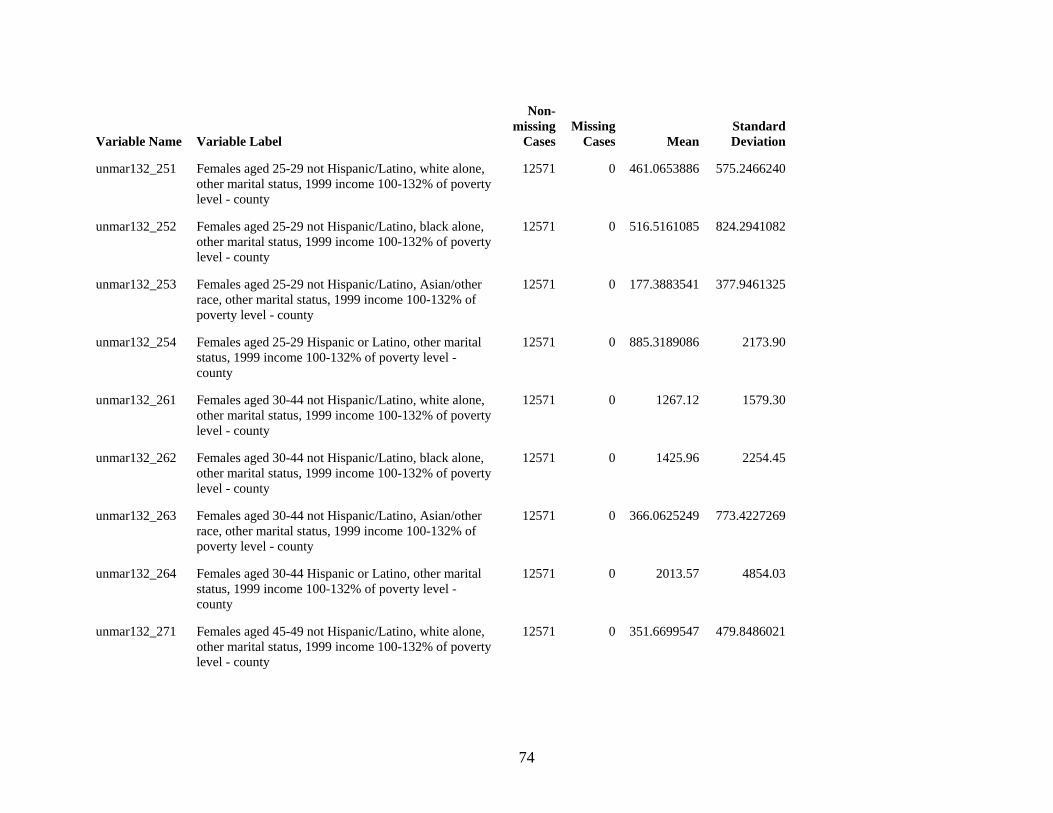
74
Variable Name Variable Label
Non-missing
CasesMissing
Cases MeanStandard Deviation
unmar132_251 Females aged 25-29 not Hispanic/Latino, white alone, other marital status, 1999 income 100-132% of poverty level - county
12571 0 461.0653886 575.2466240
unmar132_252 Females aged 25-29 not Hispanic/Latino, black alone, other marital status, 1999 income 100-132% of poverty level - county
12571 0 516.5161085 824.2941082
unmar132_253 Females aged 25-29 not Hispanic/Latino, Asian/other race, other marital status, 1999 income 100-132% of poverty level - county
12571 0 177.3883541 377.9461325
unmar132_254 Females aged 25-29 Hispanic or Latino, other marital status, 1999 income 100-132% of poverty level - county
12571 0 885.3189086 2173.90
unmar132_261 Females aged 30-44 not Hispanic/Latino, white alone, other marital status, 1999 income 100-132% of poverty level - county
12571 0 1267.12 1579.30
unmar132_262 Females aged 30-44 not Hispanic/Latino, black alone, other marital status, 1999 income 100-132% of poverty level - county
12571 0 1425.96 2254.45
unmar132_263 Females aged 30-44 not Hispanic/Latino, Asian/other race, other marital status, 1999 income 100-132% of poverty level - county
12571 0 366.0625249 773.4227269
unmar132_264 Females aged 30-44 Hispanic or Latino, other marital status, 1999 income 100-132% of poverty level - county
12571 0 2013.57 4854.03
unmar132_271 Females aged 45-49 not Hispanic/Latino, white alone, other marital status, 1999 income 100-132% of poverty level - county
12571 0 351.6699547 479.8486021
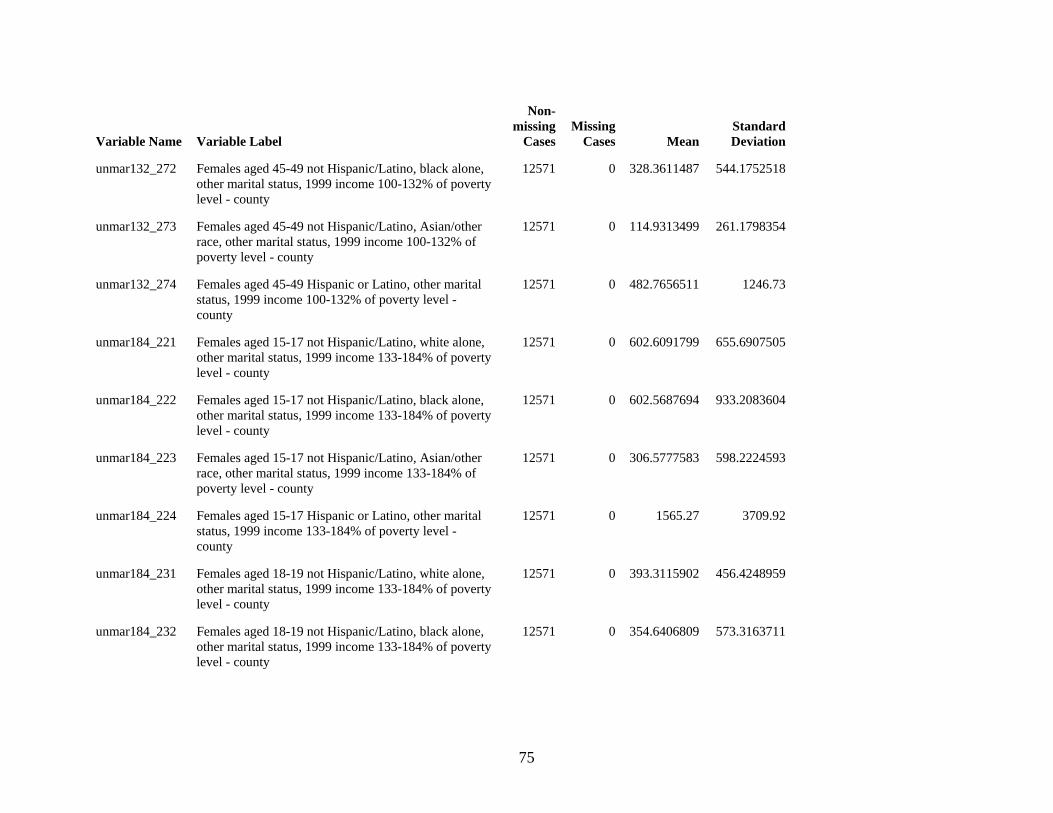
75
Variable Name Variable Label
Non-missing
CasesMissing
Cases MeanStandard Deviation
unmar132_272 Females aged 45-49 not Hispanic/Latino, black alone, other marital status, 1999 income 100-132% of poverty level - county
12571 0 328.3611487 544.1752518
unmar132_273 Females aged 45-49 not Hispanic/Latino, Asian/other race, other marital status, 1999 income 100-132% of poverty level - county
12571 0 114.9313499 261.1798354
unmar132_274 Females aged 45-49 Hispanic or Latino, other marital status, 1999 income 100-132% of poverty level - county
12571 0 482.7656511 1246.73
unmar184_221 Females aged 15-17 not Hispanic/Latino, white alone, other marital status, 1999 income 133-184% of poverty level - county
12571 0 602.6091799 655.6907505
unmar184_222 Females aged 15-17 not Hispanic/Latino, black alone, other marital status, 1999 income 133-184% of poverty level - county
12571 0 602.5687694 933.2083604
unmar184_223 Females aged 15-17 not Hispanic/Latino, Asian/other race, other marital status, 1999 income 133-184% of poverty level - county
12571 0 306.5777583 598.2224593
unmar184_224 Females aged 15-17 Hispanic or Latino, other marital status, 1999 income 133-184% of poverty level - county
12571 0 1565.27 3709.92
unmar184_231 Females aged 18-19 not Hispanic/Latino, white alone, other marital status, 1999 income 133-184% of poverty level - county
12571 0 393.3115902 456.4248959
unmar184_232 Females aged 18-19 not Hispanic/Latino, black alone, other marital status, 1999 income 133-184% of poverty level - county
12571 0 354.6406809 573.3163711
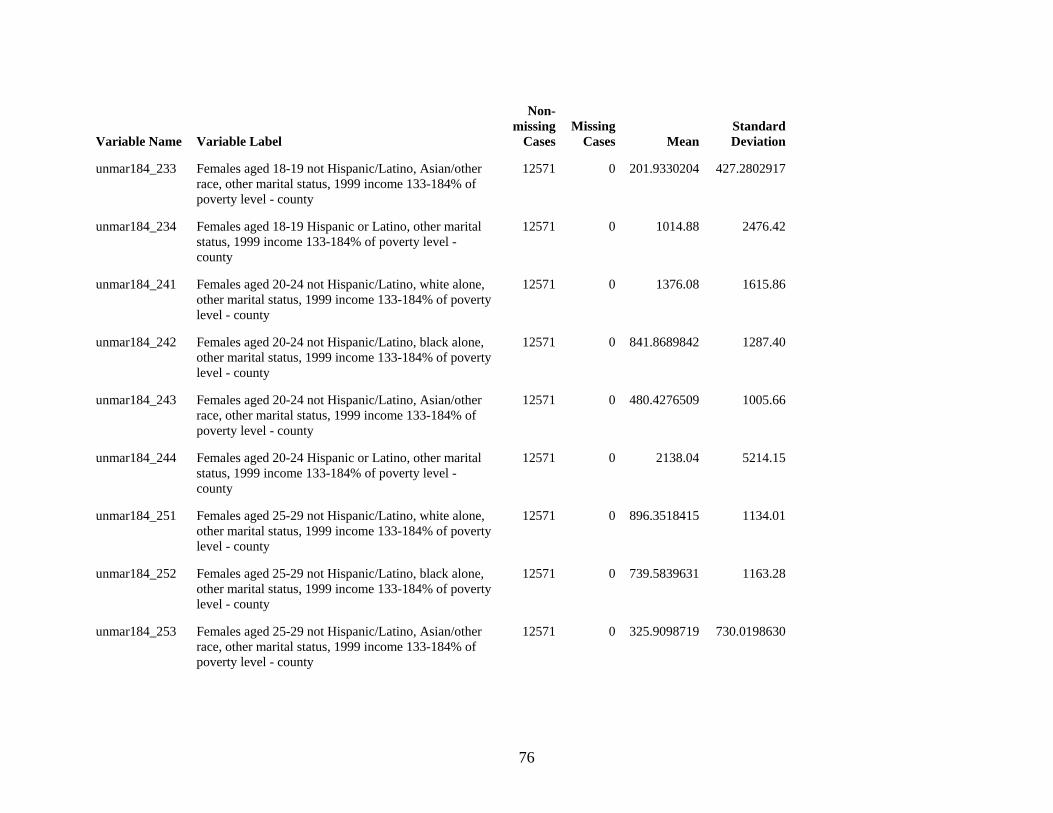
76
Variable Name Variable Label
Non-missing
CasesMissing
Cases MeanStandard Deviation
unmar184_233 Females aged 18-19 not Hispanic/Latino, Asian/other race, other marital status, 1999 income 133-184% of poverty level - county
12571 0 201.9330204 427.2802917
unmar184_234 Females aged 18-19 Hispanic or Latino, other marital status, 1999 income 133-184% of poverty level - county
12571 0 1014.88 2476.42
unmar184_241 Females aged 20-24 not Hispanic/Latino, white alone, other marital status, 1999 income 133-184% of poverty level - county
12571 0 1376.08 1615.86
unmar184_242 Females aged 20-24 not Hispanic/Latino, black alone, other marital status, 1999 income 133-184% of poverty level - county
12571 0 841.8689842 1287.40
unmar184_243 Females aged 20-24 not Hispanic/Latino, Asian/other race, other marital status, 1999 income 133-184% of poverty level - county
12571 0 480.4276509 1005.66
unmar184_244 Females aged 20-24 Hispanic or Latino, other marital status, 1999 income 133-184% of poverty level - county
12571 0 2138.04 5214.15
unmar184_251 Females aged 25-29 not Hispanic/Latino, white alone, other marital status, 1999 income 133-184% of poverty level - county
12571 0 896.3518415 1134.01
unmar184_252 Females aged 25-29 not Hispanic/Latino, black alone, other marital status, 1999 income 133-184% of poverty level - county
12571 0 739.5839631 1163.28
unmar184_253 Females aged 25-29 not Hispanic/Latino, Asian/other race, other marital status, 1999 income 133-184% of poverty level - county
12571 0 325.9098719 730.0198630
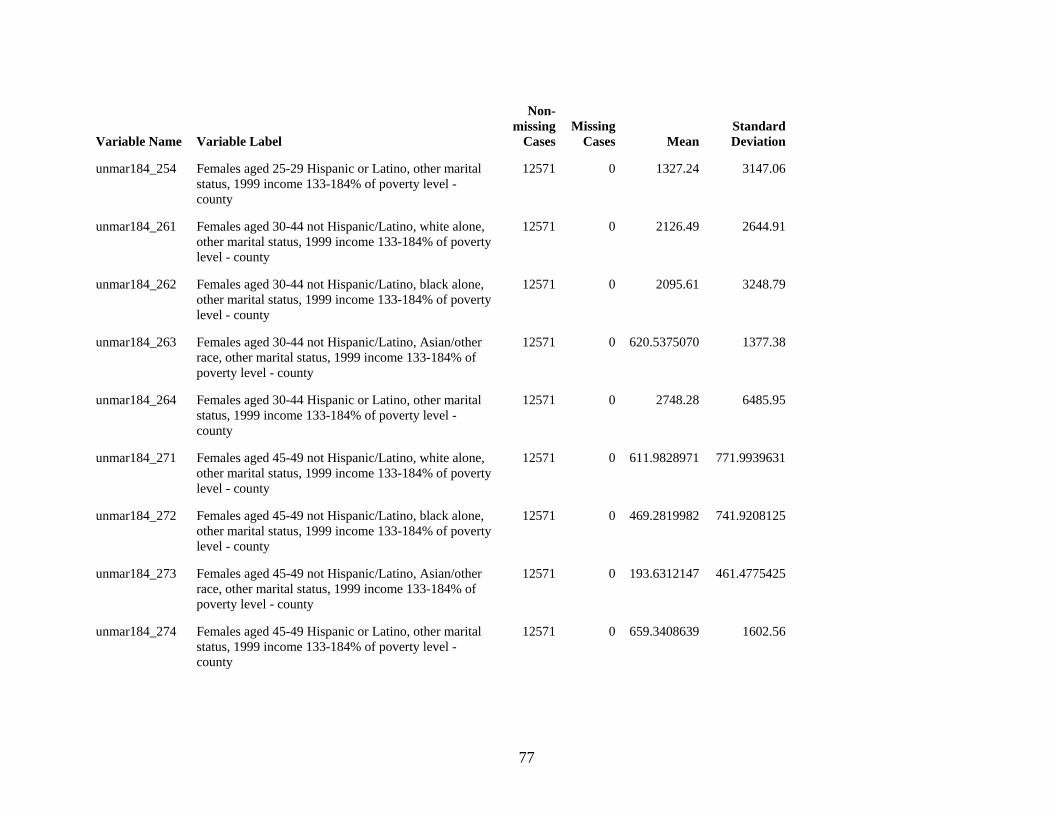
77
Variable Name Variable Label
Non-missing
CasesMissing
Cases MeanStandard Deviation
unmar184_254 Females aged 25-29 Hispanic or Latino, other marital status, 1999 income 133-184% of poverty level - county
12571 0 1327.24 3147.06
unmar184_261 Females aged 30-44 not Hispanic/Latino, white alone, other marital status, 1999 income 133-184% of poverty level - county
12571 0 2126.49 2644.91
unmar184_262 Females aged 30-44 not Hispanic/Latino, black alone, other marital status, 1999 income 133-184% of poverty level - county
12571 0 2095.61 3248.79
unmar184_263 Females aged 30-44 not Hispanic/Latino, Asian/other race, other marital status, 1999 income 133-184% of poverty level - county
12571 0 620.5375070 1377.38
unmar184_264 Females aged 30-44 Hispanic or Latino, other marital status, 1999 income 133-184% of poverty level - county
12571 0 2748.28 6485.95
unmar184_271 Females aged 45-49 not Hispanic/Latino, white alone, other marital status, 1999 income 133-184% of poverty level - county
12571 0 611.9828971 771.9939631
unmar184_272 Females aged 45-49 not Hispanic/Latino, black alone, other marital status, 1999 income 133-184% of poverty level - county
12571 0 469.2819982 741.9208125
unmar184_273 Females aged 45-49 not Hispanic/Latino, Asian/other race, other marital status, 1999 income 133-184% of poverty level - county
12571 0 193.6312147 461.4775425
unmar184_274 Females aged 45-49 Hispanic or Latino, other marital status, 1999 income 133-184% of poverty level - county
12571 0 659.3408639 1602.56
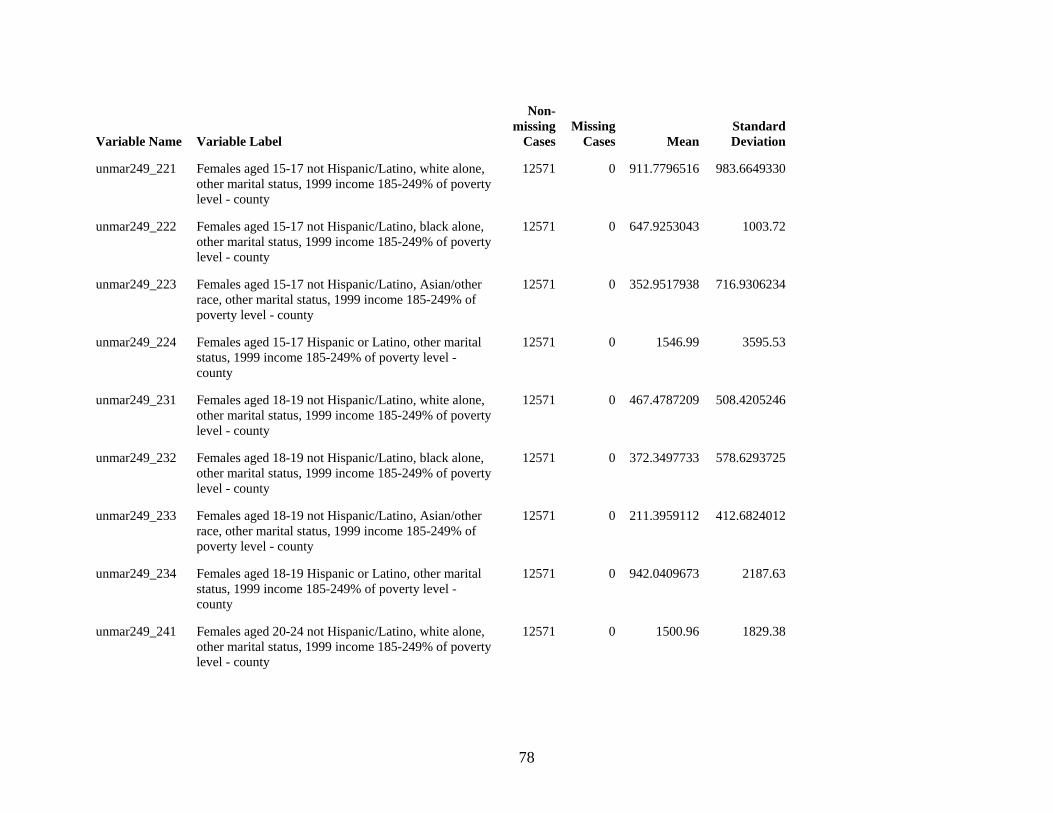
78
Variable Name Variable Label
Non-missing
CasesMissing
Cases MeanStandard Deviation
unmar249_221 Females aged 15-17 not Hispanic/Latino, white alone, other marital status, 1999 income 185-249% of poverty level - county
12571 0 911.7796516 983.6649330
unmar249_222 Females aged 15-17 not Hispanic/Latino, black alone, other marital status, 1999 income 185-249% of poverty level - county
12571 0 647.9253043 1003.72
unmar249_223 Females aged 15-17 not Hispanic/Latino, Asian/other race, other marital status, 1999 income 185-249% of poverty level - county
12571 0 352.9517938 716.9306234
unmar249_224 Females aged 15-17 Hispanic or Latino, other marital status, 1999 income 185-249% of poverty level - county
12571 0 1546.99 3595.53
unmar249_231 Females aged 18-19 not Hispanic/Latino, white alone, other marital status, 1999 income 185-249% of poverty level - county
12571 0 467.4787209 508.4205246
unmar249_232 Females aged 18-19 not Hispanic/Latino, black alone, other marital status, 1999 income 185-249% of poverty level - county
12571 0 372.3497733 578.6293725
unmar249_233 Females aged 18-19 not Hispanic/Latino, Asian/other race, other marital status, 1999 income 185-249% of poverty level - county
12571 0 211.3959112 412.6824012
unmar249_234 Females aged 18-19 Hispanic or Latino, other marital status, 1999 income 185-249% of poverty level - county
12571 0 942.0409673 2187.63
unmar249_241 Females aged 20-24 not Hispanic/Latino, white alone, other marital status, 1999 income 185-249% of poverty level - county
12571 0 1500.96 1829.38
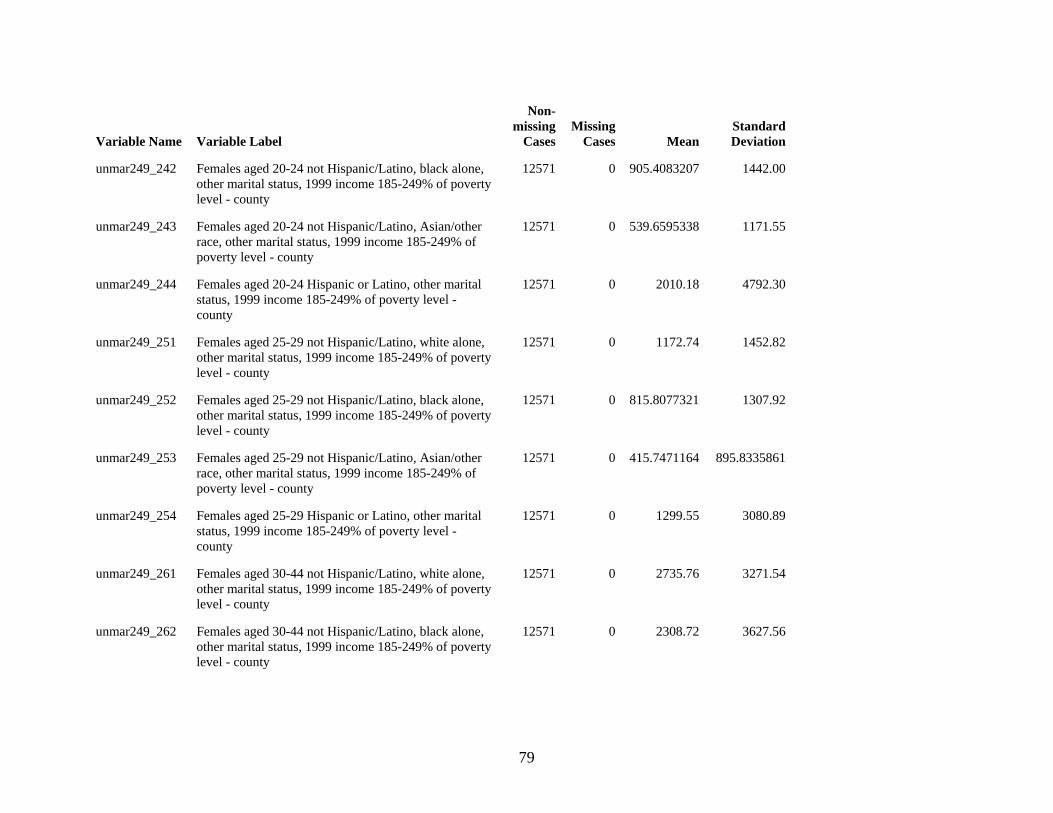
79
Variable Name Variable Label
Non-missing
CasesMissing
Cases MeanStandard Deviation
unmar249_242 Females aged 20-24 not Hispanic/Latino, black alone, other marital status, 1999 income 185-249% of poverty level - county
12571 0 905.4083207 1442.00
unmar249_243 Females aged 20-24 not Hispanic/Latino, Asian/other race, other marital status, 1999 income 185-249% of poverty level - county
12571 0 539.6595338 1171.55
unmar249_244 Females aged 20-24 Hispanic or Latino, other marital status, 1999 income 185-249% of poverty level - county
12571 0 2010.18 4792.30
unmar249_251 Females aged 25-29 not Hispanic/Latino, white alone, other marital status, 1999 income 185-249% of poverty level - county
12571 0 1172.74 1452.82
unmar249_252 Females aged 25-29 not Hispanic/Latino, black alone, other marital status, 1999 income 185-249% of poverty level - county
12571 0 815.8077321 1307.92
unmar249_253 Females aged 25-29 not Hispanic/Latino, Asian/other race, other marital status, 1999 income 185-249% of poverty level - county
12571 0 415.7471164 895.8335861
unmar249_254 Females aged 25-29 Hispanic or Latino, other marital status, 1999 income 185-249% of poverty level - county
12571 0 1299.55 3080.89
unmar249_261 Females aged 30-44 not Hispanic/Latino, white alone, other marital status, 1999 income 185-249% of poverty level - county
12571 0 2735.76 3271.54
unmar249_262 Females aged 30-44 not Hispanic/Latino, black alone, other marital status, 1999 income 185-249% of poverty level - county
12571 0 2308.72 3627.56
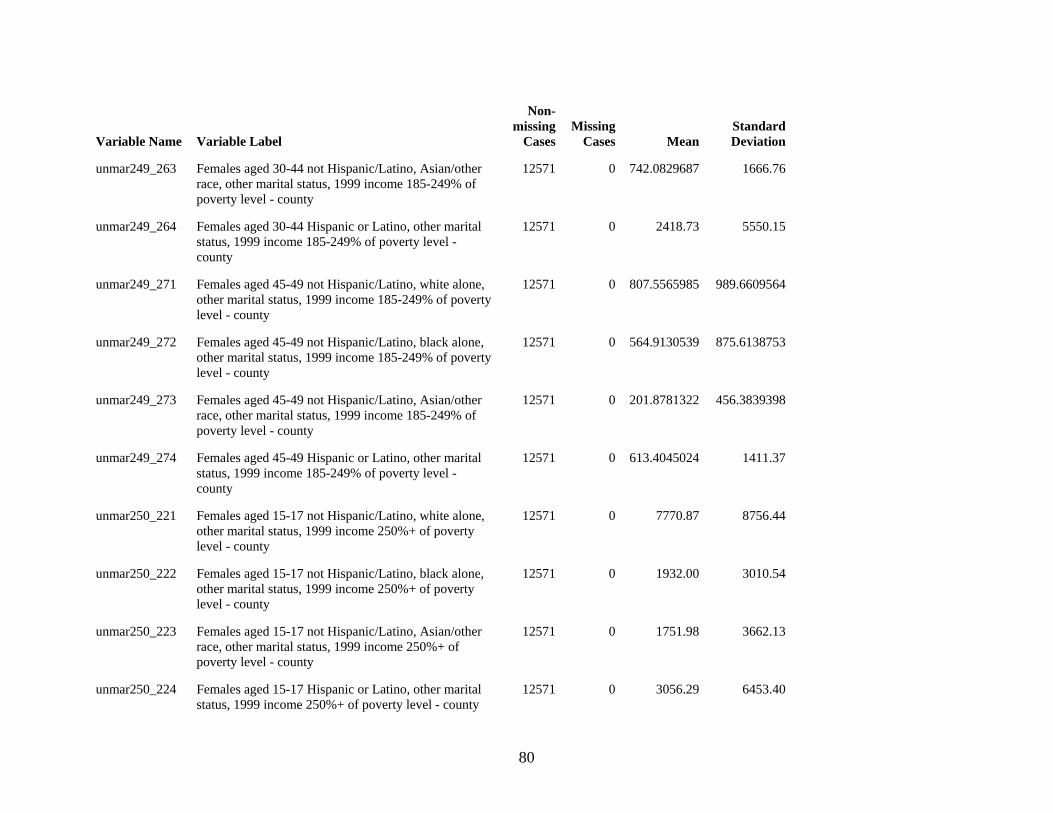
80
Variable Name Variable Label
Non-missing
CasesMissing
Cases MeanStandard Deviation
unmar249_263 Females aged 30-44 not Hispanic/Latino, Asian/other race, other marital status, 1999 income 185-249% of poverty level - county
12571 0 742.0829687 1666.76
unmar249_264 Females aged 30-44 Hispanic or Latino, other marital status, 1999 income 185-249% of poverty level - county
12571 0 2418.73 5550.15
unmar249_271 Females aged 45-49 not Hispanic/Latino, white alone, other marital status, 1999 income 185-249% of poverty level - county
12571 0 807.5565985 989.6609564
unmar249_272 Females aged 45-49 not Hispanic/Latino, black alone, other marital status, 1999 income 185-249% of poverty level - county
12571 0 564.9130539 875.6138753
unmar249_273 Females aged 45-49 not Hispanic/Latino, Asian/other race, other marital status, 1999 income 185-249% of poverty level - county
12571 0 201.8781322 456.3839398
unmar249_274 Females aged 45-49 Hispanic or Latino, other marital status, 1999 income 185-249% of poverty level - county
12571 0 613.4045024 1411.37
unmar250_221 Females aged 15-17 not Hispanic/Latino, white alone, other marital status, 1999 income 250%+ of poverty level - county
12571 0 7770.87 8756.44
unmar250_222 Females aged 15-17 not Hispanic/Latino, black alone, other marital status, 1999 income 250%+ of poverty level - county
12571 0 1932.00 3010.54
unmar250_223 Females aged 15-17 not Hispanic/Latino, Asian/other race, other marital status, 1999 income 250%+ of poverty level - county
12571 0 1751.98 3662.13
unmar250_224 Females aged 15-17 Hispanic or Latino, other marital status, 1999 income 250%+ of poverty level - county
12571 0 3056.29 6453.40
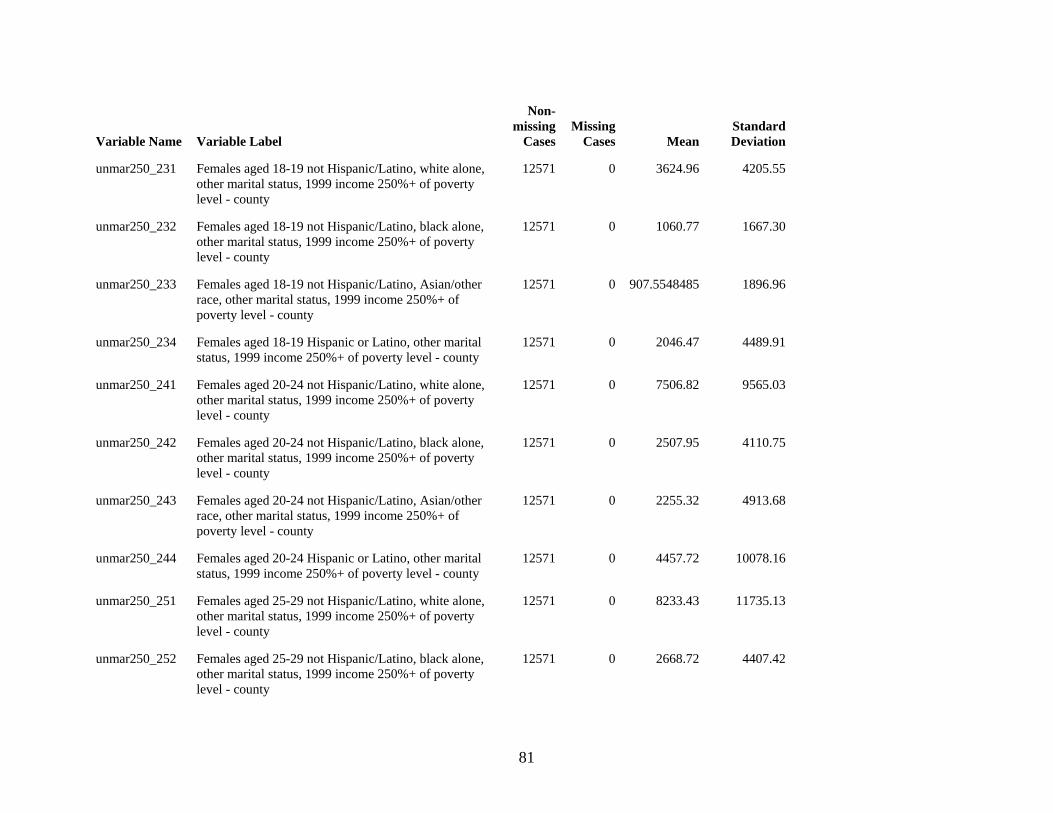
81
Variable Name Variable Label
Non-missing
CasesMissing
Cases MeanStandard Deviation
unmar250_231 Females aged 18-19 not Hispanic/Latino, white alone, other marital status, 1999 income 250%+ of poverty level - county
12571 0 3624.96 4205.55
unmar250_232 Females aged 18-19 not Hispanic/Latino, black alone, other marital status, 1999 income 250%+ of poverty level - county
12571 0 1060.77 1667.30
unmar250_233 Females aged 18-19 not Hispanic/Latino, Asian/other race, other marital status, 1999 income 250%+ of poverty level - county
12571 0 907.5548485 1896.96
unmar250_234 Females aged 18-19 Hispanic or Latino, other marital status, 1999 income 250%+ of poverty level - county
12571 0 2046.47 4489.91
unmar250_241 Females aged 20-24 not Hispanic/Latino, white alone, other marital status, 1999 income 250%+ of poverty level - county
12571 0 7506.82 9565.03
unmar250_242 Females aged 20-24 not Hispanic/Latino, black alone, other marital status, 1999 income 250%+ of poverty level - county
12571 0 2507.95 4110.75
unmar250_243 Females aged 20-24 not Hispanic/Latino, Asian/other race, other marital status, 1999 income 250%+ of poverty level - county
12571 0 2255.32 4913.68
unmar250_244 Females aged 20-24 Hispanic or Latino, other marital status, 1999 income 250%+ of poverty level - county
12571 0 4457.72 10078.16
unmar250_251 Females aged 25-29 not Hispanic/Latino, white alone, other marital status, 1999 income 250%+ of poverty level - county
12571 0 8233.43 11735.13
unmar250_252 Females aged 25-29 not Hispanic/Latino, black alone, other marital status, 1999 income 250%+ of poverty level - county
12571 0 2668.72 4407.42
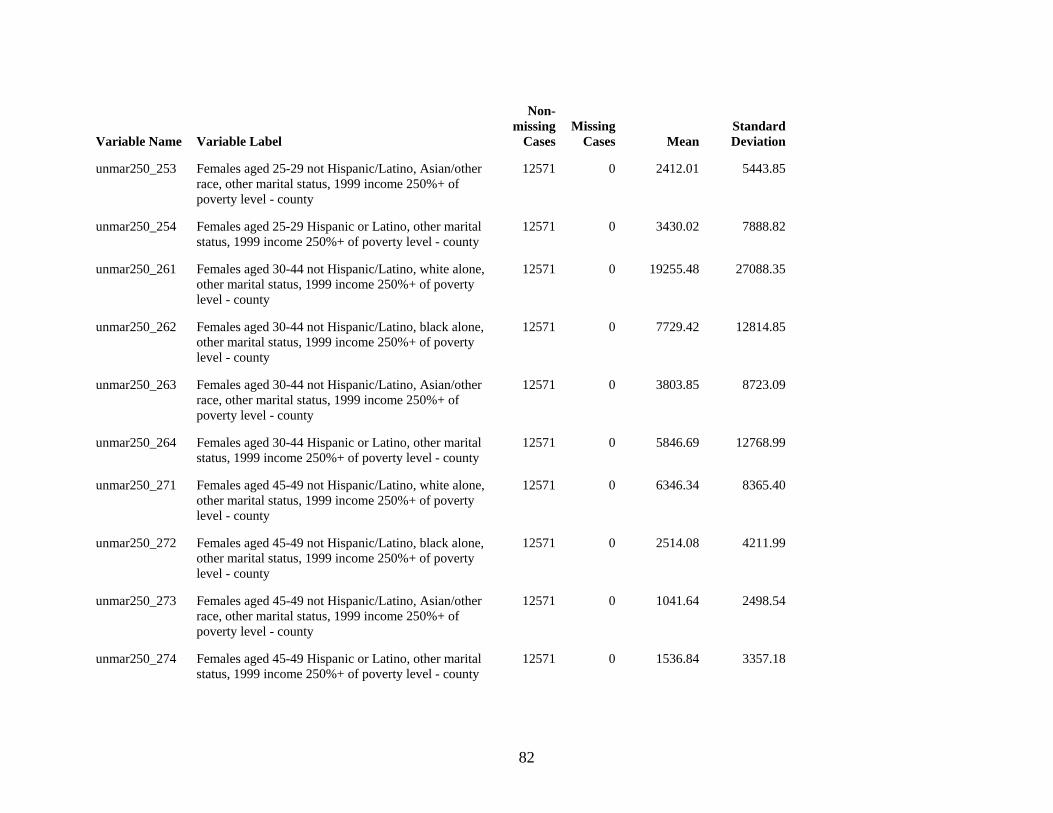
82
Variable Name Variable Label
Non-missing
CasesMissing
Cases MeanStandard Deviation
unmar250_253 Females aged 25-29 not Hispanic/Latino, Asian/other race, other marital status, 1999 income 250%+ of poverty level - county
12571 0 2412.01 5443.85
unmar250_254 Females aged 25-29 Hispanic or Latino, other marital status, 1999 income 250%+ of poverty level - county
12571 0 3430.02 7888.82
unmar250_261 Females aged 30-44 not Hispanic/Latino, white alone, other marital status, 1999 income 250%+ of poverty level - county
12571 0 19255.48 27088.35
unmar250_262 Females aged 30-44 not Hispanic/Latino, black alone, other marital status, 1999 income 250%+ of poverty level - county
12571 0 7729.42 12814.85
unmar250_263 Females aged 30-44 not Hispanic/Latino, Asian/other race, other marital status, 1999 income 250%+ of poverty level - county
12571 0 3803.85 8723.09
unmar250_264 Females aged 30-44 Hispanic or Latino, other marital status, 1999 income 250%+ of poverty level - county
12571 0 5846.69 12768.99
unmar250_271 Females aged 45-49 not Hispanic/Latino, white alone, other marital status, 1999 income 250%+ of poverty level - county
12571 0 6346.34 8365.40
unmar250_272 Females aged 45-49 not Hispanic/Latino, black alone, other marital status, 1999 income 250%+ of poverty level - county
12571 0 2514.08 4211.99
unmar250_273 Females aged 45-49 not Hispanic/Latino, Asian/other race, other marital status, 1999 income 250%+ of poverty level - county
12571 0 1041.64 2498.54
unmar250_274 Females aged 45-49 Hispanic or Latino, other marital status, 1999 income 250%+ of poverty level - county
12571 0 1536.84 3357.18
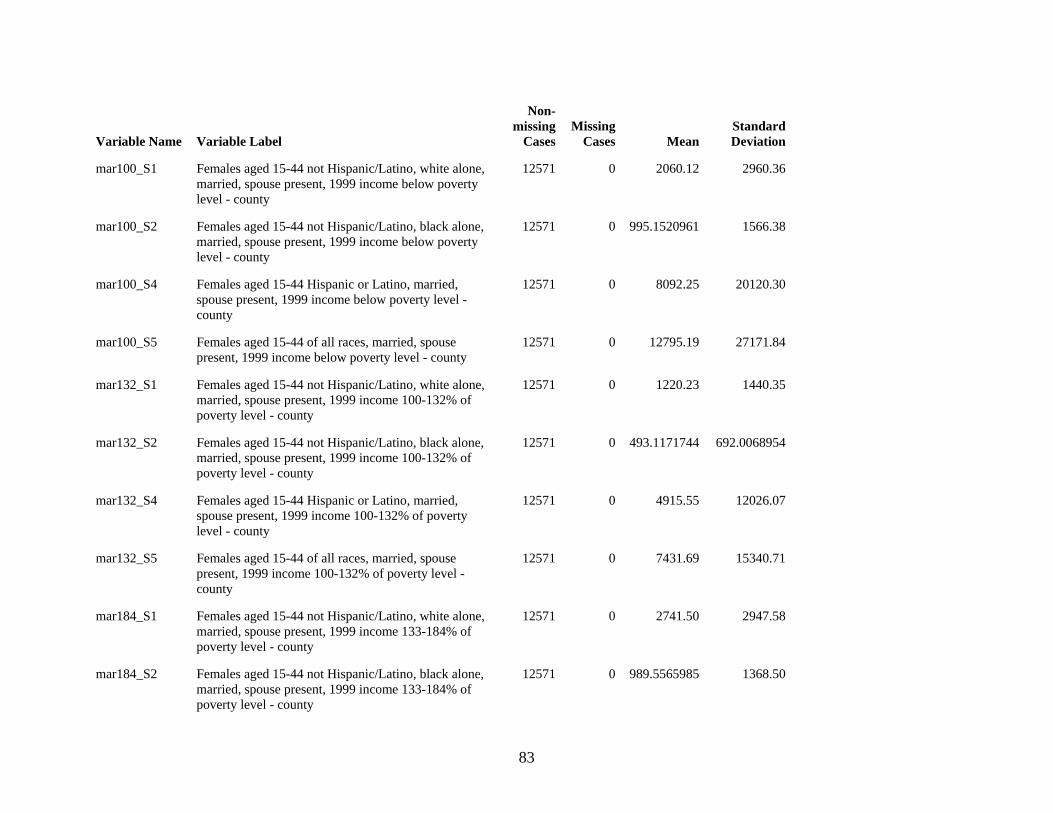
83
Variable Name Variable Label
Non-missing
CasesMissing
Cases MeanStandard Deviation
mar100_S1 Females aged 15-44 not Hispanic/Latino, white alone, married, spouse present, 1999 income below poverty level - county
12571 0 2060.12 2960.36
mar100_S2 Females aged 15-44 not Hispanic/Latino, black alone, married, spouse present, 1999 income below poverty level - county
12571 0 995.1520961 1566.38
mar100_S4 Females aged 15-44 Hispanic or Latino, married, spouse present, 1999 income below poverty level - county
12571 0 8092.25 20120.30
mar100_S5 Females aged 15-44 of all races, married, spouse present, 1999 income below poverty level - county
12571 0 12795.19 27171.84
mar132_S1 Females aged 15-44 not Hispanic/Latino, white alone, married, spouse present, 1999 income 100-132% of poverty level - county
12571 0 1220.23 1440.35
mar132_S2 Females aged 15-44 not Hispanic/Latino, black alone, married, spouse present, 1999 income 100-132% of poverty level - county
12571 0 493.1171744 692.0068954
mar132_S4 Females aged 15-44 Hispanic or Latino, married, spouse present, 1999 income 100-132% of poverty level - county
12571 0 4915.55 12026.07
mar132_S5 Females aged 15-44 of all races, married, spouse present, 1999 income 100-132% of poverty level - county
12571 0 7431.69 15340.71
mar184_S1 Females aged 15-44 not Hispanic/Latino, white alone, married, spouse present, 1999 income 133-184% of poverty level - county
12571 0 2741.50 2947.58
mar184_S2 Females aged 15-44 not Hispanic/Latino, black alone, married, spouse present, 1999 income 133-184% of poverty level - county
12571 0 989.5565985 1368.50
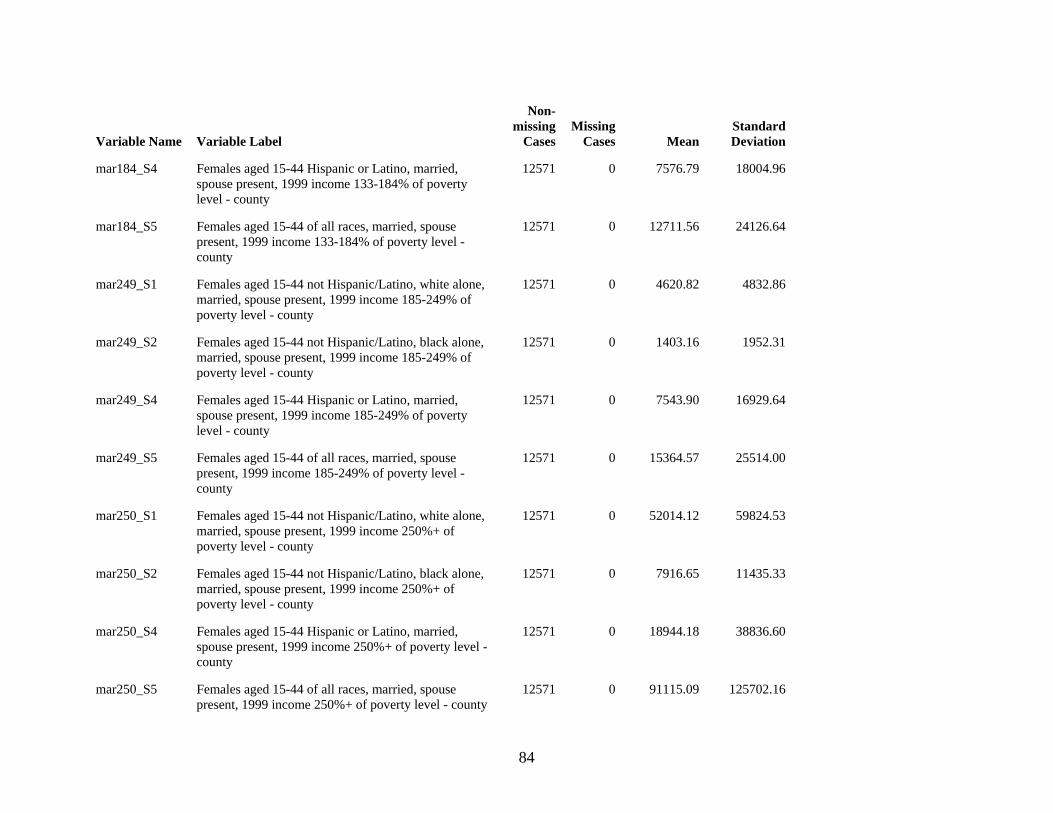
84
Variable Name Variable Label
Non-missing
CasesMissing
Cases MeanStandard Deviation
mar184_S4 Females aged 15-44 Hispanic or Latino, married, spouse present, 1999 income 133-184% of poverty level - county
12571 0 7576.79 18004.96
mar184_S5 Females aged 15-44 of all races, married, spouse present, 1999 income 133-184% of poverty level - county
12571 0 12711.56 24126.64
mar249_S1 Females aged 15-44 not Hispanic/Latino, white alone, married, spouse present, 1999 income 185-249% of poverty level - county
12571 0 4620.82 4832.86
mar249_S2 Females aged 15-44 not Hispanic/Latino, black alone, married, spouse present, 1999 income 185-249% of poverty level - county
12571 0 1403.16 1952.31
mar249_S4 Females aged 15-44 Hispanic or Latino, married, spouse present, 1999 income 185-249% of poverty level - county
12571 0 7543.90 16929.64
mar249_S5 Females aged 15-44 of all races, married, spouse present, 1999 income 185-249% of poverty level - county
12571 0 15364.57 25514.00
mar250_S1 Females aged 15-44 not Hispanic/Latino, white alone, married, spouse present, 1999 income 250%+ of poverty level - county
12571 0 52014.12 59824.53
mar250_S2 Females aged 15-44 not Hispanic/Latino, black alone, married, spouse present, 1999 income 250%+ of poverty level - county
12571 0 7916.65 11435.33
mar250_S4 Females aged 15-44 Hispanic or Latino, married, spouse present, 1999 income 250%+ of poverty level - county
12571 0 18944.18 38836.60
mar250_S5 Females aged 15-44 of all races, married, spouse present, 1999 income 250%+ of poverty level - county
12571 0 91115.09 125702.16
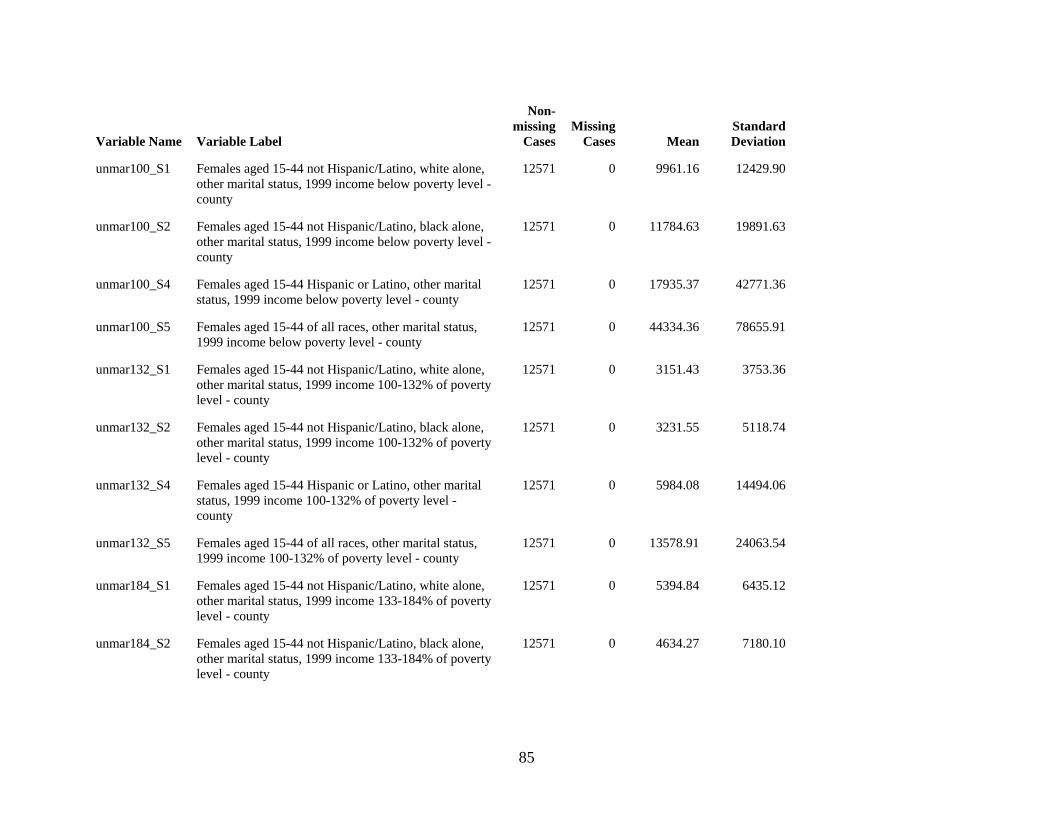
85
Variable Name Variable Label
Non-missing
CasesMissing
Cases MeanStandard Deviation
unmar100_S1 Females aged 15-44 not Hispanic/Latino, white alone, other marital status, 1999 income below poverty level - county
12571 0 9961.16 12429.90
unmar100_S2 Females aged 15-44 not Hispanic/Latino, black alone, other marital status, 1999 income below poverty level - county
12571 0 11784.63 19891.63
unmar100_S4 Females aged 15-44 Hispanic or Latino, other marital status, 1999 income below poverty level - county
12571 0 17935.37 42771.36
unmar100_S5 Females aged 15-44 of all races, other marital status, 1999 income below poverty level - county
12571 0 44334.36 78655.91
unmar132_S1 Females aged 15-44 not Hispanic/Latino, white alone, other marital status, 1999 income 100-132% of poverty level - county
12571 0 3151.43 3753.36
unmar132_S2 Females aged 15-44 not Hispanic/Latino, black alone, other marital status, 1999 income 100-132% of poverty level - county
12571 0 3231.55 5118.74
unmar132_S4 Females aged 15-44 Hispanic or Latino, other marital status, 1999 income 100-132% of poverty level - county
12571 0 5984.08 14494.06
unmar132_S5 Females aged 15-44 of all races, other marital status, 1999 income 100-132% of poverty level - county
12571 0 13578.91 24063.54
unmar184_S1 Females aged 15-44 not Hispanic/Latino, white alone, other marital status, 1999 income 133-184% of poverty level - county
12571 0 5394.84 6435.12
unmar184_S2 Females aged 15-44 not Hispanic/Latino, black alone, other marital status, 1999 income 133-184% of poverty level - county
12571 0 4634.27 7180.10
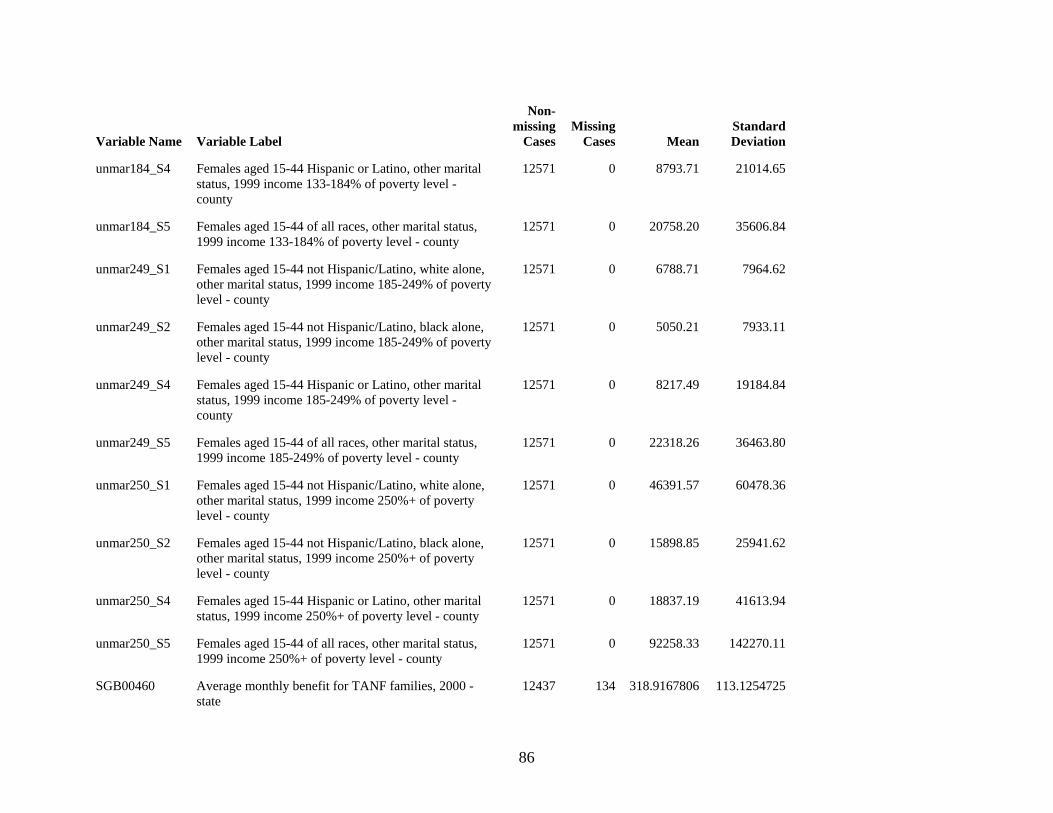
86
Variable Name Variable Label
Non-missing
CasesMissing
Cases MeanStandard Deviation
unmar184_S4 Females aged 15-44 Hispanic or Latino, other marital status, 1999 income 133-184% of poverty level - county
12571 0 8793.71 21014.65
unmar184_S5 Females aged 15-44 of all races, other marital status, 1999 income 133-184% of poverty level - county
12571 0 20758.20 35606.84
unmar249_S1 Females aged 15-44 not Hispanic/Latino, white alone, other marital status, 1999 income 185-249% of poverty level - county
12571 0 6788.71 7964.62
unmar249_S2 Females aged 15-44 not Hispanic/Latino, black alone, other marital status, 1999 income 185-249% of poverty level - county
12571 0 5050.21 7933.11
unmar249_S4 Females aged 15-44 Hispanic or Latino, other marital status, 1999 income 185-249% of poverty level - county
12571 0 8217.49 19184.84
unmar249_S5 Females aged 15-44 of all races, other marital status, 1999 income 185-249% of poverty level - county
12571 0 22318.26 36463.80
unmar250_S1 Females aged 15-44 not Hispanic/Latino, white alone, other marital status, 1999 income 250%+ of poverty level - county
12571 0 46391.57 60478.36
unmar250_S2 Females aged 15-44 not Hispanic/Latino, black alone, other marital status, 1999 income 250%+ of poverty level - county
12571 0 15898.85 25941.62
unmar250_S4 Females aged 15-44 Hispanic or Latino, other marital status, 1999 income 250%+ of poverty level - county
12571 0 18837.19 41613.94
unmar250_S5 Females aged 15-44 of all races, other marital status, 1999 income 250%+ of poverty level - county
12571 0 92258.33 142270.11
SGB00460 Average monthly benefit for TANF families, 2000 - state
12437 134 318.9167806 113.1254725
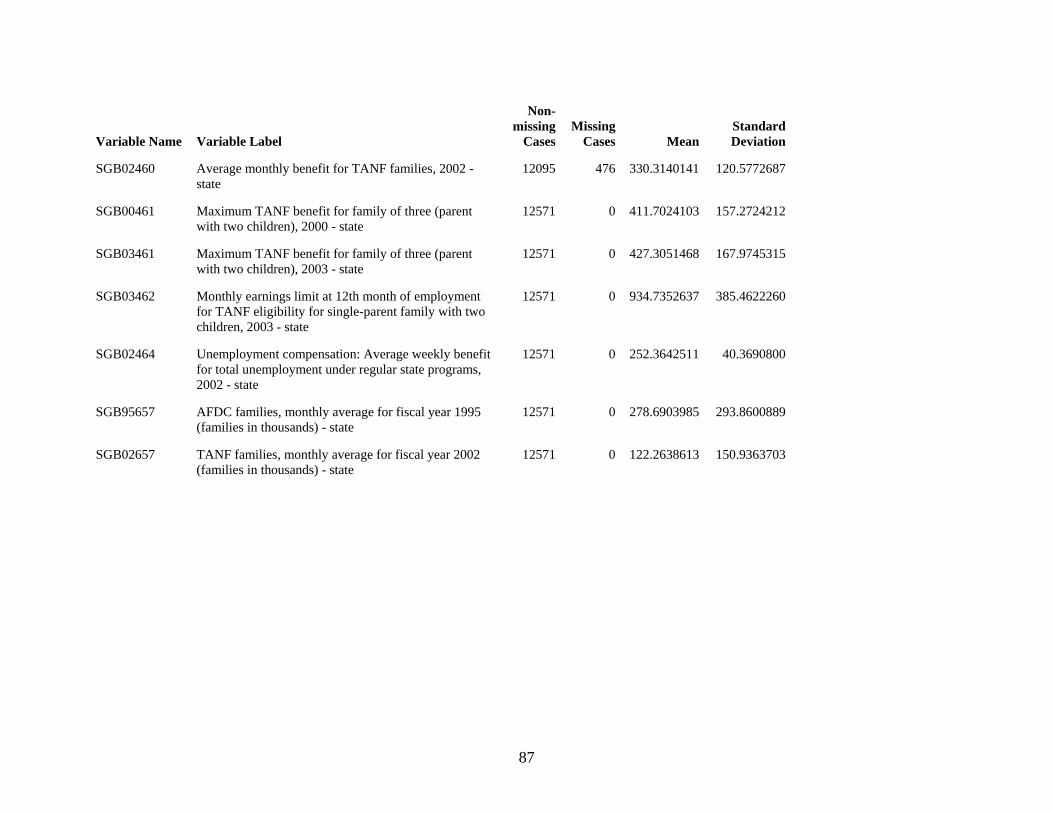
87
Variable Name Variable Label
Non-missing
CasesMissing
Cases MeanStandard Deviation
SGB02460 Average monthly benefit for TANF families, 2002 - state
12095 476 330.3140141 120.5772687
SGB00461 Maximum TANF benefit for family of three (parent with two children), 2000 - state
12571 0 411.7024103 157.2724212
SGB03461 Maximum TANF benefit for family of three (parent with two children), 2003 - state
12571 0 427.3051468 167.9745315
SGB03462 Monthly earnings limit at 12th month of employment for TANF eligibility for single-parent family with two children, 2003 - state
12571 0 934.7352637 385.4622260
SGB02464 Unemployment compensation: Average weekly benefit for total unemployment under regular state programs, 2002 - state
12571 0 252.3642511 40.3690800
SGB95657 AFDC families, monthly average for fiscal year 1995 (families in thousands) - state
12571 0 278.6903985 293.8600889
SGB02657 TANF families, monthly average for fiscal year 2002 (families in thousands) - state
12571 0 122.2638613 150.9363703
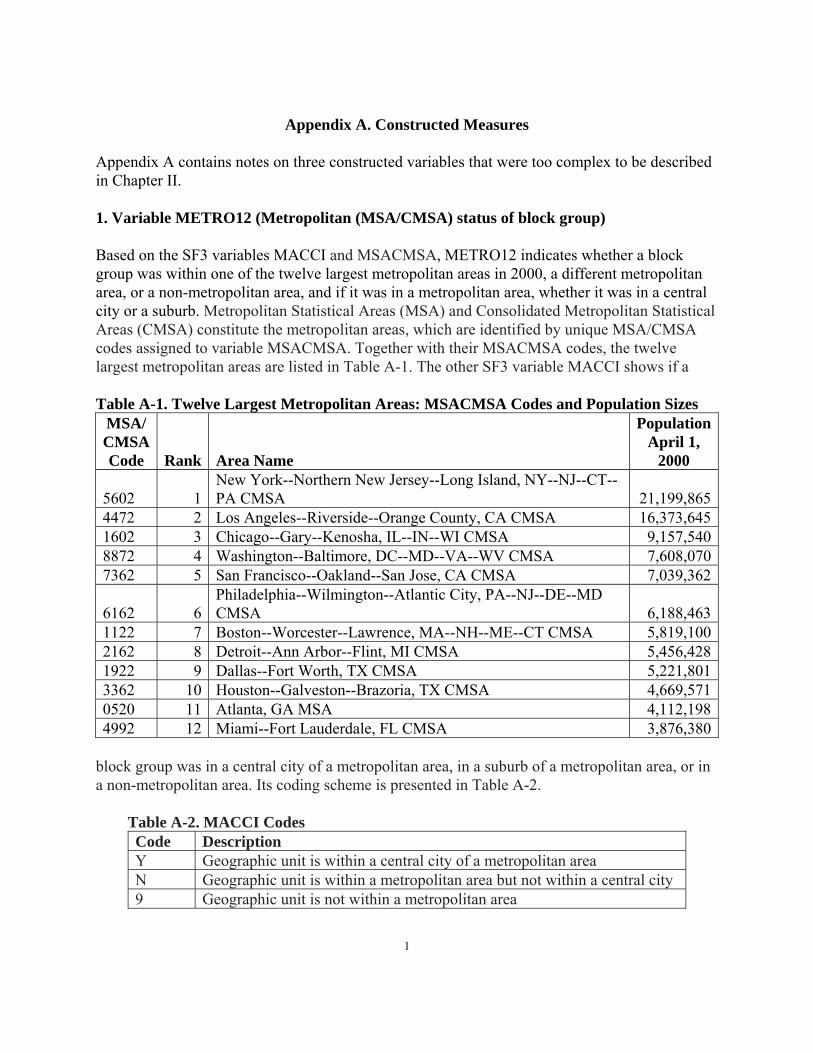
1
Appendix A. Constructed Measures
Appendix A contains notes on three constructed variables that were too complex to be described in Chapter II.
1. Variable METRO12 (Metropolitan (MSA/CMSA) status of block group) Based on the SF3 variables MACCI and MSACMSA, METRO12 indicates whether a block group was within one of the twelve largest metropolitan areas in 2000, a different metropolitan area, or a non-metropolitan area, and if it was in a metropolitan area, whether it was in a central city or a suburb. Metropolitan Statistical Areas (MSA) and Consolidated Metropolitan Statistical Areas (CMSA) constitute the metropolitan areas, which are identified by unique MSA/CMSA codes assigned to variable MSACMSA. Together with their MSACMSA codes, the twelve largest metropolitan areas are listed in Table A-1. The other SF3 variable MACCI shows if a Table A-1. Twelve Largest Metropolitan Areas: MSACMSA Codes and Population Sizes
MSA/ CMSA Code Rank Area Name
PopulationApril 1,
2000
5602 1 New York--Northern New Jersey--Long Island, NY--NJ--CT--PA CMSA 21,199,865
4472 2 Los Angeles--Riverside--Orange County, CA CMSA 16,373,6451602 3 Chicago--Gary--Kenosha, IL--IN--WI CMSA 9,157,5408872 4 Washington--Baltimore, DC--MD--VA--WV CMSA 7,608,0707362 5 San Francisco--Oakland--San Jose, CA CMSA 7,039,362
6162 6 Philadelphia--Wilmington--Atlantic City, PA--NJ--DE--MD CMSA 6,188,463
1122 7 Boston--Worcester--Lawrence, MA--NH--ME--CT CMSA 5,819,1002162 8 Detroit--Ann Arbor--Flint, MI CMSA 5,456,4281922 9 Dallas--Fort Worth, TX CMSA 5,221,8013362 10 Houston--Galveston--Brazoria, TX CMSA 4,669,5710520 11 Atlanta, GA MSA 4,112,1984992 12 Miami--Fort Lauderdale, FL CMSA 3,876,380
block group was in a central city of a metropolitan area, in a suburb of a metropolitan area, or in a non-metropolitan area. Its coding scheme is presented in Table A-2. Table A-2. MACCI Codes
Code Description Y Geographic unit is within a central city of a metropolitan area N Geographic unit is within a metropolitan area but not within a central city 9 Geographic unit is not within a metropolitan area
2
METRO12 was computed as follows:
If MACCI equals Y and MSACMSA equals the MSA/CMSA code of one the twelve largest metropolitan areas, then METRO12=1 If MACCI equals Y and MSACMSA does not equal the MSA/CMSA code of one the twelve largest metropolitan areas, then METRO12=2 If MACCI equals N and MSACMSA equals the MSA/CMSA code of one the twelve largest metropolitan areas, then METRO12=3 If MACCI equals N and MSACMSA does not equal the MSA/CMSA code of one the twelve largest metropolitan areas, then METRO12=4 If MACCI equals 9 then METRO12=5
In instances where a metropolitan block group straddled a central city-suburb boundary so that it was partially in a central city and partially in a suburb, METRO12 was assigned a central city code, i.e., code 1 or 2 depending on the value of MSACMSA. 2. Variable CST00246 (Median 1999 household income for households with householder Asian and other races – county) This median was estimated using Pareto interpolation for grouped data:
Median = exp(Mlb + [p*(Mub - Mlb)]) where Mub is the logarithm of the upper bound of the category containing the median, Mlb is the logarithm of the lower bound of this category, and p is the proportion of the population bounded by Mub and Mlb that lies at or below the median. If the median fell in the final open-ended interval of the income distribution ($200,000 or more), CST00246 was equated to 200,001. If it fell in the lowest income interval (less than $10,000), CST00246 was equated to 9,999. 3. Variable CST00319 (Female Labor Force Opportunity Index, 2000 – county) The Female Labor Force Opportunity Index measures the expected number of jobs for female workers relative to the potential supply of female workers, taking into account the sex-segregated nature of the labor market. Following Nakamura et al. (1979), it is defined as
Σpiwi/F
3
were wi is the number of workers in the county who are in occupation category i, pi is the national proportion of workers in occupation category i who are female, and F is the potential supply of women workers expressed as the number of women in the county aged 16 and older .1
1 Nakamura, Masao, Alice Nakamura, and Dallas Cullen (1979), "Job Opportunities, the Offered Wage, and the Labor Supply of Married Women," American Economic Review , Vol. 69, pp. 787-805.