Embed Size (px)
Citation preview
NANOPETROPHYSICS CHARACTERIZATION OF THE BAKKEN
FORMATION, WILLISTON BASIN, NORTH DAKOTA,
USA
by
JOSEPH IKECHUKWU ANYANWU
Presented to the Faculty of the Graduate School of
The University of Texas at Arlington in Partial Fulfillment
of the Requirements
for the Degree of
MASTER OF SCIENCE IN GEOLOGY
THE UNIVERSITY OF TEXAS AT ARLINGTON
May 2015

ii
Copyright © by Joseph Ikechukwu Anyanwu 2015
All Rights Reserved

iii
Acknowledgements
First of all, I want to give God thanks for His grace, mercy and blessings
upon my life.
I want to say thank you to my supervisor, Dr. Max Qinhong Hu, for his
guidance and support throughout this research project and to my other
committee members, Dr. John Wickham and Dr. Ashley Griffith for their support
throughout the project.
I would like to thank Julie LeFever and the staffs of the Wilson M. Laird
Core and Sample Library and the North Dakota Geological Survey for allowing
me to use their facilities, photographs, and samples.
I would like to thank some members of Center for Collaborative
Characterization of Porous Media (C3PM) in the persons of Troy Barber, Shawn
Yuxiang, Kibria Md Golam, Chris Torres and Douglas Tebo, for their help during
the tests used in this project.
Finally, I would like to thank my parents and siblings for their
unconditional love and support throughout the period of my education. Special
thanks to Donald Madukwe and Louis Ogbeifun for their support and
encouragement.
April 3, 2015
iv
Abstract
NANOPETROPHYSICS CHARACTERIZATION OF THE BAKKEN
FORMATION, WILLISTON BASIN, NORTH DAKOTA,
USA
Joseph Anyanwu, M.S
The University of Texas at Arlington, 2015
Supervising Professor: Max Quinhong Hu
The recent oil boom in the US has been attributed to the result of
hydraulic fracturing and horizontal drilling of shale plays. However despite this
boom, production and maximum recovery is still limited to be only few
percentage of the original oil in place. There have been many studies attempting
to enhance the oil recovery of the Bakken Shale, however one area that has not
been addressed is the structure of the nanopores storing and transporting the
hydrocarbons. The pore geometry and connectivity of these nanopore structures
affect the fluid flow and mass transport, which is linked to overall oil recovery.
This work focuses on the connectivity of the nanopore structure within the
Bakken shale using cores of all three Bakken members obtained from a
producing well in North Dakota. For these tight rock samples, we study pore
structure and edge-accessible porosity, using the following complementary tests:
1) mercury injection capillary pressure (MICP); 2) fluid and tracer imbibition into
initially-dry sample; and 3) tracer diffusion into fluid-saturated sample. Tracer

v
imbibition and diffusion is measured by elemental laser ablation-ICP-MS
mapping.
Results from the MICP show that the Bakken members have nano-sized
pores with low permeability and tortuous flow pathways. Low connectivity of
small pore produce anomalous imbibition behavior indicated by the imbibition
slope, which is consistent with percolation theory. Limited connected pathways
for the tracers were also observed from tracer imbibition and saturated diffusion
tests.
The findings from these innovative approaches provide information on
pore structure and connectivity that can be used in fluid dynamics to estimate
overall oil recovery.

vi
Table of Contents
Acknowledgements ............................................................................................. iii
Abstract .............................................................................................................. iv
List of Illustrations .............................................................................................. viii
List of Tables ...................................................................................................... xii
Chapter 1 Introduction ......................................................................................... 1
1.1 Overview ................................................................................................... 1
1.2 Location of Study Area .............................................................................. 4
1.3 Objectives and Scope of Study .................................................................. 5
1.4 Literature Review and Previous Works on Bakken Formation .................... 6
Chapter 2 Geologic Setting ................................................................................ 10
2.1 Structural History of Williston Basin ......................................................... 10
2.2 Regional Stratigraphy and Sedimentology of the Williston Basin ............. 13
2.3 Stratigraphy of the Bakken Formation ...................................................... 17
2.3.1 Upper Bakken Member ................................................................. 19
2.3.2 Middle Bakken Member................................................................. 19
2.3.3 Lower Bakken Member ................................................................. 20
Chapter 3 Methods of Study .............................................................................. 22
3.1 Sampling Procedure ................................................................................ 22
3.2 Mercury Injection Capillary Pressure (MICP) ........................................... 23
3.3 Fluid Imbibition Tests ............................................................................... 27
3.4 Saturated Diffusion Tests......................................................................... 31

vii
3.5 Tracer Mapping by Laser Ablation-Inductively Coupled Plasma-
Mass Spectrometry (LA–ICP–MS) ................................................................. 33
Chapter 4 Observations and Results ................................................................. 36
4.1 Mercury-Injection Capillary Pressure (MICP) ........................................... 36
4.2 Fluid and Tracer Imbibition ...................................................................... 42
4.2.1 Tracer imbibition and LA-ICP-MS Analyses ................................... 46
4.3 Saturation Diffusion and LA-ICP-MS Analyses ........................................ 51
Chapter 5 Conclusion and Recommendations ................................................... 55
5.1 Conclusion ............................................................................................... 55
5.2 Recommendations ................................................................................... 56
References ........................................................................................................ 58
Biographical Information .................................................................................... 65

viii
List of Illustrations
Figure 1-1 Decline curve analysis of Bakken: showing ten-year probabilistic-type
curve (PTC) for all horizontal wells in the Bakken Formation and Three Forks
Formation (Cook, 2013) ....................................................................................... 3
Figure 1-2 United States area extent of the Williston Basin and Bakken
Formation, Red star symbol the location of the Bell oil field in Stark County
(modified from Pollastro et al., 2010). .................................................................. 4
Figure 1-3 Diagrammatic sketch of a pore structure showing distribution of pore
throats and shapes with connectivity patterns...................................................... 6
Figure 2-1 Geographical extent of Williston Basin and the Bakken Formation
(image source: Energy & Environmental Research Center, 2013, Bakken
Formation) ......................................................................................................... 11
Figure 2-2 General structural extent of the Williston Basin with two major fault
systems responsible for the formation of the basin in the Precambrian (Pollastro
et al., 2010) ....................................................................................................... 12
Figure 2-3 Present day major structural elements of the US portion of the
Williston Basin. Solid black ovals show general location of major areas of oil
production from the Bakken Formation (Pollastro et al., 2010) .......................... 13
Figure 2-4 Time-stratigraphic column of the Williston Basin with Milankovitch
Cycles and Petroleum Plays. Solid black intervals in the source rock column are
for thick accumulations; thin lines indicate an association with carbonate
depositional cycles. For the reservoir rock column, green is for oil and red for
gas; thin lines indicate generalized reservoir rock and do not necessarily

ix
represent the full spectrum of possible reservoirs. E, Early; M, Middle; L, Late;
Pal, Paleocene; Eoc, Eocene; Olig, Oligocene; Mio, Miocene; Plio, Pliocene
(Anna, et al., 2011). Diagram from Anna et al. (2011). ....................................... 15
Figure 2-5 Generalized stratigraphic column for the Williston Basin with Bakken
Formation shown in red (modified from Kuhn et al., 2012). ................................ 16
Figure 2-6 Schematic stratigraphic column of the Bakken Formation with
overlying and underlying Lodgepole and Three-Forks Formations respectively
[modified from Kuhn et al., (2012) and Pollastro et al., (2010)] .......................... 18
Figure 2-7 Typical gamma-ray and resistivity curves of the three members of the
Bakken Formation from Antelope oilfield, McKenzie County, N. Dakota (from
Pollastro et al., 2010) ......................................................................................... 21
Figure 3-1 Photos of Kubas well cores of each Bakken members taken from core
box before they were cut from North Dakota Geological Survey ........................ 22
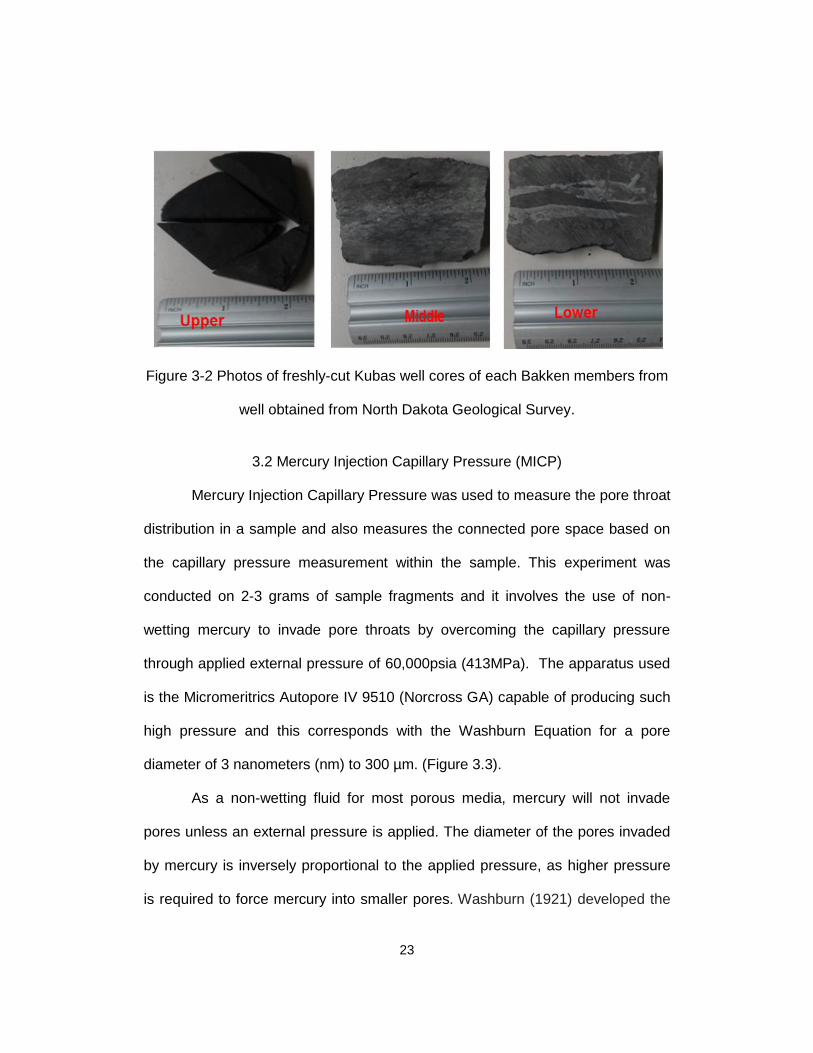
Figure 3-2 Photos of freshly-cut Kubas well cores of each Bakken members from
well obtained from North Dakota Geological Survey. ......................................... 23
Figure 3-3 AutoPore IV® machine used to run Hg injection porosimetry
experiments ....................................................................................................... 25
Figure 3-4 Labelled sample cubes coated with quick cure epoxy; prior to
imbibition ........................................................................................................... 29
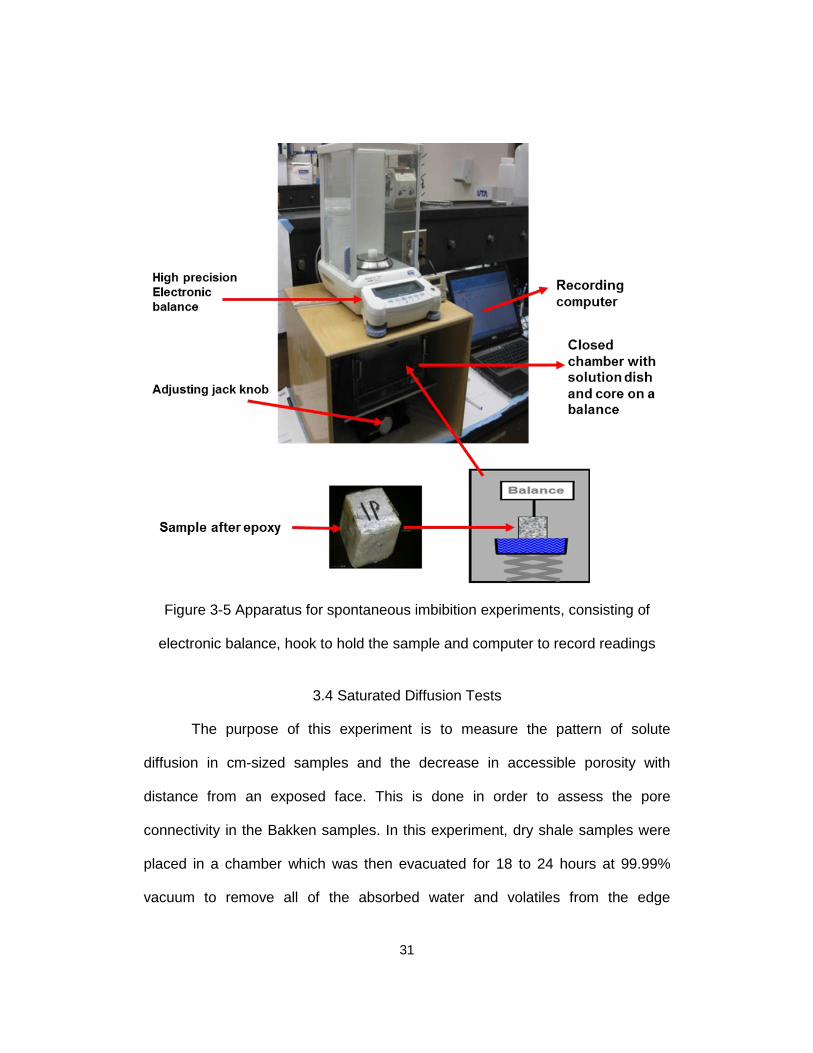
Figure 3-5 Apparatus for spontaneous imbibition experiments, consisting of
electronic balance, hook to hold the sample and computer to record readings .. 31
Figure 3-6 Apparatus for the saturated diffusion experiment; consist of stop clock
and lidded reservoir holding the tracers solution during an experiment .............. 32

x
Figure 3-7 The LA–ICP–MS apparatus for micro‐scale elemental mapping of
tracer distribution patterns in the samples ......................................................... 35
Figure 4-1 MICP analysis of Bakken Formation showing cumulative mercury
intrusion volume versus intrusion pressure for the three Bakken Members. ...... 37
Figure 4-2 Comparison of pore-throat diameters of the three Bakken Members
from MICP analyses showing distribution cumulative intrusion volume versus
pore-throat diameter .......................................................................................... 38
Figure 4-3 Comparison of pore-throat diameters of three Bakken Members from
MICP analyses showing distribution cumulative intrusion volume versus pore-
throat diameter .................................................................................................. 39
Figure 4-4 MICP analysis of Bakken Formation on a histogram showing porosity
versus pore-throat diameter for three Bakken members .................................... 40
Figure 4-5 Imbibition curve and slope for the Middle Bakken: using n-decane with
tracers as imbibition fluid ................................................................................... 43
Figure 4-6 Imbibition curve and slope for the Middle Bakken: using API brine with
tracers as imbibition fluid ................................................................................... 44
Figure 4-7 Imbibition curve and slope for the Middle Bakken: using DI water as
imbibition fluid .................................................................................................... 45
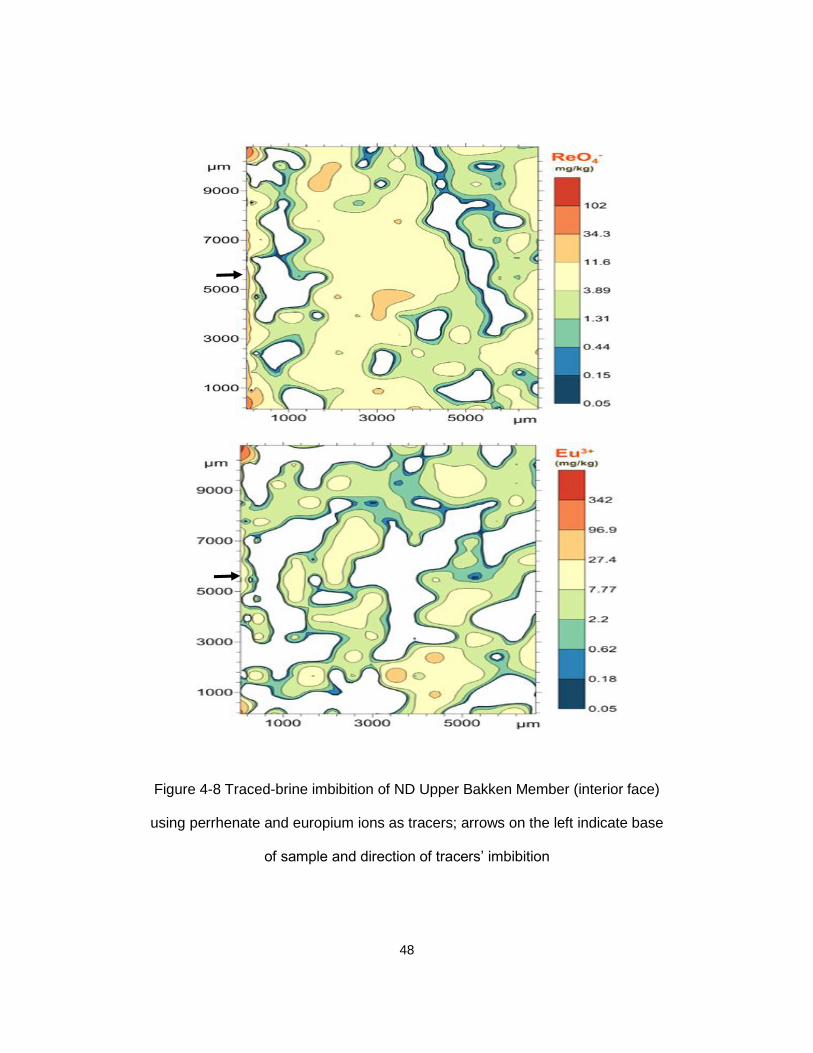
Figure 4-8 Traced-brine imbibition of ND Upper Bakken Member (interior face)
using perrhenate and europium ions as tracers; arrows on the left indicate base
of sample and direction of tracers’ imbibition ..................................................... 48

xi
Figure 4-9 Traced-brine imbibition of ND Middle Bakken Member (interior face)
using perrhenate and europium ions as tracers; arrows on the left indicate base
of sample and direction of tracers’ imbibition ..................................................... 49
Figure 4-10 Tracer imbibition (Brine) of ND Lower Bakken Member (interior face)
using perrhenate and europium ions as tracers; arrows on the left indicate base
of sample and direction of tracers’ imbibition ..................................................... 50
Figure 4-11 Saturated diffusion (Decane) in ND Upper Bakken Member (interior
face) using organic-iodine and rhenium (V); arrows on the left indicate base of
sample and direction of tracers’ diffusion ........................................................... 52
Figure 4-12 Saturated diffusion (Decane) in ND Middle Bakken Member (interior
face) using organic-iodine and rhenium (V); arrows on the left indicate base of
sample and direction of tracers’ diffusion ........................................................... 53
Figure 4-13 Saturated diffusion (Decane) in ND Lower Bakken Member (interior
face) using organic-iodine and rhenium (V); arrows on the left indicate base of
sample and direction of tracers’ diffusion ........................................................... 54
xii
List of Tables
Table 1-1 Summary of the petrophysical parameters ........................................... 9
Table 4-2 Result summary of the MIP experiment; Le is the effective path length
through the pores, while L is the length of the core sample ............................... 41
Table 4-3 Behavior of imbibition slopes as a function of imbibing fluids ............. 46

1
Chapter 1
Introduction
1.1 Overview
Shale oil reservoir developments are a growing source of natural oil and
gas reserves across the United States and North America at large. However,
they cannot be produced at commercial flow rates without the successful
application of some special recovery processes. This is because the shale
reservoir rocks are known for their ultra-low permeability. Despite these poor
petrophysical properties, shale rocks have proven to be an excellent source of oil
and gas, capable of producing at commercial rates, when completed with
hydraulically fractured horizontal wells. The Bakken-Three Forks Formations of
the Williston Basin have been proven to have high recoverable oil at 7.4billion
barrels (USGS, 2013) while the North Dakota Department of Mineral Resources
reported a production of 26,261,633 bbl at 1,132,331 bbl per day as of August
2014 (https://www.dmr.nd.gov/oilgas/stats/statisticsvw.asp). This made Bakken
petroleum system one of the biggest discoveries and an important
unconventional play in the US petroleum system, with production hitting several
billions of barrels from several counties of North Dakota and Montana. However,
despite producing large barrels of oil daily, the North Dakota Bakken play is
producing only 7% of the oil in place (Myths of Bakken: Bismarck Tribune Nov
17th 2014) and this has led to several studies on how to improve recovery.
Hydrocarbon production in tight plays is technically challenging. The
primary economic challenge facing the industry is the relatively high cost of new

2
wells, combined with their rapid initial depletion rate and low recovery factor. The
rapid production decline requires that new wells be drilled, and old wells re-
fractured or re-stimulated, just to maintain production levels. Like every other
play, production in the Bakken play tends to decline several months (years) after
the first production (Figure 1.1) and we hypothesize that this is due to geology
and specifically, the pore structure (geometry and topology) within the matrix.
The Bakken Formation and its petroleum system is comprised of three
members: the Upper (shale), Middle (consisting of dolomites, siltstones and
sandstones), and the Lower (shale) Members. The Upper and Lower members
are organic-rich shale believed to be the source rock, which have expelled oil into
the Middle Bakken layer, the target zone of recent hydraulic fracturing.

3
Figure 1-1 Decline curve analysis of Bakken: showing ten-year probabilistic-type
curve (PTC) for all horizontal wells in the Bakken Formation and Three Forks
Formation (Cook, 2013)
Although, the Middle Bakken is presently the main focus for production
with extensive horizontal drilling operations, hydraulic fracturing and
development, there has been production from the Upper Shale Member since the
late 1970’s to the early 1990s around the southwest part of the basin in North
Dakota (Lefever et al, 1991). However, recently there has been growing interest
in the Upper Bakken and, Sonnenberg (2014) reported that the Upper Shale has
recently been targeted with horizontal drilling and multistage fracture stimulations
in areas where the Middle Member pinches out. Thus, it becomes interesting to

4
study the reservoir potentials of the Bakken Shales with respect to pore-throat
distribution and connectivity.
1.2 Location of Study Area
The location of the study area is geographically situated in the western
part of Stark County in North Dakota. Cores were collected from Kubas well in
the Bell oil field located on latitude and longitude of 46.947777N and -
103.123496W respectively (Figure 1.2).
Figure 1-2 United States area extent of the Williston Basin and Bakken
Formation, Red star symbol the location of the Bell oil field in Stark County
(modified from Pollastro et al., 2010).

5
1.3 Objectives and Scope of Study
The main objective of this work is to study and characterize the nanopore
structure and probe connectivity within the Bakken cores from distribution pattern
of tracers in fluid by using complementary laboratory experiments.
As a result of pore structure and low pore connectivity, large amounts of
hydrocarbons are left behind during primary production. Hu et al., (2012)
reported that fluid flow and solute transport in rock are macroscopic
consequences of the pore structure, which integrates geometry (e.g., pore size
and shape, pore-size distribution) and topology (e.g., pore connectivity) (Figure
1.3). The pore size distribution, porosity, permeability and natural fracture
conduits determine the storativity and transmissibility of oil in the rock matrix, and
as such, when pore connectivity is low, topological factors outweigh the better-
known geometrical factors (Ewing and Horton, 2002; Hu et al., 2002; Hunt et al.,
2014).
Since good pore network provides flow channels for enhanced oil
production, the potential prevalence of low pore connectivity in Bakken and other
tight plays and its significant impacts on fluid flow and hydrocarbon transport,
have generated much interest lately, partly, due to poor documentation and
understanding in the past. Hence, this study will help to bridge the gap between
pore structure, (with respect to accessibility and connectivity) and dynamic fluid
behavior in tight plays, as they affect migration of hydrocarbon molecules from
the shale matrix into the stimulated fracture and overall oil recovery.

6
Figure 1-3 Diagrammatic sketch of a pore structure showing distribution of pore
throats and shapes with connectivity patterns
1.4 Literature Review and Previous Works on Bakken Formation
The Bakken Petroleum system, widely referred to as a shale play is
consist of three members: Upper, Middle and Lower Members. The Upper and
Lower Shale Members are organic-rich shales acting as the source from rocks
while the Middle Member (silty to dolomitic), feeds from the source rocks, and
acts as the reservoir. While the shale members have similar petrophysical
properties, the Middle Member has the better reservoir parameters (because it

7
can be easily fractured due to the brittleness of its rock fabric) needed for
production and hence production shifted from the low-producing Upper Shale to
the Middle Member during the early 80’s and 90’s. Even though the Middle
Member is the center of attention for most production in the Williston Basin,
commercial production and development activities have only become
increasingly viable in recent years due to advances in horizontal drilling and use
of multi-stage fracture stimulation.
The Bakken source rocks have TOC values varying from 1wt.% to as high
as 35% in the shallower and deeper part of the Williston Basin respectively (Jin
and Sonnenberg, 2012) with API gravity of 10-55 °API (Heck et al., 1999), and
viscosity of 36 cp (Tran, 2011). Petrophysical characterization of the Bakken has
been challenging with continuous research going on to better understand and
improve oil recovery from the reservoirs. Like most shale plays, the Bakken
system is characterized by complex petrophysical parameters and as such,
optimum oil recovery is dependent on lithology, mineralogy, fluid properties and
the types of pores inherent. The most common and important aspects of the
complex petrophysical parameters is a function of its porosity and fracture
permeability. The fractures are believed to be the primary path of fluid flow within
the Bakken petroleum system and thus good understanding of their sizes and
distribution within the reservoir matrix cannot be over emphasized. Breit et
al.,(1992) commented that most of the fractures are generally vertically oriented
thereby making it difficult for vertical wells to connect, resulting in low
productivity, while horizontal wells drilled parallel to the Bakken bedding plane
8
would intersect many such extensional fractures and therefore improve
production. Sonnenberg, (2014), reported that the Upper Shale Member serves
both as a source rock and also contributes as a reservoir to production, as it has
been targeted for horizontal drilling and multistage fracture stimulations along the
southwest edge of Elm Coulee Field where the Middle Member pinches out.
In addition to its low permeability, Schuler et al., (2011), reported that the
Bakken play has a characteristic of very light oil (API gravity over 40 degrees)
residing in an oil-wet or mixed-wet condition. This oil-wet condition makes it
difficult for the aqueous phase to penetrate into the matrix and displace the
residing oil, thereby limiting enhanced oil recovery from water-flooding. In other
words, oil cannot be spontaneously produced from oil-wet rocks except the
capillary pressure barrier between fracture conduits and matrix is overcome.
Several authors in the past have used different chemical additives to
study imbibition in shales. Olafuyi et al., (2007), demonstrated that spontaneous
imbibition can be studied on small core plugs while Wang et al., (2010) reported
that API brine and surfactactants formulations can imbibe in shales and displace
oil. Standes and Austad (2000) reported that oil was successfully produced via
spontaneous imbibition. Thus the study of spontaneous imbibition is important in
enhanced oil recovery processes from rock matrix. Fluid flow and solute transport
in rock with low pore connectivity can be characterized by percolation theory, the
mathematics of flow pathways and scaling in disordered systems (Hu et al.,
2012). However, the process of spontaneous imbibition of fluid into any rock
matrix is challenging as it depends on factors such as permeability, wettability,

9
shape, size of the matrix, saturation history, interfacial tension and viscosity of
the fluid system (Olafuyi et al., 2007; Tiab and Donaldson, 2012). The decision
was made to study pore structure using both water-and oil-wetting fluids
enhanced with tracers to study not just the rate of imbibition, but also the
connectivity of these pores within the samples.
There are limited publications on the porosity, pore-size distributions and
permeability within the Bakken members (Table 1-1). Ramakrishna et al., (2010)
estimated the pore throat radius to have R50 value of 0.002 microns, hence the
need to study the pore-throat distributions of the three members of the Bakken
Formation and their pore structure in general. Table 1-1 summarizes some of the
petrophysical parameters reported in the literature.
Table 1-1 Summary of the petrophysical parameters

10
Chapter 2
Geologic Setting
2.1 Structural History of Williston Basin
The Bakken Formation is located in the Williston Basin of North Dakota, a
large, roughly circular intercratonic sedimentary basin located on the North
American Craton covering several hundred thousand square miles across parts
of North and South Dakota, Montana, and the Canadian provinces of Manitoba
and Saskatchewan (Figures 1.2 & 2.1). The basin has a complex tectonic history,
and this is due to the deformation of underlying basement rocks and major
bounding fault systems. These fault systems are responsible for much of the
basin’s interior faults and lineaments, block-fault movements, sedimentation
patterns, salt dissolution, fluid movement and thermal history (Pollastro et al.,
2010).
At the beginning of the Phanerozoic, prior to the supercontinent breakup,
production of heat lenses caused a partial melting of the lower crust and upper
mantle. This was followed by emplacement of anorogenic granites during
extensional tectonics resulting in the supercontinent breakup. Intrusion of
anorogenic granites and other partially melted intrusive rocks weakened the
continental lithosphere, thus providing a zone of localized regional stretching and
permitting the formation of cratonic basins. (Dev and Hsui, 1987). LeFever et al.
(1991) reported that North Dakota is underlain by one of the Superior Craton,
which is one of the cratons created and emplaced 2.75 - 2.6 billion years ago and
consists mainly of granites and greenstones. Anna et al. (2011) and Monahan

11
(2014) reported that in the Precambrian, the Archean Superior Craton was
sutured to the Archean Wyoming Craton by the Trans-Hudson Belt. This resulted
in a north-south trending strike-slip fault and shear belt that created zones of
weakness that controlled the location of several anticlines in the basin today
(Figure 2.2 A-B). A weak zone was developed by the Trans-Hudson Orogenic
belt to the west of the basin and led to sagging during the Cambrian, creating the
subsequent Williston Basin.
Figure 2-1 Geographical extent of Williston Basin and the Bakken Formation
(image source: Energy & Environmental Research Center, 2013, Bakken
Formation)

12
Figure 2-2 General structural extent of the Williston Basin with two major fault
systems responsible for the formation of the basin in the Precambrian (Pollastro
et al., 2010)

13
Figure 2-3 Present day major structural elements of the US portion of the
Williston Basin. Solid black ovals show general location of major areas of oil
production from the Bakken Formation (Pollastro et al., 2010)
2.2 Regional Stratigraphy and Sedimentology of the Williston Basin
The North Dakota portion of the Williston basin has experienced nearly
continuous sedimentation with sediments running from the Cambrian through the
Tertiary time. The basin sedimentation is characterized by cyclical transgression
and regressions with repeated depositional sequence of carbonates and clastics
(LeFever et al., 1991). These cycles of sea level change are classified into six
major depositional sequences which in ascending order, are the Sauk,

14
Tippecanoe, Kaskaskia, Absaroka, Zuni, and Tejas, and they account for most of
the sedimentary rocks found in the Williston Basin (Sloss, 1963) ( Figure 2.3).
The Bakken Formation falls under the Devonian-Mississippian Kaskaskia
Sequence that was a result of two transgressive cycles, and as such the
sequence is divided into two cycles, with an unconformity that separates the
younger Devonian rocks from the older Devonian to form an upper and lower
sequence. Rocks of the lower cycle record a northwest connection into the Elk
Point Basin while deposition in the upper cycle records a westward connection
into the Central Montana Trough (LeFever, 1991).
Deposition of the Upper Kaskaskia Sequence began sometime after
middle Lodgepole deposition (Figure 2.4), during the time when the
sedimentation in the basin records a change in sediment source from the Elk
Point Basin to the Central Montana Trough (LeFever, 1991). Termination by
erosion of the Upper Kaskaskia sequence took place approximately during the
Mississippian and Pennsylvanian boundary. The rocks of the Absaroka sequence
(Pennsylvanian through Triassic) consist mostly of siliciclastic sediments with
some evaporites and carbonates present (Simenson, 2010).
The Lower Kaskaskia sequence is a result off transgression from the
northwest of the Elk Point Basin, and this resulted in the deposition of the Ashern
and Winnipegosis Formations. The Lower Kaskaskia sequence showed repeated
cycles and as such is dominated by carbonates with few clastics and evaporates
up until the Three Forks Formation. The boundary between the Bakken and
Three-Forks Formations marks the boundary between the Upper and Lower

15
Kaskaskia sequence. Gerhard et al. (1987) and LeFever et al. (1991) reported
that the Devonian and Mississippian strata are separated by an unconformity
which represents uplift and erosion or sea level change. At this time, the
Devonian strata were uplifted and exposed along the basin margin, while
deposition continued in the deeper portion of the basin, implying that the
Mississippian sediments were later deposited on the eroded Devonian surface.
Figure 2-4 Time-stratigraphic column of the Williston Basin with Milankovitch
Cycles and Petroleum Plays. Solid black intervals in the source rock column are
for thick accumulations; thin lines indicate an association with carbonate
depositional cycles. For the reservoir rock column, green is for oil and red for
gas; thin lines indicate generalized reservoir rock and do not necessarily
represent the full spectrum of possible reservoirs. E, Early; M, Middle; L, Late;
Pal, Paleocene; Eoc, Eocene; Olig, Oligocene; Mio, Miocene; Plio, Pliocene
(Anna, et al., 2011). Diagram from Anna et al. (2011).

16
Figure 2-5 Generalized stratigraphic column for the Williston Basin with
Bakken Formation shown in red (modified from Kuhn et al., 2012).

17
2.3 Stratigraphy of the Bakken Formation
The Bakken Formation is an Upper Devonian through Lower
Mississippian unit of the Williston Basin. It overlies the Devonian Three-Forks
Formation and is overlain by the Mississippian Lodgepole Formation (Figures
2.5, 2.6). It has a thickness of about 50 m (<160 ft), extends blanket-like in the
subsurface of the Williston Basin at a maximum depth of 3700 m (∼12,150 ft.)
and can be correlated across the basin, from its distinct gamma-ray well-log
pattern (LeFever, 2005, Kuhn et al., 2012).
Bakken Formation is divided into three member units: the Upper Bakken
shale member, the middle reservoir member and the Lower Bakken shale
member (Webster, 1984, LeFever, 2008). The upper and lower Bakken shales
are black organic-rich marine shale. They are both of homogeneous lithology, act
as the major source rocks feeding the middle member and have very high
gamma ray readings (>200 API) and low resistivity readings. Olesen (2010)
reported they also tend to exhibit some brittleness due to high silica content. The
Middle Member varies in lithology, has a typical wireline log characteristics for
clastics and carbonates and acts as the major reservoir in the Bakken petroleum
system. Kuhn et al. (2012) and Sonnenberg (2014) both reported the production
from the Upper Shale, while Sarg (2012) reported that reservoirs are present
both in the Middle Bakken Member and Upper Bakken Shale. Price and LeFever
(1994) reported that the Bakken oils were confined to the Bakken source system

18
(uppermost Three Forks Formation to lowermost Lodgepole Formation) and have
not migrated into the overlying Mississippian reservoirs.
Depositional environments interpreted for the Bakken Formation have
ranged from a marine swamp with a restricted circulation caused by the prolific
growth of organic matter to an offshore marine environment with a stratified water
column (LeFever, 1991). Each of the three Bakken members extends across a
wider area than the preceding one, as they tend to pinch out against the
Devonian Three Forks Formation (Figure 2.6).
Figure 2-6 Schematic stratigraphic column of the Bakken Formation with
overlying and underlying Lodgepole and Three-Forks Formations respectively
[modified from Kuhn et al., (2012) and Pollastro et al., (2010)]
19
2.3.1 Upper Bakken Member
The lithology of the upper member of the Bakken Formation
homogenously consists of dark grey to brownish-black to black, fissile,
noncalcareous, bituminous and carbonaceous shale (Meissner 1978, LeFever
1991). It is slightly to highly rich in organic carbon (up to 35% TOC), with
laminated-to-massive bedding of silt-sized material occurring throughout and a
lag unit of conodonts, fish bones and teeth, with phosphatic grains commonly at
the base (Pollastro et al., 2013). Fractures are also present in the upper shale
member that reaches a maximum thickness of 28 ft. (9 m) in North Dakota
(LeFever, 1991). It has been reported as being brittle due to its high silica
content. The isopach maps of LeFever, (2008) show that the member has a
broad, yet poorly defined, depocenter. The Upper Member of Bakken is
characterized by high gamma-ray, very-high to very-low resistivity in a typical log
(Figure 2.7), has a reported average porosity 5.5%, and a permeability of 0.1mD
(Meissner, 1978).
2.3.2 Middle Bakken Member
The Bakken Middle Member in North Dakota has a variable lithology
ranging from light grey to medium grey interbedded sequence of siltstones and
sandstones with lesser amount of shale, dolostones and limestones rich in silt,
sand and oolites present (LeFever, 1991; Pitman et al., 2001; Kuhn et al., 2012).
The siltstones and sandstones are massively or coarsely bedded with occasional
trough or planar cross-bedding. The middle member, sandwiched between the

20
upper and lower members, is the thickest of the Bakken Formation with a
maximum thickness of 87 ft. (27 m) in North Dakota, and a well-developed
depocenter (LeFever 1991; Pollastro et al., 2010).
Several studies have identified and mapped various lithofacies within the
Middle Member of the Bakken Formation. Smith and Bustin (2000) and Sarg
(2012) identified six lithofacies, while LeFever (2007) recognized seven
lithofacies. Sarg (2012) described the depositional environment of the middle
member to be from shallow water marine environment. The Middle Member is
also the major reservoir member and the main focus of exploration within the
Bakken petroleum system.
2.3.3 Lower Bakken Member
The Lower Shale Member of the Bakken Formation is similar to the Upper
Member. It consist of dark-grey to brownish-black to black, quartz-rich, massive
to fissile, non-calcareous, slightly to highly organic-rich shale (LeFever et
al.,1991; Pitman et al., 2001; Pollastro et al., 2010; Kuhn et al., 2012). It has the
smallest geographic extent with a well-defined depocenter and reaches a
maximum thickness of 56 ft. (17 m) (Pollastro et al., 2010). The lithology is
similar to the upper shale member, however, the color of the shale varies
depending on the amount of silt versus clay and carbon present. Thin laminae of
siltstone, limestone and sandstone and lag deposits containing fragments of
conodonts, fish bones and teeth, with phosphatic particles are locally present at

21
the base of the member (LeFever et al., 1991). The Lower Shale is also
considered to be a mature source rock with occasional fractures present.
Figure 2-7 Typical gamma-ray and resistivity curves of the three members of the
Bakken Formation from Antelope oilfield, McKenzie County, N. Dakota (from
Pollastro et al., 2010)

22
Chapter 3
Methods of Study
3.1 Sampling Procedure
This study focuses on three core samples collected from a well in a
producing field of the Williston Basin in North Dakota. These cores which were
continuous with very few missing intervals were obtained from the core library
and laboratory of the North Dakota Geologic Survey. About two inches were cut
from each member of the Bakken Formation with the help of the Laboratory
Technician based on intervals in the well reports, well-logs and visual
identification. Figures 3.1 and 3.2 show the images of the Bakken cores of the
well from the core library and after they were sampled at chosen intervals.
Figure 3-1 Photos of Kubas well cores of each Bakken members taken from core
box before they were cut from North Dakota Geological Survey
23
Figure 3-2 Photos of freshly-cut Kubas well cores of each Bakken members from
well obtained from North Dakota Geological Survey.
3.2 Mercury Injection Capillary Pressure (MICP)
Mercury Injection Capillary Pressure was used to measure the pore throat
distribution in a sample and also measures the connected pore space based on
the capillary pressure measurement within the sample. This experiment was
conducted on 2-3 grams of sample fragments and it involves the use of non-
wetting mercury to invade pore throats by overcoming the capillary pressure
through applied external pressure of 60,000psia (413MPa). The apparatus used
is the Micromeritrics Autopore IV 9510 (Norcross GA) capable of producing such
high pressure and this corresponds with the Washburn Equation for a pore
diameter of 3 nanometers (nm) to 300 µm. (Figure 3.3).
As a non-wetting fluid for most porous media, mercury will not invade
pores unless an external pressure is applied. The diameter of the pores invaded
by mercury is inversely proportional to the applied pressure, as higher pressure
is required to force mercury into smaller pores. Washburn (1921) developed the

24
following equation based on the assumption that all the pores are cylindrical in
shape:
The experiment is based on Washburn’s equation stated as;
∆P = -2WαCosθ ……………………………………………………(3.1)
R
Where,
R = equivalent pore-throat radius (μm), W = Washburn unit conversion
factor (0.145)
α = surface tension of mercury (485 dynes/cm for Hg), θ = contact angle
between mercury and the porous medium(130° for Hg in most solids), ∆P =
pressure difference across the curved mercury interface (psia).
∆P = 90.4/R ………………………………………………………. (3.2)
Each sample was oven-dried at 60 °C for at least 48 hours to remove
moisture, then cooled to room temperature (~23 °C) in a desiccator before the
MICP test. Samples were then evacuated to 50 µm Hg (0.05 Torr or 6.7 Pa).
During the MICP test, each sample underwent both low-pressure and high-
pressure analyses. Under low-pressure analysis, the largest pore-throat diameter
recorded by MICP is about 300 µm. Equilibration time (the minimum time
duration to achieve a stable mercury level before proceeding to the next
pressure) was chosen to be 50 seconds. Since pore throats control access to the
pore space, mercury first fills up the pore space it can access through the largest

25
pore throats by overcoming capillary pressure, it then passes through smaller
and smaller pore throats as pressure increases and eventually fills up the entire
connected pore space. At 60,000 psi pressure, mercury can enter pore throats as
small as 3 nm in diameter. The intrusion volume is recorded and after reaching
the 60,000 psi, the pressure is reduced to allow for extrusion and the extrusion
volume is recorded.
Because the interfacial tension of mercury and contact angle between
mercury and rock sample is already known, knowing the pressure at which the
mercury passes through the pore throats and the pore throat radius can be
estimated along with porosity, permeability and tortuosity.
Figure 3-3 AutoPore IV® machine used to run Hg injection porosimetry
experiments
26
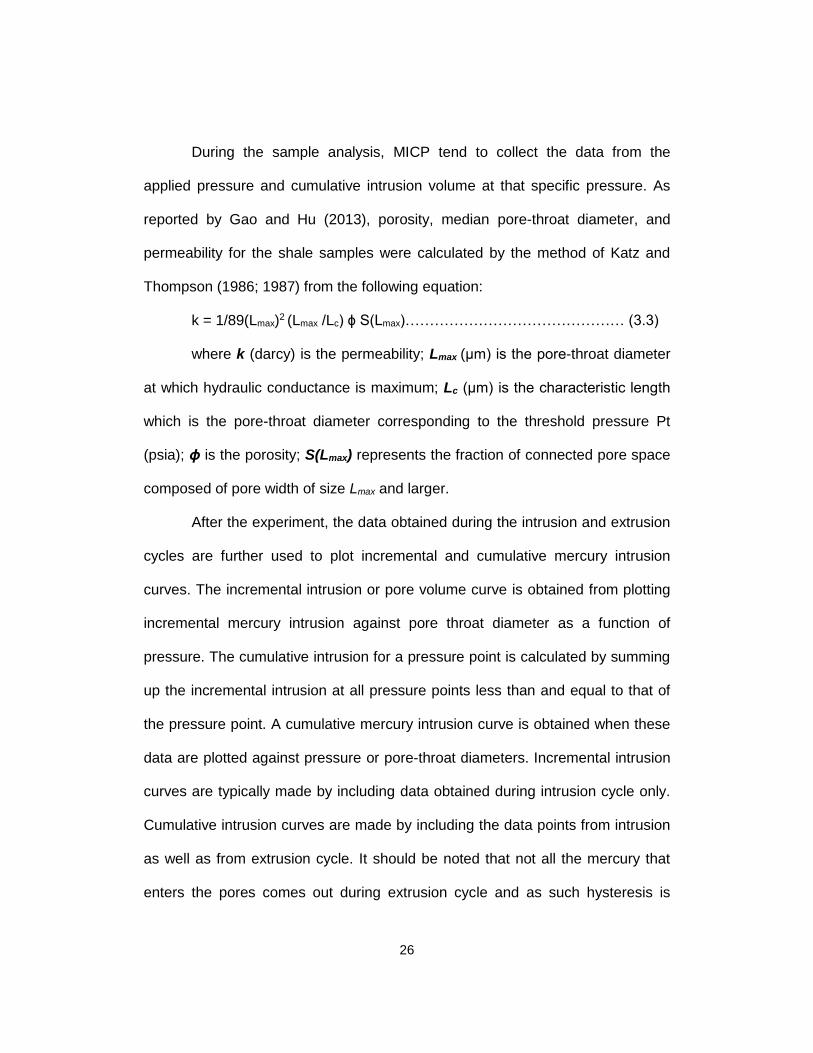
During the sample analysis, MICP tend to collect the data from the
applied pressure and cumulative intrusion volume at that specific pressure. As
reported by Gao and Hu (2013), porosity, median pore-throat diameter, and
permeability for the shale samples were calculated by the method of Katz and
Thompson (1986; 1987) from the following equation:
k = 1/89(Lmax)2 (Lmax /Lc) ɸ S(Lmax)……………………………………… (3.3)
where k (darcy) is the permeability; Lmax (μm) is the pore-throat diameter
at which hydraulic conductance is maximum; Lc (μm) is the characteristic length
which is the pore-throat diameter corresponding to the threshold pressure Pt
(psia); ɸ is the porosity; S(Lmax) represents the fraction of connected pore space
composed of pore width of size Lmax and larger.
After the experiment, the data obtained during the intrusion and extrusion
cycles are further used to plot incremental and cumulative mercury intrusion
curves. The incremental intrusion or pore volume curve is obtained from plotting
incremental mercury intrusion against pore throat diameter as a function of
pressure. The cumulative intrusion for a pressure point is calculated by summing
up the incremental intrusion at all pressure points less than and equal to that of
the pressure point. A cumulative mercury intrusion curve is obtained when these
data are plotted against pressure or pore-throat diameters. Incremental intrusion
curves are typically made by including data obtained during intrusion cycle only.
Cumulative intrusion curves are made by including the data points from intrusion
as well as from extrusion cycle. It should be noted that not all the mercury that
enters the pores comes out during extrusion cycle and as such hysteresis is

27
observed in the plot. The presence of the hysteresis confirms that the intrusion
was real and the experiment was correctly done.
3.3 Fluid Imbibition Tests
Spontaneous imbibition is a process driven by capillary-force whereby a
wetting fluid displaces a non-wetting fluid under the influence of capillary suction
only. During the process of secondary oil recovery from fractured reservoirs, fluid
is spontaneously imbibed from the fracture system into the rock matrix blocks,
thereby resulting to the oil and gas in the matrix being displaced by the fluid.
Going by this, it’s fine to say that the oil/gas secondary production rate is strongly
dependent on the spontaneous imbibition process, and extensive research has
been undertaken to investigate this process in oil and gas industry (Li, 2007;
Olafuyi et al., 2007; Standnes, 2010; Shahri et al., 2012; Wang 2012).
The imbibition test involves exposing one face of a rock sample to fluid,
and measuring the mass of fluid uptake over time. This test is a simple procedure
for probing pore connectivity within a sample matrix, and for estimating the
crossover length (depth to constant accessible porosity) in low pore connectivity
rocks (Hu et al., 2001; 2012). Based on the network modeling results of Ewing
and Horton (2002), we can probe pore connectivity, as indicated by the slope
from the log plot of imbibed liquid mass versus log time. The imbibition behavior
slope of ¼, ¼ changing to ½, or ½ – roughly classifies a rock’s pore connectivity
(Hu et al., 2012).

28
Imbibition is mathematically analogous to diffusion in that, for classical
homogeneous materials under negligible gravitational effects, the distance l, to
the wetting front increases with the square root of time (l ~ t0.5), (Hu et al.,
2012). If the accessible porosity is uniform with distance, then the cumulative
mass of imbibed water I behaves identically as l ~ t0.5. The mass is plotted
against the square root of time after the experiments. The slope obtained is
usually around 0.5 for well-connected pores and 0.25 or less for poorly
connected pores (Ewing and Horton, 2002). If the accessible porosity is uniform
with distance, then the cumulative mass of imbibed water l behaves identically: l
~ t0.5 . This relationship gives a slope of 0.5 in log space, which we call the
imbibition slope.
Core samples of approximately 1cm cube were cut from the blocks of the
Bakken samples from a producing well (Kubas) and labelled uniquely. The
sample cubes were coated with quick-cure epoxy sealant leaving just two faces
that will go into the fluid. This will ensure one dimensional imbibition to avoid
evaporation of the imbibing fluid from (and avoid vapor transport and capillary
condensation through it) the side surfaces of the samples (Figures 3.4 A, B and
C). Once the epoxied samples were dried, they were placed in a 60°oven to dry
up residual fluid. The dried sample is then placed in a desiccator to cool off for
about 2 hours and then taken out for the experiment. A dish is filled with fluid (DI
water without tracers, API brine or n-decane with tracers) and the weight was
recorded. The sample dimensions and weight were also recorded.

29
Figure 3-4 Labelled sample cubes coated with quick cure epoxy; prior to
imbibition
The experiment were performed by bringing the non-epoxied face of the
sample into contact with the dish solution and recording the weight change over
time automatically into a computer connected with the apparatus (Figure 3.5).
The core was suspended from a hook underneath the electronic balance and in a
closed chamber while the major part of the sample remains suspended in the air
leaving just the exposed face to make contact with the fluid.
For water imbibition experiments, beakers of water were placed inside the
experiment chamber to keep the humidity inside the chamber constant. The top
side of the epoxied samples were loosely covered with foil, with a small hole left
for air escape, to reduce vapor transport and capillary condensation on to the top
face. The sample bottom was submerged to a depth of about 1 mm in a fluid
reservoir. The imbibition rate was monitored by automatically recording the
sample weight change over time. The imbibition experiment was done in a

30
direction that is parallel to the bedding plane on the sample. The maximum
relative error of the measurements is estimated as ±20 seconds. The tracer
solution containing both nonsorbing (bromide and perrhenate) and sorbing
(cesium, cobalt, samarium, and strontium) tracers was prepared using ultrapure
(Type 1) water and >99% pure reagents (CoBr2, CsBr, CsI, NaBr, NaReO4,
SmBr3·6H2O, SrBr2·2H2O). The tracers in the n-decane include organic-iodine
(iododecane) and trichlorooxobis (triphenylphosphine) rhenium (V). After the
tracer experiment, the samples were frozen with liquid nitrogen, freeze-dried at -
52 °C and near-vacuum (about 1 Pa) for a day, and then stored at relative
humidity below 10% before elemental mapping.
31
Figure 3-5 Apparatus for spontaneous imbibition experiments, consisting of
electronic balance, hook to hold the sample and computer to record readings
3.4 Saturated Diffusion Tests
The purpose of this experiment is to measure the pattern of solute
diffusion in cm-sized samples and the decrease in accessible porosity with
distance from an exposed face. This is done in order to assess the pore
connectivity in the Bakken samples. In this experiment, dry shale samples were
placed in a chamber which was then evacuated for 18 to 24 hours at 99.99%
vacuum to remove all of the absorbed water and volatiles from the edge

32
connected pores. Then a saturating fluid made up of n-decane (no tracers) is
introduced into the system so as to allow the fluid to penetrate and occupy the
evacuated pores of the sample. Following the approach published in Hu and Mao
(2012), the samples were then placed on a Teflon mesh inside a traced-decane
solution reservoir, such that only the bottom of the sample (to reduce hydraulic
head differences) touched the tracer solution, which was constantly stirred with a
magnetic stirrer. The reservoir volume was on the order of 320 mL, compared to
the samples’ pore volume of less than 0.1 mL. This high volume ratio ensured an
approximately constant tracer concentration (as required to satisfy the boundary
condition of the applicable mathematical solution of the diffusion equation).
Figure 3-6 Apparatus for the saturated diffusion experiment; consist of stop clock
and lidded reservoir holding the tracers solution during an experiment

33
The lidded reservoir was held at a constant 23 °C. After a fixed diffusion
time of 25 hours, the samples were removed from the reservoir, frozen with liquid
nitrogen, freeze-dried at -52 °C and near-vacuum (about 1 Pa) for a day, then
stored at relative humidity below 10% prior to LA–ICP–MS (laser ablation-
inductively coupled plasma-mass spectrometry) analyses.
3.5 Tracer Mapping by Laser Ablation-Inductively Coupled Plasma-Mass
Spectrometry (LA–ICP–MS)
In this Task, we measure the decrease in accessible porosity with
distance from an exposed face in order to assess pore connectivity in the shale
samples. This is because in a rock with sparsely-connected pores, the accessible
porosity decreases with distance from an edge (a fracture for example).
For this test, tracers in fluids are used to specifically interrogate the
wettability of kerogen and mineral pore spaces and their connectivity, by
conducting diffusion and imbibition tests. Two molecular tracers and their sizes
used in n-decane are the organic iodine (1-iododecane) with dimension of 1.393
nm×0.287 nm×0.178 nm for and the trichlorooxobis (triphenylphosphine) rhenium
(V) with dimensions of 1.273 nm×0.919 nm×0.785 nm. The tracers were chosen
because they are non-sorbing, easily detectable by LA-ICP-MS analysis and will
only occupy accessible pores without reacting with the matrix.
After tracer imbibition and diffusion tests, whether with brine or n-decane,
the Bakken samples were frozen with liquid nitrogen, kept at -80°C in a freezer,
freeze-dried, then stored at <10% relative humidity until LA–ICP–MS analysis.

34
The tracer distribution in the samples is then mapped with laser ablation-
inductively coupled plasma-mass spectrometry. Prior to cutting, both the top
(tracer-exit) and bottom (tracer-entry) faces were spot-checked for the presence
of tracers, and then the sample was cut dry in the middle from the top face. This
was done transverse-wise with respect to the imbibition or diffusion direction,
using a low-speed diamond saw (Buehler IsoMet). The laser ablation system
(New Wave; Freemont, CA) (Figure 3.6) used a 100 µm spot diameter UP-213
laser to vaporize a hole in the shale sample at sub-micron depth increments;
elements entrained in the vapor were analyzed with ICP–MS
(PerkinElmer/SCIEX ELAN DRC II; Sheldon, CT). This LA–ICP–MS approach
can generate 2-D and 3-D maps of chemical distributions in rock at a spatial
resolution of microns, and a concentration limit of low-mg/kg (Hu et al., 2012;
Peng et al., 2012; Hu and Mao, 2013).

35
Figure 3-7 The LA–ICP–MS apparatus for micro‐scale elemental mapping of
tracer distribution patterns in the samples

36
Chapter 4
Observations and Results
4.1 Mercury-Injection Capillary Pressure (MICP)
Mercury intrusion measurements were carried out to obtain the pore-
throat distributions of the three Bakken members at their respective depths from
Kubas Well in Stark County. The results showing pore-throats distribution were
plotted on a scatter chart of measured pore volumes versus pore-throat
diameters (Figures 4.1, 4.2 and 4.3) and on a histogram (Figure 4.4) The MICP
results show that most pores (about 70–80% by volume) in the Bakken samples
are smaller than 1 μm. As measured by the MICP, pores in the three members of
Bakken Formation are predominantly in nanometer size range while the
estimated permeability are in nanodarcy.
The MICP results shows the Bakken members have average pore-throat
diameters of 7.8 nm, 6.8 nm and 17.6 nm, with estimated permeability of 3.16,
0.85, 5.68 nanodarcies for the Upper, Middle and Lower Bakken respectively.
The pore throat distributions for the three members were also plotted. These
values are slightly deviated from the published values but still falls within the
range of what is expected from a poorly connected rock. Aside from the pore-
throat diameters, permeability estimates were obtained from the analyses, as
well as other useful petrophysical parameters such as porosity and tortuosity
(Table 4-1).

37
Figure 4-1 MICP analysis of Bakken Formation showing cumulative mercury
intrusion volume versus intrusion pressure for the three Bakken Members.

38
Figure 4-2 Comparison of pore-throat diameters of the three Bakken Members
from MICP analyses showing distribution cumulative intrusion volume versus
pore-throat diameter

39
Figure 4-3 Comparison of pore-throat diameters of three Bakken Members from
MICP analyses showing distribution cumulative intrusion volume versus pore-
throat diameter

40
Figure 4-4 MICP analysis of Bakken Formation on a histogram showing porosity
versus pore-throat diameter for three Bakken members

41
Table 4-1 Result summary of the MIP experiment; Le is the effective path length
through the pores, while L is the length of the core sample
During the experiment, mercury starts to intrude from the larger pores to
the tiny pore sizes as the pressure increases. Thus higher pressure is needed to
invade tighter pore throats. The incremental intrusion curve represents the pore
volume accessed through pore-throats of a given grain size. The intrusion
saturation starts at zero and then increases as pressure reaches 60,000 psia and
volume of mercury forced into the rock at 100% is the limit of the machine. The
100% mark was set at the limit of the machine, but from figure (4.2), we observed
continuity beyond the mark. This implies that there are still pores below the 3nm
limit of the machine. This pores (< 3nm) can be studied using nitrogen sorption
test. The result shows that the Lower Shale Member have the highest porosity
Sample
Sample
Depths
(ft)
Median
Pore-throat
Diameter
(nm)
Average
Pore-throat
Diameter
(nm)
Porosity
(%)
Permeability
(nanodarcy)
Le/L [square
root of
(tortuosity*ɸ)]
Kubas
Upper
Bakken
10626 8.4 7.8 1.62 1.82 6.4
Kubas
Middle
Bakken
10636 6.2 6.8 0.98 0.85 5.23
Kubas
Lower
Bakken
10638 22.8 17.6 2.76 37.2 3.89

42
and pore-throat diameters. However both shale members have higher porosity
and pore-throat diameters than the Middle Member, and this may be attributed to
more (larger) natural fractures. Samples with higher pore diameters are often
expected to have higher permeability as observed in the Lower Members of the
Bakken Formation (Table 4-1).
The tortuosity observed were also fairly large and the effect were
observed fluid imbibition within the Bakken members. For tight matrix, mercury
requires as much 60,000 psia to achieve significant intrusion, hence, for this tight
rocks, the higher the pressure at which the mercury intrusion occurs, the lower
the permeability.
4.2 Fluid and Tracer Imbibition
Imbibition tests from the three Bakken members produced slopes ranging
from 0.18 to 0.36 (Figures 4.4 to 4.6) indicating the low connectivity of the
Bakken petroleum system. The result is based on the pore volume of fluid
imbibed against time and the data is plotted for different fluid used for all three
members of the Bakken Formation.
The slopes obtained are dependent on good pore networks, connectivity
and wettability within the cores. The higher slope of 0.44 from the Upper Bakken
using DI water as imbibition fluid (Table 4-2) does not mean good connectivity, it
is rather the result of instability of the initial sample settling. Replicated test (using
another sample) not reported produced a slope of 0.128. The imbibition test
revealed fair connectivity with n-decane (0.363 through 0.386) and this is a

43
function of the Bakken wettability with oil. Low slopes were obtained from the
brine and water imbibition tests and these slopes are indicative of the preferred
oil-wet condition of the Bakken cores.
Figure 4-5 Imbibition curve and slope for the Middle Bakken: using n-decane with
tracers as imbibition fluid

44
Figure 4-6 Imbibition curve and slope for the Middle Bakken: using API brine with
tracers as imbibition fluid

45
Figure 4-7 Imbibition curve and slope for the Middle Bakken: using DI water as
imbibition fluid
46
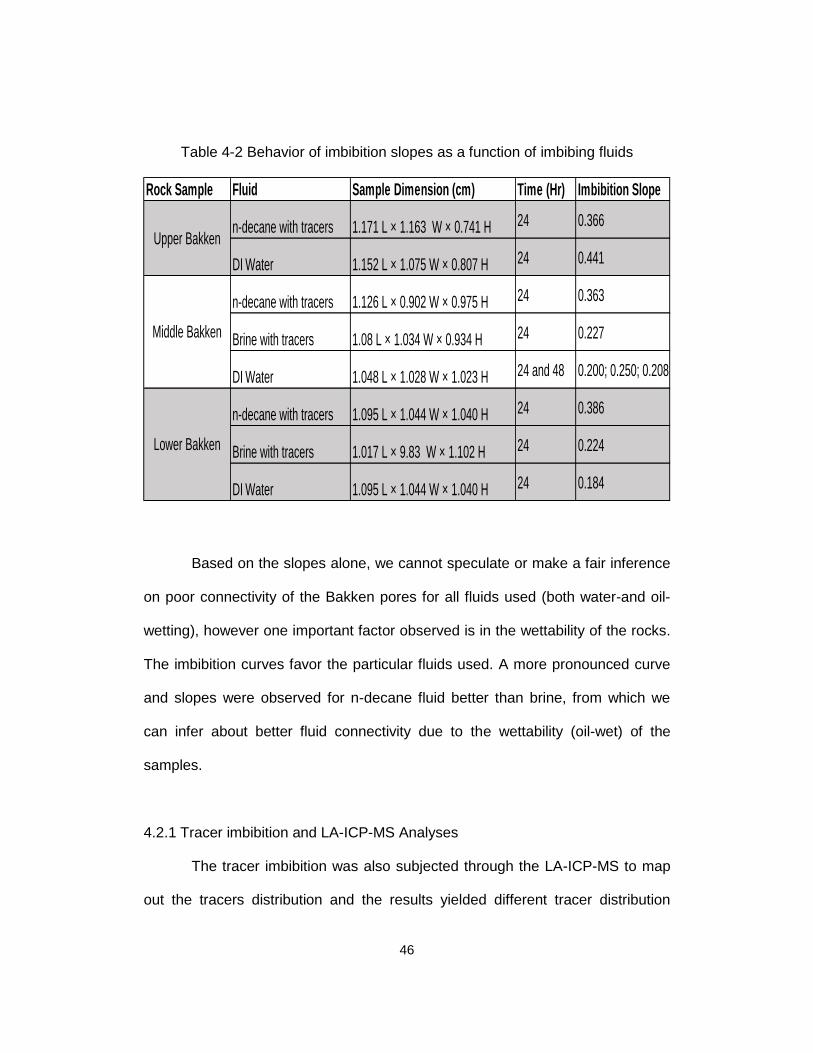
Table 4-2 Behavior of imbibition slopes as a function of imbibing fluids
Based on the slopes alone, we cannot speculate or make a fair inference
on poor connectivity of the Bakken pores for all fluids used (both water-and oil-
wetting), however one important factor observed is in the wettability of the rocks.
The imbibition curves favor the particular fluids used. A more pronounced curve
and slopes were observed for n-decane fluid better than brine, from which we
can infer about better fluid connectivity due to the wettability (oil-wet) of the
samples.
4.2.1 Tracer imbibition and LA-ICP-MS Analyses
The tracer imbibition was also subjected through the LA-ICP-MS to map
out the tracers distribution and the results yielded different tracer distribution
Rock Sample Fluid Sample Dimension (cm) Time (Hr) Imbibition Slope
n-decane with tracers 1.171 L × 1.163 W × 0.741 H 24 0.366
DI Water 1.152 L × 1.075 W × 0.807 H 24 0.441
n-decane with tracers 1.126 L × 0.902 W × 0.975 H 24 0.363
Brine with tracers 1.08 L × 1.034 W × 0.934 H 24 0.227
DI Water 1.048 L × 1.028 W × 1.023 H 24 and 48 0.200; 0.250; 0.208
n-decane with tracers 1.095 L × 1.044 W × 1.040 H 24 0.386
Brine with tracers 1.017 L × 9.83 W × 1.102 H 24 0.224
DI Water 1.095 L × 1.044 W × 1.040 H 24 0.184
Upper Bakken
Middle Bakken
Lower Bakken

47
patterns (Figures 4.7 - 4.9). The non-colored portion on the map implies no tracer
penetration in the pores as a result very tight pore throats. The pattern of pore
penetration is a function of the molecular sizes of the tracers, made evident
where organic-iodine which is smaller compared to the rhenium (V) penetrates
more with higher concentration distribution in the sample.
The pattern, distribution and mass concentration of the tracers may also
represent the patterns of the pores connectivity with respect to percolation
theory. This can be observed from imbibition of the perrhenate (ReO4-) and
europium (Eu3+) ions as tracers in the brine fluid. The non-sorbing perrhenate
tracer (ReO4-), is used as an indicative of the edge-accessible porosity
distribution within the samples. As a non-sorbing tracer, ReO4- will only occupy
the pore spaces equal or bigger than its molecular size without interacting with
the shale matrix. Thus, the larger the pore spaces, the more concentration
observed and, the better the connectivity pattern, the more pronounced the
distribution pattern of the tracers within the sample. The dramatic decrease of
tracers with depth illustrates the poorly-connected pore spaces of Bakken
samples.
48
Figure 4-8 Traced-brine imbibition of ND Upper Bakken Member (interior face)
using perrhenate and europium ions as tracers; arrows on the left indicate base
of sample and direction of tracers’ imbibition

49
Figure 4-9 Traced-brine imbibition of ND Middle Bakken Member (interior face)
using perrhenate and europium ions as tracers; arrows on the left indicate base
of sample and direction of tracers’ imbibition

50
Figure 4-10 Tracer imbibition (Brine) of ND Lower Bakken Member (interior face)
using perrhenate and europium ions as tracers; arrows on the left indicate base
of sample and direction of tracers’ imbibition

51
4.3 Saturation Diffusion and LA-ICP-MS Analyses
The tracer distribution in shale is then mapped with laser ablation-
inductively coupled plasma-mass spectrometry. For two molecular tracers in n-
decane with the sizes of 1.393 nm × 0.287 nm × 0.178 nm for 1-Iododecane and
1.273 nm × 0.919 nm × 0.785 nm for trichlorooxobis (triphenylphosphine)
rhenium (V), much less diffusive penetration was observed for wider molecules of
trichlorooxobis (triphenylphosphine) rhenium (V) in oil-wetting shales with median
pore-sizes of several nanometers.
The LA-ICP-MS analyses also map tracer distribution patterns from the
saturated diffusion experiments (Figure 4.9). The LA–ICP–MS method gives both
(1) the rate of decrease in concentration from the edge to some plateau
(constant) concentration, and (2) the depth at which the plateau concentration is
reached; both are related to the pore connectivity of the matrix.
Observe the trend of tracer distribution from North-East to the south in the
Lower Bakken for saturated diffusion (figure 4.12), the pore connectivity trend
probably explains the high peak observed in the increasing pore volume from
MICP, while the other maps for the other members will be an indicative of the
scattered pore distribution in the samples.

52
Figure 4-11 Saturated diffusion (Decane) in ND Upper Bakken Member (interior
face) using organic-iodine and rhenium (V); arrows on the left indicate base of
sample and direction of tracers’ diffusion

53
Figure 4-12 Saturated diffusion (Decane) in ND Middle Bakken Member (interior
face) using organic-iodine and rhenium (V); arrows on the left indicate base of
sample and direction of tracers’ diffusion

54
Figure 4-13 Saturated diffusion (Decane) in ND Lower Bakken Member (interior
face) using organic-iodine and rhenium (V); arrows on the left indicate base of
sample and direction of tracers’ diffusion

55
Chapter 5
Conclusion and Recommendations
5.1 Conclusion
Using different complimentary suites of core-scale analyses and pore-
scale network modeling, this project looked into the prevailing low pore
connectivity in natural rock that might have originated from lithological and grain-
size arrangement (sorting), as well as processes such as burial diagenesis and
metamorphism. It is no doubt that the size and geometry of the pores along with
and tortuosity of the other connecting throats all have huge effects in the
productivity of a reservoir, however, a study of how the effects cut across all tight
plays is worth probing.
Results from the MICP indicates that the Bakken pores are predominantly
in the nanometer size range, with an average pore-throat diameter of 7.8, 6.8
and 17.6 for the Upper, Middle and Lower Bakken members respectively. The
porosity and permeability values measured were also very low in line with the low
pore diameters obtained.
The small pore size and low pore connectivity lead to anomalous
imbibition behavior, consistent with percolation theory. The calculated imbibition
slopes indicates low pore connectivity within the sample used in the test.
The small pore size and low pore connectivity lead to extremely low
diffusion rates in the tight matrix, as measured using liquid tracer diffusion
approach and LA–ICP–MS mapping. In general, the LA-ICP-MS analyses
indicate that only less than 10% of the porosity (especially from the tracer

56
imbibition) in the middle of a sample is connected to the exterior while the interior
tracer concentration and distribution are limited by tortuous pathways. The
decrease in concentrations away from the edge pores and base suggest that
only small portion of the nanopores in the Bakken samples are connected for
diffusion and imbibition. Also much less tracer penetration into samples was
observed for the wider molecules, suggesting that the nano-sized molecules
become entangled in the Bakken’s nanopores.
We find that the Bakken members, and likely other tight plays as well,
have very limited edge-accessible pore spaces. This is shown from low pore
connectivity behavior of fluid (water brine and n-decane) imbibition, and a limited
connected pathways of tracers from tracer imbibition and saturation diffusion.
This sparse, and limited, pore space connection revealed within the Bakken play
will lead to the limited fracture-matrix interactions in fractured shale, and
consequently steep initial production decline and overall low recovery.
5.2 Recommendations
The effect of the low pore connectivity and short connected distance that
these observations reveal will lead to steep initial decline and low overall
production in the Bakken play, hence the need to conduct more studies on pore
structure. The results of this project can bridge knowledge gaps in nano-scale
pore structure effects on macro-scale fluid migration and behavior in hydraulically
stimulated shale formations, which can lead to the development of viable
approaches to improving fluid productivity and associated economic benefits of

57
unconventional resource utilization. More studies should be conducted to further
observe pore structure along with fluid behavior and dynamics within the
nanopores using other capturing instruments like Small Angle Neutron Scattering
(SANS) and Nuclear Magnetic Resonance (NMR) analyses.
From the limited accessibility and connectivity of nanopores in Bakken
Formation observed here, we further recommend repositioning of the stimulated
hydraulic fractures in the wells to further expose and connect with the isolated
and ineffective pores within the matrix for improved and overall oil recovery in the
Bakken and other unconventional shale plays.

58
References
Alexandre, C.S., 2011. Reservoir Characterization and Petrology of the Bakken
Formation, Elm Coulee Field, Richland County, MT: Colorado School of
Mines, M.S. Thesis
Anna, L., Pollastro, R., and Gaswirth, S., 2011. Williston Basin Province-
Stratigraphic and Structural framework to a geologic assessment of
undiscovered oil and gas resources, Chap 2 of. f U.S. Geological Survey
Williston Basin Province Assessment team, Assessment of undiscovered
oil and gas resources of the Williston Basin Province of North Dakota,
Montana, and South Dakota, 2010, Volume U.S. Geological Survey
Digital Data Series 69-W, p. 17.
Breit, V.S., Stright Jr. D.H., and Dozzo, J.A., 1992. Reservoir Characterization of
the Bakken Shale From Modeling of Horizontal Well Production
Interference Data. SPE Rocky Mountain Regional Meeting held in
Casper, Wyoming.
Cook, T.A., 2013., Procedure for calculating estimated ultimate recoveries of
Bakken and Three Forks Formations horizontal wells in the Williston
Basin: U.S. Geological Survey Open-File Report 2013–1109, 14 p.,
http://pubs.usgs.gov/of/2013/1109/.
Dev K.G., and Hsui A.T., 1987. Origin of Cratonic Basins; Geology, vol. 15,
Issue 12, p.1094.
Energy & Environmental Research Center., 2013. Bakken Formation
http://www.undeerc.org/bakken/bakkenformation.aspx

59
Ewing, R.P., and Horton R., 2002. Diffusion in sparsely connected pore spaces:
Temporal and Spatial Scaling. Water Resour. Res., 38: 1285,
doi:10.1029/2002WR001412.
Gao, Z.Y., and Hu, Q., 2013. Estimating Permeability Using Median Pore-throat
Radius Obtained From Mercury Intrusion Porosimetry. J. Geophy Eng.
10,(2).
Gerhard, L.C., Anderson, S.B., LeFever, J.A., and Carlson, C.G., 1982.
Geological Development, Origin, and Energy Mineral Resources of
Williston Basin, North Dakota: AAPG Bulletin, 66(8): 989-1020.
Gerhard, L.C., Anderson, S. B., and LeFever, J.A., 1987. Structural history of the
Nesson Anticline, in Longman, M. W., ed., Williston Basin: Anatomy of a
Cratonic Oil Province: Rocky Mountain Association of Geologists, p. 337-
353.
Heck, T.J., LeFever, R. D., Fischer, D.W. and LeFever, J., 1999. Overview of the
Petroleum Geology of the North Dakota Williston Basin; Publication of
Department of Mineral Resources, North Dakota Geologic Survey.
Hester, T.C., and Schmoker, J.W., 1985. Selected Physical Properties of the
Bakken Formation, North Dakota and Montana Part of the Williston Basin:
U.S. Geological Survey Oil and Gas Investigations Chart, OC-126,
1sheet.
Hu, Q., Kneafsey, T.J., Trautz, R.C., and Wang, J.S.Y., 2002. Tracer Penetration
into Welded Tuff Matrix from Flowing Fractures. Vadose Zone J., 1: 102–
112.

60
Hu, Q., Ewing, R.P. and Dultz, S., 2012. Pore connectivity in Natural Rock. J.
Contam. Hydrol.,133: 76–83.
Hu, Q., and Mao, X.L., 2012. Applications of Laser Ablation-Inductively Coupled
Plasma-Mass Spectrometry in studying Chemical Diffusion, Sorption, and
Transport in Natural Rock. Geochem. J., 46 (5):459–475.
Hu Q., Gao, X. Gao, Z., Ewing, R., Dultz, S., and Kaufmann, J., 2014. Pore
Accessibility and Connectivity of Mineral and Kerogen Phases in Shales.
Unconventional Resources Technology Conference (URTeC)
Hunt, A.G., Ewing, R.P., and Ghanbarian, B., 2014. Percolation Theory for Flow
in Porous Media 3rd ed., Lect. Notes Phys. 880, Springer, Heidelberg.
Jin, H., and Sonnenberg S.A., 2012. Source Rock Potential of the Bakken Shales
in the Williston Basin, North Dakota and Montana Search and Discovery
Article #20156
Kathleen Neset., 2014. Myths of Bakken: Bismarck Tribune Nov 17th 2014
http://bismarcktribune.com/bakken/breakout/myths-of-the-bakken
Katz, A.J., and Thompson A.H., 1986. A quantitative prediction of permeability in
porous rock. Phys. Rev. B., 34: 8179–81.
Kuhn, P.P., Primio, R., Hill, R., Lawrence, J.R., and Horsfield, B., 2012. Three-
Dimensional Modelling study of the low permeability petroleum system of
the Bakken Formation. AAPG Bulletin, v. 96, no. 10, pp. 1867-1897.
LeFever, J. A., Martiniuk, C.D., Dancsok, E.F.R., and Lund, D.F., 1991.
Petroleum Potential of the Middle Member, Bakken Formation, Williston
basin, in Christopher, J. E. and F. Haidl, eds., Proceedings of the sixth

61
international Williston Basin Symposium: Saskatchewan Geological
Society, Special Publication 11, p. 74–94.
LeFever, J. A., 2005. Oil Production from the Bakken Formation: A Short History;
North Dakota Geological Survey Newsletter, v.32, no.1, p.1-6
LeFever, J.A., 2007b. Lithofacies of the middle Bakken member, North Dakota,
North Dakota Geological Survey Geologic Investigations pdf.
LeFever, J.A., 2008. Structural contour and isopach maps of the Bakken
Formation in North Dakota: North Dakota Geological Survey Geologic
Investigations.
Li, K., 2007. Scaling of spontaneous imbibition data with wettability included. J.
Contam. Hydrol.,89: 218–230.
Meissner, F. F., 1978. Petroleum geology of the Bakken Formation, Williston
basin, North Dakota and Montana, in D. Rehrig, ed. The Economic
Geology of the Williston Basin: Proceedings of the Montana Geological
Society, 24th Annual Conference, p. 207-227.
Monahan, P. D., 2014. Depositional Facies and Reservoir Analysis of the Tyler
Formation in the Central Williston Basin, North Dakota. M.S. Thesis,
University of Texas at Arlington.
Nelson P. H., 2009. Pore-throat sizes in Sandstones, Tight sandstones, and
Shale AAPG Bulletin, 93 (3): 329– 340
North Dakota Drilling & Production Statistics; Historical monthly; Bakken Oil
Production Statistics, September 2013.
https://www.dmr.nd.gov/oilgas/stats/statisticsvw.asp

62
Olafuyi, O.A., Cinar, Y., Knackstedt, M. A., and Pinczewski, W.V., 2007.
Spontaneous Imbibition in Small Cores Bakken Shale. SPE 109724.
Presented at the SPE Asia Pacific Oil &Gas Conference Oct. - Nov. 2007
Olesen, N.L., 2010. Bakken Oil Resource Play, Williston Basin (US), Overview
and Historical Perspective; Continental Resources.
Peng, S., Hu, Q., Ewing, R.P., Liu, C., and Zachara, J.M., 2012. Quantitative 3-D
Elemental Mapping By LA-ICP-MS of Basalt from The Hanford 300 Area.
Environ. Sci. Technol., 46: 2035–2042.
Pitman, J.K., Price, L.C., and LeFever, J.A., 2001. Diagenesis and Fracture
Development in the Bakken Formation, Williston Basin—Implications for
Reservoir Quality in the Middle Member. U.S. Geological Survey
Professional Paper 1653.
Pollastro, R.M., Roberts, L.N.R., and Cook, T.A., 2010. Geologic Assessment of
Technically recoverable oil in the Devonian and Mississippian Bakken
Formation, Chap. 5 of U.S. Geological Survey Williston Basin Province
Assessment Team, Assessment of undiscovered oil and gas resources of
the Williston Basin Province of North Dakota, Montana, and South
Dakota, 2010 (ver. 1.1, November 2013): U.S. Geological Survey Digital
Data Series DDS–69–W, 34 p
Price, L. C., and LeFever, J., 1994. Dysfunctionalism in the Williston Basin: The
Bakken/Mid-Madison petroleum system: Bull. Canadian Petrol. Geol., 42:
187-218.

63
Ramakrishna S., Balliet, R., Miller, D., Sarvotham, S., and Merkel, D., 2010.
Formation Evaluation in the Bakken Complex Using Laboratory Core
Data and Advanced Logging Technologies. SPWLA 51st Annual Logging
Symposium.
Sarg, F.J., 2012. The Bakken - An Unconventional Petroleum and Reservoir
System; Final Scientific Report, Colorado School of Mines DOE Award
No.: DE-NT0005672.
Shahri, M.P., Jamialahmadi, M., and Shadizadeh, S.R., 2012. New Normalization
Index for Spontaneous Imbibition. J. Petrol. Sci. Eng., 82-83: 130–139.
Shuler P., Tang H., Lu Z., and Tang Y., 2011. Chemical Processes for Improved
Oil Recovery From Bakken Shale. CSUG/SPE 147531. Presented at the
Canadian Unconventional Resources Conference, Calgary, Canada.
November 2011.
Simenson, A., 2010. Depositional Facies and Petrophysical Analysis of the
Bakken Formation, Parshall Field, Mountrail County, North Dakota.
Colorado School of Mines, M.S. Thesis.
Sloss, L. L., 1963. Sequences in the Cratonic Interior of the North America:
GSA Bull., 74, 93-114.
Smith, M.G., and Bustin, R.M., 1995. Sedimentology of the Late Devonian and
Early Mississippian Bakken Formation, Williston Basin, in Seventh
International Williston Basin Symposium Guidebook: Billings, Montana
Geological Society, p. 103–114.
64
Sonnenberg, S. A., 2014. Upper Bakken Shale Resource Play, Williston Basin
Search and Discovery Article #10625
Standnes, D., and Austad, T., 2000. Wettability Alteration in Chalk 2. Mechanism
for Wettability Alteration from Oil-Wet to Water-Wet Using Surfactants. J.
Petrol. Sci. and Eng. 28:, 123-143
Standnes, D.C., 2010. Scaling spontaneous imbibition of water data accounting
for fluid Viscosities. J. Petrol. Sci. Eng., 73: 214–219.
Tiab, D., and Donaldson, E., 2012. Theory and Practice of Measuring Reservoir
Rock and Fluid Transport Properties. Gulf Professional Publishing.
Tran T., 2011. Bakken Shale Oil Production Trends; Texas A&M University, M.S.
Thesis
US Department of the Interior., 2013. USGS Releases of New Oil and Gas
Assessment for Bakken and Three Forks, 30 Apr. 2013.
Wang, D., Butler, R., Liu, H., and Ahmed, S., 2010. Flowrate Behavior and
Imbibition in Shale. SPE 138521. Presented at the SPE regional meeting
in West Virginia, October 2010.
Wang, D., Butler, R., Zhang, J., and Seright, R,. 2012. Wettability Survey in
Bakken Shale with Surfactant-formulation Imbibition, SPE Reserv. Eval.
Eng. 15(6), 695-705

65
Biographical Information
Joseph Ikechukwu Anyanwu is the third of seven children of Mr. and Mrs.
A.E. Anyanwu. He graduated with Bachelor of Technology from the Federal
University of Technology, Owerri, in Imo State, Nigeria in 2006, and a Master’s of
Science in Geology from the University of Texas at Arlington in 2015. His
undergraduate research was in Sedimentology and particle size distribution and
this led him to choose the petroleum geology option for his graduate program.
While at the University of Texas at Arlington, his research interest was in
petrophysics and low-pore connectivity in unconventional resource plays, hence
a focus on nanopetrophysics of Bakken play. After graduation, Joseph intend to
work and build a career in the oil and gas industry.