Embed Size (px)
Citation preview

8/2/2019 Bakken Exit Capacity
http://slidepdf.com/reader/full/bakken-exit-capacity 1/53

8/2/2019 Bakken Exit Capacity
http://slidepdf.com/reader/full/bakken-exit-capacity 2/53
8/2/2019 Bakken Exit Capacity
http://slidepdf.com/reader/full/bakken-exit-capacity 3/53
8/2/2019 Bakken Exit Capacity
http://slidepdf.com/reader/full/bakken-exit-capacity 4/53
BRIGHAM
4
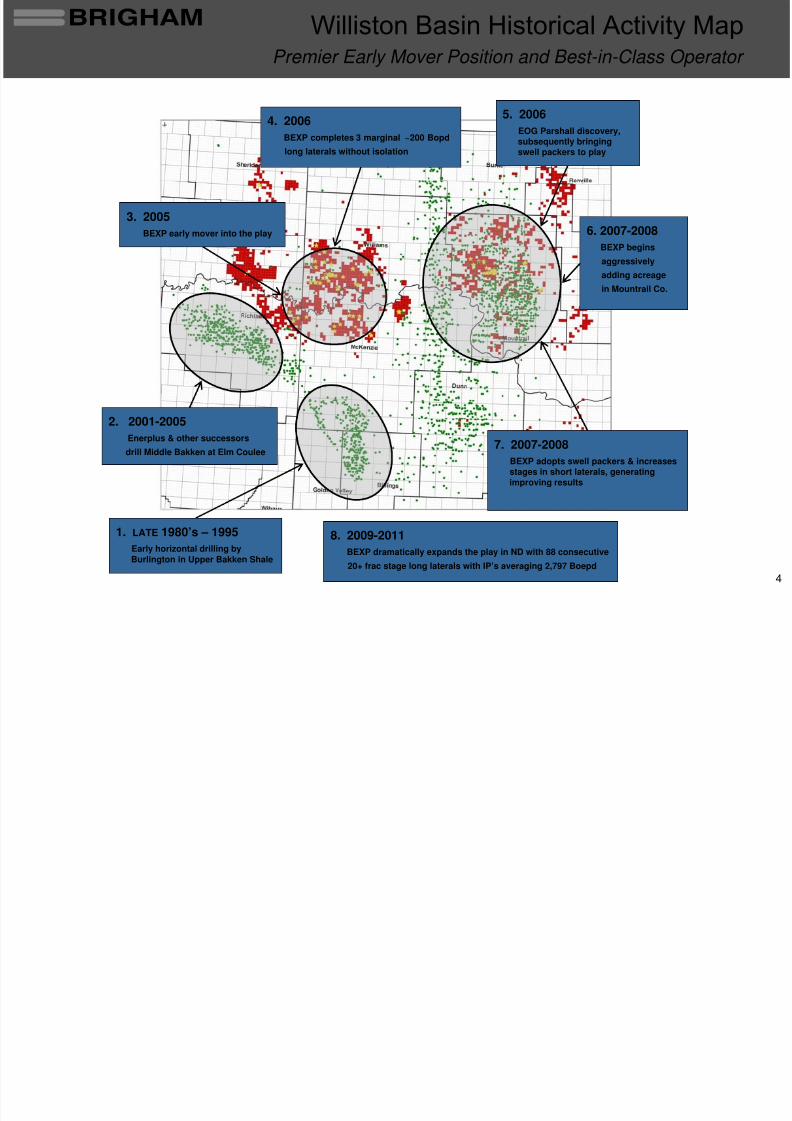
Premier Early Mover Position and Best-in-Class Operator
6. 2007-2008
BEXP begins
aggressively
adding acreage
in Mountrail Co.
3. 2005
BEXP early mover into the play
4. 2006
BEXP completes 3 marginal ~200 Bopd
long laterals without isolation
5. 2006
EOG Parshall discovery,subsequently bringingswell packers to play
8. 2009-2011
BEXP dramatically expands the play in ND with 88 consecutive
20+ frac stage long laterals with IP’s averaging 2,797 Boepd
1. LATE 1980’s – 1995
Early horizontal drilling byBurlington in Upper Bakken Shale
2. 2001-2005
Enerplus & other successors
drill Middle Bakken at Elm Coulee7. 2007-2008
BEXP adopts swell packers & increasesstages in short laterals, generatingimproving results
Williston Basin Historical Activity Map
8/2/2019 Bakken Exit Capacity
http://slidepdf.com/reader/full/bakken-exit-capacity 5/53
5
BRIGHAM
North Dakota
Well Area Objective Frac Stages IP (Boe/d)
Avg 1st 7 Days
(Boe/d)**
Avg 1st 30 Days
(Boe/d)**
Avg 1st 60 Days
(Boe/d)**
Enderud 9-4 #2H Rough Rider Bakken 42 4,289 3,186 NA NA
Art 6-7 #1H Rough Rider Bakken 35 2,391 1,615 NA NA
Judy 22-15 #1H Rough Rider Bakken 38 3,295 1,977 NA NA
Irgens 27-34 #2H Rough Rider Three Forks 32 2,906 1,416 NA NA
Irgens 27-34 #1H Rough Rider Bakken 32 2,133 1,162 NA NA
Holm 9-4 #2H Ross Three Forks 32 2,196 1,106 729 NA
Holm 9-4 #1H Ross Bakken 32 3,032 1,742 1,083 NA
Alger State 16-21 #1H Ross Bakken 34 3,089 2,014 1,354 NA
Donald 1-12 #1H Rough Rider Bakken 39 1,376 1,114 629 NA
Lucy Hanson 15-22 #1H Rough Rider Bakken 36 4,358 2,272 1,227 934
Raymond 17-20 #1H Rough Rider Bakken 39 2,602 1,844 951 674
Larsen 3-10 #2H Rough Rider Bakken 31 3,212 1,624 1,029 807
Hovde 33-4 #1H Rough Rider Bakken 31 2,349 1,434 874 NA
Pladson 4-9 #1H Ross Three Forks 38 1,104 682 543 NA
Stanley Larson 8-5 #1H Rough Rider Bakken 37 1,020 679 423 311
Gunderson 15-22 #1H Rough Rider Bakken 38 3,905 2,739 1,638 1,220
SCHA 33-34 #1H Ross Bakken 30 2,974 1,614 983 NA
Russell 10-3 #1H Rough Rider Bakken 38 2,993 1,621 915 688Irw in 15-22 #1H Rough Rider Bakken 32 2,073 1,265 856 668
DeLorme 12-1 #1H Rough Rider Bakken 37 2,074 1,131 735 580
Field Trust 7-6 #1H Rough Rider Bakken 38 2,245 1,328 825 631
L. Tufto 7-6 #1H Rough Rider Bakken 37 3,215 1,719 985 800
A. Tufto 18-19 #1H Rough Rider Bakken 33 2,871 1,926 1,027 861
O'Neill 17-20 #1H Rough Rider Bakken 33 3,349 1,611 996 789
Dave Arnson 8-5 #1H Rough Rider Bakken 32 2,464 1,700 976 788
MacMaster 11-2 #1H Rough Rider Bakken 34 1,129 745 500 380
Kalil Farms 14-23 #1H Rough Rider Bakken 33 1,603 1,013 608 501Vachal 3-34 #1H Ross Bakken 38 3,800 1,948 1,304 1,029
Greenstein 30-31 #1H Rough Rider Bakken 31 3,232 2,033 1,099 808
Erickson 8-17 #3H Rough Rider Bakken 32 3,091 1,707 974 724
Brad Olson 9-16 #3H Rough Rider Bakken 32 2,375 1,558 839 666
Esther Hynek 10-11 #1H Ross Bakken 31 1,904 1,309 828 670
Sorenson 29-32 #2H Ross Bakken 38 5,330 3,181 1,815 1,371
Cvancara 20-17 #1H Ross Bakken 36 4,402 2,630 1,577 1,229
Afseth 34-3 #1H Ross Bakken 38 1,267 1,026 618 510
Brow n 30-19 #1H Ross Bakken 37 3,309 1,360 1,324 1,045Hospital 31-36 #1H Ross Bakken 33 1,449 1,140 785 595
Gibbins 1-12 #1H Rough Rider Bakken 33 2,582 1,852 1,101 831
Knoshaug 14-11 #1H Rough Rider Bakken 36 4,443 2,460 1,390 1,051
Lloyd 34-3 #1H Rough Rider Bakken 31 4,030 2,489 1,456 1,094Earliest
Most
Recent
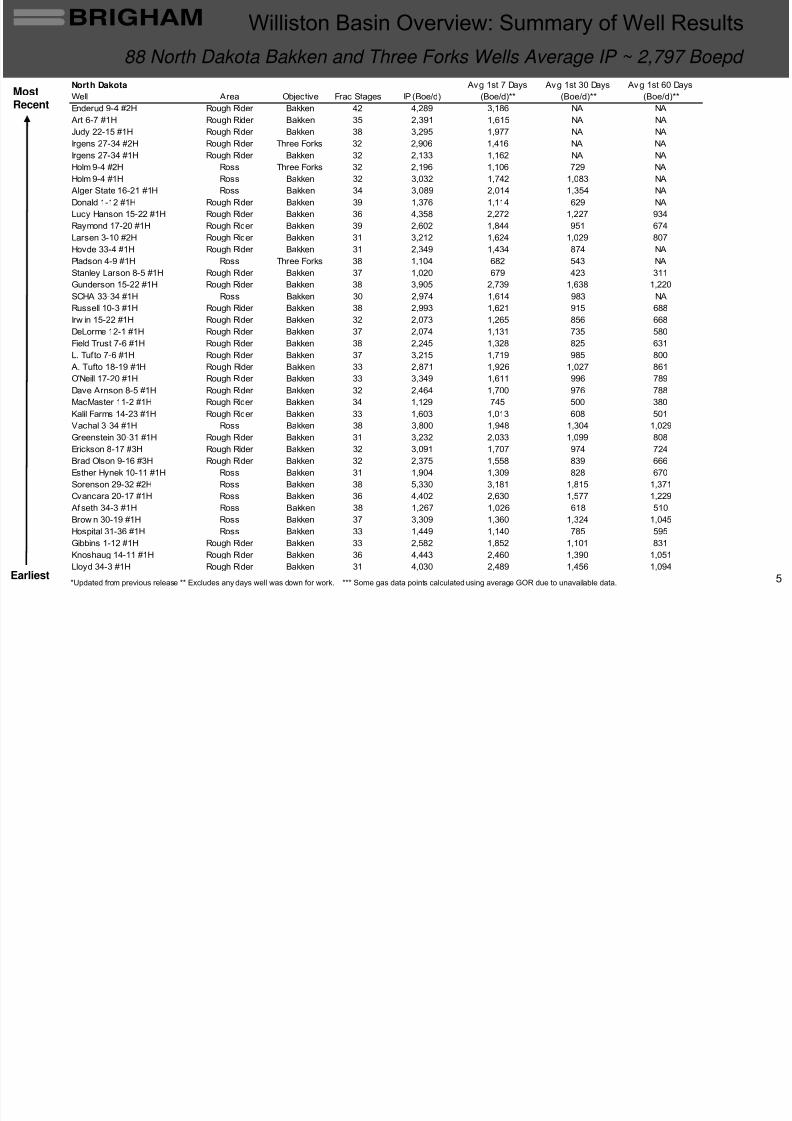
88 North Dakota Bakken and Three Forks Wells Average IP ~ 2,797 Boepd
Williston Basin Overview: Summary of Well Results
*Updated from previous release ** Excludes any days well was down for work. *** Some gas data points calculated using average GOR due to unavailable data.

8/2/2019 Bakken Exit Capacity
http://slidepdf.com/reader/full/bakken-exit-capacity 6/536
BRIGHAM
Well Area Objective Frac Stages IP (Boe/d)
Avg 1st 7 Days
(Boe/d)**
Avg 1st 30 Days
(Boe/d)**
Avg 1st 60 Days
(Boe/d)**
Bratcher 10-3 #1H Rough Rider Bakken 30 3,667 2,040 1,129 880M. Macklin 15-22 #1H Rough Rider Bakken 38 2,534 1,529 1,062 848
M. Olson 20-29 #1H Rough Rider Bakken 38 2,080 1,481 1,007 802
Heen 26-35 #1H Rough Rider Bakken 38 3,791 1,966 1,379 1,073
Arv id Anderson 14-11 #1H Ross Bakken 38 3,191 1,839 1,330 1,015
Lippert 1-12 #1H Rough Rider Bakken 31 2,214 1,512 942 729
Roger Sorenson 8-5 #1H Ross Bakken 38 2,658 1,778 1,120 864
Brakken 30-31 #1H Rough Rider Bakken 30 3,573 2,241 1,277 955
Brad Olson 9-16 #2H Rough Rider Bakken 32 2,717 1,387 773 560
Smith Farm 23-14 #1H Rough Rider Bakken 32 2,417 1,630 1,041 824
Abelmann 23-14 #1H Rough Rider Bakken 33 4,169 2,333 1,407 1,155
Clif ford Bakke 26-35 #1H Ross Bakken 38 5,061 3,657 2,328 1,796
State 36-1#2H Rough Rider Three Forks 31 2,356 1,438 874 696
Domaskin 30-31#1H Ross Bakken 38 4,675 3,092 1,882 1,482
Larsen 3-10 #1H Rough Rider Bakken 31 3,090 1,754 1,034 815
Boots 13-24 #1H Rough Rider Bakken 31 1,946 1,194 662 517
Abe Owan 21-16 #1H Rough Rider Bakken 37 2,213 1,369 900 640
Weisz 11-14 #1H Rough Rider Bakken 37 2,278 1,652 1,014 763
Wright 4-33 #1H Ross Bakken 38 3,660 2,124 1,322 1,013
Sukut 28-33 #1H Rough Rider Bakken 32 1,959 1,330 801 672
Michael Ow an 26-35 #1H Rough Rider Bakken 33 2,931 1,605 889 651
Sedlacek Trust 33-4 #1H Rough Rider Bakken 30 2,695 1,446 826 612
Abe 30-31 #1H Rough Rider Bakken 31 1,847 1,139 731 569
Ow an 29-32 #1H Rough Rider Bakken 31 2,302 1,510 868 631
Ross-Alger 6-7 #1H Ross Bakken 32 3,070 2,074 1,465 1,170
Jack Cvancara 19-18 #1H Ross Bakken 36 5,035 2,972 1,800 1,368
Tjelde 29-32 #1H Rough Rider Bakken 30 3,171 1,710 931 714Mortenson 5-32 #1H Rough Rider Bakken 23 2,314 1,129 584 416
Abelmann St. 21-16 #1H Rough Rider Bakken 31 3,301 1,935 1,044 822
Arnson 13-24 #1H Rough Rider Bakken 30 1,339 776 480 385
Sorenson 29-32 #1H Ross Bakken 27 5,133 3,141 1,909 1,425
Jack Erickson 6-31 #1H Rough Rider Bakken 30 2,652 1,482 833 658
Jerome Anderson 15-10 #1H Ross Bakken 30 3,115 1,938 1,146 853
Papineau Trust 17-20 #1H Rough Rider Bakken 29 3,042 1,743 971 774
Kalil 25-36 #1H Rough Rider Bakken 30 1,586 1,056 650 475
Liffrig 29-20 #1H Ross Three Forks 29 2,477 1,659 1,082 798Jackson 35-34 #1H Rough Rider Bakken 30 3,540 1,616 907 700
Ow an-Nehring 27-34 #1H Rough Rider Bakken 30 2,513 1,737 1,089 843
State 36-1 #1H Rough Rider Bakken 30 3,807 2,497 1,516 1,135
88 North Dakota Bakken and Three Forks Wells Average IP ~ 2,797 Boepd
Williston Basin Overview: Summary of Well Results
Earliest
Most
Recent
*Updated from previous release ** Excludes any days well was down for work. *** Some gas data points calculated using average GOR due to unavailable data.
8/2/2019 Bakken Exit Capacity
http://slidepdf.com/reader/full/bakken-exit-capacity 7/537
BRIGHAM
North Dakota (cont.)
Well Area Objective Frac Stages IP (Boe/d)
Avg 1st 7 Days
(Boe/d)*
Avg 1st 30 Days
(Boe/d)*
Avg 1st 60 Days
(Boe/d)*
Williston 25-36 #1H Rough Rider Bakken 32 3,394 2,342 1,505 1,128
Strand 16-9 #1H Rough Rider Bakken 26 2,264 1,578 948 694
Lee 16-21 #1H Rough Rider Bakken 28 1,544 1,183 698 594
BCD Farms 16-21 #1H Rough Rider Bakken 28 1,776 1,176 702 530
Brad Olson 9-16 #1H Rough Rider Bakken 28 2,112 1,447 811 641
Anderson 28-33 #1H Ross Bakken 24 2,154 1,811 1,346 1,059
Strobeck 27-34 #1H Ross Three Forks 18 2,021 1,410 989 740
Figaro 29-32 #1H Rough Rider Bakken 19 1,895 1,240 831 636Olson 10-15 #1H Rough Rider Bakken 20 1,433 1,132 730 600
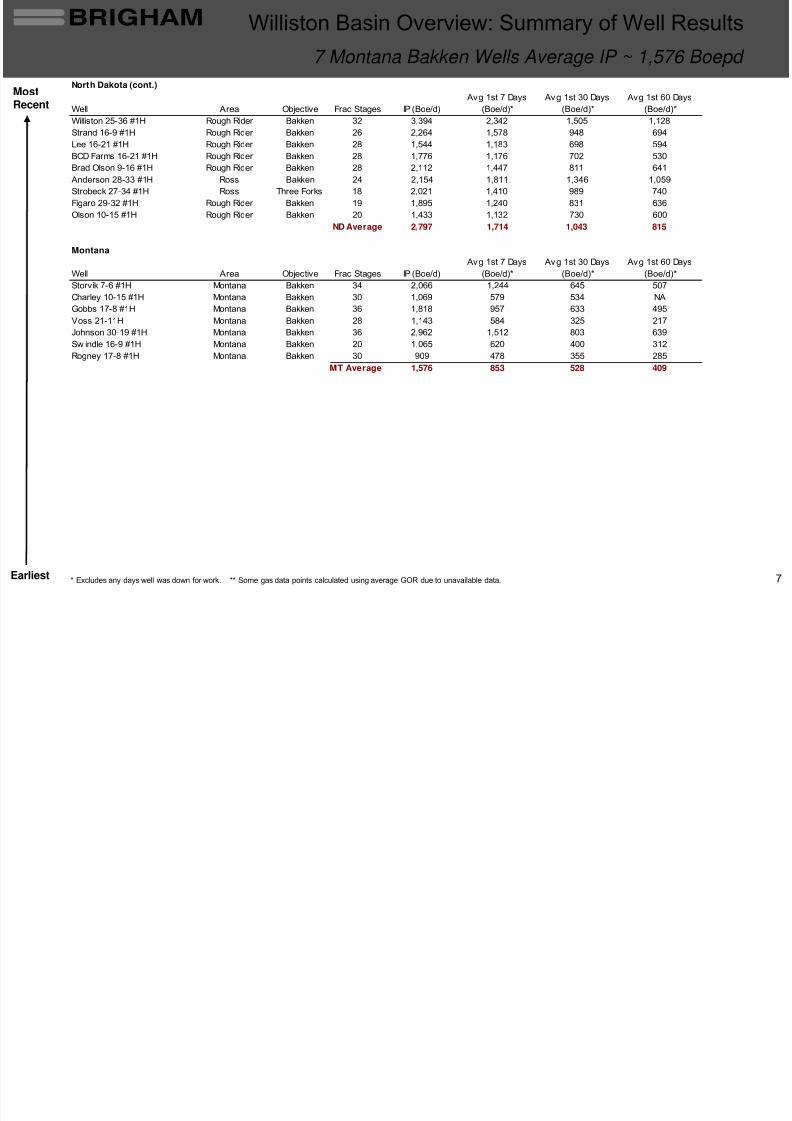
ND Average 2,797 1,714 1,043 815
Montana
Well Area Objective Frac Stages IP (Boe/d)
Avg 1st 7 Days
(Boe/d)*
Avg 1st 30 Days
(Boe/d)*
Avg 1st 60 Days
(Boe/d)*
Storvik 7-6 #1H Montana Bakken 34 2,066 1,244 645 507
Charley 10-15 #1H Montana Bakken 30 1,069 579 534 NA
Gobbs 17-8 #1H Montana Bakken 36 1,818 957 633 495Voss 21-11H Montana Bakken 28 1,143 584 325 217
Johnson 30-19 #1H Montana Bakken 36 2,962 1,512 803 639
Sw indle 16-9 #1H Montana Bakken 20 1,065 620 400 312
Rogney 17-8 #1H Montana Bakken 30 909 478 355 285
MT Average 1,576 853 528 409
7 Montana Bakken Wells Average IP ~ 1,576 Boepd
Williston Basin Overview: Summary of Well Results
Earliest
Most
Recent
* Excludes any days well was down for work. ** Some gas data points calculated using average GOR due to unavailable data.

8/2/2019 Bakken Exit Capacity
http://slidepdf.com/reader/full/bakken-exit-capacity 8/53
8/2/2019 Bakken Exit Capacity
http://slidepdf.com/reader/full/bakken-exit-capacity 9/53
BRIGHAM
9
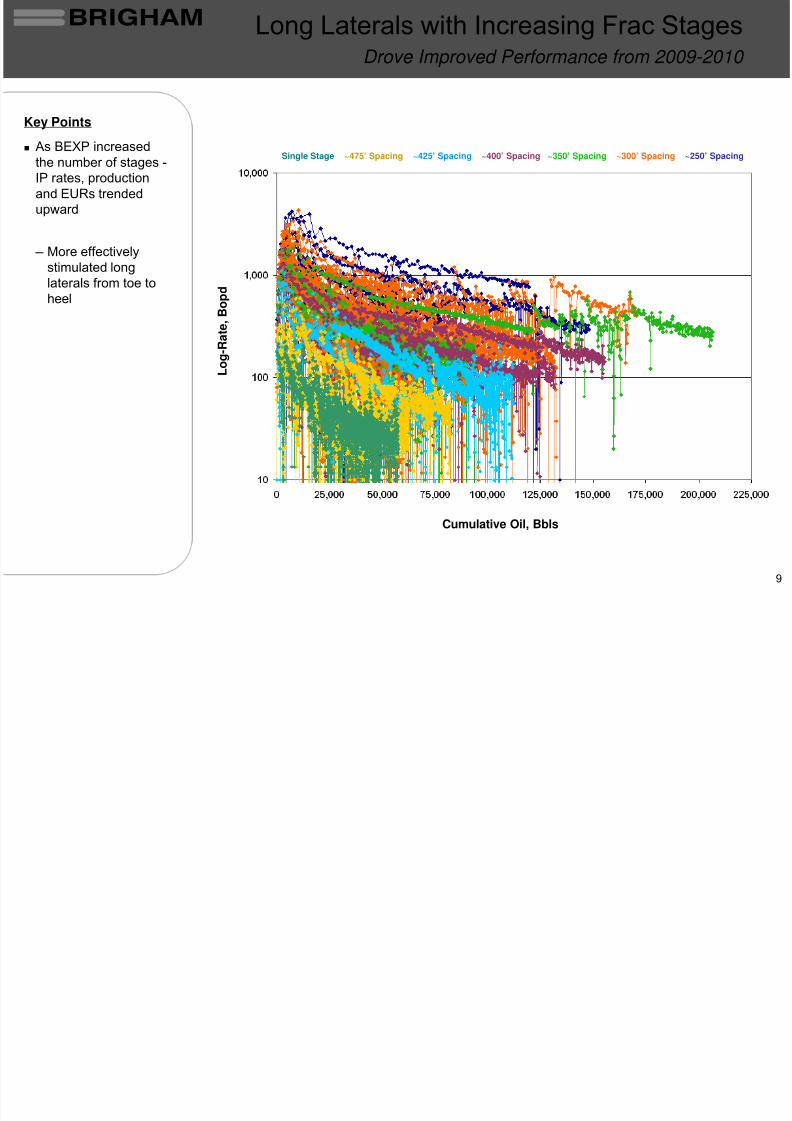
Key Points
As BEXP increasedthe number of stages -
IP rates, productionand EURs trended
upward
─
More effectivelystimulated longlaterals from toe toheel
Drove Improved Performance from 2009-2010
Long Laterals with Increasing Frac Stages
Cumulative Oil, Bbls
L o g - R a t e , B
o p d
Single Stage ~475’ Spacing ~425’ Spacing ~400’ Spacing ~350’ Spacing ~300’ Spacing ~250’ Spacing
8/2/2019 Bakken Exit Capacity
http://slidepdf.com/reader/full/bakken-exit-capacity 10/53
BRIGHAM
10
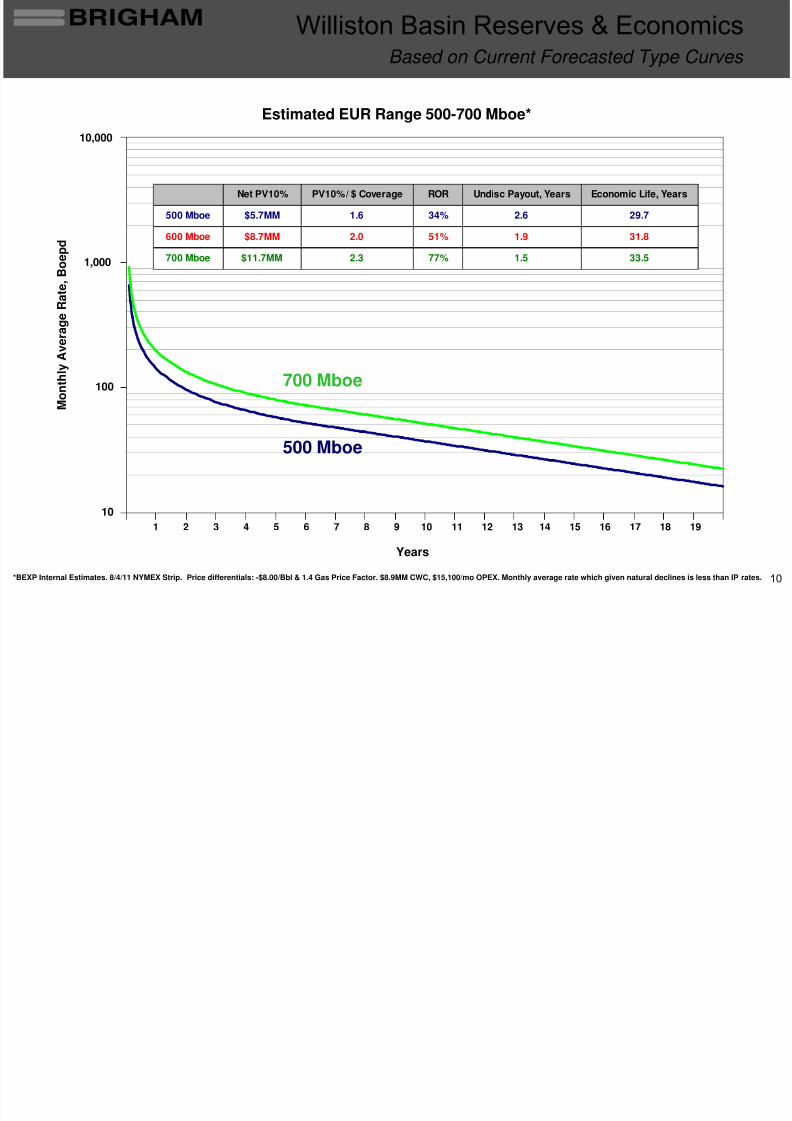
Estimated EUR Range 500-700 Mboe*
10
100
1,000
10,000
M o n t h l y A v e r a g e
R a t e ,
B o e p d
*BEXP Internal Estimates. 8/4/11 NYMEX Strip. Price differentials: -$8.00/Bbl & 1.4 Gas Price Factor. $8.9MM CWC, $15,100/mo OPEX. Monthly average rate which given natural declines is less than IP rates.
1 2 3 4 5 6 7 8 9 10 11 12 13 14 15 16 17 18 19
Years
500 Mboe
700 Mboe
Based on Current Forecasted Type Curves
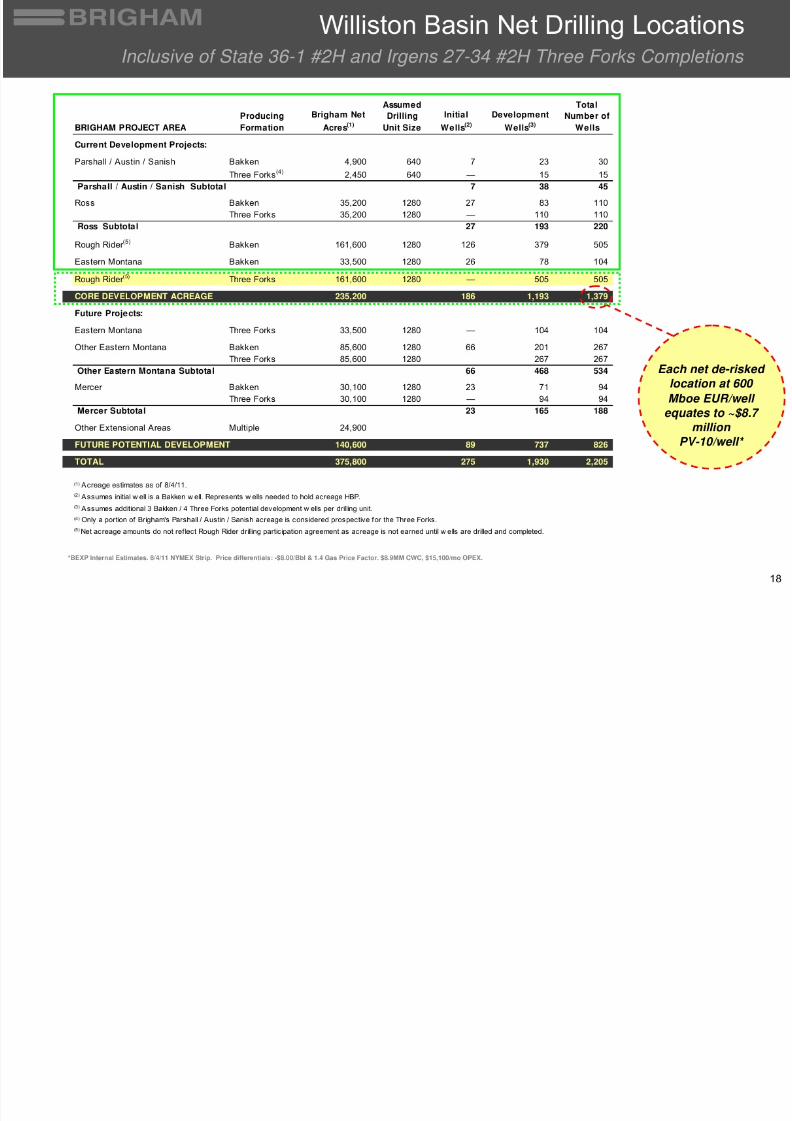
Williston Basin Reserves & Economics
Net PV10% PV10% / $ Coverage ROR Undisc Payout, Years Economic Life, Years
500 Mboe $5.7MM 1.6 34% 2.6 29.7
600 Mboe $8.7MM 2.0 51% 1.9 31.8
700 Mboe $11.7MM 2.3 77% 1.5 33.5
Estimated EUR Range 500-700 Mboe*
1,000
100
10,000
10
M o n t h l y A v e r a g e R a t e ,
B o e p d
8/2/2019 Bakken Exit Capacity
http://slidepdf.com/reader/full/bakken-exit-capacity 11/5311
BRIGHAM
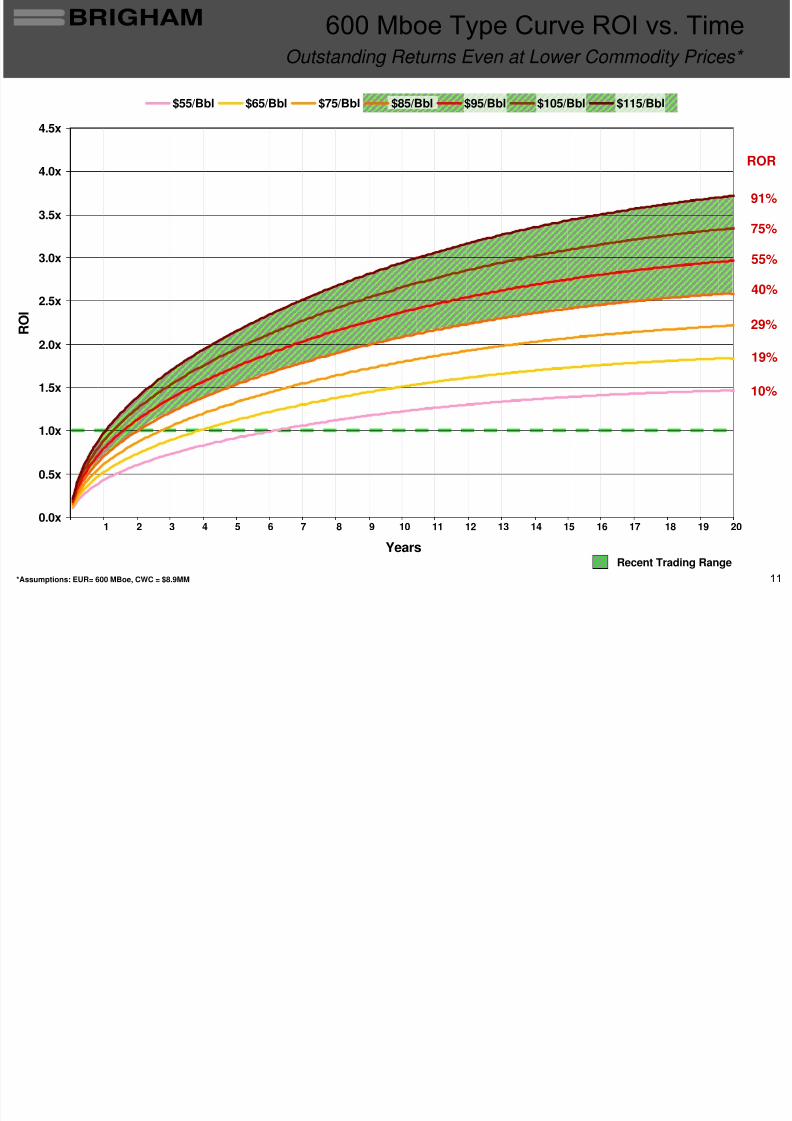
Outstanding Returns Even at Lower Commodity Prices*
600 Mboe
Type Curve ROI vs. Time
*Assumptions: EUR= 600 MBoe, CWC = $8.9MM
1 2 3 4 5 6 7 8 9 10 11 12 13 14 15 16 17 18 19 20
ROR
55%
40%
29%
19%
10%
75%
Recent Trading Range
91%
0.0x
0.5x
1.0x
1.5x
2.0x
2.5x
3.0x
3.5x
4.0x
4.5x
Years
R O I
$55/Bbl $65/Bbl $75/Bbl $85/Bbl $95/Bbl $105/Bbl $115/Bbl
8/2/2019 Bakken Exit Capacity
http://slidepdf.com/reader/full/bakken-exit-capacity 12/5312
BRIGHAM
0
1
2
3
4
5
6
7
8
9
10
11
12
13
14
J A S O N D J F M A M J J A S O N D J F M A M J J A S O N D J F M A M J J A S O N D J F M A M J J A S O N D J F M A M J J
20102006 2007 2008 2009
4 Rigs 7 Rigs
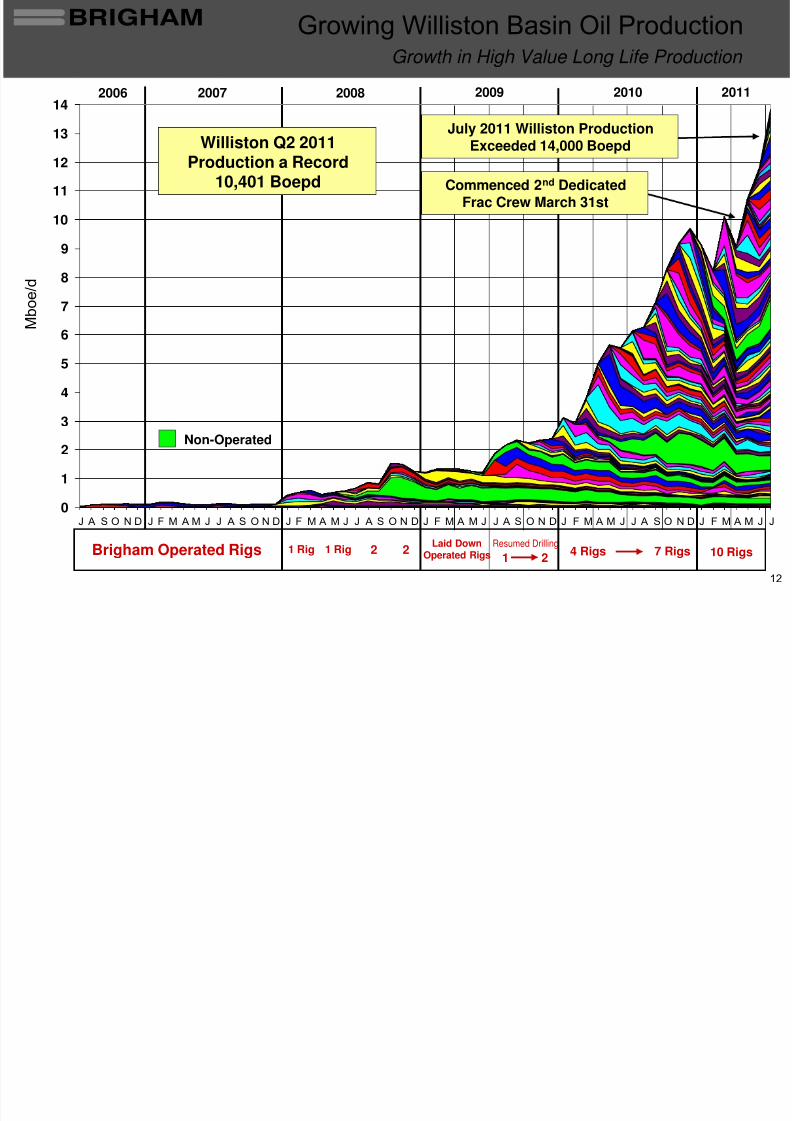
Williston Q2 2011Production a Record
10,401 Boepd
Non-Operated
M b
o e / d
Laid DownOperated Rigs
1 Rig 2Brigham Operated Rigs 2Resumed Drilling
1 21 Rig 10 Rigs
July 2011 Williston ProductionExceeded 14,000 Boepd
Commenced 2nd Dedicated
Frac Crew March 31st
2011
Growth in High Value Long Life Production
Growing Williston Basin Oil Production

8/2/2019 Bakken Exit Capacity
http://slidepdf.com/reader/full/bakken-exit-capacity 13/53
BRIGHAM
13
$25.83/Boe
$15.57/Boe$16.41/Boe
$14.00
$16.00
$18.00
$20.00
$22.00
$24.00
$26.00
$28.00
Total Operated Non-Operated
Strong DrillingResults
Drilling CapEx / Proved Developed Rsvs
Bakken / Three Forks Operated Wells Delivering Lower ProvedDeveloped Finding Costs Than Non-Operated Wells
Proved Developed Finding & Development Costs ($/Boe)
Growth EngineBakken/ThreeForks Drilling
2010 Bakken / Three Forks
8/2/2019 Bakken Exit Capacity
http://slidepdf.com/reader/full/bakken-exit-capacity 14/5314
BRIGHAM
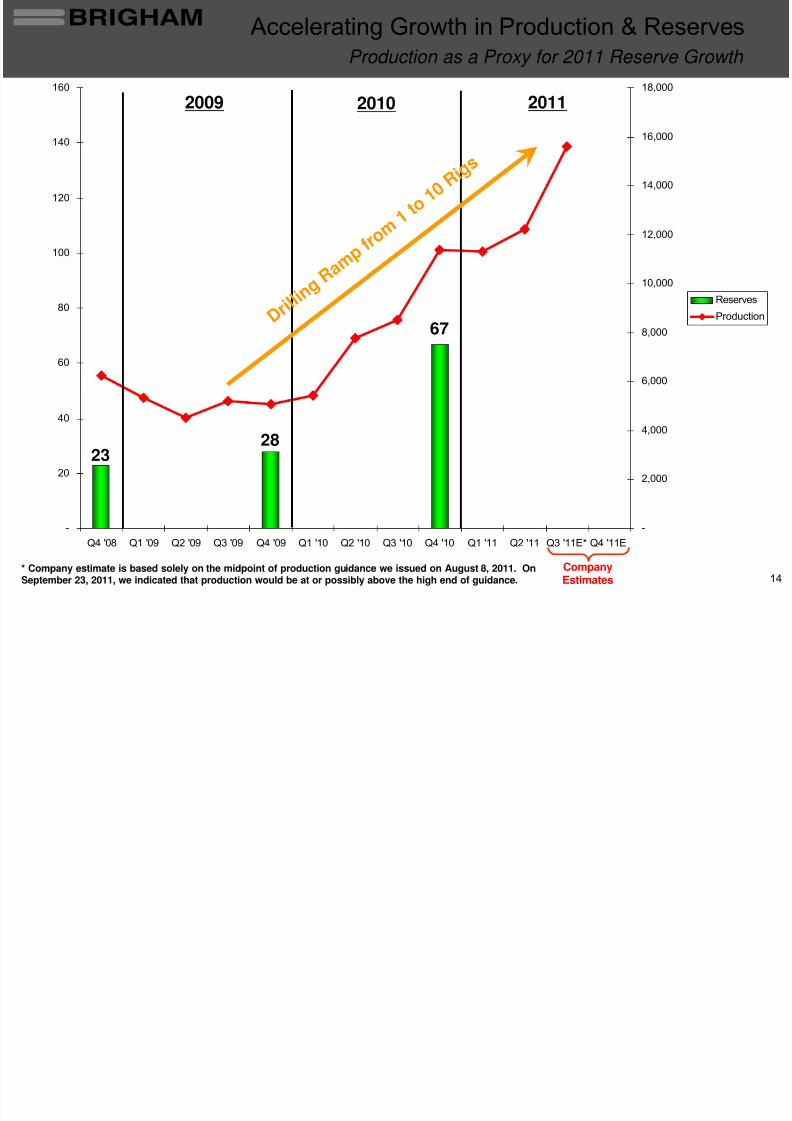
67
2823
-
20
40
60
80
100
120
140
160
Q4 '08 Q1 '09 Q2 '09 Q3 '09 Q4 '09 Q1 '10 Q2 '10 Q3 '10 Q4 '10 Q1 '11 Q2 '11 Q3 '11E* Q4 '11E
-
2,000
4,000
6,000
8,000
10,000
12,000
14,000
16,000
18,000
Reserves
Production
2009 20112010
CompanyEstimates
Accelerating Growth in Production & ReservesProduction as a Proxy for 2011 Reserve Growth
D r i l l i n
g R a
m p f r o
m 1 t o
1 0 R i g s
* Company estimate is based solely on the midpoint of production guidance we issued on August 8, 2011. OnSeptember 23, 2011, we indicated that production would be at or possibly above the high end of guidance.
G
8/2/2019 Bakken Exit Capacity
http://slidepdf.com/reader/full/bakken-exit-capacity 15/5315
BRIGHAM
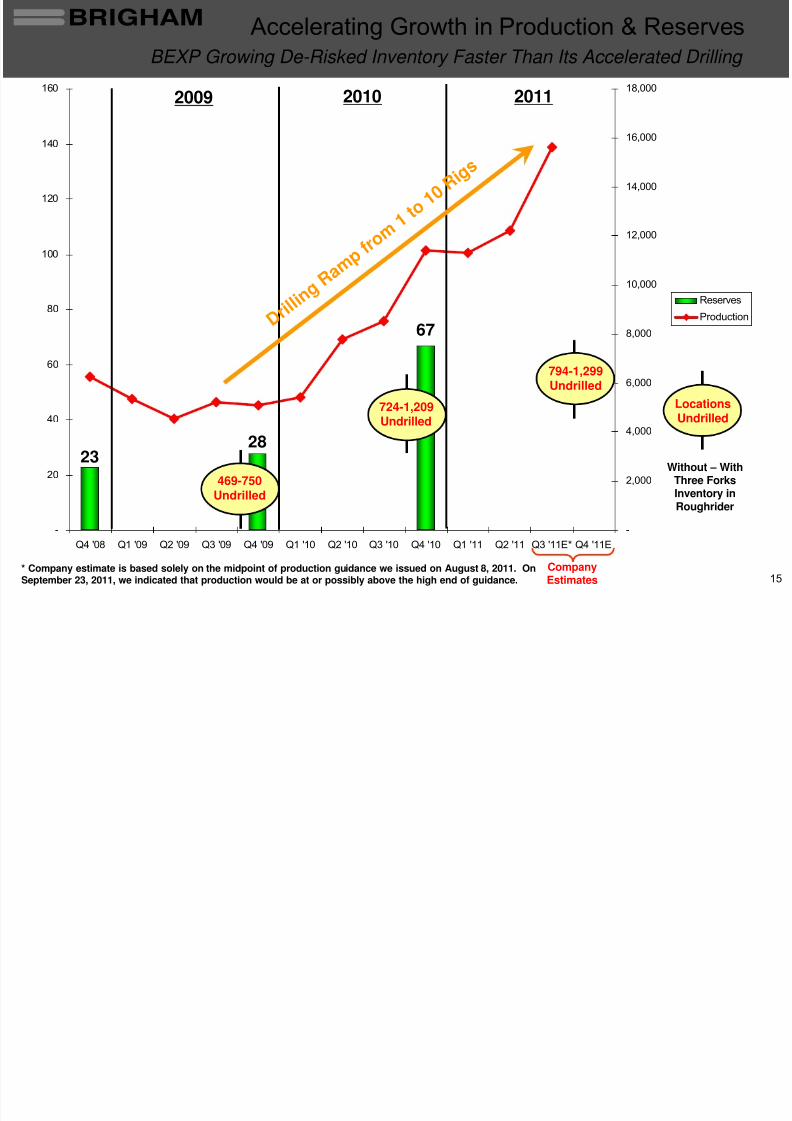
67
2328
-
20
40
60
80
100
120
140
160
Q4 '08 Q1 '09 Q2 '09 Q3 '09 Q4 '09 Q1 '10 Q2 '10 Q3 '10 Q4 '10 Q1 '11 Q2 '11 Q3 '11E* Q4 '11E
-
2,000
4,000
6,000
8,000
10,000
12,000
14,000
16,000
18,000
Reserves
Production
2009 20112010
D r i l l i n
g R a
m p f r o
m 1 t o
1 0 R i g s
Accelerating Growth in Production & ReservesBEXP Growing De-Risked Inventory Faster Than Its Accelerated Drilling
724-1,209Undrilled
469-750Undrilled
794-1,299Undrilled
Without – WithThree ForksInventory inRoughrider
Locations
Undrilled
CompanyEstimates
* Company estimate is based solely on the midpoint of production guidance we issued on August 8, 2011. OnSeptember 23, 2011, we indicated that production would be at or possibly above the high end of guidance.

8/2/2019 Bakken Exit Capacity
http://slidepdf.com/reader/full/bakken-exit-capacity 16/53
BRIGHAM

8/2/2019 Bakken Exit Capacity
http://slidepdf.com/reader/full/bakken-exit-capacity 17/5317
BRIGHAM
M O N T A N A
M O N T A N A
N O R T H
D A
K O T A
N O R T H
D A K O T A
Williams
Rough Rider Three Forks Activity Map
ContinentalObert 1-13H
IP: 896 Boepd
Mrachek Trust 22-15Completing
OasisWilson 14-24H
Completing
State 36-1 #2HIP: 2,356 Boepd
Irgens 27-34 #2HIP: 2,906 Boepd
Tracker
Scanlan 17-1THIP: 1,781 Boepd
Kodiak KoalaIP: 2,327 Boepd
Brigham Drilling
Brigham Bakken Completing
Non-Op Drilling
Three Forks Producing
Brigham TRFKs Completing
Broderson 30-31 #1HCompleting
5 Proximal Three Forks Completions with Avg. IP: 2,053 Boepd
8/2/2019 Bakken Exit Capacity
http://slidepdf.com/reader/full/bakken-exit-capacity 18/53
BRIGHAM

8/2/2019 Bakken Exit Capacity
http://slidepdf.com/reader/full/bakken-exit-capacity 19/5319
BRIGHAM
Wright 4-33IP: 3,660 Boepd
Bakken/
Three ForksDensity Pilot
Sorenson 29-32 #1H3rd Highest Reported
IP: 5,133 Boepd
Jack Cvancara 19-185th Highest Reported
IP: 5,035 Boepd
Esther Hynek 10-11IP: 1,904 Boepd
SCHA 33-34IP: 2,974 Boepd
Clifford Bakke 26-354th Highest Reported
IP: 5,061 Boepd
Sorenson 29-32 #2HHighest ReportedIP: 5,330 BoepdCvancara 20-17
IP: 4,402 Boepd
Hospital 31-36IP: 1,449 Boepd
Roger Sorenson 8-5IP: 2,658 Boepd
24 Long Lateral High Frac Stage Wells w/ 3,171 Boepd Avg. IP
Ross Activity Map
Brigham Drilling
Brigham Completing
Non-Op Drilling
Three Forks Producing
Bures 20-29 #2HCompleting
Bures 20-29Completing
Vachal 3-34
IP: 3,800 Boepd
Charlie Sorenson 17-8#1 & 2H Completing
Brown 30-19IP: 3,309 Boepd
Domaskin 30-317th Highest Reported
IP: 4,675 Boepd
Alger State 16-21IP: 3,089 Boepd
Arvid Anderson 14-11IP: 3,191 Boepd
Holm 9-4IP: 3,032 Boepd
Holm 9-4 #2HIP: 2,196 Boepd
BRIGHAM
8/2/2019 Bakken Exit Capacity
http://slidepdf.com/reader/full/bakken-exit-capacity 20/5320
BRIGHAM
M O N T A N A
M O N T A N A
N O R T H
D A K O T A
N O R T H
D A K O T A
Williams
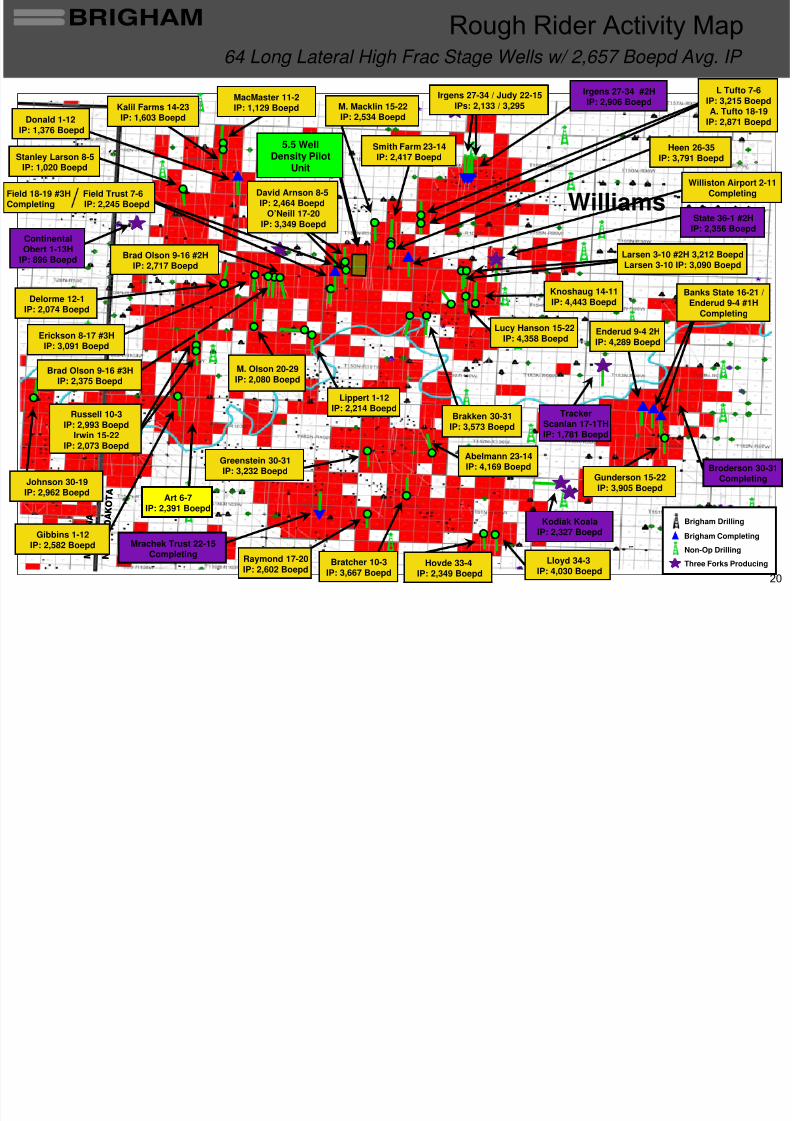
Johnson 30-19IP: 2,962 Boepd
Brad Olson 9-16 #2HIP: 2,717 Boepd
Heen 26-35IP: 3,791 Boepd
State 36-1 #2HIP: 2,356 Boepd
Greenstein 30-31IP: 3,232 Boepd
Lloyd 34-3IP: 4,030 Boepd
L Tufto 7-6
IP: 3,215 BoepdA. Tufto 18-19IP: 2,871 Boepd
ContinentalObert 1-13H
IP: 896 Boepd
Hovde 33-4IP: 2,349 Boepd
Lippert 1-12IP: 2,214 Boepd
Smith Farm 23-14IP: 2,417 Boepd
M. Macklin 15-22IP: 2,534 Boepd
Erickson 8-17 #3HIP: 3,091 Boepd
TrackerScanlan 17-1THIP: 1,781 Boepd
Brad Olson 9-16 #3HIP: 2,375 Boepd
Delorme 12-1
IP: 2,074 Boepd
Gunderson 15-22IP: 3,905 Boepd
5.5 WellDensity Pilot
Unit
Williston Airport 2-11Completing
Gibbins 1-12IP: 2,582 Boepd
Bratcher 10-3IP: 3,667 Boepd
Stanley Larson 8-5IP: 1,020 Boepd
Irgens 27-34 #2H
IP: 2,906 Boepd
64 Long Lateral High Frac Stage Wells w/ 2,657 Boepd Avg. IP
Rough Rider Activity Map
Brigham Drilling
Brigham Completing
Non-Op Drilling
Three Forks ProducingRaymond 17-20IP: 2,602 Boepd
MacMaster 11-2
IP: 1,129 Boepd
Field 18-19 #3H Field Trust 7-6Completing IP: 2,245 Boepd
Russell 10-3IP: 2,993 Boepd
Irwin 15-22IP: 2,073 Boepd
Art 6-7IP: 2,391 Boepd
Mrachek Trust 22-15Completing
Larsen 3-10 #2H 3,212 BoepdLarsen 3-10 IP: 3,090 Boepd
Irgens 27-34 / Judy 22-15
IPs: 2,133 / 3,295
M. Olson 20-29IP: 2,080 Boepd
David Arnson 8-5IP: 2,464 Boepd
O’Neill 17-20IP: 3,349 Boepd
Kodiak KoalaIP: 2,327 Boepd
Enderud 9-4 2HIP: 4,289 Boepd
Lucy Hanson 15-22IP: 4,358 Boepd
Donald 1-12IP: 1,376 Boepd
Brakken 30-31IP: 3,573 Boepd
Knoshaug 14-11IP: 4,443 Boepd
Banks State 16-21 /Enderud 9-4 #1H
Completing
Kalil Farms 14-23IP: 1,603 Boepd
Broderson 30-31Completing
Abelmann 23-14IP: 4,169 Boepd
BRIGHAM
8/2/2019 Bakken Exit Capacity
http://slidepdf.com/reader/full/bakken-exit-capacity 21/5321
BRIGHAM
Roosevelt
M O N T A N A
M O N T A N A
N O R T H
D A K
O T A
N O R T H
D A K
O T A
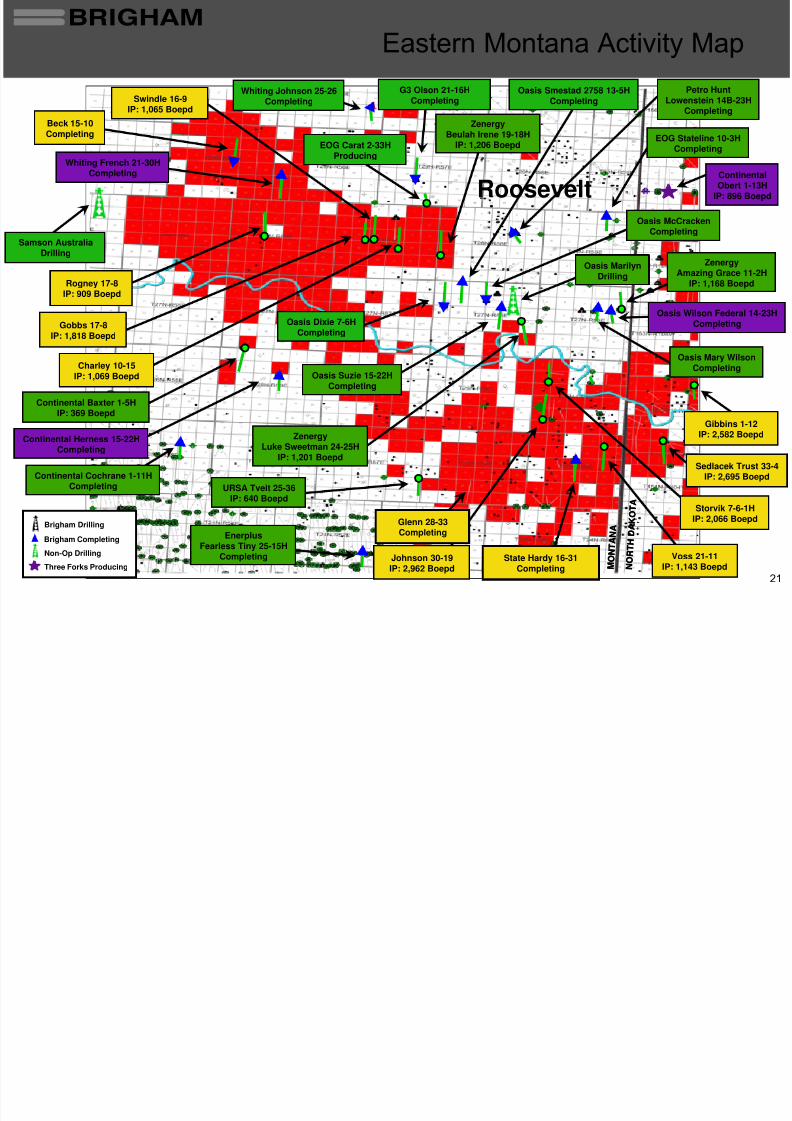
Rogney 17-8IP: 909 Boepd
Petro HuntLowenstein 14B-23H
Completing
Swindle 16-9IP: 1,065 Boepd
Johnson 30-19IP: 2,962 Boepd
Sedlacek Trust 33-4IP: 2,695 Boepd
Continental Baxter 1-5H
IP: 369 Boepd
EOG Carat 2-33HProducing
ZenergyLuke Sweetman 24-25H
IP: 1,201 Boepd
Oasis Suzie 15-22HCompleting
EOG Stateline 10-3HCompleting
ZenergyBeulah Irene 19-18H
IP: 1,206 Boepd
Charley 10-15IP: 1,069 Boepd
URSA Tveit 25-36IP: 640 Boepd
Oasis Dixie 7-6HCompleting
ZenergyAmazing Grace 11-2H
IP: 1,168 Boepd
Voss 21-11IP: 1,143 Boepd
Beck 15-10Completing
ContinentalObert 1-13H
IP: 896 Boepd
Storvik 7-6-1H
IP: 2,066 Boepd
Oasis Wilson Federal 14-23HCompleting
Gibbins 1-12IP: 2,582 Boepd
Whiting French 21-30HCompleting
Continental Herness 15-22HCompleting
Oasis Smestad 2758 13-5H
Completing
Whiting Johnson 25-26
Completing
Gobbs 17-8IP: 1,818 Boepd
Continental Cochrane 1-11HCompleting
EnerplusFearless Tiny 25-15H
Completing
Oasis McCrackenCompleting
Oasis Mary WilsonCompleting
G3 Olson 21-16HCompleting
Eastern Montana Activity Map
State Hardy 16-31Completing
Brigham Drilling
Brigham Completing
Non-Op Drilling
Three Forks Producing
Oasis MarilynDrilling
Samson AustraliaDrilling
Glenn 28-33Completing

8/2/2019 Bakken Exit Capacity
http://slidepdf.com/reader/full/bakken-exit-capacity 22/53
BRIGHAM R h Rid I d D i D illi P

8/2/2019 Bakken Exit Capacity
http://slidepdf.com/reader/full/bakken-exit-capacity 23/53
BRIGHAM
23
Key Points
Completed RoughRider density wells theBrad Olson 9-16 #2Hand the Brad Olson
9-16 #3H
─
First density wellaverages approximately1,200’
from previouslycompleted Brad Olson#1H, a distance more
consistent with four wellspacing
─
Results from these wells,along with microseismic
data, demonstrate theviability of increaseddensity drilling
─
Plan to initiate four welldensity pattern in bothRough Rider and Ross inQ3 2011
─
5.5 well density pattern inQ4 2011
─
Four well spacing also
utilized by Kodiak andContinental in recentlyannounced drilling plans
Brad Olson Increased Density Wells & Microseismic
Rough Rider Increased Density Drilling Program
Erickson 8-17 #3H
Olson 10-15 #1HIP: 1,433 Boepd
Brad Olson 9-16 #1HIP: 2,112 Boepd
Brad Olson 9-16 #2HIP: 2,717 Boepd
Brad Olson 9-16 #3HIP: 2,375 Boepd
Erickson 8-17 #1H
Avg Distance Between #1H and#3H Wells: 1,790 Feet
Avg Distance Between #2H and#3H Wells: 1,390 Feet
BRIGHAM R h Rid I d D it D illi P
8/2/2019 Bakken Exit Capacity
http://slidepdf.com/reader/full/bakken-exit-capacity 24/53
BRIGHAM
24
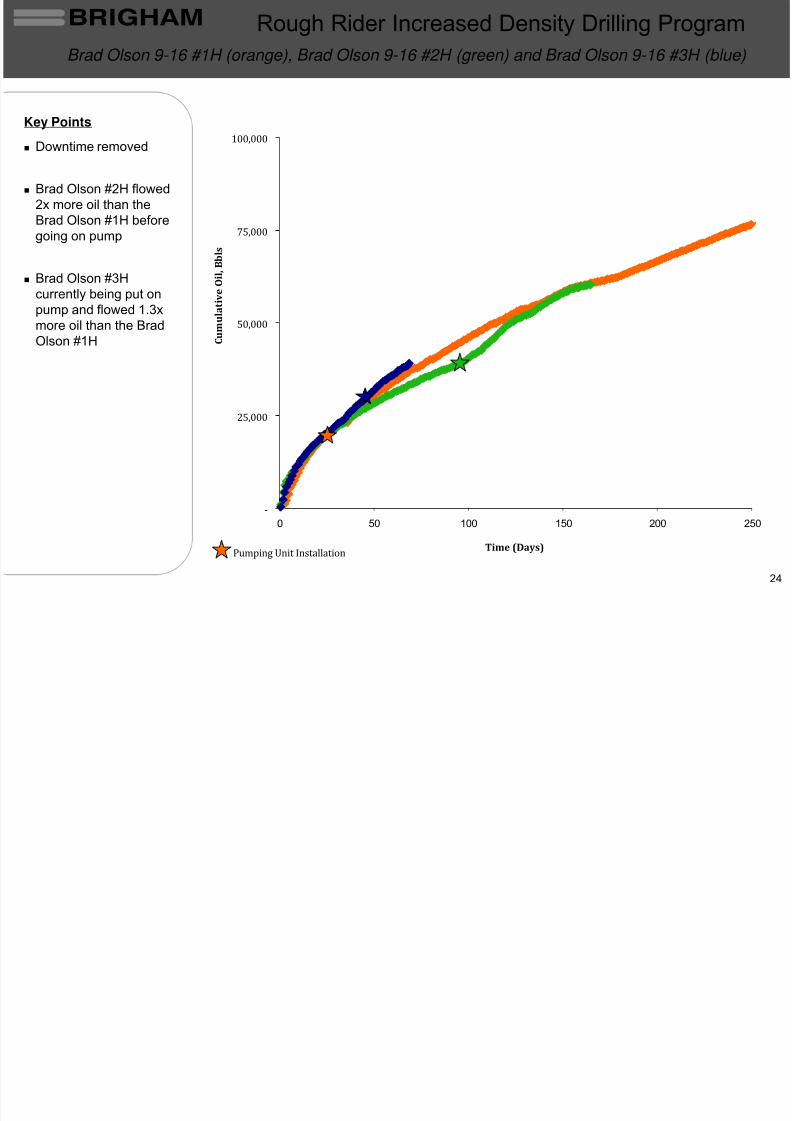
Rough Rider Increased Density Drilling Program
Key Points
Downtime removed
Brad Olson #2H flowed
2x more oil than theBrad Olson #1H beforegoing on pump
Brad Olson #3Hcurrently being put on
pump and flowed 1.3xmore oil than the BradOlson #1H
Brad Olson 9-16 #1H (orange), Brad Olson 9-16 #2H (green) and Brad Olson 9-16 #3H (blue)
‐
25,000
50,000
75,000
100,000
0 50 100 150 200 250
Time(Days)
C u m u l a t i v e O i l , B b l s
PumpingUnitInstallation
BRIGHAM
L C ti A Bl k
8/2/2019 Bakken Exit Capacity
http://slidepdf.com/reader/full/bakken-exit-capacity 25/53
BRIGHAM
25
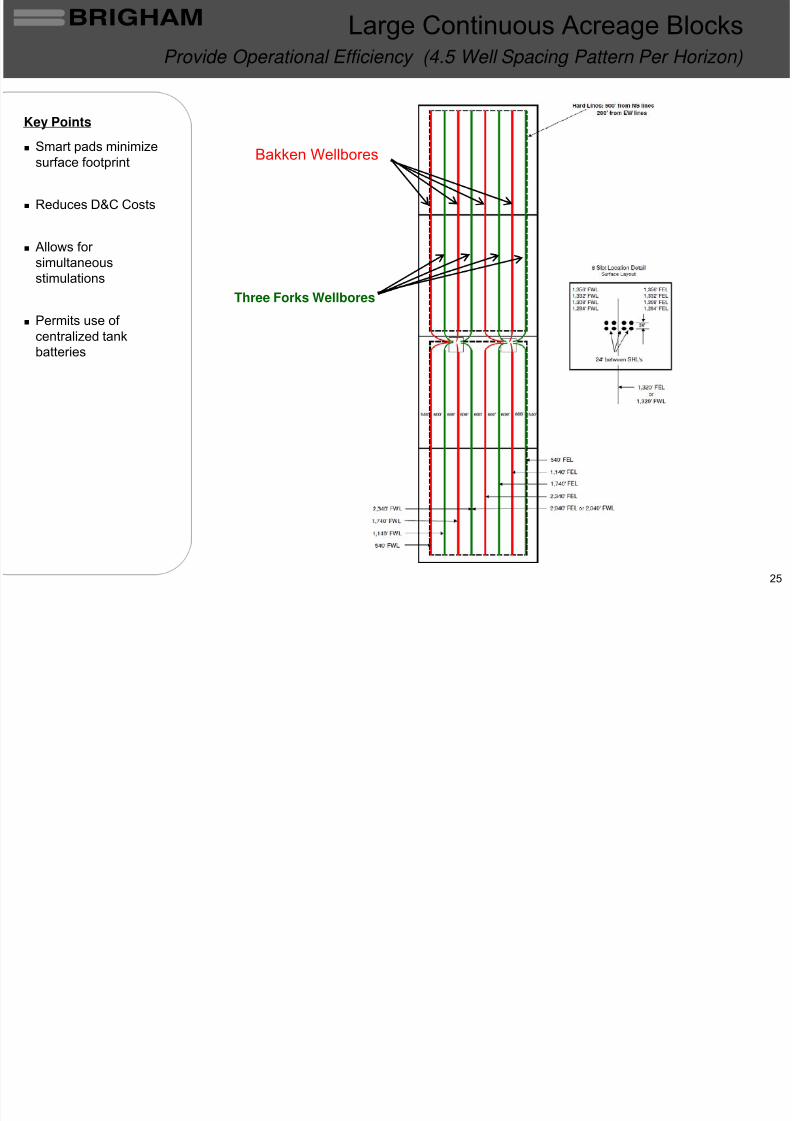
Key Points
Smart pads minimizesurface footprint
Reduces D&C Costs
Allows for simultaneousstimulations
Permits use of centralized tankbatteries
Bakken Wellbores
Three Forks Wellbores
Provide Operational Efficiency (4.5 Well Spacing Pattern Per Horizon)
Large Continuous Acreage Blocks
BRIGHAM Oil Ri h B i
8/2/2019 Bakken Exit Capacity
http://slidepdf.com/reader/full/bakken-exit-capacity 26/53
BRIGHAM
26
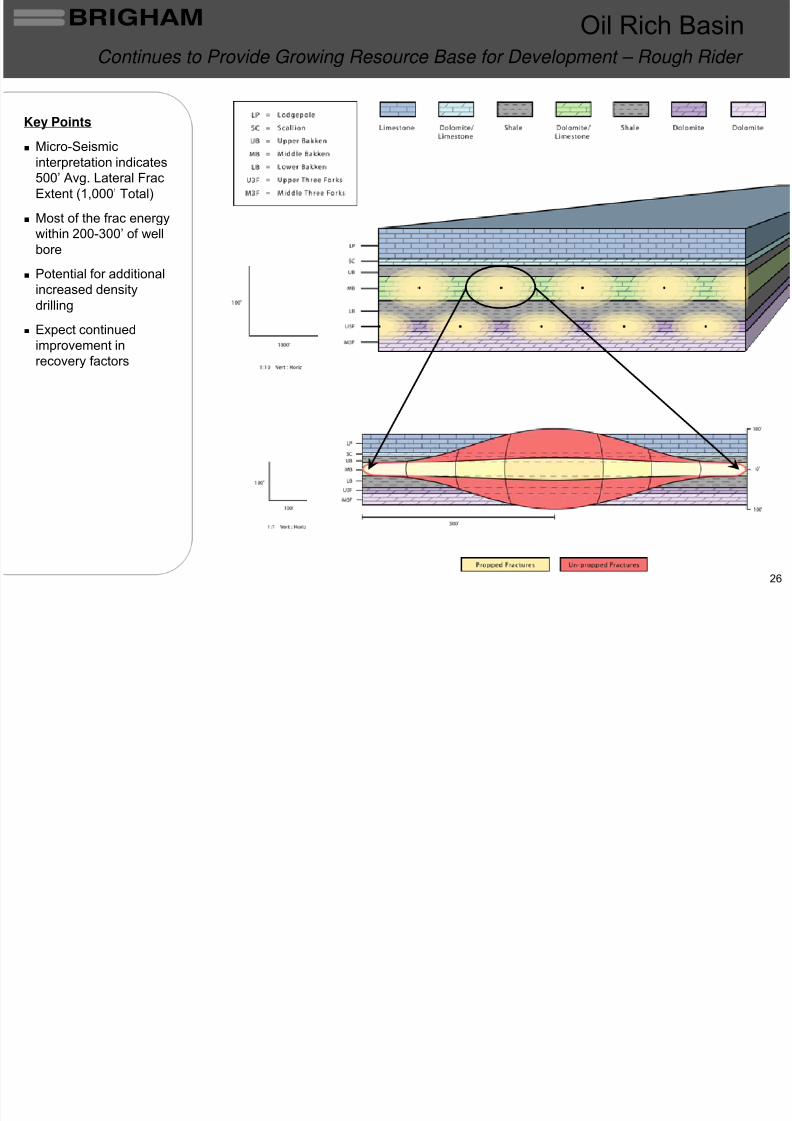
Key Points
Micro-Seismicinterpretation indicates500’
Avg. Lateral Frac
Extent (1,000’
Total)
Most of the frac energywithin 200-300’
of well
bore
Potential for additionalincreased densitydrilling
Expect continuedimprovement inrecovery factors
Continues to Provide Growing Resource Base for Development – Rough Rider
Oil Rich Basin
BRIGHAM Oil Ri h B i
8/2/2019 Bakken Exit Capacity
http://slidepdf.com/reader/full/bakken-exit-capacity 27/53
BRIGHAM
27
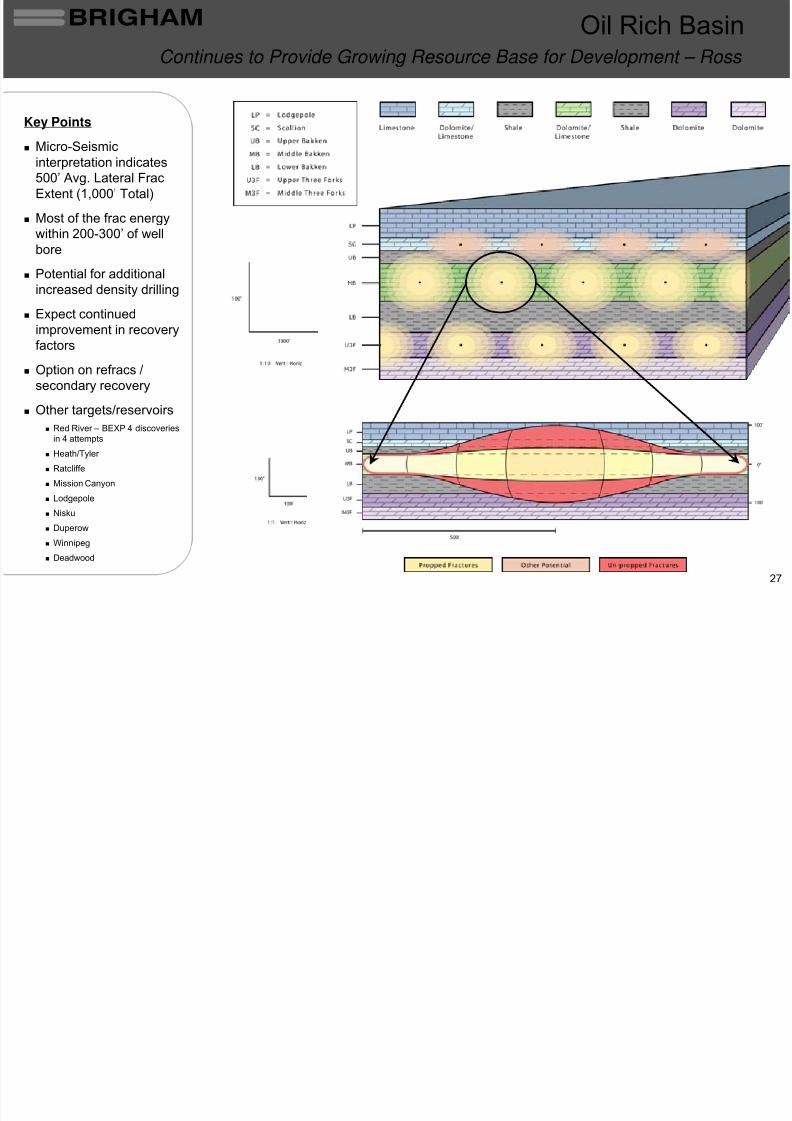
Continues to Provide Growing Resource Base for Development – Ross
Oil Rich Basin
Key Points
Micro-Seismicinterpretation indicates500’
Avg. Lateral Frac
Extent (1,000’
Total)
Most of the frac energywithin 200-300’
of well
bore
Potential for additionalincreased density drilling
Expect continuedimprovement in recoveryfactors
Option on refracs
/
secondary recovery
Other targets/reservoirs
Red River –
BEXP 4 discoveriesin 4 attempts
Heath/Tyler
Ratcliffe
Mission Canyon
Lodgepole
Nisku
Duperow
Winnipeg
Deadwood
BRIGHAM
8/2/2019 Bakken Exit Capacity
http://slidepdf.com/reader/full/bakken-exit-capacity 28/53
28
BRIGHAM
28
BRIGHAM H i t l B kk 3 M th A

8/2/2019 Bakken Exit Capacity
http://slidepdf.com/reader/full/bakken-exit-capacity 29/53
BRIGHAM
29
Williams
McKenzie
Mountrail
North Dakota: Post-2008
Horizontal Bakken 3 Month Avg.
BRIGHAM H i t l B kk 6 M th A
8/2/2019 Bakken Exit Capacity
http://slidepdf.com/reader/full/bakken-exit-capacity 30/53
BRIGHAM
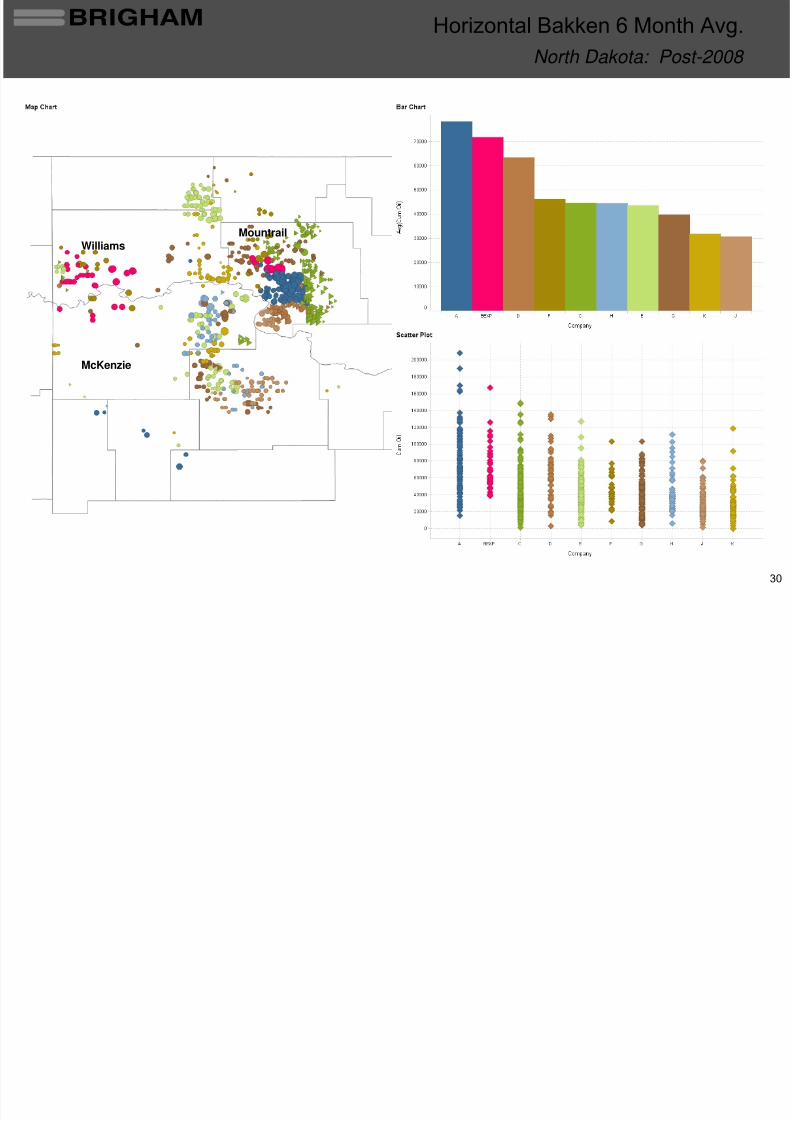
30
Williams
McKenzie
Mountrail
North Dakota: Post-2008
Horizontal Bakken 6 Month Avg.
BRIGHAM H i t l B kk 12 M th A
8/2/2019 Bakken Exit Capacity
http://slidepdf.com/reader/full/bakken-exit-capacity 31/53
BRIGHAM
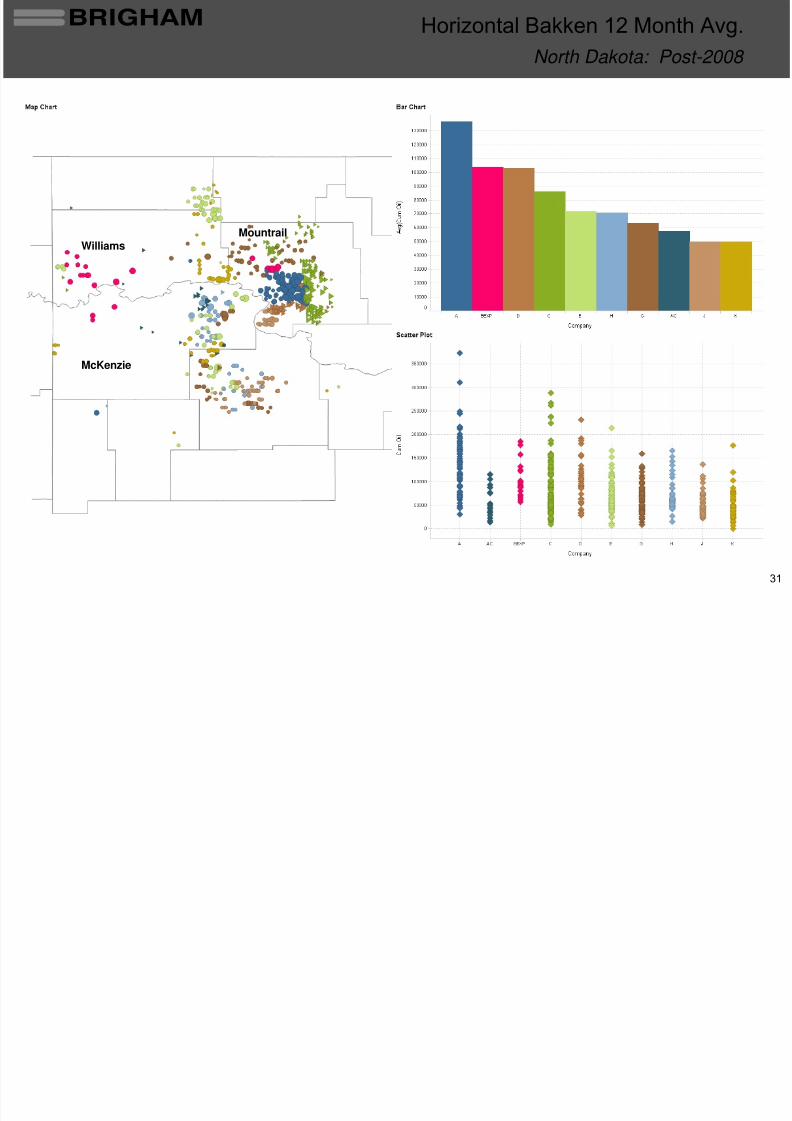
31
North Dakota: Post-2008
Horizontal Bakken 12 Month Avg.
Williams
McKenzie
Mountrail
BRIGHAM Long Laterals Within 5 Mi of BEXP 3 Month A g

8/2/2019 Bakken Exit Capacity
http://slidepdf.com/reader/full/bakken-exit-capacity 32/53
BRIGHAM
32
Williams
McKenzie
Mountrail
Rough Rider: Post-2008
Long Laterals Within ~5 Mi. of BEXP 3 Month Avg.
BRIGHAM Long Laterals Within 5 Mi of BEXP 6 Month Avg
8/2/2019 Bakken Exit Capacity
http://slidepdf.com/reader/full/bakken-exit-capacity 33/53
BRIGHAM
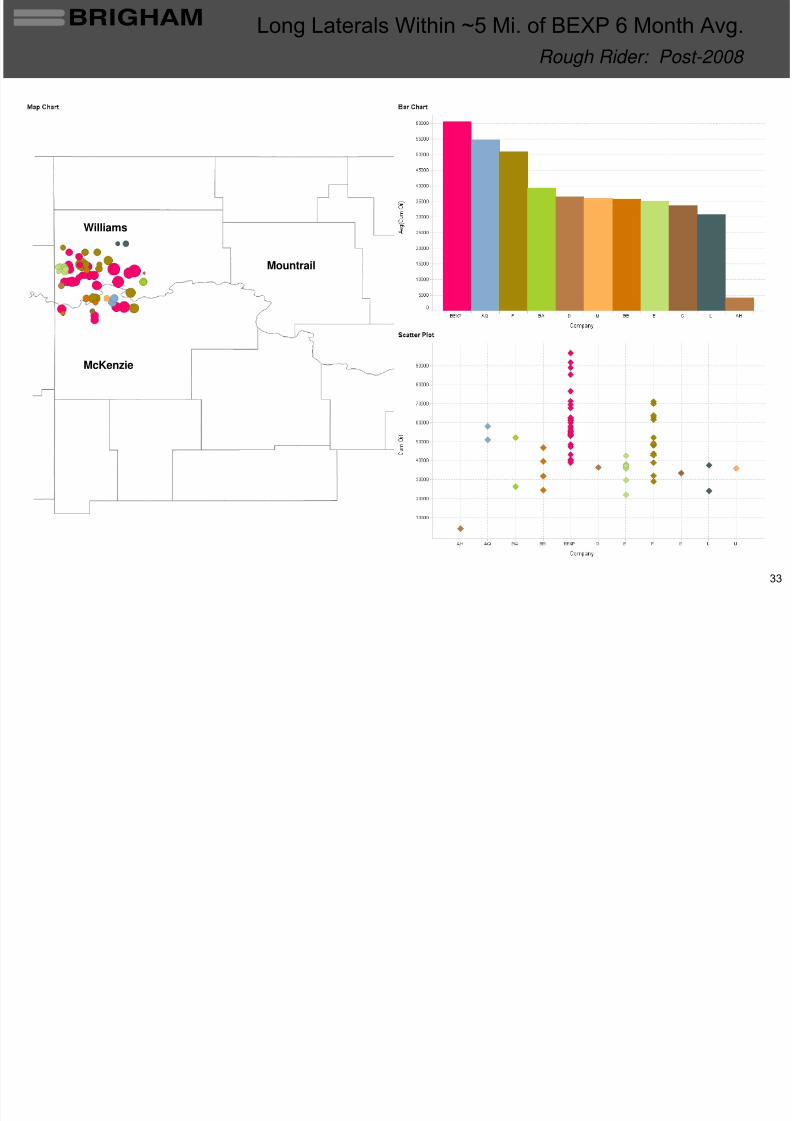
33
Williams
McKenzie
Mountrail
Rough Rider: Post-2008
Long Laterals Within ~5 Mi. of BEXP 6 Month Avg.
BRIGHAM Long Laterals Within 5 Mi of BEXP 12 Month Avg
8/2/2019 Bakken Exit Capacity
http://slidepdf.com/reader/full/bakken-exit-capacity 34/53
BRIGHAM
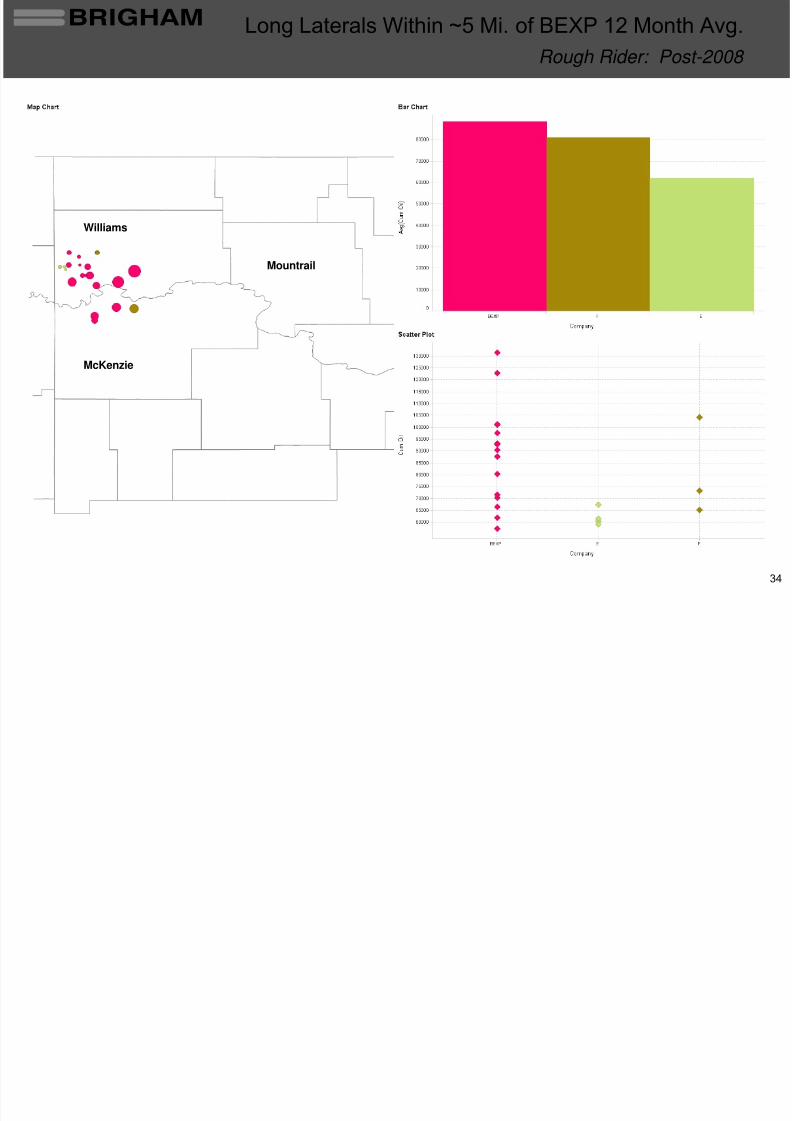
34
Williams
McKenzie
Mountrail
Rough Rider: Post-2008
Long Laterals Within ~5 Mi. of BEXP 12 Month Avg.
BRIGHAM Long Laterals Within ~5 Mi of BEXP 3 Month Avg

8/2/2019 Bakken Exit Capacity
http://slidepdf.com/reader/full/bakken-exit-capacity 35/53
BRIGHAM
35
Ross: Post-2008
Long Laterals Within ~5 Mi. of BEXP 3 Month Avg.
Williams
McKenzie
Mountrail
BRIGHAM Long Laterals Within ~5 Mi of BEXP 6 Month Avg

8/2/2019 Bakken Exit Capacity
http://slidepdf.com/reader/full/bakken-exit-capacity 36/53
BRIGHAM
36
Williams
McKenzie
Mountrail
Ross: Post-2008
Long Laterals Within ~5 Mi. of BEXP 6 Month Avg.
BRIGHAM Long Laterals Within ~5 Mi of BEXP 12 Month Avg
8/2/2019 Bakken Exit Capacity
http://slidepdf.com/reader/full/bakken-exit-capacity 37/53
BRIGHAM
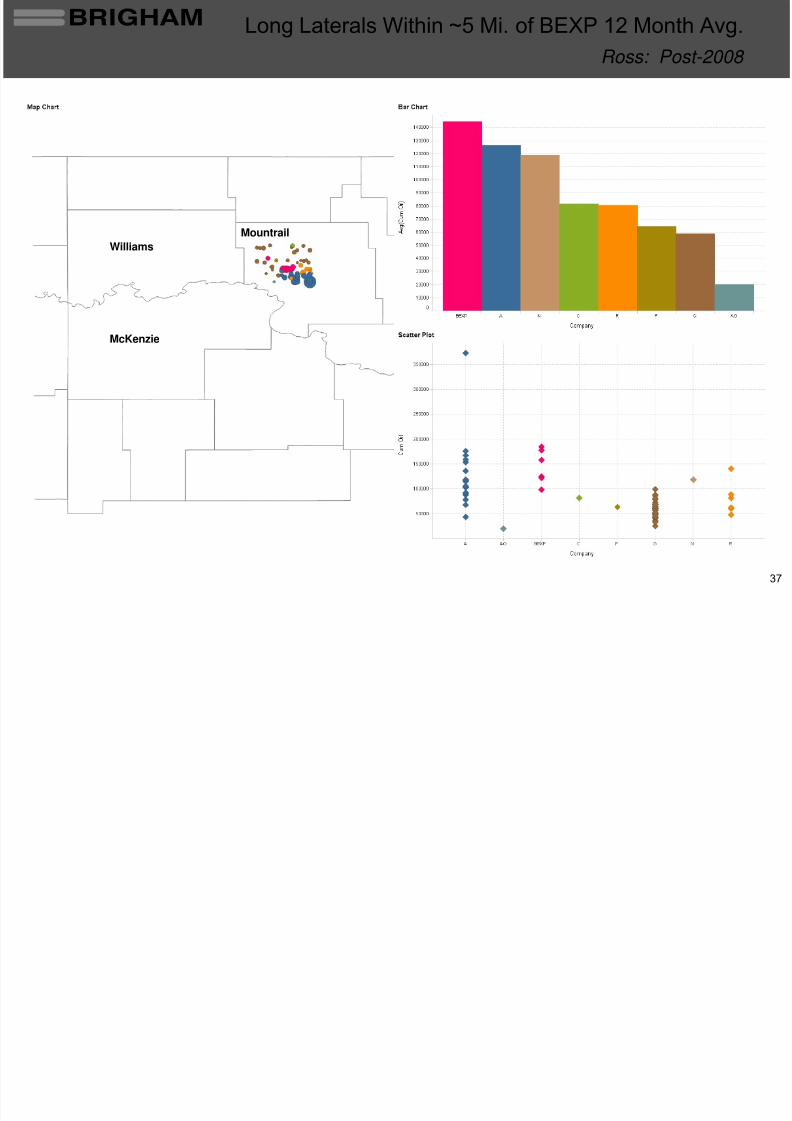
37
Ross: Post-2008
Long Laterals Within ~5 Mi. of BEXP 12 Month Avg.
Williams
McKenzie
Mountrail

8/2/2019 Bakken Exit Capacity
http://slidepdf.com/reader/full/bakken-exit-capacity 38/53
BRIGHAM Large Continuous Acreage Blocks

8/2/2019 Bakken Exit Capacity
http://slidepdf.com/reader/full/bakken-exit-capacity 39/53
39
Key Points
Contiguous acreageblocks providesignificant advantagesover competitors
─
Enables efficient multi-wellpad development drilling
─
Stacked locations allow for simultaneous “zipper fracs”
─
Ability to operate majority of acreage and thereby controlpace of development
─
Provides flexibility to avoidsurface issues
─
Provides for efficientinfrastructure development
─
Targeting 10 to 20% costsavings per well
Executing acreagetrades to further consolidate netacreage positions andincrease operationalcontrol
Provide Operational Efficiencies (~188 Operated Drilling Units)
Large Continuous Acreage Blocks
Current Rough Rider Development
108 Stacked 1,280-Acre Drilling Units (864 gross wells)
60 Additional Operated 1,280-Acre Drilling Units (480 gross wells)
Note: Assumes ≥ 30% WI = Operated.
BRIGHAM
8/2/2019 Bakken Exit Capacity
http://slidepdf.com/reader/full/bakken-exit-capacity 40/53
40
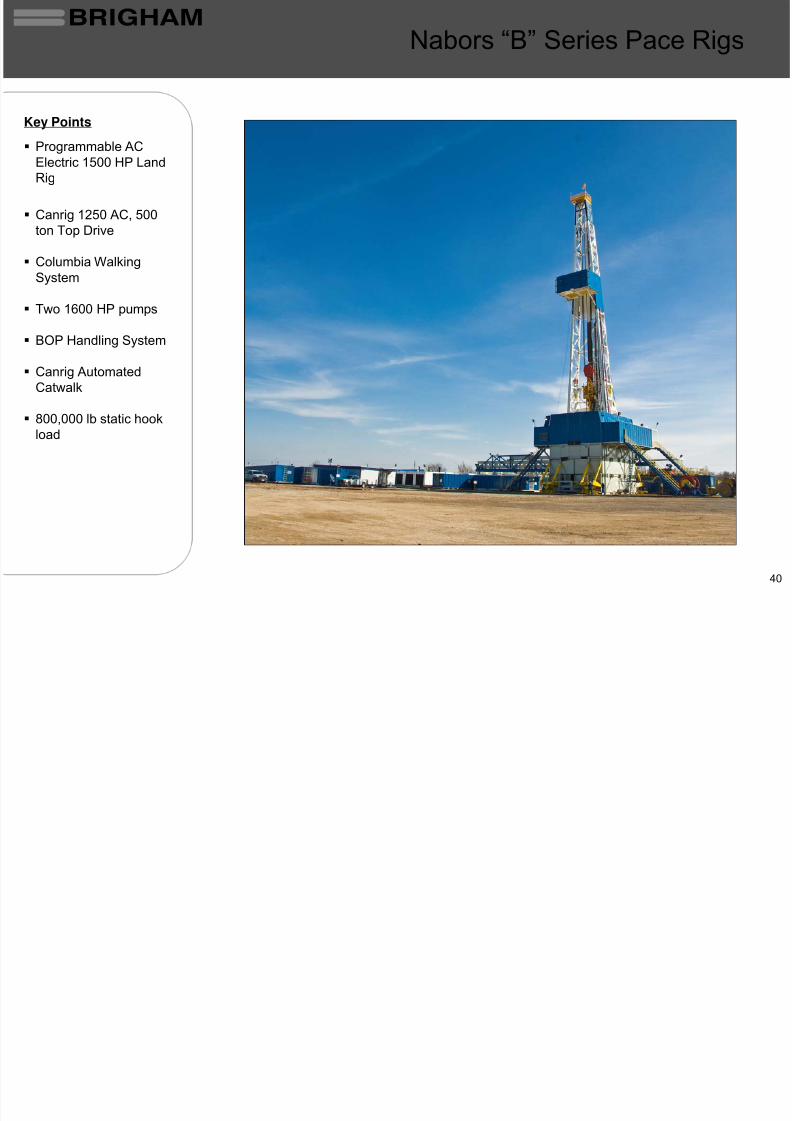
Nabors “B”
Series Pace Rigs
Key Points
Programmable ACElectric 1500 HP LandRig
Canrig
1250 AC, 500
ton Top Drive
Columbia WalkingSystem
Two 1600 HP pumps
BOP Handling System
Canrig
Automated
Catwalk
800,000 lb static hookload
BRIGHAM
8/2/2019 Bakken Exit Capacity
http://slidepdf.com/reader/full/bakken-exit-capacity 41/53
41
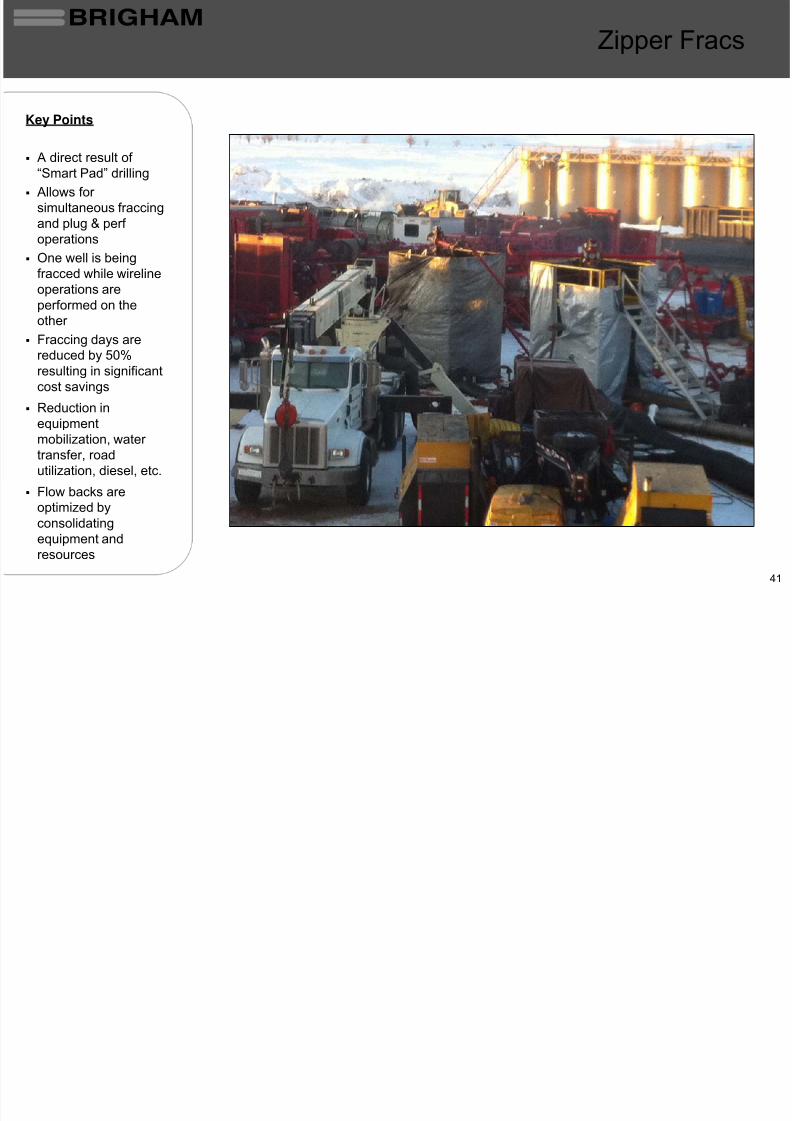
Key Points
A direct result of “Smart Pad”
drilling
Allows for
simultaneous fraccing
and plug & perf
operations
One well is beingfracced
while wireline
operations areperformed on theother
Fraccing
days are
reduced by 50%resulting in significantcost savings
Reduction in
equipmentmobilization, water transfer, roadutilization, diesel, etc.
Flow backs areoptimized by
consolidatingequipment andresources
Zipper Fracs
BRIGHAM
8/2/2019 Bakken Exit Capacity
http://slidepdf.com/reader/full/bakken-exit-capacity 42/53
42
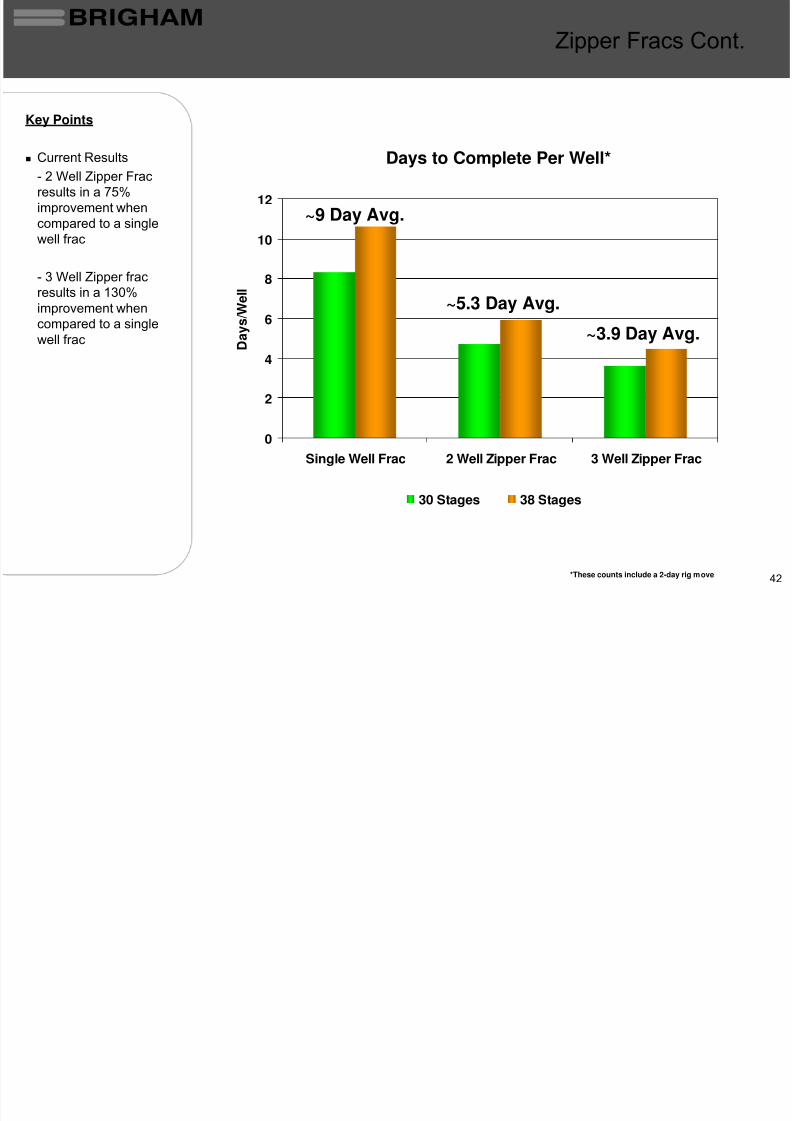
Key Points
Current Results
-
2 Well Zipper Fracresults in a 75%
improvement whencompared to a singlewell frac
-
3 Well Zipper frac
results in a 130%improvement whencompared to a singlewell frac
Zipper Fracs
Cont.
Days to Complete Per Well*
0
2
4
6
8
10
12
Single Well Frac 2 Well Zipper Frac 3 Well Zipper Frac
D a y s / W e l l
30 Stages 38 Stages
*These counts include a 2-day rig move
~9 Day Avg.
~5.3 Day Avg.
~3.9 Day Avg.
BRIGHAM Infrastructure Pipeline Operations
8/2/2019 Bakken Exit Capacity
http://slidepdf.com/reader/full/bakken-exit-capacity 43/53
43
Photo Taken June 22, 2011
Infrastructure Pipeline Operations
BRIGHAM
8/2/2019 Bakken Exit Capacity
http://slidepdf.com/reader/full/bakken-exit-capacity 44/53
44
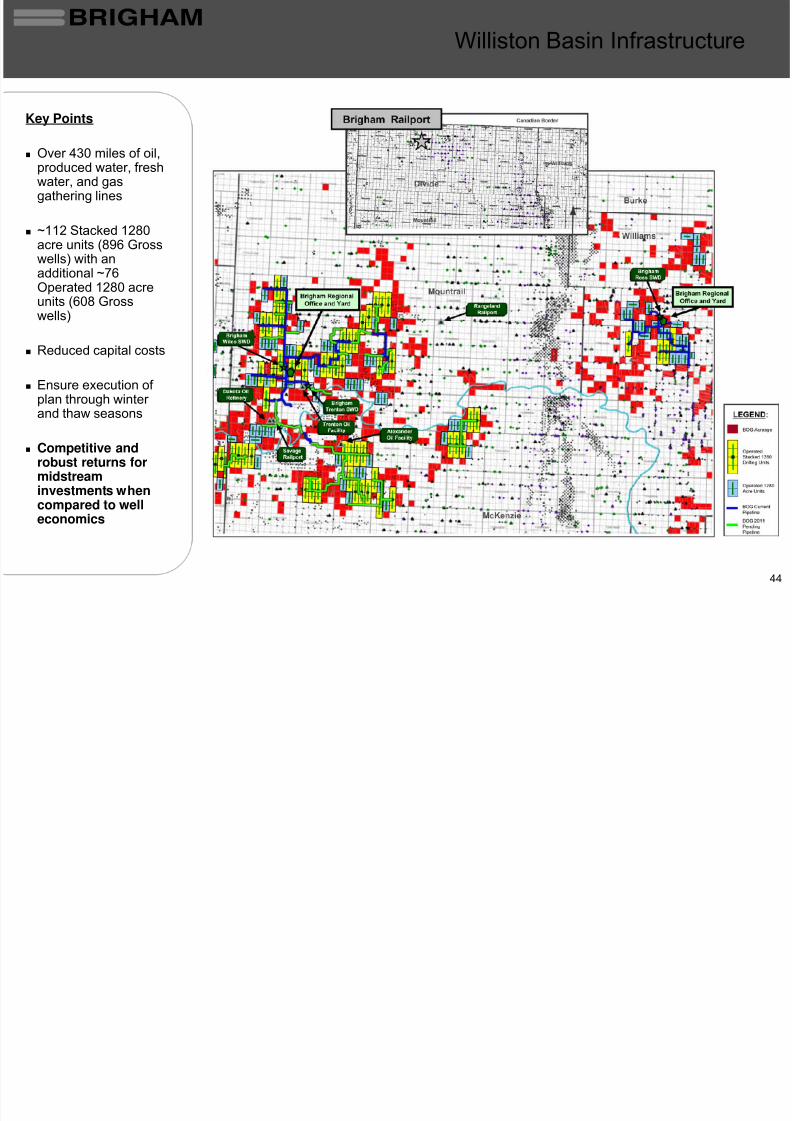
Williston Basin Infrastructure
Key Points
Over 430 miles of oil,produced water, freshwater, and gasgathering lines
~112 Stacked 1280acre units (896 Grosswells) with anadditional ~76Operated 1280 acreunits (608 Gross
wells)
Reduced capital costs
Ensure execution of plan through winter
and thaw seasons
Competitive androbust returns formidstreaminvestments whencompared to well
economics
BRIGHAM Brigham Bakken & Three Forks Oil Differentials

8/2/2019 Bakken Exit Capacity
http://slidepdf.com/reader/full/bakken-exit-capacity 45/53
45
( $
/ b b l )
2008 2009 2010 2011
Differentials Stabilized in 2009-2010, Improved After Q1 2011
Brigham Bakken & Three Forks Oil Differentials
~$5/Bo
Improvement
8/2/2019 Bakken Exit Capacity
http://slidepdf.com/reader/full/bakken-exit-capacity 46/53
BRIGHAM 2011 Capital Budget - $836 million

8/2/2019 Bakken Exit Capacity
http://slidepdf.com/reader/full/bakken-exit-capacity 47/53
47
•
Further drilling acceleration by bringing forward rigs 9 through 12
•
8.2 incremental net Williston Basin wells and acreage acquisitions account for majority of incremental cap-ex
Oil & Gas Capital Expenditures Updated Change fromAnnounced Budget Announced
Budget Forecast Budget
Drilling $582.1 $669.2 $87.1
Support Infrastructure 83.2 87.1 3.9
Land 27.4 79.2 51.8
Total Oil & Gas Cap-ex $692.7 $835.5 $142.8
% Increase from Announced Budget 21%
Net Wells Drilled Updated Change from
Announced Budget Announced
Budget Forecast Budget
Williston Basin 65.7 73.9 8.2
Other 2.4 2.4 -
Total Net Wells 68.1 76.3 8.2
Incremental Capital on Additional Drilling / Acreage Acquisitions
2011 Capital Budget
$836 million
BRIGHAM Liquidity Position at June 30, 2011
8/2/2019 Bakken Exit Capacity
http://slidepdf.com/reader/full/bakken-exit-capacity 48/53
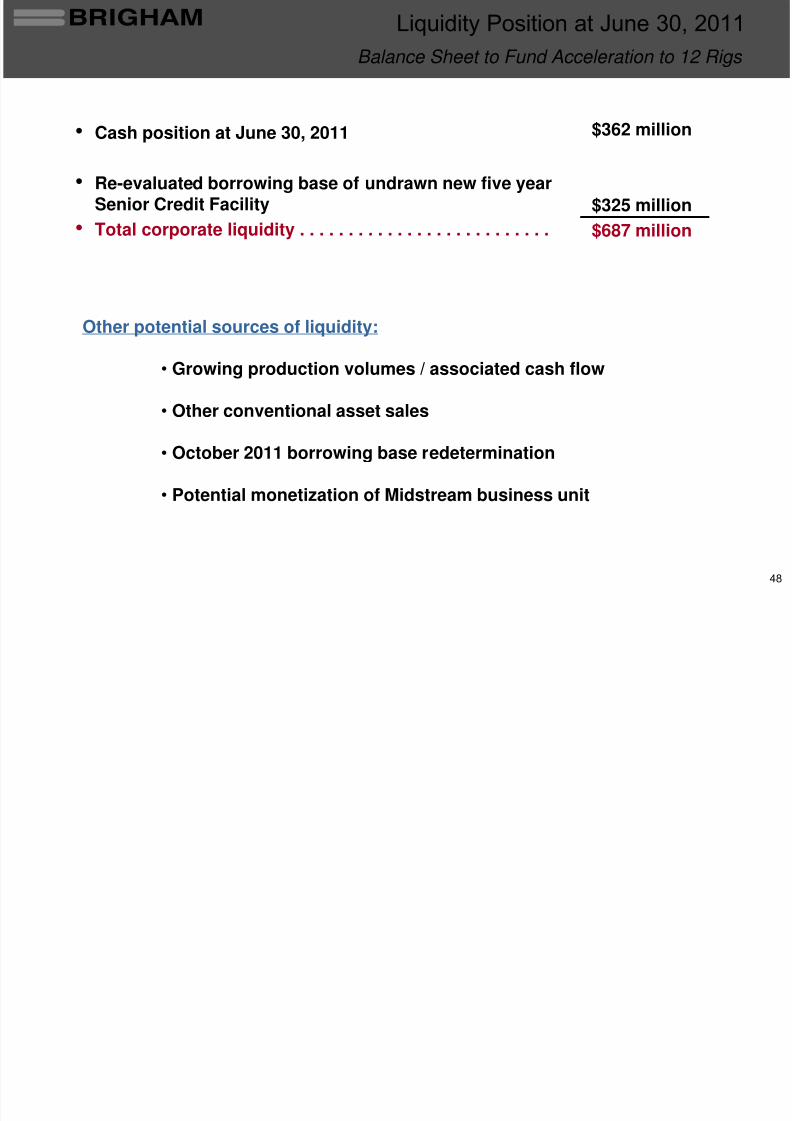
48
•
Cash position at June 30, 2011
•
Re-evaluated borrowing base of undrawn new five year
Senior Credit Facility•
Total corporate liquidity . . . . . . . . . . . . . . . . . . . . . . . . . .
$362 million
$325 million$687 million
Other potential sources of liquidity:
• Growing production volumes / associated cash flow
• Other conventional asset sales
• October 2011 borrowing base redetermination
• Potential monetization of Midstream business unit
Balance Sheet to Fund Acceleration to 12 Rigs
q y ,
BRIGHAM
Oil H d O t t di 2011 2013*
8/2/2019 Bakken Exit Capacity
http://slidepdf.com/reader/full/bakken-exit-capacity 49/53
49*As of 9/29/2011
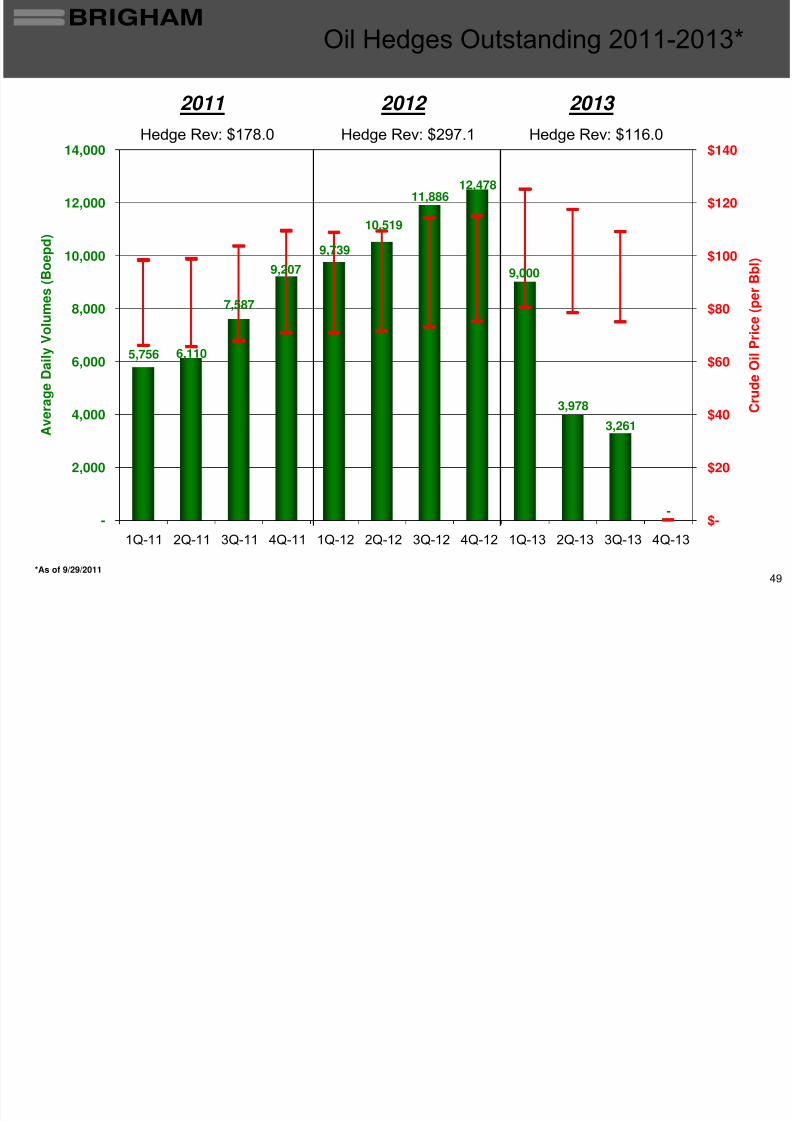
Oil Hedges Outstanding 2011-2013*
2011 2012 2013 Hedge Rev: $178.0 Hedge Rev: $297.1 Hedge Rev: $116.0
9,207
5,756
9,739
12,47811,886
7,587
6,110
10,519
9,000
3,978
3,261
-
-
2,000
4,000
6,000
8,000
10,000
12,000
14,000
1Q-11 2Q-11 3Q-11 4Q-11 1Q-12 2Q-12 3Q-12 4Q-12 1Q-13 2Q-13 3Q-13 4Q-13
A v e r a g e D a i l y V o l u m e s ( B o e p d )
$-
$20
$40
$60
$80
$100
$120
$140
C r u d e O i l P r i c e
( p e r B b l )
BRIGHAMKey Takeaways
8/2/2019 Bakken Exit Capacity
http://slidepdf.com/reader/full/bakken-exit-capacity 50/53
50
•
“Manufacturing oil” – Commanding / growing presence in premier domestic oil resource play, with
multiple pay zones and infill drilling providing significant optionality
•
Advanced drilling and completion designs driving industry leading production, EURs and returns
•
11 to 18 year remaining inventory on de-risked core acreage
•
Significant incremental NAV growth catalysts to be assessed over the next 12 months
• Continuing to add to core acreage position
•
Accelerating to 12 rigs by March 2012, bringing forward significant NAV growth in 2011 and 2012
•
Current liquidity position able to fund level of acceleration beyond 12 rig program
Outstanding drilling results, significant and growing inventory of development drilling locations, favorableoperating environment and current liquidity position create an opportunity to accelerate drilling activityand bring forward incremental net asset value per share.
Key Takeaways
BRIGHAM

8/2/2019 Bakken Exit Capacity
http://slidepdf.com/reader/full/bakken-exit-capacity 51/53
51
BRIGHAM Williston Basin Oil Production
8/2/2019 Bakken Exit Capacity
http://slidepdf.com/reader/full/bakken-exit-capacity 52/53
52
0
100,000
200,000
300,000
400,000
500,000
600,000
700,000
800,000
900,000
1,000,000
1,100,000
1,200,000
1,300,000
1,400,000
2 0 0 0
2 0 0 1
2 0 0 2
2 0 0 3
2 0 0 4
2 0 0 5
2 0 0 6
2 0 0 7
2 0 0 8
2 0 0 9
2 0 1 0
2 0 1 1
2 0 1 2
2 0 1 3
2 0 1 4
2 0 1 5
2 0 1 6
2 0 1 7
2 0 1 8
2 0 1 9
2 0 2 0
2 0 2 1
2 0 2 2
2 0 2 3
2 0 2 4
2 0 2 5
B o / d
a y
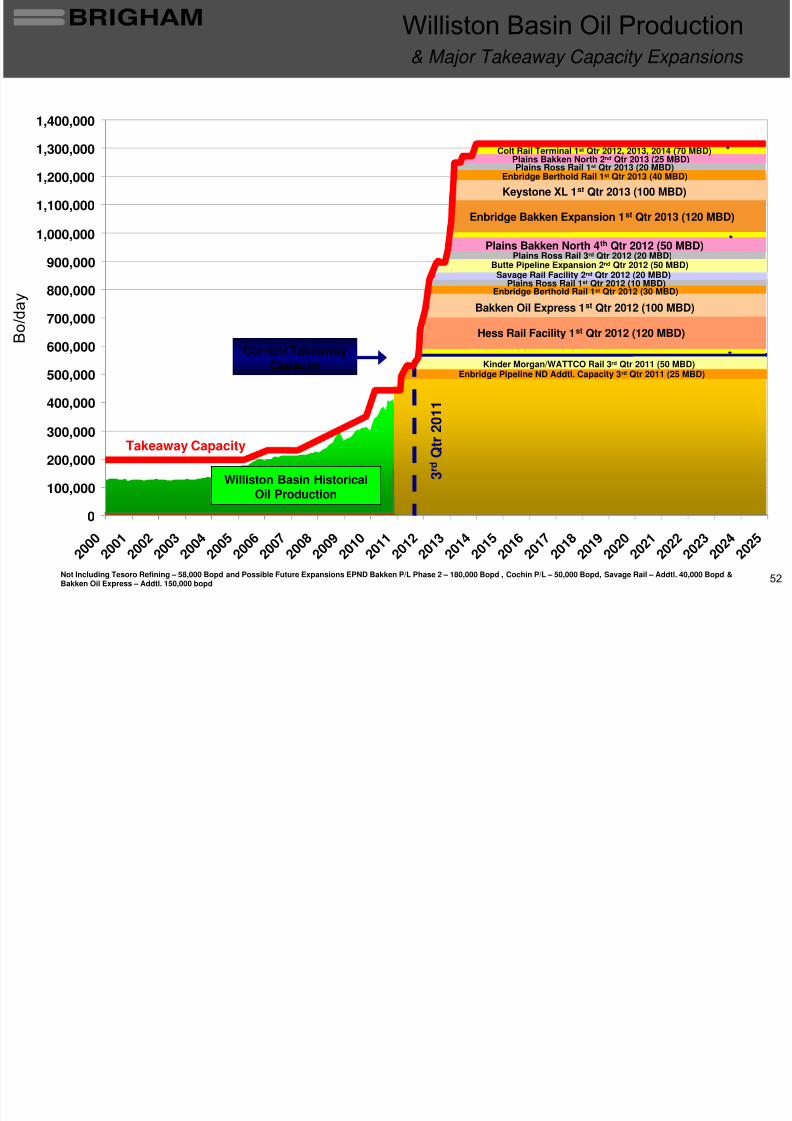
Takeaway Capacity
Not Including Tesoro Refining – 58,000 Bopd and Possible Future Expansions EPND Bakken P/L Phase 2 – 180,000 Bopd , Cochin P/L – 50,000 Bopd, Savage Rail – Addtl. 40,000 Bopd &Bakken Oil Express – Addtl. 150,000 bopd
Williston Basin HistoricalOil Production
Current TakeawayCapacity
3 r d
Q t r 2 0
1 1
Enbridge Pipeline ND Addtl. Capacity 3rd Qtr 2011 (25 MBD)
Hess Rail Facility 1st Qtr 2012 (120 MBD)
Keystone XL 1st Qtr 2013 (100 MBD)
Butte Pipeline Expansion 2nd Qtr 2012 (50 MBD)
Kinder Morgan/WATTCO Rail 3rd Qtr 2011 (50 MBD)
Plains Bakken North 4th Qtr 2012 (50 MBD)
Plains Bakken North 2nd Qtr 2013 (25 MBD)
Enbridge Bakken Expansion 1st Qtr 2013 (120 MBD)
*
*
Savage Rail Facility 2nd Qtr 2012 (20 MBD)
& Major Takeaway Capacity Expansions
Bakken Oil Express 1st Qtr 2012 (100 MBD)
Enbridge Berthold Rail 1st Qtr 2012 (30 MBD)Plains Ross Rail 1st Qtr 2012 (10 MBD)
Plains Ross Rail 3rd Qtr 2012 (20 MBD)
Enbridge Berthold Rail 1st Qtr 2013 (40 MBD)Plains Ross Rail 1st Qtr 2013 (20 MBD)
Colt Rail Terminal 1st Qtr 2012, 2013, 2014 (70 MBD) *
BRIGHAM Williston Basin
8/2/2019 Bakken Exit Capacity
http://slidepdf.com/reader/full/bakken-exit-capacity 53/53
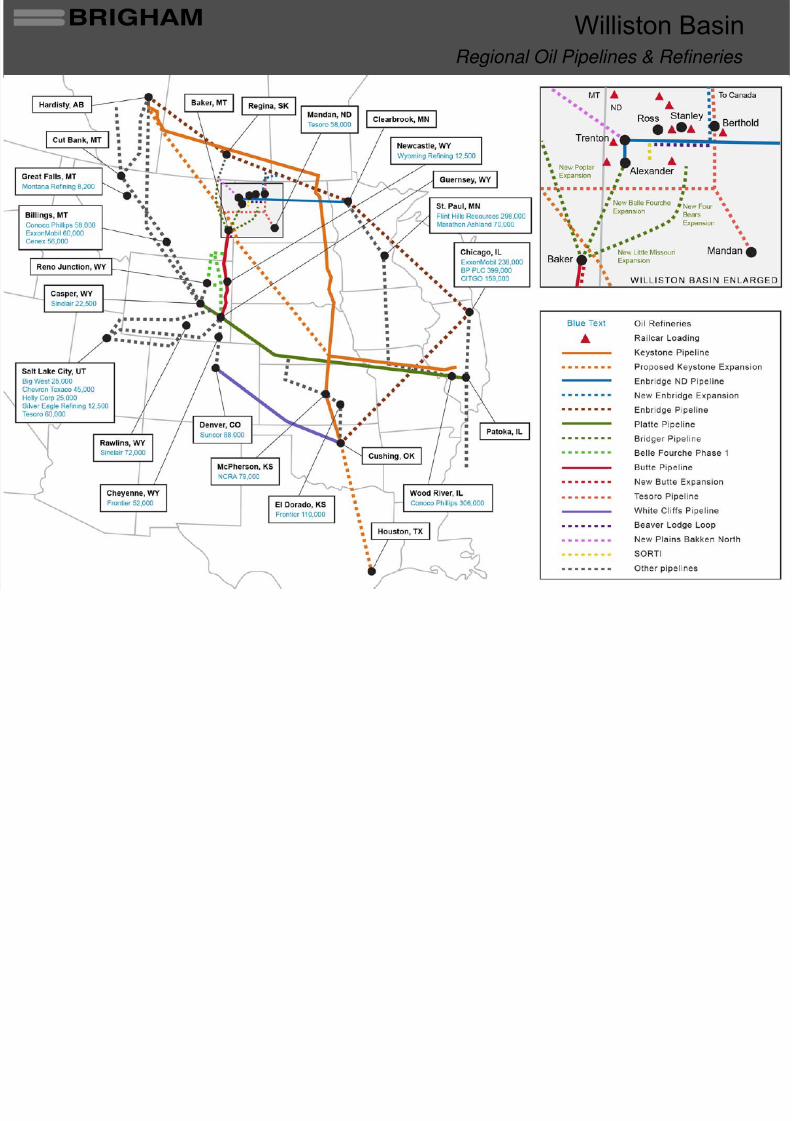
Regional Oil Pipelines & Refineries

![[Entry/Exit] Standard Capacity Contract for [Monthly ...Entry/Exit] Standard . Capacity Contract . for [Monthly/Quarterly/Yearly] Capacity Products . Published on 29.12.2016 ([Code](https://img.pdfslide.us/doc/110x75/5b2a3ff27f8b9a44468b45c9/entryexit-standard-capacity-contract-for-monthly-entryexit-standard-.jpg)