Embed Size (px)
Citation preview
Accepted Manuscript
Title: Nanofiltration of glucose: analysis of parameters andmembrane characterization
Author: Jorge Emilio Almazan Estela Marıa Romero-DondizVeronica Beatriz Rajal ElzaFani Castro-Vidaurre
PII: S0263-8762(14)00406-7DOI: http://dx.doi.org/doi:10.1016/j.cherd.2014.09.005Reference: CHERD 1693
To appear in:
Received date: 10-6-2014Revised date: 1-9-2014Accepted date: 4-9-2014
Please cite this article as: Almazan, J.E., Romero-Dondiz, E.M., Rajal, V.B.,Castro-Vidaurre, E.F.,Nanofiltration of glucose: analysis of parameters andmembrane characterization, Chemical Engineering Research and Design (2014),http://dx.doi.org/10.1016/j.cherd.2014.09.005
This is a PDF file of an unedited manuscript that has been accepted for publication.As a service to our customers we are providing this early version of the manuscript.The manuscript will undergo copyediting, typesetting, and review of the resulting proofbefore it is published in its final form. Please note that during the production processerrors may be discovered which could affect the content, and all legal disclaimers thatapply to the journal pertain.
CORE Metadata, citation and similar papers at core.ac.uk
Provided by CONICET Digital
Page 1 of 26
Accep
ted
Man
uscr
ipt
1
Nanofiltration of glucose: analysis of parameters and membrane characterization
Jorge Emilio Almazána,*, Estela María Romero-Dondiza, Verónica Beatriz Rajala, ElzaFani
Castro-Vidaurrea
Instituto de Investigaciones para la Industria Química (INIQUI - CONICET), Facultad de
Ingeniería, Universidad Nacional de Salta, Av. Bolivia 5150, A4408FVY Salta Capital, Argentina.
*Correspondingauthor: Jorge Emilio Almazán. Instituto de Investigaciones para la Industria
Química (INIQUI - CONICET), Facultad de Ingeniería, Universidad Nacional de Salta, Av.
Bolivia 5150, A4408FVY. Salta Capital, Argentina. Tel.: +54 387 4255361; fax: +54 387
4251006.E-mail address: [email protected]
Abstract
Membrane characterization and modeling of nanofiltration processes of uncharged solutes are
of special interest for the food industry. In this work two commercial membranes, DK and DL,
were used to concentrate glucose solutions. Membranes were characterized according
hydrophobicity, thickness, porosity, and hydraulic permeability. The influence of pressure and
concentration of glucose on the permeate flux and rejection were studied. Both membranes
presented a great potential for the food industry due to their high rejection of glucose. The
osmotic pressure model was combined with film theory and the real driven force was calculated
taking into account the osmotic pressure and the concentration polarization. Both phenomena
influenced the process (concentration polarization only in the most dilute solutions at low
pressure) and the permeability for glucose solutions was similar to the hydraulic permeability. A
mathematical model based on the Donnan- Steric Pore Model was used to determine the pore
radius and the effective thickness of both membranes. As the concentration inside the pore
(needed for the calculations) is difficult to measure experimentally, various alternatives were
proposed. The average of the concentration at the interface and permeate best fitted the
experimental data. The model was applied successfully; the maximum error was 8% within the
range of concentrations (5 – 100 g/L) for the DL membrane and 5% for the DK membrane up to
50 g/L.
Page 2 of 26
Accep
ted
Man
uscr
ipt
2
Highlights
Two membranes were characterized and used to concentrate glucose solutions
Both membranes presented a great potential due to their high rejection of glucose
The osmotic pressure and concentration polarization effects were taken into account
Membrane pore radius and effective thickness were determined
The model fitted successfully the experimental data with maximum errors of 8%
Keywords
Nanofiltration; Glucose; Osmotic Pressure Model; Concentration Polarization; DSPM
1. Introduction
In the last years, significant progress has been made in the preparation and study of new
polymeric and inorganic nanofiltration (NF) membranes. Many academic and industrial research
projects in this area are also in progress (Drioli and Fontananova, 2004; Drioli et al., 2011;
Strathmann, 1999). NF membranes have properties in between those of ultrafiltration and
reverse osmosis membranes and exceptional stability at very low or high pH, very high
temperatures or organic solvent media (Yacubowicz and Yacubowicz, 2005). The separation
mechanism of these membranes involves steric and electrical (Donnan) effects. Because of this
combination they are effective for the separation of small organic solutes and salts from a
mixture. NF is currently used in water treatment, chemical and food processing industries, to
concentrate, fractionate or purify aqueous solutions of organic solutes (Molecular Weight (MW):
100-500 g/mol), textile dyes, heavy metals, and mixtures of monovalent/multivalent solutions
(Gao et al., 2014; Hinkova et al., 2002; Jiao et al., 2004; Luo and Wan, 2013; Ong et al., 2014;
Zhu et al., 2014).
Different phenomena appear when sugar solutions, in contrast to pure water, are filtered. The
concentration polarization and the raise of osmotic pressure are the causes for the flux
declination observed in many applications due to increasing resistance to permeation and
fouling susceptibility. To study these phenomena, the osmotic pressure model, combined with
film theory, is generally used. It states that the permeate flux reduction is because the effective
transmembrane pressure decreases. Furthermore, itis possible to define a real driving force
Page 3 of 26
Accep
ted
Man
uscr
ipt
3
which takes into account those phenomena (Cheng et al., 1998). The phenomenon of
concentration polarization was also extensively studied and different correlations were
developed (Bader and Veenstra, 1996; Gekas and Hallström, 1987; Geraldes and Afonso, 2007;
van der Horst et al., 1995), involving different empirical expressions to predict the concentration
polarization in membrane processes for different solutions, using experimental data. Using this
method,Geraldes and Afonso (2006) predicted the concentration polarization for several
geometries with 2D velocity fields and concentration distributions both in laminar and turbulent
regimes. This correlation was applied in different works, where different NF membranes were
studied and glucose, sucrose, and Na2SO4 solutions were used (Cavaco Morão et al., 2008;
Rodrigues et al., 2010).
Since many monosaccharides are important ingredients in food and pharmaceutical industries
and pure fractions of a specific monosaccharide are sometimes required, their purification and
separation are under intense study. Among monosaccharides, glucose, the most frequently
used sugar, is commercially available as dextrose, which is employed as an additive sweetener
in popular beverages and processed foods. It is also a key ingredient in many commercial and
medical products. Monosaccharide separations were traditionally performed by chromatographic
methods and vacuum distillation (Feng et al., 2009; Sjöman et al., 2007). Currently, NF is a
promising method since it requires lower energy consumption and maintenance costs in
comparison with other alternatives (Feng et al., 2009).
For the successful implementation of a NF process it is necessary to obtain information about
the separation efficiency and the capacity of the membrane. This is traditionally done by trial and
error, although this approach is time consuming and expensive. Several models have been or
are being developed for this purpose (Bowen et al., 1997; Bowen and Mukhtar, 1996; Garba et
al., 1999; Hagmeyer and Gimbel, 1998; Straatsma et al., 2002; van der Horst et al., 1995). The
Donnan- Steric Pore Model (DSPM) proposed by Bowen and Mohammad (1998) successfully
predicted NF performance and is currently one of the most used models (Bowen and Welfoot,
2002; Santafé-Moros et al., 2008). However, one of the main disadvantages of the DSPM model
is that physicochemical properties must be calculated. Thus, it is necessary to make different
assumptions and analyze which are the most appropriate.
In this work we performed the nanofiltration of glucose solutions as the simplest model for juice.
The aims were i) to evaluate the filtration process, ii) to analyze the osmotic pressure and
concentration polarization phenomena using the pressure osmotic model and an empirical
Page 4 of 26
Accep
ted
Man
uscr
ipt
4
correlation for concentration polarization, iii) to calculate the parameters involved in the DSPM
model, and iv) to characterize the membranes using the proposed model.
2. Materials and Methods
2.1 Membrane characterization
Two commercial NF membranes, GE Desal_DK (DK) and GE Desal_DL (DL), with different
Molecular Weight Cut-Off (MWCO) values, were used (Table 1). These membranes are thin-film
membrane of hydrophilic character. The water used in the NF set-up and for the preparation of
the solutions was distilled with an electrical conductivity less than 0.4 µS/cm. Glucose was of
pro-analysis grade and delivered from Sigma-Aldrich.
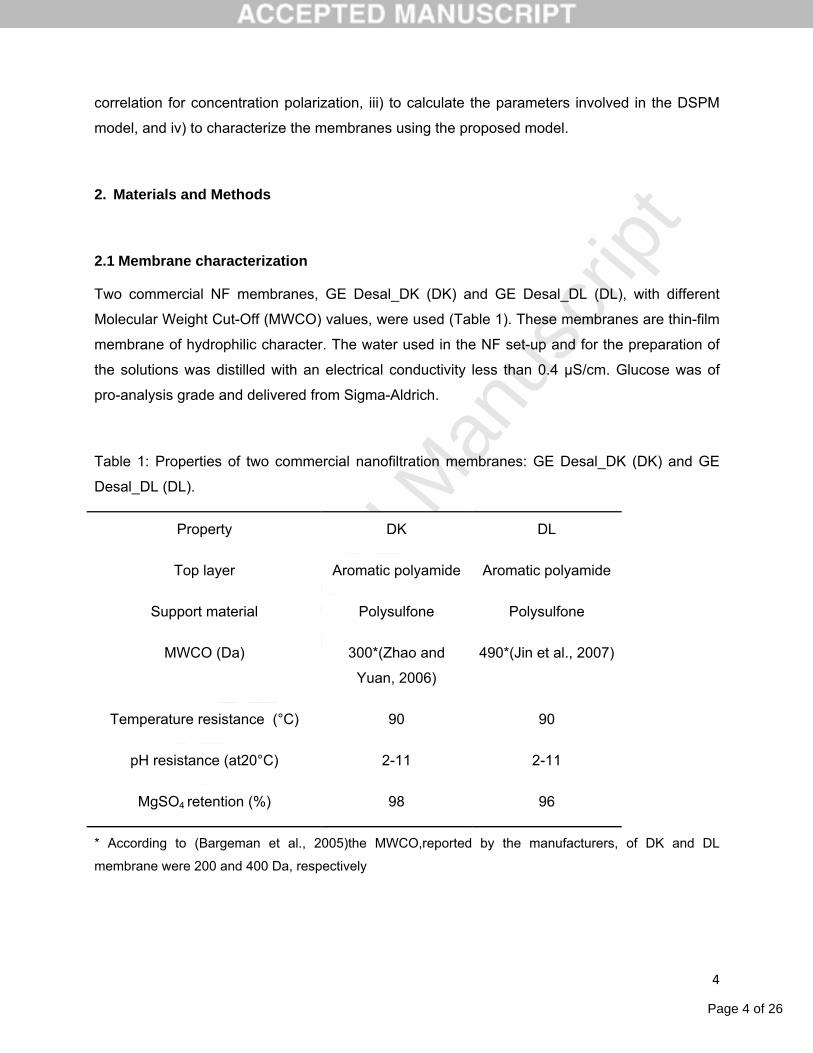
Table 1: Properties of two commercial nanofiltration membranes: GE Desal_DK (DK) and GE
Desal_DL (DL).
Property DK DL
Top layer Aromatic polyamide Aromatic polyamide
Support material Polysulfone Polysulfone
MWCO (Da) 300*(Zhao and
Yuan, 2006)
490*(Jin et al., 2007)
Temperature resistance (°C) 90 90
pH resistance (at20°C) 2-11 2-11
MgSO4 retention (%) 98 96
* According to (Bargeman et al., 2005)the MWCO,reported by the manufacturers, of DK and DL
membrane were 200 and 400 Da, respectively
Page 5 of 26
Accep
ted
Man
uscr
ipt
5
Characterization of membranes included determination of the water contact angle, porosity and
thickness. The water contact angle was measured at room temperature using a Standard
Goniometer with DRO Pimage Standard (model 200-00, Ramé-Hart Instrument Co.). The
porosity plays an important role with regard to permeation and separation (Chen et al., 2004)
and was determined according to Chakrabarty et al. (2008). The membrane thickness was
measured using and electronic micrometer screw Flower. The cross-sectional morphology of
membranes was examined using Scanning Electron Microscopy (SEM) with a JEOL equipment
(model JSM-6480 LV). The samples were fractured in liquid nitrogen and sputter-coated with
gold.
2.2 Nanofiltration set-up and membrane permeability
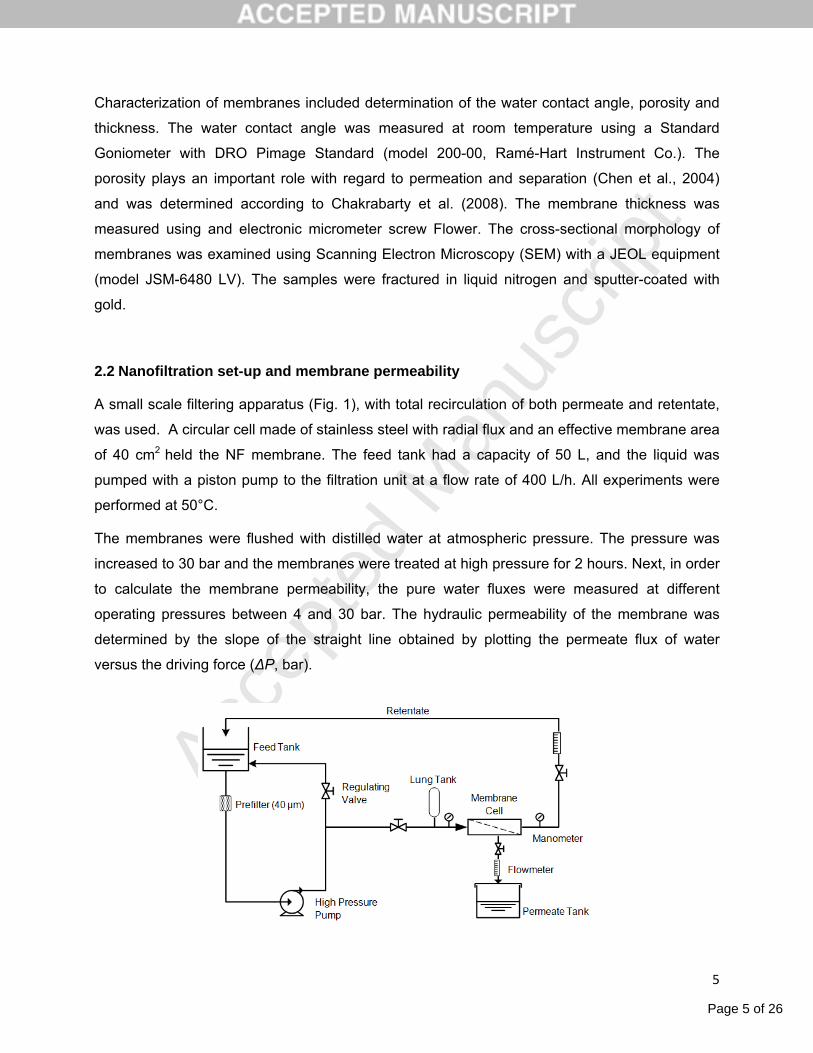
A small scale filtering apparatus (Fig. 1), with total recirculation of both permeate and retentate,
was used. A circular cell made of stainless steel with radial flux and an effective membrane area
of 40 cm2 held the NF membrane. The feed tank had a capacity of 50 L, and the liquid was
pumped with a piston pump to the filtration unit at a flow rate of 400 L/h. All experiments were
performed at 50°C.
The membranes were flushed with distilled water at atmospheric pressure. The pressure was
increased to 30 bar and the membranes were treated at high pressure for 2 hours. Next, in order
to calculate the membrane permeability, the pure water fluxes were measured at different
operating pressures between 4 and 30 bar. The hydraulic permeability of the membrane was
determined by the slope of the straight line obtained by plotting the permeate flux of water
versus the driving force (ΔP, bar).
Page 6 of 26
Accep
ted
Man
uscr
ipt
6
Fig. 1: Schematic diagram of the experimental set-up for nanofiltration.
2.3 Filtration of Glucose solutions
Different concentrations of glucose solutions were filtered: 5, 10, 50, and 100 g/L. The
corresponding viscosities were: 1.012, 1.024, 1.136, and 1.308 cp, respectively. The solution pH
was adjusted to 6.00 with the addition of a few milliliters of concentrated nitric acid (65% w/w).
Filtration was performed at 4, 8, 12, 24, and 28 bar and 50°C,a temperature chosen to obtain
low viscosities in the feed solutions that was considered reasonably safe according to
membrane and glucose stabilities (Sjöman et al., 2007). Concentration and pH of glucose
solutions were measured with a Maselli refractometer, model LR-01, and with a pHmeter
Altronix, model TPX1. After each filtration, the membrane module was cleaned in two steps. The
first one was performed recirculating distilled water for 30 min through the membrane module at
a water flow rate of 600 L/h and a pressure of 10 bar, in order to remove the reversible polarized
layer. In the second step, the membrane module was cleaned using the following solutions: an
acetic acid solution (pH= 4.0, used an acidic cleaning agent) and a NaOH solution (pH= 9.0,
used as basic cleaning agent). Cleaning solutions were recirculated in the NF system for 45 min
at 50°C at a flow rate of 600 L/h and a pressure of 10 bar. At the end of each cleaning procedure
the membrane module was rinsed with distilled water for 20 min, at room temperature and
pressure .It is important to remark that for the second cleaning step the basic agent followed the
acidic one as this procedure gave the best results, in agreement with what was reported by
some researchers (He et al., 2007; Sjöman et al., 2007) but in opposition to what was found by
others (Cassano et al., 2007; Pap et al., 2009).
2.4 Permeate flux andseparation evaluation
According to Darcy’s law, permeate flux is defined by the equation:
(1)
where Jv (dm3/m2h)is the permeate flux, Lp (dm3/m2h bar) is the pure water permeability and
(bar) is the nominal driven force; the transmembrane pressure is called “nominal" (n) and
not "real" driven force because different factors appeared when the glucose solutions were
filtered such as osmotic pressure and concentration polarization. These factors were not present
in tests with water and they reduced the driving force of the process.
Page 7 of 26
Accep
ted
Man
uscr
ipt
7
The performance of the separation was evaluated by the observed rejection coefficient (Robs)
which was calculated for the different glucose solutions as:
(2)
where cp (g/L) is the concentration of glucose in the permeate and cb (g/L) the concentration of
glucose in the feed.
2.5 Osmotic pressure and concentration polarization
According to the pressure model (Cheng et al., 1998; Nabetani et al., 1992), a new driven force
is defined to evaluate the influence of the osmotic pressure and concentration polarization in the
nanofiltration performance:
(3)
where (bar) is the real driven force, (dimensionless) is the reflection coefficient, and
(bar) is the osmotic pressure difference between the membrane interface and the
permeate side and was calculated using empirical equations (Nabetani et al., 1992; Perry and
Green, 1997).
To calculate it was necessary obtain first the interfacial concentration, ci(g/L). For this
purpose, the mass transfer coefficient k0 (m/s) was obtained. For the radial flux geometrical
configuration used in the trials, k0was calculated according to the equation (Mazzoni and
Bandini, 2006):
with (4)
where Sh, Re, and Sc are the Sherwood, Reynolds, and Schmidt numbers, respectively, all of
them dimensionless; Rc(m) is the cell radius, b(m) is the semicell thickness, and Ds(m2/s) is the
glucose diffusivity.
The coefficient k0 was corrected taking into account the effect of wall viscosity on mass transfer
(Aimar and Field, 1992) and a new mass transfer coefficient kL (m/s) was calculated using the
expression:
(5)
Page 8 of 26
Accep
ted
Man
uscr
ipt
8
where (poise) and (poise) are the viscosities of glucose solutions in the feed and in the
interface, respectively. Viscosities were calculated using empirical equations (Perry and Green,
1997).
Finally, the ci was calculated to analyze the influence of the concentration polarization in
nanofiltration of glucose using the model film theory:
(6)
Equation (6) was solved by an iteration method minimizing the difference between the ci
calculated and proposed. Once the ci was obtained the experimental glucose real rejection
coefficient (Rreal,exp) was calculated as:
(7)
As mentioned before, the rejection and were called “real” because they take into account the
effects of osmotic pressure and concentration polarization during glucose nanofiltration.
Furthermore, the average concentration polarization was calculated according to Cavaco Morão
et al. (2008) and Rodrigues et al. (2010):
(8)
where (dimensionless) is the ratio between the permeate flux (Jv) and the material transfer
coefficient (kL) and Ξ (dimensionless) is a correction factor of the mass transfer that takes into
account the effect of permeate flux on the mass transfer coefficient. This factor is independent of
the module geometry and is given by the correlation:
(9)
which is valid for <20.
2.6 Donnan steric pore model and dielectric exclusion model (DSPDEM) application and characterization of membranes
Page 9 of 26
Accep
ted
Man
uscr
ipt
9
The experimental data and the results of the different calculations were used to verify if the
model was applicable to nanofiltration of glucose. The equations used were selected for
uncharged solutes and considering slit-like pores (Bandini and Bruni, 2010):
(10)
where (%) is the calculated real rejection of glucose, Pe (dimensionless) is the Peclet
number, (dimensionless) is the equilibrium partition coefficient and Ki,c (dimensionless)is the
hindrance factor for convection.
The equilibrium partition coefficient is a function of the Stoke’s radius of glucose (rs, m) and of
the pore radius (rp, m), and it is calculated as:
(11)
The Peclet number (Pe) is defined as:
(12)
where (m) is the effective thickness of the membrane and (m2/s) is the diffusivity inside the
pore, defined as (Nabetani et al., 1992):
(13)
Where Ki,d (dimensionless) is the hindrance factor for diffusion, (m2/s) is the bulk diffusivity of
glucose solution, (poise) is the water viscosity, and (poise) is the viscosity of the
solution inside the pore, which is a function of the concentration inside the pore (Cinside,, g/L).
Because of the difficulties to measure the latter, we evaluated different alternatives of viscosity in
this work to choose the most appropriate. Thus, different viscosities were calculated using
empirical expressions (Perry and Green, 1997) for the following concentrations: average
concentration between the interface and the permeate, permeate concentration, retentate
concentration (Cret), and interface concentration. The viscosities obtained were then introduced
to the model equations.
The hindered nature of diffusion and convection of glucose inside the membrane were
accounted for by the coefficients and , which were calculated as:
Page 10 of 26
Accep
ted
Man
uscr
ipt
10
(14)
(15)
Where (dimensionless) is:
(16)
In order to characterize the membranes the model was applied performing an iterative
calculation varying the pore size and the effective thickness. With a statistical analysis, the
model parameters were adjusted to minimize the difference between experimental real rejection
and calculated real rejection. Then, pore size and effective thickness of the different membranes
were obtained. The application of the proposed model was evaluated by calculating the error, as
the difference between the experimental and the calculated (with the model) real rejections. We
considered that the model was properly adjusted if the error obtained was less than 20%.
3. Results and Discussion
3.1 Membrane characterization
In general very limited information about membrane characterization is given by membrane
manufacturers. With only this limited information it becomes difficult to compare different
membranes and choose one for a particular application. For this reason, a morphological and
permselective characterization (membrane permeability) was necessary for DK and DL
membranes.
Taking into account the thickness, contact angle, and porosity both membranes were similar
(Table 2). According to the small contact angles, reflecting the ability of the membrane surface to
interact with water molecules, membranes were hydrophilic, which is in agreement with the
findings of other authors (Mänttäri et al., 2006; Zhao and Yuan, 2006).
Table 2: Characteristics of DK and DL membranes. Results are the average of three
independent measurements ± standard deviation.
Page 11 of 26
Accep
ted
Man
uscr
ipt
11
DK membrane DL membrane
Thickness (µm) 156.00 ±1.24 153.00 ±2.99
Contact Angle (°) 32.08±0.28 25.07±0.20
Porosity (%) 32.99±0.97 31.31±0.78
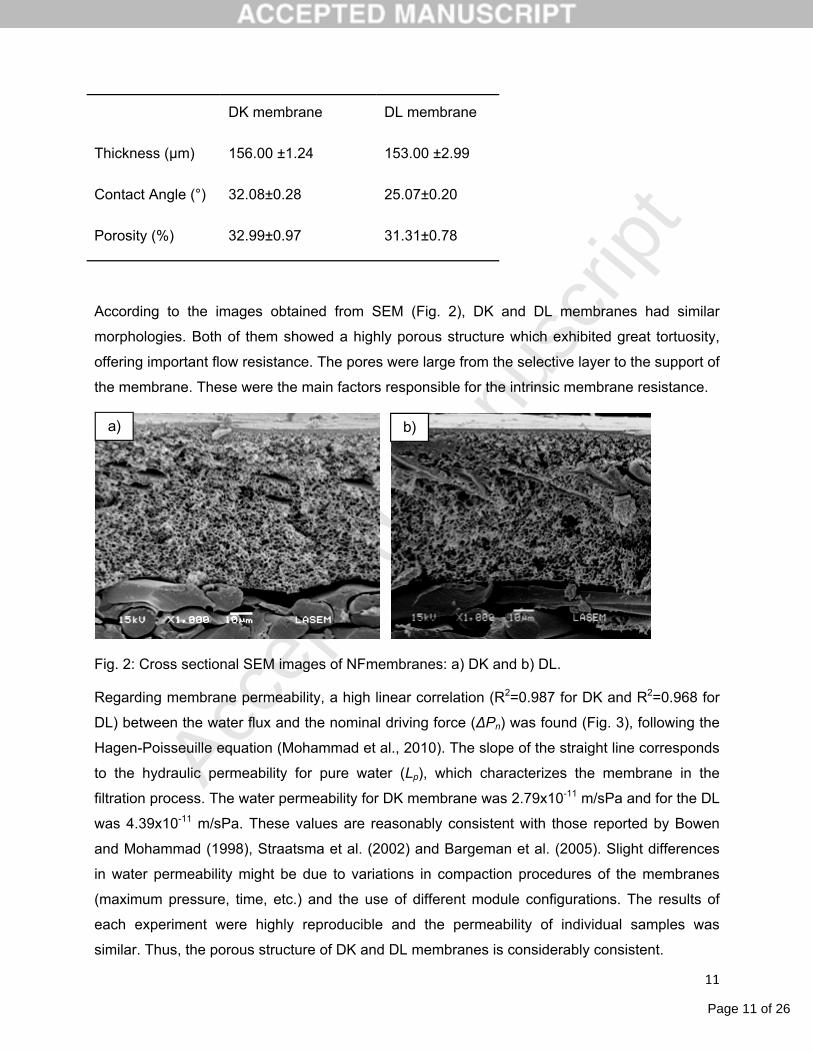
According to the images obtained from SEM (Fig. 2), DK and DL membranes had similar
morphologies. Both of them showed a highly porous structure which exhibited great tortuosity,
offering important flow resistance. The pores were large from the selective layer to the support of
the membrane. These were the main factors responsible for the intrinsic membrane resistance.
a) b)
Fig. 2: Cross sectional SEM images of NFmembranes: a) DK and b) DL.
Regarding membrane permeability, a high linear correlation (R2=0.987 for DK and R2=0.968 for
DL) between the water flux and the nominal driving force (ΔPn) was found (Fig. 3), following the
Hagen-Poisseuille equation (Mohammad et al., 2010). The slope of the straight line corresponds
to the hydraulic permeability for pure water (Lp), which characterizes the membrane in the
filtration process. The water permeability for DK membrane was 2.79x10⁻¹¹ m/sPa and for the DL
was 4.39x10⁻¹¹ m/sPa. These values are reasonably consistent with those reported by Bowen
and Mohammad (1998), Straatsma et al. (2002) and Bargeman et al. (2005). Slight differences
in water permeability might be due to variations in compaction procedures of the membranes
(maximum pressure, time, etc.) and the use of different module configurations. The results of
each experiment were highly reproducible and the permeability of individual samples was
similar. Thus, the porous structure of DK and DL membranes is considerably consistent.
Page 12 of 26
Accep
ted
Man
uscr
ipt
12
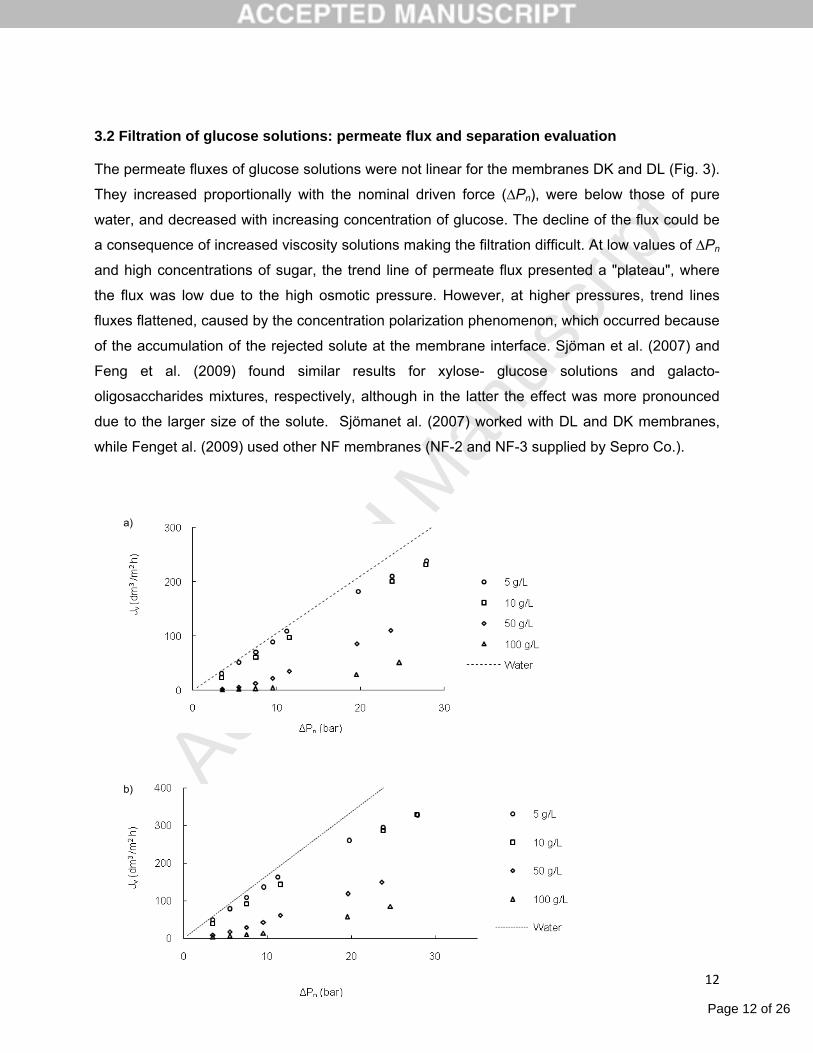
3.2 Filtration of glucose solutions: permeate flux and separation evaluation
The permeate fluxes of glucose solutions were not linear for the membranes DK and DL (Fig. 3).
They increased proportionally with the nominal driven force (∆Pn), were below those of pure
water, and decreased with increasing concentration of glucose. The decline of the flux could be
a consequence of increased viscosity solutions making the filtration difficult. At low values of ∆Pn
and high concentrations of sugar, the trend line of permeate flux presented a "plateau", where
the flux was low due to the high osmotic pressure. However, at higher pressures, trend lines
fluxes flattened, caused by the concentration polarization phenomenon, which occurred because
of the accumulation of the rejected solute at the membrane interface. Sjöman et al. (2007) and
Feng et al. (2009) found similar results for xylose- glucose solutions and galacto-
oligosaccharides mixtures, respectively, although in the latter the effect was more pronounced
due to the larger size of the solute. Sjömanet al. (2007) worked with DL and DK membranes,
while Fenget al. (2009) used other NF membranes (NF-2 and NF-3 supplied by Sepro Co.).
a)
b)
Page 13 of 26
Accep
ted
Man
uscr
ipt
13
Fig. 3: Permeate flux (Jv) for pure water and glucose solutions (5, 10, 50, and 100 g/L) using a)
DK and b) DL membranes.
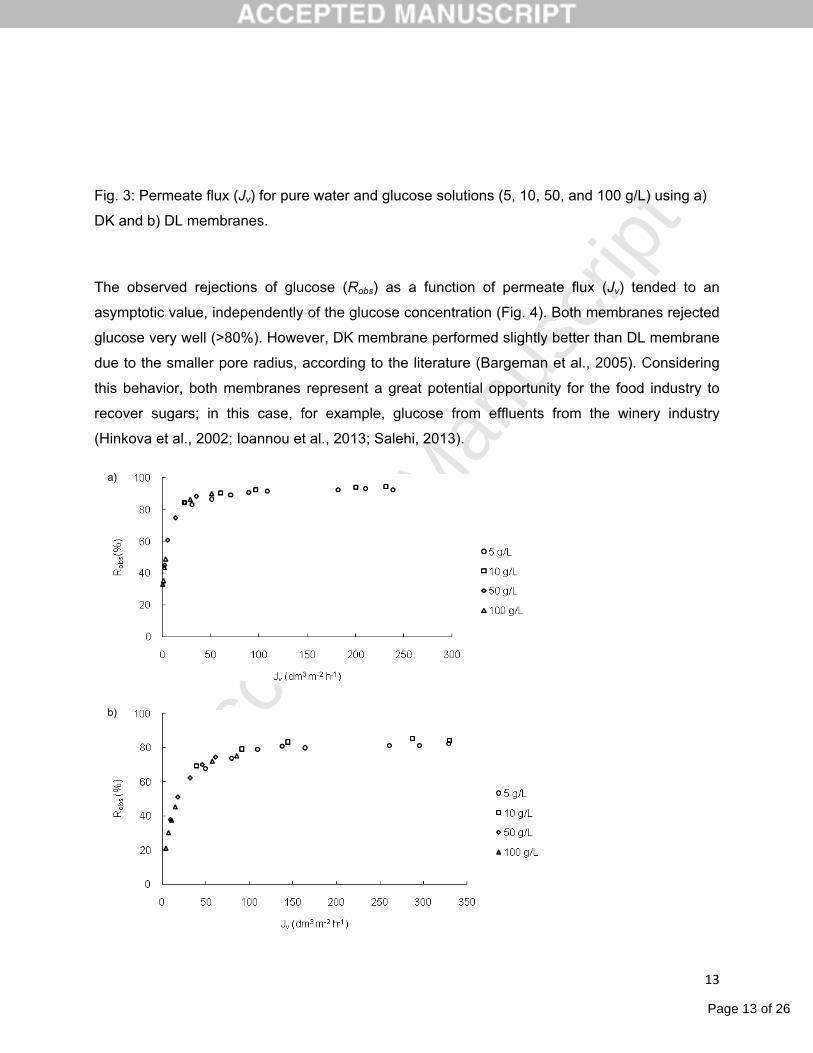
The observed rejections of glucose (Robs) as a function of permeate flux (Jv) tended to an
asymptotic value, independently of the glucose concentration (Fig. 4). Both membranes rejected
glucose very well (>80%). However, DK membrane performed slightly better than DL membrane
due to the smaller pore radius, according to the literature (Bargeman et al., 2005). Considering
this behavior, both membranes represent a great potential opportunity for the food industry to
recover sugars; in this case, for example, glucose from effluents from the winery industry
(Hinkova et al., 2002; Ioannou et al., 2013; Salehi, 2013).
a)
b)
Page 14 of 26
Accep
ted
Man
uscr
ipt
14
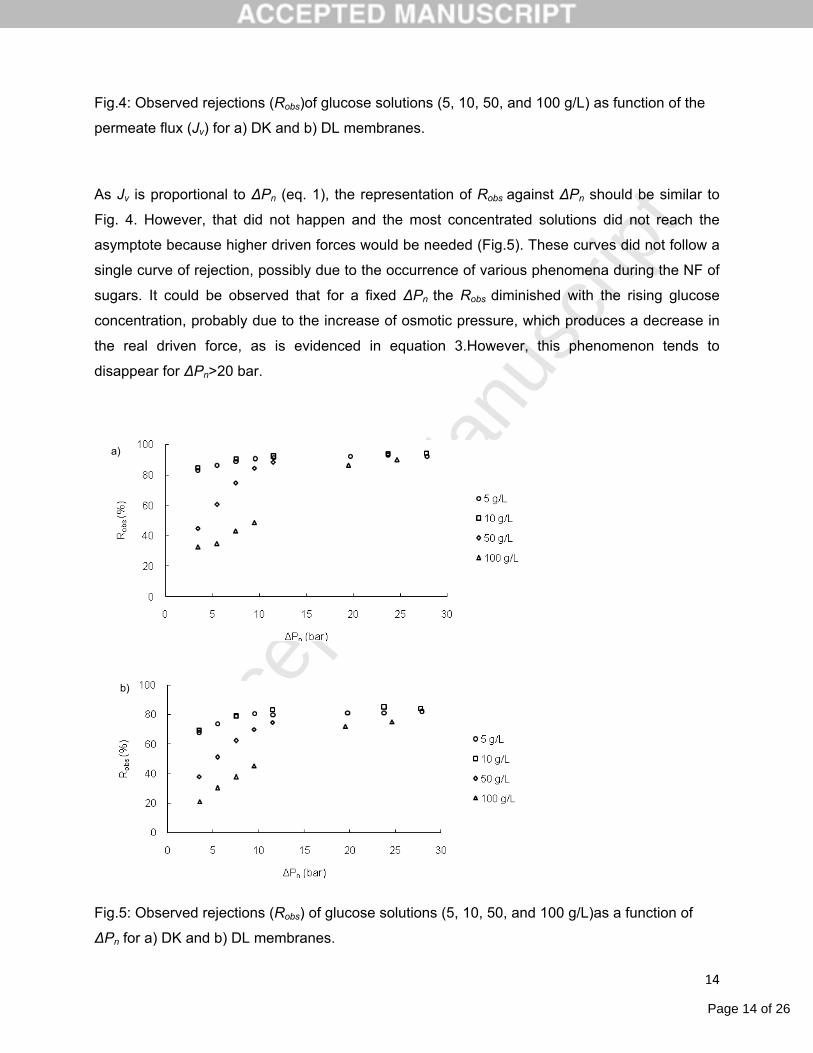
Fig.4: Observed rejections (Robs)of glucose solutions (5, 10, 50, and 100 g/L) as function of the
permeate flux (Jv) for a) DK and b) DL membranes.
As Jv is proportional to ΔPn (eq. 1), the representation of Robs against ΔPn should be similar to
Fig. 4. However, that did not happen and the most concentrated solutions did not reach the
asymptote because higher driven forces would be needed (Fig.5). These curves did not follow a
single curve of rejection, possibly due to the occurrence of various phenomena during the NF of
sugars. It could be observed that for a fixed ΔPn the Robs diminished with the rising glucose
concentration, probably due to the increase of osmotic pressure, which produces a decrease in
the real driven force, as is evidenced in equation 3.However, this phenomenon tends to
disappear for ΔPn>20 bar.
Fig.5: Observed rejections (Robs) of glucose solutions (5, 10, 50, and 100 g/L)as a function of
ΔPn for a) DK and b) DL membranes.
a)
b)
Page 15 of 26
Accep
ted
Man
uscr
ipt
15
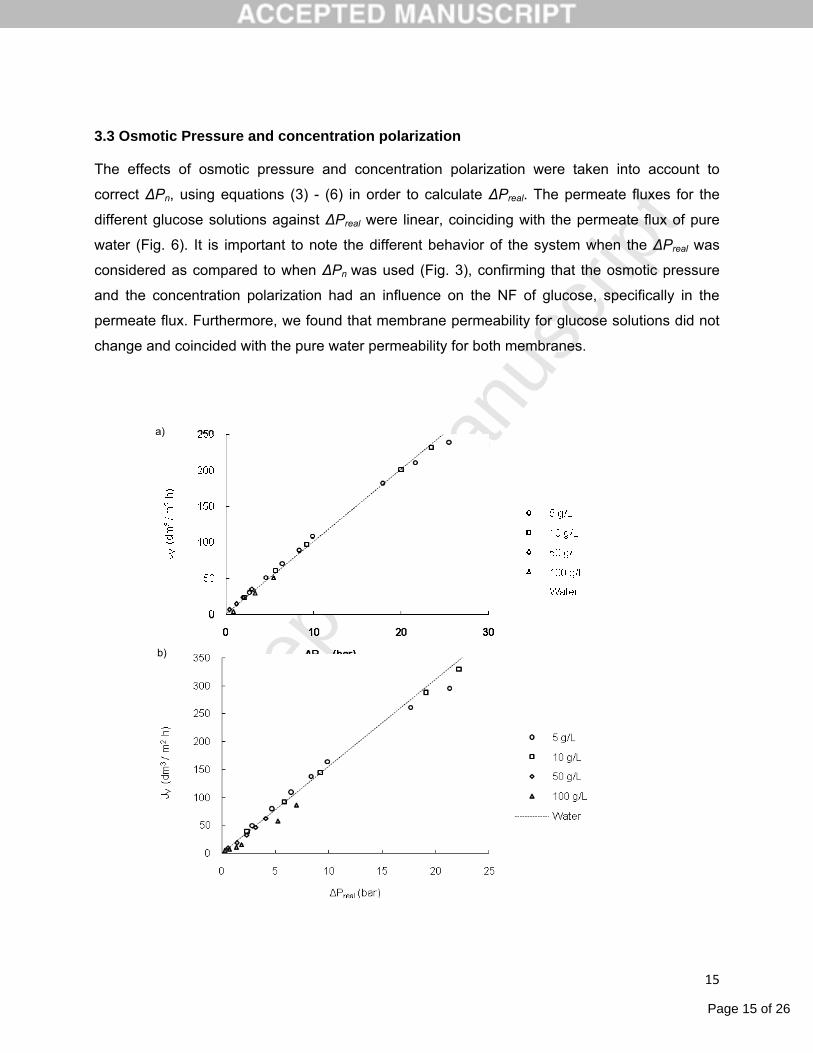
3.3 Osmotic Pressure and concentration polarization
The effects of osmotic pressure and concentration polarization were taken into account to
correct ΔPn, using equations (3) - (6) in order to calculate ΔPreal. The permeate fluxes for the
different glucose solutions against ΔPreal were linear, coinciding with the permeate flux of pure
water (Fig. 6). It is important to note the different behavior of the system when the ΔPreal was
considered as compared to when ΔPn was used (Fig. 3), confirming that the osmotic pressure
and the concentration polarization had an influence on the NF of glucose, specifically in the
permeate flux. Furthermore, we found that membrane permeability for glucose solutions did not
change and coincided with the pure water permeability for both membranes.
a)
b)
Page 16 of 26
Accep
ted
Man
uscr
ipt
16
Fig. 6: Permeate flux (Jv) of water and glucose solutions (5, 10, 50, and 100 g/L) as a function of
the real driving force (ΔPreal) for a) DK and b) DL membranes.
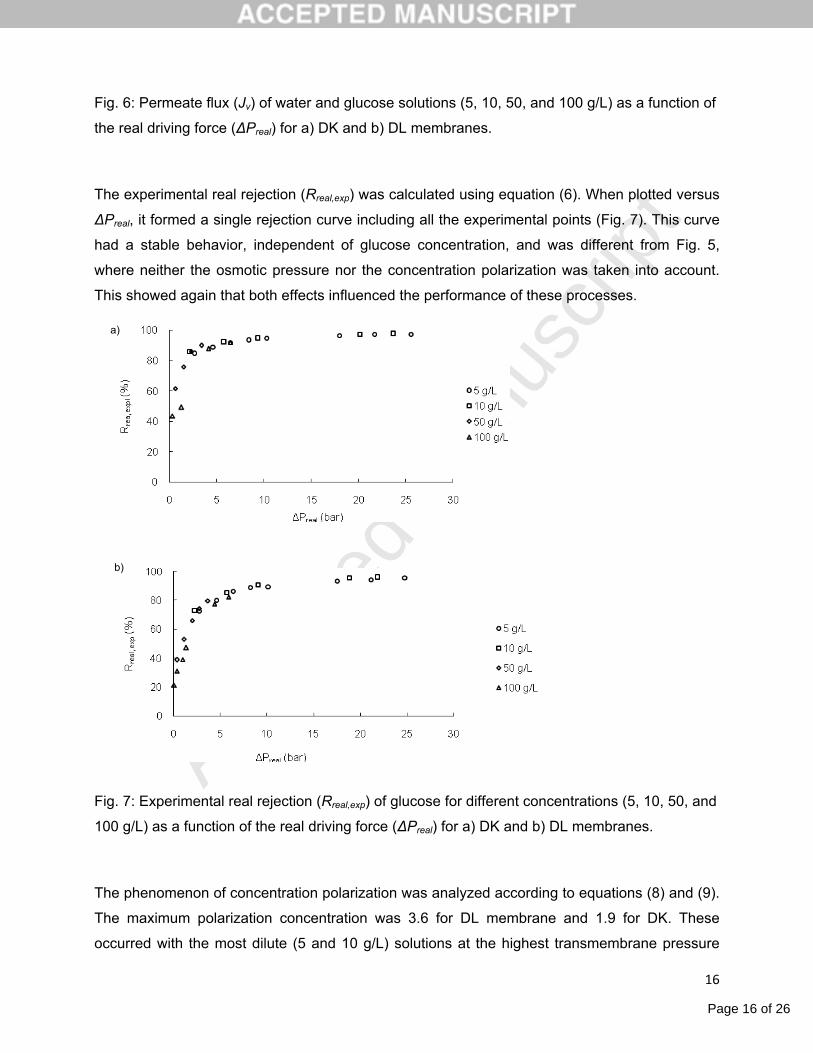
The experimental real rejection (Rreal,exp) was calculated using equation (6). When plotted versus
ΔPreal, it formed a single rejection curve including all the experimental points (Fig. 7). This curve
had a stable behavior, independent of glucose concentration, and was different from Fig. 5,
where neither the osmotic pressure nor the concentration polarization was taken into account.
This showed again that both effects influenced the performance of these processes.
Fig. 7: Experimental real rejection (Rreal,exp) of glucose for different concentrations (5, 10, 50, and
100 g/L) as a function of the real driving force (ΔPreal) for a) DK and b) DL membranes.
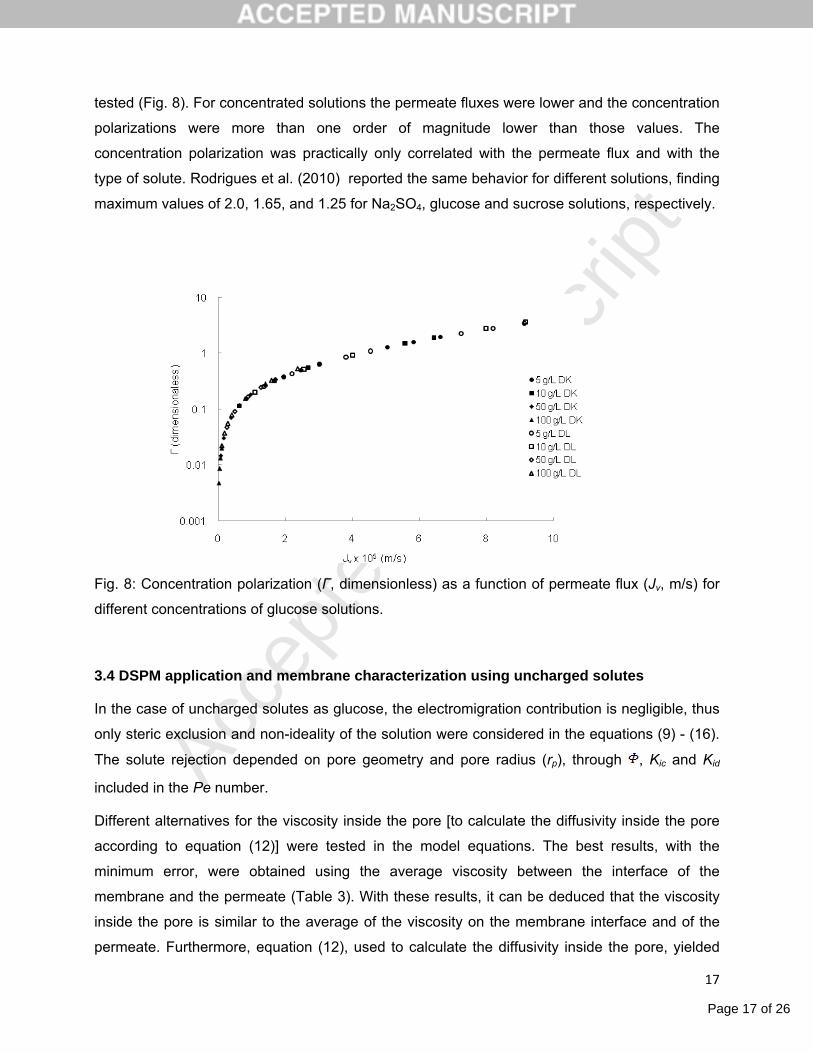
The phenomenon of concentration polarization was analyzed according to equations (8) and (9).
The maximum polarization concentration was 3.6 for DL membrane and 1.9 for DK. These
occurred with the most dilute (5 and 10 g/L) solutions at the highest transmembrane pressure
a)
b)
Page 17 of 26
Accep
ted
Man
uscr
ipt
17
tested (Fig. 8). For concentrated solutions the permeate fluxes were lower and the concentration
polarizations were more than one order of magnitude lower than those values. The
concentration polarization was practically only correlated with the permeate flux and with the
type of solute. Rodrigues et al. (2010) reported the same behavior for different solutions, finding
maximum values of 2.0, 1.65, and 1.25 for Na2SO4, glucose and sucrose solutions, respectively.
Fig. 8: Concentration polarization (Γ, dimensionless) as a function of permeate flux (Jv, m/s) for
different concentrations of glucose solutions.
3.4 DSPM application and membrane characterization using uncharged solutes
In the case of uncharged solutes as glucose, the electromigration contribution is negligible, thus
only steric exclusion and non-ideality of the solution were considered in the equations (9) - (16).
The solute rejection depended on pore geometry and pore radius (rp), through , Kic and Kid
included in the Pe number.
Different alternatives for the viscosity inside the pore [to calculate the diffusivity inside the pore
according to equation (12)] were tested in the model equations. The best results, with the
minimum error, were obtained using the average viscosity between the interface of the
membrane and the permeate (Table 3). With these results, it can be deduced that the viscosity
inside the pore is similar to the average of the viscosity on the membrane interface and of the
permeate. Furthermore, equation (12), used to calculate the diffusivity inside the pore, yielded
Page 18 of 26
Accep
ted
Man
uscr
ipt
18
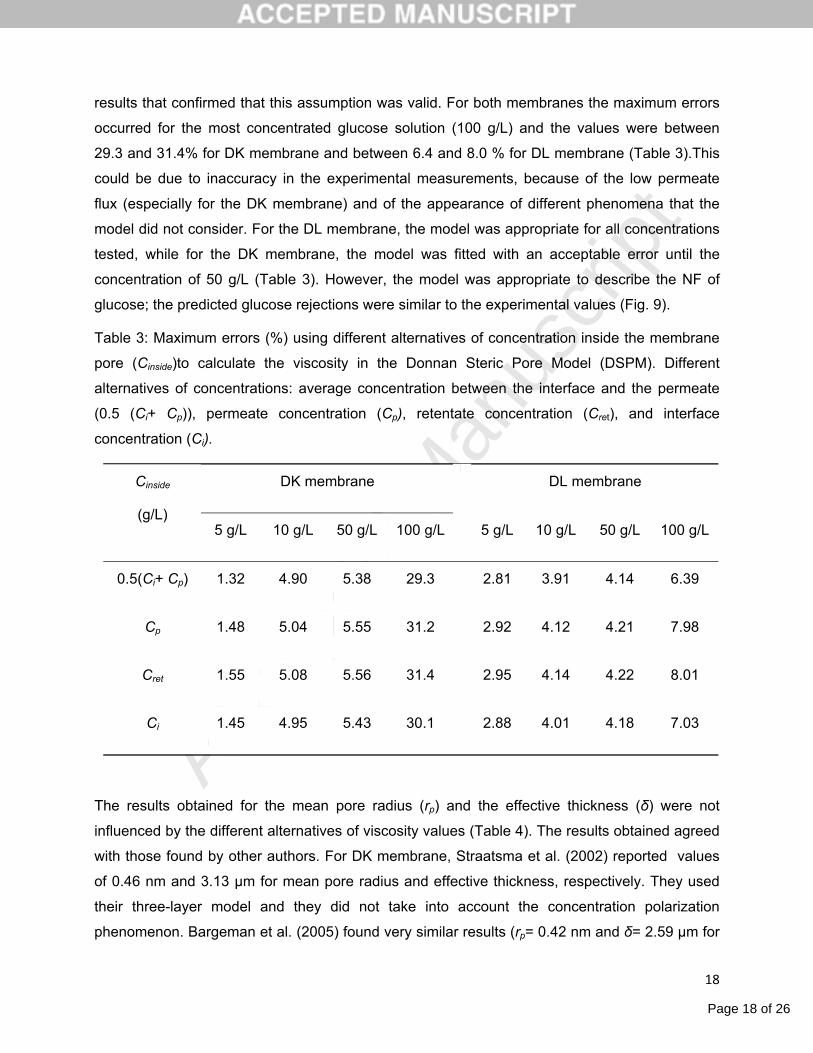
results that confirmed that this assumption was valid. For both membranes the maximum errors
occurred for the most concentrated glucose solution (100 g/L) and the values were between
29.3 and 31.4% for DK membrane and between 6.4 and 8.0 % for DL membrane (Table 3).This
could be due to inaccuracy in the experimental measurements, because of the low permeate
flux (especially for the DK membrane) and of the appearance of different phenomena that the
model did not consider. For the DL membrane, the model was appropriate for all concentrations
tested, while for the DK membrane, the model was fitted with an acceptable error until the
concentration of 50 g/L (Table 3). However, the model was appropriate to describe the NF of
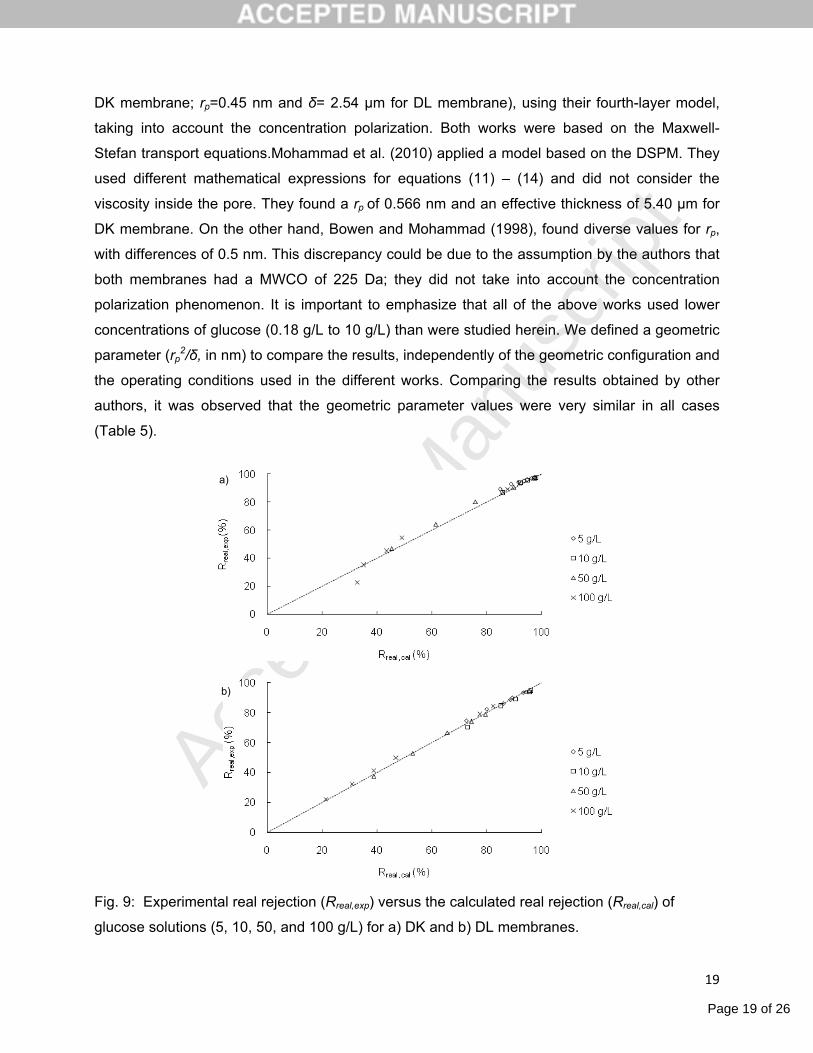
glucose; the predicted glucose rejections were similar to the experimental values (Fig. 9).
Table 3: Maximum errors (%) using different alternatives of concentration inside the membrane
pore (Cinside)to calculate the viscosity in the Donnan Steric Pore Model (DSPM). Different
alternatives of concentrations: average concentration between the interface and the permeate
(0.5 (Ci+ Cp)), permeate concentration (Cp), retentate concentration (Cret), and interface
concentration (Ci).
DK membrane DL membrane Cinside
(g/L) 5 g/L 10 g/L 50 g/L 100 g/L 5 g/L 10 g/L 50 g/L 100 g/L
0.5(Ci+ Cp) 1.32 4.90 5.38 29.3 2.81 3.91 4.14 6.39
Cp 1.48 5.04 5.55 31.2 2.92 4.12 4.21 7.98
Cret 1.55 5.08 5.56 31.4 2.95 4.14 4.22 8.01
Ci 1.45 4.95 5.43 30.1 2.88 4.01 4.18 7.03
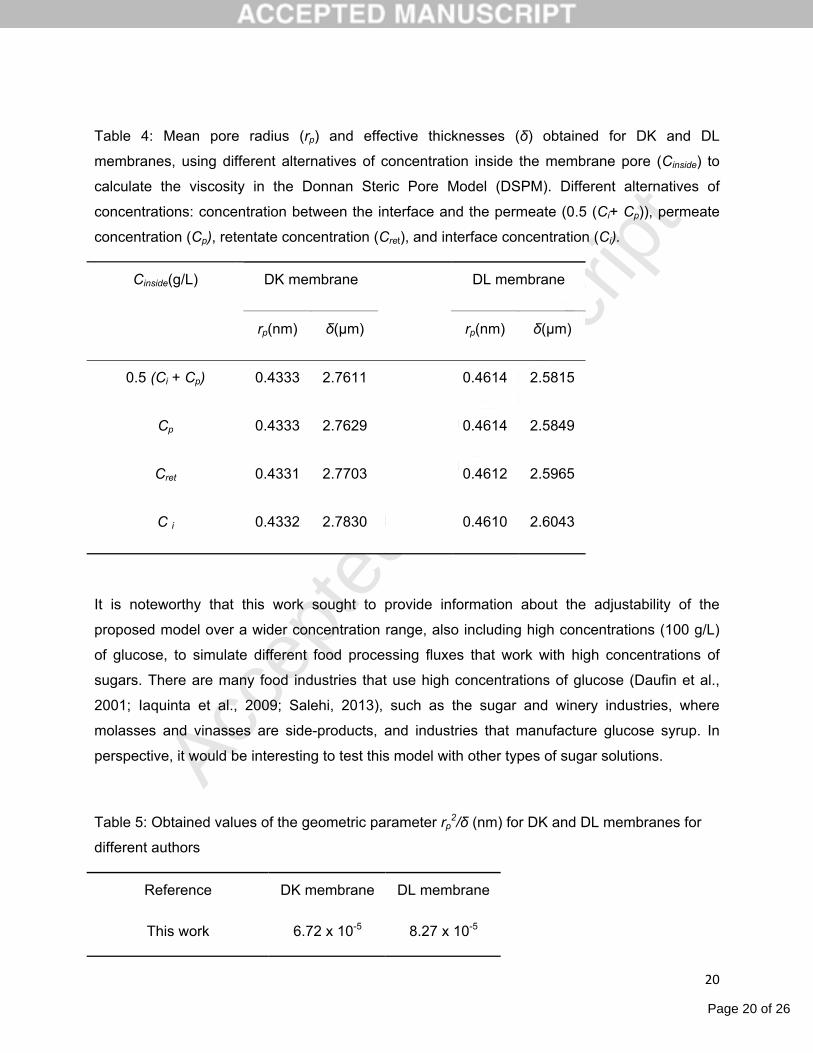
The results obtained for the mean pore radius (rp) and the effective thickness (δ) were not
influenced by the different alternatives of viscosity values (Table 4). The results obtained agreed
with those found by other authors. For DK membrane, Straatsma et al. (2002) reported values
of 0.46 nm and 3.13 µm for mean pore radius and effective thickness, respectively. They used
their three-layer model and they did not take into account the concentration polarization
phenomenon. Bargeman et al. (2005) found very similar results (rp= 0.42 nm and δ= 2.59 µm for
Page 19 of 26
Accep
ted
Man
uscr
ipt
19
DK membrane; rp=0.45 nm and δ= 2.54 µm for DL membrane), using their fourth-layer model,
taking into account the concentration polarization. Both works were based on the Maxwell-
Stefan transport equations.Mohammad et al. (2010) applied a model based on the DSPM. They
used different mathematical expressions for equations (11) – (14) and did not consider the
viscosity inside the pore. They found a rp of 0.566 nm and an effective thickness of 5.40 µm for
DK membrane. On the other hand, Bowen and Mohammad (1998), found diverse values for rp,
with differences of 0.5 nm. This discrepancy could be due to the assumption by the authors that
both membranes had a MWCO of 225 Da; they did not take into account the concentration
polarization phenomenon. It is important to emphasize that all of the above works used lower
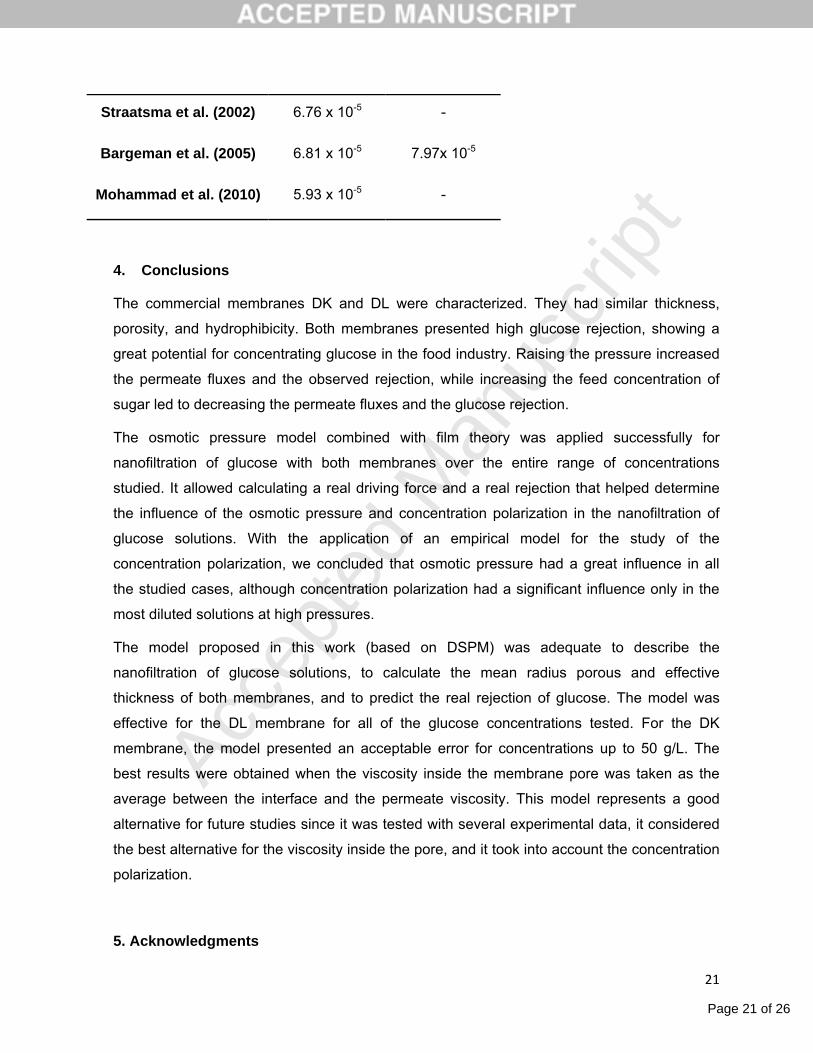
concentrations of glucose (0.18 g/L to 10 g/L) than were studied herein. We defined a geometric
parameter (rp2/δ, in nm) to compare the results, independently of the geometric configuration and
the operating conditions used in the different works. Comparing the results obtained by other
authors, it was observed that the geometric parameter values were very similar in all cases
(Table 5).
Fig. 9: Experimental real rejection (Rreal,exp) versus the calculated real rejection (Rreal,cal) of
glucose solutions (5, 10, 50, and 100 g/L) for a) DK and b) DL membranes.
a)
b)
Page 20 of 26
Accep
ted
Man
uscr
ipt
20
Table 4: Mean pore radius (rp) and effective thicknesses (δ) obtained for DK and DL
membranes, using different alternatives of concentration inside the membrane pore (Cinside) to
calculate the viscosity in the Donnan Steric Pore Model (DSPM). Different alternatives of
concentrations: concentration between the interface and the permeate (0.5 (Ci+ Cp)), permeate
concentration (Cp), retentate concentration (Cret), and interface concentration (Ci).
DK membrane DL membrane Cinside(g/L)
rp(nm) δ(µm) rp(nm) δ(µm)
0.5 (Ci + Cp) 0.4333 2.7611 0.4614 2.5815
Cp 0.4333 2.7629 0.4614 2.5849
Cret 0.4331 2.7703 0.4612 2.5965
C i 0.4332 2.7830 0.4610 2.6043
It is noteworthy that this work sought to provide information about the adjustability of the
proposed model over a wider concentration range, also including high concentrations (100 g/L)
of glucose, to simulate different food processing fluxes that work with high concentrations of
sugars. There are many food industries that use high concentrations of glucose (Daufin et al.,
2001; Iaquinta et al., 2009; Salehi, 2013), such as the sugar and winery industries, where
molasses and vinasses are side-products, and industries that manufacture glucose syrup. In
perspective, it would be interesting to test this model with other types of sugar solutions.
Table 5: Obtained values of the geometric parameter rp2/δ (nm) for DK and DL membranes for
different authors
Reference DK membrane DL membrane
This work 6.72 x 10⁻⁵ 8.27 x 10⁻⁵
Page 21 of 26
Accep
ted
Man
uscr
ipt
21
Straatsma et al. (2002) 6.76 x 10⁻⁵ -
Bargeman et al. (2005) 6.81 x 10⁻⁵ 7.97x 10⁻⁵
Mohammad et al. (2010) 5.93 x 10⁻⁵ -
4. Conclusions
The commercial membranes DK and DL were characterized. They had similar thickness,
porosity, and hydrophibicity. Both membranes presented high glucose rejection, showing a
great potential for concentrating glucose in the food industry. Raising the pressure increased
the permeate fluxes and the observed rejection, while increasing the feed concentration of
sugar led to decreasing the permeate fluxes and the glucose rejection.
The osmotic pressure model combined with film theory was applied successfully for
nanofiltration of glucose with both membranes over the entire range of concentrations
studied. It allowed calculating a real driving force and a real rejection that helped determine
the influence of the osmotic pressure and concentration polarization in the nanofiltration of
glucose solutions. With the application of an empirical model for the study of the
concentration polarization, we concluded that osmotic pressure had a great influence in all
the studied cases, although concentration polarization had a significant influence only in the
most diluted solutions at high pressures.
The model proposed in this work (based on DSPM) was adequate to describe the
nanofiltration of glucose solutions, to calculate the mean radius porous and effective
thickness of both membranes, and to predict the real rejection of glucose. The model was
effective for the DL membrane for all of the glucose concentrations tested. For the DK
membrane, the model presented an acceptable error for concentrations up to 50 g/L. The
best results were obtained when the viscosity inside the membrane pore was taken as the
average between the interface and the permeate viscosity. This model represents a good
alternative for future studies since it was tested with several experimental data, it considered
the best alternative for the viscosity inside the pore, and it took into account the concentration
polarization.
5. Acknowledgments
Page 22 of 26
Accep
ted
Man
uscr
ipt
22
This research was supported by Consejo de Investigaciones de la Universidad Nacional de
Salta, Research Project 1895/1. Jorge Emilio Almazán and Estela María Romero-Dondiz are
or were recipients of graduate fellowships from Consejo Nacional de Investigaciones
Científicas y Técnicas (CONICET). The authors would like to thank Dr. Jerold Last for his
kind help with the English corrections.
6. References
Aimar, P., Field, R., 1992. Limiting flux in membrane separations: A model based on the
viscosity dependency of the mass transfer coefficient. Chemical Engineering Science 47, 579-
586.
Bader, M.S.H., Veenstra, J.N., 1996. Analysis of concentration polarization phenomenon in
ultrafiltration under turbulent flow conditions. Journal of Membrane Science 114, 139-148.
Bandini, S., Bruni, L., 2010. 2.04 - Transport Phenomena in Nanofiltration Membranes, in: Drioli,
E., Giorno, L. (Eds.), Comprehensive Membrane Science and Engineering. Elsevier, Oxford, pp.
67-89.
Bargeman, G., Vollenbroek, J.M., Straatsma, J., Schroën, C.G.P.H., Boom, R.M., 2005.
Nanofiltration of multi-component feeds. Interactions between neutral and charged components
and their effect on retention. Journal of Membrane Science 247, 11-20.
Bowen, W.R., Mohammad, A.W., 1998. Characterization and Prediction of Nanofiltration
Membrane Performance—A General Assessment. Chemical Engineering Research and Design
76, 885-893.
Bowen, W.R., Mohammad, A.W., Hilal, N., 1997. Characterisation of nanofiltration membranes
for predictive purposes — use of salts, uncharged solutes and atomic force microscopy. Journal
of Membrane Science 126, 91-105.
Bowen, W.R., Mukhtar, H., 1996. Characterisation and prediction of separation performance of
nanofiltration membranes. Journal of Membrane Science 112, 263-274.
Bowen, W.R., Welfoot, J.S., 2002. Modelling the performance of membrane nanofiltration—
critical assessment and model development. Chemical Engineering Science 57, 1121-1137.
Cassano, A., Donato, L., Drioli, E., 2007. Ultrafiltration of kiwifruit juice: Operating parameters,
juice quality and membrane fouling. Journal of Food Engineering 79, 613-621.
Page 23 of 26
Accep
ted
Man
uscr
ipt
23
Cavaco Morão, A.I., Brites Alves, A.M., Geraldes, V., 2008. Concentration polarization in a
reverse osmosis/nanofiltration plate-and-frame membrane module. Journal of Membrane
Science 325, 580-591.
Chakrabarty, B., Ghoshal, A.K., Purkait, M.K., 2008. Effect of molecular weight of PEG on
membrane morphology and transport properties. Journal of Membrane Science 309, 209-221.
Chen, Z., Deng, M., Chen, Y., He, G., Wu, M., Wang, J., 2004. Preparation and performance of
cellulose acetate/polyethyleneimine blend microfiltration membranes and their applications.
Journal of Membrane Science 235, 73-86.
Cheng, T.-W., Yeh, H.-M., Gau, C.-T., 1998. Flux analysis by modified osmotic-pressure model
for laminar ultrafiltration of macromolecular solutions. Separation and Purification Technology
13, 1-8.
Daufin, G., Escudier, J.P., Carrère, H., Bérot, S., Fillaudeau, L., Decloux, M., 2001. Recent and
Emerging Applications of Membrane Processes in the Food and Dairy Industry. Food and
Bioproducts Processing 79, 89-102.
Drioli, E., Fontananova, E., 2004. Membrane Technology and Sustainable Growth. Chemical
Engineering Research and Design 82, 1557-1562.
Drioli, E., Stankiewicz, A.I., Macedonio, F., 2011. Membrane engineering in process
intensification—An overview. Journal of Membrane Science 380, 1-8.
Feng, Y.M., Chang, X.L., Wang, W.H., Ma, R.Y., 2009. Separation of galacto-oligosaccharides
mixture by nanofiltration. Journal of the Taiwan Institute of Chemical Engineers 40, 326-332.
Gao, J., Sun, S.-P., Zhu, W.-P., Chung, T.-S., 2014. Polyethyleneimine (PEI) cross-linked P84
nanofiltration (NF) hollow fiber membranes for Pb2+ removal. Journal of Membrane Science
452, 300-310.
Garba, Y., Taha, S., Gondrexon, N., Dorange, G., 1999. Ion transport modelling through
nanofiltration membranes. Journal of Membrane Science 160, 187-200.
Gekas, V., Hallström, B., 1987. Mass transfer in the membrane concentration polarization layer
under turbulent cross flow : I. Critical literature review and adaptation of existing sherwood
correlations to membrane operations. Journal of Membrane Science 30, 153-170.
Geraldes, V., Afonso, M.D., 2006. Generalized mass- transfer correction factor for nanofiltration
and reverse osmosis. American Institute of Chemical Engineers Journal 52, 3353- 3362.
Page 24 of 26
Accep
ted
Man
uscr
ipt
24
Geraldes, V., Afonso, M.D., 2007. Prediction of the concentration polarization in the
nanofiltration/reverse osmosis of dilute multi-ionic solutions. Journal of Membrane Science 300,
20-27.
Hagmeyer, G., Gimbel, R., 1998. Modelling the salt rejection of nanofiltration membranes for
ternary ion mixtures and for single salts at different pH values. Desalination 117, 247-256.
He, Y., Ji, Z., Li, S., 2007. Effective clarification of apple juice using membrane filtration without
enzyme and pasteurization pretreatment. Separation and Purification Technology 57, 366-373.
Hinkova, A., Bubnık, Z., Kadlec, P., Pridal, J., 2002. Potentials of separation membranes in the
sugar industry. Separation and Purification Technology 26, 101-110.
Iaquinta, M., Stoller, M., Merli, C., 2009. Optimization of a nanofiltration membrane process for
tomato industry wastewater effluent treatment. Desalination 245, 314-320.
Ioannou, L.A., Michael, C., Vakondios, N., Drosou, K., Xekoukoulotakis, N.P., Diamadopoulos,
E., Fatta-Kassinos, D., 2013. Winery wastewater purification by reverse osmosis and oxidation
of the concentrate by solar photo-Fenton. Separation and Purification Technology 118, 659-669.
Jiao, B., Cassano, A., Drioli, E., 2004. Recent advances on membrane processes for the
concentration of fruit juices: a review. Journal of Food Engineering 63, 303-324.
Jin, X., Hu, J., Ong, S.L., 2007. Influence of dissolved organic matter on estrone removal by NF
membranes and the role of their structures. Water Research 41, 3077-3088.
Luo, J., Wan, Y., 2013. Effects of pH and salt on nanofiltration—a critical review. Journal of
Membrane Science 438, 18-28.
Mänttäri, M., Pihlajamäki, A., Nyström, M., 2006. Effect of pH on hydrophilicity and charge and
their effect on the filtration efficiency of NF membranes at different pH. Journal of Membrane
Science 280, 311-320.
Mazzoni, C., Bandini, S., 2006. On nanofiltration Desal-5 DK performances with calcium
chloride–water solutions. Separation and Purification Technology 52, 232-240.
Mohammad, A.W., Basha, R.K., Leo, C.P., 2010. Nanofiltration of glucose solution containing
salts: Effects of membrane characteristics, organic component and salts on retention. Journal of
Food Engineering 97, 510-518.
Page 25 of 26
Accep
ted
Man
uscr
ipt
25
Nabetani, H., Nakajima, M., Watanabe, A., Nakao, S.-i., Kimura, S., 1992. Prediction of the flux
for the reverse osmosis of a solution of sucrose and glucose. Journal of Chemical Engineering of
Japan 25, 575-580.
Ong, Y.K., Li, F.Y., Sun, S.-P., Zhao, B.-W., Liang, C.-Z., Chung, T.-S., 2014. Nanofiltration
hollow fiber membranes for textile wastewater treatment: Lab-scale and pilot-scale studies.
Chemical Engineering Science 114, 51-57.
Pap, N., Kertész, S., Pongrácz, E., Myllykoski, L., Keiski, R.L., Vatai, G., László, Z., Beszédes,
S., Hodúr, C., 2009. Concentration of blackcurrant juice by reverse osmosis. Desalination 241,
256-264.
Perry, R.H., Green, D.W., 1997. Perry's Chemical Engineers' Handbook 7th Edition. McGraw-Hill
Professional.
Rodrigues, C., Cavaco Morão, A.I., de Pinho, M.N., Geraldes, V., 2010. On the prediction of
permeate flux for nanofiltration of concentrated aqueous solutions with thin-film composite
polyamide membranes. Journal of Membrane Science 346, 1-7.
Salehi, F., 2013. Current and future applications for nanofiltration technology in the food
processing. Food and Bioproducts Processing.
Santafé-Moros, A., Gozálvez-Zafrilla, J.M., Lora-García, J., 2008. Applicability of the DSPM with
dielectric exclusion to a high rejection nanofiltration membrane in the separation of nitrate
solutions. Desalination 221, 268-276.
Sjöman, E., Mänttäri, M., Nyström, M., Koivikko, H., Heikkilä, H., 2007. Separation of xylose
from glucose by nanofiltration from concentrated monosaccharide solutions. Journal of
Membrane Science 292, 106-115.
Straatsma, J., Bargeman, G., van der Horst, H.C., Wesselingh, J.A., 2002. Can nanofiltration be
fully predicted by a model? Journal of Membrane Science 198, 273-284.
Strathmann, H., 1999. Membrane processes for sustainable industrial growth. Membrane
Technology 1999, 9-11.
van der Horst, H.C., Timmer, J.M.K., Robbertsen, T., Leenders, J., 1995. Use of nanofiltration
for concentration and demineralization in the dairy industry: Model for mass transport. Journal of
Membrane Science 104, 205-218.
Yacubowicz, H., Yacubowicz, J., 2005. Nanofiltration: properties and uses. Filtration &
Separation 42, 16-21.
Page 26 of 26
Accep
ted
Man
uscr
ipt
26
Zhao, Y., Yuan, Q., 2006. Effect of membrane pretreatment on performance of solvent resistant
nanofiltration membranes in methanol solutions. Journal of Membrane Science 280, 195-201.
Zhu, W.-P., Sun, S.-P., Gao, J., Fu, F.-J., Chung, T.-S., 2014. Dual-layer
polybenzimidazole/polyethersulfone (PBI/PES) nanofiltration (NF) hollow fiber membranes for
heavy metals removal from wastewater. Journal of Membrane Science 456, 117-127.