Embed Size (px)
Citation preview

Lesson 3: Nanofiltration
Student Materials
Contents • The Filtration Spectrum: Student Handout
• Types of Filtration Systems and Their Traits: Student Handout • Which Method is Best? Student Worksheet
• Comparing Nanofilters to Conventional Filters Lab Activity: Student Instructions & Worksheet
• Cleaning Jarny’s Water: Student Instructions & Report • New Nanomembranes: Student Reading
• Reflecting on the Guiding Questions: Student Worksheet
3-S1

The
Filtr
atio
n Sp
ectr
um: S
tude
nt H
ando
ut
Ada
pted
from
Osm
onic
s Fi
ltrat
ion
Spec
trum
R
etrie
ved
Janu
ary
7, 2
007,
from
http
://w
ww
.sasc
onsu
lting
.ca/
File
s/Sp
ectru
m.jp
g
3-S2

Type
s of
Filt
ratio
n Sy
stem
s an
d Th
eir
Trai
ts: S
tude
nt H
ando
ut
Type
of
Filtr
atio
n M
ax P
artic
le
Size
(met
ers)
C
hara
cter
izat
ion
Ex
ampl
e Pa
rtic
les
D
isadv
anta
ges
D
iagr
am
Mic
rofil
trat
ion
(MF)
10
-5 to
10-7
Rem
oval
bas
ed o
n re
lativ
ely
larg
e po
re s
ize,
reta
ins
cont
amin
ants
on
surf
ace.
V
ery
low
wat
er p
ress
ure
need
ed.
Ofte
n us
ed a
s a
pre-
filte
r.
Sand
, silt
, cla
ys,
Gia
rdia
lam
blia
, Cr
ypto
spoi
dium
, cy
sts,
alg
ae a
nd
som
e ba
cter
ia
Rem
oves
littl
e or
no
org
anic
mat
ter.
Doe
s not
rem
ove
viru
ses.
D
epth
Filt
er
Surf
ace
Filte
r [1]
Ultr
afilt
ratio
n (U
F)
10-7
to 1
0-8
Rem
oval
bas
ed o
n sm
alle
r por
e si
ze, r
etai
ns c
onta
min
ants
on
surf
ace.
Lo
w w
ater
pre
ssur
e ne
eded
.
Susp
ende
d or
gani
c so
lids
Parti
al re
mov
al o
f ba
cter
ia
Mos
t viru
ses
rem
oved
Mos
t pro
blem
s ar
e w
ith fo
ulin
g.
Can
not r
emov
e iro
n or
man
gane
se
ions
(mul
tival
ent
ions
). [1
]
Nan
ofilt
ratio
n (N
F)
10-8
to 1
0-10
Rem
oval
bas
ed o
n ve
ry sm
all
pore
size
and
shap
e an
d ch
arge
ch
arac
teris
tics
of m
embr
ane.
M
oder
ate
pres
sure
nee
ded.
Susp
ende
d so
lids
Bac
teria
V
iruse
s So
me
mul
tival
ent
ions
Cur
rent
ly m
ost a
re
susc
eptib
le to
hig
h fo
ulin
g.
Cos
t is r
elat
ivel
y hi
gh (c
urre
ntly
).
[2]
Rev
erse
O
smos
is (R
O)
10-9
to 1
0-11
Hig
h pr
essu
re p
roce
ss th
at
push
es w
ater
aga
inst
the
conc
entra
tion
grad
ient
D
iffer
ent m
embr
anes
hav
e di
ffer
ent p
ore
size
s an
d di
ffer
ent c
hara
cter
istic
s.
Susp
ende
d so
lids
Bac
teria
V
iruse
s M
ost m
ultiv
alen
t io
ns
Mon
oval
ent i
ons
Mem
bran
es a
re
pron
e to
foul
ing.
C
ost i
s hig
h.
[3
] N
ote:
Rel
ativ
e Pr
essu
re n
eede
d fo
r ope
ratio
n: R
O >
NF
> U
F >
MF
R
elat
ive
Cos
t: R
O >
NF
> U
F >
MF
[4]
3-S3

Refe
renc
es
(Acc
esse
d D
ecem
ber 2
007.
)
[1] h
ttp://
ww
w.fr
eedr
inki
ngw
ater
.com
/wat
er-e
duca
tion/
qual
ity-w
ater
-filt
ratio
n-m
etho
d.ht
m
[2] A
dapt
ed fr
om h
ttp://
ww
w.h
omec
ents
.com
/imag
es/h
2o-im
gs/n
ano_
f_l.g
if
[3] A
dapt
ed fr
om h
ttp://
ww
w.z
enon
.com
/imag
e/re
sour
ces/
glos
sary
/reve
rse_
osm
osis
/reve
rse_
osm
osis
.jpg
[4] h
ttp://
ww
w.n
esc.
wvu
.edu
/ndw
c/
3-S4
Name__________________________________ Date______________________ Period ______
Which Method is Best? Student Worksheet
Purpose Use the Filtration Spectrum: Student Handout to determine which filtration method is best suited to filter a variety of particles.
Introduction and Example If you had a filter that was made of paper, it would not let sand pass through but would allow water and dissolved sodium chloride pass through. To demonstrate this, you would draw the following arrows:
Na+ Cl- H2O Sand
Filter Paper
Refer to the Filtration Spectrum handout. Based on what you see in the handout, draw arrows that show which particles will pass through each membrane and which will not.
Water Monovalent Ions
Multivalent Ions
Viruses Bacteria Suspended Solids
Microfilter
Ultrafilter
Nanofilter
Reverse osmosis
3-S5

Comparing Nanofilters to Conventional Filters Lab Activity: Student Instructions
Overview You are on a backpacking trip in the mountains with a friend. Each of you has brought 2 liters of water with you and you are running very low. You had planned to stay at least for another day, but realize that if you don’t find a source of clean drinking water, you will need to turn back and end your trip early. You brought with you some water testing strips and a nanofilter that fits inside of a syringe, just in case you needed to drink the water from the river. Your job is to use your testing strips to find out what else, besides what you can see (such as leaves) is in the water. Once you find what is in the water, you will have to filter out any of the unwanted substances. The pores of your nanofilter are so small that they will easily plug with large substances. You want to filter as much as you can using the gravel and the sand by the river in a funnel. You have also brought activated charcoal with you.
Can you make the river water clean enough to drink, or do you have to turn around and go home?
Materials: Filtration (Part I) • ½ cup sand • ½ cup gravel
• About 50 mL of activated charcoal • 1 25 mm NanoCeram® nanofilter disc
• 1 Luer-Loc ceramic filter housing (to hold the nanofilter) • 2 250 mL beakers
• 1 funnel • Paper towels
• Syringe • Test strips for nitrate and nitrite ions
• Test strips for chloride ions • Test strips for copper
• Test strips or drops for iron(II) and iron(III) ions • ½ liter of “river water” in a bottle
Materials: Comparing Ultrafiltration with Nanofiltration (Part II) • 1 25 mm NanoCeram® nanofilter disc • 1 25 mm Millipore VS ultrafilter disc
• 1 Luer-Loc ceramic filter housing (to hold the nanofilter and the ultrafilter)
3-S6

• Syringe • Bottle of water containing dissolved dye
• (2) small effluent collectors • Paper towels
Procedures: Filtration (Part I)
Setup 1. Put the charcoal in water to soak for at least
10 minutes, and proceed with the next step. After 10 minutes, take the charcoal out and rinse it thoroughly to prevent coloring the water.
2. Arrange the ring on the ring stand and put the empty funnel inside of the ring, as shown in Figure 1. Put the 250 ml beaker underneath the funnel so it will catch the effluent.
3. Look at the river water in the bottle. Record your observations of the river water on your lab sheet. Be sure to notice texture, colors, and anything else that stands out.
4. Follow the instructions in the Ion Testing box below to test the river water for the presence of the ions.
Figure 1. Funnel supported by ring with beaker underneath to
catch effluent [1].
Ion Testing 1. Label a paper towel with each of the symbols of the ions you will test:
Fe2+ Fe3+ Cl- NO3- NO2
- Cu2+ 2. Dip the appropriate strips in the river water to test for these ions. 3. Put the wet strips on a paper towel under their appropriate symbols so you don’t
forget which strip represents a test for which ion. 4. Match the color of your strip with the color chart on the side of the relevant test
strip bottle. The amount of the ion in your river water sample will be listed underneath the matching color square on the bottle.
5. Record on your lab sheet the color of the strip and the amount of each ion indicated by the test strip.
You will repeat this “ion testing” step after each filtration to find out if the ions are still present in the water.
3-S7

Table 1 summarizes the consequences of the presence of these ions in drinking water.
Table 1. Ions and Consequences in Drinking Water Ions Consequences in Drinking Water
Fe2+ and Fe3+ These ions indicate that rust from pipes has gotten into the water. While rust is not dangerous, it makes the water taste bad and leaves mineral deposits in sinks and bathtubs.
NO3– and
NO2–
These ions are an indication that pesticides from agriculture have gotten into the water.
Cl– This ion indicates that salt has intruded into the water. People cannot use salty water for drinking. Salty water usually cannot be used for agriculture either, although there are a few exceptions.
Cu2+ Copper is normally found in water from natural sources as well as from corrosion of the copper pipes used for water. Copper is not harmful in quantities less than 1000-µm.
Gravel Filtration 1. Put ½ cup of gravel into the funnel. 2. Put a clean 250 mL beaker underneath the funnel.
3. Pour the river water supplied by your teacher over the gravel. Notice if the gravel stopped any of the substances that you saw in the water from going into the beaker below.
4. Record your observations on your lab sheets.
Gravel and Sand Filtration 5. Put ½ cup of sand on top of the gravel in the funnel. 6. Put a clean 250 mL beaker under the funnel.
7. Pour the contents of the first beaker, the effluent, into the funnel on top of the sand. Notice if the sand and gravel stop any of the substances in the water from going into the beaker below.
8. Record your observations on your lab sheet.
9. Rinse the empty 250 mL beaker and place it underneath the funnel.
Gravel, Sand, and Activated Charcoal Filtration 10. Put the activated charcoal into the funnel on top of the sand and the gravel.
11. Pour the remaining water (the effluent) left from the sand filtration step into the funnel on top of the charcoal. Notice if the charcoal removes anything else.
12. Record your observations on your lab sheet.
3-S8

Conduct Ion Test 13. Using the test strips, test for the presence of the ions in the filtered water by
following the instructions in the Ion Testing box above. 14. Record the results of your ion tests on your lab sheet and answer the questions.
Nanofiltration 15. Get a 25 mm NanoCeram® nanofilter disc and a Luer-Loc ceramic filter housing. 16. Open the filter housing and carefully place the disc into the filter housing, place
the O-ring on top of the disc, and close securely, making sure the disc is centered in the housing to prevent leakage around the edges of the disc.
17. Rinse the empty 250 mL beaker and place it underneath the filter. 18. Fill the syringe with the effluent collected after filtering with the charcoal, sand,
and gravel. 19. Screw the filter housing onto the syringe, taking care not to depress the plunger
of the syringe during this operation. 20. Push the effluent through the nanofilter using even, steady pressure. 21. Record your observations of the solution after it has gone through the nanofilter
on your lab sheet.
Conduct Ion Test 22. Using the test strips, test for the presence of the ions in the filtered water by
following the instructions in the Ion Testing box above.
23. Record the results of your ion tests on your lab sheet and answer the questions.
Procedures: Comparing Ultrafiltration with Nanofiltration (Part II) You have just used a new nanofilter (the NanoCeram filter) that has recently come to market. An older ultrafilter, called the Millipore VS filter is also available. The NanoCeram® filter is a multilevel woven membrane with various nanoparticles embedded into the layers of membranes. The Millipore VS membrane is a nonwoven, matte-like paper.
The purpose of this part of the lab activity is to compare the nanofilter with the ultrafilter based upon the following two criteria:
• Completeness of filtration • The relative amount of pressure needed to push the water through each filter
The completeness of filtration will be measured by filtering dissolved dye through each of the filters and looking at the color of the filter and the effluent. The relative pressure needed for filtration will be measured by how hard you have to push the syringe to get the water to pass through the filters.
3-S9
Compare Millipore VS and NanoCeram® Filtration 1. Open the bottle containing the dissolved dye and draw 2-3 mL into the syringe.
2. Open the Luer-Loc filter housing and carefully place a single 25mm disc of Millipore VS membrane material into it. Place the O-ring on top of the disc and close securely, making sure the disc is centered in the housing to prevent leakage around the edges of the disc.
3. Screw the filter housing onto the syringe, taking care not to depress the plunger of the syringe during this operation.
4. Depress plunger of the syringe while holding the syringe over an effluent collector to capture the fluid as it exits the syringe through the filter housing.
5. Apply enough pressure to ensure that the dissolved dye is passing through the filter media. Typical results for this stage using the Millipore VS membrane material show only several drops coming out of the syringe due to the extreme amount of pressure required to force the dissolved dye through the filter.
6. Once this is completed, carefully remove and open the filter housing, and remove the filter membrane.
7. Place the membrane aside, next to the effluent collector containing the effluent from this test.
8. Rinse the syringe and repeat the sequence of steps 1-7 above, but with the NanoCeram® filter. Push the dissolved dye through gently and steadily; avoid pushing fast.
9. Compare the color of the effluent from the two filters, the color of the filters, and how easy or hard it was to push the dissolved dye through the filters with the syringe.
10. Record your observations on your lab sheet.
11. Answer the questions on your lab sheet. 12. Clean your lab station.
References (Accessed January 2008.) [1] http://icn2.umeche.maine.edu/newnav/newnavigator/images/P7280072.JPG
3-S10

Name__________________________________ Date______________________ Period ______
Comparing Nanofilters to Conventional Filters Lab Activity: Student Worksheet
Part 1: Filtration 1. DRAW and DESCRIBE the contents and appearance of your river water. After looking
carefully, write down everything that you see that is in the river water. Be sure to include any identifiable substances, and any colors.
2. Record the color of the test strip and amount of each ion indicated by the test strip.
Substance Tested Color Presence or Absence
Fe2+ and Fe3
NO3– and NO2
–
Cl–
Cu2+
Gravel Filtration 3. Describe the appearance of the effluent after it was poured through the gravel.
4. Based on your observations, what was removed from the river water after filtering with the gravel?
5. Based on your observations, what remained in the river water after filtering with the
gravel?
3-S11

Gravel and Sand FIltration 6. Describe the appearance of the effluent after it was poured through the gravel and sand.
7. Based on your observations, what was removed from the river water after filtering with
the gravel and sand?
8. Based on your observations, what remained in the river water after filtering with the
gravel and sand?
Gravel, Sand, and Activated Charcoal Filtration 9. Describe the appearance of the effluent after it was poured through the gravel, sand, and
charcoal.
10. Record the color of the test strip and amount of each ion indicated by the test strip.
Substance Tested Color Presence or Absence
Fe2+ and Fe3
NO3– and NO2
–
Cl–
Cu2+
11. Based on your evidence (observations and strip tests), what was removed from the river
water after filtering with the gravel, sand, and charcoal?
12. Based on your evidence (observations and strip tests), what remained in the river water
after filtering with the gravel, sand, and charcoal?
3-S12

Nanofiltration 13. Describe the appearance of the effluent after it was pushed through the NanoCeram®
nanofilter.
14. Record the color of the test strip and amount of each ion indicated by the test strip.
Substance Tested Color Presence or Absence
Fe2+ and Fe3
NO3– and NO2
–
Cl–
Cu2+
15. Based on your evidence (observations and strip tests), what was removed from the river
water after filtering through the nanofilter?
16. Based on your evidence (observations and strip tests), what remained in the river water
after filtering through the nanofilter?
3-S13
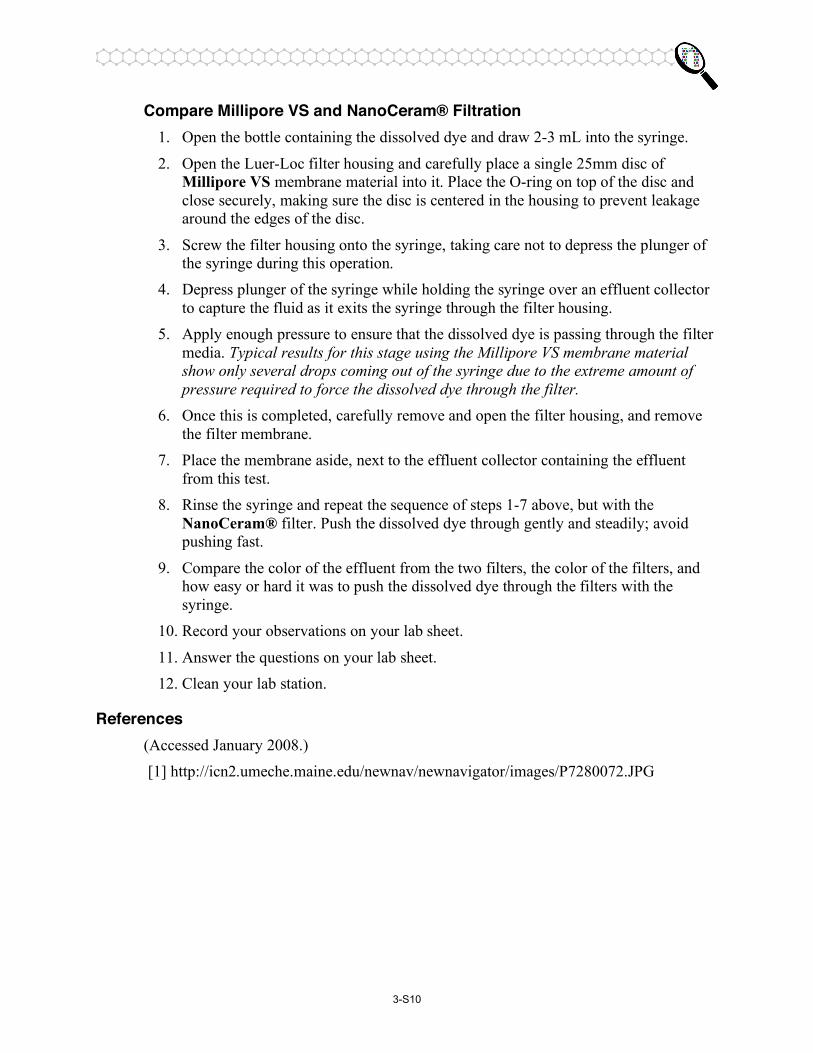
Part II: Comparing Ultrafiltration with Nanofiltration After following the lab directions for putting the effluent through the two filters, fill out the following table.
Filter Type Color of Effluent Color of Filter Relative Pressure Required to Push
the Solution Through the Filter
Millipore VS ultrafilter
NanoCeram® nanofilter
17. Which filter removed the dye the best? How do you know?
18. Which filter required less pressure to push the water through?
19. Based on your results about pressure, which filter would cost less overall?
20. Based on the evidence from your experiments, can you stay and camp another day or do you have to go home to get clean, drinkable water?
21. What do you think might have been the sources of the pollutants in your river water?
3-S14

Cleaning Jarny’s Water: Student Instructions & Report
There’s a Problem with Our Water… In the Eastern part of France, in the city of Jarny (see Figure 1), the local people have a serious problem with their drinking water. Their main source of drinking water comes from the ground water table located near an old iron mine. (See Figure 2 for an explanation of ground water.) The water has always been pumped out of the mine and filtered before being used for drinking water. When the mine was active, this system worked fine. But since closing, the water has flooded up into the mine, creating a pool of standing water that seeps into the ground water used for drinking. Figure 1. Jarny, France (green
arrow) [1]. Over time, the water sitting in the mine reacted with the debris left in the abandoned mine, leaving much of the water contaminated. A local water-monitoring agency has watched the rising contamination levels and determined that the current water cleaning system is not good enough to make the water safe to drink. Even before the water flooded up into the mine, a few substances were slightly above safety limits, but now their levels are even higher.
Figure 2. Ground water [2].
Water that comes from rain (precipitation) trickles through the ground (infiltration) until it flows to an area that it can’t pass through, such as bedrock. Fresh water accumulates in these places and is referred to as ground water. The top of the ground water is the water table. When this underground water is large enough, it is called an aquifer. Aquifers are a commonly used source of fresh drinking water for people all over the world.
Now that you have some background on the water problem facing Jarny, your team’s job is to design a system to clean the water to make it drinkable by the local residents. To do this you will need to do the following:
3-S15

1. Analyze the data in Table 1 to identify what harmful substances are present in the water. This table provides raw water measurements on a set of substances, selected due to their change in concentration before and after the flooding.
2. Complete question 1 in the Student Report. Record the following information for each substance:
• The name of the substance identified to be filtered out of the water
• The amount the substance is over the acceptable limit • The ranking of substances by size (1 = largest)
• The least expensive filter needed to filter the substance identified 3. Analyze the data on the current water cleaning system (Table 2), your reading
handouts, and relevant charts to help inform your design of a system to clean the water to make it drinkable. Assume that your design will be added on to the system currently in place: a flocculation procedure, a sand filter, and a 1.0 micron microfilter. Remember that the town is poor and your design needs to provide a cost-effective solution. Your design may involve single-step or multiple-step methods.
4. Complete questions 2 and 3 in the Student Report.
3-S16

Table 1. Water Measurements Before and After Flooding Substance Before flooding
(mg/L) After flooding
(mg/L) “Safe” levels
(mg/L) Health hazard or
water-taste quality
Ca2+ 168 296 160 Contributes to water “hardness”
Mg2+ 31 185 15 Contributes to water “hardness”
Na+ 50 260 350 Dehydration
CO32- 367 500 100 Taste or alkalinity
SO42- 192 1794 300 Water taste
Cd2+ .002 .018 .005 Kidney damage
Bacteria (E. coli) 0 24 0 Diarrhea, cramps, nausea, or headaches
Asbestos (million fibers/L) from rotting
pipes
2 12 7 Increased risk of developing intestinal polyps
Human hair (million hairs/L)
16 48 3 None known, just disgusting
Table 2. Jarny’s Current Water Cleaning System
Jarny’s current water cleaning system involves treating the water with a flocculent (a material that combines with large-sized particles in the water) and then letting the flocculent (with the large particle combinations) sink to the bottom so it can be removed. The remaining water is filtered through two filters: 1) sand, and then 2) a membrane with 1.0 micrometer diameter holes.
References [1] http://maps.google.com
[2] Adapted from http://ga.water.usgs.gov/edu/earthgwdecline.html
3-S17

Student Report 1. Use the water quality information in Table 1 to fill in Table 3 below.
Table 3. Substances Present at Unacceptable Levels
Substance Amount over acceptable limit
Rank substances by size (1=largest)
If there is a range, choose the size at the smallest end of the range
Particles of similar size can have the same ranking
Least expensive filter necessary
Ca2+
Mg2+
CO32-
SO42-
Cd2+
Bacteria (E coli)
Asbestos
Human hair
.
3-S18

2. The best filter or combination of filters to add to Jarny’s water system are the following, in
order:
3. Draw your design showing the water and its contents before and after passing through each
filter in your design.
3-S19

New Nanomembranes: Student Reading The Desalination Problem
In the early1960’s, the United States government challenged the scientific community to discover an inexpensive yet effective method for removing salt from water (desalination) on a large scale. Desalination offered the potential to make water from the oceans drinkable, but at the time, desalination methods tended to be expensive and inefficient. Accepting this challenge, Samuel Yuster and two of his graduate students at the University of California, Los Angeles created a porous material that simulated the movement of water through a living cell’s membrane. This material, a type of cellulose polymer, was called a reverse osmosis (RO) membrane. Within a living cell, water travels across the cell membrane from an area of higher concentration of solute to an area of lower concentration. This natural process, called osmosis, continues until the concentration of solute on the inside and outside of the cell are equal. In reverse osmosis, water is transported through an artificial membrane from an area of lower concentration to one of higher concentration––the opposite of osmosis. The water goes against the “concentration gradient.” Because this does not happen naturally, pressure (e.g. from a pump) is required to push the water through the membrane. By pushing water through this membrane, which salt and other ions can’t pass through, the water is filtered, leaving it pure and safe to drink. Reverse osmosis is the most expensive type of water filtration due to the constant energy required to pump water through the membrane at high pressure. Thus, even though we have a technique to make ocean water drinkable, the cost still prevents wide scale use.
Desalination technology has not changed much over the last fifty years…until now. Currently, there is a considerable amount of active research going into the creation of a variety of nanotechnology membranes, all with the goal of finding an inexpensive, but highly efficient method of removing salt from water.
Meet Eric Hoek Eric Hoek, a researcher at the University of California, Los Angeles, has been making the news lately. Dr. Hoek is an assistant professor of civil and environmental engineering and is working with a company to patent a nanofiltration membrane that shows promise as an efficient and cost-effective way to remove salt from water.
Dr. Hoek is working to create membranes with pore sizes of one nanometer. Because of the small pore size, the membrane blocks substances that are only a few nanometers in size.
Figure 1. Dr. Eric Hoek, Assistant
Professor at the University of California in Los Angeles (UCLA) [1].
3-S20
However, the membrane not only filters based on size but also based on charge. In other words, the membrane can stop particles of a particular size and of a particular electrostatic charge while allowing water through. He explains that one-nanometer pores are an optimal size because an electric field is generated that covers the entire pore. This electric field is adjustable in strength so that it can be “tuned” to reject charged items in solutes.
In addition, Dr. Hoek has figured out how to embed noxious substances in his nanomembranes––substances that will kill bacteria on contact! Dr. Hoek explains that at the nanoscale level, you can build substances into the membrane to give it certain properties. For example, by implanting into the membrane substances that are toxic to bacteria, you can effectively kill bacteria in water. Dr. Hoek’s nanomembranes provide all of these new filtration benefits, but equally importantly, they filter water at much less pressure and cost than traditional reverse osmosis techniques. How does this happen? Dr. Hoek explains that channels can be built into the membranes that are surprisingly hydrophilic (attractive to water molecules). The hydrophilic channels attract water to pass it through the membrane, thus reducing the pressure needed to push the water through it. Dr. Hoek plans to continue working on the development of smaller, “adaptive” membranes that can be adjusted through the combination of pressure-driven and electric/charge driven filtration. In other words, the membrane will allow you to have much greater control over the types of particles that can be filtered out. He also envisions creating membranes that are self-cleaning, which would reduce both maintenance and operating expenses. As Dr. Hoek tells his students, “Work on important problems, and your work will be appreciated. You'll do incremental work along the way to the goal, but you need the important problem to steer your work.”
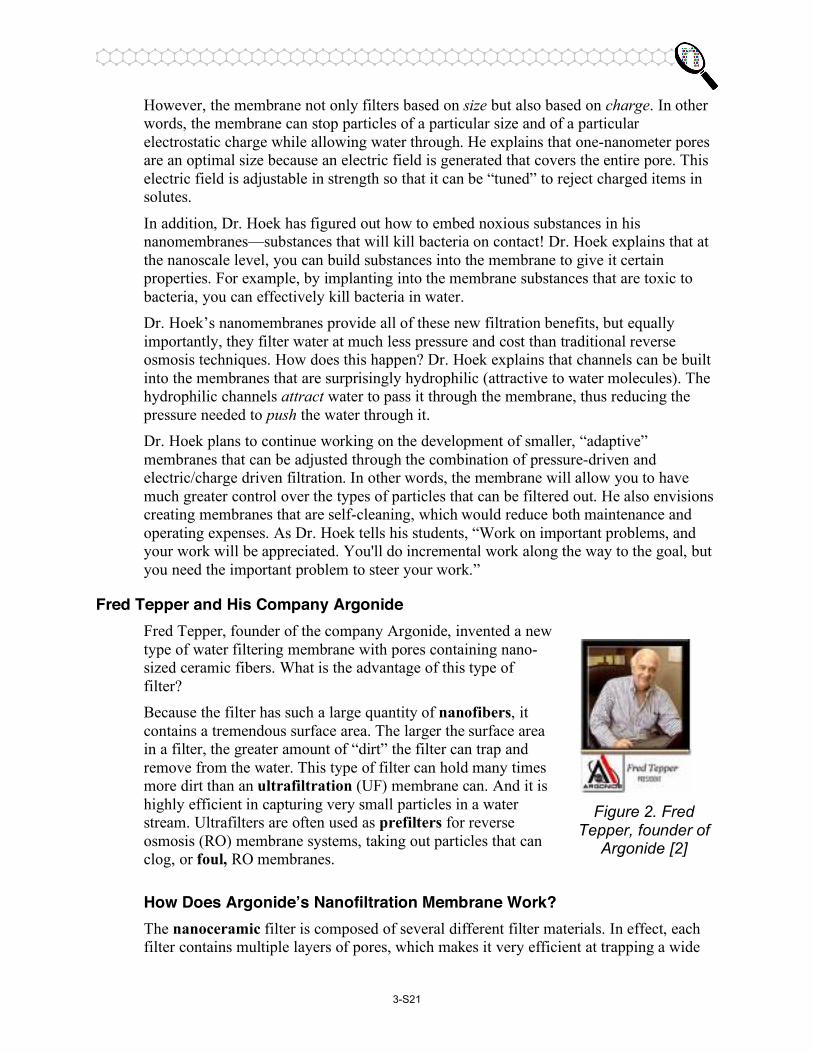
Fred Tepper and His Company Argonide Fred Tepper, founder of the company Argonide, invented a new type of water filtering membrane with pores containing nano-sized ceramic fibers. What is the advantage of this type of filter? Because the filter has such a large quantity of nanofibers, it contains a tremendous surface area. The larger the surface area in a filter, the greater amount of “dirt” the filter can trap and remove from the water. This type of filter can hold many times more dirt than an ultrafiltration (UF) membrane can. And it is highly efficient in capturing very small particles in a water stream. Ultrafilters are often used as prefilters for reverse osmosis (RO) membrane systems, taking out particles that can clog, or foul, RO membranes.
Figure 2. Fred Tepper, founder of
Argonide [2]
How Does Argonide’s Nanofiltration Membrane Work? The nanoceramic filter is composed of several different filter materials. In effect, each filter contains multiple layers of pores, which makes it very efficient at trapping a wide
3-S21

variety of particle sizes through a nanoscale adhesion process (nanoadhesion). The filter is completely lined with an alumina-based material which, when reduced to nano-sized fibers, gives the fiber surfaces a very strong positive charge. Negatively-charged particles, like salts or ions that need to be removed from water, are attracted to the positively-charged fiber surfaces and are effectively removed from the water. Nanoceramic filters can sustain high water-flow rates, and are very good at capturing small particles. In traditional filtration, to capture smaller particles, you need smaller pores in the filter. However, with the electroadhesive properties of nanoceramic filters, particles are attracted to and captured by the positive charges on the filter surfaces. For standard filters to approach the efficiency of nanoceramic filters, they must typically use a smaller pore size. This smaller pore size leads to increased clogging (fouling) of the pores and a lower flow rate of water compared to the nanoceramic filters.
Nanoceramic filters act as prefilters to reverse osmosis membranes since they are able to filter out particles that would typically harm or foul RO membranes. This allows the RO membrane to do what it does best: remove salt ions from water. The RO membrane will last much longer if it doesn’t have to trap bigger particles, and it will need fewer maintenance/cleaning cycles, which can extend its lifetime. Thus even though the nanoceramic filter does not perform reverse osmosis, it contributes to a larger technology solution that makes RO less expensive.
References [1] http://www.cnsi.ucla.edu/institution/personnel?personnel_id=124316
[2] http://www.argonide.com/company.html
Glossary Term Definition
alumina A synthetically produced aluminum oxide (Al2O3)
desalination The process by which salt is removed from salt water (e.g. sea water) to make it drinkable.
electroadhesive Two substances adhere to each other by the attraction of opposite charges.
electroconductor A material that conducts electricity.
foul (fouling) The process in which the substance(s) being filtered out block the pores of a filter, making that filter unable to transport water.
nanoadhesion A process in which charged particles are (electrostatically) attracted to nanofibers that have been coated with a thin metallic film.
nanoceramic A ceramic (inorganic, nonmetallic material) that is synthesized from nano-sized powders.
3-S22

nanofibers Fibers with diameters less than 100 nanometers.
osmosis The passage of water through a semi-permeable membrane from a region of low solute concentration to a region of high solute concentration until equilibrium is reached.
polymer A long molecule that is made up of a chain of many small repeated units.
prefilter A filter that cleans small particles out of the water, thereby increasing the efficiency of the next, smaller filter.
reverse osmosis A method of producing pure water by forcing saline or impure water through a semi-permeable (selectively permeable) membrane across which salts or impurities cannot pass.
solute A substance that is dissolved in another substance (called the solvent) in a homogeneous mixture. For example in salt water the salt ions are the solute and the water is the solvent.
ultrafiltration Method for removing particles from water via a membrane filter. By applying pressure, water passes through this membrane.
3-S23
Name__________________________________ Date______________________ Period ______
Reflecting on the Guiding Questions: Student Worksheet Think about the activities you just completed. What did you learn that will help you answer the guiding questions? Jot down notes in the spaces below. 1. Why are water’s unique properties so important for life as we know it?
What I learned in these activities:
What I still want to know:
2. How do we make water safe to drink?
What I learned in these activities:
What I still want to know:
3. How can nanotechnology help provide unique solutions to the water shortage?
What I learned in these activities:
What I still want to know:
4. Can we solve our global water shortage problems? Why or why not?
What I learned in these activities:
What I still want to know:
3-S24