Embed Size (px)
Citation preview
Subscriber access provided by MINCyT
is published by the American Chemical Society. 1155 Sixteenth Street N.W.,Washington, DC 20036Published by American Chemical Society. Copyright © American Chemical Society.However, no copyright claim is made to original U.S. Government works, or worksproduced by employees of any Commonwealth realm Crown government in the courseof their duties.
Separations
Water defluoridation: nanofiltration vs membrane distillationLucia Moran, Marie Paquet, Katarzyna Janowska, Paul Jamard, Cejna Anna Quist-
Jensen, Gabriela Natalia Bosio, Daniel Mártire, Debora Fabbri, and Vittorio BoffaInd. Eng. Chem. Res., Just Accepted Manuscript • DOI: 10.1021/acs.iecr.8b03620 • Publication Date (Web): 10 Oct 2018
Downloaded from http://pubs.acs.org on October 12, 2018
Just Accepted
“Just Accepted” manuscripts have been peer-reviewed and accepted for publication. They are postedonline prior to technical editing, formatting for publication and author proofing. The American ChemicalSociety provides “Just Accepted” as a service to the research community to expedite the disseminationof scientific material as soon as possible after acceptance. “Just Accepted” manuscripts appear infull in PDF format accompanied by an HTML abstract. “Just Accepted” manuscripts have been fullypeer reviewed, but should not be considered the official version of record. They are citable by theDigital Object Identifier (DOI®). “Just Accepted” is an optional service offered to authors. Therefore,the “Just Accepted” Web site may not include all articles that will be published in the journal. Aftera manuscript is technically edited and formatted, it will be removed from the “Just Accepted” Website and published as an ASAP article. Note that technical editing may introduce minor changesto the manuscript text and/or graphics which could affect content, and all legal disclaimers andethical guidelines that apply to the journal pertain. ACS cannot be held responsible for errors orconsequences arising from the use of information contained in these “Just Accepted” manuscripts.
brought to you by COREView metadata, citation and similar papers at core.ac.uk
provided by CONICET Digital
1
Water defluoridation: nanofiltration vs membrane distillation
Lucía I. Moran Ayala,1 Marie Paquet,2 Katarzyna Janowska,2 Paul Jamard,2 Cejna A. Quist-Jensen,2
Gabriela N. Bosio1, Daniel O. Mártire1, Debora Fabbri,3 Vittorio Boffa2,*
1Instituto de Investigaciones Fisicoquímicas Teóricas y Aplicadas (INIFTA), CONICET, Universidad
Nacional de La Plata, Diagonal 113 y calle 64, 1900, La Plata, Argentina.
2Department of Chemistry and Bioscience, Aalborg University, Fredrik Bajers vej 7H, 9220 Aalborg,
Denmark.
3Dipartimento di Chimica, Universitá di Torino, Via P. Giuria 5, 10125 Torino, Italy.
*Correspoinding author: Vittorio Boffa, e-mail: [email protected]
Page 1 of 37
ACS Paragon Plus Environment
Industrial & Engineering Chemistry Research
123456789101112131415161718192021222324252627282930313233343536373839404142434445464748495051525354555657585960
2
Abstract
Nowadays fluoride contamination of drinking water is a major problem for various countries, because
high concentrations of fluoride pose a risk of dental and skeletal fluorosis. Over the past years,
membrane nanofiltration (NF) has been proposed as convenient defluoridation technology. However,
NF cannot be applied to water systems with high fluoride concentration and the disposal of the
membrane concentrate remains an issue. In this work, we compared a commercial polyester NF
membrane and a polypropylene hollow-fiber membrane distillation (MD) module for their ability to
remove fluoride ions from water in the presence of hardness ions and organic fouling agents. The NF
membrane can offer more than 10 times higher water productivity than MD, under realistic gradients
of temperature and pressure, respectively. Despite that, after reaching a concentration factor of about
3, fouling and scaling caused the flux to drop to about 80 % respect to its initial value. Moreover, F-
retention decreased from 90% to below 80%, thus providing a permeate of scarce quality. MD was
operated in the direct-contact mode on a polypropylene hollow-fiber membrane, which was charged
with a hot feed flow (average T = 58 ºC) on one side and a cooled (20 ºC) permeate flow of distilled
water on the other side. The concentration of fluoride ion in the permeate was always below the
detection limit of our electrode (0.2 ppm), regardless of the fluoride concentration in the feed.
Moreover, the MD module showed higher resistance to fouling and scaling than NF and CaF2 crystals
were recovered from the MD concentrate after cooling. These results suggest that the synergic
combination of the two techniques might be beneficial for the purification of fluoride-contaminated
water systems: MD can be used to further concentrate the NF retentate, thus producing high-purity
water and recovering CaF2 crystals.
Keywords: membrane separation; distillation; fouling; scaling; fluorite crystallization.
Page 2 of 37
ACS Paragon Plus Environment
Industrial & Engineering Chemistry Research
123456789101112131415161718192021222324252627282930313233343536373839404142434445464748495051525354555657585960
3
Introduction
Contamination of drinking water by fluoride is associated with health hazards such as dental and
skeletal fluorosis.1,2 High fluoride concentration in natural water can be caused by geogenic sources (as
leaching of fluorine-containing minerals in rocks and sediments) and anthropogenic sources, mainly
due to the use of pesticides and to industrial activities. Thus, nowadays fluoride contamination of
drinking water is a major problem for various countries,3 including Argentina, Mexico, United States,
Middle East countries, China and India. World Health Organization (WHO) indicates the limits of
fluoride concentration in drinking water between 0.5 and 1.0 mg L-1 and recommends setting local
guidelines at a concentration lower than 1.5 mg L-1.4,5 Hence, various technologies have been proposed
for the abatement and the control of fluoride,6 such as adsorption, ion exchange, chemical precipitation,
and a range of membrane processes encompassing reverse osmosis (RO), nanofiltration (NF),
electrodialysis, and really recently membrane distillation (MD). Efficiency and productivity of these
processes is governed by different factors, such as raw water characteristics, pressure, temperature, etc.
One of the emerging processes is NF, which has been applied to water defluoridation with
promising results at laboratory and pilot scale, over the last decade.7-20 NF is a pressure-driven process,
in which the contaminants are removed by a water-permeable membrane. NF membranes have
typically 1-2 nm diameter pores, that is, larger than the size of hydrated ions (e.g. the effective size of
hydrated fluoride21-23 ions is ~0.3 nm). Therefore, their selectivity depends on a combination of steric
and charge interactions,24-26 which allow removing hardness ions and reducing the concentration of
monovalent ions (as fluoride). NF membranes have lower ion rejection than reverse osmosis (RO)
membranes, but can offer several advantages, such as low operating pressure, high permeability and
relatively low costs of investment, operation and maintenance.26,27 The two main drawbacks of NF
membranes are the following: (i) the quality of the produced water is affected by the fluoride
Page 3 of 37
ACS Paragon Plus Environment
Industrial & Engineering Chemistry Research
123456789101112131415161718192021222324252627282930313233343536373839404142434445464748495051525354555657585960
4
concentration in the feed; (ii) their productivity is reduced by concentration-polarization phenomena. In
short, due to the water permeation, salt concentration increases in the vicinity of the membrane surface,
thus resulting in an increased salt concentration in the permeate, which corresponds to a decrease in the
observed retention. Moreover, scaling and fouling require frequent backwashing and cleaning at the
detriment of membrane service time and productivity.
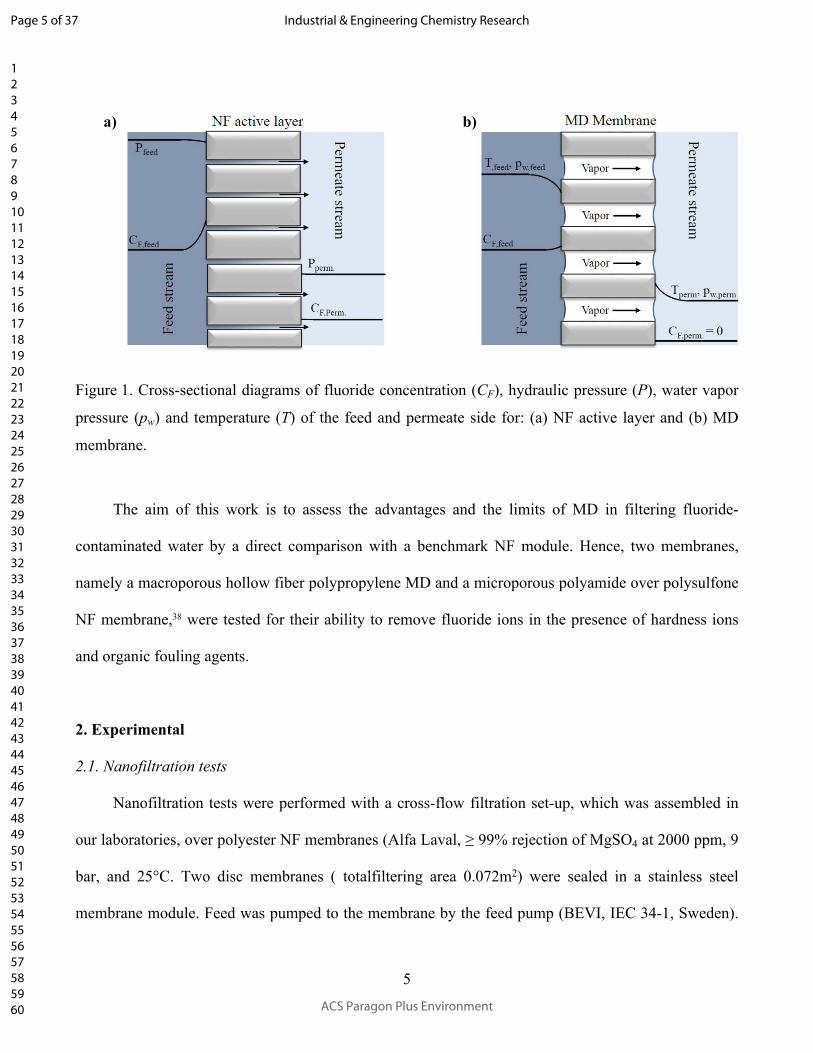
In this context, membrane distillation (MD) has been recently proposed as a possible alternative
to NF and RO in desalination28,29 and defluoridation30-32 processes. The cross-sectional diagrams of NF
and MD are depicted in Figure 1, in order to stress the main differences between the two processes.
MD is an emerging technology, which is based on the transport of water vapor through a hydrophobic
macroporous membrane. In this case, membrane pores have a size, which is two orders of magnitude
larger than the hydrated ions, thus size exclusion and charge interaction do not contribute to the
separation mechanism. Indeed, the distillation membrane acts as a barrier between the hot polluted
solution and the cold permeate.33-35 Due to its hydrophobic properties, the membrane is not permeable
to water in liquid state, but allows for steam permeation. Mass and heat transfer mechanisms govern
steam flux from the hot feed to the cold permeate side of the membrane. The main advantage of MD is
the ability to operate at a lower operating feed temperature than conventional distillation and a much
lower hydrostatic pressure than NF and RO.36 Moreover, MD permeability and selectivity are both
negligibly affected by the increase of osmotic pressure and concentration polarization phenomena
during the feed concentration.37 On the other hand, temperature polarization has a negative impact on
the water productivity of MD systems.
Page 4 of 37
ACS Paragon Plus Environment
Industrial & Engineering Chemistry Research
123456789101112131415161718192021222324252627282930313233343536373839404142434445464748495051525354555657585960
5
Figure 1. Cross-sectional diagrams of fluoride concentration (CF), hydraulic pressure (P), water vapor
pressure (pw) and temperature (T) of the feed and permeate side for: (a) NF active layer and (b) MD
membrane.
The aim of this work is to assess the advantages and the limits of MD in filtering fluoride-
contaminated water by a direct comparison with a benchmark NF module. Hence, two membranes,
namely a macroporous hollow fiber polypropylene MD and a microporous polyamide over polysulfone
NF membrane,38 were tested for their ability to remove fluoride ions in the presence of hardness ions
and organic fouling agents.
2. Experimental
2.1. Nanofiltration tests
Nanofiltration tests were performed with a cross-flow filtration set-up, which was assembled in
our laboratories, over polyester NF membranes (Alfa Laval, ≥ 99% rejection of MgSO4 at 2000 ppm, 9
bar, and 25°C. Two disc membranes ( totalfiltering area 0.072m2) were sealed in a stainless steel
membrane module. Feed was pumped to the membrane by the feed pump (BEVI, IEC 34-1, Sweden).
a) b)
Page 5 of 37
ACS Paragon Plus Environment
Industrial & Engineering Chemistry Research
123456789101112131415161718192021222324252627282930313233343536373839404142434445464748495051525354555657585960
6
Permeate mass flow was measured by a balance. Feed pressure was measured before and after the
membrane by two pressure transmitters (Danfoss, MBS 4010, Denmark) and an electronic heat sensor
(Kamstrup A/S, Denmark) measured feed temperature before membrane module. A rotary lobe pump
(Philipp Hilge Gmbh & Co, Novalobe, Germany) controlled the cross-flow rate measured by a
microprocessor-based flow rate transmitter (Siemens, MAG 50000). It was adjusted to be 0.17 L s-1 for
all the experiments. The flow rate of the retentate stream was controlled by a manual valve (Nupro ®).
An Agilent ATR FT-IR 630 spectrophotometer with a spectral range 5100-640 cm-1 was employed to
analyze the NF membrane after being in contact with humic substances. The spectral resolution of the
equipment is lower than 2 cm-1 and its precision is 0.05 cm-1.
2.2 Membrane distillation tests
Membrane distillation tests were performed on a set-up, which is illustrated elsewhere.50 The
feed was pumped (Cole-Parmer Masterflex L/S) to a heater (Haake K20) and afterwards into the lumen
side of the membrane module, and then it returned to a feed tank. The permeate was pumped (Cole-
Parmer Masterflex L/S) to a cooler (Julabo FP50) and into the module in the shell side in
countercurrent flow with respect to the feed. The increase of permeate volume was scrutinized by a
balance (A&D Company Limited FZ-300i). The temperature was monitored in feed and permeate at
inlet and outlet of the module (Ludwig Schneider, Type 13100). The membrane module used for all
experiments was made using Membrana Accurel® PP S6/2 hollow fiber membranes. The outer
diameter of the hollow fiber was 2.5 mm, inner diameter was 1.6 mm and thickness was 0.45 mm. The
porosity of the membranes was 73% with a pore size of 0.2 μm. The total membrane surface area of the
5 fibers was 0.010 m2.
Page 6 of 37
ACS Paragon Plus Environment
Industrial & Engineering Chemistry Research
123456789101112131415161718192021222324252627282930313233343536373839404142434445464748495051525354555657585960
7
2.3 Feed solutions and water analysis
Pure water permeability was measured by filtering deionized water Milli-Q produced (Resistivity
> 18 MΩ cm). For NF and MD tests a model fluoride water solution was prepared and analyzed as
follow. A Thermo Scientific™ Dionex™ ED40 instrument equipped with a conductimeter detector was
used to measure the anion concentration. Anions were analyzed with an AS9HC column and a K2CO3
solution (9 mM) as eluent at a flow rate of 1 mL min-1. A PerkinElmer® Optima 7000 DV ICP-Optical
Emission Spectrometer (Shelton, CT, USA) equipped with WinLab™ 32 for ICP Version 4.0 software
was used for measurement of cations. Conductivity was measured with SevenMultiTM S70-K
benchtop (± 0.5% accuracy). Fluoride concentration was measured with a fluoride selective electrode
model FOO1503 (Van London, Phoenix). The X-rays diffraction (XRD) patterns of the filtered MD
concentrate was acquired over a PANanalytical Empyrean diffractometer, operating at 45 kV and 40
mA, with Cu Kα radiation. The composition in Table 1 was used to simulate precipitation of salts
during the concentration of the polluted feed water. The precipitation was simulated through the
geochemical software PHREEQC interactive-version 3.39 A so-called “REACTION” feature in the
software was utilized to remove a specified amount of water in a given number of steps. The output of
the software provides information on which salts that precipitates and in which amounts, etc.
Temperature, pH and redox potential of the polluted water in the simulations has been assumed to 25
°C, 6.9 and 4 pe, respectively.
3. Results and discussion
3.1. Water productivity
Page 7 of 37
ACS Paragon Plus Environment
Industrial & Engineering Chemistry Research
123456789101112131415161718192021222324252627282930313233343536373839404142434445464748495051525354555657585960
8
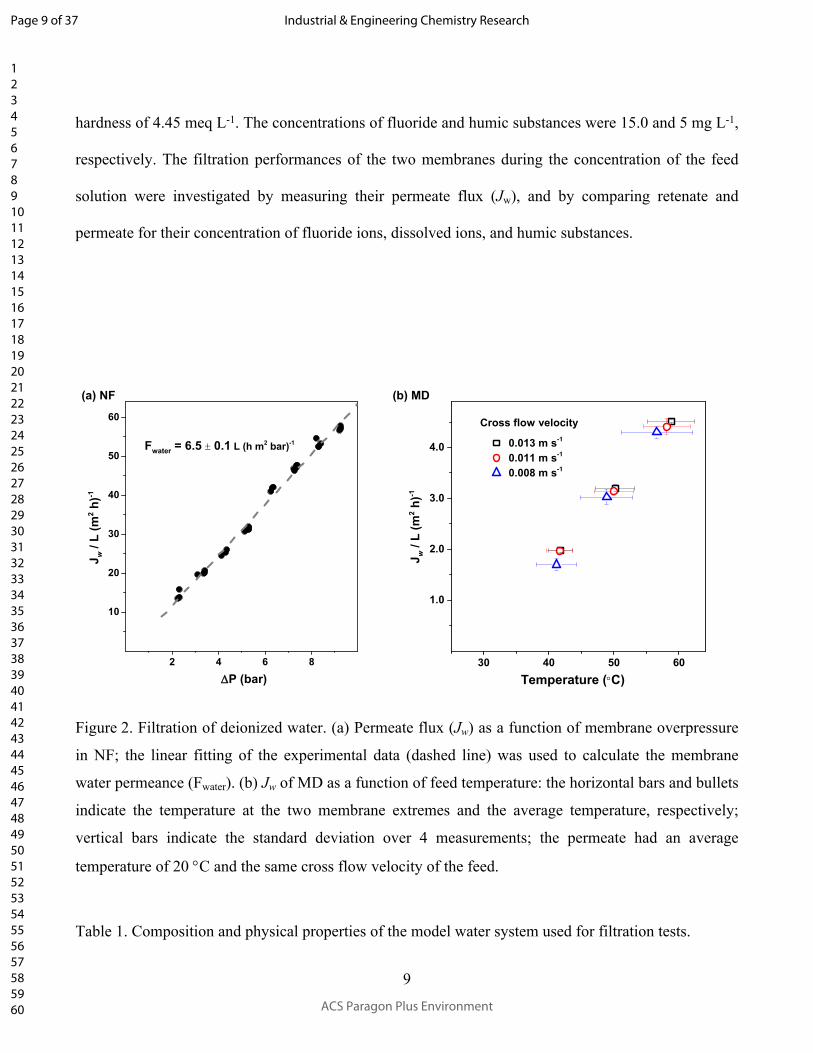
Figure 2 allows comparing the permeate flux (JW, L m-2 h-1) of the NF and MD membranes, when
deionized water (resistivity ≥ 18 MΩ cm) is filtered at realistic gradients of pressure and temperature,
respectively. A water permeability of 6.5 ± 0.1 L (m2 h bar)-1 for the NF membrane was measured by
fitting the experimental data in Figure 2a. This value is consistent with the water permeability reported
in literature for the other commercial NF membranes,40-48 thus making this module a good basis of
comparison for the MD membrane. The water fluxes achieved by the MD membrane (Figure 2b) range
between 2 and 4.5 L (m2 h)-1 and are also in line with the literature values.49 In general, the permeate
flux can be increased by increasing the temperature gradient i.e. the vapor pressure gradient across the
membrane. Increasing the crossflow velocity also results in an increased flux, due to the smaller
temperature drop along the membrane fiber (horizontal lines in Figure 2b). At an average feed
temperature of 58 C and permeate temperature of 20 C the MD membrane can produce a flux of 4.5
L (m2 h)-1, while the NF membrane has a water flux of about 60 L (m2 h)-1 at a transmembrane pressure
(P) of 9 bar. Therefore, the MD membrane permits to obtain water fluxes, which are one order of
magnitude lower than those achieved by NF, i.e. the MD membrane requires more than 10 times larger
area to filter the same amount of water than its NF counterpart does.
Nevertheless, real water systems are complex mixtures of inorganic ions, organic molecules and
often contain biological materials. Therefore, the two membranes should be compared for their
permeability and their selectivity towards fluoride ions, in such type of systems. Moreover, they should
be able to maintain their perm-selectivity during filtration. For this reason, a model water system
simulating fluoride-contaminated water was prepared and filtered over both the commercial NF
membrane and the MD membrane. The chemical and physical properties of this water system are
reported in Table 1. Such water system had a total conductivity of 0.54 mS cm-1, pH 6.9, and a total
Page 8 of 37
ACS Paragon Plus Environment
Industrial & Engineering Chemistry Research
123456789101112131415161718192021222324252627282930313233343536373839404142434445464748495051525354555657585960
9
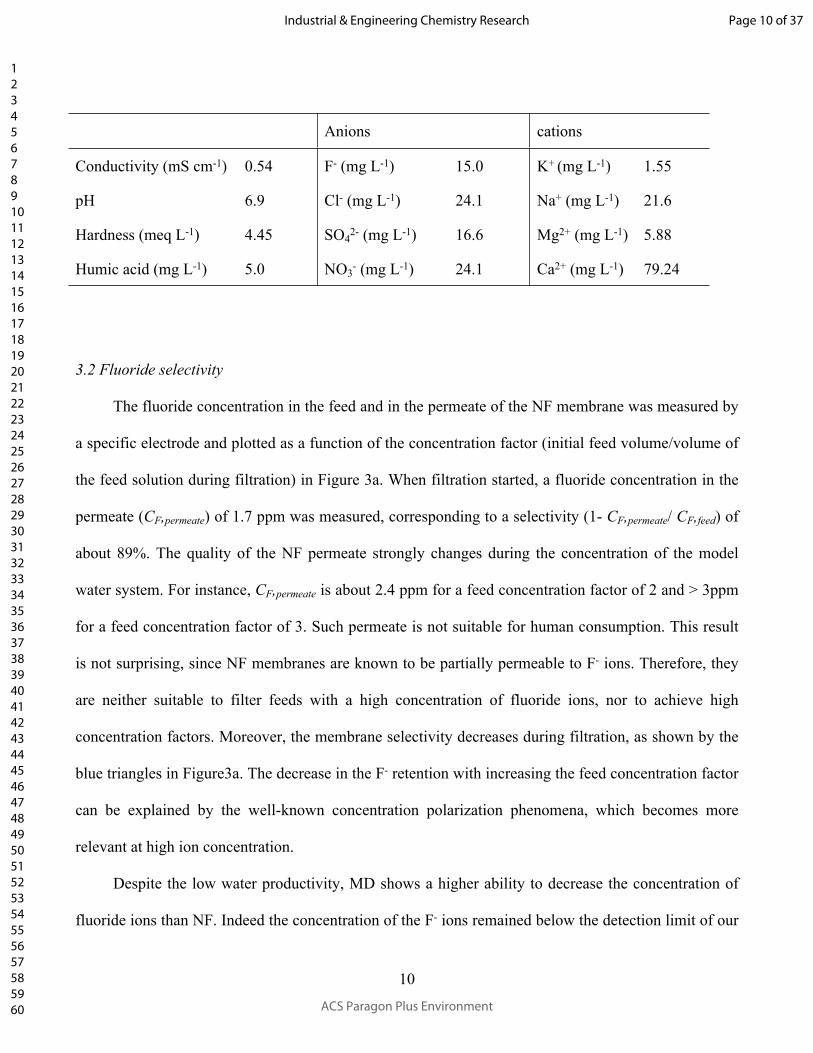
hardness of 4.45 meq L-1. The concentrations of fluoride and humic substances were 15.0 and 5 mg L-1,
respectively. The filtration performances of the two membranes during the concentration of the feed
solution were investigated by measuring their permeate flux (Jw), and by comparing retenate and
permeate for their concentration of fluoride ions, dissolved ions, and humic substances.
30 40 50 60
1.0
2.0
3.0
4.0
2 4 6 8
10
20
30
40
50
60
Temperature (C)
0.013 m s-1
0.011 m s-1
0.008 m s-1
Cross flow velocity J
w /
L (m
2 h)-1
Jw /
L (m
2 h)-1
Fwater = 6.5 0.1 L (h m2 bar)-1
P (bar)
(a) NF (b) MD
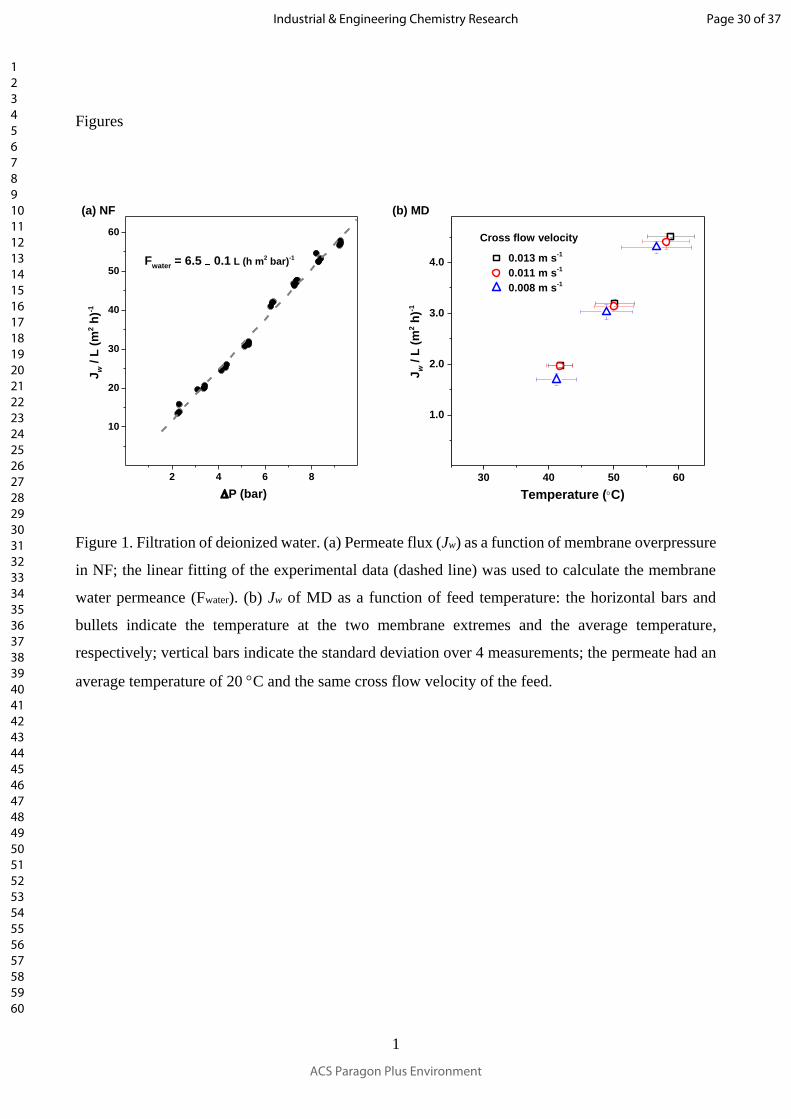
Figure 2. Filtration of deionized water. (a) Permeate flux (Jw) as a function of membrane overpressure
in NF; the linear fitting of the experimental data (dashed line) was used to calculate the membrane
water permeance (Fwater). (b) Jw of MD as a function of feed temperature: the horizontal bars and bullets
indicate the temperature at the two membrane extremes and the average temperature, respectively;
vertical bars indicate the standard deviation over 4 measurements; the permeate had an average
temperature of 20 C and the same cross flow velocity of the feed.
Table 1. Composition and physical properties of the model water system used for filtration tests.
Page 9 of 37
ACS Paragon Plus Environment
Industrial & Engineering Chemistry Research
123456789101112131415161718192021222324252627282930313233343536373839404142434445464748495051525354555657585960
10
Anions cations
Conductivity (mS cm-1) 0.54 F- (mg L-1) 15.0 K+ (mg L-1) 1.55
pH 6.9 Cl- (mg L-1) 24.1 Na+ (mg L-1) 21.6
Hardness (meq L-1) 4.45 SO42- (mg L-1) 16.6 Mg2+ (mg L-1) 5.88
Humic acid (mg L-1) 5.0 NO3- (mg L-1) 24.1 Ca2+ (mg L-1) 79.24
3.2 Fluoride selectivity
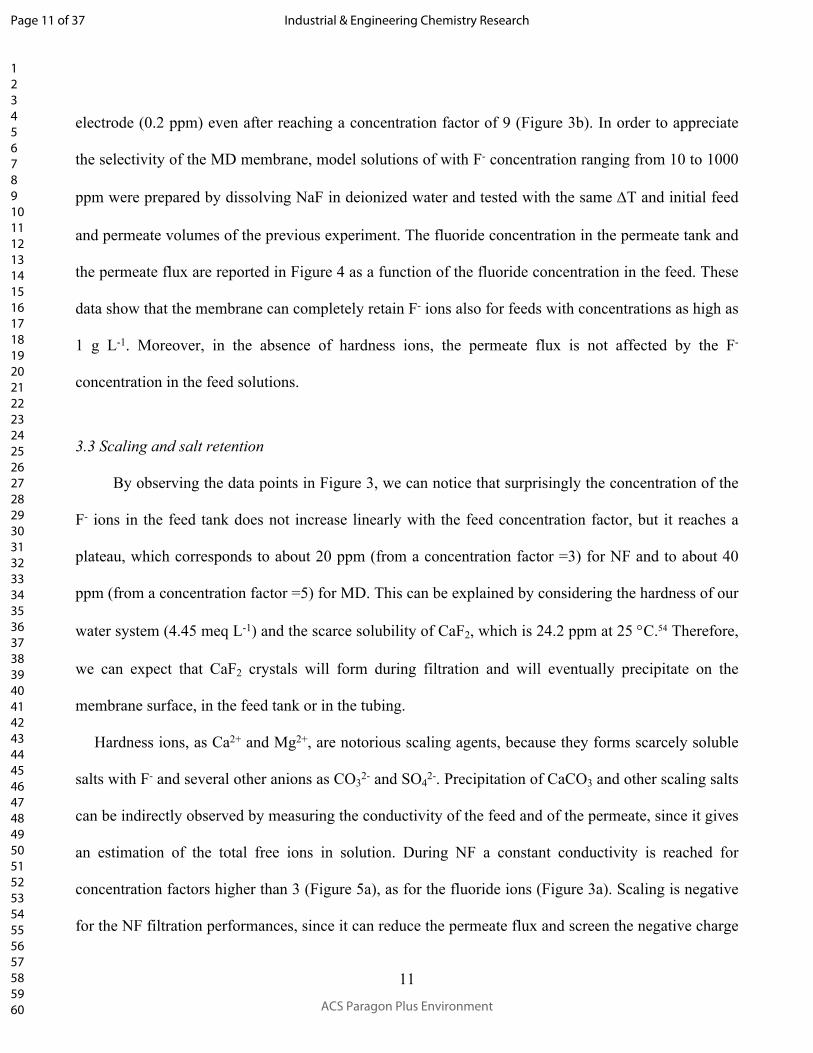
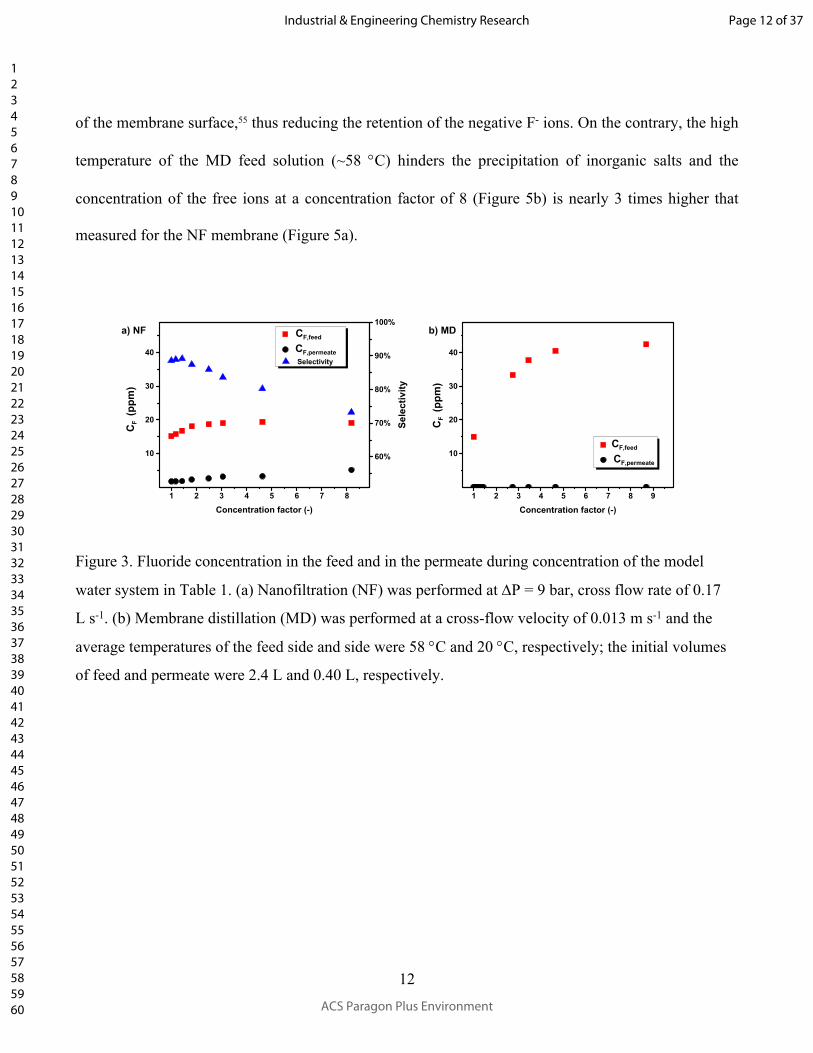
The fluoride concentration in the feed and in the permeate of the NF membrane was measured by
a specific electrode and plotted as a function of the concentration factor (initial feed volume/volume of
the feed solution during filtration) in Figure 3a. When filtration started, a fluoride concentration in the
permeate (CF,permeate) of 1.7 ppm was measured, corresponding to a selectivity (1- CF,permeate/ CF,feed) of
about 89%. The quality of the NF permeate strongly changes during the concentration of the model
water system. For instance, CF,permeate is about 2.4 ppm for a feed concentration factor of 2 and > 3ppm
for a feed concentration factor of 3. Such permeate is not suitable for human consumption. This result
is not surprising, since NF membranes are known to be partially permeable to F- ions. Therefore, they
are neither suitable to filter feeds with a high concentration of fluoride ions, nor to achieve high
concentration factors. Moreover, the membrane selectivity decreases during filtration, as shown by the
blue triangles in Figure3a. The decrease in the F- retention with increasing the feed concentration factor
can be explained by the well-known concentration polarization phenomena, which becomes more
relevant at high ion concentration.
Despite the low water productivity, MD shows a higher ability to decrease the concentration of
fluoride ions than NF. Indeed the concentration of the F- ions remained below the detection limit of our
Page 10 of 37
ACS Paragon Plus Environment
Industrial & Engineering Chemistry Research
123456789101112131415161718192021222324252627282930313233343536373839404142434445464748495051525354555657585960
11
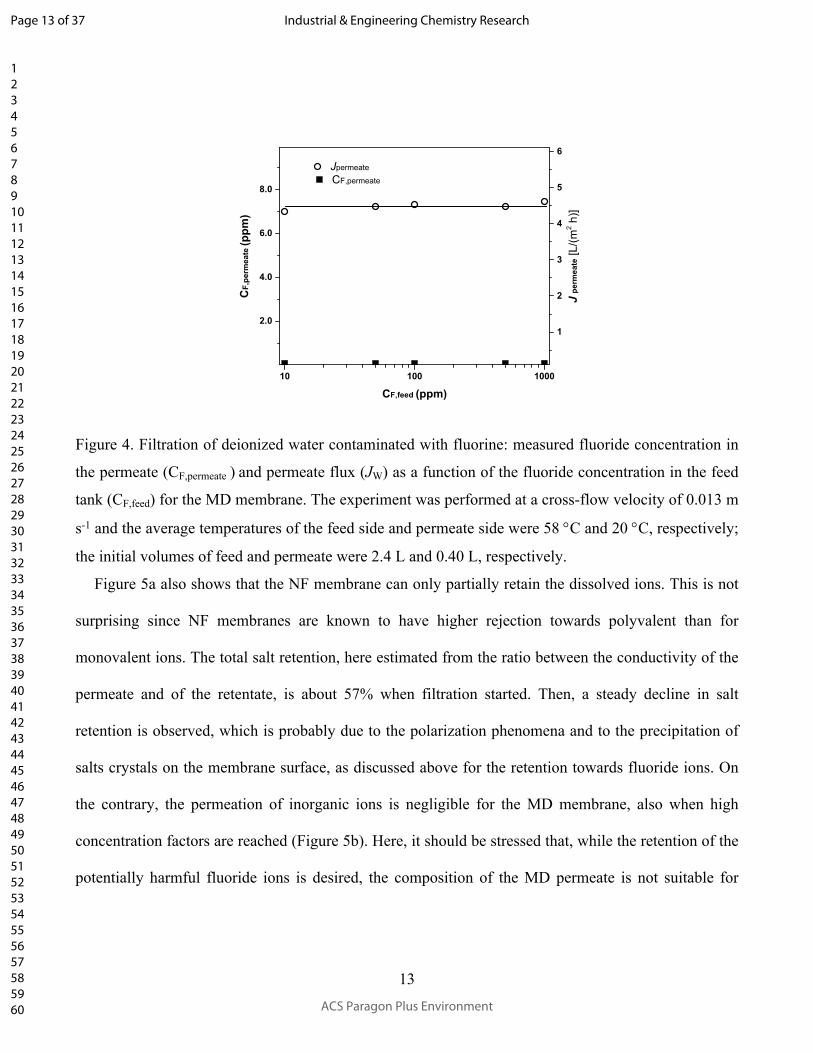
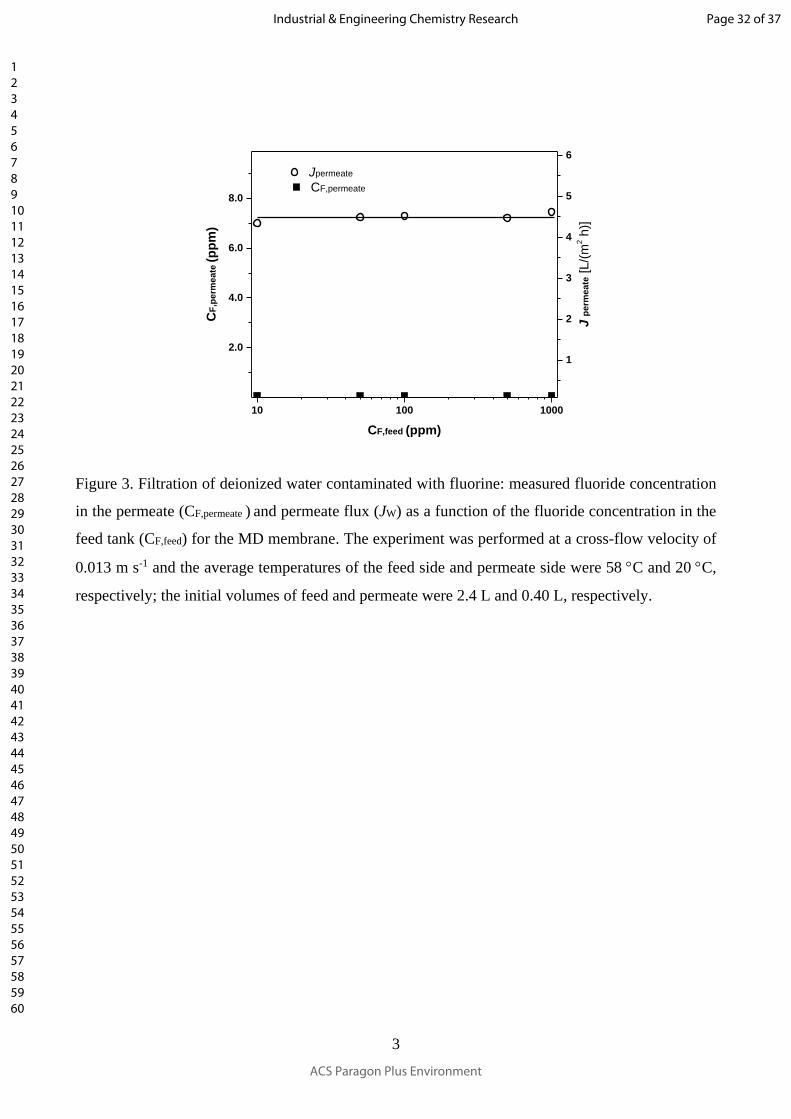
electrode (0.2 ppm) even after reaching a concentration factor of 9 (Figure 3b). In order to appreciate
the selectivity of the MD membrane, model solutions of with F- concentration ranging from 10 to 1000
ppm were prepared by dissolving NaF in deionized water and tested with the same T and initial feed
and permeate volumes of the previous experiment. The fluoride concentration in the permeate tank and
the permeate flux are reported in Figure 4 as a function of the fluoride concentration in the feed. These
data show that the membrane can completely retain F- ions also for feeds with concentrations as high as
1 g L-1. Moreover, in the absence of hardness ions, the permeate flux is not affected by the F-
concentration in the feed solutions.
3.3 Scaling and salt retention
By observing the data points in Figure 3, we can notice that surprisingly the concentration of the
F- ions in the feed tank does not increase linearly with the feed concentration factor, but it reaches a
plateau, which corresponds to about 20 ppm (from a concentration factor =3) for NF and to about 40
ppm (from a concentration factor =5) for MD. This can be explained by considering the hardness of our
water system (4.45 meq L-1) and the scarce solubility of CaF2, which is 24.2 ppm at 25 C.54 Therefore,
we can expect that CaF2 crystals will form during filtration and will eventually precipitate on the
membrane surface, in the feed tank or in the tubing.
Hardness ions, as Ca2+ and Mg2+, are notorious scaling agents, because they forms scarcely soluble
salts with F- and several other anions as CO32- and SO4
2-. Precipitation of CaCO3 and other scaling salts
can be indirectly observed by measuring the conductivity of the feed and of the permeate, since it gives
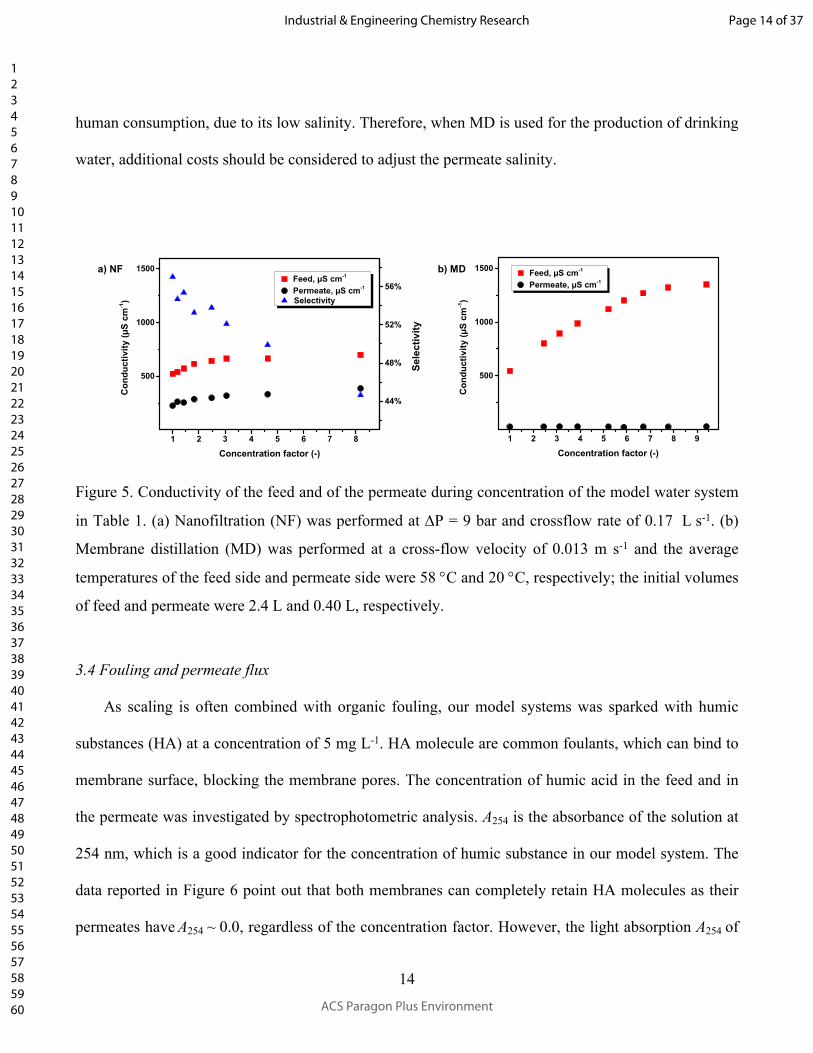
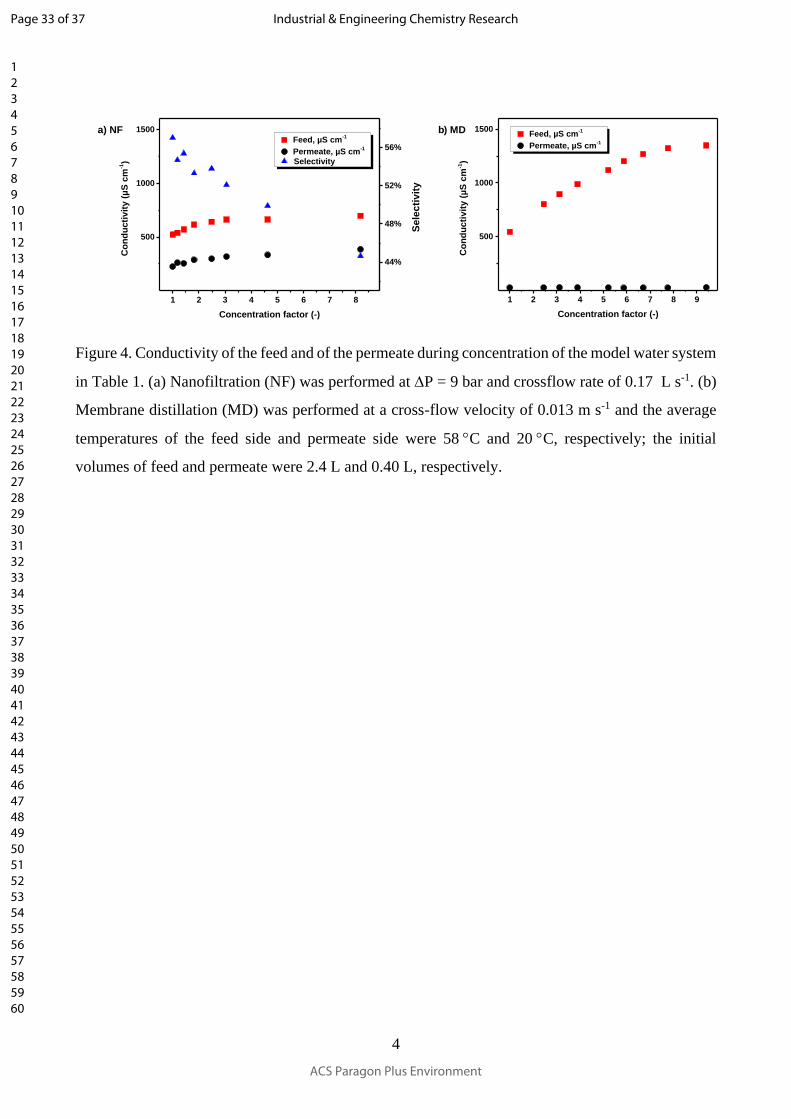
an estimation of the total free ions in solution. During NF a constant conductivity is reached for
concentration factors higher than 3 (Figure 5a), as for the fluoride ions (Figure 3a). Scaling is negative
for the NF filtration performances, since it can reduce the permeate flux and screen the negative charge
Page 11 of 37
ACS Paragon Plus Environment
Industrial & Engineering Chemistry Research
123456789101112131415161718192021222324252627282930313233343536373839404142434445464748495051525354555657585960
12
of the membrane surface,55 thus reducing the retention of the negative F- ions. On the contrary, the high
temperature of the MD feed solution (~58 C) hinders the precipitation of inorganic salts and the
concentration of the free ions at a concentration factor of 8 (Figure 5b) is nearly 3 times higher that
measured for the NF membrane (Figure 5a).
1 2 3 4 5 6 7 8 9
10
20
30
40
1 2 3 4 5 6 7 8
10
20
30
40
CF,feed
CF,permeate
Concentration factor (-)
a) NF b) MD
CF (p
pm)
CF,feed
CF,permeate
CF (p
pm)
Concentration factor (-)
60%
70%
80%
90%
100%
Selectivity
Sele
ctiv
ity
Figure 3. Fluoride concentration in the feed and in the permeate during concentration of the model
water system in Table 1. (a) Nanofiltration (NF) was performed at P = 9 bar, cross flow rate of 0.17
L s-1. (b) Membrane distillation (MD) was performed at a cross-flow velocity of 0.013 m s-1 and the
average temperatures of the feed side and side were 58 C and 20 C, respectively; the initial volumes
of feed and permeate were 2.4 L and 0.40 L, respectively.
Page 12 of 37
ACS Paragon Plus Environment
Industrial & Engineering Chemistry Research
123456789101112131415161718192021222324252627282930313233343536373839404142434445464748495051525354555657585960
13
10 100 1000
2.0
4.0
6.0
8.0CF,permeate
CF,
perm
eate
(ppm
)
CF,feed (ppm)
1
2
3
4
5
6Jpermeate
J pe
rmea
te[L
/(m2 h
)]
Figure 4. Filtration of deionized water contaminated with fluorine: measured fluoride concentration in
the permeate (CF,permeate ) and permeate flux (JW) as a function of the fluoride concentration in the feed
tank (CF,feed) for the MD membrane. The experiment was performed at a cross-flow velocity of 0.013 m
s-1 and the average temperatures of the feed side and permeate side were 58 C and 20 C, respectively;
the initial volumes of feed and permeate were 2.4 L and 0.40 L, respectively.
Figure 5a also shows that the NF membrane can only partially retain the dissolved ions. This is not
surprising since NF membranes are known to have higher rejection towards polyvalent than for
monovalent ions. The total salt retention, here estimated from the ratio between the conductivity of the
permeate and of the retentate, is about 57% when filtration started. Then, a steady decline in salt
retention is observed, which is probably due to the polarization phenomena and to the precipitation of
salts crystals on the membrane surface, as discussed above for the retention towards fluoride ions. On
the contrary, the permeation of inorganic ions is negligible for the MD membrane, also when high
concentration factors are reached (Figure 5b). Here, it should be stressed that, while the retention of the
potentially harmful fluoride ions is desired, the composition of the MD permeate is not suitable for
Page 13 of 37
ACS Paragon Plus Environment
Industrial & Engineering Chemistry Research
123456789101112131415161718192021222324252627282930313233343536373839404142434445464748495051525354555657585960
14
human consumption, due to its low salinity. Therefore, when MD is used for the production of drinking
water, additional costs should be considered to adjust the permeate salinity.
1 2 3 4 5 6 7 8
500
1000
1500
1 2 3 4 5 6 7 8 9
500
1000
1500a) NF b) MDFeed, µS cm-1
Permeate, µS cm-1
Con
duct
ivity
(µS
cm-1)
Concentration factor (-)
Feed, µS cm-1
Permeate, µS cm-1
Con
duct
ivity
(µS
cm-1)
Concentration factor (-)
44%
48%
52%
56%Selectivity
Sele
ctiv
ity
Figure 5. Conductivity of the feed and of the permeate during concentration of the model water system
in Table 1. (a) Nanofiltration (NF) was performed at P = 9 bar and crossflow rate of 0.17 L s-1. (b)
Membrane distillation (MD) was performed at a cross-flow velocity of 0.013 m s-1 and the average
temperatures of the feed side and permeate side were 58 C and 20 C, respectively; the initial volumes
of feed and permeate were 2.4 L and 0.40 L, respectively.
3.4 Fouling and permeate flux
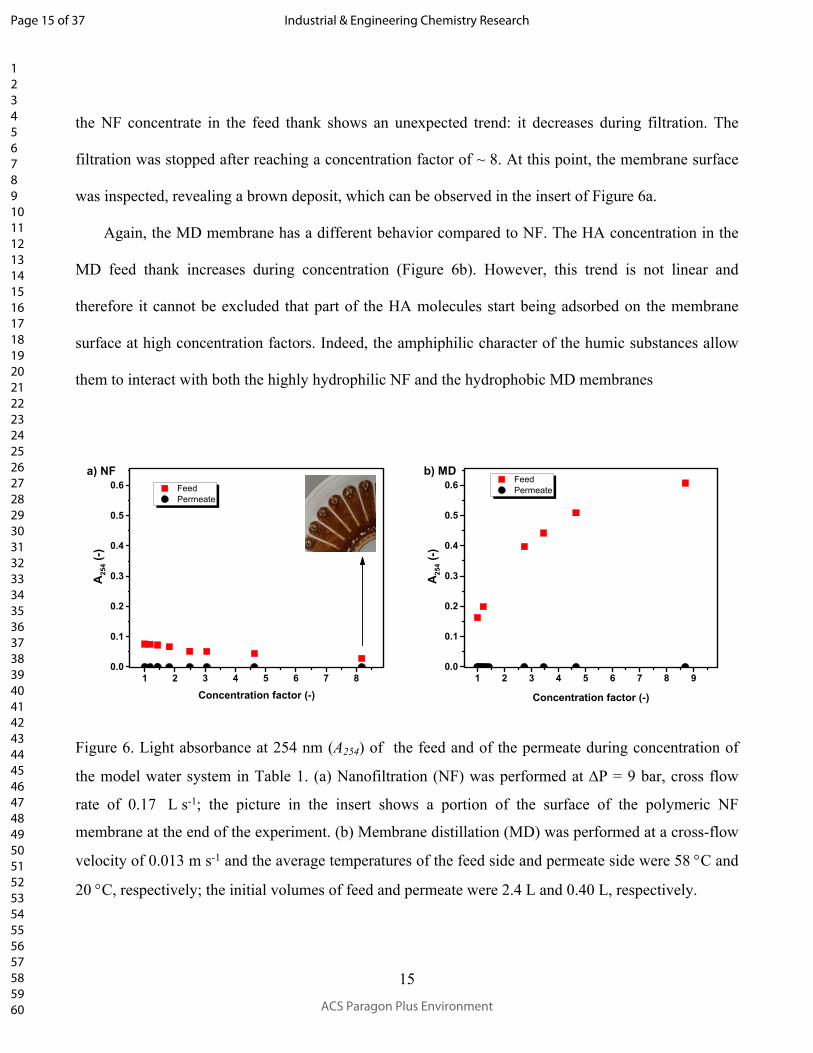
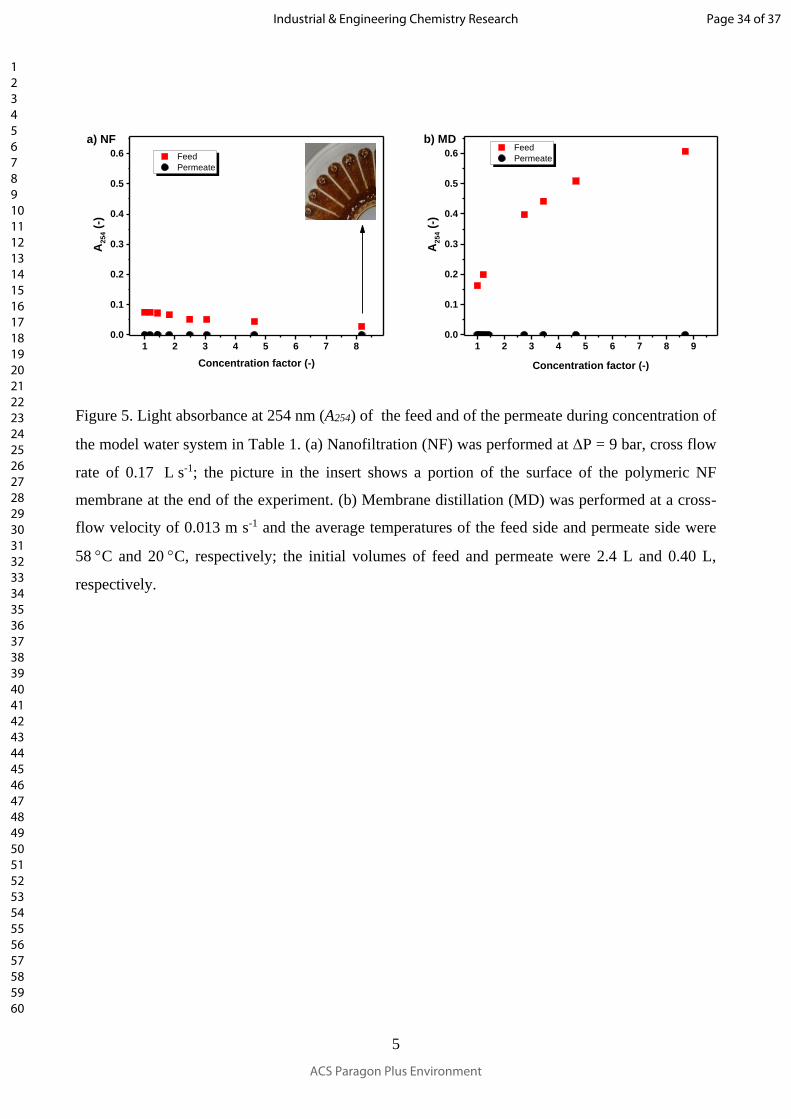
As scaling is often combined with organic fouling, our model systems was sparked with humic
substances (HA) at a concentration of 5 mg L-1. HA molecule are common foulants, which can bind to
membrane surface, blocking the membrane pores. The concentration of humic acid in the feed and in
the permeate was investigated by spectrophotometric analysis. A254 is the absorbance of the solution at
254 nm, which is a good indicator for the concentration of humic substance in our model system. The
data reported in Figure 6 point out that both membranes can completely retain HA molecules as their
permeates have A254 ~ 0.0, regardless of the concentration factor. However, the light absorption A254 of
Page 14 of 37
ACS Paragon Plus Environment
Industrial & Engineering Chemistry Research
123456789101112131415161718192021222324252627282930313233343536373839404142434445464748495051525354555657585960
15
the NF concentrate in the feed thank shows an unexpected trend: it decreases during filtration. The
filtration was stopped after reaching a concentration factor of ~ 8. At this point, the membrane surface
was inspected, revealing a brown deposit, which can be observed in the insert of Figure 6a.
Again, the MD membrane has a different behavior compared to NF. The HA concentration in the
MD feed thank increases during concentration (Figure 6b). However, this trend is not linear and
therefore it cannot be excluded that part of the HA molecules start being adsorbed on the membrane
surface at high concentration factors. Indeed, the amphiphilic character of the humic substances allow
them to interact with both the highly hydrophilic NF and the hydrophobic MD membranes
1 2 3 4 5 6 7 80.0
0.1
0.2
0.3
0.4
0.5
0.6
1 2 3 4 5 6 7 8 90.0
0.1
0.2
0.3
0.4
0.5
0.6a) NF
FeedPermeate
A25
4 (-)
Concentration factor (-)
b) MDFeedPermeate
A25
4 (-)
Concentration factor (-)
Figure 6. Light absorbance at 254 nm (A254) of the feed and of the permeate during concentration of
the model water system in Table 1. (a) Nanofiltration (NF) was performed at P = 9 bar, cross flow
rate of 0.17 L s-1; the picture in the insert shows a portion of the surface of the polymeric NF
membrane at the end of the experiment. (b) Membrane distillation (MD) was performed at a cross-flow
velocity of 0.013 m s-1 and the average temperatures of the feed side and permeate side were 58 C and
20 C, respectively; the initial volumes of feed and permeate were 2.4 L and 0.40 L, respectively.
Page 15 of 37
ACS Paragon Plus Environment
Industrial & Engineering Chemistry Research
123456789101112131415161718192021222324252627282930313233343536373839404142434445464748495051525354555657585960
16
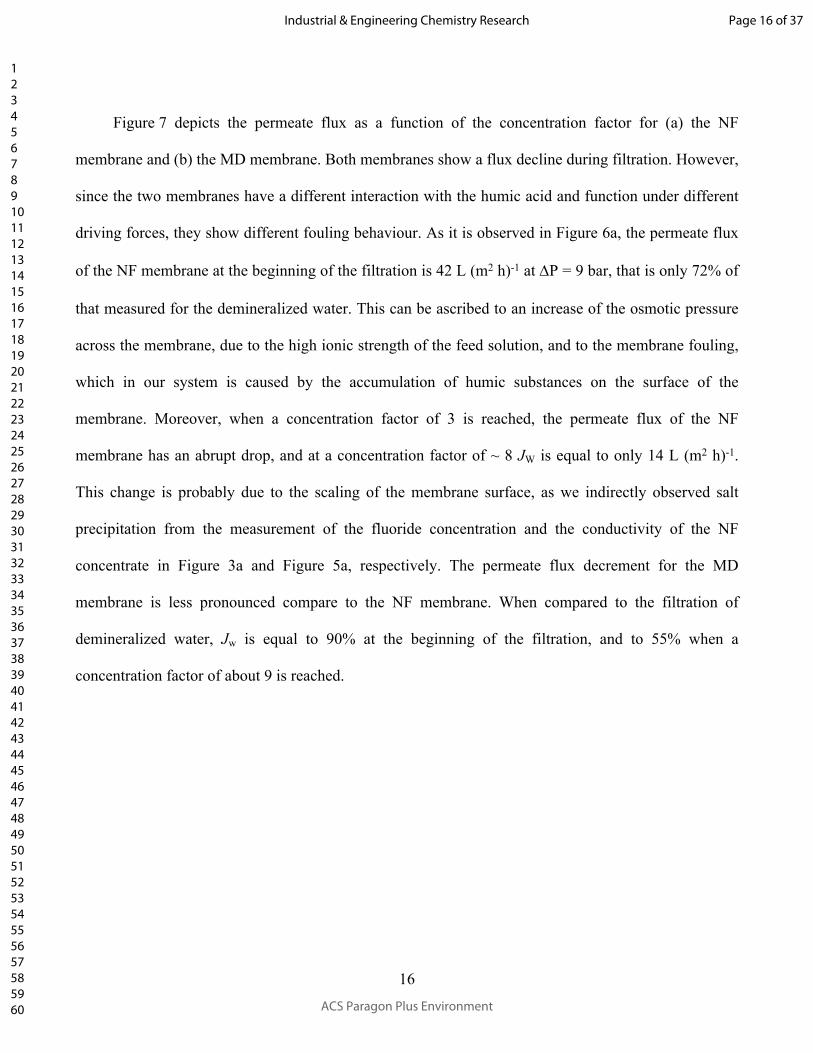
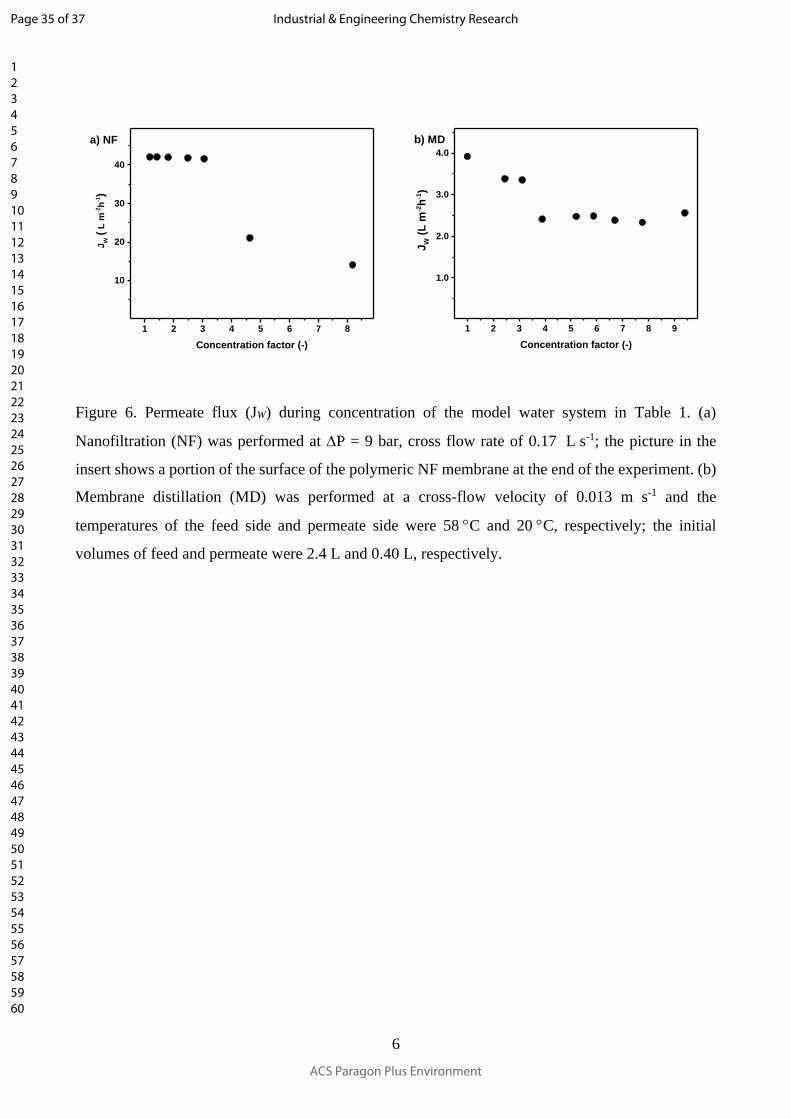
Figure 7 depicts the permeate flux as a function of the concentration factor for (a) the NF
membrane and (b) the MD membrane. Both membranes show a flux decline during filtration. However,
since the two membranes have a different interaction with the humic acid and function under different
driving forces, they show different fouling behaviour. As it is observed in Figure 6a, the permeate flux
of the NF membrane at the beginning of the filtration is 42 L (m2 h)-1 at P = 9 bar, that is only 72% of
that measured for the demineralized water. This can be ascribed to an increase of the osmotic pressure
across the membrane, due to the high ionic strength of the feed solution, and to the membrane fouling,
which in our system is caused by the accumulation of humic substances on the surface of the
membrane. Moreover, when a concentration factor of 3 is reached, the permeate flux of the NF
membrane has an abrupt drop, and at a concentration factor of ~ 8 JW is equal to only 14 L (m2 h)-1.
This change is probably due to the scaling of the membrane surface, as we indirectly observed salt
precipitation from the measurement of the fluoride concentration and the conductivity of the NF
concentrate in Figure 3a and Figure 5a, respectively. The permeate flux decrement for the MD
membrane is less pronounced compare to the NF membrane. When compared to the filtration of
demineralized water, Jw is equal to 90% at the beginning of the filtration, and to 55% when a
concentration factor of about 9 is reached.
Page 16 of 37
ACS Paragon Plus Environment
Industrial & Engineering Chemistry Research
123456789101112131415161718192021222324252627282930313233343536373839404142434445464748495051525354555657585960
17
1 2 3 4 5 6 7 8
10
20
30
40
1 2 3 4 5 6 7 8 9
1.0
2.0
3.0
4.0
J W( L
m-2h-1
)
Concentration factor (-)
a) NF
J W(L
m-2h-1
)
Concentration factor (-)
b) MD
Figure 7. Permeate flux (JW) during concentration of the model water system in Table 1. (a)
Nanofiltration (NF) was performed at P = 9 bar, cross flow rate of 0.17 L s-1; the picture in the insert
shows a portion of the surface of the polymeric NF membrane at the end of the experiment. (b)
Membrane distillation (MD) was performed at a cross-flow velocity of 0.013 m s-1 and the
temperatures of the feed side and permeate side were 58 C and 20 C, respectively; the initial volumes
of feed and permeate were 2.4 L and 0.40 L, respectively.
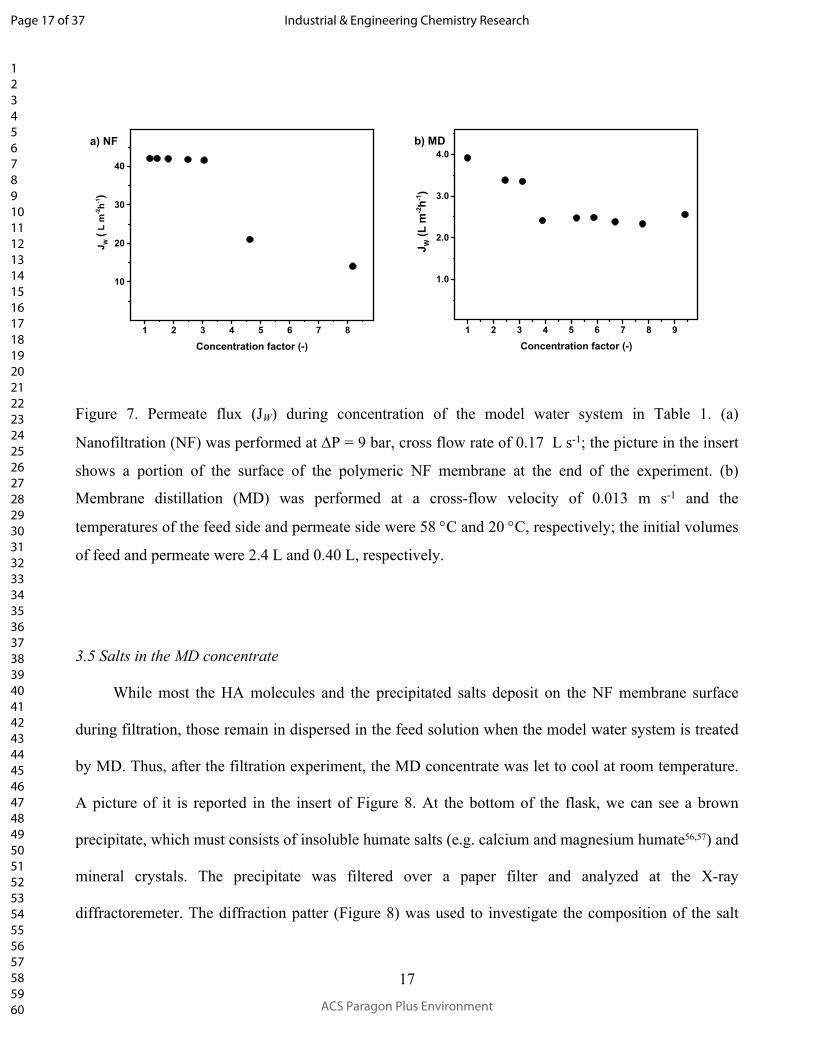
3.5 Salts in the MD concentrate
While most the HA molecules and the precipitated salts deposit on the NF membrane surface
during filtration, those remain in dispersed in the feed solution when the model water system is treated
by MD. Thus, after the filtration experiment, the MD concentrate was let to cool at room temperature.
A picture of it is reported in the insert of Figure 8. At the bottom of the flask, we can see a brown
precipitate, which must consists of insoluble humate salts (e.g. calcium and magnesium humate56,57) and
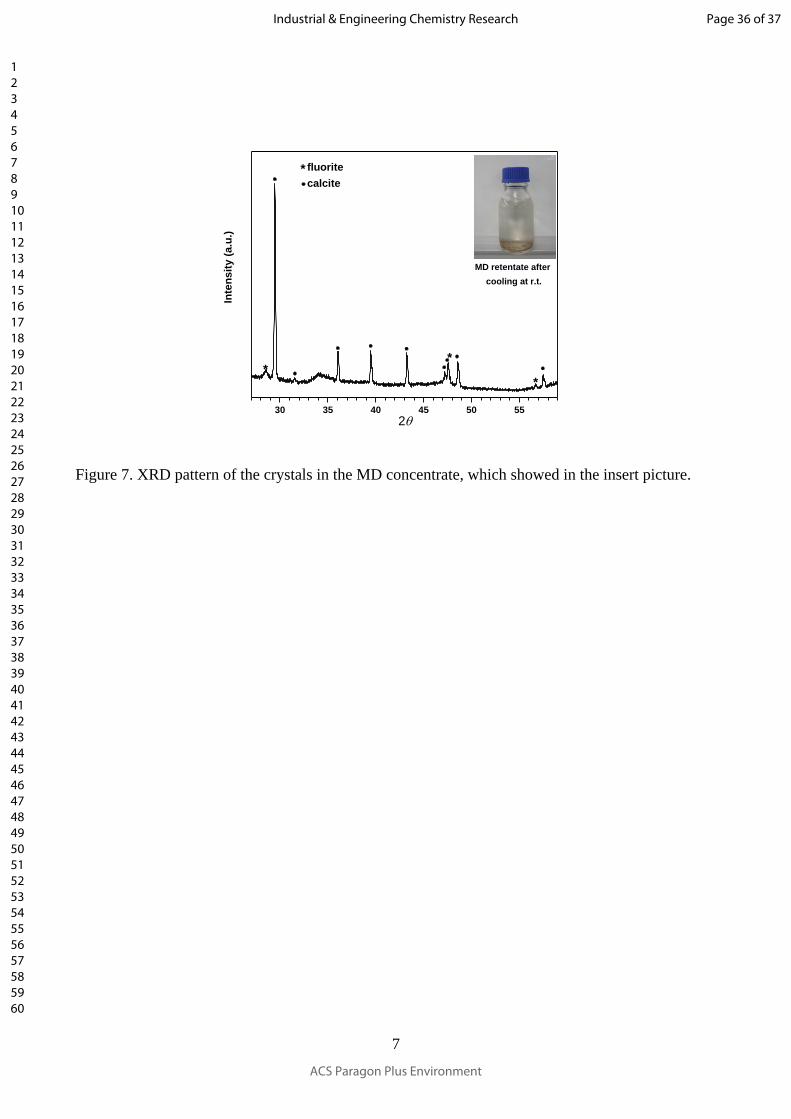
mineral crystals. The precipitate was filtered over a paper filter and analyzed at the X-ray
diffractoremeter. The diffraction patter (Figure 8) was used to investigate the composition of the salt
Page 17 of 37
ACS Paragon Plus Environment
Industrial & Engineering Chemistry Research
123456789101112131415161718192021222324252627282930313233343536373839404142434445464748495051525354555657585960
18
crystals precipitated after cooling the MD concentrate. Such analysis was performed with the “search
and match” function of the software HighScore Plus (PANalytical 2017). The peaks of our
diffractogram were compatible with only two types of crystals: fluorite (CaF2 [ref. 58], peaks at 2 =
28.57, 47.52, and 56.4) and calcite (CaCO3 [ref. 59,60] or Ca0.94Mg0.06CO3 [ref. 60], peaks at 2 =
29.5, 31.6, 36.1, 39.6, 43.3, 47.2, 47.6, 48.6, and 57.5). The reference diffractograms of other
minerals cannot be matched with the peaks in Figure 8. This is consistent with the solubility product
constants (at 25 C)61 of the salts that can be formed by concentration of the model water system in
Table 1: CaF2 1.7 10−14, CaCO3 4.7 10−9, MgF2 8 10−8, MgCO3 4.0 10−5, CaSO4 2.5 10−5.
30 35 40 45 50 55
*
*
*
*
Inte
nsity
(a.u
.)
2
MD retentate after cooling at r.t.
fluoritecalcite
Figure 8. XRD pattern of the crystals in the MD concentrate, which showed in the insert picture.
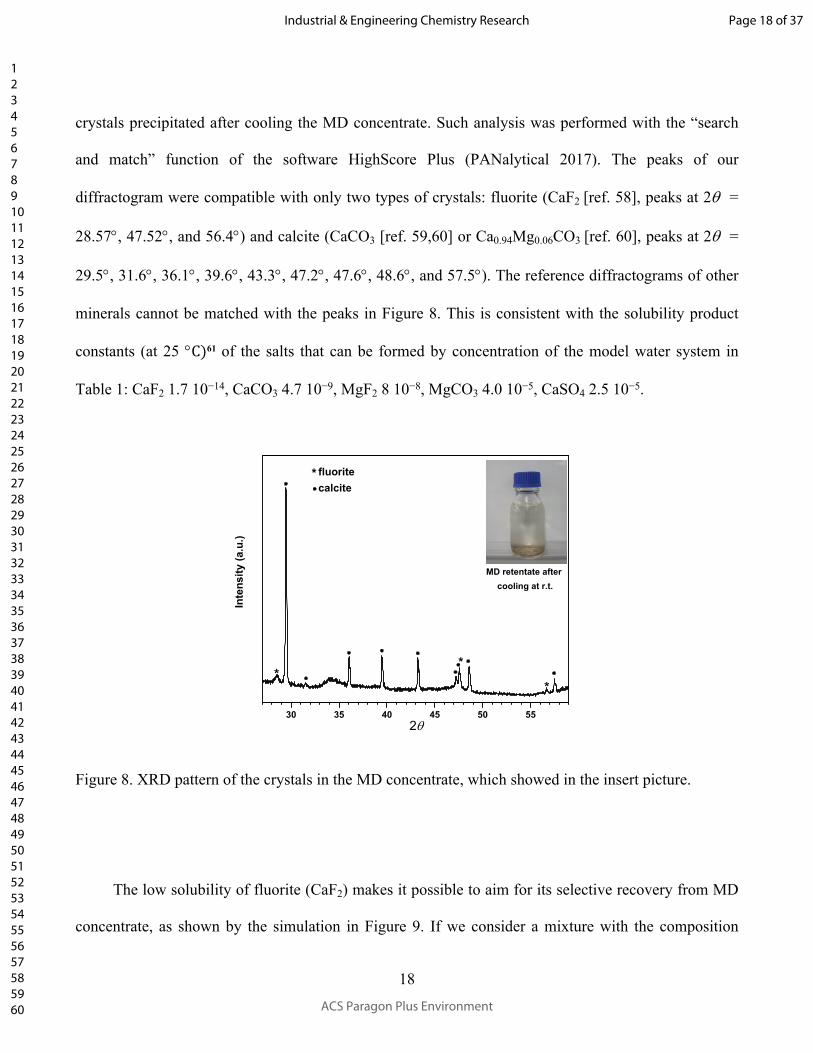
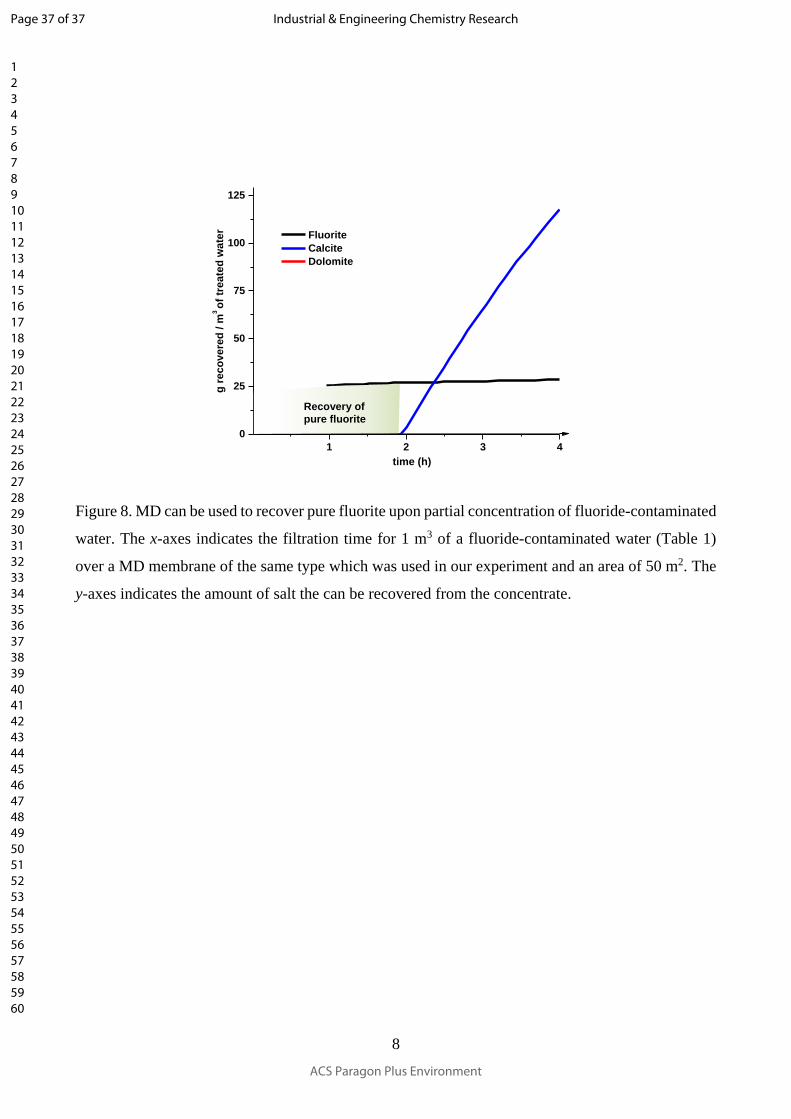
The low solubility of fluorite (CaF2) makes it possible to aim for its selective recovery from MD
concentrate, as shown by the simulation in Figure 9. If we consider a mixture with the composition
Page 18 of 37
ACS Paragon Plus Environment
Industrial & Engineering Chemistry Research
123456789101112131415161718192021222324252627282930313233343536373839404142434445464748495051525354555657585960
19
reported in Table 1, fluorite is the first mineral salt that precipitate during concentration. The filtration
can be stopped before the formation of a significant amount of calcite, thus allowing for the recovery of
pure fluorite crystals from the MD concentrate.
Recovery of pure fluorite
1 2 3 40
25
50
75
100
125
g re
cove
red
/ m3 of
trea
ted
wat
er
time (h)
Fluorite Calcite Dolomite
Figure 9. MD can be used to recover pure fluorite upon partial concentration of fluoride-contaminated
water. The x-axes indicates the filtration time for 1 m3 of a fluoride-contaminated water (Table 1) over
a MD membrane of the same type which was used in our experiment and an area of 50 m2. The y-axes
indicates the amount of salt the can be recovered from the concentrate.
Conclusions
In summary, both NF and MD allow for the rejection of fluoride ions in solution. However, these
two processes are based on different mechanisms of permeation and selectivity, and thus they show
different performances during concentration of fluoride-contaminated water. The NF membrane is
Page 19 of 37
ACS Paragon Plus Environment
Industrial & Engineering Chemistry Research
123456789101112131415161718192021222324252627282930313233343536373839404142434445464748495051525354555657585960
20
partially permeable to the fluoride ions and therefore it is not suitable to treat streams with high
fluoride concentration and at high concentration factors the permeate might have a fluoride
concentration not suitable for human consumption. However, it has much higher water productivity
than the MD unit, even after the membrane surface underwent scaling and fouling.
The most important feature of MD is that the feed quality remains constant over all the filtration
time and the fluoride concentration in our permeate was below the detection limit of our electrode (0.2
ppm), even after reaching a concentration factor of 9. MD has higher resistance to fouling and scaling
than NF. Moreover, it does not require high pressure and solar heat or waste heat can be exploited to
generate a vapor pressure gradient across the membrane. The main drawbacks of MD has been proven
to be: (i) the low water productivity and (ii) the scarce salinity of the permeate, which must be
increased at a level save for human consumption. However, such problems are already faced by the
current RO installations.
The results here reported suggest that the synergic combination of the two techniques can be an
interesting solution to treat fluoride-contaminated water. At first, NF can be used to purify water until
the concentration of fluoride ion in the permeate is compatible with the local requirements for drinking
water, or until fouling and scaling make inconvenient to continue the concentration process, even with
frequent backwashing. Indeed, NF membranes are partially permeable to fluoride ions and the quality
of the produced drinking water deteriorates during concentration. Therefore, the NF concentrate can be
further treated by MD. Pre-concentration by NF will be beneficial for the MD process by reducing the
energy consumption for the heating and the membrane area. Highly pure CaF2 can be crystallized by
cooling the MD concentrate, and eventually exploited in industrial processes, as the production of
hydrogen fluoride. Moreover, the permeates of the NF and MD module can be mixed to obtain a high
quality drinking water, with the desired concentration of fluoride ions and dissolved minerals.
Page 20 of 37
ACS Paragon Plus Environment
Industrial & Engineering Chemistry Research
123456789101112131415161718192021222324252627282930313233343536373839404142434445464748495051525354555657585960
21
Acknowledgements
The authors gratefully acknowledge the European Commission for supporting the secondments of L. I.
Moran Ayala and V. Boffa (MAT4TREAT, H2020‐MSCA‐RISE‐2014, grant n. 64555), and for
funding the PhD stipend of K. Janowska (AQUAlity, H2020‐MSCA‐ITN‐2016, grant n. 765860). L. I.
Moran Ayala thanks CONICET (Argentina) for her graduate studentship.
References
1. Choubisa, S.L.; Fluorosis in some tribal villages of Dungapur district of Rajasthan, India. Fluoride,
1997, 30, 223–228.
2. Xu, R.Q.; Wu, D.Q.; Xu, R.Y. Relations between environment and endemic fluorosis in Hohot
region, Inner Mongolia. Fluoride, 1997, 30, 26–28.
3. Ali, S.; Thakur, S.K.; Sarkar, A.; Shekhar S.; Worldwide contamination of water by fluoride.
Environ. Chem. Lett. 2016, 14, 291-315.
4. WHO, Guidelines for Drinking-Water Quality. First addendum to third ed. vol. 1.
Recommendations, 2006, WHO.
5. Murray, J.J. Appropriate use of fluorides for human health. Geneva, 1986, World Health
Organization.
6. S. Ayoob; A. K. Gupta, V. T. Bhat, A conceptual overview on sustainable technologies for the
defluoridation of drinking water, Crit. Rev. Env. Sci. and Tech. 2008, 38, 401-470.
7. Ben Nasr, A.; Charcosset, C.; Ben Amar, R.; Walha, K. Defluoridation of water by nanofiltration, J.
Fluorine Chem. 2013, 150, 92–97.
Page 21 of 37
ACS Paragon Plus Environment
Industrial & Engineering Chemistry Research
123456789101112131415161718192021222324252627282930313233343536373839404142434445464748495051525354555657585960
22
8. Boussouga, Y.A.; Lhassani, A. Modeling of fluoride retention in nanofiltration and reverse osmosis
membranes for single and binary salt mixtures, Desalination Water Treat., 2017, 95, 162-169.
9. Owusu-Agyeman, I.; Jeihanipour, A.; Luxbacher, A.T.; Schafer, A I.; Implications of humic acid,
inorganic carbon and speciation on fluoride retention mechanisms in nanofiltration and reverse
osmosis, J. Membrane Sci. 2017, 528, 82-94.
10. Harahsheh, M.; Hussain, Y. A.; Al-Zoubi, H.; Batiha, M.; Hammouri, E. Hybrid precipitation-
nanofiltration treatment of effluent pond water from phosphoric acid industry, Desalination, 2017, 406,
88-97.
11. Shen, J.J.; Richards, B.S.; Schafer A. I.; Renewable energy powered membrane technology: Case
study of St. Dorcas borehole in Tanzania demonstrating fluoride removal via nanofiltration/reverse
osmosis, Sep. Purif. Technol., 2016, 170, 445-452.
12. Shen, J. J.; Schafer, A. I. Factors affecting fluoride and natural organic matter (NOM) removal
from natural waters in Tanzania by nanofiltration/reverse osmosis, Sci. Total Environ., 2015, 527 520-
529.
13. Shen, J. J.; Schafer, A. I. Removal of fluoride and uranium by nanofiltration and reverse osmosis:
A review, Chemosphere, 2014, 117, 679-691.
14. Xi, B.D.; Wang, X.W.; Liu, W. J.; Xia, X.F.; Li, D.S.; He, L.S.; Wang, H.M.; Sun, W.J.; Yang
T.X.; Tao, W. Fluoride and Arsenic Removal by Nanofiltration Technology from Groundwater in
Rural Areas of China: Performances with Membrane Optimization, Sep. Sci. Technol., 2014, 49, 2642-
2649.
15. I. Bejaoui, A. Mnif, B. Hamrouni, Performance of Reverse Osmosis and Nanofiltration in the
Removal of Fluoride from Model Water and Metal Packaging Industrial Effluent, Sep. Sci. Technol.,
2014, 49, 1135-1145.
Page 22 of 37
ACS Paragon Plus Environment
Industrial & Engineering Chemistry Research
123456789101112131415161718192021222324252627282930313233343536373839404142434445464748495051525354555657585960
23
16. Chakrabortty, S.; Roy, M.; Pal P. Removal of fluoride from contaminated groundwater by cross
flow nanofiltration: Transport modeling and economic evaluation, Desalination, 2013, 313, 115-124.
17. J. Hoinkis, S. Valero-Freitag, M.P. Caporgno, C. Patzold, Removal of nitrate and fluoride by
nanofiltration - a comparative study, Desalination and Water Treatment, 30 (2011) 278-288.
18. I. Bejaoui, A. Mnif, B. Hamrouni, Influence of operating conditions on the retention of fluoride
from water by nanofiltration, Desalination and Water Treatment, 29 (2011) 39-46.
19. Wang, X.W.; Xi, B.D.; Huo, S.L.; Liu, W.J.; Sun, W.J.; Li, D.S.; Yu, H.B.; Ma, W.F.; Liu, H.L.
Performances comparison of reverse osmosis and nanofiltration application to defluorination from
groundwater: influence factors and fouling analysis, Fresenius Environ. Bull., 2011, 20, 3141-3151.
20. Padilla, A.P.; Saitua, H. Performance of simultaneous arsenic, fluoride and alkalinity (bicarbonate)
rejection by pilot-scale nanofiltration, Desalination, 2010, 257 16- 21.
21. Nightingale, E.R. Phenomenological theory of ion solvation. Effective radii of hydrated ions, J.
Phys. Chem. 1959, 63, 1381–1387.
22. Zhou, J.; Lu, X.; Wang, Y.; Shi, J. Molecular dynamics study on ionic hydration, Fluid Phase
Equilib. 2002, 194–197, 257–270.
23. M.Y. Kiriukhim, K.D. Collins, Dynamic hydration numbers for biologically important ions,
Biophys. Chem. 99 (2002) 155–168.
24. Farsi, A.; Malvache, C.; De Bartolis, O.; Magnacca, G.; Kristensen, P. K.; Christensen, M. L.;
Boffa V., Design and fabrication of silica-based nanofiltration membranes for water desalination and
detoxification, Microporous Mesoporous Mater., 2017, 237, 117-126.
25. Farsi, A.; Boffa, V.; Christensen, M. L. Electroviscous effects in ceramic nanofiltration
membranes, ChemPhysChem, 2015, 16, 3397-407.
Page 23 of 37
ACS Paragon Plus Environment
Industrial & Engineering Chemistry Research
123456789101112131415161718192021222324252627282930313233343536373839404142434445464748495051525354555657585960
24
26. Farsi, A.; Boffa, V.; Qureshi, H.F.; Nijmeijer, A.; Winnubst, L.; Christensen, M. L.Modeling water
flux and salt rejection of mesoporous -alumina and microporous organosilica membranes, J.
Membrane Sci., 2014, 470, 307–315.
27. Diawara, C. K. Nanofiltration Process Efficiency in Water Desalination, Sep. Purif. Rev., 2008, 37,
302–324.
28. Qtaishat, M.R.; Banat, F. Desalination by solar powered membrane distillation systems,
Desalination 2013, 308, 186-197.
29. Quist-Jensen, C.A.; Ali, A.; Mondal, S.; Macedonio, F.; Drioli, E. A study of membrane
distillation and crystallization for lithium recovery from high-concentrated aqueous solutions, J.
Membrane Sci. 2016, 505, 167–173.
30. Hou, D. Y.; Wang, J.; Wang, B. Q.; Luan, Z. K.; Sun X. C.; Ren, X. J. Fluoride removal from
brackish groundwater by direct contact membrane distillation, Water Sci. Technol., 2010, 61, 2178-
3187.
31. Hou, D.; Wang, J.; Zhao, C.; Wang, B.; Luan, Z.; Sun X. Fluoride removal from brackish
groundwater by direct contact membrane distillation, J. Environ. Sci., 2010, 22, 1860–1867.
32. Boubakri, A.; Bouchrit, R.; Hafiane, A.; Al-Tahar Bouguecha, S. Fluoride removal from aqueous
solution by direct contact membrane distillation: theoretical and experimental studies, Environ. Sci.
Poll. Research, 2014, 21, 10493-10501.
33. Qtaishat, M.; Rana, D.; Matsuura, T.; Khayet, M. Effect of surface modifying macromolecules
stoichiometric ratio on composite hydrophobic/hydrophilic membranes characteristics and performance
in direct contact, AIChE 2009, 55, 3145-3151.
Page 24 of 37
ACS Paragon Plus Environment
Industrial & Engineering Chemistry Research
123456789101112131415161718192021222324252627282930313233343536373839404142434445464748495051525354555657585960
25
34. Qtaishat, M.; Khayet, M.; Matsuura, T. Novel porous composite hydrophobic/hydrophilic
polysulfone membranes for desalination by direct contact membrane distillation, J. Membrane Sci.
2009, 341, 139-148.
35. Qtaishat, M.; Matsuura, T.; Khayet, M.; Khulbe, K.C. Comparing the desalination performance of
SMM blended polyethersulfone to SMM blended polyetherimide membranes by direct contact
membrane distillation, Desalination Water Treat. 2009, 5, 91-98.
36. Boubakri, A.; Hafiane. A.; Al Tahar Bouguecha, S. Application of response surface methodology
for modeling and optimization of membrane distillation desalination process, J. Ind. Eng. Chem., 2014,
20, 3163-3169.
37. Ali, A., Macedonio F.; Drioli E.; Aljlil S.; Alharbi, O. A. Experimental and theoretical evaluation
of temperature polarization phenomenon in direct contact membrane distillation, Chem. Eng. Res.
Design 2013, 91, 1966–1977.
38. Meschke, K.; Daus, B.; Haseneder, R.; Repke, J.-U. Strategic elements from leaching solutions by
nanofiltration – Influence of pH on separation performance, Sep. Purif. Technol. 2017, 184, 264–274.
39. Parkhurst, D.L.; Appelo, C.A. Description of Input and Examples for PHREEQC Version 3—A
Computer Program for Speciation, Batch-Reaction, One-Dimensional Transport, and Inverse
Geochemical Calculations. Available online: http://pubs.usgs.gov/tm/06/a43
40. FILMTEC™ XLE-2521 Membranes, Form No. 609-00349-0706. www.lenntech.com/Data-
sheets/Dow-Filmtec-XLE-2521.pdf
41. FLUID SYSTEMS® TFC®-ULP® 4” ELEMENT, KOCH membrane system,
www.lenntech.com/Data-sheets/Koch-Fluid-Systems-TFC-4040-ULP-L.pdf
42. Toray Membrane Product, www.toraywater.com/products/ro/pdf/TMG.pdf
43. Hydranautics Corporate http://www.membranes.com/docs/4inch/ESPA4-4040.pdf
Page 25 of 37
ACS Paragon Plus Environment
Industrial & Engineering Chemistry Research
123456789101112131415161718192021222324252627282930313233343536373839404142434445464748495051525354555657585960
26
44. FILMTEC Membranes, Nanofiltration Produces Sparkling Clean Water for Swedish Resort
Community, Form No. 609-00379-0503,
http://msdssearch.dow.com/PublishedLiteratureDOWCOM/dh_0047/0901b803800478f5.pdf?filepath=
liquidseps/pdfs/noreg/609-00379.pdf&fromPage=GetDoc
45. FILMTEC™ Membranes, FILMTEC NF90-400 Nanofiltration Element, Nanofiltration Elements
for Commercial Systems, Form No. 609-00345-0406, http://www.lenntech.com/Data-sheets/Dow-
Filmtec-NF90-400.pdf
46. CK Series, Water Softening NF Elements (Cellulose Acetate), GE water &process technology,
https://www.gewater.com/kcpguest/salesedge/documents/Fact%20Sheets_Cust/Americas/English/FS12
68EN.pdf
47. Hydranautics Corporate http://www.membranes.com/docs/8inch/ESNA1-LF-LD.pdf
48. Product Guide for Spiral-Wound RO & NF Elements, CSM,
http://www.csmfilter.com/csm/upload/RO_Catalogue/CSM%20RO%20Catalog_Eng_Final_DavidK_1
1.7.12.pdf
49. Ullah, R.; Khraisheh, M.; Esteves, R.J.; McLeskey, J.T.; AlGhouti, M.; Gad-El-Hak, M.; Tafreshi,
H.V. Energy efficiency of direct contact membrane distillation, Desalination 2018, 433 56-67.
50. C.A. Quist-Jensen, J.M. Sørensen, A. Svenstrup, L. Scarpa, T.S. Carlsen, H.C. Jensen, L.
Wybrandt, M.L. Christensen, Membrane crystallization for phosphorus recovery and ammonia
stripping from reject water from sludge dewatering process, Desalination, in press
https://doi.org/10.1016/j.desal.2017.11.034.
51. Perez Padilla, A.; Saitua, H. Performance of simultaneous arsenic, fluoride and alkalinity
(bicarbonate) rejection by pilot-scale nanofiltration, Desalination 2010, 257, 16–21.
Page 26 of 37
ACS Paragon Plus Environment
Industrial & Engineering Chemistry Research
123456789101112131415161718192021222324252627282930313233343536373839404142434445464748495051525354555657585960
27
52. Richards, L.A.; Richards, B.S.; Rossiter, H.M.A.; Schäfer, A.I. Impact of speciation on fluoride,
arsenic and magnesium retention by nanofiltration/reverse osmosis in remote, Australian communities,
Desalination 2009, 248, 177–183.
53. Shen, J.; Schäfer, A. Removal of fluoride and uranium by nanofiltration and reverse osmosis: A
review. Chemosphere 2014, 117, 679–69.
54. McCann, H. G. The solubility of fluorapatite and its relationship to that of calcium fluoride. Arch
Oral Biol 1968, 13, 987–1001.
55. Tu, K.L.; Chivas, A.R; Nghiem, L.D.; Effects of membrane fouling and scaling on boron rejection
by nanofiltration and reverse osmosis membranes, Desalination 2011, 279, 269–277.
56. Kříženecká, S.; Hejda, S.; Machovič, V.; Trögl, J. Preparation of iron, aluminium, calcium,
magnesium, and zinc humates for environmental applications, Chemical Papers, 2014, 68, 1443–1451.
57. Savarino, P.; Montoneri, E.; Bottigliengo, S.; Boffa, V.; Guizzetti, T.; Perrone, D.G.; Mendichi, R.
Biosurfactants from urban wastes as auxiliaries for textile dyeing, Ind. Eng. Chem. Res. 2009, 48,
3738-3748.
58. Speziale, S.; Duffy, T. S. Single-crystal elastic constants of fluorite (CaF2) to 9.3 GPa, Phys.
Chem. Minerals, 2002, 29, 465-472.
59. Ondrus, P.; Veselovsky, F.; Gabasova, A.; Hlousek, J.; Srein, V.; Vavrnn, I.; Skala, R.; Sejkora, J.;
Drabek, M. Primary minerals of the Jáchymov ore district, Journal of the Czech Geological Society,
2003, 48, 19-147.
60. Paquette, J.; Reeder, R. J. Single-crystal X-ray structure refinements of two biogenic magnesian
calcite crystals Am. Mineralogist, 1990, 75, 1151-1158.
61. Gupta, A.K. S. Ion Exchange in Environmental Processes: Fundamentals, Applications and
Sustainable Technology, First Edition. 2017 John Wiley & Sons, Inc.
Page 27 of 37
ACS Paragon Plus Environment
Industrial & Engineering Chemistry Research
123456789101112131415161718192021222324252627282930313233343536373839404142434445464748495051525354555657585960
28
Page 28 of 37
ACS Paragon Plus Environment
Industrial & Engineering Chemistry Research
123456789101112131415161718192021222324252627282930313233343536373839404142434445464748495051525354555657585960
29
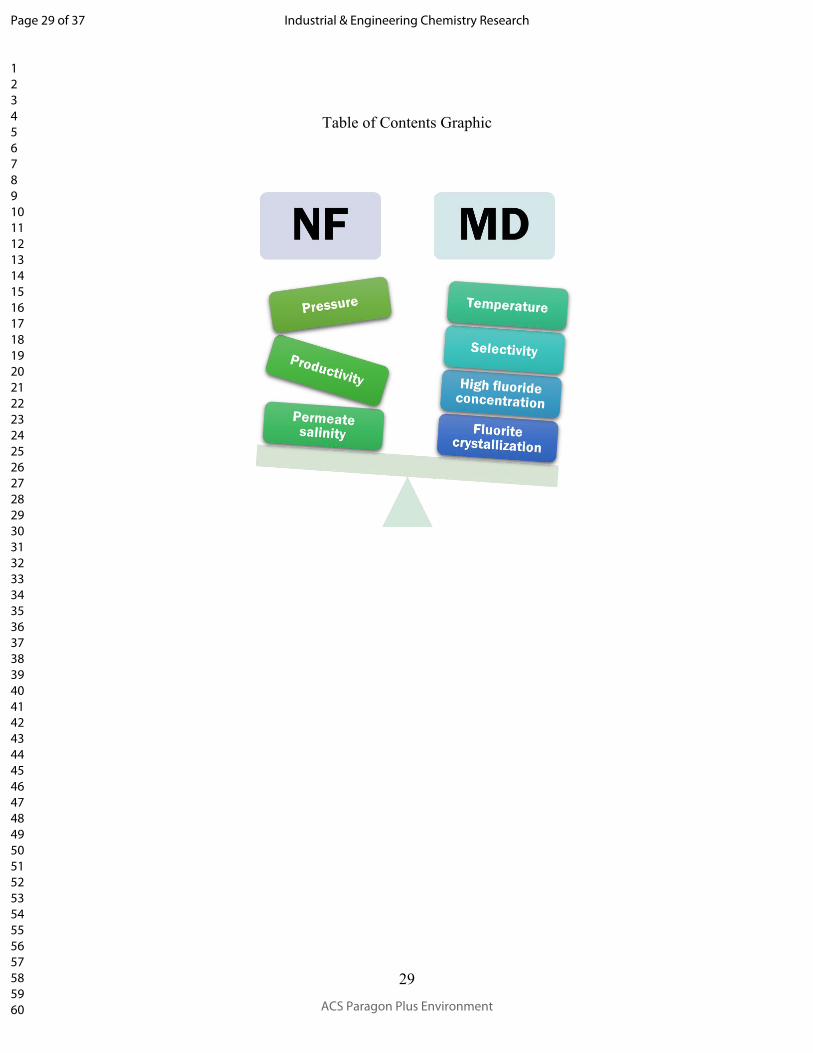
Table of Contents Graphic
Page 29 of 37
ACS Paragon Plus Environment
Industrial & Engineering Chemistry Research
123456789101112131415161718192021222324252627282930313233343536373839404142434445464748495051525354555657585960
1
Figures
Figure 1. Filtration of deionized water. (a) Permeate flux (Jw) as a function of membrane overpressure
in NF; the linear fitting of the experimental data (dashed line) was used to calculate the membrane
water permeance (Fwater). (b) Jw of MD as a function of feed temperature: the horizontal bars and
bullets indicate the temperature at the two membrane extremes and the average temperature,
respectively; vertical bars indicate the standard deviation over 4 measurements; the permeate had an
average temperature of 20 C and the same cross flow velocity of the feed.
30 40 50 60
1.0
2.0
3.0
4.0
2 4 6 8
10
20
30
40
50
60
Temperature (C)
0.013 m s-1
0.011 m s-1
0.008 m s-1
Cross flow velocity
Jw / L
(m
2 h
)-1
Jw / L
(m
2 h
)-1
Fwater
= 6.5 0.1 L (h m2 bar)
-1
P (bar)
(a) NF (b) MD
Page 30 of 37
ACS Paragon Plus Environment
Industrial & Engineering Chemistry Research
123456789101112131415161718192021222324252627282930313233343536373839404142434445464748495051525354555657585960
2
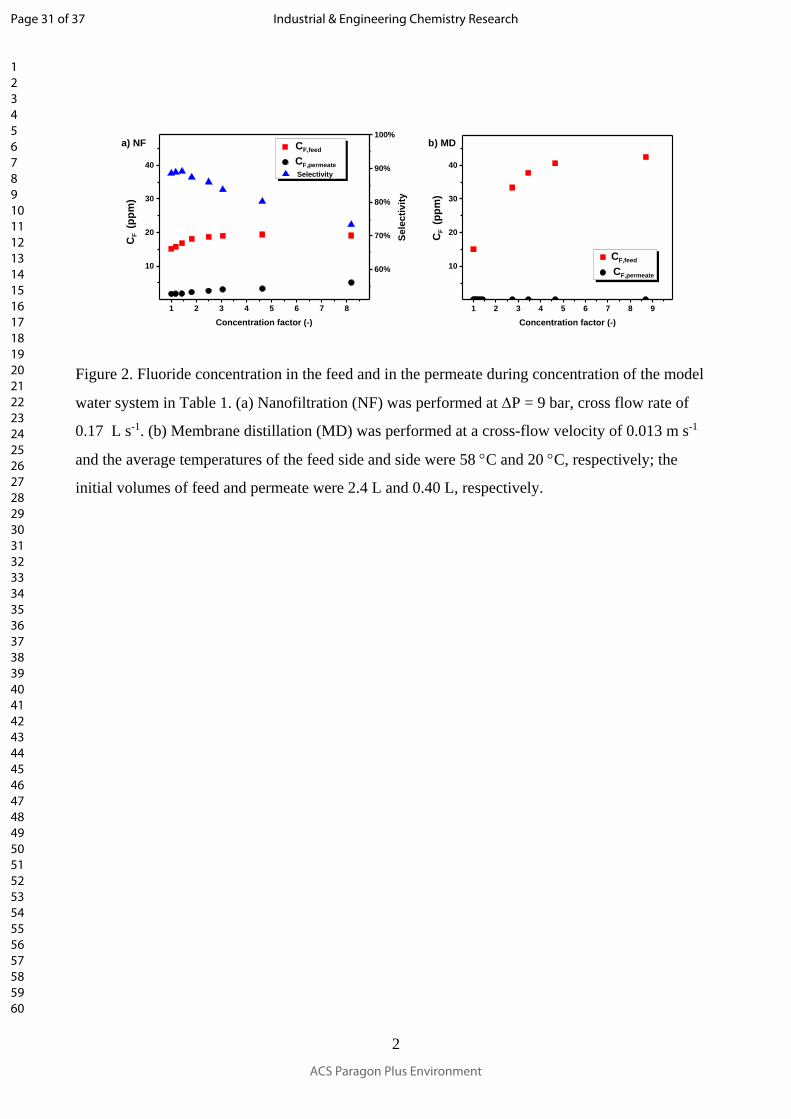
Figure 2. Fluoride concentration in the feed and in the permeate during concentration of the model
water system in Table 1. (a) Nanofiltration (NF) was performed at P = 9 bar, cross flow rate of
0.17 L s-1. (b) Membrane distillation (MD) was performed at a cross-flow velocity of 0.013 m s-1
and the average temperatures of the feed side and side were 58 C and 20 C, respectively; the
initial volumes of feed and permeate were 2.4 L and 0.40 L, respectively.
1 2 3 4 5 6 7 8 9
10
20
30
40
1 2 3 4 5 6 7 8
10
20
30
40
CF,feed
CF,permeate
Concentration factor (-)
a) NF b) MD
CF
(p
pm
)
CF,feed
CF,permeate
CF
(p
pm
)
Concentration factor (-)
60%
70%
80%
90%
100%
Selectivity
Se
lec
tiv
ity
Page 31 of 37
ACS Paragon Plus Environment
Industrial & Engineering Chemistry Research
123456789101112131415161718192021222324252627282930313233343536373839404142434445464748495051525354555657585960
3
Figure 3. Filtration of deionized water contaminated with fluorine: measured fluoride concentration
in the permeate (CF,permeate ) and permeate flux (JW) as a function of the fluoride concentration in the
feed tank (CF,feed) for the MD membrane. The experiment was performed at a cross-flow velocity of
0.013 m s-1 and the average temperatures of the feed side and permeate side were 58 C and 20 C,
respectively; the initial volumes of feed and permeate were 2.4 L and 0.40 L, respectively.
10 100 1000
2.0
4.0
6.0
8.0CF,permeate
CF
,pe
rme
ate
(p
pm
)
CF,feed (ppm)
1
2
3
4
5
6
Jpermeate
J p
erm
ea
te [L
/(m
2 h
)]
Page 32 of 37
ACS Paragon Plus Environment
Industrial & Engineering Chemistry Research
123456789101112131415161718192021222324252627282930313233343536373839404142434445464748495051525354555657585960
4
Figure 4. Conductivity of the feed and of the permeate during concentration of the model water system
in Table 1. (a) Nanofiltration (NF) was performed at P = 9 bar and crossflow rate of 0.17 L s-1. (b)
Membrane distillation (MD) was performed at a cross-flow velocity of 0.013 m s-1 and the average
temperatures of the feed side and permeate side were 58 C and 20 C, respectively; the initial
volumes of feed and permeate were 2.4 L and 0.40 L, respectively.
1 2 3 4 5 6 7 8
500
1000
1500
1 2 3 4 5 6 7 8 9
500
1000
1500a) NF b) MDFeed, µS cm
-1
Permeate, µS cm-1
Co
nd
ucti
vit
y (
µS
cm
-1)
Concentration factor (-)
Feed, µS cm-1
Permeate, µS cm-1
Co
nd
ucti
vit
y (
µS
cm
-1)
Concentration factor (-)
44%
48%
52%
56%
Selectivity
Se
lec
tiv
ity
Page 33 of 37
ACS Paragon Plus Environment
Industrial & Engineering Chemistry Research
123456789101112131415161718192021222324252627282930313233343536373839404142434445464748495051525354555657585960
5
Figure 5. Light absorbance at 254 nm (A254) of the feed and of the permeate during concentration of
the model water system in Table 1. (a) Nanofiltration (NF) was performed at P = 9 bar, cross flow
rate of 0.17 L s-1; the picture in the insert shows a portion of the surface of the polymeric NF
membrane at the end of the experiment. (b) Membrane distillation (MD) was performed at a cross-
flow velocity of 0.013 m s-1 and the average temperatures of the feed side and permeate side were
58 C and 20 C, respectively; the initial volumes of feed and permeate were 2.4 L and 0.40 L,
respectively.
1 2 3 4 5 6 7 8
0.0
0.1
0.2
0.3
0.4
0.5
0.6
1 2 3 4 5 6 7 8 9
0.0
0.1
0.2
0.3
0.4
0.5
0.6
a) NF
Feed
Permeate
A2
54 (
-)
Concentration factor (-)
b) MD Feed
Permeate
A2
54 (
-)
Concentration factor (-)
Page 34 of 37
ACS Paragon Plus Environment
Industrial & Engineering Chemistry Research
123456789101112131415161718192021222324252627282930313233343536373839404142434445464748495051525354555657585960
6
Figure 6. Permeate flux (JW) during concentration of the model water system in Table 1. (a)
Nanofiltration (NF) was performed at P = 9 bar, cross flow rate of 0.17 L s-1; the picture in the
insert shows a portion of the surface of the polymeric NF membrane at the end of the experiment. (b)
Membrane distillation (MD) was performed at a cross-flow velocity of 0.013 m s-1 and the
temperatures of the feed side and permeate side were 58 C and 20 C, respectively; the initial
volumes of feed and permeate were 2.4 L and 0.40 L, respectively.
1 2 3 4 5 6 7 8
10
20
30
40
1 2 3 4 5 6 7 8 9
1.0
2.0
3.0
4.0
JW
( L
m-2h
-1)
Concentration factor (-)
a) NF
JW
(L
m-2h
-1)
Concentration factor (-)
b) MD
Page 35 of 37
ACS Paragon Plus Environment
Industrial & Engineering Chemistry Research
123456789101112131415161718192021222324252627282930313233343536373839404142434445464748495051525354555657585960
7
Figure 7. XRD pattern of the crystals in the MD concentrate, which showed in the insert picture.
30 35 40 45 50 55
*
*
*
*
Inte
nsit
y (
a.u
.)
2
MD retentate after
cooling at r.t.
fluorite
calcite
Page 36 of 37
ACS Paragon Plus Environment
Industrial & Engineering Chemistry Research
123456789101112131415161718192021222324252627282930313233343536373839404142434445464748495051525354555657585960
8
Figure 8. MD can be used to recover pure fluorite upon partial concentration of fluoride-contaminated
water. The x-axes indicates the filtration time for 1 m3 of a fluoride-contaminated water (Table 1)
over a MD membrane of the same type which was used in our experiment and an area of 50 m2. The
y-axes indicates the amount of salt the can be recovered from the concentrate.
1 2 3 4
0
25
50
75
100
125
g r
ec
ov
ere
d /
m3
of
tre
ate
d w
ate
r
time (h)
Fluorite
Calcite
Dolomite
Recovery of
pure fluorite
Page 37 of 37
ACS Paragon Plus Environment
Industrial & Engineering Chemistry Research
123456789101112131415161718192021222324252627282930313233343536373839404142434445464748495051525354555657585960