Embed Size (px)
Citation preview
Reverse Osmosis/NanofiltrationMembranes 101
Alex Wesner P.E.
Separation Processes, Inc.
1
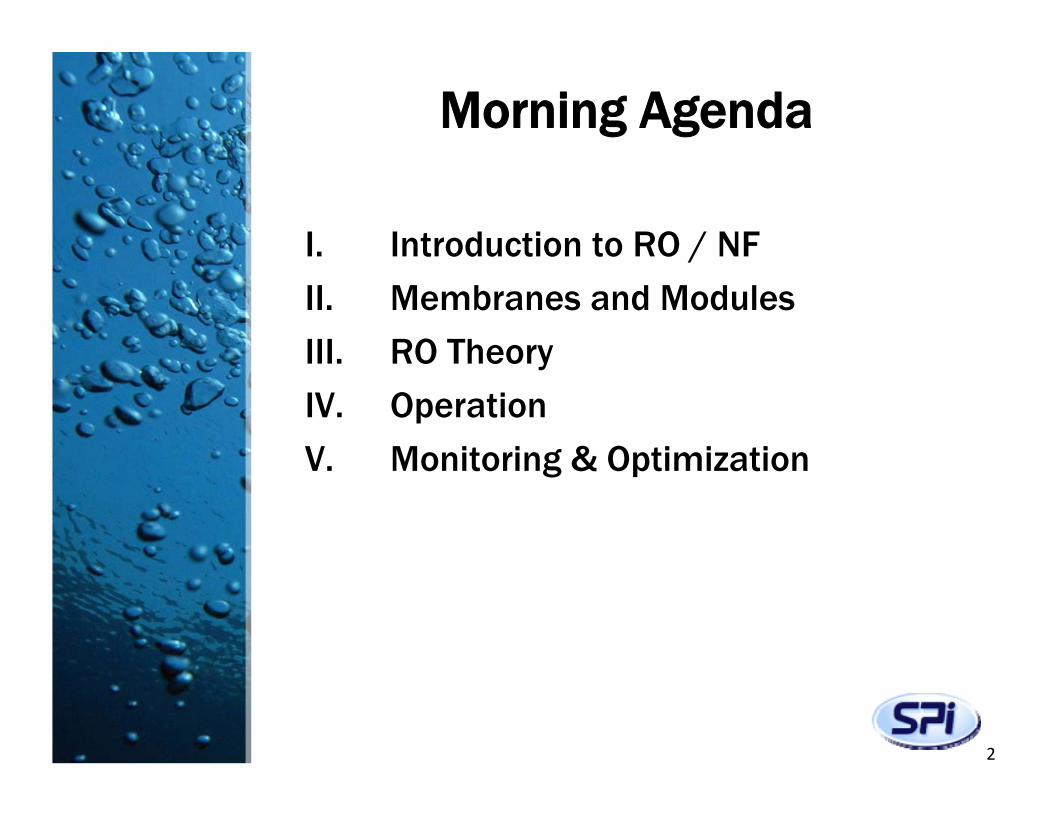
Morning Agenda
I. Introduction to RO / NF
II. Membranes and Modules
III. RO Theory
IV. Operation
V. Monitoring & Optimization
2
INTRODUCTION TO RO / NF
3
4
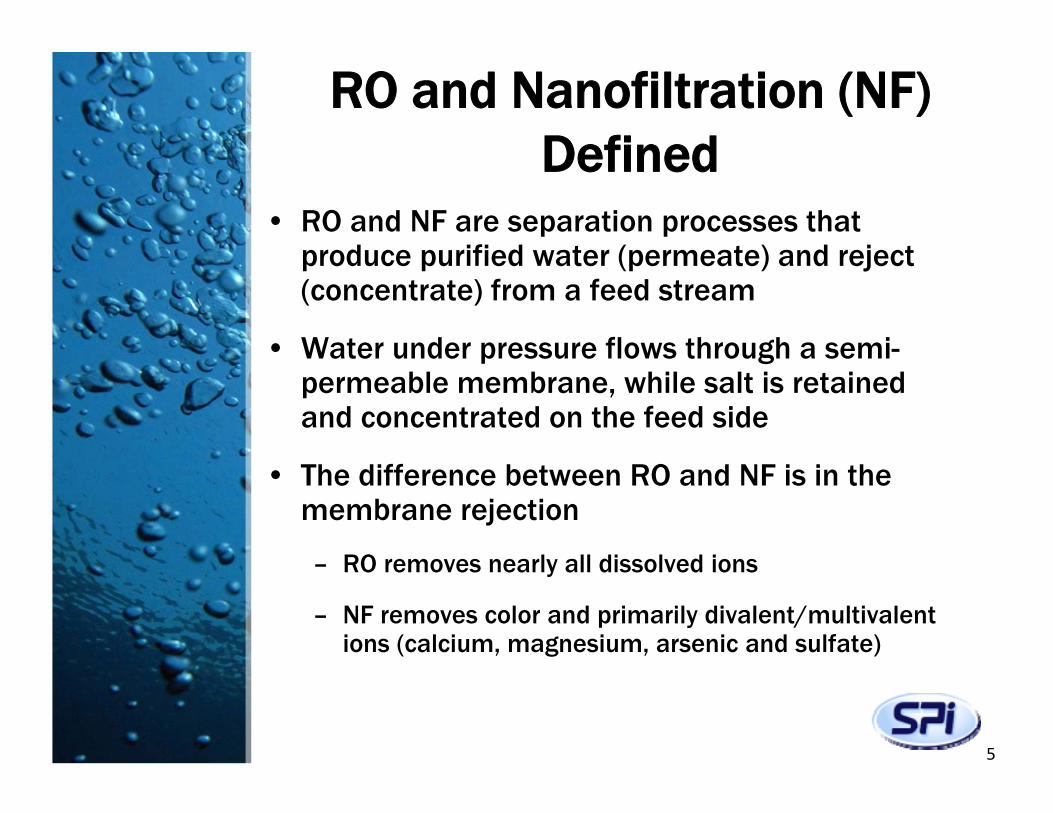
RO and Nanofiltration (NF) Defined
• RO and NF are separation processes that produce purified water (permeate) and reject (concentrate) from a feed stream
• Water under pressure flows through a semi-permeable membrane, while salt is retained and concentrated on the feed side
• The difference between RO and NF is in the membrane rejection
– RO removes nearly all dissolved ions
– NF removes color and primarily divalent/multivalent ions (calcium, magnesium, arsenic and sulfate)
5
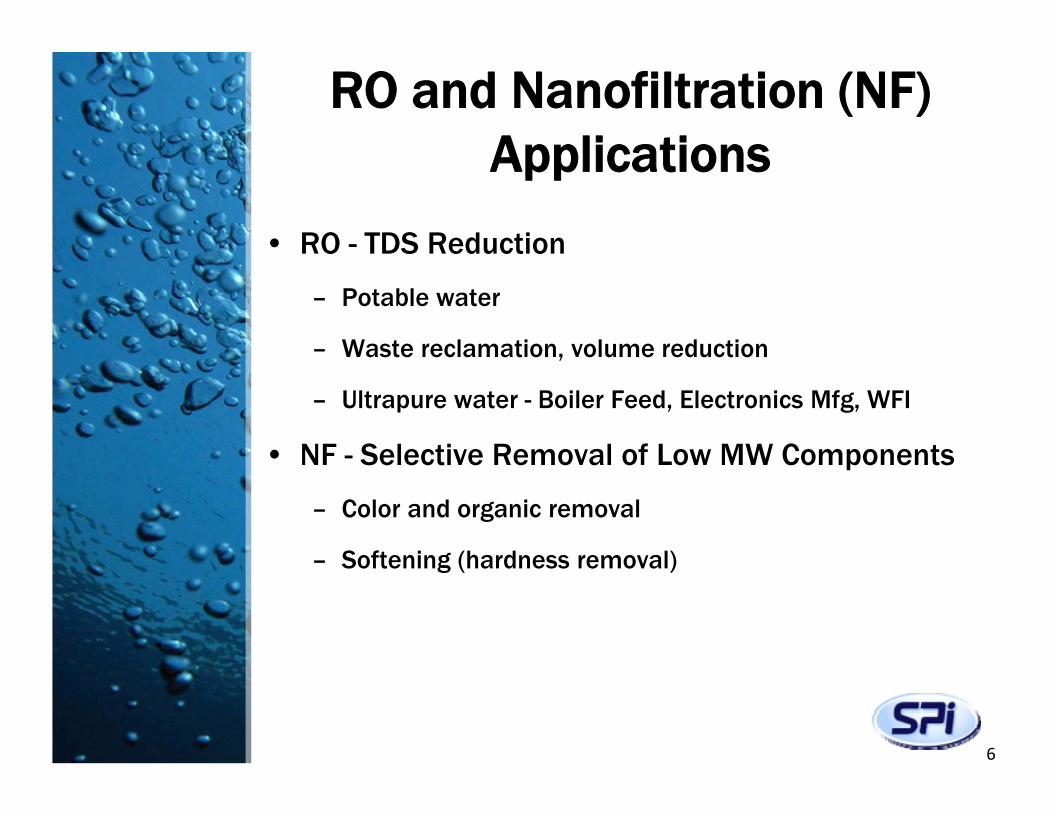
RO and Nanofiltration (NF) Applications
• RO - TDS Reduction
– Potable water
– Waste reclamation, volume reduction
– Ultrapure water - Boiler Feed, Electronics Mfg, WFI
• NF - Selective Removal of Low MW Components
– Color and organic removal
– Softening (hardness removal)
6
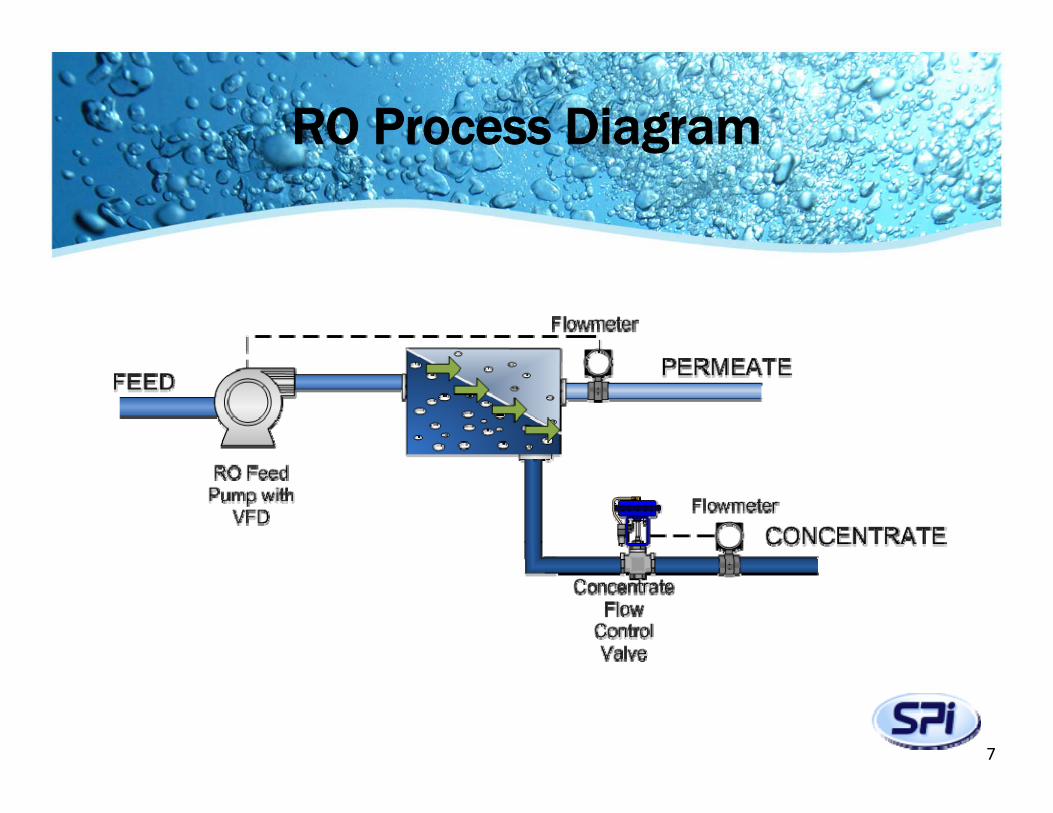
RO Process Diagram
7
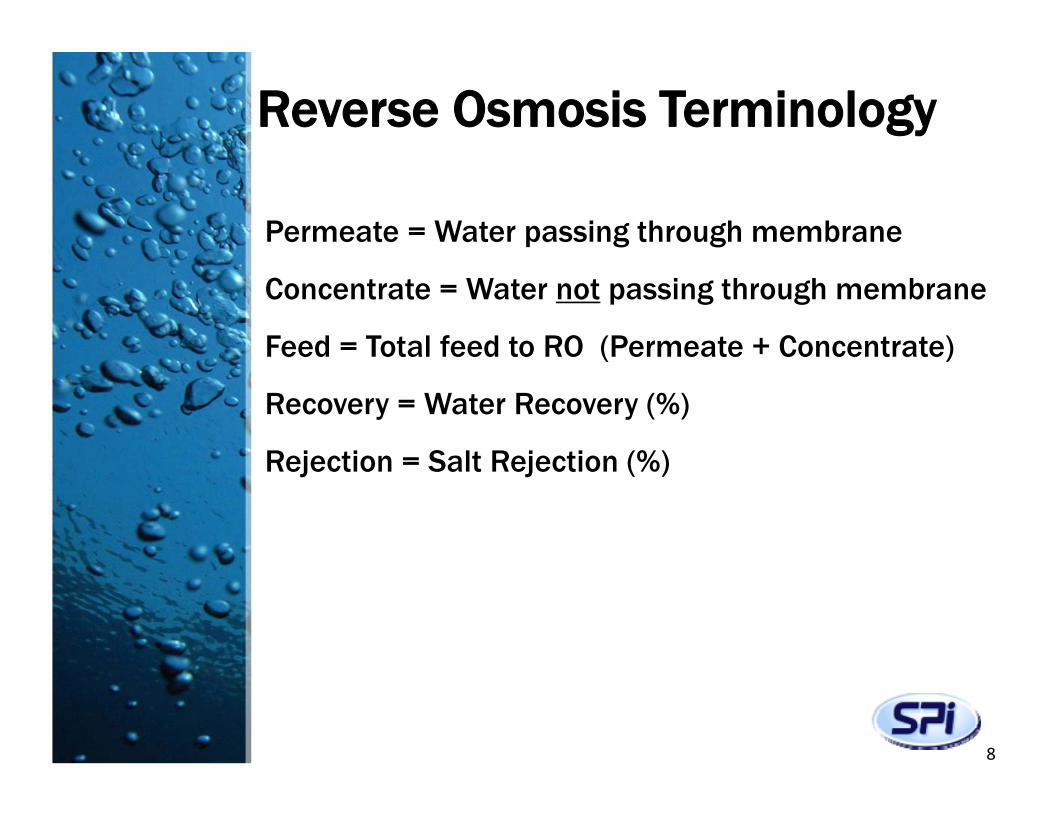
Reverse Osmosis Terminology
Permeate = Water passing through membrane
Concentrate = Water not passing through membrane
Feed = Total feed to RO (Permeate + Concentrate)
Recovery = Water Recovery (%)
Rejection = Salt Rejection (%)
8
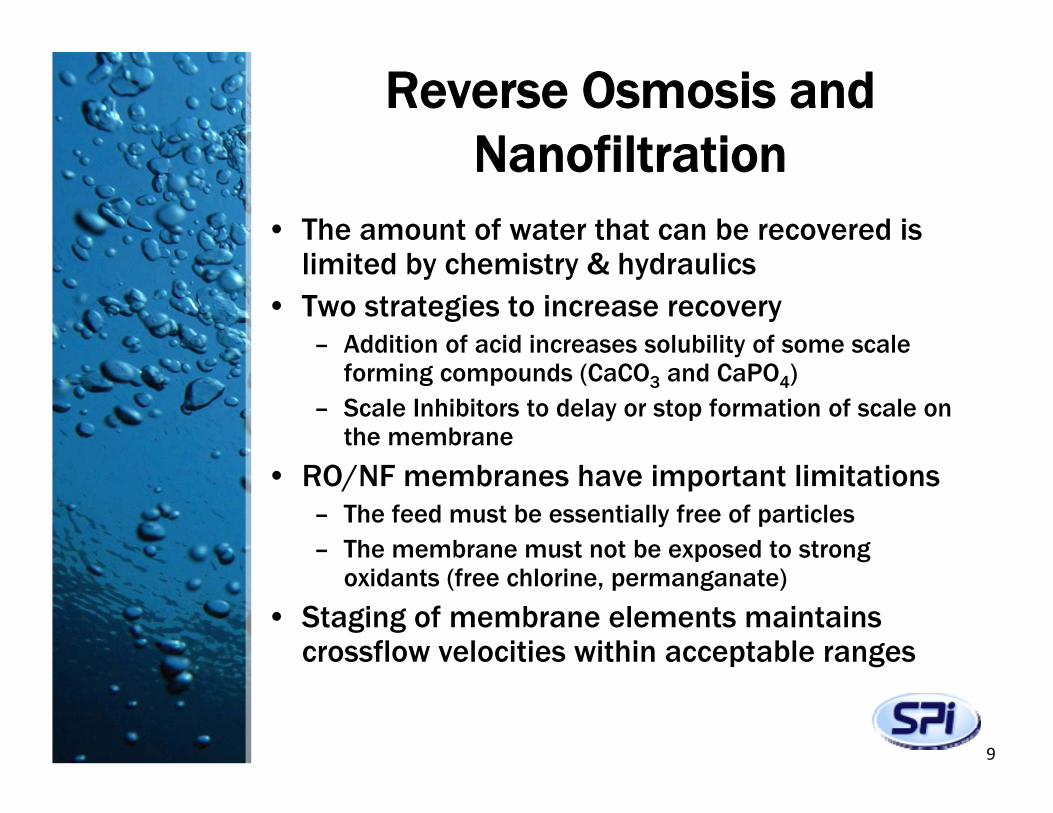
Reverse Osmosis and Nanofiltration
• The amount of water that can be recovered is limited by chemistry & hydraulics
• Two strategies to increase recovery– Addition of acid increases solubility of some scale
forming compounds (CaCO3 and CaPO4)– Scale Inhibitors to delay or stop formation of scale on
the membrane
• RO/NF membranes have important limitations– The feed must be essentially free of particles– The membrane must not be exposed to strong
oxidants (free chlorine, permanganate)
• Staging of membrane elements maintains crossflow velocities within acceptable ranges
9
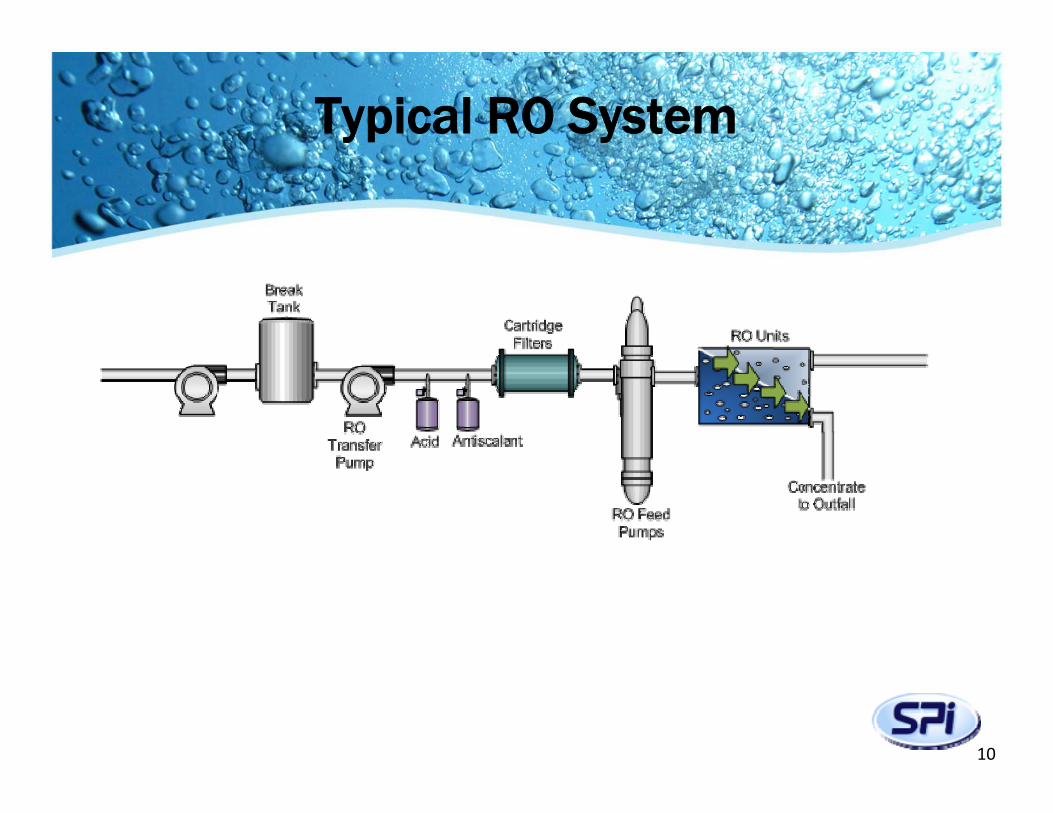
Typical RO System
10
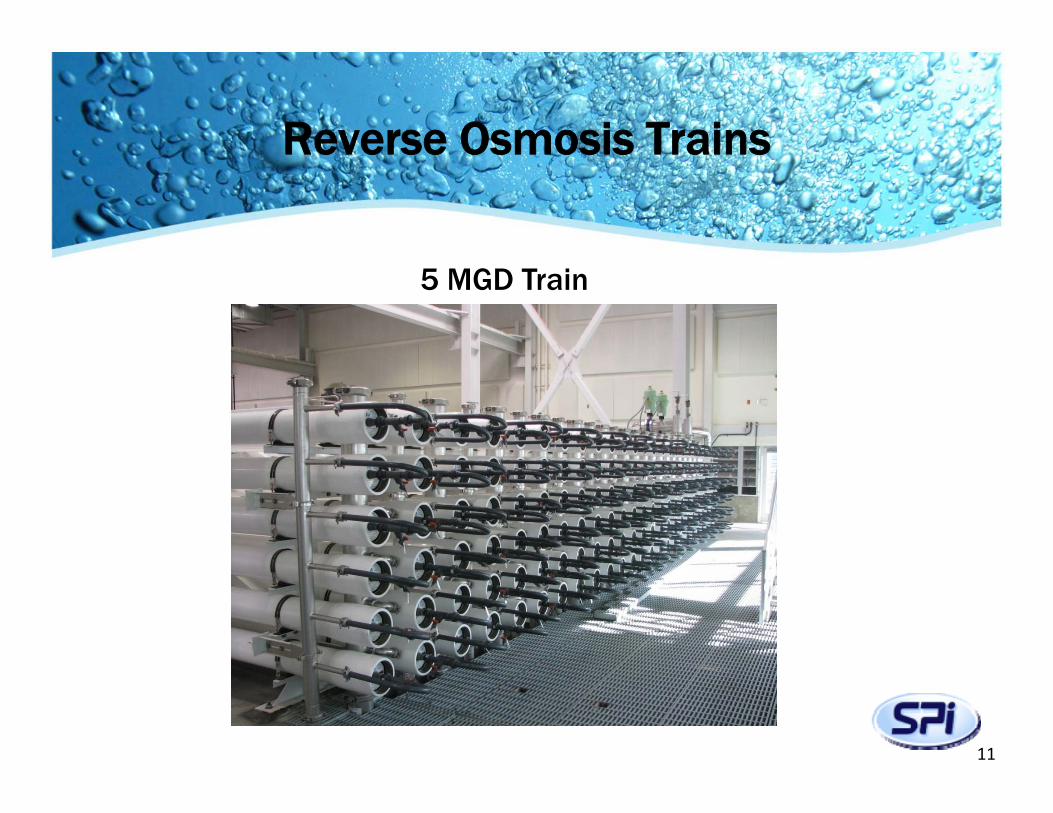
Reverse Osmosis Trains
11
5 MGD Train
RO / NF MEMBRANES & MODULES
12
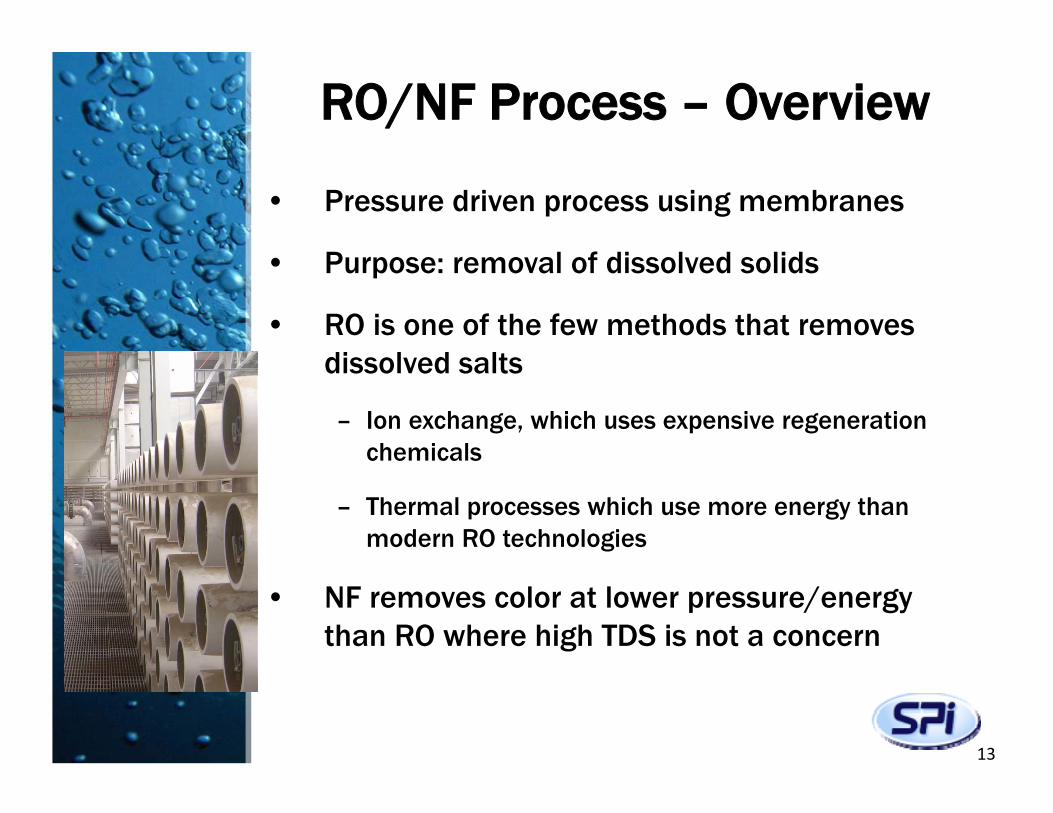
RO/NF Process – Overview
• Pressure driven process using membranes
• Purpose: removal of dissolved solids
• RO is one of the few methods that removes dissolved salts
– Ion exchange, which uses expensive regeneration chemicals
– Thermal processes which use more energy than modern RO technologies
• NF removes color at lower pressure/energy than RO where high TDS is not a concern
13
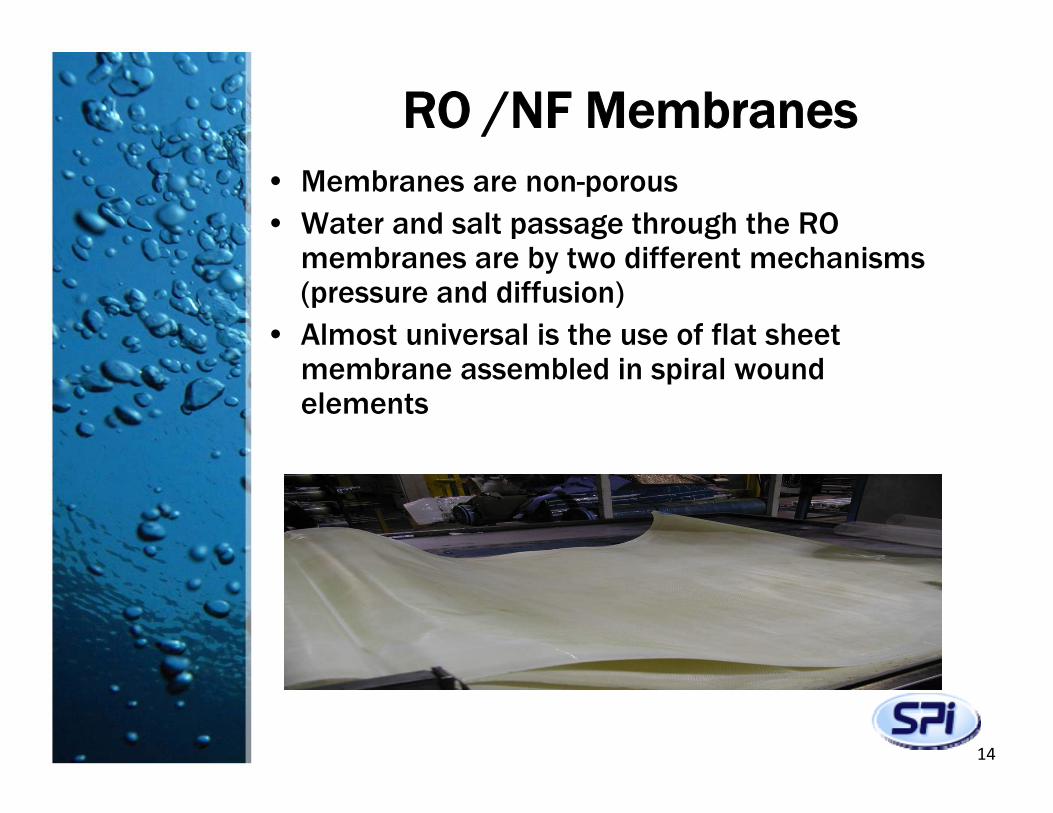
RO /NF Membranes• Membranes are non-porous• Water and salt passage through the RO
membranes are by two different mechanisms (pressure and diffusion)
• Almost universal is the use of flat sheet membrane assembled in spiral wound elements
14
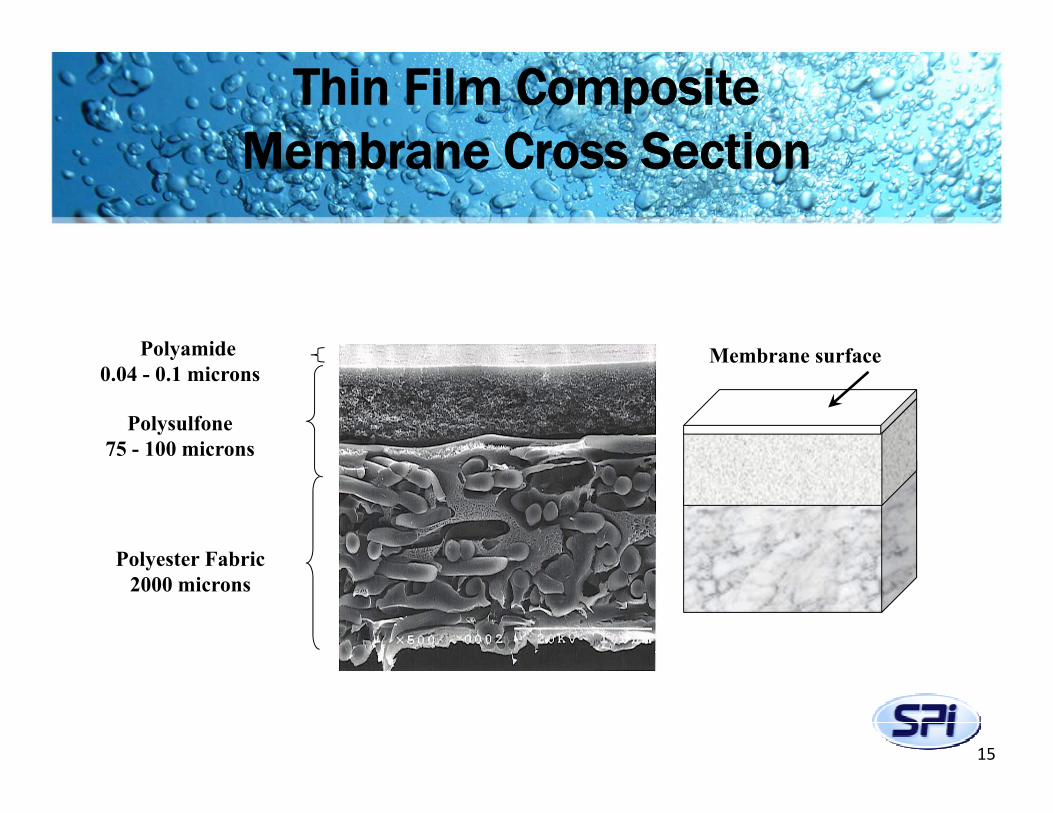
Thin Film Composite Membrane Cross Section
15
Polysulfone 75 - 100 microns
Polyester Fabric 2000 microns
Polyamide 0.04 - 0.1 microns
Membrane surface
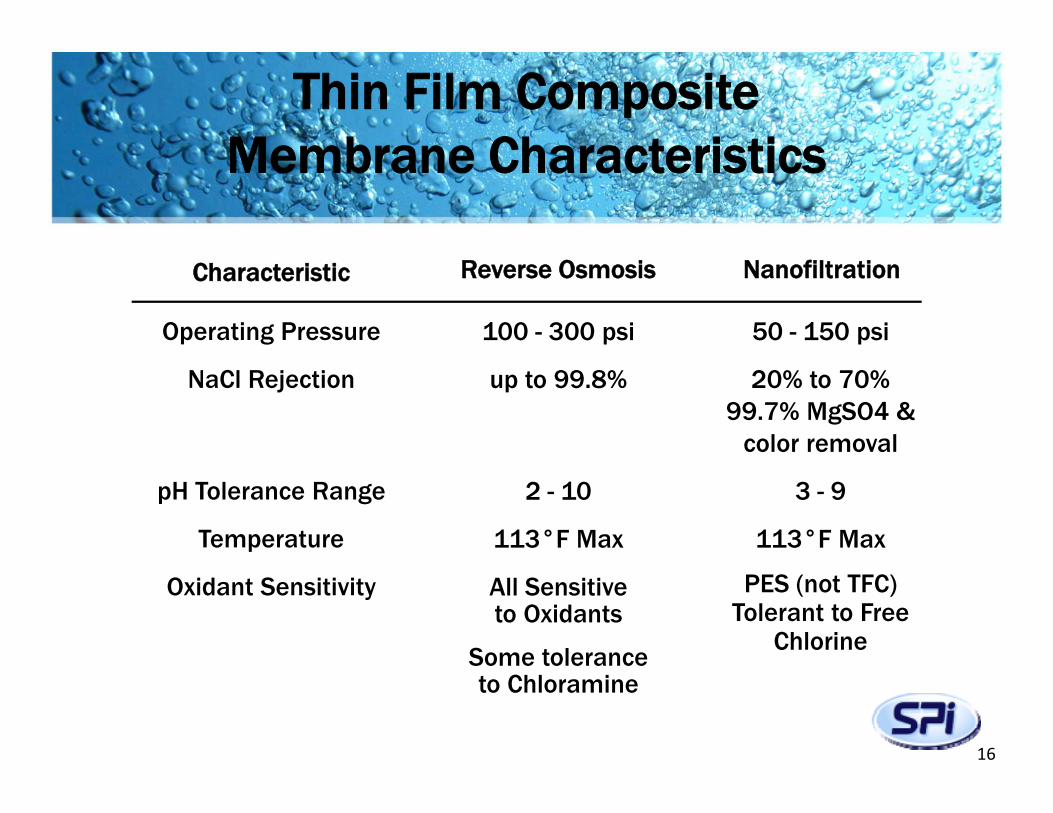
Thin Film CompositeMembrane Characteristics
Characteristic Reverse Osmosis Nanofiltration
100 - 300 psi
up to 99.8%
2 - 10
113°F Max
All Sensitiveto Oxidants
Some toleranceto Chloramine
50 - 150 psi
20% to 70%99.7% MgSO4 &
color removal
3 - 9
113°F Max
PES (not TFC) Tolerant to Free
Chlorine
Operating Pressure
NaCl Rejection
pH Tolerance Range
Temperature
Oxidant Sensitivity
16
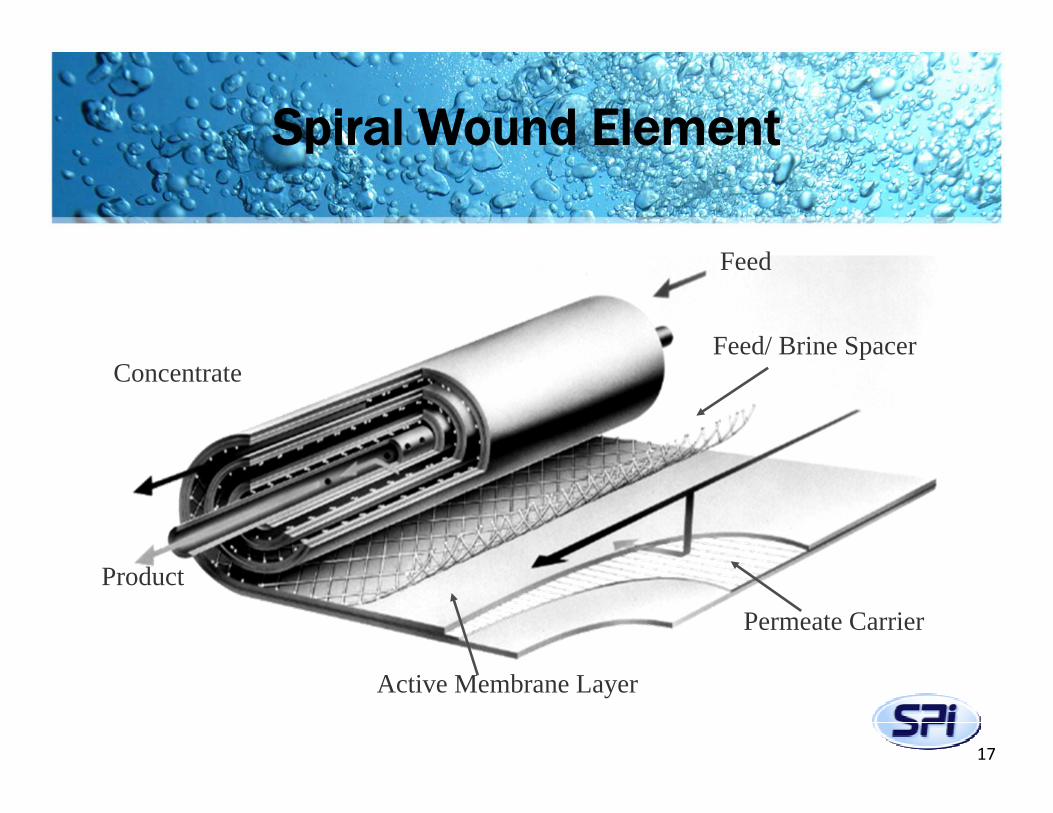
Spiral Wound Element
Feed
Feed/ Brine Spacer
Permeate Carrier
Product
Active Membrane Layer
Concentrate
17
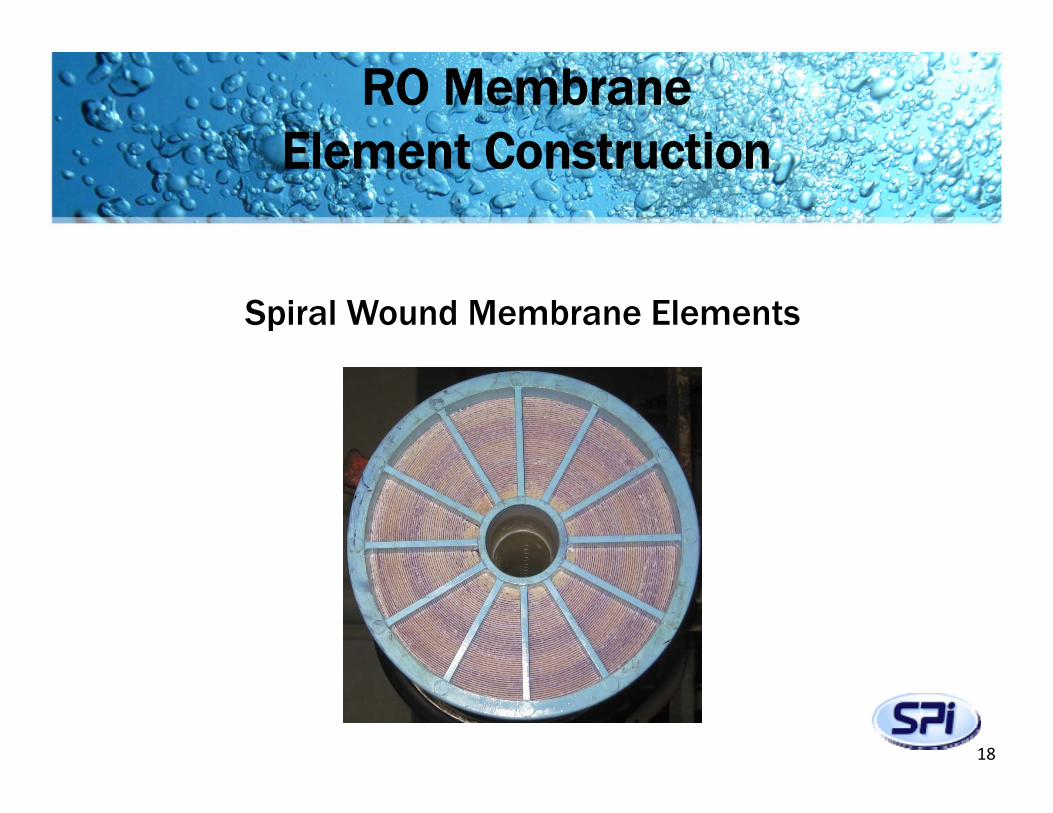
RO MembraneElement Construction
Spiral Wound Membrane Elements
18
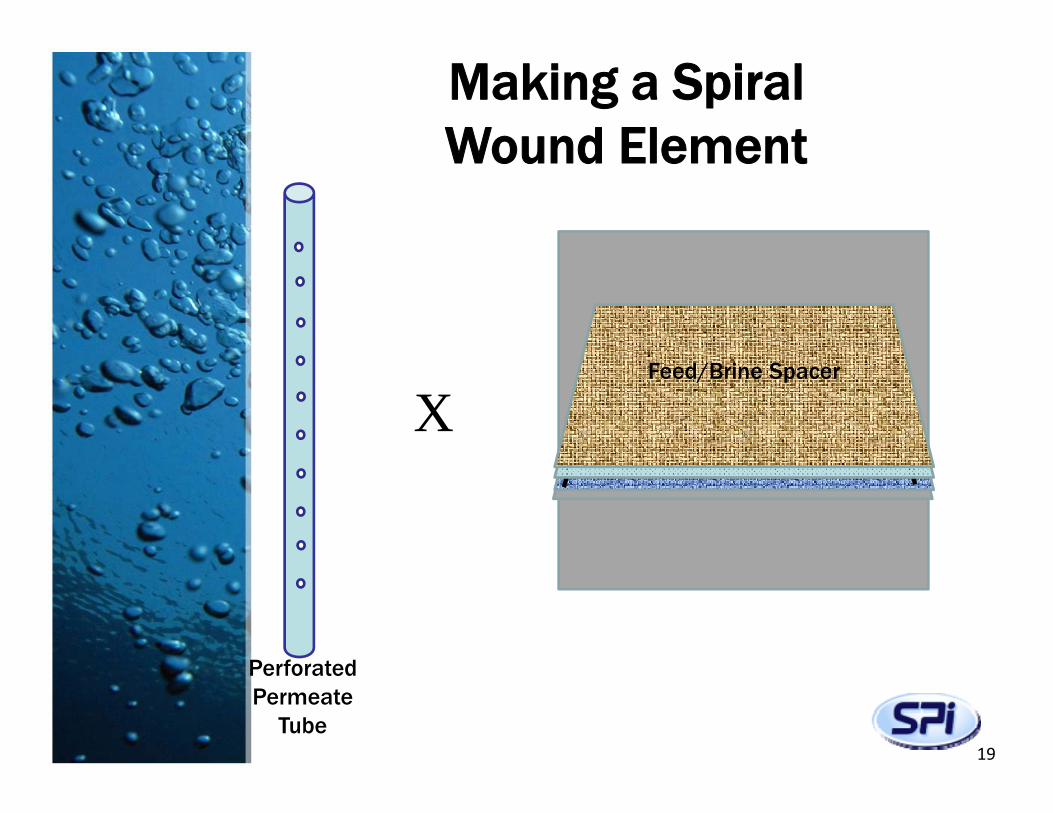
Making a Spiral Wound Element
PerforatedPermeate
Tube
XBackside of
RO Membrane Sheet
(RO Chemistry on
Opposite Side)
Backside of
RO Membrane Sheet
(RO Chemistry on
Opposite Side)
RO Permeate CarrierRO Membrane Sheet
(RO Chemistry Side)
Feed/Brine Spacer
19
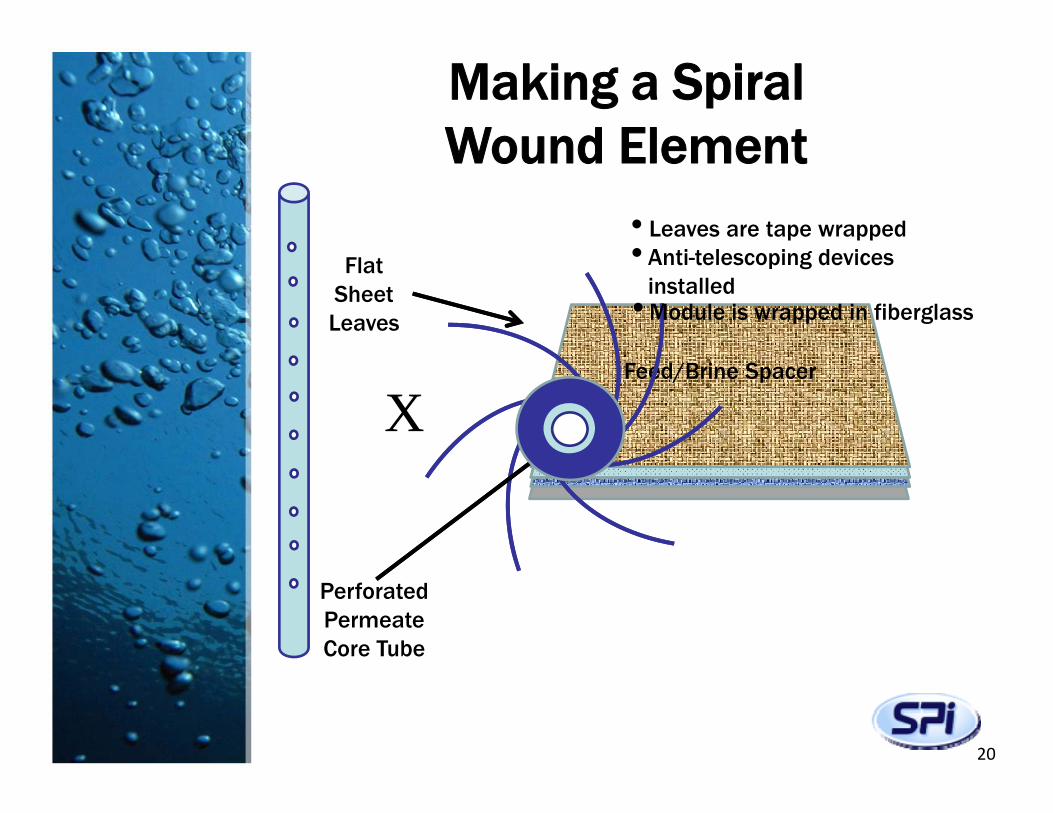
XBackside of
RO Membrane Sheet
(RO Chemistry on
Opposite Side)
RO Permeate CarrierRO Membrane Sheet
(RO Chemistry Side)
Feed/Brine Spacer
PerforatedPermeateCore Tube
FlatSheetLeaves
• Leaves are tape wrapped• Anti-telescoping devices
installed• Module is wrapped in fiberglass
Making a Spiral Wound Element
20
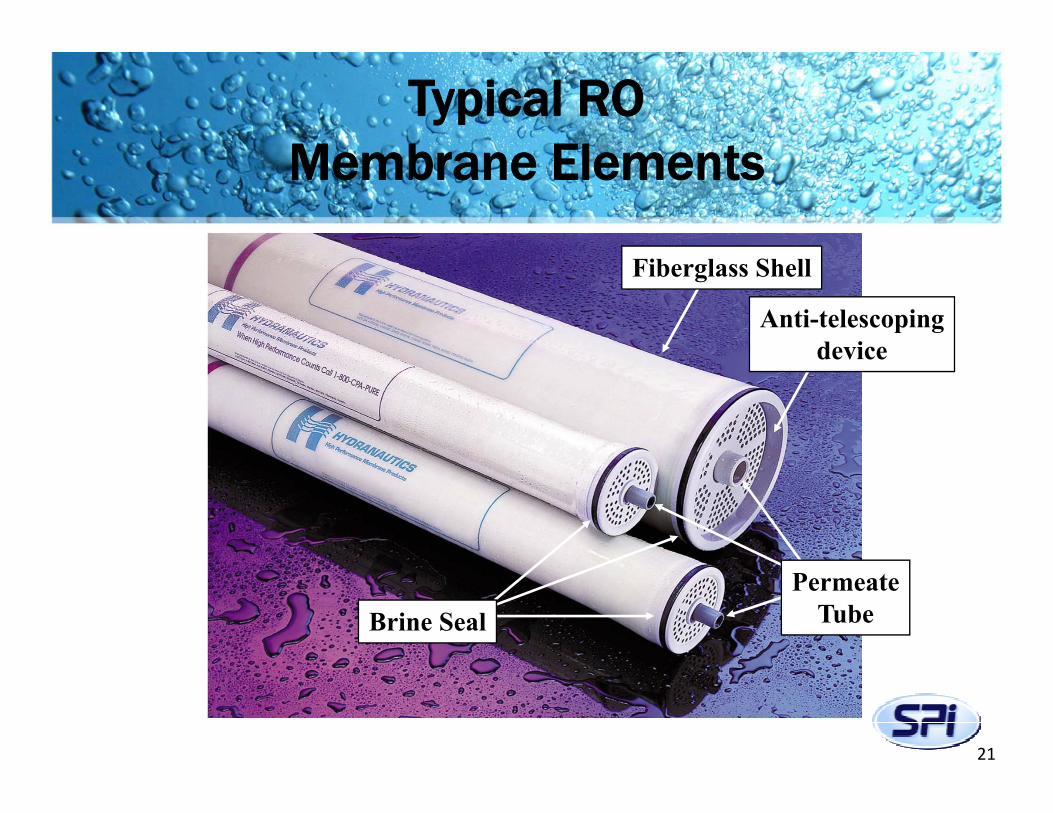
Typical RO Membrane Elements
Fiberglass Shell
Brine Seal
Anti-telescopingdevice
PermeateTube
21
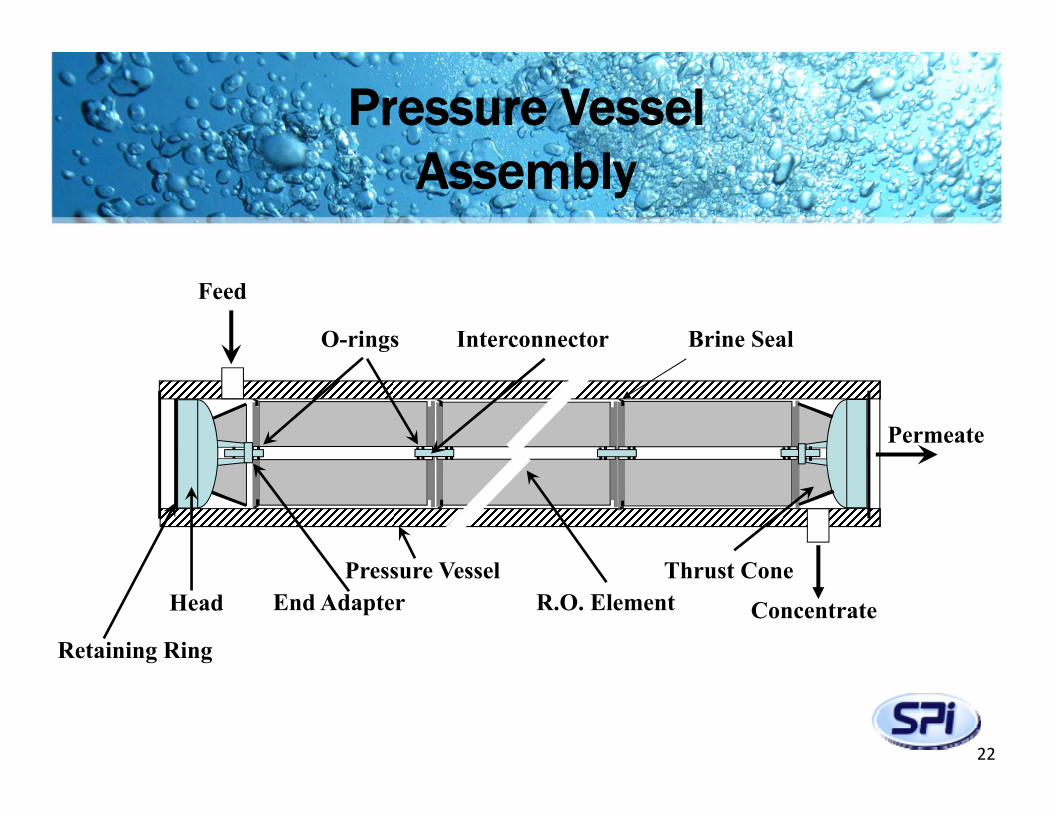
Pressure Vessel Assembly
Feed
Concentrate
Permeate
Head End Adapter R.O. Element
InterconnectorO-rings Brine Seal
Pressure Vessel
Retaining Ring
Thrust Cone
22
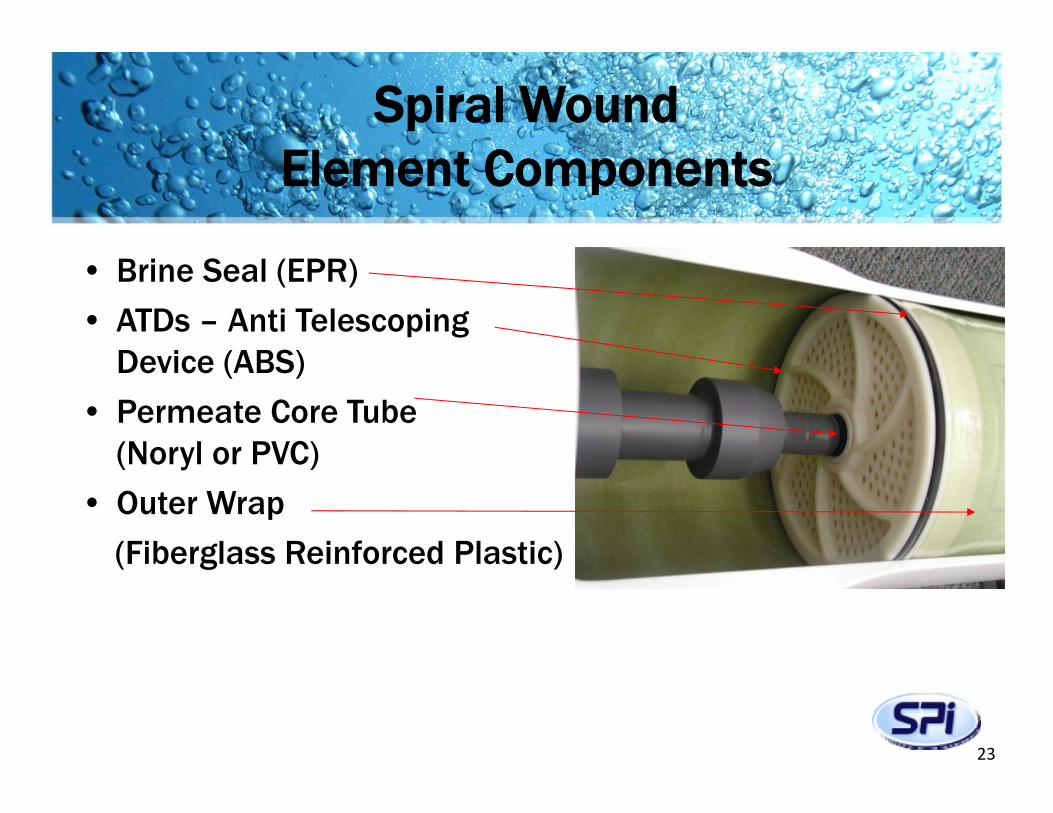
• Brine Seal (EPR)
• ATDs – Anti Telescoping Device (ABS)
• Permeate Core Tube (Noryl or PVC)
• Outer Wrap
(Fiberglass Reinforced Plastic)
Spiral Wound Element Components
23
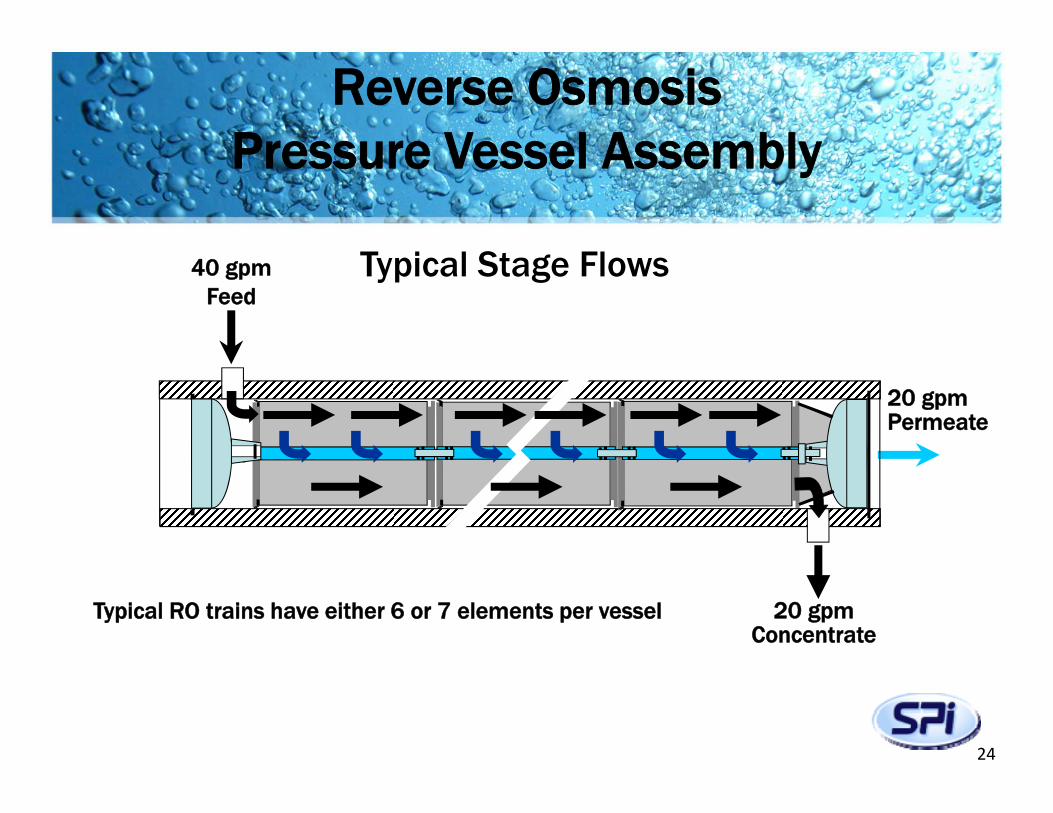
Reverse OsmosisPressure Vessel Assembly
40 gpm Feed
20 gpmConcentrate
20 gpmPermeate
Typical RO trains have either 6 or 7 elements per vessel
Typical Stage Flows
24
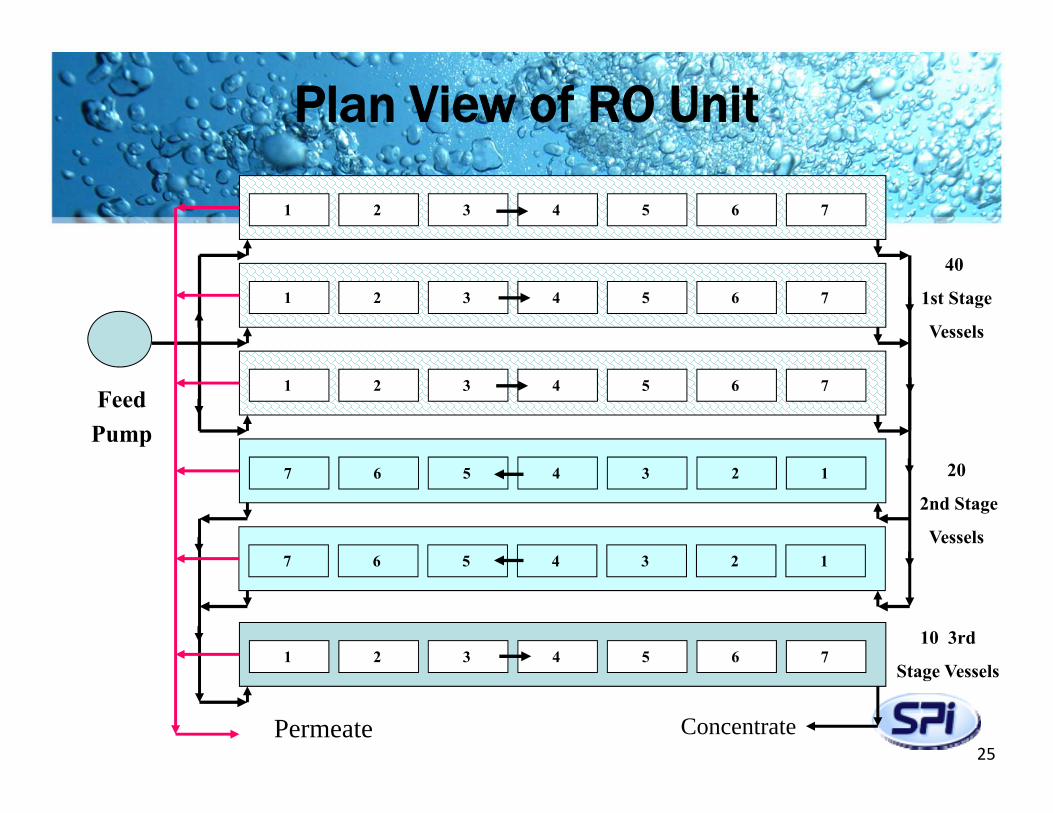
Plan View of RO Unit
1 2 3 4 5 6 7
1 2 3 4 5 6 7
1 2 3 4 5 6 7Feed
Pump
7 6 5 4 3 2 1
Permeate
7 6 5 4 3 2 1
1 2 3 4 5 6 7
Concentrate
40
1st Stage
Vessels
20
2nd Stage
Vessels
10 3rd
Stage Vessels
25
REVERSE OSMOSIS THEORY
26
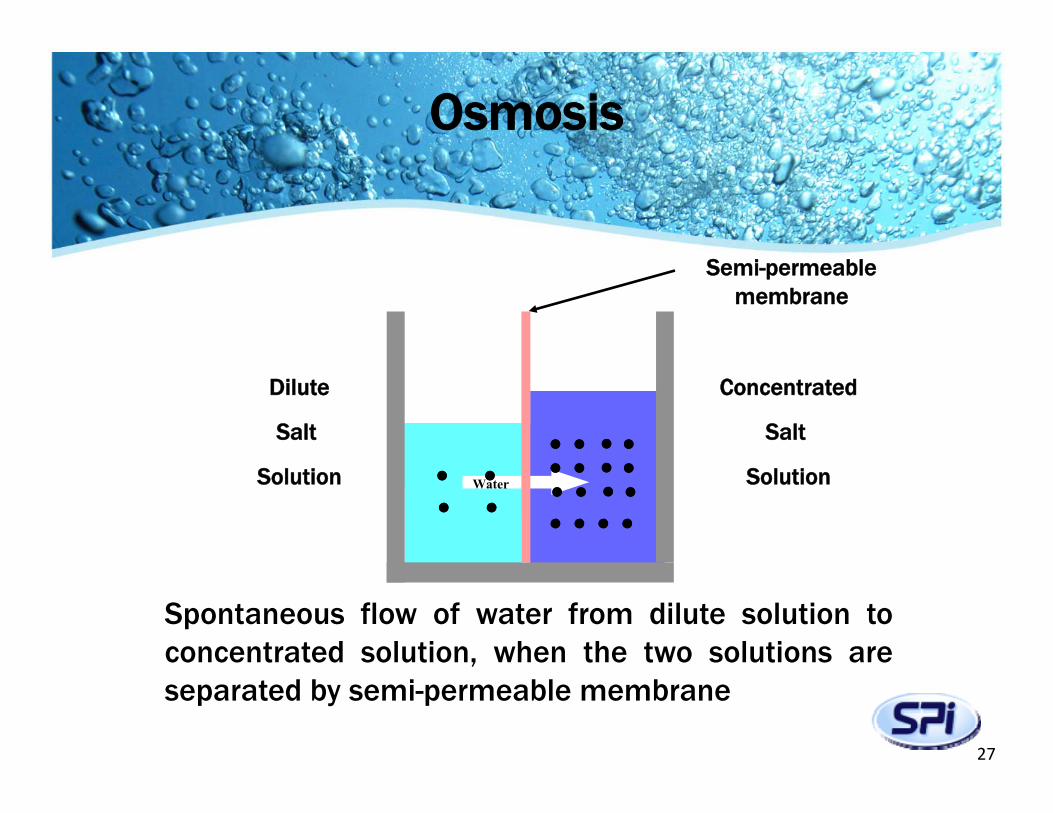
Spontaneous flow of water from dilute solution toconcentrated solution, when the two solutions areseparated by semi-permeable membrane
Dilute
Salt
Solution
Semi-permeable membrane
Concentrated
Salt
SolutionWater
Osmosis
27
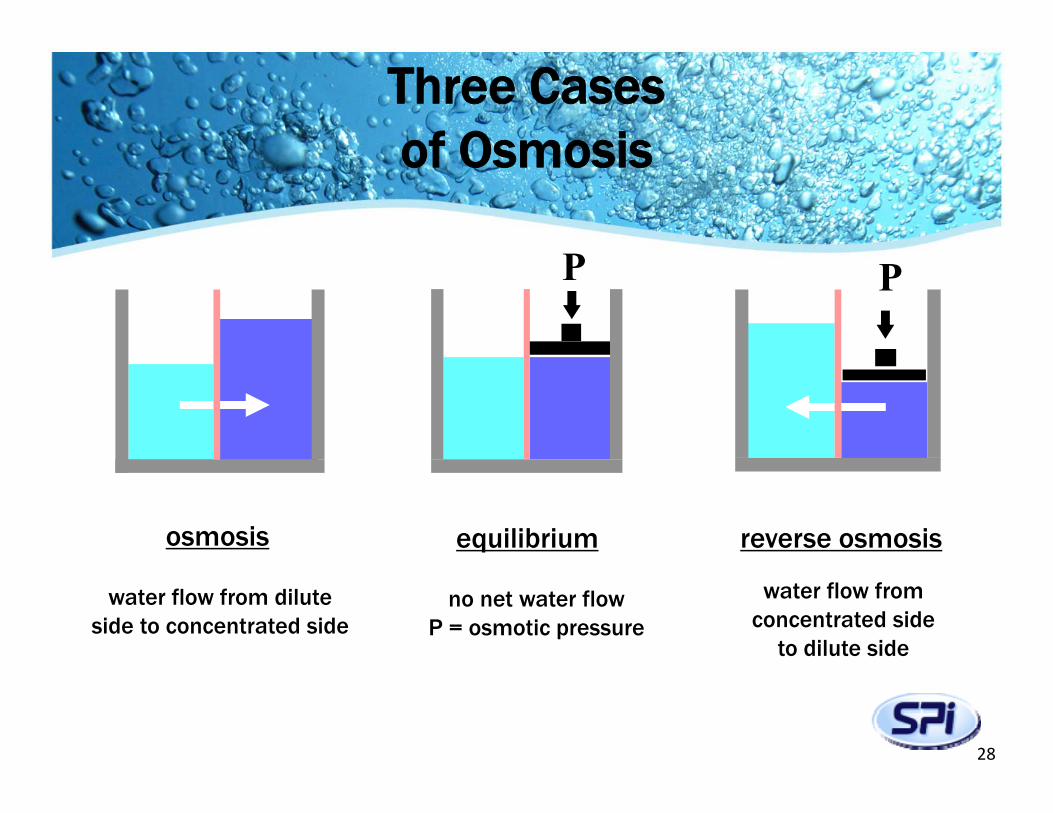
Three Cases of Osmosis
osmosis equilibrium reverse osmosis
PP
water flow from dilute side to concentrated side
no net water flowP = osmotic pressure
water flow from concentrated side
to dilute side
28
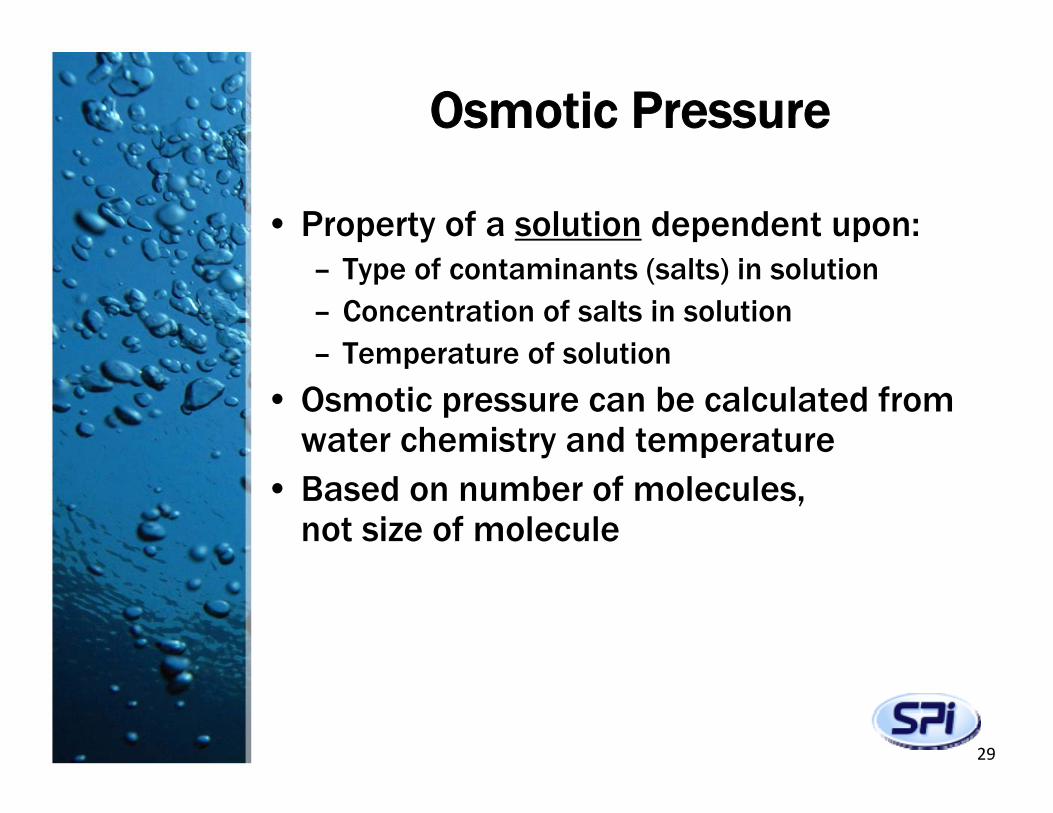
Osmotic Pressure
• Property of a solution dependent upon:– Type of contaminants (salts) in solution– Concentration of salts in solution– Temperature of solution
• Osmotic pressure can be calculated from water chemistry and temperature
• Based on number of molecules,not size of molecule
29
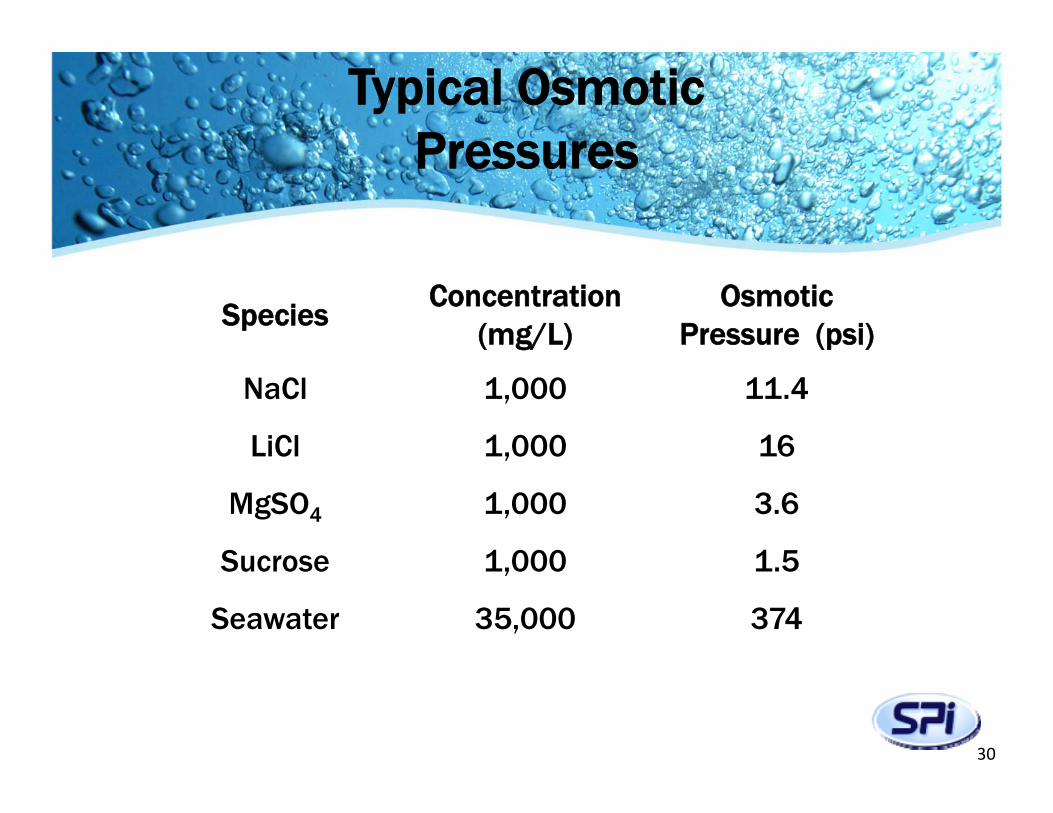
SpeciesConcentration
(mg/L)Osmotic
Pressure (psi)
NaCl 1,000 11.4
LiCl 1,000 16
MgSO4 1,000 3.6
Sucrose 1,000 1.5
Seawater 35,000 374
Typical Osmotic Pressures
30
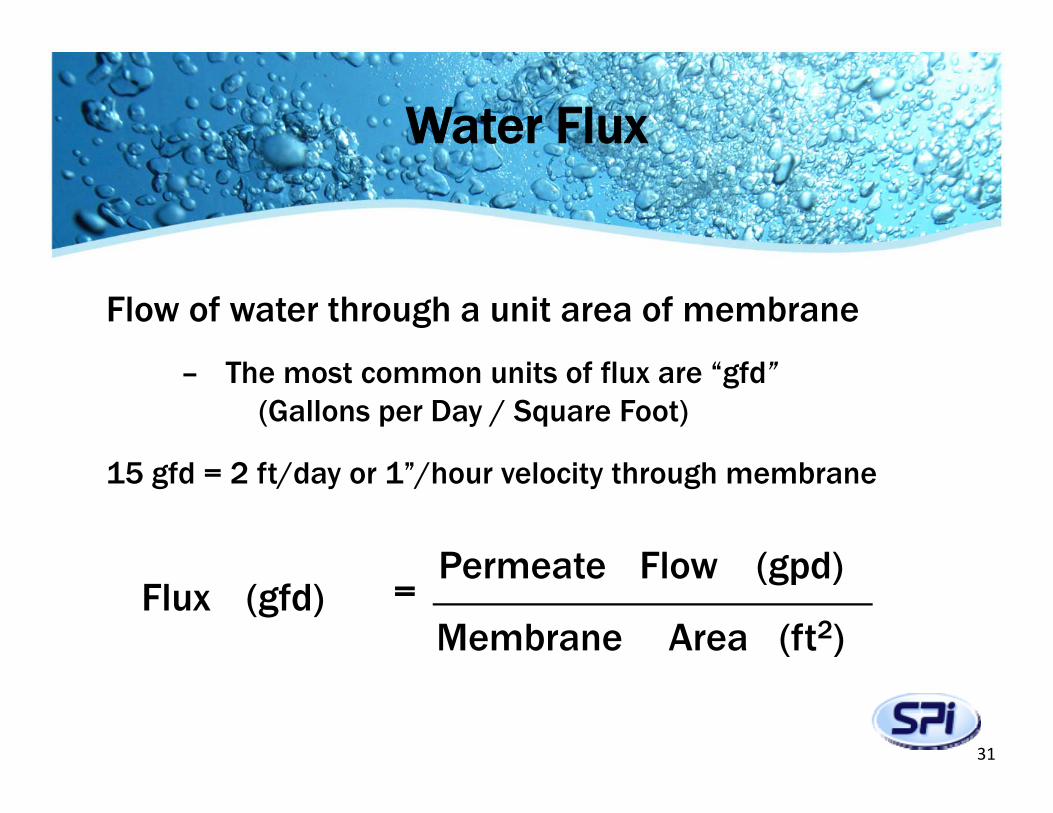
Water Flux
Flow of water through a unit area of membrane
– The most common units of flux are “gfd”(Gallons per Day / Square Foot)
15 gfd = 2 ft/day or 1”/hour velocity through membrane
(ft2)AreaMembrane
(gpd)FlowPermeate(gfd)Flux =
31
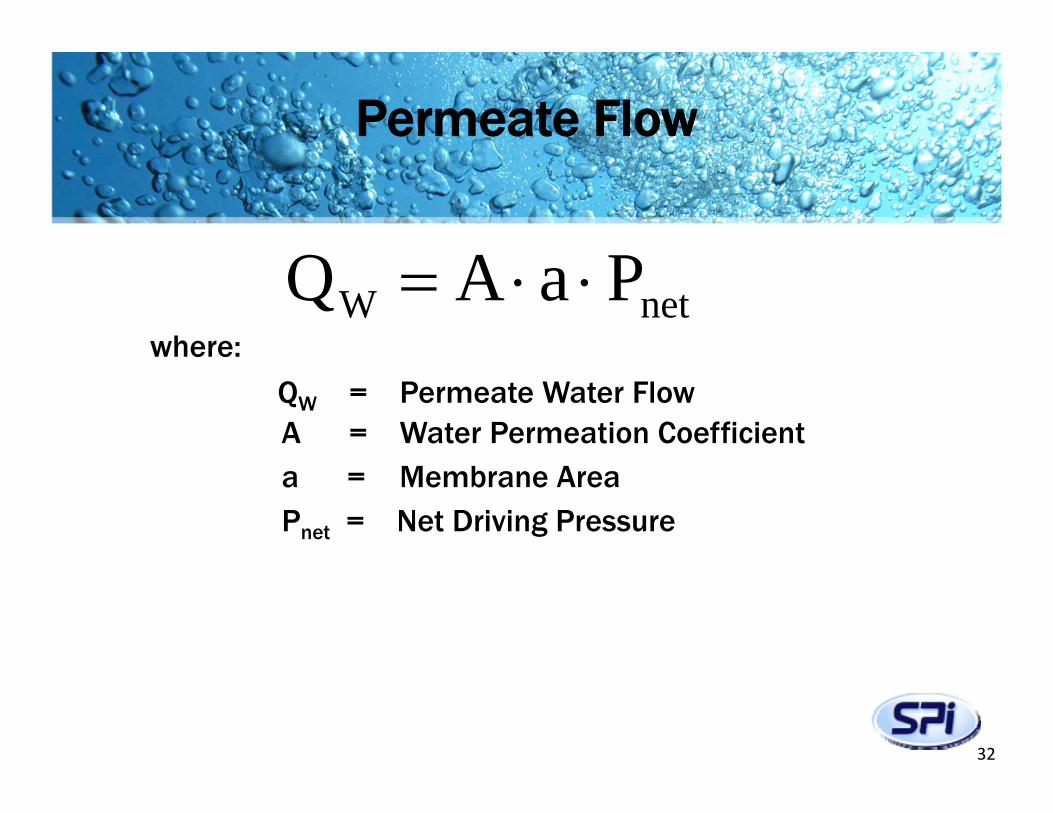
where:
QW = Permeate Water Flow A = Water Permeation Coefficienta = Membrane AreaPnet = Net Driving Pressure
netW PaAQ
Permeate Flow
32
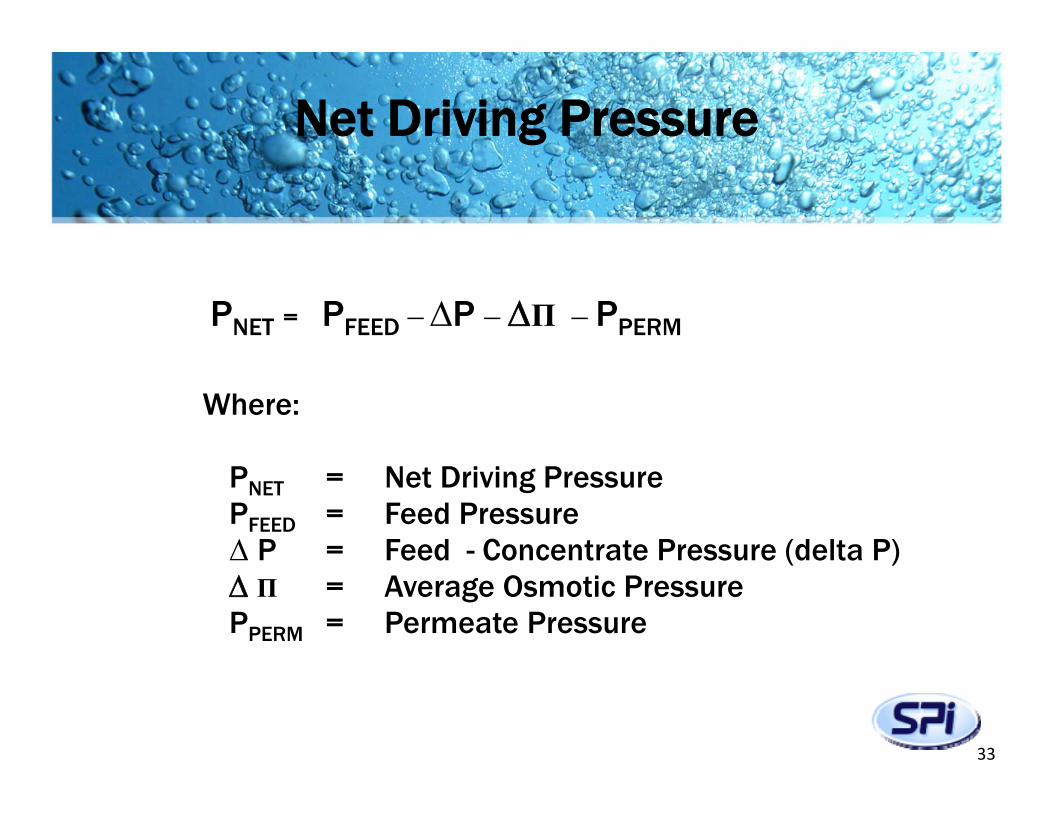
Net Driving Pressure
33
PNET = PFEED –∆P – П – PPERM
Where:
PNET = Net Driving PressurePFEED = Feed Pressure∆ P = Feed - Concentrate Pressure (delta P) П = Average Osmotic PressurePPERM = Permeate Pressure
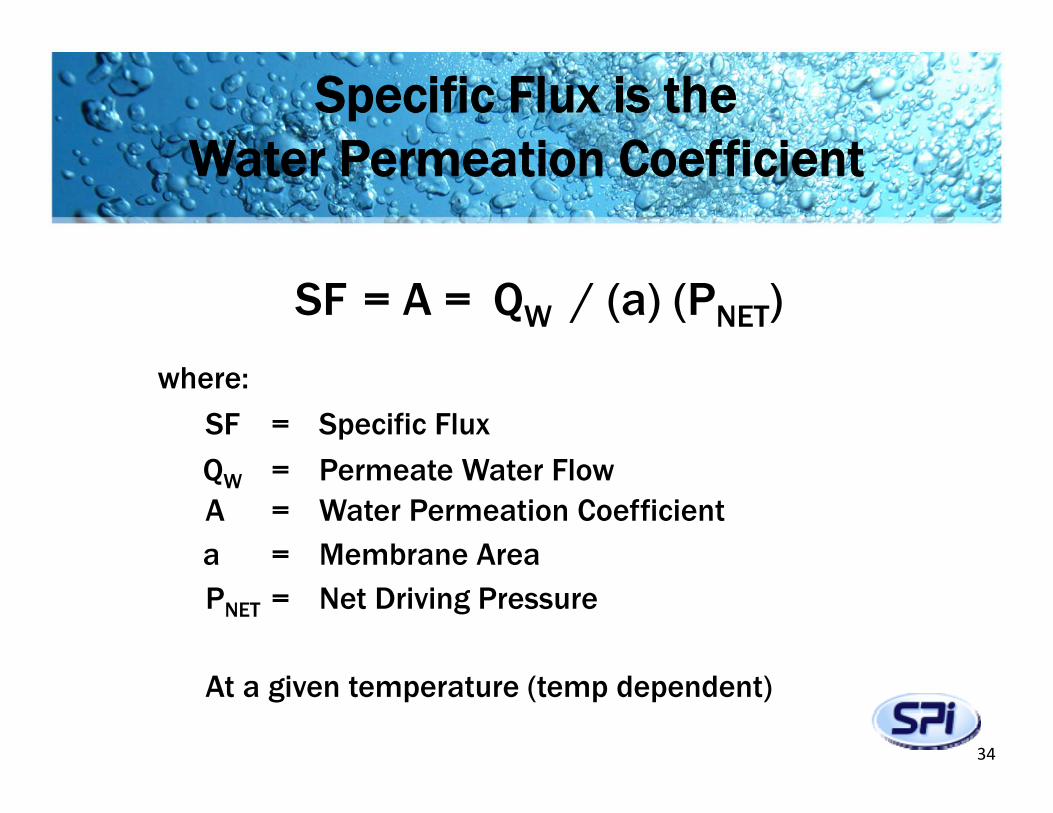
where:
SF = Specific Flux
QW = Permeate Water Flow A = Water Permeation Coefficienta = Membrane AreaPNET = Net Driving Pressure
At a given temperature (temp dependent)
Specific Flux is the Water Permeation Coefficient
34
SF = A = QW / (a) (PNET)
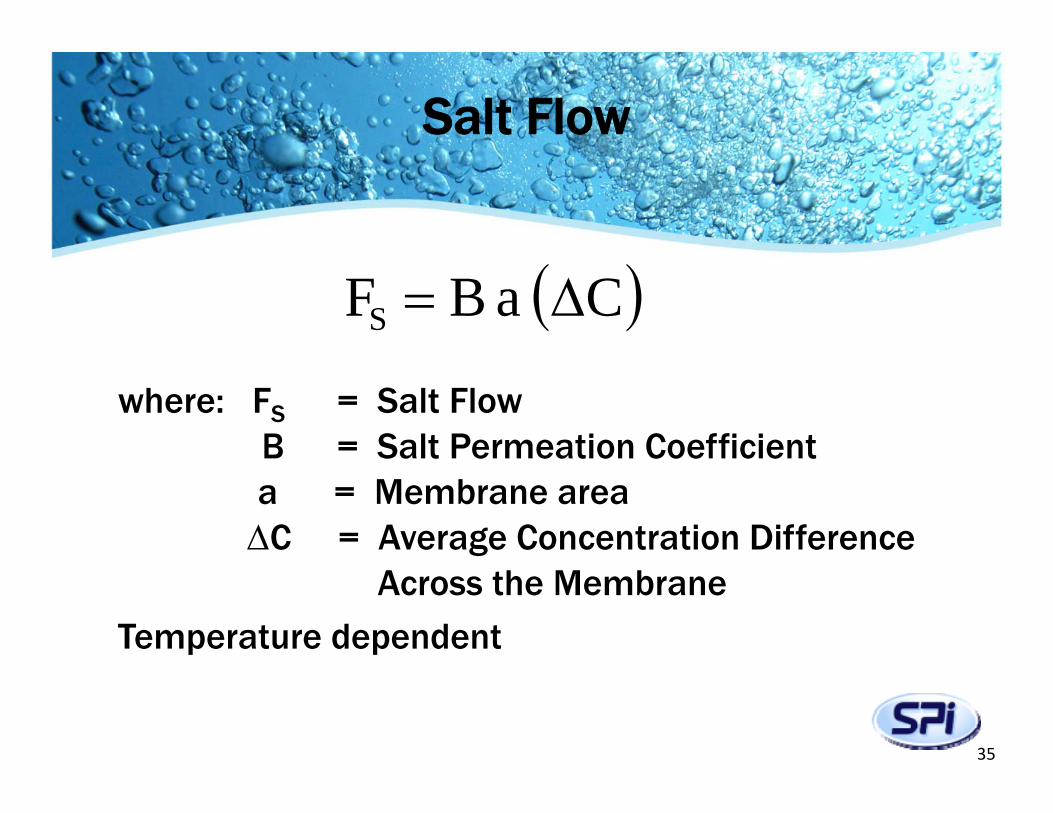
Salt Flow
where: FS = Salt Flow B = Salt Permeation Coefficienta = Membrane area
C = Average Concentration Difference Across the Membrane
Temperature dependent
C a BFS
35
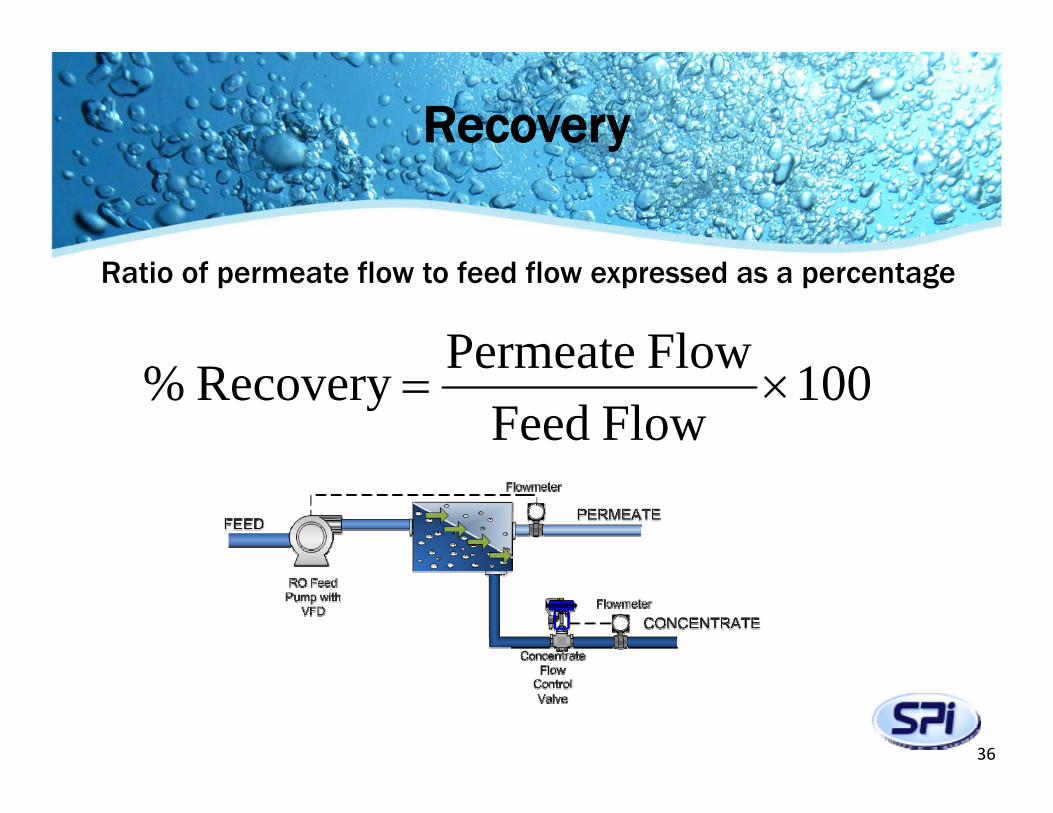
Recovery
Ratio of permeate flow to feed flow expressed as a percentage
100 Flow Feed
Flow Permeate Recovery %
36
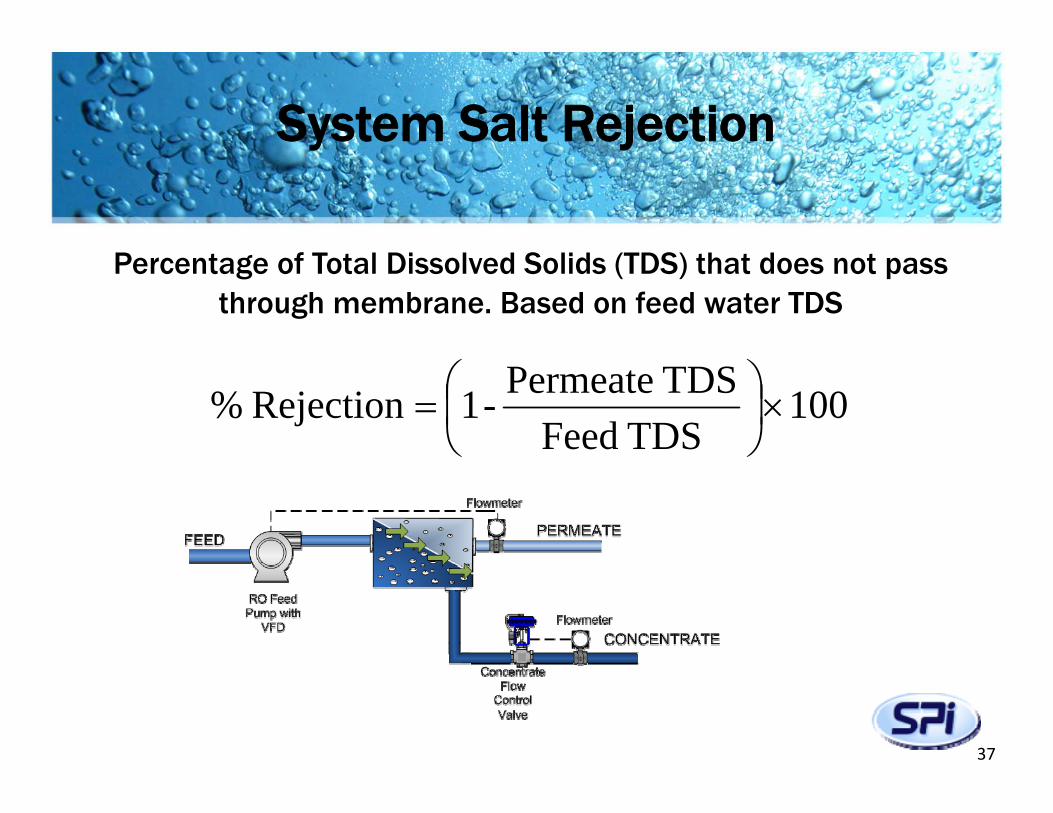
System Salt Rejection
Percentage of Total Dissolved Solids (TDS) that does not pass through membrane. Based on feed water TDS
100 TDS Feed
TDS Permeate-1 Rejection %
37
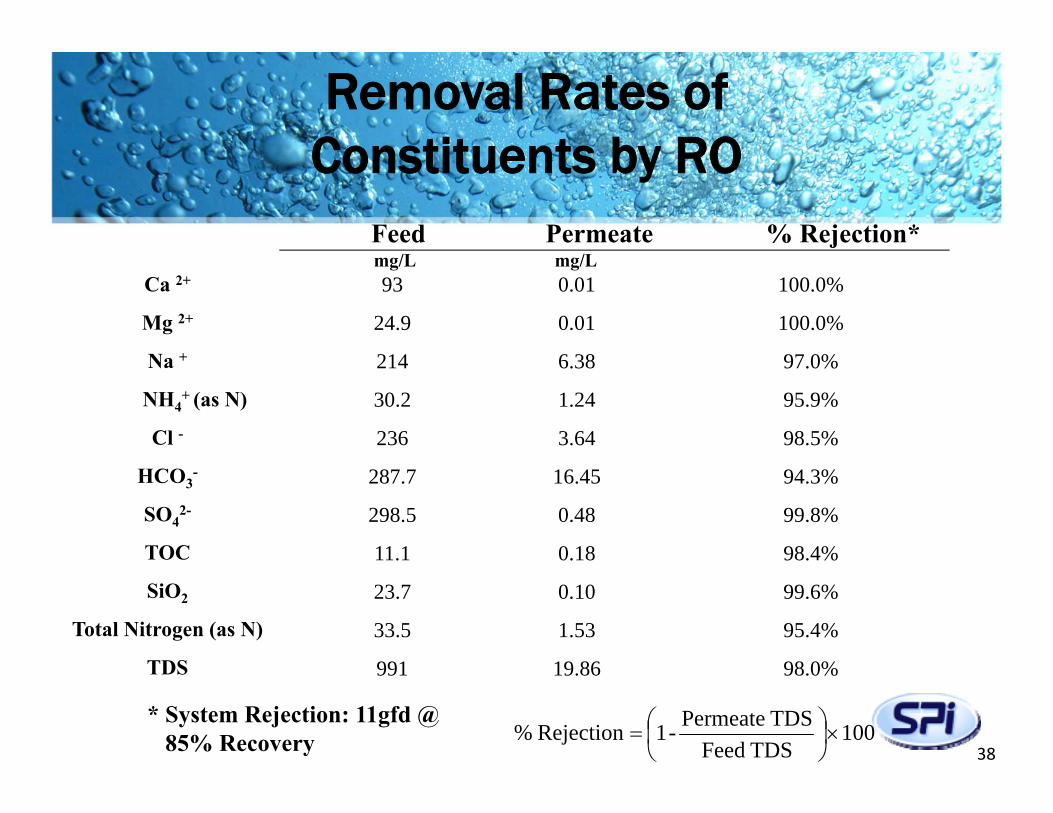
Removal Rates of Constituents by RO
Feed Permeate % Rejection* mg/L mg/L
Ca 2+
Mg 2+
Na +
NH4+ (as N)
Cl -
HCO3-
SO42-
TOC
SiO2
Total Nitrogen (as N)
TDS
* System Rejection: 11gfd @ 85% Recovery 100
TDS FeedTDS Permeate-1 Rejection %
93 0.01 100.0%
24.9 0.01 100.0%
214 6.38 97.0%
30.2 1.24 95.9%
236 3.64 98.5%
287.7 16.45 94.3%
298.5 0.48 99.8%
11.1 0.18 98.4%
23.7 0.10 99.6%
33.5 1.53 95.4%
991 19.86 98.0%
38
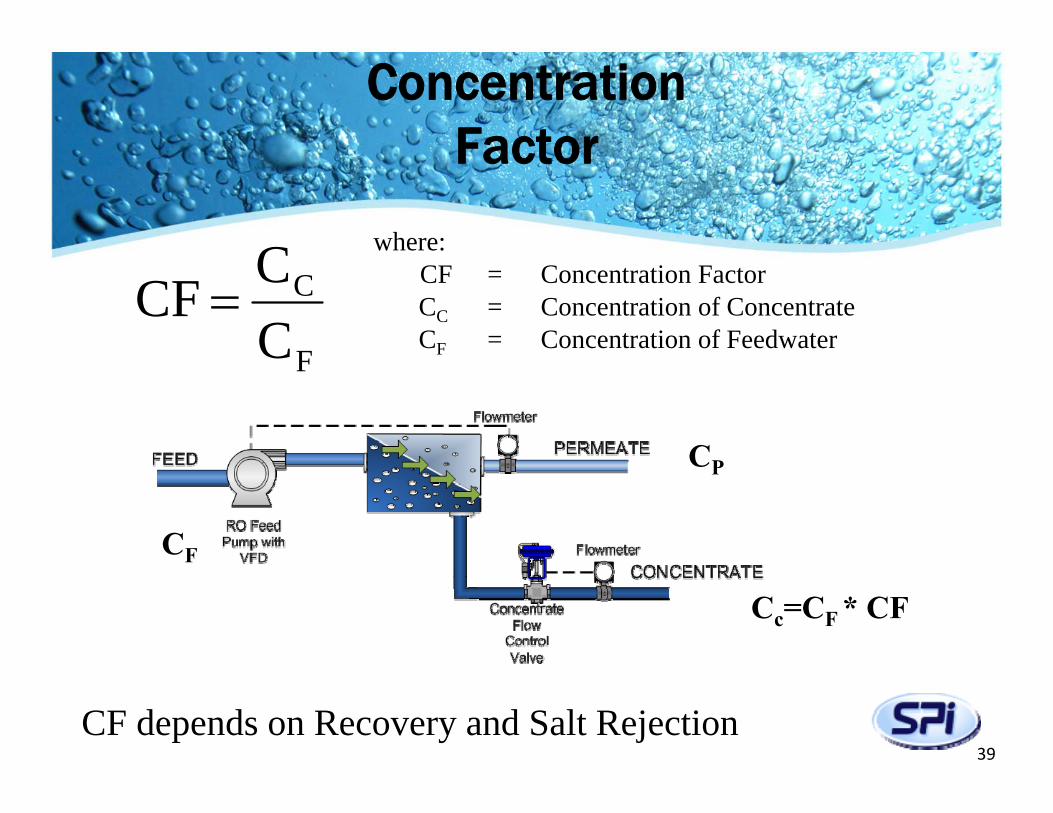
where:CF = Concentration Factor CC = Concentration of ConcentrateCF = Concentration of Feedwater
F
C
CC CF
Concentration Factor
CF depends on Recovery and Salt Rejection
CF
CP
Cc=CF * CF
39
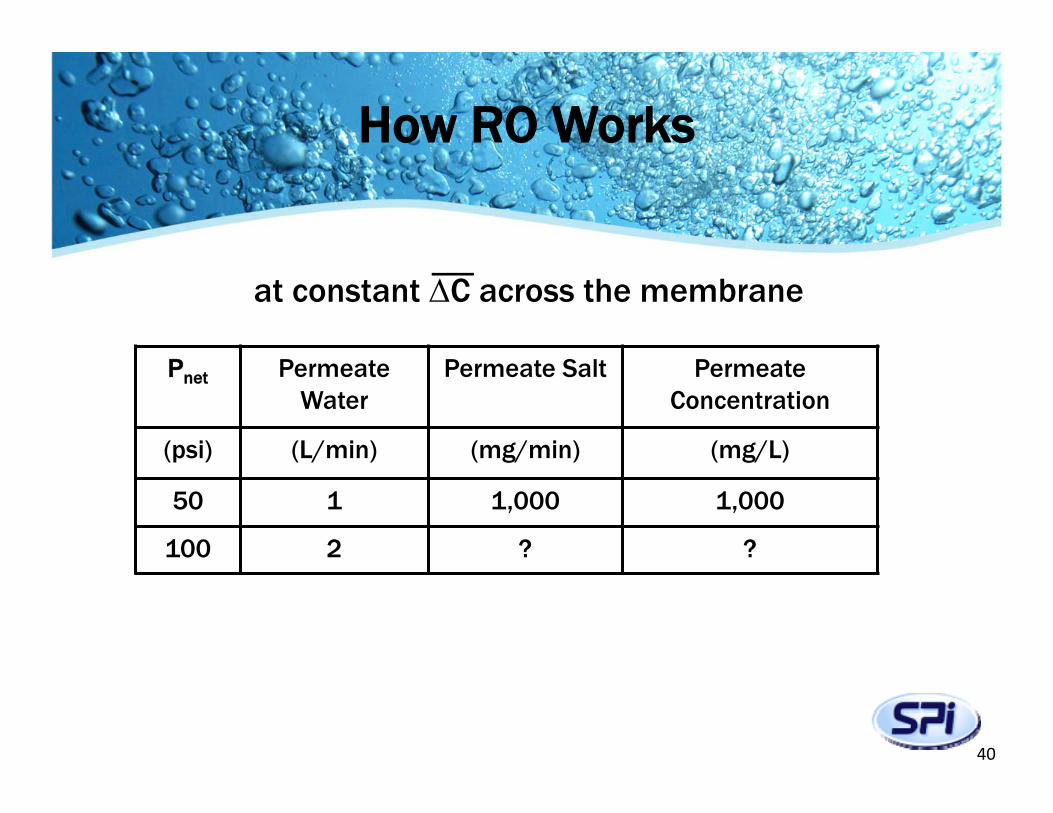
at constant C across the membrane
How RO Works
Pnet Permeate Water
Permeate Salt Permeate Concentration
(psi) (L/min) (mg/min) (mg/L)
50 1 1,000 1,000
100 2 ? ?
40
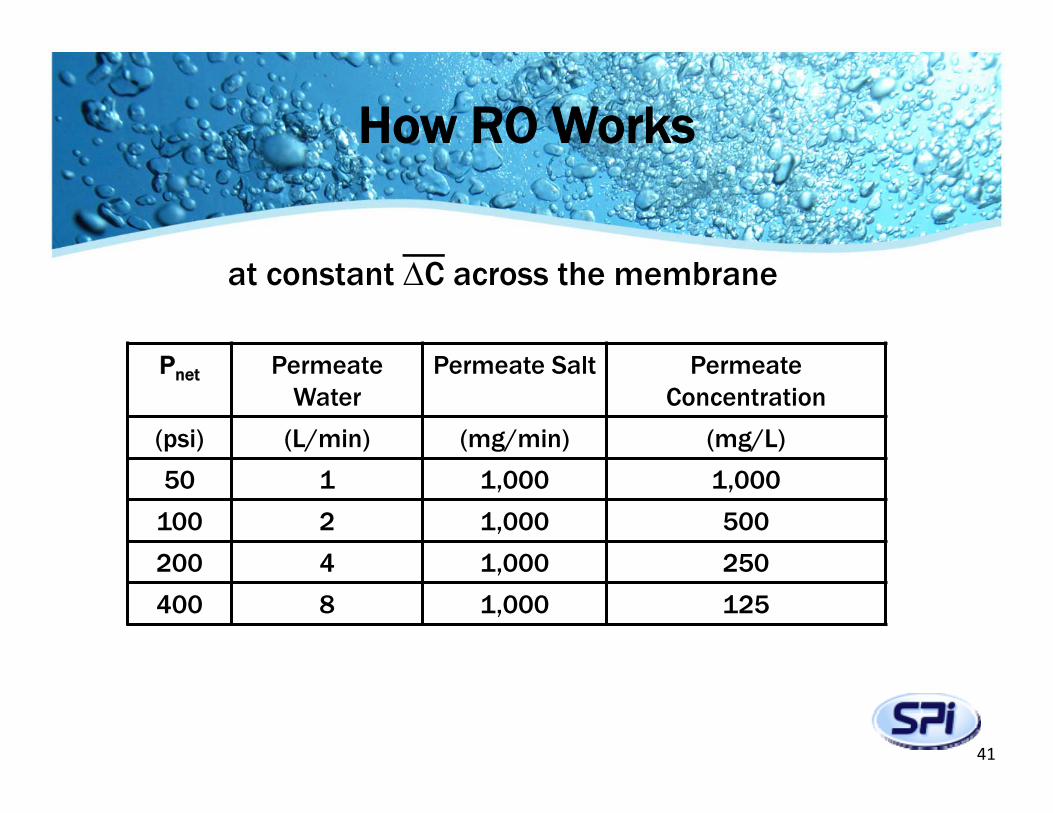
How RO Works
at constant C across the membrane
Pnet Permeate Water
Permeate Salt Permeate Concentration
(psi) (L/min) (mg/min) (mg/L)
50 1 1,000 1,000
100 2 1,000 500
200 4 1,000 250
400 8 1,000 125
41
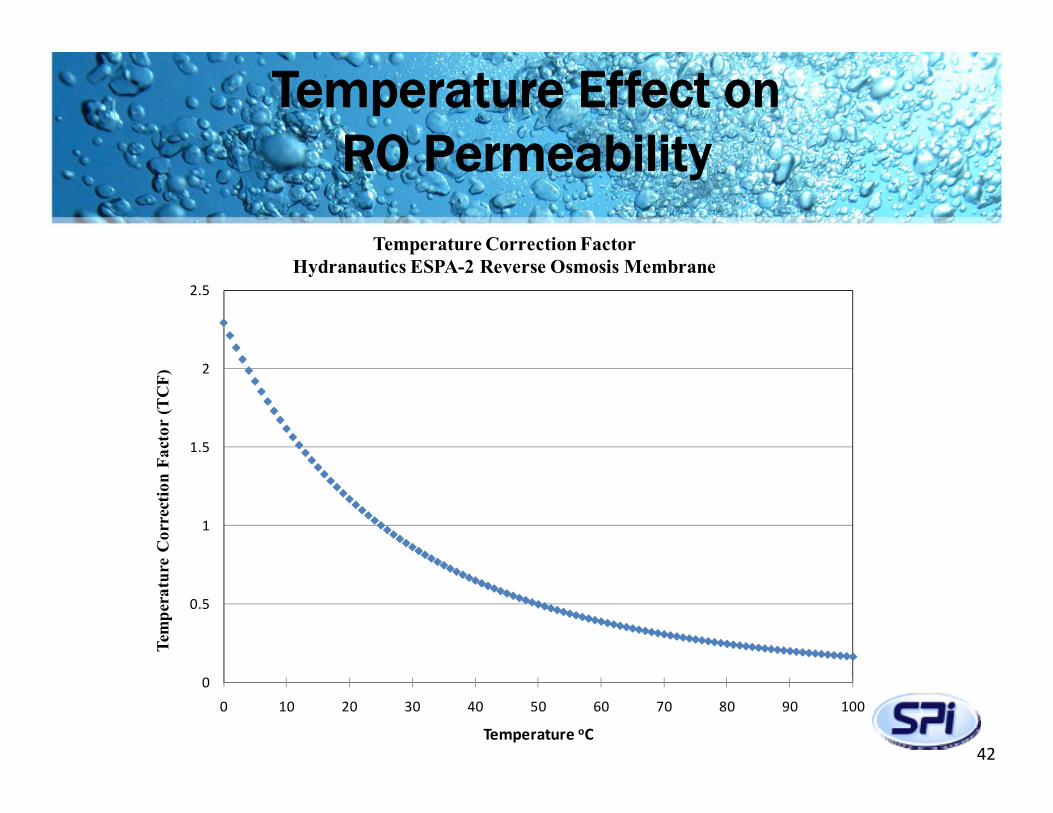
Temperature Effect on RO Permeability
0
0.5
1
1.5
2
2.5
0 10 20 30 40 50 60 70 80 90 100
Tem
pera
ture
Cor
rect
ion
Fact
or (T
CF)
Temperature oC
Temperature Correction Factor Hydranautics ESPA-2 Reverse Osmosis Membrane
42
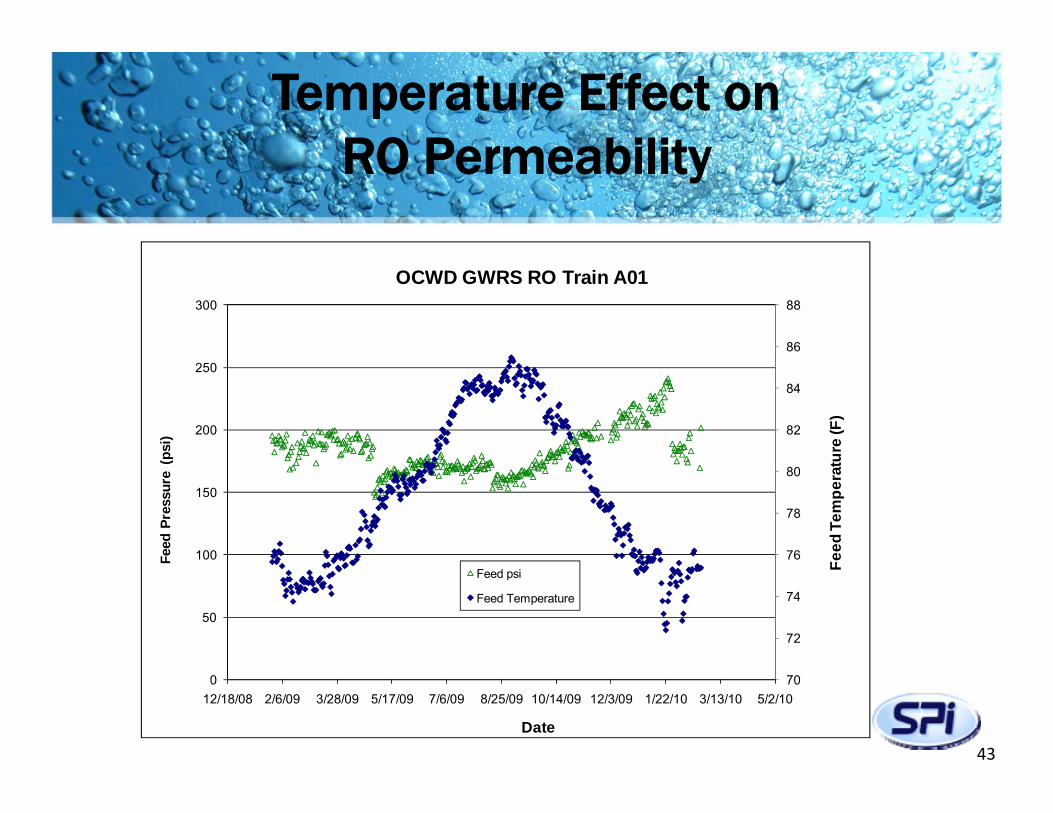
Temperature Effect on RO Permeability
43
70
72
74
76
78
80
82
84
86
88
0
50
100
150
200
250
300
12/18/08 2/6/09 3/28/09 5/17/09 7/6/09 8/25/09 10/14/09 12/3/09 1/22/10 3/13/10 5/2/10
Feed
Tem
pera
ture
(F)
Feed
Pre
ssur
e (p
si)
Date
OCWD GWRS RO Train A01
Feed psi
Feed Temperature
OPERATION
44
Important points about Reverse Osmosis
• Membrane Performance is local to each element
• Osmotic pressure must be overcome to obtain flow
• Flow of water through membrane is a function of local net driving pressure
• Flow of salt through membrane is a function of local salt concentration
• Osmotic pressure of feed increases as salts are rejected, lowering the net driving pressure
• Increasing water temperature will increase water flow and salt passage
45
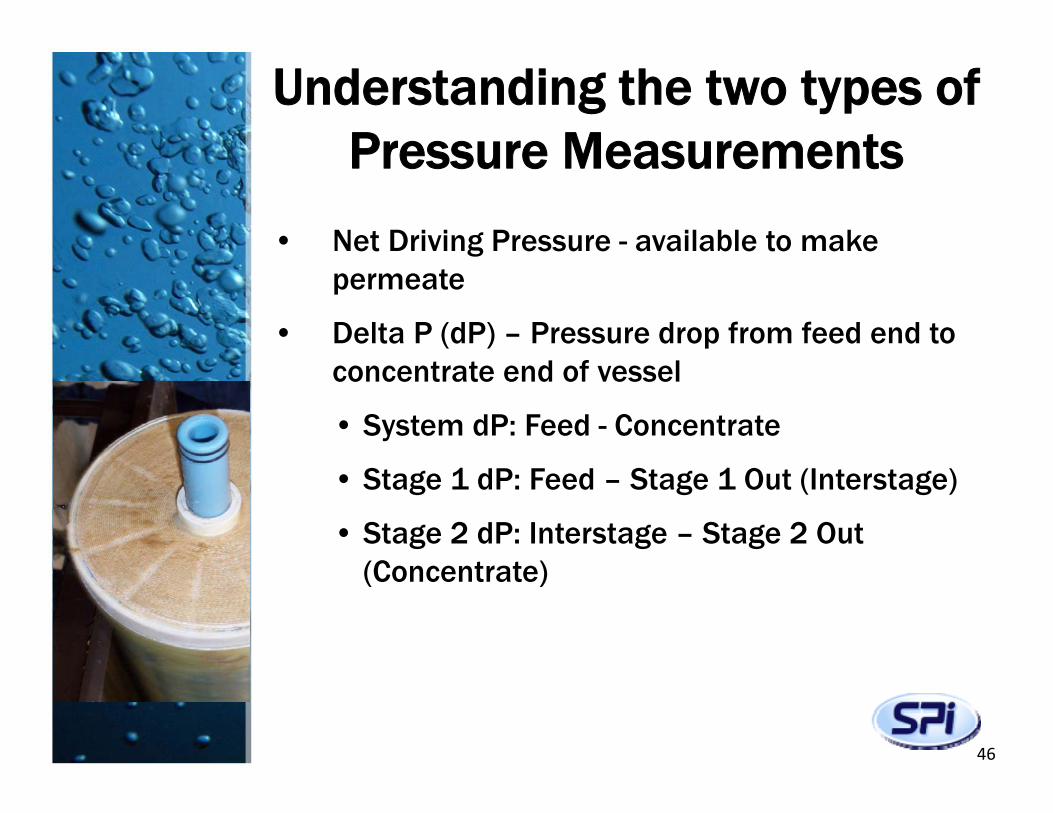
Understanding the two types of Pressure Measurements
• Net Driving Pressure - available to make permeate
• Delta P (dP) – Pressure drop from feed end to concentrate end of vessel
• System dP: Feed - Concentrate
• Stage 1 dP: Feed – Stage 1 Out (Interstage)
• Stage 2 dP: Interstage – Stage 2 Out (Concentrate)
46
RO Process – Criteria for Successful Operation
• Operate system at design permeate and concentrate setpoints
• Minimize (and monitor) the operating pressure required
• Normalize operating data for overall system and for each stage if possible
– Specific Flux, Normalized ΔP andNormalized Permeate Conductivity
• Maintain permeate water quality
• Clean based on system limitations and economics (energy vs cleaning cost)
47
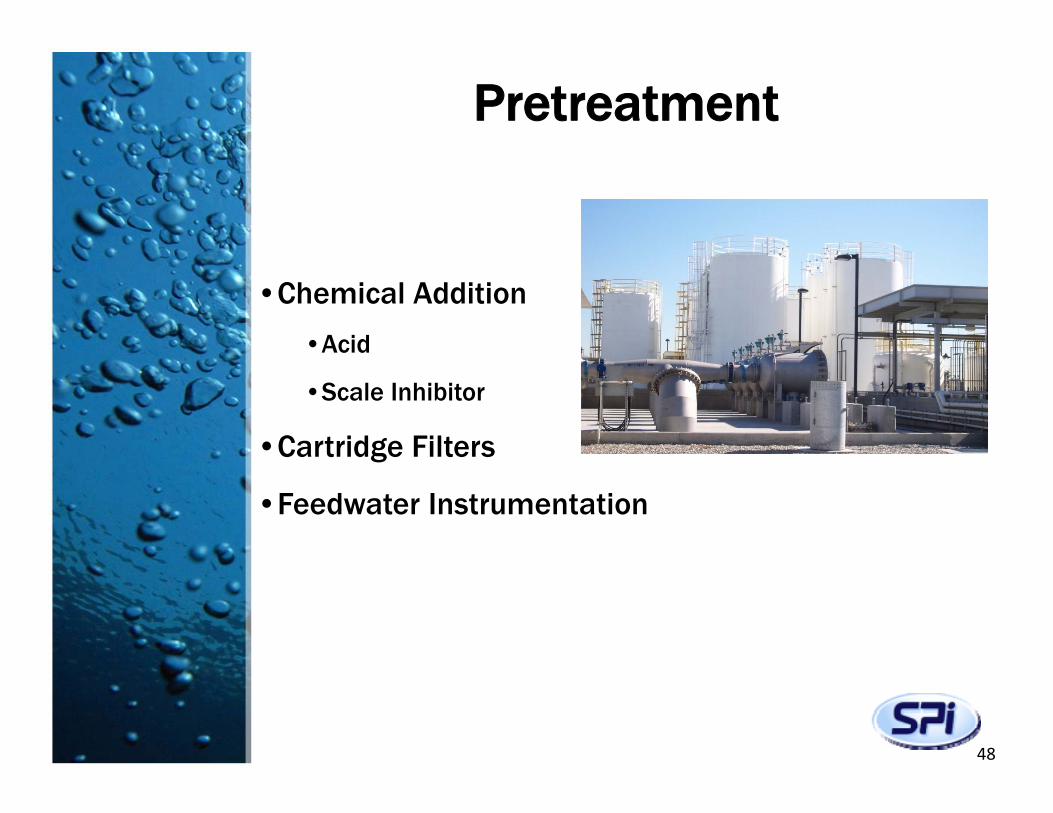
Pretreatment
•Chemical Addition
•Acid
•Scale Inhibitor
•Cartridge Filters
•Feedwater Instrumentation
48
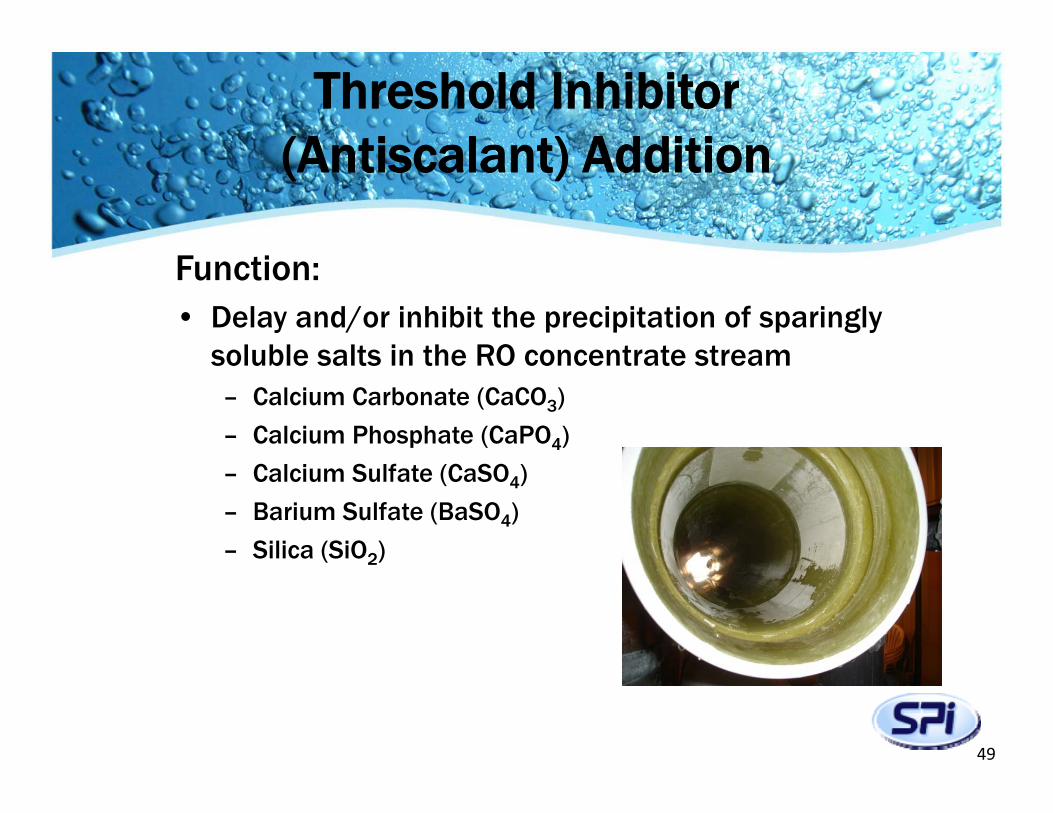
Threshold Inhibitor (Antiscalant) Addition
Function: • Delay and/or inhibit the precipitation of sparingly
soluble salts in the RO concentrate stream– Calcium Carbonate (CaCO3)
– Calcium Phosphate (CaPO4)
– Calcium Sulfate (CaSO4)
– Barium Sulfate (BaSO4)
– Silica (SiO2)
49
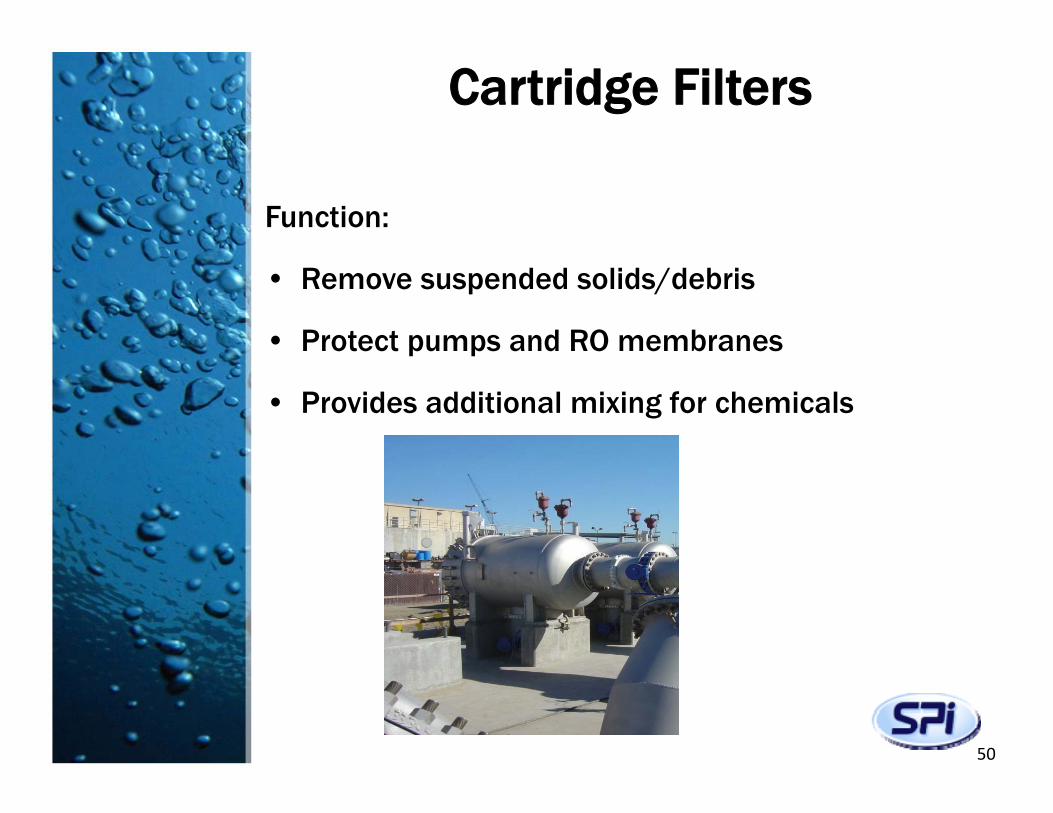
Cartridge Filters
Function:
• Remove suspended solids/debris
• Protect pumps and RO membranes
• Provides additional mixing for chemicals
50
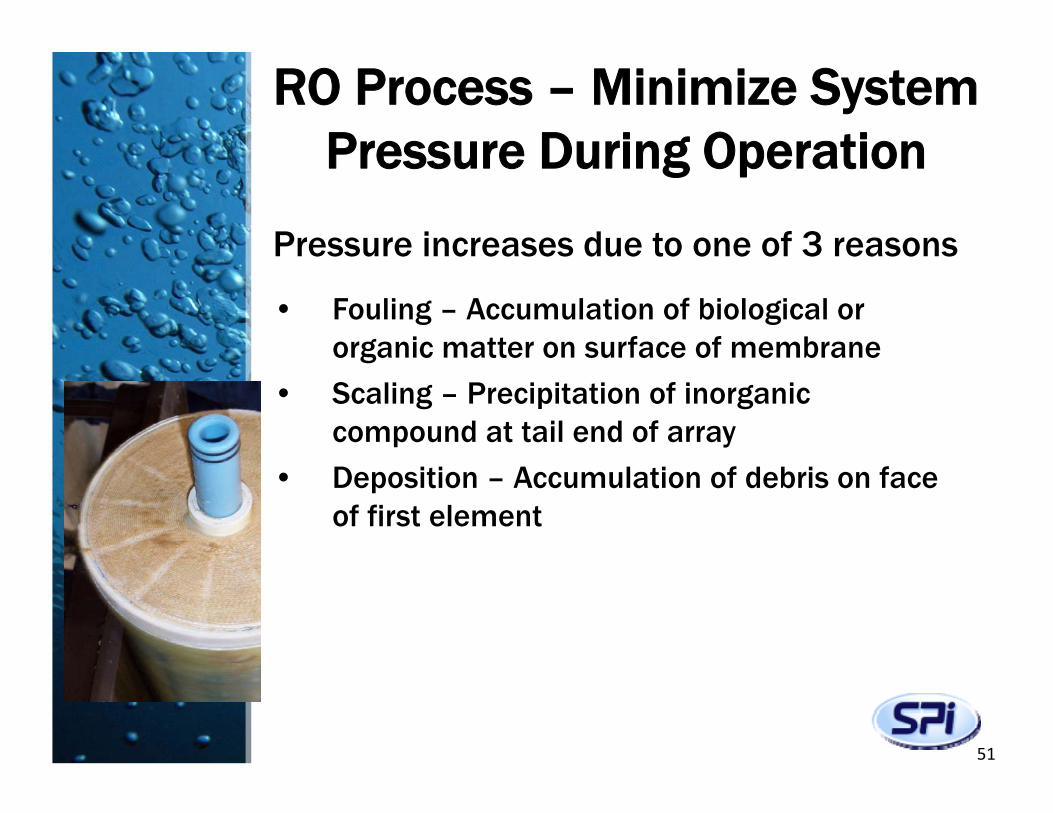
RO Process – Minimize System Pressure During Operation
Pressure increases due to one of 3 reasons
• Fouling – Accumulation of biological or organic matter on surface of membrane
• Scaling – Precipitation of inorganic compound at tail end of array
• Deposition – Accumulation of debris on face of first element
51
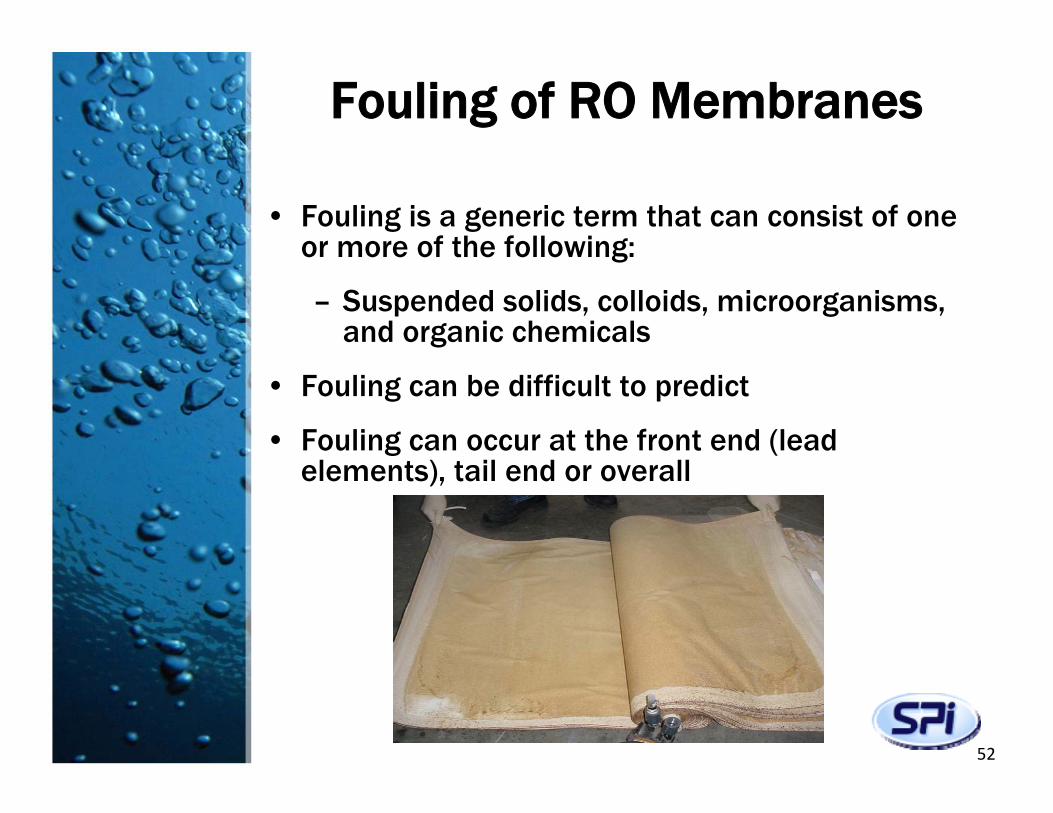
Fouling of RO Membranes
• Fouling is a generic term that can consist of one or more of the following:
– Suspended solids, colloids, microorganisms, and organic chemicals
• Fouling can be difficult to predict
• Fouling can occur at the front end (lead elements), tail end or overall
52
Scaling of RO Membranes
• Scaling refers to formation of a chemical “scale” similar to what occurs in a water heater or boiler
Typical scales are:
•calcium carbonate, calcium phosphate
•calcium sulfate, barium sulfate or strontium sulfate
•silica
• Scaling potential can be calculated based on water chemistry
• Scaling initially occurs at tail end of RO system – last few elements
53
MONITORING ANDOPTIMIZATION
54
Regularly Monitored RO Parameters
• Date and Time
• Feed pH
• Feed conductivity
• Feed temperature
• Feed pressure
• Stage differential pressures
• Concentrate pressure
• Concentrate flow
• Permeate flow
• Permeate conductivity
• Permeate pressure
55
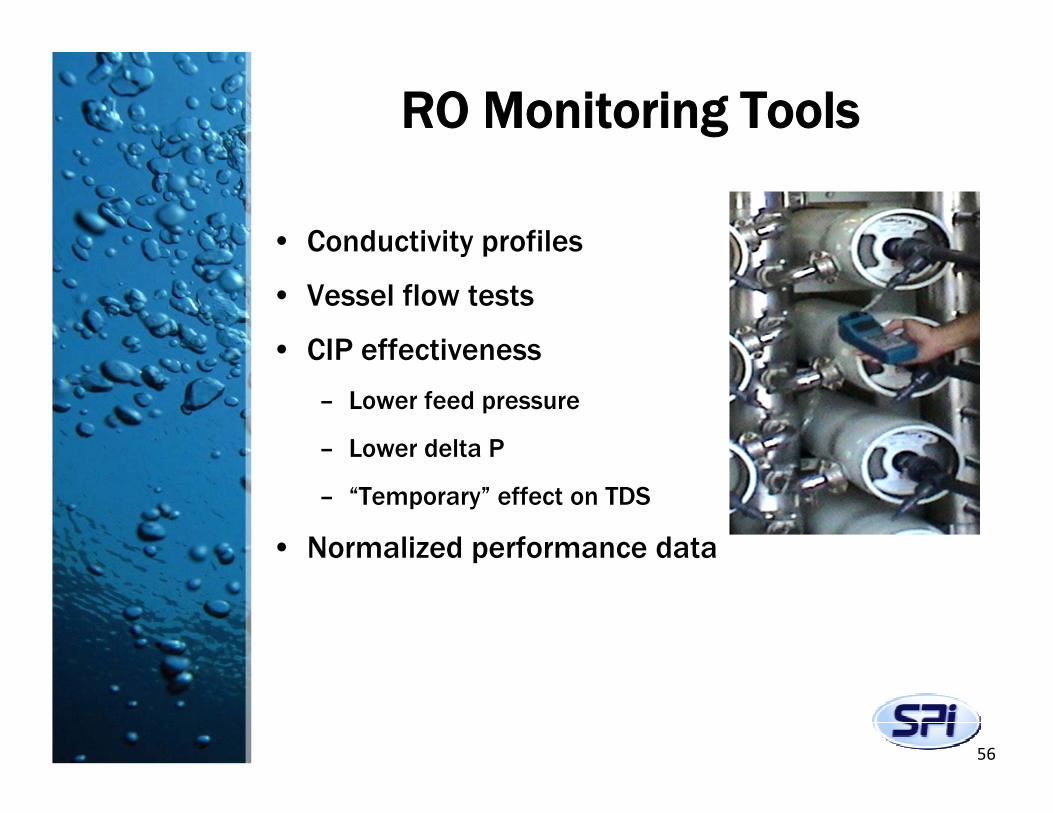
RO Monitoring Tools
• Conductivity profiles
• Vessel flow tests
• CIP effectiveness
– Lower feed pressure
– Lower delta P
– “Temporary” effect on TDS
• Normalized performance data
56
Data Normalization
• Calculation of values that describe membrane performance at design conditions even when system is not operated at design conditions (flow, temperature, recovery, etc.)
• Removes influence of variable operating conditions
57
Data Normalization
Why Normalize Data?– Allows user to make direct comparison of
membrane performance despite changes in operating conditions
– Used to determine if the system performance is stable or developing problems
58
Types of Normalized Data
• Specific Flux - Membrane productivity on a standard basis
• Normalized ΔP - Pressure drop at standard operating conditions
• Normalized Permeate Conductivity - Permeate conductivity at standard operating conditions
59
Questions
Alex Wesner P.E.
Separation Processes, Inc.
awesner@spi‐engineering.com
619‐316‐165560