Embed Size (px)
Citation preview

Muswellbrook Shire Council COMMERCIAL-IN-CONFIDENCE Page 1
Muswellbrook Shire Council
Financial Assessment, Sustainability and Benchmarking Report
17 April 2013
Prepared by NSW Treasury Corporation for Muswellbrook Shire Council, the Division of Local
Government and the Independent Local Government Review Panel.

Muswellbrook Shire Council COMMERCIAL-IN-CONFIDENCE Page 2
Disclaimer
This report has been prepared by New South Wales Treasury Corporation (TCorp) in accordance with
the appointment of TCorp by the Division of Local Government (DLG) as detailed in TCorp’s letters of
22 December 2011 and 28 May 2012. The report has been prepared to assist the DLG and the
Independent Local Government Review Panel in its consideration of the Sustainability of each local
government area in NSW.
The report has been prepared based on information provided to TCorp as set out in Section 2.2 of this
report. TCorp has relied on this information and has not verified or audited the accuracy, reliability or
currency of the information provided to it for the purpose of preparation of the report. TCorp and its
directors, officers and employees make no representation as to the accuracy, reliability or completeness
of the information contained in the report.
In addition, TCorp does not warrant or guarantee the outcomes or projections contained in this report.
The projections and outcomes contained in the report do not necessarily take into consideration the
commercial risks, various external factors or the possibility of poor performance by the Council all of
which may negatively impact the financial capability and sustainability of the Council. The TCorp report
focuses on whether the Council has reasonable capacity, based on the information provided to TCorp, to
take on additional borrowings, and Council’s future Sustainability, within prudent risk parameters and the
limits of its financial projections.
The report has been prepared for Muswellbrook Shire Council, the DLG and the Independent Local
Government Review Panel. TCorp shall not be liable to Muswellbrook Shire Council or have any liability
to any third party under the law of contract, tort and the principles of restitution or unjust enrichment or
otherwise for any loss, expense or damage which may arise from or be incurred or suffered as a result of
reliance on anything contained in this report.

Muswellbrook Shire Council COMMERCIAL-IN-CONFIDENCE Page 3
Index
Section 1 Executive Summary ....................................................................................................... 4
Section 2 Introduction .................................................................................................................... 6
2.1: Purpose of Report ............................................................................................................ 7
2.2: Scope and Methodology .................................................................................................. 7
2.3: Overview of the Local Government Area ......................................................................... 9
Section 3 Review of Financial Performance and Position ........................................................... 10
3.1: Revenue ........................................................................................................................ 10
3.2: Expenses ....................................................................................................................... 12
3.3: Operating Results .......................................................................................................... 13
3.4: Financial Management Indicators .................................................................................. 15
3.5: Statement of Cashflows ................................................................................................. 17
3.6: Capital Expenditure ........................................................................................................ 18
3.6(a): Infrastructure Backlog .................................................................................................... 18
3.6(b): Infrastructure Status ....................................................................................................... 19
3.6(c): Capital Program ............................................................................................................. 22
3.7: Specific Risks to Council ................................................................................................ 23
Section 4 Review of Financial Forecasts ..................................................................................... 24
4.1: Operating Results .......................................................................................................... 24
4.2: Financial Management Indicators .................................................................................. 24
4.3: Capital Expenditure ........................................................................................................ 30
4.4: Financial Model Assumption Review ............................................................................. 31
4.5: Borrowing Capacity ........................................................................................................ 33
4.6: Sustainability .................................................................................................................. 34
Section 5 Benchmarking and Comparisons with Other Councils ................................................. 35
Section 6 Conclusion and Recommendations ............................................................................. 41
Appendix A Historical Financial Information Tables .................................................................... 42
Appendix B Glossary .................................................................................................................. 46
Muswellbrook Shire Council COMMERCIAL-IN-CONFIDENCE Page 4
Section 1 Executive Summary
This report provides an independent assessment of Muswellbrook Shire Council’s (the Council) financial
capacity, and its future Sustainability. The analysis is based on a review of the historical performance,
current financial position, and long term financial forecasts. It also benchmarks the Council against its
peers using key ratios.
TCorp’s approach has been to:
Review the most recent four years of Council’s consolidated financial results
Conduct a detailed review of the Council’s 10 year financial forecasts, with a particular focus on
a council’s General Fund. Where a council operates a Water or other Fund the financial
capacity of these other Funds may be reviewed where considered necessary.
Council’s financial results have been satisfactory in some areas over the review period based on the
following observations:
Over the review period, Council had sufficient liquidity to meet its short term liabilities
Over the review period, Council had a moderate level of borrowings ($8.3m in 2012, being 1.8%
of the Net Assets) and had flexibility in regard to carrying more long term debt
Areas of concern are that:
Since 2011, Council has been reporting operating deficits (excluding capital grants and
contributions) due to a substantial increase in operating expenses (in depreciation particularly in
2011 following the Asset Revaluations). In 2012, Council was in receipt of an SRV of 4.0%
applied to mining rates in order to fund maintenance of mine affected roads and associated
stormwater drainage infrastructure. Despite this SRV and the prepayment of half of the 2013
Financial Assistance Grant (FAG), Council reported a $1.1m operating deficit excluding capital
grants and contributions in 2012
Approximately 55.6% of Council’s revenue base is derived from own sourced revenue (annual
charges, and user charges and fees) compared to a benchmark of 60.0%. The Council is
dependent on external sources of funding such as operating grants and contributions
Council spent the required amounts on renewal of assets in two of the past four years
The Council reported $23.9m of Infrastructure Backlog in 2012 which represents 6.9% of its infrastructure
asset value of $346.7m. Other observations include:
Over the past four years, the total value of the Backlog has decreased by $11.3m due to the
Asset Revaluations
In 2012, the Backlog was mainly related to public roads and sewerage assets (representing
respectively 38.2% and 37.2% of the total Infrastructure Backlog)
Since 2011, spending on maintenance of assets has been insufficient. Since the development
of the Asset Management Plans (AMP), required maintenance costs have increased and
highlighted Council’s limited resources. If this trend continues, it is likely that the Backlog will
grow in future years

Muswellbrook Shire Council COMMERCIAL-IN-CONFIDENCE Page 5
The key observations from our review of Council’s 10 year forecasts for its General Fund are:
The LTFP assumes that current service levels to the community are being maintained
The forecasts show substantial operating deficits excluding capital grants and contributions in all
10 years
Overall, it appears that Council will have limited liquidity throughout the next 10 year period to
service its short term liabilities, although, it does appear that Council will have sufficient
capacity to service its currently scheduled debt commitments and capital expenditure
Council’s level of fiscal flexibility is forecast to slightly improve as Council expects to decrease
its reliance on external funding sources such as operating grants and contributions
The total capital expenditure is forecast to be below the asset renewal benchmark, indicating
Council’s asset base and service quality are likely to deteriorate
Based on the credit metrics of DSCR and Interest Cover Ratio, it appears that Council could have the
capacity to undertake additional borrowings. Council has advised TCorp that Council has access to
substantial and recurrent capital contributions connected with infrastructure renewal on its mining
affected road network and that bringing forward the renewal of its mining affected road network is the
subject of Council’s proposed borrowings under LIRS Round 2. Council proposes to fund its borrowings
from that recurrent capital source. TCorp considers that borrowing for capital renewal for that purpose,
using funds from its recurrent capital sources to repay those borrowings, is appropriate. Given the
forecasts show consistent operating deficits between 2013 and 2022, TCorp considers that it would be
prudent for Council to develop strategies to improve its operating position prior to undertaking any
additional borrowings funded from other sources.
TCorp believes Council to be moderately Sustainable in the short to medium term. Since 2011, Council
has recorded operating deficits when capital grants and contributions are excluded. The Asset
Management Plans (AMPs) have highlighted that Council’s current levels of resources are insufficient to
ensure that the required amounts on maintenance and renewal are being spent for each class of assets.
Without additional funding, Council may therefore be unable to maintain the current service levels in
these areas in the medium to long term. TCorp notes that Council’s depreciation rate per kilometre
appears to be at the higher end of councils and this should be reviewed to ensure assets are being
correctly depreciated.
In respect of the long term Sustainability of the Council our key observations are:
Council forecasts continuous operating deficits (excluding capital grants and contributions) that
will make it difficult to maintain service levels
Council’s long term Sustainability would be aided by a diversification of its revenue sources in
order to decrease its reliance on external funding sources such as operating grants and
contributions. Council is confident in its ability to increase its own sourced revenue through
increased mining rates to be derived from new and expanded mining activity
In the long term, consistent operating deficits may prevent Council from adding further
borrowings
Council is not spending sufficient amounts on maintenance and renewal of assets and in the
long term this is likely to lead to an increased Infrastructure Backlog and to a decline in the
quality of the assets
Muswellbrook Shire Council COMMERCIAL-IN-CONFIDENCE Page 6
In respect of our Benchmarking analysis we have compared the Council’s key ratios with other councils
in DLG Group 11. Our key observations are:
Council’s financial flexibility as indicated by the Operating Ratio and the Own Source Revenue
Ratio is mixed with an Operating ratio above the group’s average ratio in three of the past years
and an Own Source Operation Revenue consistently below the benchmark and above the
group’s average ratio in two of the past four years. In the medium term, In the medium term,
Council’s Operating Ratio is forecast to decline to be below the benchmark but it will remain
above the group’s average ratio.
Council’s liquidity position has remained sound over the review period but was below the group
average. In the medium term, Council’s liquidity position is forecast to decline and be below the
benchmark and the group average.
Over the review period, Council’s debt servicing position has remained sound but was below the
group average. In the medium term, this situation is forecast to remain unchanged.
On average, Council out performed its peers in terms of level of Backlog, renewal of assets and
capital expenditure. In the medium term, Council’s Capital Expenditure Ratio is forecast to
deteriorate and be below both the benchmark and the group’s average ratio.

Muswellbrook Shire Council COMMERCIAL-IN-CONFIDENCE Page 7
Section 2 Introduction
2.1: Purpose of Report
This report provides the Council with an independent assessment of their financial capacity, Sustainability
and performance measured against a peer group of councils. It will complement Council’s internal due
diligence, the IP&R system of the Council and the DLG, together with the work being undertaken by the
Independent Local Government Review Panel.
The report is to be provided to the DLG and the Independent Local Government Review Panel.
The key areas focused on are:
The financial capacity of the Council
The long term Sustainability of the Council
The financial performance of the Council in comparison to a range of similar councils and
measured against prudent benchmarks
2.2: Scope and Methodology
TCorp’s approach was to:
Review the most recent four years of the Council’s consolidated audited accounts using
financial ratio analysis. In undertaking the ratio analysis TCorp has utilised ratio’s substantially
consistent with those used by Queensland Treasury Corporation (QTC) initially in its review of
Queensland Local Government (2008), and subsequently updated in 2011
Conduct a detailed review of the Council’s 10 year financial forecasts including a review of the
key assumptions that underpin the financial forecasts. The review of the financial forecasts
focused on the Council’s General Fund
Identify significant changes to future financial forecasts from existing financial performance and
highlight risks associated with such forecasts, including those that could impact Council’s
Sustainability
Conduct a benchmark review of a Council’s performance against its peer group
Prepare a report that provides an overview of the Council’s existing and forecast financial
position and its capacity to meet increased debt commitments and achieve long term
Sustainability
Conduct a high level review of the Council’s IP&R documents for factors which could impact the
Council’s financial capacity, performance and Sustainability
In undertaking its work, TCorp relied on:
Council’s audited financial statements (2008/09 to 2011/12)
Council’s financial forecast model
Council’s IP&R documents
Discussions with Council officers
Other publicly available information such as information published on the IPART website
Muswellbrook Shire Council COMMERCIAL-IN-CONFIDENCE Page 8
In completing the report, TCorp worked closely with Council management to analyse and understand the
information gathered. The Council was given a draft copy of the report for their review and comment.
Council has provided TCorp with additional information and comments which TCorp has incorporated into
the report.
Definition of Sustainability
In conducting our reviews, TCorp has relied upon the following definition of sustainability to provide
guidance:
"A local government will be financially sustainable over the long term when it is able to generate sufficient
funds to provide the levels of service and infrastructure agreed with its community."
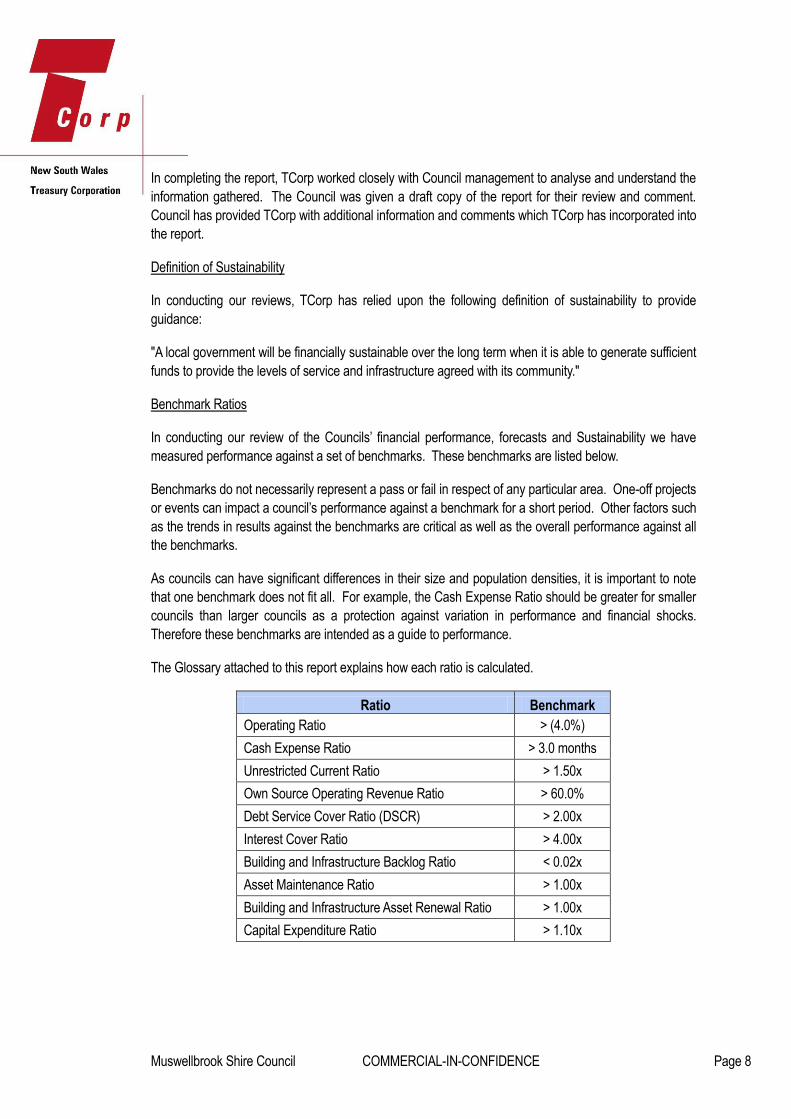
Benchmark Ratios
In conducting our review of the Councils’ financial performance, forecasts and Sustainability we have
measured performance against a set of benchmarks. These benchmarks are listed below.
Benchmarks do not necessarily represent a pass or fail in respect of any particular area. One-off projects
or events can impact a council’s performance against a benchmark for a short period. Other factors such
as the trends in results against the benchmarks are critical as well as the overall performance against all
the benchmarks.
As councils can have significant differences in their size and population densities, it is important to note
that one benchmark does not fit all. For example, the Cash Expense Ratio should be greater for smaller
councils than larger councils as a protection against variation in performance and financial shocks.
Therefore these benchmarks are intended as a guide to performance.
The Glossary attached to this report explains how each ratio is calculated.
Ratio Benchmark
Operating Ratio > (4.0%)
Cash Expense Ratio > 3.0 months
Unrestricted Current Ratio > 1.50x
Own Source Operating Revenue Ratio > 60.0%
Debt Service Cover Ratio (DSCR) > 2.00x
Interest Cover Ratio > 4.00x
Building and Infrastructure Backlog Ratio < 0.02x
Asset Maintenance Ratio > 1.00x
Building and Infrastructure Asset Renewal Ratio > 1.00x
Capital Expenditure Ratio > 1.10x
Muswellbrook Shire Council COMMERCIAL-IN-CONFIDENCE Page 9
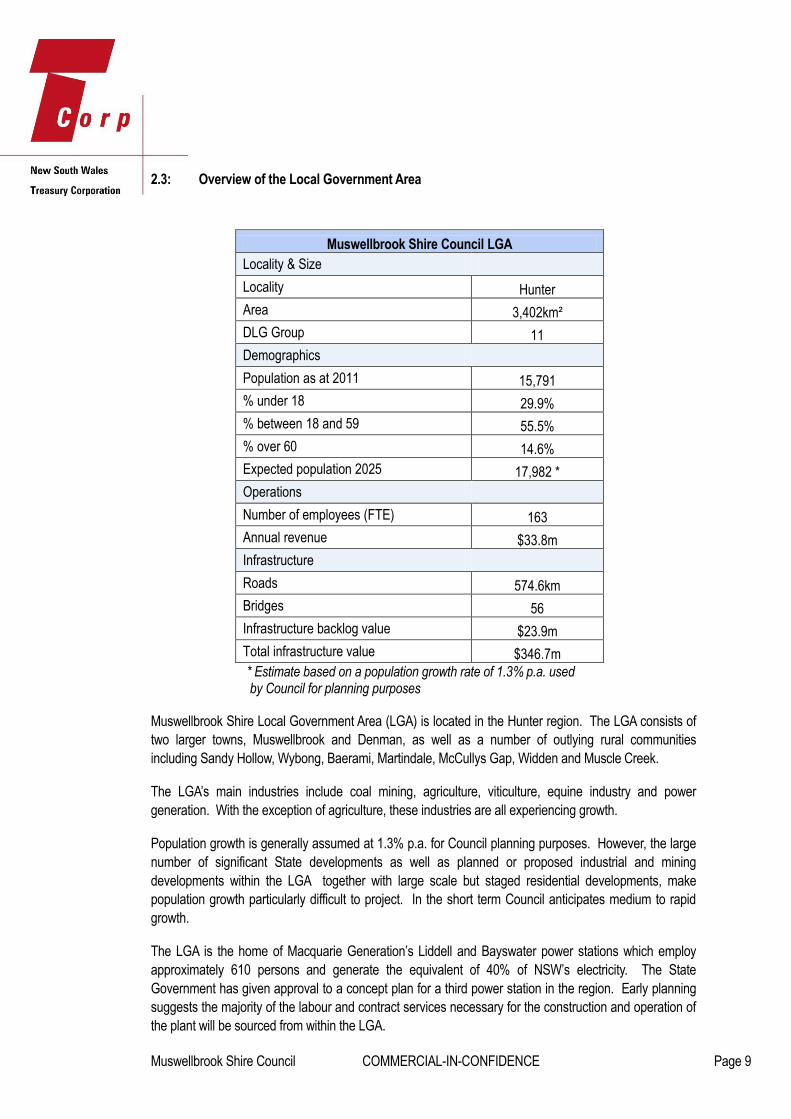
2.3: Overview of the Local Government Area
Muswellbrook Shire Council LGA
Locality & Size
Locality Hunter
Area 3,402km²
DLG Group 11
Demographics
Population as at 2011 15,791
% under 18 29.9%
% between 18 and 59 55.5%
% over 60 14.6%
Expected population 2025 17,982 *
Operations
Number of employees (FTE) 163
Annual revenue $33.8m
Infrastructure
Roads 574.6km
Bridges 56
Infrastructure backlog value $23.9m
Total infrastructure value $346.7m
* Estimate based on a population growth rate of 1.3% p.a. used by Council for planning purposes
Muswellbrook Shire Local Government Area (LGA) is located in the Hunter region. The LGA consists of
two larger towns, Muswellbrook and Denman, as well as a number of outlying rural communities
including Sandy Hollow, Wybong, Baerami, Martindale, McCullys Gap, Widden and Muscle Creek.
The LGA’s main industries include coal mining, agriculture, viticulture, equine industry and power
generation. With the exception of agriculture, these industries are all experiencing growth.
Population growth is generally assumed at 1.3% p.a. for Council planning purposes. However, the large
number of significant State developments as well as planned or proposed industrial and mining
developments within the LGA together with large scale but staged residential developments, make
population growth particularly difficult to project. In the short term Council anticipates medium to rapid
growth.
The LGA is the home of Macquarie Generation’s Liddell and Bayswater power stations which employ
approximately 610 persons and generate the equivalent of 40% of NSW’s electricity. The State
Government has given approval to a concept plan for a third power station in the region. Early planning
suggests the majority of the labour and contract services necessary for the construction and operation of
the plant will be sourced from within the LGA.

Muswellbrook Shire Council COMMERCIAL-IN-CONFIDENCE Page 10
Section 3 Review of Financial Performance and Position
In reviewing the financial performance of the Council, TCorp has based its review on the annual audited
accounts of the Council unless otherwise stated.
3.1: Revenue
Key Observations
Rates and annual charges increased by 4.8% ($0.5m) in 2010, 16.5% ($2.0m) in 2011 and
9.5% ($1.3m) in 2012 to $15.3m. In 2010, mining rates increased by $0.2m while residential
rates as well as water and sewer charges all increased by $0.1m. In 2011, mining rates
increased by $1.2m to $3.0m due to increasing mining activity while sewerage charges
increased by $0.4m to $2.5m. The total mining and emplacement areas in the LGA increased
by 15.0% in 2011. In 2012, sewerage charges increased by $0.5m, while residential, mining
and business rates all increased by $0.2m each.
In 2012, Council was in receipt of a one-off 4.0% SRV above the rate peg. IPART has granted
the renewal of that 4.0% SRV in 2013 and has allowed Council to retain it permanently in
Council’s rating base. The SRV has been applied to mining rates and the proceeds are utilised
to improve mine affected roads and associated storm water drainage infrastructure, especially
on Thomas Mitchell Drive and its related access roads, as well as on Carramere and Blakefield
roads.
User charges and fees increased by 14.0% ($1.0m) over the review period to $8.5m, peaking at
$10.5m in 2011 due to high levels of RMS charges ($3.0m). Over the review period, waste
disposal tipping fees increased by $0.8m to $1.8m due to the Waste and Environmental Levy.
15,289 13,96111,981 11,433
8,474 10,472
7,879 7,435
2,537 2,190
2,3421,812
6,372 4,868
4,6085,408
1,102567
520 318
0
5,000
10,000
15,000
20,000
25,000
30,000
35,000
40,000
2012 2011 2010 2009
Figure 1 - Revenue Sources for 2008/09 to 2011/12 ($'000s)
Rates and annual charges User charges and fees
Interest and investment revenue Grants and contributions for operating purposes
Other revenues

Muswellbrook Shire Council COMMERCIAL-IN-CONFIDENCE Page 11
Operating grants and contributions increased by 17.8% ($1.0m) over the review period to
$6.4m. In 2010, they decreased by 14.8% ($0.8m) due to decreases of $0.6m in grants for
flood restoration as well as in FAG following the prepayment in 2009 of the first instalment
($0.7m) of the 2010 FAG. In 2012, operating grants and contributions increased by 30.9%
($1.5m) mainly due to the prepayment of half ($1.7m) of the 2013 FAG.
Other revenues increased by $0.8m over the review period to $1.1m due to increased rental
income which amounted to $0.8m in 2012.

Muswellbrook Shire Council COMMERCIAL-IN-CONFIDENCE Page 12
3.2: Expenses
Key Observations
While the number of full time employees (excluding vacancies) decreased from 168 to 163
employees over the review period, employee costs increased by 7.7% ($0.7m) in 2009, 3.4%
($0.4m) in 2011 and 5.9% ($0.6m) in 2012 to $11.5m. Over the past four years, salaries and
wages increased by $1.9m to $9.6m. In 2012, Council had eight vacancies implying that
employee costs are likely to continue to grow in future years.
Materials and contracts costs decreased by $0.1m over the review period to $7.7m, peaking at
$8.1m in 2011 due to an unusually large amount of works being carried out on behalf of the
RMS. The costs are offset by higher revenue from RMS.
Due to the Asset Revaluations process, annual depreciation expense increased by 1.9%
($0.1m) in 2010, 94.3% ($5.3m) in 2011 and 3.5% ($0.4m) in 2012 to $11.3m.
Other expenses increased by 67.2% ($1.6m) over the review period to $4.1m. In 2012, waste
levy contributions, and electricity and heating costs were the main contributors to other
expenses, amounting to $1.1m and $0.7m respectively.
11,493 10,849 10,495 9,746
522 419 398 423
7,749 8,141 7,450 7,895
11,270 10,889
5,604 5,498
3,868 3,391
2,737 2,313
0
5,000
10,000
15,000
20,000
25,000
30,000
35,000
40,000
2012 2011 2010 2009
Figure 2 - Expenses for 2008/09 to 2011/12 ($'000s)
Employees Borrowing costs Materials and contract expenses
Depreciation and amortisation Other expenses

Muswellbrook Shire Council COMMERCIAL-IN-CONFIDENCE Page 13
3.3: Operating Results
TCorp has made some standard adjustments to focus the analysis on core operating council results.
Grants and contributions for capital purposes, realised and unrealised gains on investments and other
assets are excluded, as well as one-off items which Council have no control over (e.g. impairments).
TCorp believes that the exclusion of these items will assist in normalising the measurement of key
performance indicators, and the measurement of Council’s performance against its peers.
All items excluded from the income statement and further historical financial information is detailed in
Appendix A.
Key Observations
Since 2011, Council has consistently reported operating deficits when capital grants and
contributions are excluded. This was due to the substantial increase ($5.3m) in depreciation
expense in 2011. In 2012, the operating deficit excluding capital grants and contributions
remained relatively high despite the increase in operating revenue (including a 4.0% SRV and
the prepayment of half of the 2013 FAG).
Council’s expenses include a non-cash depreciation expense ($11.3m in 2012), which has
increased over the past four years following the Asset Revaluations process. Whilst the non
cash nature of depreciation can favourably impact on ratios such as EBITDA that focus on cash,
depreciation is an important expense at it represents the allocation of the value of an asset over
its useful life.
Council officers have indicated that Council is proposing to fully fund its depreciation expense
by 2017 through a number of possible additional revenue sources from mining rates (in relation
to new or expanded coal mines expected in future years) and from current commercial activities
(lease and sale of residential and commercial buildings).
(1,128)(1,631)
646 531
8,6097,866
11,258
7,329
(4,000)
(2,000)
0
2,000
4,000
6,000
8,000
10,000
12,000
2012 2011 2010 2009
Figure 3 - Operating Results for 2008/09 to 2011/12 ($'000s)
Operating result (excluding capital grants and contributions)
Operating result (including capital grants and contributions)
Muswellbrook Shire Council COMMERCIAL-IN-CONFIDENCE Page 14
Council’s operating results including capital grants and contributions peaked at $11.3m in 2010
following the receipt of high levels of capital grants following an increase of $4.3m in
contributions for roads and bridges which amounted to $5.3m.
Council operates three Funds separately from its General Fund: a Sewer, a Water and a
Domestic Waste Management (DWM) Fund. Each of those businesses have generated
operating surpluses over the review period after and before capital grants and contributions,
with the exception of the DWM and Sewer businesses in 2010 which generated relatively small
operating deficits after capital grants and contributions ($5.0k and $0.3m respectively).
Council’s Operating Result is negatively affected by a large Depreciation expense, especially in
respect to roads infrastructure. Council has reviewed its 2011/12 Depreciation expense in
comparison with its peer Council’s (being the other Council’s in the Division of Local
Government’s Group 11) and has found that Council’s replacement value per kilometre is
significantly higher than the average value for the group.
It is also noted that Council receives a high proportion of recurrent capital contributions as a
result of voluntary planning contributions with the coal industry which offsets the impact of the
apparent elevation in the depreciation allowance for the consumption of its road assets. As this
income is currently classified as a Capital Contribution, Council should review this with their
Auditors to consider the reclassification of this recurrent income to operating revenue. Such a
reclassification is likely to have a significant impact on Council’s overall results. It is also noted
that Council does not account for annual in-kind contributions to the renewal of its road network
required under coal mining related planning consents. These recurrent contributions also
appear to significantly distort the Council’s apparent operating result.
Muswellbrook Shire Council COMMERCIAL-IN-CONFIDENCE Page 15
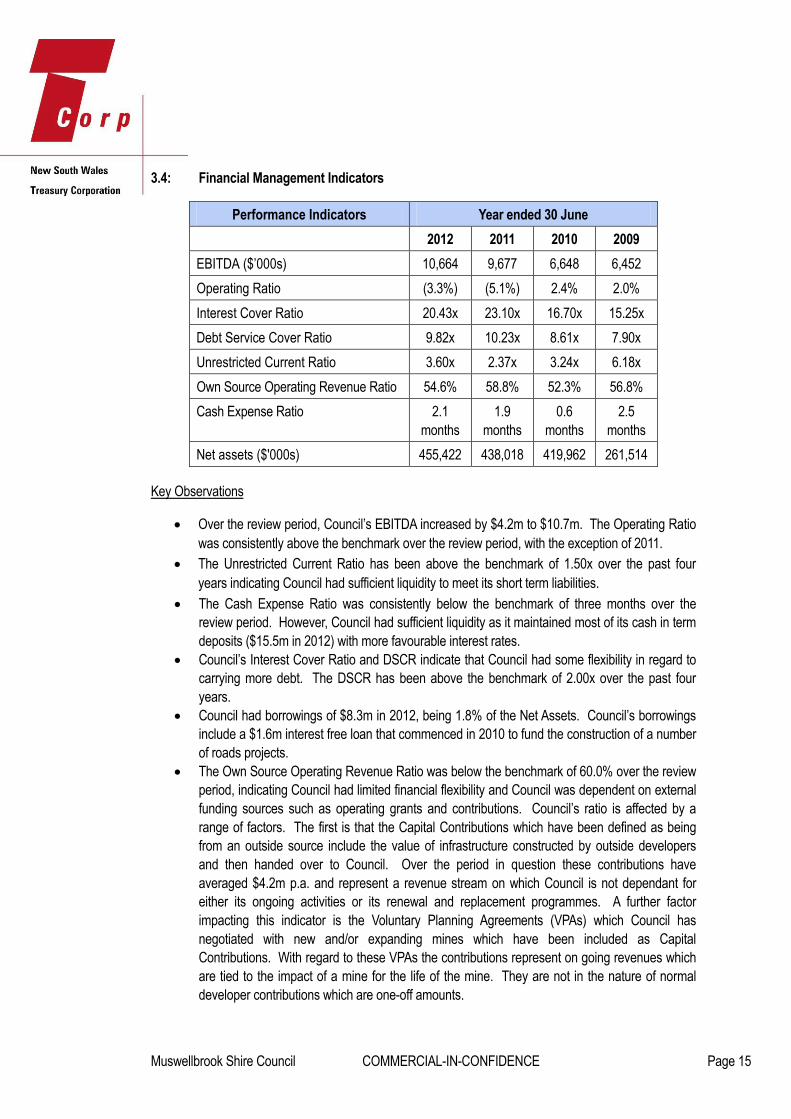
3.4: Financial Management Indicators
Performance Indicators Year ended 30 June
2012 2011 2010 2009
EBITDA ($’000s) 10,664 9,677 6,648 6,452
Operating Ratio (3.3%) (5.1%) 2.4% 2.0%
Interest Cover Ratio 20.43x 23.10x 16.70x 15.25x
Debt Service Cover Ratio 9.82x 10.23x 8.61x 7.90x
Unrestricted Current Ratio 3.60x 2.37x 3.24x 6.18x
Own Source Operating Revenue Ratio 54.6% 58.8% 52.3% 56.8%
Cash Expense Ratio 2.1
months
1.9
months
0.6
months
2.5
months
Net assets ($'000s) 455,422 438,018 419,962 261,514
Key Observations
Over the review period, Council’s EBITDA increased by $4.2m to $10.7m. The Operating Ratio
was consistently above the benchmark over the review period, with the exception of 2011.
The Unrestricted Current Ratio has been above the benchmark of 1.50x over the past four
years indicating Council had sufficient liquidity to meet its short term liabilities.
The Cash Expense Ratio was consistently below the benchmark of three months over the
review period. However, Council had sufficient liquidity as it maintained most of its cash in term
deposits ($15.5m in 2012) with more favourable interest rates.
Council’s Interest Cover Ratio and DSCR indicate that Council had some flexibility in regard to
carrying more debt. The DSCR has been above the benchmark of 2.00x over the past four
years.
Council had borrowings of $8.3m in 2012, being 1.8% of the Net Assets. Council’s borrowings
include a $1.6m interest free loan that commenced in 2010 to fund the construction of a number
of roads projects.
The Own Source Operating Revenue Ratio was below the benchmark of 60.0% over the review
period, indicating Council had limited financial flexibility and Council was dependent on external
funding sources such as operating grants and contributions. Council’s ratio is affected by a
range of factors. The first is that the Capital Contributions which have been defined as being
from an outside source include the value of infrastructure constructed by outside developers
and then handed over to Council. Over the period in question these contributions have
averaged $4.2m p.a. and represent a revenue stream on which Council is not dependant for
either its ongoing activities or its renewal and replacement programmes. A further factor
impacting this indicator is the Voluntary Planning Agreements (VPAs) which Council has
negotiated with new and/or expanding mines which have been included as Capital
Contributions. With regard to these VPAs the contributions represent on going revenues which
are tied to the impact of a mine for the life of the mine. They are not in the nature of normal
developer contributions which are one-off amounts.
Muswellbrook Shire Council COMMERCIAL-IN-CONFIDENCE Page 16
Net Assets increased by $193.9m between 2009 and 2012 mainly due to the Asset
Revaluations that increased the value of roads, bridges, footpaths, drainage assets, and
community land assets.
The Asset Revaluations over the last four years have resulted in a high level of volatility in Net
Assets over this period. Consequently, in the short term the value of Net Assets is not
necessarily an informative indicator of performance. In the medium to long term however, this is
a key indicator of a Council’s capacity to add value to its operations. Over time, Net Assets
should increase at least in line with inflation plus an allowance for increased population and/or
improved or increased services.
When the Asset Revaluations are excluded, the underlying trend in all four years has been an
expanding infrastructure, property, plant, and equipment (IPP&E) asset base with asset
purchases being larger than the combined value of disposed assets and annual depreciation.
Over the four years this amounted to a $28.9m increase in IPP&E assets.

Muswellbrook Shire Council COMMERCIAL-IN-CONFIDENCE Page 17
3.5: Statement of Cashflows
Key Observations
While cash and cash equivalents remained relatively static between 2009 and 2012 (with the
exception of 2010), total cash and investments increased by $0.6m to $44.0m.
In 2012, Council had cash and investments amounting to $44.0m (including $4.0m in cash) of
which $31.4m was externally restricted, $11.8m was internally restricted and $0.8m was
unrestricted.
In 2012, Council’s investments portfolio amounted to $39.9m and was comprised of managed
funds amounting to $3.1m, term deposits amounting to $15.5m, floating rate notes worth
$11.0m and other long term financial assets amounting to $10.4m.
Council invested $0.5m in managed funds in 2002. Council officers have indicated that there is
no maturity date set for the fund and that the losses that occurred during the GFC were minor
and have been recouped.
Council’s other long term financial assets are in capital protected products ($5.4m) and bonds
with financial institutions ($5.0m). These financial assets were due to mature between October
2012 and June 2017.
Over the review period, Council had CDOs amounting to $2.7m in 2009, $1.2m in 2010, $1.3m
in 2011. These investments successfully matured without losses to Council during the 2012
financial year.
4,0263,568
1,006
4,089
0
500
1,000
1,500
2,000
2,500
3,000
3,500
4,000
4,500
2012 2011 2010 2009
Figure 4 - Cash and Cash Equivalents for 2008/09 to 2011/12 ($'000s)
Muswellbrook Shire Council COMMERCIAL-IN-CONFIDENCE Page 18
3.6: Capital Expenditure
The following section predominantly relies on information obtained from Special Schedules 7 and 8 that
accompany the annual financial statements. These figures are unaudited and are therefore Council’s
estimated figures.
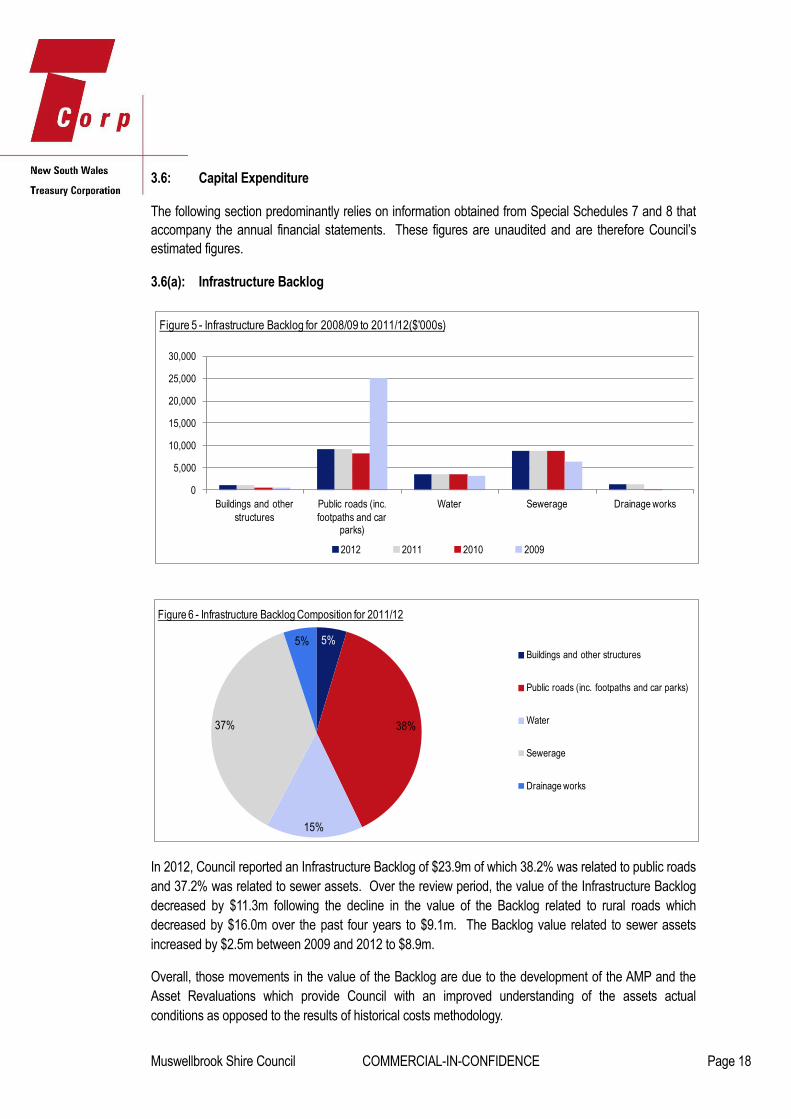
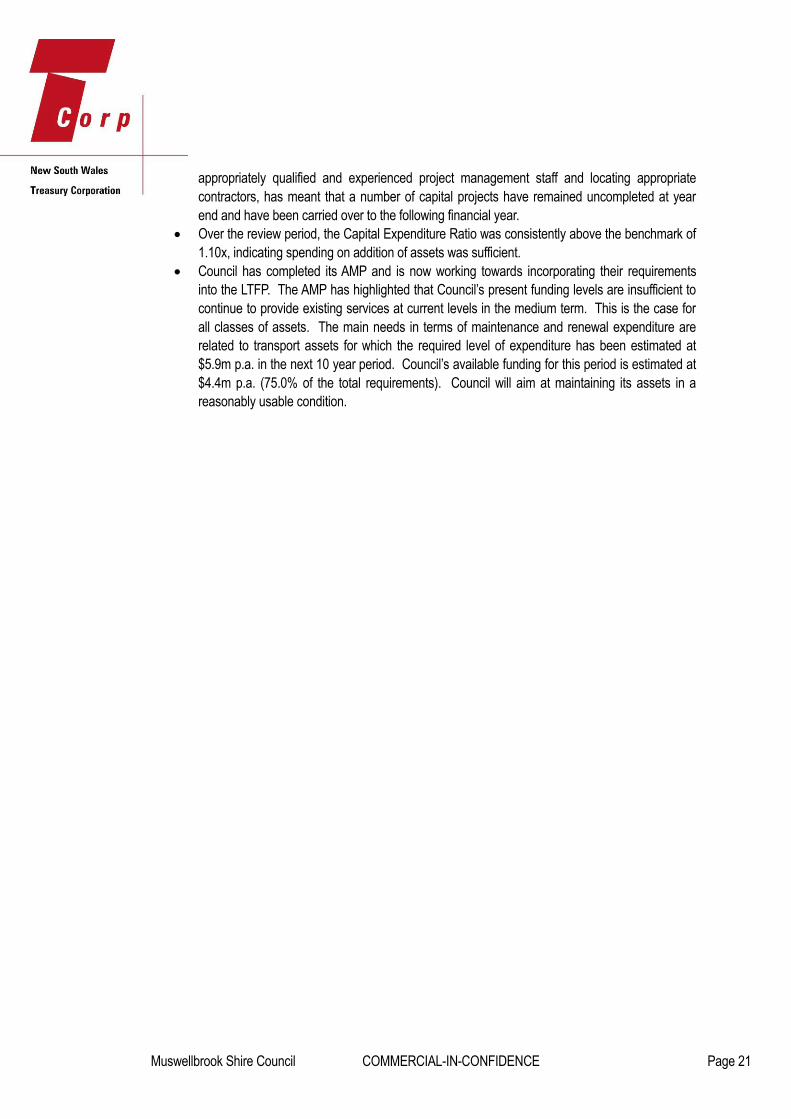
3.6(a): Infrastructure Backlog
In 2012, Council reported an Infrastructure Backlog of $23.9m of which 38.2% was related to public roads
and 37.2% was related to sewer assets. Over the review period, the value of the Infrastructure Backlog
decreased by $11.3m following the decline in the value of the Backlog related to rural roads which
decreased by $16.0m over the past four years to $9.1m. The Backlog value related to sewer assets
increased by $2.5m between 2009 and 2012 to $8.9m.
Overall, those movements in the value of the Backlog are due to the development of the AMP and the
Asset Revaluations which provide Council with an improved understanding of the assets actual
conditions as opposed to the results of historical costs methodology.
5%
38%
15%
37%
5%
Figure 6 - Infrastructure Backlog Composition for 2011/12
Buildings and other structures
Public roads (inc. footpaths and car parks)
Water
Sewerage
Drainage works
0
5,000
10,000
15,000
20,000
25,000
30,000
Buildings and other
structures
Public roads (inc.
footpaths and car parks)
Water Sewerage Drainage works
Figure 5 - Infrastructure Backlog for 2008/09 to 2011/12($'000s)
2012 2011 2010 2009

Muswellbrook Shire Council COMMERCIAL-IN-CONFIDENCE Page 19
Council officers have advised that Council has made an application for a subsidised interest loan under
the Local Infrastructure Renewal Scheme (LIRS) in order to fund a substantial part of the works
necessary to reduce the Backlog. In addition, Council appears to have a number of potential additional
revenue sources, including increased rates derived from new and expanded coal mines as well as
current commercial activities (lease and sale of residential and commercial buildings).

Muswellbrook Shire Council COMMERCIAL-IN-CONFIDENCE Page 20
3.6(b): Infrastructure Status
Infrastructure Status Year ended 30 June
2012 2011 2010 2009
Bring to satisfactory standard ($’000s) 23,880 23,880 21,283 35,221
Required annual maintenance ($’000s) 4,645 4,645 4,645 3,943
Actual annual maintenance ($’000s) 3,253 3,253 5,149 4,071
Total value of infrastructure assets ($’000s) 346,734 333,855 320,708 197,136
Total assets ($’000s) 473,648 455,774 435,651 276,366
Building and Infrastructure Backlog Ratio 0.07x 0.07x 0.07x 0.18x
Asset Maintenance Ratio 0.70x 0.70x 1.11x 1.03x
Building and Infrastructure Renewals Ratio 0.77x 1.16x 1.34x 0.68x
Capital Expenditure Ratio 1.84x 1.61x 2.87x 1.43x
Over the review period, the Building and Infrastructure Backlog Ratio was consistently above
the benchmark of 0.02x. The ratio decreased in 2010 following the decline in the value of the
Backlog and the increase in the value of Infrastructure Assets following the Asset Revaluations.
The Asset Maintenance Ratio has been below the benchmark of 1.00x since 2011, indicating
spending on maintenance of assets was insufficient. In particular, Council spending on
maintenance of rural roads, sewer mains and stormwater assets were below the required
amounts. Following the development of the AMP, the amount of maintenance required on
assets has increased beyond Council’s financial capabilities. If this trend continues, it is likely
that the value of the Backlog will grow in future years. Council is seeking to source additional
funds in this area, through increased mining rates from the expansion and the opening of new
coal mines in upcoming years.
The capital renewal expenditure for rural roads and stormwater assets has increased
significantly in recent years. The 2009/10 Rural Roads Renewal programme was allocated
$1.3m in 2009/10, while in 2013/14 this allocation is proposed to be $2.8m. With regard to
stormwater renewals, the allocation was increased from nil in 2009/10 to $0.2m in 2013/14. In
addition to this Council has taken steps such as the implementation of the Stormwater
Management Levy and the funding of stormwater management plans in recognition of the
maintenance requirements for these assets.
The figures indicated in Special Schedules 7 in 2011 and 2012 are identical. Council officers
have advised that after updating the data in 2011 with regard to Revaluations, Council
considered that the situation had not substantially changed in 2012 and accepted that it was
unnecessary to alter the values reported.
The Building and Infrastructure Renewals Ratio was above the benchmark of 1.00x in two of the
past four years (2010 and 2011), indicating spending on renewal of infrastructure assets was
sufficient in those years. In 2012, the ratio was well below the benchmark. Approximately
$6.6m worth of planned renewal capital expenditure could not be completed in 2012 and has
been rescheduled for 2013. Council has markedly increased its capital expenditure in recent
years, and in addition to this placed increased emphasis on design and planning of these works.
This increased design and planning process, as well as factors such as attracting and retaining
Muswellbrook Shire Council COMMERCIAL-IN-CONFIDENCE Page 21
appropriately qualified and experienced project management staff and locating appropriate
contractors, has meant that a number of capital projects have remained uncompleted at year
end and have been carried over to the following financial year.
Over the review period, the Capital Expenditure Ratio was consistently above the benchmark of
1.10x, indicating spending on addition of assets was sufficient.
Council has completed its AMP and is now working towards incorporating their requirements
into the LTFP. The AMP has highlighted that Council’s present funding levels are insufficient to
continue to provide existing services at current levels in the medium term. This is the case for
all classes of assets. The main needs in terms of maintenance and renewal expenditure are
related to transport assets for which the required level of expenditure has been estimated at
$5.9m p.a. in the next 10 year period. Council’s available funding for this period is estimated at
$4.4m p.a. (75.0% of the total requirements). Council will aim at maintaining its assets in a
reasonably usable condition.

Muswellbrook Shire Council COMMERCIAL-IN-CONFIDENCE Page 22
3.6(c): Capital Program
The following figures are sourced from the Council’s Annual Financial Statements at Special Schedule
No. 8 and are not audited. New capital works are major non-recurrent projects.
Capital Program ($’000s) Year ended 30 June
2012 2011 2010 2009
New capital works 8,466 10,286 4,978 N/A
Replacement/refurbishment of existing assets 12,167 10,796 6,001 N/A
Total 20,633 21,082 10,979 N/A
Over the review period, Council completed several capital projects including:
Upgrade of the Muswellbrook Aquatic Centre ($1.3m)
Sewering the Muswellbrook industrial estate ($2.8m)
Upgrade of the Skelletar Stock Route ($1.0m)
Smith’s Bridge upgrade ($0.6m)
Sandy Creek Road upgrade ($0.7m)
Stage 3 of Muswellbrook CBD revitalisation ($0.7m)
Emergency services centre ($1.1m)
Purchase of Campbell’s Corner ($3.2m)
Renovation and extension of the Muswellbrook Library ($3.4m)
Plant items and waste “lids” for the Muswellbrook waste management facility ($0.7m)
Construction of new staff housing ($0.6m)
Construction of the Muswellbrook skate park ($0.3m)
Rehabilitation of Crinoline Street in Denman ($0.8m)
Completion of the replacement of the Bridge Street footpath ($0.5m)
Upgrading of the New England Highway/Hunter Street Intersection ($0.3m)
Purchase of 87 Hill Street ($0.3m)
Levelling and lighting works at Olympic Park ($0.2m)
Council is currently undertaking the construction of a 63 bed student accommodation facility ($6.0m) and
is in the planning stages of the Thomas Mitchell Drive ($11.0m) and the construction of a new sewerage
treatment plant ($33.0m).
Council will operate the student accommodation facility once it is constructed. The project is a joint
partnership with Muswellbrook TAFE, with the accommodation to be constructed on TAFE land. The joint
agreement outlines that Council will operate the facility, as TAFE is restricted from operating the facility.
Grant funding and third party funding has been secured for the project and Council will recoup its initial
capital investment in the project. It is expected that operating the facility will generate a positive cash
flow over its expected life.

Muswellbrook Shire Council COMMERCIAL-IN-CONFIDENCE Page 23
3.7: Specific Risks to Council
Infrastructure maintenance and renewal funding shortfall. The AMP has highlighted the extent of funding
shortfall in the short to medium term in relation to maintenance and renewal of assets. Council appears
to have the ability to source additional funding in order to close this gap, including increased revenue
generated from mining rates due to an expansion in the activity expected in future years.
Mining activity. The LGA has become the major centre of the Upper Hunter coal mining, with the largest
concentration of open cut mining operations and with major expansions of mining approvals over the last
few years, it has the second highest rate of coal extraction in NSW. Council is now facing a major
uncertainty which is to plan for the impacts of the mine openings and expansion on revenues, demand
for Council’s services and on infrastructure (including roads water and sewer systems). In addition, the
coal industry adds cost pressures, in particular in relation to labour costs and availability. The existence
of a “drive in- drive out” type of community is a further challenge when planning for the LGA’s future.
Commercial activities. Council is involved in a number of commercial activities related to the provision of
residential and commercial properties for lease and sale of both development ready and surplus vacant
land. Since July 2010, Council has created a commercial buildings business activity (reported in the
special schedules of the annual financial statements) in order to dissociate from Council’s normal
activities (and from its General Fund) a number of buildings and land that have been acquired in order to
provide revenue from rentals and sales. Council generated a deficit after tax of $0.1m in 2011 and a
surplus after tax of $0.6m in 2012 from its commercial buildings activity. Council has prepared a separate
LTFP for this Fund. The projections show an operating result between $0.6m to $0.8m each year
between 2013 and 2022. The surpluses generated in the Commercial Property fund to date have been
reinvested in the fund, allowing it to become established and expand to a point where it can generate
significant ongoing dividends. From 2013/14, an annual dividend of $0.5m will be paid to the General
Fund and it is expected that this should increase to $1.0m by 2016/17. These dividends will be used to
fund increased renewal and replacement of assets and infrastructure in the General Fund.
Demographic planning. Council is currently experiencing a number of residential developments. A large
number of residential subdivisions are currently under various stages of approval and/or construction.
The Eastbrook and the Ironbark Road subdivision for instance are half way through construction and
around 740 and 80 lots respectively are to be created and have already sold strongly according to
Council officers. Two other new developments are proposed for the West Denman area and there exists
the possibility of the construction of a further 80 lot development at Highbrook. Due to these
developments as well as the potential mining activity expansion, demographic projections cannot be
estimated with certainty. Council has adopted a hypothesis of population growth of 1.3% p.a. for budget
planning purposes but might have to review this hypothesis in upcoming years depending on the
outcome of the residential lot sales and mining activity expansion.

Muswellbrook Shire Council COMMERCIAL-IN-CONFIDENCE Page 24
Section 4 Review of Financial Forecasts
The financial forecast model shows the projected financial statements and assumptions for the next 10
years. We have focused our financial analysis upon the General Fund. Although Council’s consolidated
position includes Water, Sewer and Commercial Buildings Business Funds, these are operated as
independent entities, which unlike the General Fund are more able to adjust the appropriate fees and
charges to meet all future operating and investing expenses.
Council also operates a DWM Fund but we note that Council has not prepared a LTFP for the DWM
Fund and has included the projections for that Fund in the LTFP for the General Fund. In 2012, total
income generated from the DWM business represented 3.6% of Council’s total revenue (including capital
grants and contributions). Net Assets related to the DWM business represented less than 0.1% of
Council’s total Net Assets.
Under Section 504 of the Local Government Act, revenue derived in relation to the provision of Domestic
Waste Management services can only be expended on the provision of that service. Any surpluses are
therefore not able to be utilised outside the DWM business. Council has ensured that all reasonable
costs incurred in relation to the administration and accounting for the fund have been included in the
Reasonable Cost Calculation.
4.1: Operating Results
The Operating Ratio is below the benchmark each year of the forecast. The projections show that
substantial operating deficit positions (excluding capital grants and contributions) are expected each year
between 2013 and 2022 (between $3.0m and $3.3m operating deficits each year).
In 2013, the ratio is forecast to decline as operating expenses are forecast to increase by 23.4% ($6.0m)
while operating revenue is forecast to increase by 19.7% ($4.7m). Materials and contracts costs in
particular are forecast to rise by $5.9m in 2013 due to Council undertaking the rehabilitation of a major
coal mine servicing road.
From 2014 onwards, the Operating Ratio is forecast to improve as operating revenue is forecast to
increase at greater rates than operating expenses each year.
(16.0%)
(14.0%)
(12.0%)
(10.0%)
(8.0%)
(6.0%)
(4.0%)
(2.0%)
0.0%
2011 2012 2013 2014 2015 2016 2017 2018 2019 2020 2021 2022
Figure 7- Operating Ratio for General Fund
Operating Ratio Benchmark

Muswellbrook Shire Council COMMERCIAL-IN-CONFIDENCE Page 25
This ratio has been identified as being below the benchmark set for each of the years covered in the
Long Term Financial Plan. Council accepts that this is the case and points out that the above graph
(figure 7) shows significant improvements over time (with the ratio halving over the period). It should be
noted that the current plan represents very conservative estimates and does not yet contemplate the
improvements to revenue and the actions proposed to further improve this situation.

Muswellbrook Shire Council COMMERCIAL-IN-CONFIDENCE Page 26
4.2: Financial Management Indicators
Liquidity Ratios
The Cash Expense Ratio is consistently below the benchmark in the 10-year forecast period due to
Council maintaining a substantial part of its cash reserves in cash investments.
When investments are included, the Cash Expense Ratio is above the benchmark of three months
indicating Council has sufficient liquidity.
0.0 months
0.5 months
1.0 months
1.5 months
2.0 months
2.5 months
3.0 months
3.5 months
2011 2012 2013 2014 2015 2016 2017 2018 2019 2020 2021 2022
Figure 8 - Cash Expense Ratio for General Fund
Cash Expense Ratio Benchmark
0.0 months
2.0 months
4.0 months
6.0 months
8.0 months
10.0 months
12.0 months
14.0 months
16.0 months
2011 2012 2013 2014 2015 2016 2017 2018 2019 2020 2021 2022
Figure 8a - Cash Expense Ratio for General Fund (including Investments)
Cash Expense Ratio Benchmark
Muswellbrook Shire Council COMMERCIAL-IN-CONFIDENCE Page 27
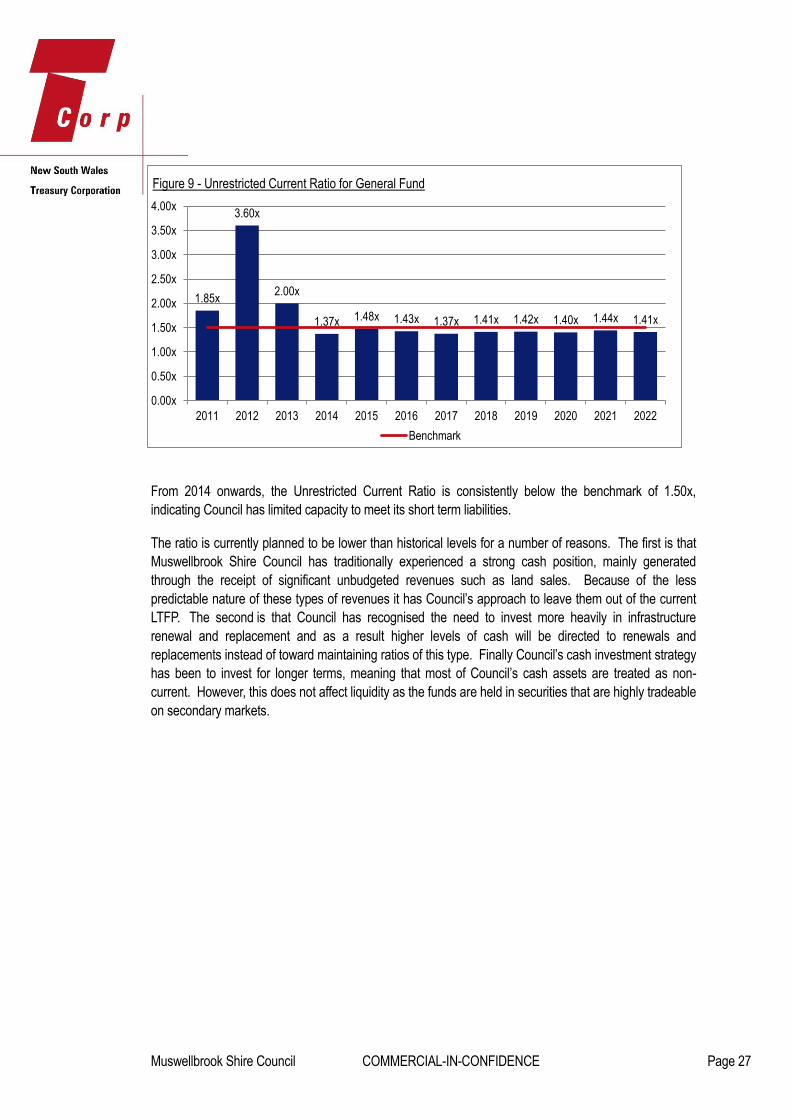
From 2014 onwards, the Unrestricted Current Ratio is consistently below the benchmark of 1.50x,
indicating Council has limited capacity to meet its short term liabilities.
The ratio is currently planned to be lower than historical levels for a number of reasons. The first is that
Muswellbrook Shire Council has traditionally experienced a strong cash position, mainly generated
through the receipt of significant unbudgeted revenues such as land sales. Because of the less
predictable nature of these types of revenues it has Council’s approach to leave them out of the current
LTFP. The second is that Council has recognised the need to invest more heavily in infrastructure
renewal and replacement and as a result higher levels of cash will be directed to renewals and
replacements instead of toward maintaining ratios of this type. Finally Council’s cash investment strategy
has been to invest for longer terms, meaning that most of Council’s cash assets are treated as non-
current. However, this does not affect liquidity as the funds are held in securities that are highly tradeable
on secondary markets.
1.85x
3.60x
2.00x
1.37x 1.48x 1.43x 1.37x 1.41x 1.42x 1.40x 1.44x 1.41x
0.00x
0.50x
1.00x
1.50x
2.00x
2.50x
3.00x
3.50x
4.00x
2011 2012 2013 2014 2015 2016 2017 2018 2019 2020 2021 2022
Figure 9 - Unrestricted Current Ratio for General Fund
Benchmark

Muswellbrook Shire Council COMMERCIAL-IN-CONFIDENCE Page 28
Fiscal Flexibility Ratios
The Own Source Operating Revenue is above the benchmark of 60.0% each year of the forecast (with
the exception of 2013), indicating Council has financial flexibility.
In 2013, the ratio is skewed downwards due to Council forecasting to receive high levels of capital grants
and contributions ($9.7m in total). Indeed, Council has negotiated a $7.1m capital contribution toward
the rehabilitation of a major coal mine service road. From 2014 onwards, the ratio is forecast to improve
and to be above the benchmark of 60.0% due to capital grants and contributions being forecast to be
lower than the historical amounts (between $1.9m and $2.5m each year between 2014 and 2022).
40%
45%
50%
55%
60%
65%
70%
2011 2012 2013 2014 2015 2016 2017 2018 2019 2020 2021 2022
Figure 10 - Own Source Operating Revenue Ratio for General Fund
Own Source Operating Revenue Ratio Benchmark

Muswellbrook Shire Council COMMERCIAL-IN-CONFIDENCE Page 29
The DSCR is above the benchmark of 2.00x each year of the forecast, indicating Council has the
capacity to service its existing loans. The LTFP indicates that Council does not forecast to add any
borrowings in the 10 year period.
Similar to the DSCR, the Interest Cover Ratio is above the benchmark each year of the forecast,
indicating Council has capacity to service the scheduled debt commitments. There is capacity to service
further debt interest costs before the Council’s ratio decreases to the 4.00x benchmark.
15.94x14.71x
12.72x13.40x
14.13x15.17x
15.92x16.66x
17.38x18.05x
18.80x 19.33x
0.00x
2.00x
4.00x
6.00x
8.00x
10.00x
12.00x
14.00x
16.00x
18.00x
20.00x
2011 2012 2013 2014 2015 2016 2017 2018 2019 2020 2021 2022
Figure 12 - Interest Cover Ratio for General Fund
Benchmark
9.73x 9.80x
7.39x 7.65x 7.93x 8.35x
10.08x11.40x 11.89x 12.36x
15.89x 16.24x
0.00x
2.00x
4.00x
6.00x
8.00x
10.00x
12.00x
14.00x
16.00x
18.00x
20.00x
2011 2012 2013 2014 2015 2016 2017 2018 2019 2020 2021 2022
Figure 11 - DSCR for General Fund
Benchmark
Muswellbrook Shire Council COMMERCIAL-IN-CONFIDENCE Page 30
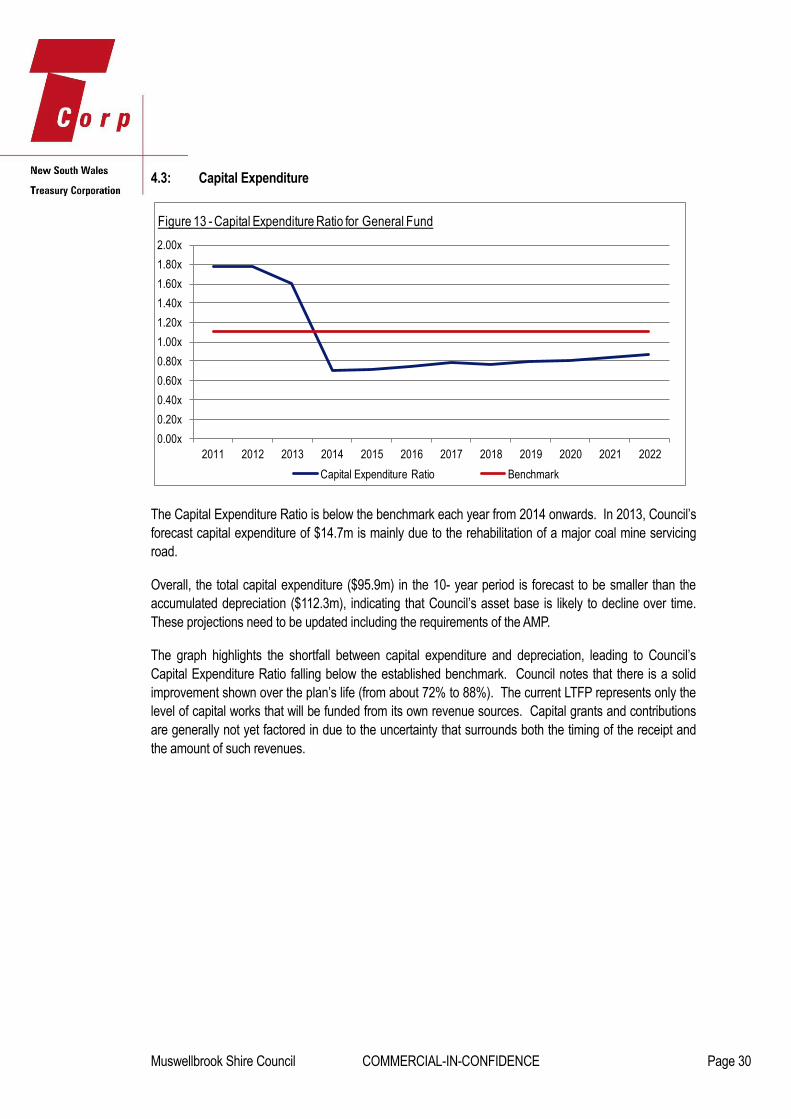
4.3: Capital Expenditure
The Capital Expenditure Ratio is below the benchmark each year from 2014 onwards. In 2013, Council’s
forecast capital expenditure of $14.7m is mainly due to the rehabilitation of a major coal mine servicing
road.
Overall, the total capital expenditure ($95.9m) in the 10- year period is forecast to be smaller than the
accumulated depreciation ($112.3m), indicating that Council’s asset base is likely to decline over time.
These projections need to be updated including the requirements of the AMP.
The graph highlights the shortfall between capital expenditure and depreciation, leading to Council’s
Capital Expenditure Ratio falling below the established benchmark. Council notes that there is a solid
improvement shown over the plan’s life (from about 72% to 88%). The current LTFP represents only the
level of capital works that will be funded from its own revenue sources. Capital grants and contributions
are generally not yet factored in due to the uncertainty that surrounds both the timing of the receipt and
the amount of such revenues.
0.00x
0.20x
0.40x
0.60x
0.80x
1.00x
1.20x
1.40x
1.60x
1.80x
2.00x
2011 2012 2013 2014 2015 2016 2017 2018 2019 2020 2021 2022
Figure 13 - Capital Expenditure Ratio for General Fund
Capital Expenditure Ratio Benchmark

Muswellbrook Shire Council COMMERCIAL-IN-CONFIDENCE Page 31
4.4: Financial Model Assumption Review
Councils have used their own assumptions in developing their forecasts.
In order to evaluate the validity of the Council’s forecast model, TCorp has compared the model
assumptions versus TCorp’s benchmarks for annual increases in the various revenue and expenditure
items. Any material differences from these benchmarks should be explained through the LTFP.
TCorp’s benchmarks:
Rates and annual charges: TCorp notes that the LGCI increased by 3.4% in the year to
September 2011, and in December 2011, IPART announced that the rate peg to apply in the
2012/13 financial year will be 3.6%. Beyond 2013 TCorp has assessed a general benchmark
for rates and annual charges to increase by mid-range LGCI annual increases of 3.0%
Interest and investment revenue: annual return of 5.0%
All other revenue items: the estimated annual CPI increase of 2.5%
Employee costs: 3.5% (estimated CPI+1.0%)
All other expenses: the estimated annual CPI increase of 2.5%
Key Observations and Risks
When Muswellbrook Council prepared the LTFP it considered that many of the assumptions are
dependent on the actions of other parties, whether these are State Government agencies or mining
companies. This makes expected additional revenues difficult to include in the LTFP as both the
quantum and timing of these increased revenues are difficult to assess. Council’s current LTFP therefore
represents a very conservative and very much baseline scenario. As Council is of the view that the LTFP
should only include revenues that are fairly secure, these potential revenues streams have been
excluded until they become more predictable.
The LTFP is currently being reviewed to include, as far as possible the above outlined factors and once
completed a further assessment of Council may result in a higher assessed level of sustainability for
Council.
The LTFP assumes that service levels to the community are being maintained
TCorp has based its analysis on the actual figures for 2011 and 2012 for the General Fund as
well as the projections for the period between 2013 and 2022.
We note that the General Fund acts as the ‘owner’ of the other funds and that the projections
include the paying of dividends from the other funds back to the General Fund. In addition, the
General Fund provides administrative and other services to the other funds for which it is paid
via overhead allocations. The Water and Sewer funds are allowed to pay certain dividends in
accordance with the guidelines established for the Best Practice Pricing1 of these services, on
the provision that Council meets the requirements set down therein. As a fund established
1 Department of Primary Industries, Office of Water “NSW Best Practice Management of Water Supply and
Sewerage Guidelines” 2007.
Muswellbrook Shire Council COMMERCIAL-IN-CONFIDENCE Page 32
wholly by Council, the Commercial Property fund can pay dividends in accordance with any
conditions established by Council.
Based on the actual 2012 figures, rates and annual charges are forecast to increase by 23.2%
($2.3m) in 2013 due to the 4.0% SRV granted by IPART for that year as well as increased
revenue generated from mining rates following the expansion of coal mines. From 2014
onwards, rates and annual charges are forecast to increase by 6.2% p.a. in order to account for
increases in population and changes to land use. This rate of growth is more optimistic than
benchmark considering Council uses a population growth rate of 1.3% p.a.
Council’s Ordinary Rates grew at a rate of 7.5% per annum between 2008/09 and 2011/12 and
includes the amounts expected to be allowed through rate pegging and the natural growth
expected in residential, commercial and mining expansion. Council feel the 6.2% increases
proposed are feasible, especially as the land use changes that occur in the Shire (especially
from Farmland to Mining) do have significant impacts on rating revenues.
User charges and fees are forecast to increase by 3.5% ($0.2m) in 2013 and 3.8% ($0.2m) in
2014. They are forecast to increase at an average rate of 6.2% p.a. from 2015 onwards due
indexation for inflation as well as planned increased activity at Council’s Aquatic Centre and
waste management facility (including the collection charges related to the waste and
environmental levy).
Operating grants and contributions are forecast to decrease by 7.6% ($0.5m) in 2013 and by
4.0% ($0.2m) in 2014 as an adjustment of the high amounts received in 2012 including the
prepayment of half of the 2013 FAG. Operating grants and contributions are forecast to
increase at an average rate of 3.0% p.a. from 2015 onwards.
Employee costs are forecast to increase by 1.2% ($1.1m) in 2013 and to remain static in 2014.
They are forecast to increase at an average rate of 3.0% p.a. from 2015 onwards.
Materials and contracts costs are forecast to increase by $5.9m in 2013. Council officers have
indicated that this is due to a range of internal transactions such as works fleet operations,
transfer between funds and business units within the General Fund as well as rates and water
usage charges. Council officers have indicated that these transactions have been included in
the budget and therefore in the LTFP for reporting and control purposes but are excluded from
the end of the year reporting as internal transactions as the reports are consolidated . Materials
and contracts costs are forecast to increase at an average rate of 6.8% p.a. from 2014 onwards
due to indexation of costs for inflation as well as Council forecasting a strong growth in
revenues allowing for increased maintenance expenditure.
Annual depreciation expense is forecast to increase by 1.1% in 2013 and at an average rate of
4.5% p.a. from 2014 onwards in order to account for expected increases in asset through
capital works.
The LTFP requires further refinement. In particular, the AMP needs to be fully incorporated
which will enable Council to better understand its revenue raising requirements. We also
consider that internal transactions should be excluded from the LTFP as this skews any analysis
of the outcomes.
Council is of the view that the fees charged by the General Fund to the Water and Sewer Funds
for administration and accounting etc. are reimbursements of services provided by the General
Fund to those funds. Including these charges more accurately represents the true cost of
operating the minor funds and is a legitimate source of revenue or at least a diminution of the
costs of operating the General Fund. Similarly, the dividends paid by the minor funds represent
a genuine source of revenue to the General Fund as the “owner” of these minor funds.

Muswellbrook Shire Council COMMERCIAL-IN-CONFIDENCE Page 33
Excluding such transactions from each individual minor fund’s plan will not allow a true
indication of the individual fund’s sustainability. However, Council accepts TCorp’s point of view
in relation to Works Plant transactions.
4.5: Borrowing Capacity
Based on the current version of the LTFP and when analysing the financial capacity of the Council, we
believe that Council should not incorporate additional loan funding in addition to its existing debt facilities
where those borrowings are serviced from operating revenues. Council has advised TCorp that Council
has access to substantial and recurrent capital planning contributions connected with infrastructure
renewal on its mining affected road network. Bringing forward the renewal of its mining affected road
network is the subject of Council’s proposed borrowings. Council proposes to fund its borrowings for the
mining affected road renewal from that recurrent capital source. TCorp considers that borrowing for
capital renewal for that purpose may be appropriate.
Some comments and observations are:
As noted in our comments in section 4.1, the forecast shows that substantial deficit positions are
expected each year when capital grants and contributions are excluded. Despite favourable
forecasts for the credit metrics (DSCR and Interest Cover Ratio) in the 10 year forecast, TCorp
considers that it would be prudent for Council to develop strategies to improve its operating
position prior to proceeding with further borrowings other than those mentioned above
Muswellbrook Shire Council COMMERCIAL-IN-CONFIDENCE Page 34
4.6 Sustainability
TCorp believes Council to be moderately Sustainable in the short to medium term. Since 2011, Council
has recorded operating deficits when capital grants and contributions are excluded. The development of
the AMP has highlighted that Council’s current levels of resources are insufficient to ensure that the
required amounts on maintenance and renewal are being spent for each class of assets. Without
additional funding, Council may therefore be unable to maintain the current service levels in these areas.
Council has, in the past, shared some of the same concerns, but is currently undertaking actions and
planning to work towards achieving substantial improvements in regard to its sustainability. Once these
proposed actions are undertaken and are better able to be measured, the adjusted Long Term Financial
Plan may show a higher degree of financial sustainability over a longer term.
In considering the longer term financial Sustainability of the Council we make the following further
comments:
Council forecasts continuous operating deficits (excluding capital grants and contributions) that
will make it difficult to maintain existing service levels.
Council’s long term Sustainability would be aided by a diversification of its revenue sources in
order to decrease its reliance on external funding sources such as operating grants and
contributions. Council was granted an SRV for 2013 that will be permanently retained in
Council’s rating base. The proceeds are to be utilised to improve mine affected roads and
associated storm water drainage infrastructure, especially on Thomas Mitchell Drive and its
related access roads.
Council has maintained a moderate level of borrowings over time. In the medium term, Council
may have capacity to take on debt to fund capital projects. However, consistent operating
deficits may prevent Council from adding further borrowings.
In recent years, spending on maintenance and renewal of assets was insufficient. The AMP has
highlighted an existing gap between the required level of maintenance and capital renewal
expenditure, and Council’s available resources. In the long term, if Council is not spending
sufficient amounts on asset maintenance, the Backlog may grow and the quality of Council’s
assets is likely to decline. Ultimately, this could impact service standards. Council is determined
to reduce its Backlog in the medium term and appears to have several options available to
increase its revenues. Indeed, Council has approximately six coal mines under various stages of
consideration for opening or expansion as well as several projects of industrial and residential
developments. With an increased mining activity and expanding population, Council is
endeavouring to reduce its Backlog in the short to medium term.

Muswellbrook Shire Council COMMERCIAL-IN-CONFIDENCE Page 35
Section 5 Benchmarking and Comparisons with Other Councils
Each council’s performance has been assessed against ten key benchmark ratios. This section of the
report compares the Council’s performance with its peers in the same DLG Group. The Council is in
DLG Group 11. There are 21 councils in this group and at the time of preparing this report, we have data
for all of these councils.
In Figure 14 to Figure 24, the graphs compare the historical performance of Council with the benchmark
for that ratio, with the average for the Group, with the highest performance (or lowest performance in the
case of the Infrastructure Backlog Ratio where a low ratio is an indicator of strong performance), and with
the forecast position of the Council as at 2016 (as per Council’s LTFP). Figures 22 to 24 do not include
the 2016 forecast position as those numbers are not available.
Where no highest line is shown on the graph, this means that Council is the best performer in its group
for that ratio. For the Interest Cover Ratio and Debt Service Cover Ratio, we have excluded from the
calculations, councils with very high ratios which are a result of low debt levels that skew the ratios.
Financial Flexibility
Council’s Operating Ratio outperformed the benchmark and the group average in three of the past four
years. In the medium term, Council’s Operating Ratio is forecast to decline and be below the benchmark.
Though, it will remain above the group’s average ratio.
(10.0%)
(5.0%)
0.0%
5.0%
10.0%
15.0%
2009 2010 2011 2012 2016
Figure 14 - Operating Ratio Comparison
Benchmark Highest
Average Muswellbrook Shire Council
Muswellbrook Shire Council COMMERCIAL-IN-CONFIDENCE Page 36
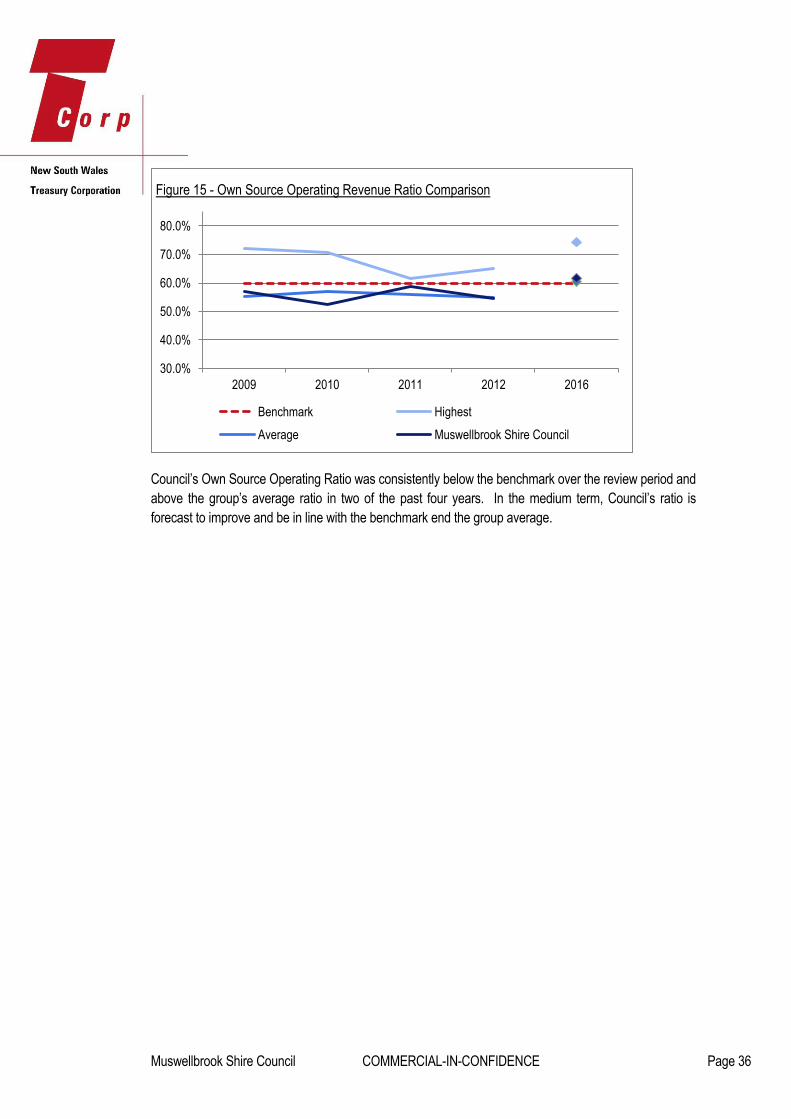
Council’s Own Source Operating Ratio was consistently below the benchmark over the review period and
above the group’s average ratio in two of the past four years. In the medium term, Council’s ratio is
forecast to improve and be in line with the benchmark end the group average.
30.0%
40.0%
50.0%
60.0%
70.0%
80.0%
2009 2010 2011 2012 2016
Figure 15 - Own Source Operating Revenue Ratio Comparison
Benchmark Highest
Average Muswellbrook Shire Council

Muswellbrook Shire Council COMMERCIAL-IN-CONFIDENCE Page 37
Liquidity
Council’s liquidity position has remained sound over the review period but was below the group average.
On average, Council’s Cash Expense Ratio and Unrestricted Current Ratio were consistently below the
benchmark and the group’s average ratio. In the medium term, Council’s liquidity position is forecast to
decline and be below the benchmark and the group average.
0.0 months
5.0 months
10.0 months
15.0 months
20.0 months
25.0 months
2009 2010 2011 2012 2016
Figure 16 - Cash Expense Ratio Comparison
Benchmark Highest
Average Muswellbrook Shire Council
1.00
3.00
5.00
7.00
9.00
11.00
13.00
2009 2010 2011 2012 2016
Figure 17 - Unrestricted Current Ratio Comparison
Benchmark Highest
Average Muswellbrook Shire Council

Muswellbrook Shire Council COMMERCIAL-IN-CONFIDENCE Page 38
Debt servicing
Over the review period, Council’s debt servicing capacity has remained sound but was below the group
average. Council’s DSCR and Interest Cover Ratio were consistently above their respective benchmark
but below the group’s average ratios. In the medium term, Council’s debt servicing capacity is forecast to
remain sound but below the group average.
-
50.00
100.00
150.00
200.00
250.00
300.00
2009 2010 2011 2012 2016
Figure 19 - Debt Service Cover Ratio Comparison
Benchmark Highest
Average Muswellbrook Shire Council
-
20.00
40.00
60.00
80.00
100.00
120.00
2009 2010 2011 2012 2016
Figure 20 - Interest Cover Ratio Comparison
Benchmark Highest
Average Muswellbrook Shire Council

Muswellbrook Shire Council COMMERCIAL-IN-CONFIDENCE Page 39
Asset Renewal and Capital Works
-
0.50
1.00
1.50
2.00
2.50
3.00
3.50
4.00
4.50
2009 2010 2011 2012 2016
Figure 20 - Capital Expenditure Ratio Comparison
Benchmark Highest
Average Muswellbrook Shire Council
-
0.50
1.00
1.50
2.00
2.50
3.00
3.50
4.00
4.50
2009 2010 2011 2012
Figure 21 - Asset Maintenance Ratio Comparison
Benchmark Highest
Average Muswellbrook Shire Council
Muswellbrook Shire Council COMMERCIAL-IN-CONFIDENCE Page 40
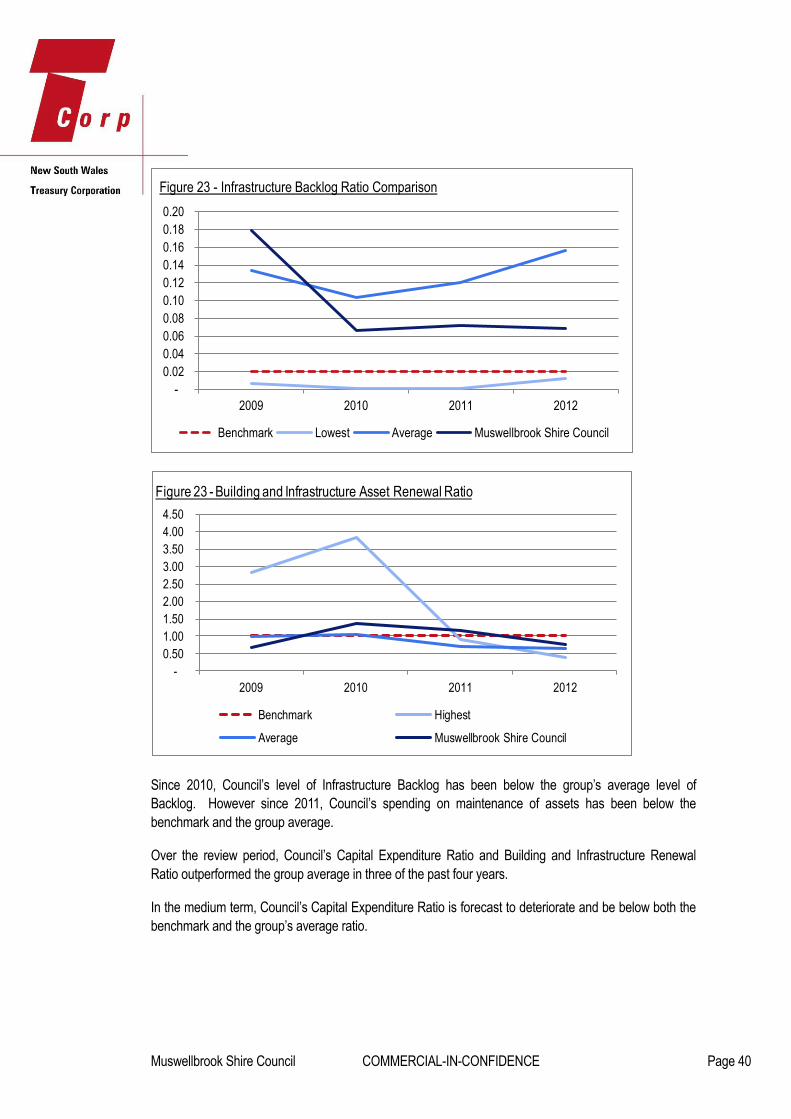
Since 2010, Council’s level of Infrastructure Backlog has been below the group’s average level of
Backlog. However since 2011, Council’s spending on maintenance of assets has been below the
benchmark and the group average.
Over the review period, Council’s Capital Expenditure Ratio and Building and Infrastructure Renewal
Ratio outperformed the group average in three of the past four years.
In the medium term, Council’s Capital Expenditure Ratio is forecast to deteriorate and be below both the
benchmark and the group’s average ratio.
-
0.02
0.04
0.06
0.08
0.10
0.12
0.14
0.16
0.18
0.20
2009 2010 2011 2012
Figure 23 - Infrastructure Backlog Ratio Comparison
Benchmark Lowest Average Muswellbrook Shire Council
-
0.50
1.00
1.50
2.00
2.50
3.00
3.50
4.00
4.50
2009 2010 2011 2012
Figure 23 - Building and Infrastructure Asset Renewal Ratio
Benchmark Highest
Average Muswellbrook Shire Council
Muswellbrook Shire Council COMMERCIAL-IN-CONFIDENCE Page 41
Section 6 Conclusion and Recommendations
Based on our review of both the historic financial information and the 10 year financial forecasts within
Council’s LTFP, we consider Council to be moderately Sustainable in the short to medium term. The
continued operating deficits forecast will eventually have a negative effect on Council’s ability to replace
key infrastructure assets as they become due for renewal. In addition, until the AMPs are finalised and
incorporated into the LTFP, Council faces the risk of a deteriorating financial position.
We base our recommendation on the following key points:
Over the past four years, Council had sufficient liquidity to meet its short term liabilities
Council has maintained a moderate level of borrowings over the past four years
However we would also recommend that the following points be considered:
Since 2011, Council has incurred substantial operating deficits (excluding capital grants and
contributions). In recent years, Council has been negatively impacted by substantial increases
in the depreciation expense following the Asset Revaluations. Council forecasts continuing
operating deficits when capital grants and contributions are excluded. While Sustainable in the
short to medium term, Council may become unsustainable in the longer term unless additional
revenues can be sourced, further efficiencies found, or service levels reviewed
Following the development of the AMP, spending on maintenance of assets has been below the
required levels. The AMPs have highlighted the limits of Council’s current levels of resources in
relation to maintenance and renewal of assets. In the long term, if Council does not spend the
required amounts on asset maintenance and renewal of assets, this could lead to an increased
Infrastructure Backlog and to a reduction in asset quality and service levels.
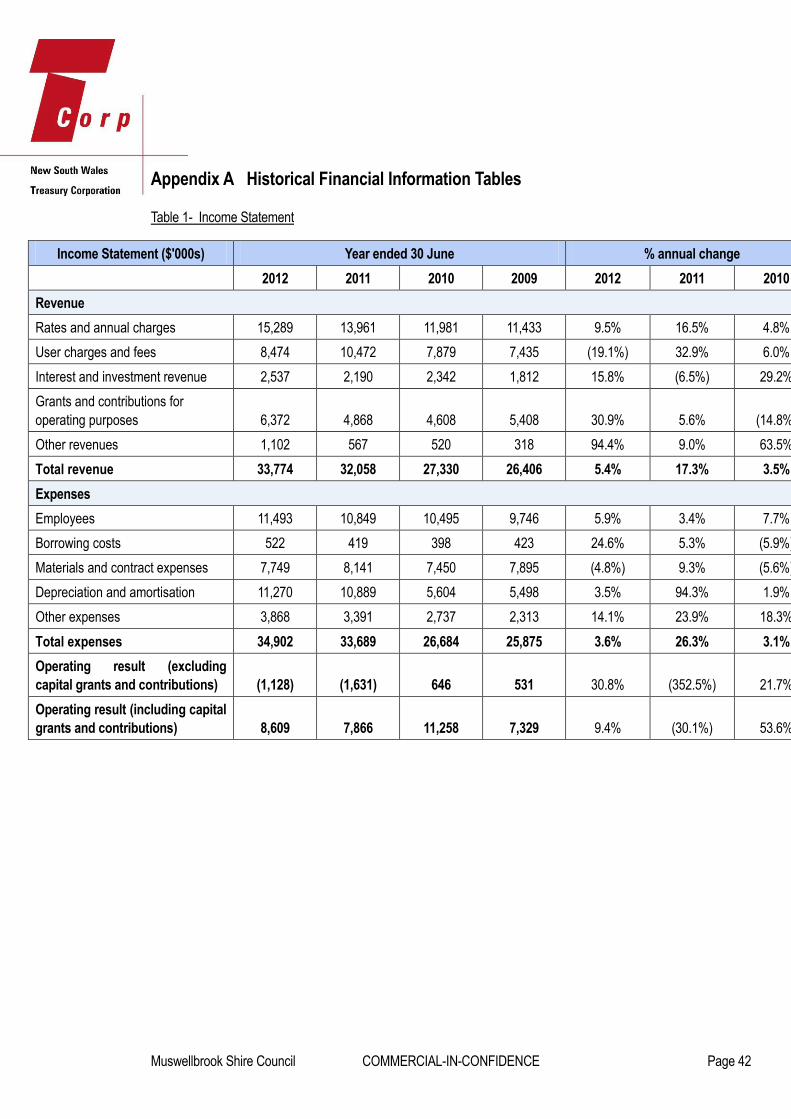
Muswellbrook Shire Council COMMERCIAL-IN-CONFIDENCE Page 42
Appendix A Historical Financial Information Tables
Table 1- Income Statement
Income Statement ($'000s) Year ended 30 June % annual change
2012 2011 2010 2009 2012 2011 2010
Revenue
Rates and annual charges 15,289 13,961 11,981 11,433 9.5% 16.5% 4.8%
User charges and fees 8,474 10,472 7,879 7,435 (19.1%) 32.9% 6.0%
Interest and investment revenue 2,537 2,190 2,342 1,812 15.8% (6.5%) 29.2%
Grants and contributions for
operating purposes 6,372 4,868 4,608 5,408 30.9% 5.6% (14.8%)
Other revenues 1,102 567 520 318 94.4% 9.0% 63.5%
Total revenue 33,774 32,058 27,330 26,406 5.4% 17.3% 3.5%
Expenses
Employees 11,493 10,849 10,495 9,746 5.9% 3.4% 7.7%
Borrowing costs 522 419 398 423 24.6% 5.3% (5.9%)
Materials and contract expenses 7,749 8,141 7,450 7,895 (4.8%) 9.3% (5.6%)
Depreciation and amortisation 11,270 10,889 5,604 5,498 3.5% 94.3% 1.9%
Other expenses 3,868 3,391 2,737 2,313 14.1% 23.9% 18.3%
Total expenses 34,902 33,689 26,684 25,875 3.6% 26.3% 3.1%
Operating result (excluding
capital grants and contributions) (1,128) (1,631) 646 531 30.8% (352.5%) 21.7%
Operating result (including capital
grants and contributions) 8,609 7,866 11,258 7,329 9.4% (30.1%) 53.6%

Muswellbrook Shire Council COMMERCIAL-IN-CONFIDENCE Page 43
Table 2 - Items excluded from Income Statement
Excluded items ($’000s)
2012 2011 2010 2009
Grants and contributions for capital purposes 9,737 9,497 10,612 6,798
Interest and investment revenue- fair value movements to investments 202 586 153 196
Interest and investment revenue- Impairment losses (307) 0 0 (327)
Interest and investment revenue- Fair valuation of interest free loans received 0 0 504 0
Borrowings costs- Remediation liabilities 224 212 250 235
Borrowing costs- Interest applicable on interest free loans to Council 77 82 0 0
Other expenses- Revaluation decrements (Fair valuation of Investment Properties) 250 149 0 0
Net gain from the disposal of assets 676 98 (26) 107

Muswellbrook Shire Council COMMERCIAL-IN-CONFIDENCE Page 44
Table 3 - Balance Sheet
Balance Sheet ($’000s) Year Ended 30 June % annual change
2012 2011 2010 2009 2012 2011 2010
Current assets
Cash and equivalents 4,026 3,568 1,006 4,089 12.8% 254.7% (75.4%)
Investments 13,040 13,484 15,866 11,809 (3.3%) (15.0%) 34.4%
Receivables 3,965 3,835 4,796 2,904 3.4% (20.0%) 65.2%
Inventories 1,195 1,660 1,649 1,626 (28.0%) 0.7% 1.4%
Other 175 138 11 236 26.8% 1154.5% (95.3%)
Total current assets 22,401 22,685 23,328 20,664 (1.3%) (2.8%) 12.9%
Non-current assets
Investments 26,898 27,511 26,808 27,448 (2.2%) 2.6% (2.3%)
Infrastructure, property, plant & equipment 418,903 401,250 384,642 228,254 4.4% 4.3% 68.5%
Investments accounted for using equity method 40 30 0 0 33.3% N/A N/A
Investment property 5,406 4,298 873 0 25.8% 392.3% 0
Total non-current assets 451,247 433,089 412,323 255,702 4.2% 5.0% 61.3%
Total assets 473,648 455,774 435,651 276,366 3.9% 4.6% 57.6%
Current liabilities
Payables 3,174 2,847 1,822 2,233 11.5% 56.3% (18.4%)
Borrowings 520 487 1,344 372 6.8% (63.8%) 261.3%
Provisions 2,404 2,195 2,327 1,979 9.5% (5.7%) 17.6%
Total current liabilities 6,098 5,529 5,493 4,584 10.3% 0.7% 19.8%
Non-current liabilities
Borrowings 7,770 8,290 6,504 5,889 (6.3%) 27.5% 10.4%
Provisions 4,358 3,937 3,654 4,337 10.7% 7.7% (15.7%)
Investments accounted for using equity method 0 0 38 42 N/A (100.0%) (9.5%)
Total non-current liabilities 12,128 12,227 10,196 10,268 (0.8%) 19.9% (0.7%)
Total liabilities 18,226 17,756 15,689 14,852 2.6% 13.2% 5.6%
Net assets 455,422 438,018 419,962 261,514 4.0% 4.3% 60.6%

Muswellbrook Shire Council COMMERCIAL-IN-CONFIDENCE Page 45
Table 4-Cashflow
Cashflow Statement ($'000s) Year ended 30 June
2012 2011 2010 2009
Cashflows from operating activities 15,562 14,195 8,144 8,451
Cashflows from investing activities (14,540) (12,481) (13,318) (5,359)
Proceeds from borrowings and advances 0 2,280 1,560 0
Repayment of borrowings and advances (564) (527) (374) (394)
Cashflows from financing activities (564) 1,753 1,186 (394)
Net increase/(decrease) in cash and equivalents 458 3,467 (3,988) 2,698
Cash and equivalents 4,026 3,568 1,006 4,089

Muswellbrook Shire Council COMMERCIAL-IN-CONFIDENCE Page 46
Appendix B Glossary
Asset Revaluations
In assessing the financial sustainability of NSW councils, IPART found that not all councils reported
assets at fair value.2 In a circular to all councils in March 20093, DLG required all NSW councils to
revalue their infrastructure assets to recognise the fair value of these assets by the end of the 2009/10
financial year.
Collateralised Debt Obligation (CDO)
CDOs are structured financial securities that banks use to repackage individual loans into a product that
can be sold to investors on the secondary market.
In 2007 concerns were heightened in relation to the decline in the “sub-prime” mortgage market in the
USA and possible exposure of some NSW councils, holding CDOs and other structured investment
products, to losses.
In order to clarify the exposure of NSW councils to any losses, a review was conducted by the DLG with
representatives from the Department of Premier and Cabinet and NSW Treasury.
A revised Ministerial investment Order was released by the DLG on 18 August 2008 in response to the
review, suspending investments in CDOs, with transitional provisions to provide for existing investments.
Division of Local Government (DLG)
DLG is a division of the NSW Department of Premier and Cabinet and is responsible for local
government across NSW. DLG’s organisational purpose is “to strengthen the local government sector”
and its organisational outcome is “successful councils engaging and supporting their communities”.
Operating within several strategic objectives DLG has a policy, legislative, investigative and program
focus in matters ranging from local government finance, infrastructure, governance, performance,
collaboration and community engagement. DLG strives to work collaboratively with the local government
sector and is the key adviser to the NSW Government on local government matters.
Depreciation of Infrastructure Assets
Linked to the asset revaluations process stated above, IPART’s analysis of case study councils found
that this revaluation process resulted in sharp increases in the value of some council’s assets. In some
cases this has led to significantly higher depreciation charges, and will contribute to higher reported
operating deficits.
1IPART “Revenue Framework for Local Government” December 2009 p.83
3 DLG “Recognition of certain assets at fair value” March 2009

Muswellbrook Shire Council COMMERCIAL-IN-CONFIDENCE Page 47
EBITDA
EBITDA is an acronym for “earnings before interest, taxes, depreciation, and amortisation”. It is often
used to measure the cash earnings that can be used to pay interest and repay principal.
Grants and Contributions for Capital Purposes
Councils receive various capital grants and contributions that are nearly always 100% specific in nature.
Due to the fact that they are specifically allocated in respect of capital expenditure they are excluded from
the operational result for a council in TCorp’s analysis of a council’s financial position.
Grants and Contributions for Operating Purposes
General purpose grants are distributed through the NSW Local Government Grants Commission. When
distributing the general component each council receives a minimum amount, which would be the
amount if 30% of all funds were allocated on a per capita basis. When distributing the other 70%, the
Grants Commission attempts to assess the extent of relative disadvantage between councils. The
approach taken considers cost disadvantage in the provision of services on the one hand and an
assessment of revenue raising capacity on the other.
Councils also receive specific operating grants for one-off specific projects that are distributed to be spent
directly on the project that the funding was allocated to.
Independent Commission Against Corruption (ICAC)
ICAC was established by the NSW Government in 1989 in response to growing community concern
about the integrity of public administration in NSW.
The jurisdiction of the ICAC extends to all NSW public sector agencies (except the NSW Police Force)
and employees, including government departments, local councils, members of Parliament, ministers,
the judiciary and the governor. The ICAC's jurisdiction also extends to those performing public official
functions.
Independent Pricing and Regulatory Tribunal (IPART)
IPART has four main functions relating to the 152 local councils in NSW. Each year, IPART determines
the rate peg, or the allowable annual increase in general income for councils. They also review and
determine council applications for increases in general income above the rate peg, known as “Special
Rate Variations”. They approve increases in council minimum rates. They also review council
development contributions plans that propose contribution levels that exceed caps set by the
Government.
Infrastructure Backlog
Infrastructure backlog is defined as the estimated cost to bring infrastructure, building, other structures
and depreciable land improvements to a satisfactory standard, measured at a particular point in time. It is
unaudited and stated within Special Schedule 7 that accompanies the council’s audited annual financial
statements.
Muswellbrook Shire Council COMMERCIAL-IN-CONFIDENCE Page 48
Integrated Planning and Reporting (IP&R) Framework
As part of the NSW Government’s commitment to a strong and sustainable local government system, the
Local Government Amendment (Planning and Reporting) Act 2009 was assented on 1 October 2009.
From this legislative reform the IP&R framework was devised to replace the former Management Plan
and Social Plan with an integrated framework. It also includes a new requirement to prepare a long-term
Community Strategic Plan and Resourcing Strategy. The other essential elements of the new framework
are a Long-Term Financial Plan (LTFP), Operational Plan and Delivery Program and an Asset
Management Plan.
Local Government Cost Index (LGCI)
The LGCI is a measure of movements in the unit costs incurred by NSW councils for ordinary council
activities funded from general rate revenue. The LGCI is designed to measure how much the price of a
fixed “basket” of inputs acquired by councils in a given period compares with the price of the same set of
inputs in the base period. The LGCI is measured by IPART.
Net Assets
Net Assets is measured as total assets less total liabilities. The Asset Revaluations over the past years
have resulted in a high level of volatility in many councils’ Net Assets figure. Consequently, in the short
term the value of Net Assets is not necessarily an informative indicator of performance. In the medium to
long term however, this is a key indicator of a council’s capacity to add value to its operations. Over time,
Net Assets should increase at least in line with inflation plus an allowance for increased population and/or
improved or increased services. Declining Net Assets is a key indicator of the council’s assets not being
able to sustain ongoing operations.
Roads and Maritime Services (RMS)
The NSW State Government agency with responsibility for roads and maritime services, formerly the
Roads and Traffic Authority (RTA).
Section 64 Contribution
Development Servicing Plans (DSPs) are made under the provisions of Section 64 of the Local
Government Act 1993 and Sections 305 to 307 of the Water Management Act 2000.
DSPs outline the developer charges applicable to developments for Water, Sewer and Stormwater within
each Local Government Area.

Muswellbrook Shire Council COMMERCIAL-IN-CONFIDENCE Page 49
Section 94 Contribution
Section 94 of the Environmental Planning and Assessment Act 1979 allows councils to collect
contributions from the development of land in order to help meet the additional demand for community
and open space facilities generated by that development.
It is a monetary contribution levied on developers at the development application stage to help pay for
additional community facilities and/or infrastructure such as provision of libraries; community facilities;
open space; roads; drainage; and the provision of car parking in commercial areas.
The contribution is determined based on a formula which should be contained in each council's Section
94 Contribution Plan, which also identifies the basis for levying the contributions and the works to be
undertaken with the funds raised.
Special Rate Variation (SRV)
A SRV allows councils to increase general income above the rate peg, under the provisions of the Local
Government Act 1993. There are two types of special rate variations that a council may apply for:
a single year variation (section 508(2)) or
a multi-year variation for between two to seven years (section 508A).
The applications are reviewed and approved by IPART.
Sustainability
A local government will be financially sustainable over the long term when it is able to generate sufficient
funds to provide the levels of service and infrastructure agreed with its community
Ratio Explanations
Asset Maintenance Ratio
Benchmark = Greater than 1.0x
Ratio = actual asset maintenance / required asset maintenance
This ratio compares actual versus required annual asset maintenance, as detailed in Special Schedule 7.
A ratio of above 1.0x indicates that the council is investing enough funds within the year to stop the
infrastructure backlog from growing.

Muswellbrook Shire Council COMMERCIAL-IN-CONFIDENCE Page 50
Building and Infrastructure Renewals Ratio
Benchmark = Greater than 1.0x
Ratio = Asset renewals / depreciation of building and infrastructure assets
This ratio compares the proportion spent on infrastructure asset renewals and the asset’s deterioration
measured by its accounting depreciation. Asset renewal represents the replacement or refurbishment of
existing assets to an equivalent capacity or performance as opposed to the acquisition of new assets or
the refurbishment of old assets that increase capacity or performance.
Cash Expense Cover Ratio
Benchmark = Greater than 3.0 months
Ratio = current year’s cash and cash equivalents / (total expenses – depreciation – interest costs)*12
This liquidity ratio indicates the number of months a council can continue paying for its immediate
expenses without additional cash inflow.
Capital Expenditure Ratio
Benchmark = Greater than 1.1x
Ratio = annual capital expenditure / annual depreciation
This indicates the extent to which a council is forecasting to expand its asset base with capital
expenditure spent on both new assets, and replacement and renewal of existing assets.
Debt Service Cover Ratio (DSCR)
Benchmark = Greater than 2.0x
Ratio = operating results before interest and depreciation (EBITDA) / principal repayments (from the
statement of cash flows) + borrowing interest costs (from the income statement)
This ratio measures the availability of cash to service debt including interest, principal and lease
payments
Building and Infrastructure Backlog Ratio
Benchmark = Less than 0.02x
Ratio = estimated cost to bring assets to a satisfactory condition (from Special Schedule 7) / total
infrastructure assets (from Special Schedule 7)
This ratio shows what proportion the backlog is against total value of a council’s infrastructure.

Muswellbrook Shire Council COMMERCIAL-IN-CONFIDENCE Page 51
Interest Cover Ratio
Benchmark = Greater than 4.0x
Ratio = EBITDA / interest expense (from the income statement)
This ratio indicates the extent to which a council can service its interest bearing debt and take on
additional borrowings. It measures the burden of the current interest expense upon a council’s operating
cash.
Operating Ratio
Benchmark = Better than negative 4%
Ratio = (operating revenue excluding capital grants and contributions – operating expenses) / operating
revenue excluding capital grants and contributions
This ratio measures a council’s ability to contain operating expenditure within operating revenue.
Own Source Operating Revenue Ratio
Benchmark = Greater than 60%
Ratio = rates, utilities and charges / total operating revenue (inclusive of capital grants and contributions)
This ratio measures the level of a council’s fiscal flexibility. It is the degree of reliance on external funding
sources such as operating grants and contributions. A council’s financial flexibility improves the higher the
level of its own source revenue.
Unrestricted Current Ratio
Benchmark = 1.5x (taken from the IPART December 2009 Revenue Framework for Local Government
report)
Ratio = Current assets less all external restrictions / current liabilities less specific purpose liabilities
Restrictions placed on various funding sources (e.g. Section 94 developer contributions, RMS
contributions) complicate the traditional current ratio because cash allocated to specific projects are
restricted and cannot be used to meet a council’s other operating and borrowing costs. The Unrestricted
Current Ratio is specific to local government and is designed to represent a council’s ability to meet debt
payments as they fall due.