Embed Size (px)
Citation preview

Multimode and Multilevel: Vertical Dimension in Historical and Literary Networks [email protected],Switzerland
Introduction In the field of global history, especially when itcomes to « histoire croisée », the use of metaphorsdescribing the vertical organization of a society, itsstructurationintolayersorintooverlappingsystems,iscommon.Thetemptationtouseasecondmetaphor,callingeverythinga“network”,isalsoveryimportantin this domain, whose objects of study are oftentransnational organizations with multiple branches,intertwined within umbrella organizations, sharingboard members and including several levels ofsecretariats and subcommittees (Grandjean 2017).However, the use of these images is not limited tohistoricalstudies,sinceweusethesamevocabularyinother disciplines to describe social situations ortextualstructures. When we go beyond the metaphor to develop aformal analysis,we often producemultigraphswho,because they simultaneously express horizontal andverticalrelationships,aregenerallyunsuitablefortheanalysis (and visualisation, except in very simplecases). If the “exploratory” dimension of socialnetwork analysis – and especially the fact that itsdisplay is relatively subjective– isoftena subjectofcriticism, we propose here to play with the visualrepresentation to show precisely how an originalmodellingcanimprovethereadingofcomplexgraphs,and helping to restore a “morphological” (Moretti1999, 68) information where disorder seems toprevail. Basedontwoexamplesfromarchivesmappingandtheatre character networks, this paper proposes areflection on the different ways to take account ofverticalityingraphs.Inparticular,wearedevelopinga way to impose a macro-structure to a network,allowing a two-dimensions view that reflects thehierarchicalaffiliationsofitscomponents.Wewillsee
that this method, by constructing a stable visualrepresentation in time and space, helps to comparedifferenttypesofrelationshipsand/ordifferenttimestatesofthegraph.
Network levels What is evident in an affiliation network is notalways explicit in other situations, but a multimodegraphisalwaystheexpressionofaformofmultilevelnetwork (Lazega and Snijders 2016). For instance,there isan implicithierarchyamong thecommitteeslevelandthelevelofindividualswithinthem.Itisthuseasy to imagine such networks as superimposedlayers,linkedbytheverticalaffiliationlinks.Andthisanalysisisobviouslyinterestingbecausetheseverticallinks are not the only ones to influence the modelstructure: committees in the upper stratum maythemselves be organized into their own horizontalstructure,aswellasindividuals,inthelowerstratum,canweaverelationshipregardlessofthestructureofthe committees to which they belong. This kind ofmacro/micro-structure comparison is not new insociology: through sociometric approaches of urbansocial structures, for example, some address theorganization of metropolitan communities togetherwith that of interpersonal relationships (Laumann1973). This raises the issue of representing thesenetworks within a two-dimensional plane, e.g. bychangesinthecolourandshapeofthemarkers(Wangetal.2016),orbyanartificial transferof theupper-levelinaregionofthegraphthatenablesthemtoberead (Zappa and Lomi 2015). When the lowcomplexity of networks allows, some may also usethree-dimensionalrepresentations,clearly indicatingthesuperimposedplanes(BraillyandLazega2012).
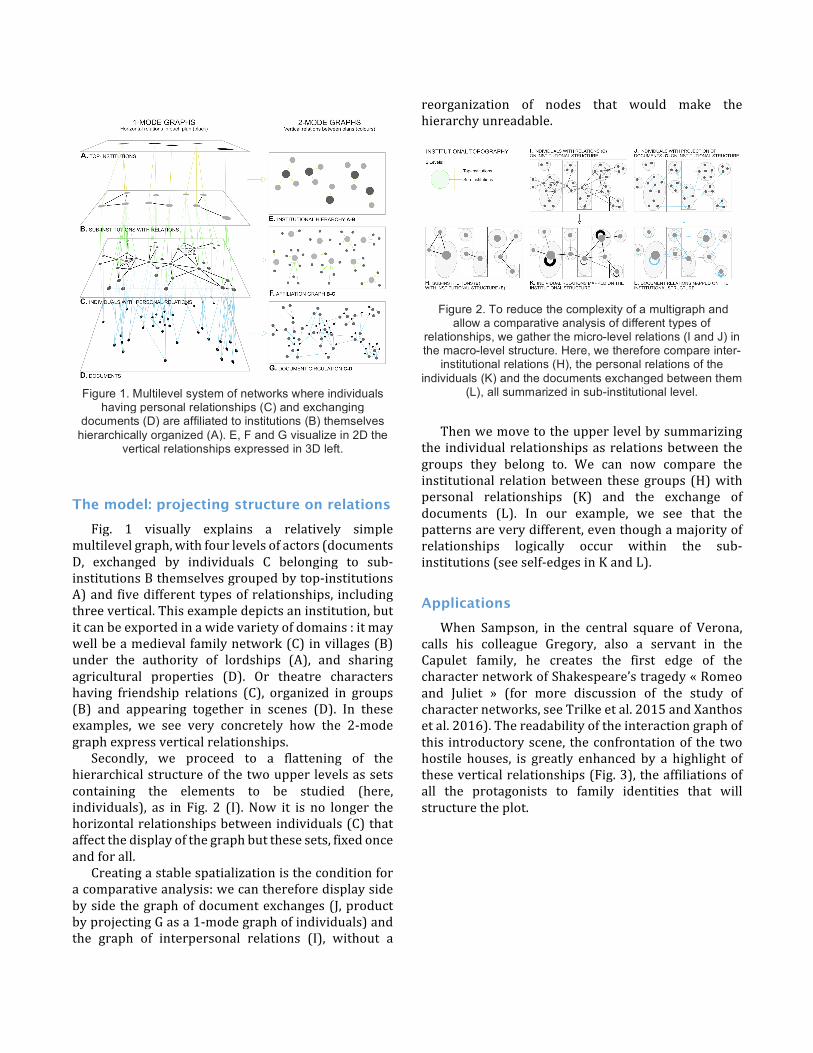
Figure 1. Multilevel system of networks where individuals
having personal relationships (C) and exchanging documents (D) are affiliated to institutions (B) themselves
hierarchically organized (A). E, F and G visualize in 2D the vertical relationships expressed in 3D left.
The model: projecting structure on relations Fig. 1 visually explains a relatively simplemultilevelgraph,withfourlevelsofactors(documentsD, exchanged by individuals C belonging to sub-institutionsBthemselvesgroupedbytop-institutionsA)andfivedifferenttypesofrelationships, includingthreevertical.Thisexampledepictsaninstitution,butitcanbeexportedinawidevarietyofdomains:itmaywellbeamedievalfamilynetwork(C)invillages(B)under the authority of lordships (A), and sharingagricultural properties (D). Or theatre charactershaving friendship relations (C), organized in groups(B) and appearing together in scenes (D). In theseexamples, we see very concretely how the 2-modegraphexpressverticalrelationships. Secondly, we proceed to a flattening of thehierarchicalstructureofthetwoupperlevelsassetscontaining the elements to be studied (here,individuals), as in Fig. 2 (I). Now it is no longer thehorizontalrelationshipsbetweenindividuals(C)thataffectthedisplayofthegraphbutthesesets,fixedonceandforall. Creatingastablespatializationistheconditionforacomparativeanalysis:wecanthereforedisplaysidebysidethegraphofdocumentexchanges(J,productbyprojectingGasa1-modegraphofindividuals)andthe graph of interpersonal relations (I), without a
reorganization of nodes that would make thehierarchyunreadable.
Figure 2. To reduce the complexity of a multigraph and
allow a comparative analysis of different types of relationships, we gather the micro-level relations (I and J) in the macro-level structure. Here, we therefore compare inter-
institutional relations (H), the personal relations of the individuals (K) and the documents exchanged between them
(L), all summarized in sub-institutional level.
Thenwemovetotheupperlevelbysummarizingthe individualrelationshipsasrelationsbetweenthegroups they belong to. We can now compare theinstitutional relationbetween thesegroups (H)withpersonal relationships (K) and the exchange ofdocuments (L). In our example, we see that thepatternsareverydifferent,eventhoughamajorityofrelationships logically occur within the sub-institutions(seeself-edgesinKandL).
Applications When Sampson, in the central square of Verona,calls his colleague Gregory, also a servant in theCapulet family, he creates the first edge of thecharacternetworkofShakespeare’stragedy«Romeoand Juliet » (for more discussion of the study ofcharacternetworks,seeTrilkeetal.2015andXanthosetal.2016).Thereadabilityoftheinteractiongraphofthis introductoryscene, theconfrontationof the twohostile houses, is greatly enhanced by a highlight oftheseverticalrelationships(Fig.3),theaffiliationsofall the protagonists to family identities that willstructuretheplot.

Figure 3. The character network of Shakespeare’s tragedy “Romeo and Juliet” (Grandjean 2015). Two characters are connected if they appear simultaneously in a scene. On the left, the network is spatialized with a classical force-directed
algorithm, and on the right by imposing a “family geography”) (family in the inner circle, servants in the outer
circle).
Inthecontextofmorecomplexnetworks,whereitis less about creating a new visual and pedagogicalartifacttofacilitatenarratologicalstudiesthantofinda way to automate pattern detection, we will alsodiscuss thecaseofnetworkanalysisof largearchivecorpora(Grandjean2014).Inthiscase(Fig.4),wewillshow in particular that it is possible to detectindividuals thatbypass institutionalhierarchy,whenhorizontal relationships do not align with verticalaffiliations.
Figure 4. Cooccurrences network of more than 3,000
scientists and diplomats in the 30,000 documents of the “International Commission on Intellectual Cooperation” of
the League of Nations (archives 1919-1927). On the left, the network spatialized with a force-directed algorithm, and on
the right spatialized by imposing a vertical hierarchy, flattening the affiliation of each individual in a kind of
“institutional geography (Grandjean 2016).
Bibliography
Brailly,J.andLazega,E.(2012).Diversitédesapprochesdemodélisationstatistiqueenanalysederéseauxsociauxmultiniveaux,MathematicsandSocialSciences,198,pp.5-28.
Grandjean,M.(2014).Laconnaissanceestunréseau:per-spectivesurl’organisationarchivistiqueetencyclopédique,LesCahiersduNumérique,10,3,pp.37-54.Grandjean,M.(2015).Networkvisualization:mappingShakespeare’stragedies,http://www.mar-tingrandjean.ch/network-visualization-shakespeare/(ac-cessedon1stOctober2016).Grandjean,M.(2016).ArchivesDistantReading:MappingtheActivityoftheLeagueofNation’sIntellectualCoopera-tion,DigitalHumanities2016:ConferenceAbstracts,pp.531-534.Grandjean,M.(2017).Strutturecomplesseeorganizza-zioniinternazionali.Analisievisualizzazionidelleretiinstoria:l’esempiodellacooperazioneintellettualedellaSo-cietàdelleNazioni,MemoriaeRicerca,25,2.Laumann,E.O.(1973).BondsofPluralism:TheFormandSubstanceofUrbanSocialNet-works,NewYork,WileyandSons.Lazega,E.andSnijders,T.A.B.(2016).MultilevelNetworkAnalysisfortheSocialSciences,Springer.Moretti,F.(1999).AtlasoftheEuropeanNovel,1800-1900,VersoBooks.Trilcke,P.,Fischer,F.andKampkaspar,D.(2015).Digi-talNetworkAnalysisofDramaticTexts.DigitalHumanities2015,http://dh2015.org/ab-stracts/xml/FISCHER_Frank_Digital_Network_Analy-sis_of_Dramati/FISCHER_Frank_Digital_Network_Analy-sis_of_Dramatic_Text.html(accessedon1stOctober2016).WangP.,RobinsG.,PattisonP.andLazegaE.(2016).So-cialselectionmodelsformultilevelnetworks,SocialNet-works,44,pp.346-362.XanthosA.PanteI.,RochatY.andGrandjeanM.(2016).VisualisingtheDynamicsofCharacterNetworks,DigitalHumanities2016:ConferenceAbstracts,pp.417-419.Zappa,P.andLomi,A.(2015).TheAnalysisofMultilevelNetworksinOrganizations:ModelsandEmpiricalTests,OrganizationalResearchMethods,18,3,pp.542-569.