Embed Size (px)
Citation preview

53
Mortality
Table 45 Resident Deaths, Crude Death Rates, and Age-Adjusted Death Rates,
South Dakota and United States, 2000-2016
Year
United States South Dakota
Number Crude Rate
Age-Adjusted Rate
Number Crude Rate
Age-Adjusted Rate
2016 NA* NA* NA* 7,838 905.7 718.6
2015 NA* NA* NA* 7,724 899.7 714.9
2014 2,626,418 823.7 724.6 7,500 879.1 709.9
2013 2,596,993 821.5 731.9 7,079 837.9 677.4
2012 2,543,279 810.2 732.8 7,283 873.9 706.8
2011 2,515,458 807.3 741.3 7,271 882.3 716.1
2010 2,468,435 799.5 747.0 7,087 870.4 713.4
2009 2,437,163 794.5 749.6 6,913 851.1 688.6
2008 2,471,984 813.0 758.3 7,056 877.0 712.1
2007 2,423,712 803.6 760.2 6,800 853.2 695.1
2006 2,426,264 810.4 776.5 7,038 892.6 732.6
2005 2,448,017 825.9 798.8 7,074 906.8 758.0
2004 2,397,615 816.5 800.8 6,811 879.7 742.3
2003 2,448,288 841.9 832.7 7,109 926.9 787.1
2002 2,443,387 847.3 845.3 6,886 903.5 771.8
2001 2,416,425 848.5 854.5 6,915 911.1 786.2
2000 2,403,351 854.0 869.0 7,014 929.2 804.8
Note: *U.S. 2015 and 2016 data were not available at publication time. Crude death rates are per 100,000 population. Age-adjusted rates are computed with the 2000 standard. Source: National Center of Health Statistics South Dakota Department of Health, Office of Health Statistics
The remaining categories (Single-race Black, Single-race Asian, Single-race Pacific Islander, and Two or more races) are included in the totals, but are not shown specifically in any tables. Table 45, below, displays the deaths, crude death rates, and age-adjusted death rates for the United States and South Dakota residents for the past 17 years. The total number of South Dakota resident deaths in 2016, (7,838 deaths) is the highest number of deaths in the past 17 years.
An Overview: 2016
Total South Dakota Resident Deaths 7,838 Crude Death Rates per 100,000 Population South Dakota 905.7 United States (2014) 823.7 Age-Adjusted Death Rates per 100,000 Population South Dakota 718.6 United States (2014) 724.6
Race is assigned based on standards set forth by the National Center for Health Statistics and the US Census Bureau in order for South Dakota’s race data to be comparable to other areas. All race data in this section are categorized in the following manner: Single-race white Single-race American Indian

54
Cancer was the second leading cause of death in 2016 and accounted for 21.6 percent of South Dakota resident deaths, a 2.4 percent increase from 2015. Accidents were the third leading cause of death and accounted for 6.4 percent of 2016 South Dakota resident deaths, a 6.7 percent increase from 2015. Motor vehicle accidents accounted for 26.8 percent of accidental deaths.
Alzheimer’s disease was the fourth leading cause of death accounting for 5.7 percent of all South Dakota resident deaths in 2016, an increase of 3.6 percent from 2015.
Chronic lower respiratory disease accounted for 5.7 percent of South Dakota resident deaths and fell from third leading cause of death in 2015 to fifth leading cause of death in 2016.
Leading Causes of Death The five leading causes of death in 2016 for South Dakota residents were heart disease, cancer, accidents, Alzheimer’s disease, and chronic lower respiratory diseases. Heart disease remained the leading cause of death in South Dakota accounting for 22.1 percent of South Dakota’s 2016 resident deaths. Heart disease was the leading cause of death for whites, males, and females in 2016. Accidents were the leading cause of death for American Indians in 2016.
Acute myocardial infarction was the leading cause of heart disease deaths during the year, accounting for 34.4 percent of heart disease deaths. Figure 8, below, compares the crude death rates of South Dakota resident heart disease and cancer since 2000. From 2015 to 2016 there was an increase in the heart disease rate and an increase in the cancer rate.
Crude Death Rat
e
Figure 8 South Dakota Resident Crude Death Rate Due to Malignant Neoplasms
and Heart Disease by Year of Death, 2000-2016
Year of Death
Note: The crude death rate is calculated using yearly U.S. Census Bureau population estimates for that year. Source: South Dakota Department of Health, Office of Health Statistics
200.1199.4198.7
191.4
196.0197.9
218.9208.4203.6
221.0226.1229.2
253.2253.6261.4
198.2
278.9
195.4190.1196.8186.3
194.8
201.0202.8
185.4194.0201.5198.0
206.4201.3214.5204.8210.5212.5
0
50
100
150
200
250
300
2000 2001 2002 2003 2004 2005 2006 2007 2008 2009 2010 2011 2012 2013 2014 2015 2016
Heart DiseaseMalignant Neoplasms

55
Source: South Dakota Department of Health, Office of Health Statistics
Total
Year of Death
2012 2013 2014 2015 2016
Total Deaths 2,272 417 424 461 467 503
Motor Vehicle Accidents 720 142 149 151 143 135
Car Occupant (V40-V49) 341 73 76 74 70 48
Occupant of Pick-Up Truck or Van (V50-V59) 133 24 25 31 25 28
Motorcycle Rider (V20-V29) 62 14 14 9 11 14
Pedestrian (V01-V09) 61 8 16 12 10 15
Occupant of Special All-Terrain Vehicle (V86) 39 11 5 5 9 9
Occupant of Heavy Transport Vehicle (V60-V69) 7 1 1 2 0 3
All Other Motor Vehicle Accidents 77 11 12 18 18 18
Other Causes of Accidental Death 1,552 275 275 310 324 368
Falls (W00-W19) 825 143 146 170 181 185
Accidental Poisoning (X40-X49) 268 42 44 58 57 67
Accidental Threats to Breathing (excl. drowning) (W75-W84) 118 18 29 24 20 27
Exposure to Smoke, Fire, and Flames ( X00-X09) 56 22 10 5 9 10
Accidental Drowning and Submersion (W65-W74, V90, V92) 55 13 11 8 13 10
Exposure to Excessive Natural Cold (X31) 42 6 9 8 5 14
Accidental Discharge of Firearms (W32-W34) 15 2 1 2 5 5
Air Transport Accidents (V95.0-V95.3, V95.8-V95.9, & V96-V97) 12 2 1 5 1 3
Contact with Agricultural Machinery (W30) 11 3 2 1 3 2
All Other Causes of Accidents 150 24 22 29 30 45
Table 46, below, displays the breakdown of accidental deaths, which were the third leading cause of deaths among South Dakotans. In 2016, 503 or 6.4 percent of deaths were due to accidents.
The highest type of motor vehicle death in 2016 was car occupant with 48 deaths. The highest death in the other causes of accidental death in 2016 was falls with 185 deaths.
Table 46
South Dakota Resident Leading Causes of Death Due to Accidents, 2012-2016
Table 47, on the next page, lists South Dakota resident leading causes of death for the last five years. Heart disease and cancer were the leading causes of death in 2016 and for each of the five prior years. Accidents took the third place leading cause of death followed by Alzheimer’s disease and chronic lower respiratory disease round out the top 5 causes in 2016.
ecord
In 2016, causes six through ten were cerebrovascular disease, diabetes mellitus, influenza and pneumonia, suicide, and chronic liver disease and cirrhosis.

56
Cause of Death Total 2012 2013 2014 2015 2016
Rank Deaths % Rank Deaths % Rank Deaths % Rank Deaths % Rank Deaths % Rank Deaths %
South Dakota (All Deaths) 37,424 100 7,283 100 7,079 100 7,500 100 7,724 100 7,838 100
Heart Disease (I00-I09, I11, I13, I20-I51)
1 8,408 22.5 1 1,652 22.7 1 1,617 22.8 1 1,695 22.6 1 1,712 22.1 1 1,732 22.1
Malignant Neoplasms (Cancer)
(C00-C97) 2 8,199 21.9 2 1,623 22.3 2 1,574 22.2 2 1,679 22.4 2 1,632 21.1 2 1,691 21.6
Accidents (V01-X59, Y85-Y86) 3 2,272 6.1 5 417 5.7 3 424 6.0 3 461 6.1 4 467 6.0 3 503 6.4
Chronic Lower Respiratory Diseases (J40-J47)
4 2,259 6.0 3 479 6.6 6 413 5.8 4 440 5.9 3 500 6.5 5 427 5.4
Alzheimer’s Disease (G30) 5 2,185 5.8 4 462 6.3 4 420 5.9 6 433 5.8 5 421 5.5 4 449 5.7
Cerebrovascular Diseases (I60-I69)
6 2,064 5.5 6 410 5.6 5 414 5.8 5 439 5.9 6 381 4.9 6 420 5.4
Diabetes Mellitus (E10-E14) 7 1,216 3.2 7 219 3.0 7 239 3.4 7 223 3.0 7 282 3.7 7 253 3.2
Influenza and Pneumonia (J09-J18)
8 962 2.6 8 188 2.6 8 186 2.6 8 180 2.4 8 213 2.8 8 195 2.5
Intentional Self-Harm (Suicide) (*U03, X60-X84, Y87.0)
9 757 2.0 9 135 1.9 9 147 2.1 9 141 1.9 9 173 2.2 9 161 2.1
Chronic Liver Disease and Cirrhosis (K70 & K73-K74)
10 657 1.8 10 113 1.6 10 121 1.7 10 128 1.7 10 137 1.8 10 158 2.0
All Other Causes - 8,445 22.6 - 1,585 21.8 - 1,524 21.5 - 1,681 22.4 - 1,806 23.4 - 1,849 23.6
Table 47 South Dakota Resident Leading Causes of Death, 2012-2016
Note: Letter/number combinations following cause of death are ICD-10 codes. Due to rounding disease-specific percentages may not sum to 100. The asterisks (*) preceding the cause-of-death codes indicate that they are not part of the International Classification of Diseases, Tenth Revision. Source: South Dakota Department of Health, Office of Health Statistics

Note: Letter / number combinations following cause of death are ICD-10 codes. Due to rounding, disease-specific percentages may not sum to 100. * This cause was not one of the 10 leading causes of death for this race group. The asterisks (*) preceding the cause-of-death codes indicate that they are not part of the International Classification of Diseases, Tenth Revision. Source: South Dakota Department of Health, Office of Health Statistics
57
All Races White American Indian
Cause of Death
Rank Deaths % Crude Rate
Age-Adjusted
Rate Rank Deaths % Crude Rate
Age-Adjusted
Rate Rank Deaths % Crude Rate
Age-Adjusted
Rate
South Dakota (All Deaths) 7,838 100 905.7 718.6 7,041 100 955.3 676.8 656 100 844.2 1,361.3
Heart Disease (I00-I09, I11, I13, I20-I51)
1 1,732 22.1 200.1 153.7 1 1,616 23.0 219.2 150.4 2 91 13.9 117.1 210.6
Malignant Neoplasms (Cancer) (C00-C97)
2 1,691 21.6 195.4 156.6 2 1,584 22.5 214.9 155.6 3 86 13.1 110.7 184.5
Accidents (V01-X59, Y85-Y86) 3 503 6.4 58.1 53.1 6 388 5.5 52.6 44.3 1 98 14.9 126.1 146.0
Alzheimer’s Disease (G30) 4 449 5.7 51.9 37.1 3 439 6.2 59.6 37.7 * - - - -
Chronic Lower Respiratory Diseases (J40-J47)
5 427 5.4 49.3 38.5 5 400 5.7 54.3 37.9 8 21 3.2 27.0 59.1
Cerebrovascular Diseases (I60-I69) 6 420 5.4 48.5 35.8 4 403 5.7 54.7 35.8 * - - - -
Diabetes Mellitus (E10-E14) 7 253 3.2 29.2 23.6 7 196 2.8 26.6 19.2 5 51 7.8 65.6 120.8
Influenza and Pneumonia (J09-J18) 8 195 2.5 22.5 16.7 8 169 2.4 22.9 14.7 7 23 3.5 29.6 63.5
Intentional Self-Harm (Suicide) (*U03, X60-X84, Y87.0)
9 161 2.1 18.6 19.9 10 115 1.6 15.6 16.0 6 34 5.2 43.8 45.8
Chronic Liver Disease and Cirrhosis (K70 & K73-K74)
10 158 2.0 18.3 16.4 * - - - - 4 58 8.8 74.6 107.6
Unspecified Dementia (F03) * - - - - 9 116 1.6 15.7 9.5 * - - - -
Assault (homicide) (X85-Y09, Y87.1) * - - - - * - - - - T9 18 2.7 23.2 22.6
Nephritis, nephrotic syndrome, and nephrosis (N00-N07, N17-N19, N25-N27)
* - - - - * - - - - T9 18 2.7 23.2 42.5
All Other Causes - 1,849 23.6 213.6 - - 1,615 22.9 219.1 - - 158 24.1 203.3 -
Table 48 South Dakota Resident Leading Causes of Death by Race, 2016

58
causes of death for South Dakota’s men, but not for women. Likewise, unspecified dementia was among the 10 leading causes of death for women, but not for men. Men were also more likely to die in accidents than women, while women were more likely to die from Alzheimer’s disease than men.
Race
Table 48, on the previous page, presents South Dakota resident leading causes of death by race as well as crude death rates and age-adjusted death rates. In 2016, patterns for the 10 leading causes of death varied by race. Seven of the 10 leading causes were the same for whites and American Indians, but they differed by rank. For example, accidents were the sixth leading cause of death at 5.5 percent for the white population, but was the first leading cause of death for the American Indian population at 14.9 percent.
Heart disease deaths ranked second place for American Indians in 2016 while cancer ranked third. Alzheimer’s disease, cerebrovascular disease, and unspecified dementia were in the 10 leading causes of death for the white population, but not the American Indian population. Among the 10 leading causes of death for the American Indian population, but not for the white population, were chronic liver disease and cirrhosis, assault (homicide), and nephritis, nephrotic syndrome, and nephrosis.
Gender
Table 49, on the following page, presents South Dakota resident leading causes of death by gender as well as crude death rates and age-adjusted death rates. In 2016, patterns for the 10 leading causes of death in South Dakota also varied by gender. Nine of the 10 leading causes were the same for South Dakota’s men and women, but they differed in rank. Intentional self-harm (suicide) was among the 10 leading ******

Table 49 South Dakota Resident Leading Causes of Death by Gender, 2016
Total Male Female
Cause of Death
Rank Deaths % Crude Rate
Age-Adjusted
Rate Rank Deaths % Crude Rate
Age-Adjusted
Rate Rank Deaths % Crude Rate
Age-Adjusted
Rate
South Dakota (All Deaths) 7,838 100 905.7 718.6 4,049 100 928.1 862.3 3,789 100 882.8 594.1
Heart Disease (I00-I09, I11, I13, I20-I51)
1 1,732 22.1 200.1 153.7 1 943 23.3 216.1 198.7 1 789 20.8 183.8 114.8
Malignant Neoplasms (Cancer) (C00-C97)
2 1,691 21.6 195.4 156.6 2 934 23.1 214.1 193.3 2 757 20.0 176.4 129.5
Accidents (V01-X59, Y85-Y86) 3 503 6.4 58.1 53.1 3 313 7.7 71.7 70.8 5 190 5.0 44.3 35.4
Alzheimer’s Disease (G30) 4 449 5.7 51.9 37.1 7 134 3.3 30.7 30.0 3 315 8.3 73.4 41.4
Chronic Lower Respiratory Diseases (J40-J47) 5 427 5.4 49.3 38.5 4 243 6.0 55.7 50.6 6 184 4.9 42.9 30.3
Cerebrovascular Diseases (I60-I69) 6 420 5.4 48.5 35.8 5 155 3.8 35.5 31.9 4 265 7.0 61.7 38.0
Diabetes Mellitus (E10-E14) 7 253 3.2 29.2 23.6 6 137 3.4 31.4 29.3 7 116 3.1 27.0 19.1
Influenza and Pneumonia (J09-J18) 8 195 2.5 22.5 16.7 10 87 2.1 19.9 18.5 8 108 2.9 25.2 14.9
Intentional Self-Harm (Suicide) (*U03, X60-X84, Y87.0)
9 161 2.1 18.6 19.9 8 125 3.1 28.7 30.4 * - - - -
Chronic Liver Disease and Cirrhosis (K70 & K73-K74)
10 158 2.0 18.3 16.4 9 90 2.2 20.6 18.7 10 68 1.8 15.8 13.9
Unspecified Dementia (F03) * - - - - * - - - - 9 86 2.3 20.0 10.6
All Other Causes - 1,849 23.6 213.6 - - 888 21.9 203.5 - - 911 24.0 212.3 -
Note: Letter/number combinations following cause of death are ICD-10 codes. Due to rounding, disease-specific percentages may not sum to 100. *This cause was not one of the 10 leading causes of death for this gender. The asterisks (*) preceding the cause of death codes indicate they are not part of the International Classification of Diseases, Tenth Revision Source: South Dakota Department of Health, Office of Health Statistics
59

Table 50
South Dakota Resident Five Leading Causes of Death by Age Group, 2012-2016
Rank All Ages 1-9 10-19 20-29 30-39 40-49 50-59 60-69 70-79 80-89 90 & over
1 Heart Disease 8,408
Accidents 58
Accidents 115
Accidents 278
Accidents 226
Malignant Neoplasms
(Cancer) 244
Malignant Neoplasms
(Cancer) 999
Malignant Neoplasms (Cancer)
1,756
Malignant Neoplasms (Cancer)
2,212
Heart Disease 2,537
Heart Disease 2,327
2 Malignant Neoplasms (Cancer)
8,199
Assault (Homicide)
19
Intentional Self-harm (Suicide)
91
Intentional Self-harm (Suicide)
153
Intentional Self-Harm (Suicide)
127
Heart Disease
208
Heart Disease
658
Heart Disease 1,146
Heart Disease 1,431
Malignant Neoplasms
(Cancer) 2,155
Alzheimer’s Disease
993
3 Accidents 2,272
Malignant Neoplasms
(Cancer) 14
Malignant Neoplasms
(Cancer) 18
Assault (Homicide)
30
Chronic Liver Disease and
Cirrhosis 81
Accidents 201
Accidents 263
Chronic Lower
Respiratory Disease
330
Chronic Lower Respiratory
Disease 611
Alzheimer’s Disease
954
Malignant Neoplasms (Cancer)
715
4 Chronic Lower
Respiratory Diseases
2,259
Congenital Malformations, Deformations,
and Chromosomal
Anomalies 11
Assault (Homicide)
14
Malignant Neoplasms
(Cancer) 25
Heart Disease
69
Chronic Liver Disease and
Cirrhosis 146
Chronic Liver Disease and
Cirrhosis 193
Diabetes Mellitus
231
Cerebrovascular Disease
325
Chronic Lower Respiratory
Disease 796
Cerebrovascular Disease
655
5 Alzheimer’s Disease 2,185
Ill-Defined and Unknown Causes of Mortality
6
Heart Disease
7
Heart Disease
21
Malignant Neoplasms (Cancer)
60
Intentional Self-Harm (Suicide)
141
Intentional Self-Harm (Suicide)
131
Accidents 200
Diabetes Mellitus
265
Cerebrovascular Disease
795
Chronic Lower Respiratory
Disease 403
Source: South Dakota Department of Health, Office of Health Statistics
60
61
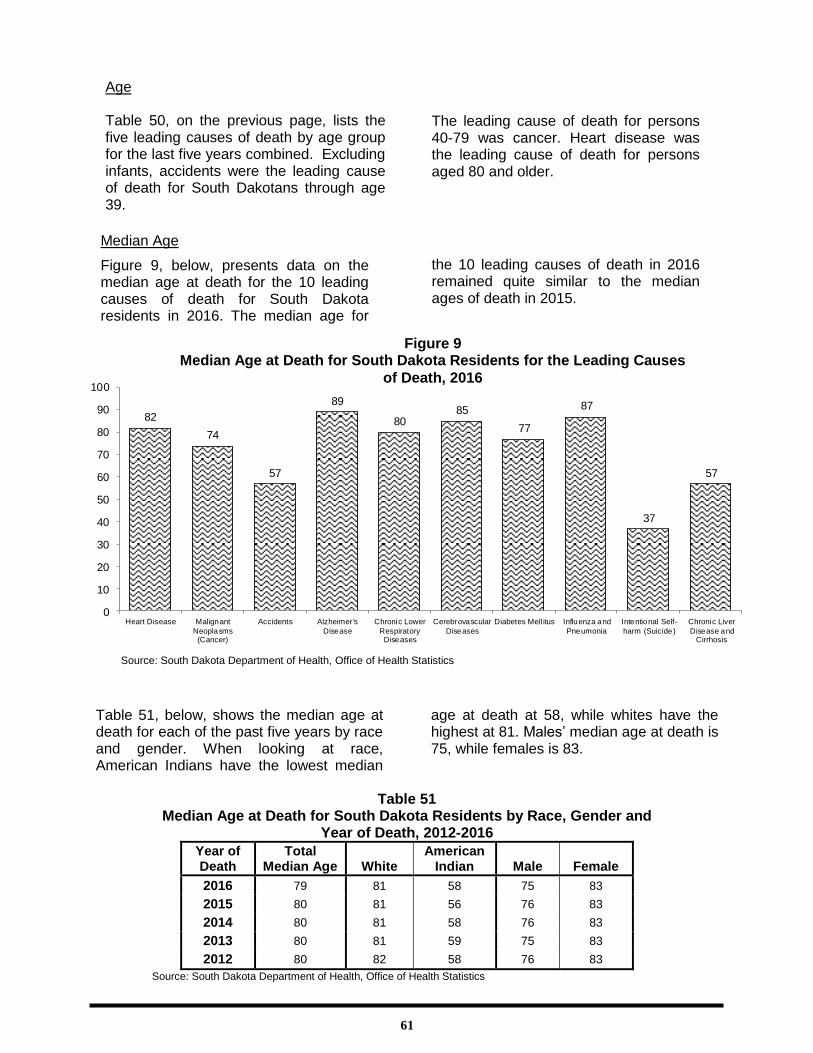
Table 51, below, shows the median age at death for each of the past five years by race and gender. When looking at race, American Indians have the lowest median
age at death at 58, while whites have the highest at 81. Males’ median age at death is 75, while females is 83.
Table 51
Median Age at Death for South Dakota Residents by Race, Gender and Year of Death, 2012-2016
Year of Death
Total Median Age
White
American Indian
Male
Female
2016 79 81 58 75 83
2015 80 81 56 76 83
2014 80 81 58 76 83
2013 80 81 59 75 83
2012 80 82 58 76 83
Source: South Dakota Department of Health, Office of Health Statistics
Median Age
Figure 9, below, presents data on the median age at death for the 10 leading causes of death for South Dakota residents in 2016. The median age for residents 111
the 10 leading causes of death in 2016 remained quite similar to the median ages of death in 2015.
Age Table 50, on the previous page, lists the five leading causes of death by age group for the last five years combined. Excluding infants, accidents were the leading cause of death for South Dakotans through age 39.
The leading cause of death for persons 40-79 was cancer. Heart disease was the leading cause of death for persons aged 80 and older.
82
74
57
89
8085
77
87
37
57
0
10
20
30
40
50
60
70
80
90
100
Heart Disease Malignant
Neoplasms(Cancer)
Accidents Alzheimer 's
Disease
Chronic Lower
RespiratoryDiseases
Cerebrovascular
Diseases
Diabetes Mell itus Influenza and
Pneumonia
Intentional Self-
harm (Suicide)
Chronic Liver
Disease andCirrhosis
Figure 9 Median Age at Death for South Dakota Residents for the Leading Causes
of Death, 2016
Source: South Dakota Department of Health, Office of Health Statistics

62
Table 52 Median Age at Death for South Dakota Residents for the Leading Causes of Death
by Race and Gender, 2016 Median Age at Death in Years
All Race Gender
Cause of Death Total Deaths
White
American Indian
Male
Female
South Dakota (All Deaths) 79 81 58 75 83
Heart Disease (I00-I09, I11, I13, I20-I51) 82 83 64 77 87
Malignant Neoplasms (Cancer) (C00-C97) 74 75 65 74 74
Accidents (V01-X59, Y85-Y86) 57 68 34 51 79
Alzheimer’s Disease (G30) 89 89 * 87 90
Chronic Lower Respiratory Diseases (J40-J47) 80 80 75 79 80
Cerebrovascular Diseases (I60-I69) 85 85 * 80 87
Diabetes Mellitus (E10-E14) 77 79 65 76 79
Influenza and Pneumonia (J09-J18) 87 87 72 82 88
Intentional Self-Harm (Suicide) (*U03, X60-X84, Y87.0) 37 44 28 38 *
Chronic Liver Disease and Cirrhosis (K70 & K73-K74) 57 * 53 57 60
Assault (homicide) (X85-Y019, Y87.1) * * 27 * *
Nephritis, Nephrotic Syndrome, and Nephrosis (N00-N07, N17-N19, N25-N27)
* * 67 * *
Unspecified Dementia (F03) * 90 * * 92
Note: Letter / number combinations following cause of death are ICD-10 codes. *This cause was not one of the 10 leading causes of death for this race or gender. The asterisks (*) preceding the cause-of-death codes indicate that they are not part of the International Classification of Diseases, Tenth Revision.
Source: South Dakota Department of Health, Office of Health Statistics
Table 52, below, shows the median age at death for South Dakota residents for the leading causes of death by race and gender. In 2016, the median age at death was 79 for all South Dakotans; for white residents the median age was 81, compared to 58 for American Indians. The overall median age at death remained the same for whites and increased for American Indians when 11
compared to their overall median age at death in 2015. The median age at death in 2016 for South Dakota resident males and females was 75 and 83, respectively. The median age at death for males decreased from 2015 to 2016 while females’ median age at death remained the same.
Years of Potential Life Lost Figure 10, on the next page, depicts the years of potential life lost (YPLL) before age 75 for each of these causes.
In 2016, accidents led in YPLL with 11,921 followed by cancer with 10,222 years of potential life lost.

63
Figure 10a, below, shows the years of potential life lost (YPLL) before age 75 for each of the causes in order from highest YPLL to lowest YPLL.
Accidents, cancer, and heart disease led in the most YPLL in South Dakota for 2016. This is the first year accidents surpassed cancer for the most YPLL.
8,092
10,222
11,921
121
1,328 1,382 1,505
678
5,555
2,916
0
2,000
4,000
6,000
8,000
10,000
12,000
Heart Disease MalignantNeoplasms(Cancer)
Accidents Alzheimer'sDisease
Chronic LowerRespiratoryDiseases
CerebrovascularDisease
DiabetesMellitus
Influenza andPneumonia
Intentional Self-Harm (Suicide)
Chronic LiverDisease and
Cirrhosis
Note: This data is not comparable to the age-adjusted data in Figure 11 on the next page. Source: South Dakota Department of Health, Office of Health Statistics
Figure 10 South Dakota Resident Years of Potential Life Lost (YPLL)
Before Age 75 for the Leading Causes of Death, 2016
11,921
10,222
8,092
5,555
2,916
1,681 1,505 1,382 1,349 1,328
0
2,000
4,000
6,000
8,000
10,000
12,000
14,000
Accidents MalignantNeoplasms
Heart Disease Intentional Self-Harm (suicide)
Chronic LiverDisease and
Cirrhosis
Assault (homicide) Diabetes Mellitus Cerebrovasculardisease
Certain conditionsoriginating in theperinatal period
Chronic LowerRespiratoryDiseases
Figure 10a South Dakota Resident Years of Potential Life Lost (YPLL)
Before Age 75 for the Leading Causes of Death (in Descending Order), 2016
Note: This data is not comparable to the age-adjusted data in Figure 11 on the next page. Source: South Dakota Department of Health, Office of Health Statistics

64
Figure 11, below, illustrates the years of potential life lost (YPLL) before age 75 per 100,000 population for the top 10 causes of death by race. When comparing YPLL by race, American Indians exceeded whites substantially in YPLL for the leading causes of death.
American Indians’ and whites’ largest YPLL was accidents with 4,750 years and 1,155 years respectively.
Whites’ second largest YPLL was cancer with 1,051 years while American Indians’ second largest YPLL was chronic liver disease and cirrhosis with 2,357 years.
Whites’ third largest YPLL was heart disease with 815 years. Suicide was the third largest YPLL for American Indians with 2,171 years, which still exceeded whites’ largest YPLL (accidents with 1,155 years).
8151,051 1,155
11 117 124 115 47
559
* 1 * *
2,1031,821
4,750
*267
399
1,110
478
2,1712,357
*
1,002
376
0
500
1,000
1,500
2,000
2,500
3,000
3,500
4,000
4,500
5,000
White
American Indian
Figure 11 Age-Adjusted Years of Potential Life Lost (YPLL) Before Age 75 for the
Leading Causes of Death by Race, 2016
Note: Years of potential life lost are age-adjusted per 100,000 population. *This cause was not one of the 10 leading causes of death for this race group. Source: South Dakota Department of Health, Office of Health Statistics
Place of Death
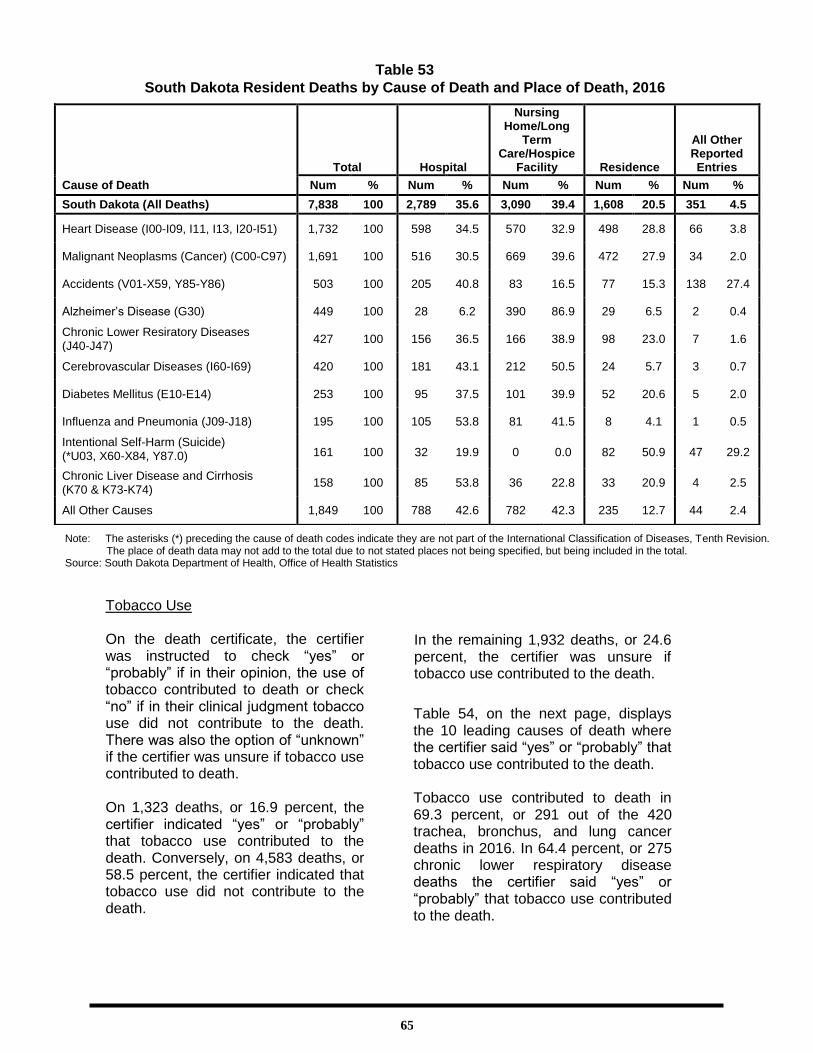
Table 53, on the next page, displays the 10 leading causes of death by place where death occurred in 2016.
Overall, nursing home, long term care, and hospice facility had the highest occurrence of deaths with 39.4 percent. Hospital followed closely with 35.6 percent.
65
Note: The asterisks (*) preceding the cause of death codes indicate they are not part of the International Classification of Diseases, Tenth Revision. The place of death data may not add to the total due to not stated places not being specified, but being included in the total. Source: South Dakota Department of Health, Office of Health Statistics
Total Hospital
Nursing Home/Long
Term Care/Hospice
Facility Residence
All Other Reported Entries
Cause of Death Num % Num % Num % Num % Num %
South Dakota (All Deaths) 7,838 100 2,789 35.6 3,090 39.4 1,608 20.5 351 4.5
Heart Disease (I00-I09, I11, I13, I20-I51) 1,732 100 598 34.5 570 32.9 498 28.8 66 3.8
Malignant Neoplasms (Cancer) (C00-C97) 1,691 100 516 30.5 669 39.6 472 27.9 34 2.0
Accidents (V01-X59, Y85-Y86) 503 100 205 40.8 83 16.5 77 15.3 138 27.4
Alzheimer’s Disease (G30) 449 100 28 6.2 390 86.9 29 6.5 2 0.4
Chronic Lower Resiratory Diseases (J40-J47)
427 100 156 36.5 166 38.9 98 23.0 7 1.6
Cerebrovascular Diseases (I60-I69) 420 100 181 43.1 212 50.5 24 5.7 3 0.7
Diabetes Mellitus (E10-E14) 253 100 95 37.5 101 39.9 52 20.6 5 2.0
Influenza and Pneumonia (J09-J18) 195 100 105 53.8 81 41.5 8 4.1 1 0.5
Intentional Self-Harm (Suicide) (*U03, X60-X84, Y87.0)
161 100 32 19.9 0 0.0 82 50.9 47 29.2
Chronic Liver Disease and Cirrhosis (K70 & K73-K74)
158 100 85 53.8 36 22.8 33 20.9 4 2.5
All Other Causes 1,849 100 788 42.6 782 42.3 235 12.7 44 2.4
Table 53
South Dakota Resident Deaths by Cause of Death and Place of Death, 2016
Tobacco Use On the death certificate, the certifier was instructed to check “yes” or “probably” if in their opinion, the use of tobacco contributed to death or check “no” if in their clinical judgment tobacco use did not contribute to the death. There was also the option of “unknown” if the certifier was unsure if tobacco use contributed to death. On 1,323 deaths, or 16.9 percent, the certifier indicated “yes” or “probably” that tobacco use contributed to the death. Conversely, on 4,583 deaths, or 58.5 percent, the certifier indicated that tobacco use did not contribute to the death.
In the remaining 1,932 deaths, or 24.6 percent, the certifier was unsure if tobacco use contributed to the death.
Table 54, on the next page, displays the 10 leading causes of death where the certifier said “yes” or “probably” that tobacco use contributed to the death. Tobacco use contributed to death in 69.3 percent, or 291 out of the 420 trachea, bronchus, and lung cancer deaths in 2016. In 64.4 percent, or 275 chronic lower respiratory disease deaths the certifier said “yes” or “probably” that tobacco use contributed to the death.

66
Table 54 South Dakota Resident Leading Causes of Death as They Relate to Tobacco Use, 2016
(Did Tobacco Use Contribute to Death)
Cause of Death
Yes/Probably Total Deaths
Number Percent Number Percent
Total 1,323 16.9 7,838 100
Malignant neoplasms (C00-C97) 438 25.9 1,691 100
Malignant neoplasm of trachea, bronchus, and lung (C33-C34) 291 69.3 420 100
Malignant neoplasm, without specification of site (C80) 15 20.8 72 100
Malignant neoplasm of pancreas (C25) 15 11.7 128 100
Malignant neoplasm of bladder (C67) 15 31.9 47 100
Malignant neoplasm of esophagus (C15) 11 30.6 36 100
Malignant neoplasm of lip, oral cavity, and pharynx (C00-C14) 10 40.0 25 100
Malignant neoplasms of colon, rectum, and anus (C18-C21) 9 5.5 163 100 Chronic lower respiratory diseases (J40-J47) 275 64.4 427 100
Chronic obstructive pulmonary disease, unspecified (J44.9) 186 66.0 282 100
Chronic obstructive pulmonary disease with acute lower respiratory infection (J44.0)
43 61.4 70 100
Emphysema (J43) 17 65.4 26 100 Heart disease (I00-I09, I11, I13, I20-I51) 269 15.5 1,732 100
Acute myocardial infarction (I21-I22) 111 18.6 596 100
Atherosclerotic heart disease (I25.1) 67 17.2 389 100
Ischemic cardiomyopathy (I25.5) 13 11.1 42 100 Cerebrovascular diseases (I60-I69) 50 11.7 420 100
Diabetes mellitus (E10-E14) 43 12.0 253 100
Chronic liver disease and cirrhosis (K70 & K73-K74) 21 13.3 158 100
Alcoholic liver disease (K70) 17 15.0 113 100 Accidents (V01-X59, Y85-Y86) 20 4.0 503 100
Influenza and pneumonia (J09-J18) 16 8.3 195 100
Pneumonia (J12-J18) 14 7.5 186 100 Essential (primary) hypertension & hypertensive renal disease (I10 & I12)
12 13.0 92 100
Nephritis, nephrotic syndrome, and nephrosis (N00-N07, N17-N19, N25-N27)
11 12.0 92 100
Source: South Dakota Department of Health, Office of Health Statistics
Drug-Induced Deaths Figures 12-17 And Tables 55-60 on the following pages break down the drug-induced deaths for South Dakota residents for the past 13 years by the manner of death, year of death, and type of drug. As shown in Figure 12 , there were 67 drug overdose deaths in 2016, up slightly from 66 drug overdose deaths in 2015. Table 54, below that, shows that of the 67 drug
overdose deaths in 2016, 52 deaths were unintentional, 12 deaths were suicides, one death was homicide, and two deaths were undetermined intent. The definition of drug overdose induced deaths is located in the back of this report (page 232) within the Technical Notes section.

67
Table 55 South Dakota Resident Deaths Due to Drug Overdose by Manner of Death and Year of
Death for All Drugs, 2004-2016
2004 2005 2006 2007 2008 2009 2010 2011 2012 2013 2014 2015 2016
Total 43 39 36 30 52 47 46 56 42 54 64 66 67
Unintentional 26 18 21 15 30 26 19 41 24 34 46 44 52
Suicide 12 14 12 8 13 12 16 11 11 15 12 19 12
Homicide 0 0 0 0 0 1 0 0 0 1 0 0 1
Undetermined Intent 5 7 3 7 9 8 11 4 7 4 6 3 2
Source: South Dakota Department of Health, Office of Health Statistics
Table 56 South Dakota Resident Deaths Due to Drug Overdose by Manner of Death and Year of
Death for All Opioid Poisoning, 2004-2016
2004 2005 2006 2007 2008 2009 2010 2011 2012 2013 2014 2015 2016
Total 17 21 20 18 28 33 31 31 21 32 32 24 38
Unintentional 12 10 15 9 18 22 15 26 15 21 27 19 31
Suicide 3 6 3 3 4 6 8 3 2 9 2 4 6
Homicide 0 0 0 0 0 1 0 0 0 0 0 0 0
Undetermined Intent 2 5 2 6 6 4 8 2 4 2 3 1 1
Source: South Dakota Department of Health, Office of Health Statistics
4339
3630
5247 46
56
42
54
64 66 67
0
10
20
30
40
50
60
70
80
2004 2005 2006 2007 2008 2009 2010 2011 2012 2013 2014 2015 2016
Figure 12South Dakota Resident Deaths Due to Drug Overdoses, 2004-2016
Source: South Dakota Department of Health, Office of Health Statistics
17
21 2018
28
3331 31
21
32 32
24
38
0
5
10
15
20
25
30
35
40
2004 2005 2006 2007 2008 2009 2010 2011 2012 2013 2014 2015 2016
Figure 13South Dakota Resident Deaths Due to All Opioid Poisoning,
2004-2016
Source: South Dakota Department of Health, Office of Health Statistics

68
0 0 0 0
1
0 0 0
1
0
2
3
7
0
2
4
6
8
2004 2005 2006 2007 2008 2009 2010 2011 2012 2013 2014 2015 2016
Figure 15South Dakota Resident Deaths Due to Illicit Opioid Poisoning,
2004-2016
Table 57 South Dakota Resident Deaths Due to Drug Overdose by Manner of Death and Year of
Death for Prescription Opioid Poisoning, 2004-2016
2004 2005 2006 2007 2008 2009 2010 2011 2012 2013 2014 2015 2016
Total 17 21 20 18 28 33 31 31 20 32 31 21 31
Unintentional 12 10 15 9 18 22 15 26 14 21 26 16 24
Suicide 3 6 3 3 4 6 8 3 2 9 2 4 6
Homicide 0 0 0 0 0 1 0 0 0 0 0 0 0
Undetermined Intent 2 5 2 6 6 4 8 2 4 2 3 1 1
Source: South Dakota Department of Health, Office of Health Statistics
Table 58 South Dakota Resident Deaths Due to Drug Overdose by Manner of Death and Year of
Death for Illicit Opioid Poisoning, 2004-2016
2004 2005 2006 2007 2008 2009 2010 2011 2012 2013 2014 2015 2016
Total 0 0 0 0 1 0 0 0 1 0 2 3 7
Unintentional 0 0 0 0 1 0 0 0 1 0 2 3 7
Suicide 0 0 0 0 0 0 0 0 0 0 0 0 0
Homicide 0 0 0 0 0 0 0 0 0 0 0 0 0
Undetermined Intent 0 0 0 0 0 0 0 0 0 0 0 0 0
Source: South Dakota Department of Health, Office of Health Statistics
17
21 2018
28
3331 31
20
32 31
21
31
0
5
10
15
20
25
30
35
2004 2005 2006 2007 2008 2009 2010 2011 2012 2013 2014 2015 2016
Figure 14South Dakota Resident Deaths Due to Prescription Opioid
Poisoning, 2004-2016
Source: South Dakota Department of Health, Office of Health Statistics
Source: South Dakota Department of Health, Office of Health Statistics

69
Table 59 South Dakota Resident Deaths Due to Drug Overdose by Manner of Death and Year of
Death for All Pharmaceutical Drug Poisoning, 2004-2016
2004 2005 2006 2007 2008 2009 2010 2011 2012 2013 2014 2015 2016
Total 33 28 27 24 35 41 40 47 33 38 48 39 43
Unintentional 18 11 16 10 19 22 16 34 18 24 33 24 31
Suicide 10 11 9 7 8 11 14 10 10 12 9 12 10
Homicide 0 0 0 0 0 1 0 0 0 0 0 0 1
Undetermined Intent 5 6 2 7 8 7 10 3 5 2 6 3 1
Source: South Dakota Department of Health, Office of Health Statistics
Table 60 South Dakota Resident Deaths Due to Drug Overdose by Manner of Death and Year of
Death for Illicit Drug Poisoning, 2004-2016
2004 2005 2006 2007 2008 2009 2010 2011 2012 2013 2014 2015 2016
Total 2 5 1 5 4 1 2 8 4 8 15 16 23
Unintentional 2 4 0 5 3 1 2 7 3 6 14 16 23
Suicide 0 0 1 0 0 0 0 1 1 1 1 0 0
Homicide 0 0 0 0 0 0 0 0 0 1 0 0 0
Undetermined Intent 0 1 0 0 1 0 0 0 0 0 0 0 0
Source: South Dakota Department of Health, Office of Health Statistics
3328 27
24
35
41 40
47
3338
48
3943
0
10
20
30
40
50
60
2004 2005 2006 2007 2008 2009 2010 2011 2012 2013 2014 2015 2016
Figure 16South Dakota Resident Deaths Due to All Pharmaceutical Drug
Poisoning, 2004-2016
Source: South Dakota Department of Health, Office of Health Statistics
2
5
1
54
12
8
4
8
1516
23
0
5
10
15
20
25
2004 2005 2006 2007 2008 2009 2010 2011 2012 2013 2014 2015 2016
Figure 17South Dakota Resident Deaths Due to Illicit Drug Poisoning,
2004-2016

70
Alcohol-Induced Deaths Figure 18, below, shows the alcohol-induced deaths for South Dakota residents for the past nine years. The definition of
alcohol-induced deaths is located in the back of this report (page 231) within the Technical Notes section.
Farm Accident Deaths
Figure 19, below, shows the number of South Dakota resident deaths due to farm accidents for the past 11 years. The
definition of farm accident deaths is located in the back of this report (page 231) within the Technical Notes section.
Maternal Mortality Table 61, on the following page, shows maternal mortality deaths for the past 12 years. The definition of maternal mortality is
located in the back of this report (page 231) within the Technical Notes section.
16
13
20
1618
1513
1416
15
22
0
5
10
15
20
25
2006 2007 2008 2009 2010 2011 2012 2013 2014 2015 2016
Figure 19South Dakota Resident Deaths Due to Farm Accidents, 2006-2016
Source: South Dakota Department of Health, Office of Health Statistics
10085 86
115
137120
142 149159
0
25
50
75
100
125
150
175
2008 2009 2010 2011 2012 2013 2014 2015 2016
Figure 18South Dakota Resident Alcohol-Induced Deaths,
2008-2016
Source: South Dakota Department of Health, Office of Health Statistics

71
Firearm Deaths Table 62, below, shows firearm deaths for South Dakota residents for the past nine years. The definition of firearm deaths is
located in the back of this report (page 231) within the Technical Notes section.
Method of Disposition
Year # of Deaths
2016 1
2015 2
2014 1
2013 3
2012 2
2011 3
2010 1
2009 1
2008 0
2007 3
2006 1
2005 1
Year
Total
Firearm Deaths
Manner of Death
Accident Suicide Homicide
2016 107 5 84 18
2015 95 5 73 16
2014 90 2 76 12
2013 79 1 71 7
2012 84 2 76 6
2011 71 1 60 10
2010 75 3 65 5
2009 75 4 61 10
2008 83 4 68 10
Source: South Dakota Department of Health, Office of Health Statistics
Table 63, on the next page, displays the different methods of disposition for the last 11 years. The top disposition in 2016 was burial with 4,145 deaths. The second highest me
method of disposition in 2016 was cremation with 3,190 deaths. Since 2006, cremation has increased from 20.5 percent of all dispositions to 40.7 percent in 2016.
Table 62
South Dakota Resident Deaths Due to Firearms, 2008-2016
Table 61
South Dakota Resident Maternal Deaths by Year of Death, 2005-2016
Source: South Dakota Department of Health, Office of Health Statistics

72
Table 64a
South Dakota Resident Deaths for 15 Leading Causes and Selected Components, 2007-2016
Leading Causes and Selected Components Tables 64a-64c, on pages 72 through 75, display South Dakota resident deaths, the crude death rate, and the age-adjusted death rate for 15 leading causes and selected components from 2007 to 2016.
The crude and age-adjusted rates for all causes in 2016 were 905.7 and 718.6 respectively, which are up from the crude and age-adjusted rates in 2015 of 899.7 and 714.9, respectively.
Cause of Death
Number of Deaths
2007 2008 2009 2010 2011 2012 2013 2014 2015 2016
All Causes 6,800 7,056 6,913 7,087 7,271 7,283 7,079 7,500 7,724 7,838
Heart Disease 1,623 1,677 1,778 1,611 1,615 1,652 1,617 1,695 1,712 1,732
Malignant Neoplasms (Cancer) 1,606 1,561 1,506 1,651 1,656 1,623 1,574 1,679 1,632 1,691
Trachea, Bronchus, and Lung 425 445 387 434 457 434 416 439 424 420
Colon, Rectum, and Anus 165 152 157 168 137 166 169 186 168 163
Pancreas 93 87 110 98 95 105 109 118 109 128
Female Breast 113 118 95 103 122 107 108 100 104 109
Prostate 94 78 84 96 88 75 76 75 90 107
Leukemia 76 60 57 82 77 68 89 90 66 61
Accidents 357 372 348 391 407 417 424 461 467 503
Motor Vehicle Accidents 145 125 133 141 99 142 149 151 143 135
Type of Disposition
Year Total
Deaths
Burial Cremation Removal from
State Donation Entombment
Count Percent Count Percent Count Percent Count Percent Count Percent
2016 7,838 4,145 52.9 3,190 40.7 447 5.7 38 0.5 17 0.2
2015 7,724 4,335 56.1 2,939 38.1 413 5.3 23 0.3 14 0.2
2014 7,500 4,302 57.4 2,738 36.5 398 5.3 40 0.5 15 0.2
2013 7,079 4,146 58.6 2,468 34.9 417 5.9 32 0.5 15 0.2
2012 7,283 4,465 61.3 2,345 32.2 428 5.9 33 0.5 10 0.1
2011 7,271 4,539 62.4 2,211 30.4 472 6.5 33 0.5 10 0.1
2010 7,087 4,548 64.2 2,044 28.8 433 6.1 47 0.7 10 0.1
2009 6,913 4,545 65.7 1,855 26.8 464 6.7 34 0.5 8 0.1
2008 7,056 4,857 68.8 1,662 23.6 485 6.9 35 0.5 9 0.1
2007 6,800 4,775 70.2 1,474 21.7 481 7.1 46 0.7 18 0.3
2006 7,038 5,127 72.8 1,440 20.5 431 6.1 30 0.4 6 0.1
Table 63
South Dakota Resident Deaths by Disposition, 2006-2016
Note: Failure of deaths to add to total is due to the disposition not stated. Source: South Dakota Department of Health, Office of Health Statistics

73
Cause of Death
Number of Deaths
2007 2008 2009 2010 2011 2012 2013 2014 2015 2016
Alzheimer’s Disease 345 401 402 401 423 462 420 433 421 449
Chronic Lower Respiratory Diseases
458 486 440 451 485 479 413 440 500 427
Cerebrovascular Diseases 408 391 417 411 442 410 414 439 381 420
Diabetes Mellitus 246 216 200 241 267 219 239 223 282 253
Influenza and Pneumonia 189 186 135 166 178 188 186 180 213 195
Intentional Self-Harm (Suicide) 101 123 128 139 125 135 147 141 173 161
Chronic Liver Disease and Cirrhosis
94 100 79 83 98 113 121 128 137 158
Unspecified Dementia 70 80 90 91 117 111 99 120 126 121
Essential (Primary) Hypertension and Hypertensive Renal Disease
70 65 52 93 94 78 72 95 103 92
Nephritis, Nephrotic Syndrome, and Nephrosis
74 90 99 72 49 57 62 72 79 92
Parkinson’s Disease 62 69 65 85 73 53 78 63 80 86
Septicemia 64 54 63 66 69 64 74 81 119 81
Cause of Death
Crude Death Rates
2007 2008 2009 2010 2011 2012 2013 2014 2015 2016
All Causes 853.2 877.0 851.0 870.4 882.3 873.9 837.9 879.1 899.7 905.7
Heart Disease 203.6 208.4 218.9 197.9 196.0 198.2 191.4 198.7 199.4 200.1
Malignant Neoplasms (Cancer) 201.5 194.0 185.4 202.8 201.0 194.8 186.3 196.8 190.1 195.4
Trachea, Bronchus, and Lung 53.3 55.3 47.6 53.3 55.5 52.1 49.2 51.5 49.4 48.5
Colon, Rectum, and Anus 20.7 18.9 19.3 20.6 16.6 19.9 20.0 21.8 19.6 18.8
Pancreas 11.7 10.8 13.5 12.0 11.5 12.6 12.9 13.8 12.7 14.8
Female Breast 28.3 29.3 23.4 25.3 29.7 25.8 25.7 23.6 24.4 25.4
Prostate 23.7 19.4 20.7 23.6 21.3 17.9 17.9 17.5 20.8 24.5
Leukemia 9.5 7.5 7.0 10.1 9.3 8.2 10.5 10.5 7.7 7.0
Accidents 44.8 46.2 42.8 48.0 49.4 50.0 50.2 54.0 54.4 58.1
Motor Vehicle Accidents 18.2 15.5 16.4 17.3 12.0 17.0 17.6 17.7 16.7 15.6
Source: South Dakota Department of Health, Office of Health Statistics
Table 64b South Dakota Resident Crude Death Rates for 15 Leading Causes and Selected Components,
2007-2016
Table 64a (continued) South Dakota Resident Deaths for 15 Leading Causes and Selected Components, 2007-2016

74
Alzheimer’s Disease 43.3 49.8 49.5 49.3 51.3 55.4 49.7 50.8 49.0 51.9
Chronic Lower Respiratory Diseases
57.5 60.4 54.2 55.4 58.9 57.5 48.9 51.6 58.2 49.3
Cerebrovascular Diseases 51.2 48.6 51.3 50.5 53.6 49.2 49.0 51.5 44.4 48.5
Diabetes Mellitus 30.9 26.8 24.6 29.6 32.4 26.3 28.3 26.1 32.8 29.2
Influenza and Pneumonia 23.7 23.1 16.6 20.4 21.6 22.6 22.0 21.1 24.8 22.5
Intentional Self-Harm (Suicide) 12.7 15.3 15.8 17.1 15.2 16.2 17.4 16.5 20.2 18.6
Chronic Liver Disease and Cirrhosis
11.8 12.4 9.7 10.2 11.9 13.6 14.3 15.0 16.0 18.3
Unspecified Dementia 8.8 9.9 11.1 11.2 14.2 13.3 11.7 14.1 14.7 14.0
Essential (Primary) Hypertension and Hypertensive Renal Disease
8.8 8.1 6.4 11.4 11.4 9.4 8.5 11.1 12.0 10.6
Nephritis, Nephrotic Syndrome, and Nephrosis
9.3 11.2 12.2 8.8 5.9 6.8 7.3 8.4 9.2 10.6
Parkinson’s Disease 7.8 8.6 8.0 10.4 8.9 6.4 9.2 7.4 9.3 9.9
Septicemia 8.0 6.7 7.8 8.1 8.4 7.7 8.8 9.5 13.9 9.4
Cause of Death
Crude Death Rates
2007 2008 2009 2010 2011 2012 2013 2014 2015 2016
Cause of Death
Age-Adjusted Death Rates
2007 2008 2009 2010 2011 2012 2013 2014 2015 2016
All Causes 695.1 712.1 688.6 713.4 716.1 706.8 677.4 709.9 714.9 718.6
Heart Disease 159.5 162.2 168.3 154.9 153.0 153.8 148.8 153.6 151.0 153.7
Malignant Neoplasms (Cancer) 170.9 164.8 156.5 170.6 168.6 162.2 154.3 161.4 153.3 156.6
Trachea, Bronchus, and Lung 46.3 47.3 40.7 45.4 47.2 43.5 41.0 41.8 39.7 38.2
Colon, Rectum, and Anus 17.2 15.9 15.8 17.0 13.9 16.4 16.7 17.6 15.7 15.2
Pancreas 9.8 8.9 11.3 10.2 9.5 10.6 10.7 11.1 10.3 11.6
Female Breast 20.9 23.3 17.6 19.7 23.7 19.5 19.3 17.9 18.7 19.3
Prostate 23.7 19.2 20.3 23.7 20.9 17.7 17.0 16.7 19.6 23.1
Leukemia 8.1 6.1 6.0 8.6 7.8 7.3 9.0 8.8 6.2 5.6
Accidents 40.9 41.8 40.0 44.3 44.8 46.6 46.4 49.2 49.3 53.1
Motor Vehicle Accidents 17.9 15.1 16.6 17.0 11.8 17.1 17.4 17.5 16.3 15.8
Table 64c South Dakota Resident Age-Adjusted Death Rates for 15 Leading Causes and Selected
Components, 2007-2016
Note: The crude death rate is calculated using yearly U.S. Census Bureau population estimates for that year. Source: South Dakota Department of Health, Office of Health Statistics
Table 64b (continued) South Dakota Resident Crude Death Rates for 15 Leading Causes and Selected
Components, 2007-2016

75
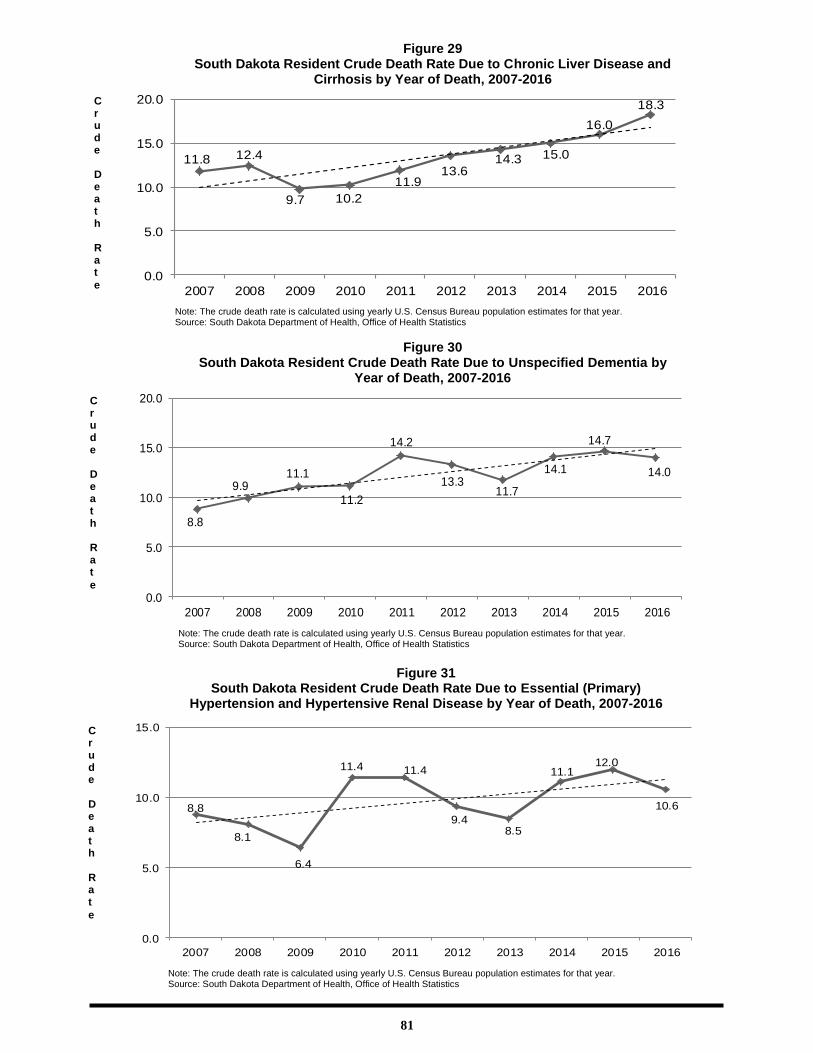
The following figures on the next several pages display 10 year trends for crude
death rates for the 15 leading causes of death in 2016.
Cause of Death
Age-Adjusted Death Rates
2007 2008 2009 2010 2011 2012 2013 2014 2015 2016
Alzheimer’s Disease 30.7 35.9 35.2 36.2 36.6 39.6 35.1 36.1 34.8 37.1
Chronic Lower Respiratory Diseases
47.1 49.0 43.9 46.0 47.4 45.4 39.1 40.7 45.1 38.5
Cerebrovascular Diseases 38.9 37.6 38.8 39.2 42.0 37.6 37.5 38.8 33.0 35.8
Diabetes Mellitus 25.5 21.8 20.4 24.6 26.8 21.6 22.9 21.2 26.3 23.6
Influenza and Pneumonia 18.1 17.3 12.6 15.5 16.3 16.9 16.4 16.1 18.3 16.7
Intentional Self-Harm (Suicide) 12.3 15.4 16.0 17.3 15.3 16.1 18.0 17.1 20.4 19.9
Chronic Liver Disease and Cirrhosis
11.2 11.6 8.7 9.7 11.1 13.3 13.3 16.0 15.9 16.4
Unspecified Dementia 6.2 6.9 7.9 8.3 10.2 9.4 8.4 10.1 10.5 9.6
Essential (Primary) Hypertension and Hypertensive Renal Disease
6.6 6.2 4.8 8.8 8.5 6.8 6.3 8.1 8.7 7.9
Nephritis, Nephrotic Syndrome, and Nephrosis
7.2 8.9 9.4 7.1 4.5 5.5 5.7 6.5 7.4 7.8
Parkinson’s Disease 6.1 6.7 6.2 8.2 7.0 5.1 7.3 6.3 7.2 7.6
Septicemia 6.5 5.5 6.4 6.7 7.0 6.2 7.2 8.1 11.0 7.5
Table 64c (continued) South Dakota Resident Age-Adjusted Death Rates for 15 Leading Causes and Selected
Components, 2007-2016
Note: The age-adjusted death rate is calculated using yearly U.S. Census Bureau population estimates for that year. Source: South Dakota Department of Health, Office of Health Statistics
203.6 208.4218.9
197.9 196.0 198.2191.4 198.7 199.4 200.1
0.0
50.0
100.0
150.0
200.0
250.0
300.0
2007 2008 2009 2010 2011 2012 2013 2014 2015 2016
Note: The crude death rate is calculated using yearly U.S. Census Bureau population estimates for that year. Source: South Dakota Department of Health, Office of Health Statistics
Figure 20 South Dakota Resident Crude Death Rate Due to Heart Disease by Year
of Death, 2007-2016
C r u d e D
e a t h R a t
e

76
201.5
194.0185.4
202.8
201.0 194.8
186.3
196.8
190.1
195.4
0.0
50.0
100.0
150.0
200.0
250.0
2007 2008 2009 2010 2011 2012 2013 2014 2015 2016
Figure 21 South Dakota Resident Crude Death Rate Due to Malignant Neoplasms by Year
of Death, 2007-2016
Note: The crude death rate is calculated using yearly U.S. Census Bureau population estimates for that year. Source: South Dakota Department of Health, Office of Health Statistics
C r u d e D e a t h R a t
e
53.355.3
47.6
53.3 55.552.1
49.2
51.5
49.4
48.5
0.0
10.0
20.0
30.0
40.0
50.0
60.0
70.0
2007 2008 2009 2010 2011 2012 2013 2014 2015 2016
Figure 21a South Dakota Resident Crude Death Rate Due to Trachea, Bronchus, and Lung
Cancer by Year of Death, 2007-2016
C r u d e D e a t h R a t e
Note: The crude death rate is calculated using yearly U.S. Census Bureau population estimates for that year. Source: South Dakota Department of Health, Office of Health Statistics
Figure 21b South Dakota Resident Crude Death Rate Due to Colon, Rectum, and Anus
Cancer by Year of Death, 2007-2016
20.7
18.9
19.320.6
16.6 19.9 20.0
21.8
19.6
18.8
0.0
5.0
10.0
15.0
20.0
25.0
2007 2008 2009 2010 2011 2012 2013 2014 2015 2016
C r u d e D e a t h R a t e
Note: The crude death rate is calculated using yearly U.S. Census Bureau population estimates for that year. Source: South Dakota Department of Health, Office of Health Statistics

77
C r u d e D e a t h R a t
e
11.7
10.8
13.5
12.011.5
12.6
12.913.8
12.7
14.8
0.0
5.0
10.0
15.0
20.0
2007 2008 2009 2010 2011 2012 2013 2014 2015 2016
Note: The crude death rate is calculated using yearly U.S. Census Bureau population estimates for that year. Source: South Dakota Department of Health, Office of Health Statistics
Figure 21c
South Dakota Resident Crude Death Rate Due to Pancreas Cancer by Year of
Death, 2007-2016
Figure 21d South Dakota Resident Crude Death Rate Due to Female Breast Cancer by
Year of Death, 2007-2016
28.3
29.3
23.4
25.3
29.7
25.8
25.723.6
24.4
25.4
0.0
10.0
20.0
30.0
40.0
2007 2008 2009 2010 2011 2012 2013 2014 2015 2016
C r u d e D e a t h R a t
e
Note: The crude death rate is calculated using yearly U.S. Census Bureau population estimates for that year. Source: South Dakota Department of Health, Office of Health Statistics
C r u d e D e a t h R a t
e
23.7
19.4
20.7
23.6
21.3
17.9 17.9 17.5
20.8
24.5
0.0
10.0
20.0
30.0
2007 2008 2009 2010 2011 2012 2013 2014 2015 2016
Note: The crude death rate is calculated using yearly U.S. Census Bureau population estimates for that year. Source: South Dakota Department of Health, Office of Health Statistics
Figure 21e
South Dakota Resident Crude Death Rate Due to Prostate Cancer by Year of Death,
2007-2016

78
9.5
7.57.0
10.19.3
8.2
10.5
10.5
7.7
7.0
0.0
2.0
4.0
6.0
8.0
10.0
12.0
2007 2008 2009 2010 2011 2012 2013 2014 2015 2016
Note: The crude death rate is calculated using yearly U.S. Census Bureau population estimates for that year. Source: South Dakota Department of Health, Office of Health Statistics
Figure 21f
South Dakota Resident Crude Death Rate Due to Leukemia by Year of Death,
2007-2016
C r u d e D e a t h R a t
e
44.8
46.242.8
48.049.4 50.0
50.2
54.0 54.458.1
0.0
10.0
20.0
30.0
40.0
50.0
60.0
70.0
2007 2008 2009 2010 2011 2012 2013 2014 2015 2016
Figure 22
South Dakota Resident Crude Death Rate Due to Accidents by Year of Death,
2007-2016
C r u d e D e a t h R a t e
Note: The crude death rate is calculated using yearly U.S. Census Bureau population estimates for that year. Source: South Dakota Department of Health, Office of Health Statistics
18.2
15.516.4
17.3
12.0
17.0
17.6
17.716.7
15.6
0.0
5.0
10.0
15.0
20.0
2007 2008 2009 2010 2011 2012 2013 2014 2015 2016
Note: The crude death rate is calculated using yearly U.S. Census Bureau population estimates for that year. Source: South Dakota Department of Health, Office of Health Statistics
Figure 22a
South Dakota Resident Crude Death Rate Due to Motor Vehicle Accidents by
Year of Death, 2007-2016
C r u d e D e a t h R a t
e

79
51.2
48.651.3
50.5
53.6
49.2
49.0
51.5
44.4
48.5
0.0
10.0
20.0
30.0
40.0
50.0
60.0
2007 2008 2009 2010 2011 2012 2013 2014 2015 2016
Note: The crude death rate is calculated using yearly U.S. Census Bureau population estimates for that year.
Source: South Dakota Department of Health, Office of Health Statistics
Figure 25 South Dakota Resident Crude Death Rate Due to Cerebrovascular Disease by Year of
Death, 2007-2016
C r u d e D e a t h R a t
e
Figure 24
South Dakota Resident Crude Death Rate Due to Chronic Lower Respiratory
Disease by Year of Death, 2007-2016
C r u d e D e a t h R a t e
Note: The crude death rate is calculated using yearly U.S. Census Bureau population estimates for that year. Source: South Dakota Department of Health, Office of Health Statistics
57.5 60.4
54.2 55.4
58.9 57.5
48.9 51.6
58.2
49.3
0.0
10.0
20.0
30.0
40.0
50.0
60.0
70.0
2007 2008 2009 2010 2011 2012 2013 2014 2015 2016
43.3
49.8
49.5 49.351.3
55.4
49.7
50.849.0
51.9
0.0
10.0
20.0
30.0
40.0
50.0
60.0
2007 2008 2009 2010 2011 2012 2013 2014 2015 2016
Note: The crude death rate is calculated using yearly U.S. Census Bureau population estimates for that year. Source: South Dakota Department of Health, Office of Health Statistics
Figure 23 South Dakota Resident Crude Death Rate Due to Alzheimer's Disease by Year of
Death, 2007-2016
C r u d e D e a t h R a t
e

80
Note: The crude death rate is calculated using yearly U.S. Census Bureau population estimates for that year. Source: South Dakota Department of Health, Office of Health Statistics
30.9
26.8
24.6
29.6
32.4
26.328.3
26.1
32.8
29.2
0.0
10.0
20.0
30.0
40.0
2007 2008 2009 2010 2011 2012 2013 2014 2015 2016
Figure 26 South Dakota Resident Crude Death Rate Due to Diabetes Mellitus by Year of
Death, 2007-2016
C r u d e D e a t h R a t
e
23.7 23.1
16.6
20.421.6
22.6 22.0
21.1
24.8
22.5
0.0
5.0
10.0
15.0
20.0
25.0
30.0
2007 2008 2009 2010 2011 2012 2013 2014 2015 2016
Note: The crude death rate is calculated using yearly U.S. Census Bureau population estimates for that year. Source: South Dakota Department of Health, Office of Health Statistics
Figure 27 South Dakota Resident Crude Death Rate Due to Influenza and Pneumonia by
Year of Death, 2007-2016
C r u d e D e a t h R a t
e
12.7
15.315.8
17.1
15.216.2
17.4
16.5
20.2
18.6
0.0
5.0
10.0
15.0
20.0
25.0
2007 2008 2009 2010 2011 2012 2013 2014 2015 2016
Note: The crude death rate is calculated using yearly U.S. Census Bureau population estimates for that year. Source: South Dakota Department of Health, Office of Health Statistics
Figure 28 South Dakota Resident Crude Death Rate Due to Intentional Self-Harm
(Suicide) by Year of Death, 2007-2016
C r u d e D e a t h R a t
e
81
11.8 12.4
9.7 10.2
11.913.6
14.3 15.0
16.0
18.3
0.0
5.0
10.0
15.0
20.0
2007 2008 2009 2010 2011 2012 2013 2014 2015 2016
Note: The crude death rate is calculated using yearly U.S. Census Bureau population estimates for that year. Source: South Dakota Department of Health, Office of Health Statistics
Figure 29 South Dakota Resident Crude Death Rate Due to Chronic Liver Disease and
Cirrhosis by Year of Death, 2007-2016
C r u d e D e a t h R a t
e
8.8
8.1
6.4
11.4 11.4
9.48.5
11.112.0
10.6
0.0
5.0
10.0
15.0
2007 2008 2009 2010 2011 2012 2013 2014 2015 2016
Note: The crude death rate is calculated using yearly U.S. Census Bureau population estimates for that year. Source: South Dakota Department of Health, Office of Health Statistics
Figure 31 South Dakota Resident Crude Death Rate Due to Essential (Primary)
Hypertension and Hypertensive Renal Disease by Year of Death, 2007-2016
C r u d e D e a t h R a t
e
Note: The crude death rate is calculated using yearly U.S. Census Bureau population estimates for that year. Source: South Dakota Department of Health, Office of Health Statistics
Figure 30 South Dakota Resident Crude Death Rate Due to Unspecified Dementia by
Year of Death, 2007-2016
C r u d e D e a t h R a t
e
8.8
9.911.1
11.2
14.2
13.311.7
14.1
14.7
14.0
0.0
5.0
10.0
15.0
20.0
2007 2008 2009 2010 2011 2012 2013 2014 2015 2016

82
8.0
6.7
7.8
8.18.4
7.7
8.89.5
13.9
9.4
0.0
3.0
6.0
9.0
12.0
15.0
2007 2008 2009 2010 2011 2012 2013 2014 2015 2016
Note: The crude death rate is calculated using yearly U.S. Census Bureau population estimates for that year. Source: South Dakota Department of Health, Office of Health Statistics
Figure 34 South Dakota Resident Crude Death Rate Due to Septicemia by Year of Death, 2007-2016
C r u d e D e a t h R a t
e
Figure 33 South Dakota Resident Crude Death Rate Due to Parkinson’s Disease by
Year of Death, 2007-2016
C r u d e D e a t h R a t
e
Note: The crude death rate is calculated using yearly U.S. Census Bureau population estimates for that year. Source: South Dakota Department of Health, Office of Health Statistics
7.88.6
8.0
10.48.9
6.4
9.27.4
9.3
9.9
0.0
2.0
4.0
6.0
8.0
10.0
12.0
2007 2008 2009 2010 2011 2012 2013 2014 2015 2016
9.3
11.212.2
8.8
5.96.8
7.3
8.49.2
10.6
0.0
2.0
4.0
6.0
8.0
10.0
12.0
14.0
2007 2008 2009 2010 2011 2012 2013 2014 2015 2016
Note: The crude death rate is calculated using yearly U.S. Census Bureau population estimates for that year. Source: South Dakota Department of Health, Office of Health Statistics
C r u d e D e a t h R a t
e
Figure 32 South Dakota Resident Crude Death Rate Due to Nephritis, Nephrotic Syndrome,
and Nephrosis by Year of Death, 2007-2016