Embed Size (px)
Citation preview
Section C: Mortality
Tables
Mortality Table 1: Summary of Deaths to Minnesota Residents
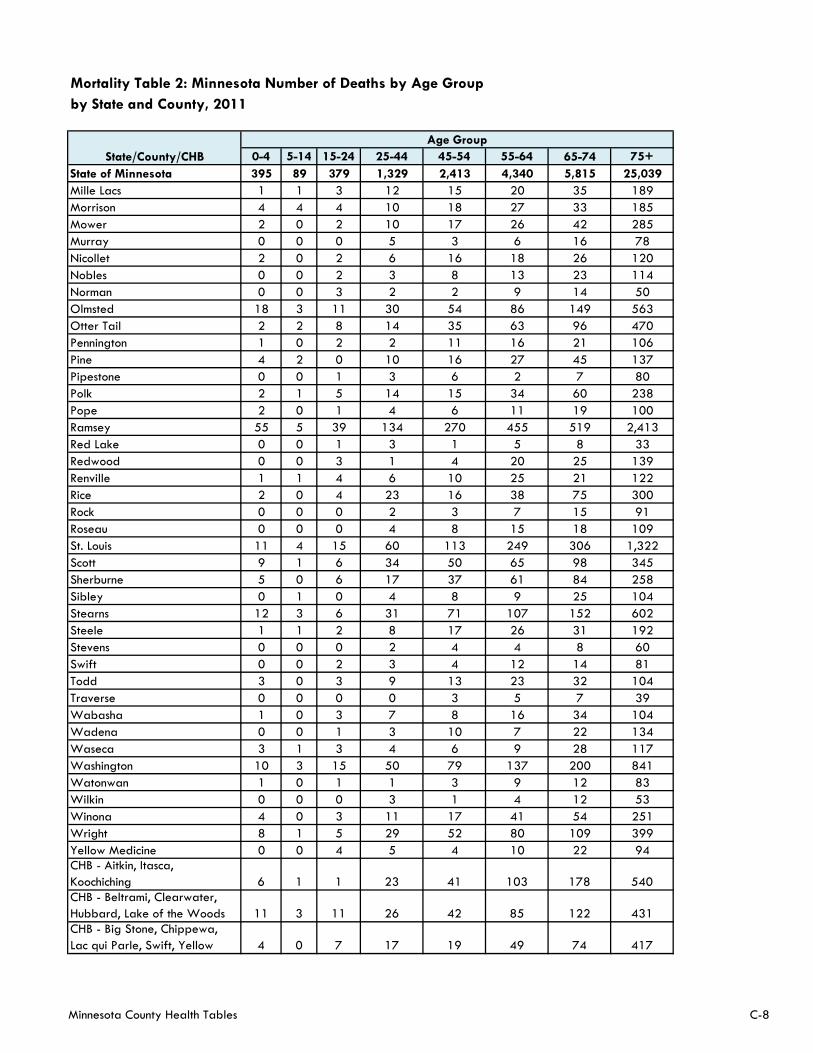
Mortality Table 2: Number of Deaths by Age Group
Mortality Table 3: Age-Specific Death Rate
Mortality Table 4: Minnesota's 10 Leading Causes of Death
Mortality Table 5:Premature Deaths
Minnesota County Health Tables
Mortality Introduction
The mortality section of the Minnesota County Health Tables provides data on deaths to residents
of Minnesota including number of deaths, crude death rates, age-adjusted death rates, age-specific
death rates, the 15 leading causes of death and premature death rate by top 10 leading causes of
death. All data are for presented for the most current year with the exception of the premature
deaths; due to small numbers of deaths a 5-year grouping is provided. This introduction provides
an overview of death (mortality) statistics, how deaths rates are calculated and how to use these
statistics.
Crude Death Rate
A crude death rate is a good measure of the overall magnitude of mortality in a population. The
crude rate is useful information for some purposes, such as planning for the delivery of health care
services. One should be cautious when comparing a crude death rate over time or to another
county or Community Health Board (CHB) and be aware that differences in the crude rate may be
due to an older populations.
A crude death rate is simply the number of deaths divided by the total population, often multiplied
by some constant so that the result is not a fraction (for death rates 100,000 is the most commonly
used multiplier).
Mortality Table 1 includes crude death rates for the state of Minnesota, its counties and community
health boards.
Age-specific death rates
An age-specific death rate is useful in understanding the influence each age group has on the
overall crude death rate. Mortality Table 3 shows age-specific death rates for the state of
Minnesota, its counties and CHBs, using eight common age groupings. Note that the death rate for
ages 0-4 is substantially higher than the death rates for the other younger age groups (primarily due
to a high death rate during infancy); only at ages 45-54 does the death rate exceed that for ages 0-
4. It can be immediately seen that the death rates are many times higher in the oldest age groups.
Therefore, county or CHB with an older population will automatically have a higher overall death
rate just because of the age distribution.
An age-specific death rate is the number of deaths to an age group divided by the population for
that age group, often multiplied by some constant so that the result is not a fraction (for death
rates 100,000 is the most commonly used multiplier).
Premature Death Rate
Almost 4 out of every 10 deaths to Minnesota residents occur to people under 75 years of age.
Thus, it is also important to investigate deaths to younger Minnesotans. By examining premature
deaths to younger persons, it may be possible to identify certain counties or CHBs were certain
deaths that may be more prevalent among younger residents.
The premature death rate (PDR) for those under age 75 is the number of deaths to residents under
age 75 per 100,000 persons age-adjusted to the 2000 U.S. standard population. For more
information on PDRs go to: Pennsylvania Department of Health, Tools of the Trade, Premature
Mortality Rates
http://www.portal.state.pa.us/portal/server.pt?open=514&objID=556449&mode=2
Tables 1 and 5 of the Minnesota County Health Tables include premature deaths to those under age
75, as well as a premature death rate (age-adjusted).
Age-adjusted Death Rates
Age adjusting rates is a way to make fairer comparisons between counties/CHBs with different age
distributions. For example, a county having a higher percentage of elderly people may have a higher
crude death than a county with a younger population merely because the elderly are more likely to
die. Age-adjusted death rates are used to eliminate this age bias in the makeup of the populations
being compared, thereby providing a much more reliable rate for comparison purposes.
The age-adjusted rates provided in Mortality Tables 1 and 5 are calculated using the direct method
of age adjustment. For more information on age adjusting death rates go to: Centers for Disease
Control and Prevention, Healthy People 2000 Statistical Notes, Direct Standardization (Age-Adjusted
Death Rates)
http://www.cdc.gov/nchs/data/statnt/statnt06rv.pdf
Additional Resources for Minnesota Death Data
Minnesota Vital Statistics Interactive Queries Website
A query system that includes deaths by county, age, cause, gender and race/ethnicity
https://pqc.health.state.mn.us/mhsq/index.jsp
Minnesota Vital Statistics State, County, and Community Health Board Trend Reports
Reports include the 5-year rates for the cancer heart disease, stroke, and unintentional injury
http://www.health.state.mn.us/divs/chs/trends/index.html
Minnesota Injury Data Access System (MIDAS)
A query system of injury and violence data for Minnesotans by county, injury type, gender,
outcome (fatal/non-fatal)
http://www.health.state.mn.us/injury/midas/ub92/
CDC Wonder
WONDER online databases utilize a rich ad-hoc query system for the analysis of public health data
http://wonder.cdc.gov/
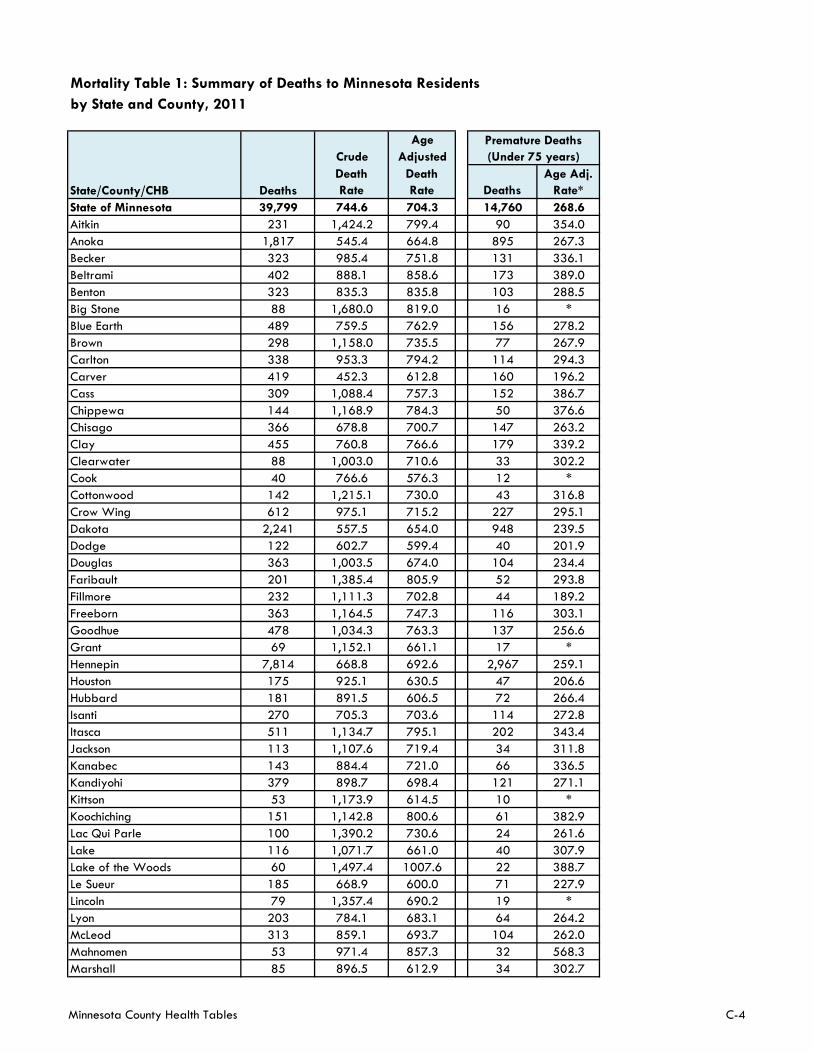
Mortality Table 1: Summary of Deaths to Minnesota Residents
by State and County, 2011
Age
Crude Adjusted
Deaths
Death
Rate
Death
Rate Deaths
Age Adj.
Rate*
State of Minnesota 39,799 744.6 704.3 14,760 268.6
Aitkin 231 1,424.2 799.4 90 354.0
Anoka 1,817 545.4 664.8 895 267.3
Becker 323 985.4 751.8 131 336.1
Beltrami 402 888.1 858.6 173 389.0
Benton 323 835.3 835.8 103 288.5
Big Stone 88 1,680.0 819.0 16 *
Blue Earth 489 759.5 762.9 156 278.2
Brown 298 1,158.0 735.5 77 267.9
Carlton 338 953.3 794.2 114 294.3
Carver 419 452.3 612.8 160 196.2
Cass 309 1,088.4 757.3 152 386.7
Chippewa 144 1,168.9 784.3 50 376.6
Chisago 366 678.8 700.7 147 263.2
Clay 455 760.8 766.6 179 339.2
Clearwater 88 1,003.0 710.6 33 302.2
Cook 40 766.6 576.3 12 *
Cottonwood 142 1,215.1 730.0 43 316.8
Crow Wing 612 975.1 715.2 227 295.1
Dakota 2,241 557.5 654.0 948 239.5
Dodge 122 602.7 599.4 40 201.9
Douglas 363 1,003.5 674.0 104 234.4
Faribault 201 1,385.4 805.9 52 293.8
Fillmore 232 1,111.3 702.8 44 189.2
Freeborn 363 1,164.5 747.3 116 303.1
Goodhue 478 1,034.3 763.3 137 256.6
Grant 69 1,152.1 661.1 17 *
Hennepin 7,814 668.8 692.6 2,967 259.1
Houston 175 925.1 630.5 47 206.6
Hubbard 181 891.5 606.5 72 266.4
Isanti 270 705.3 703.6 114 272.8
Itasca 511 1,134.7 795.1 202 343.4
Jackson 113 1,107.6 719.4 34 311.8
Kanabec 143 884.4 721.0 66 336.5
Kandiyohi 379 898.7 698.4 121 271.1
Kittson 53 1,173.9 614.5 10 *
Koochiching 151 1,142.8 800.6 61 382.9
Lac Qui Parle 100 1,390.2 730.6 24 261.6
Lake 116 1,071.7 661.0 40 307.9
Lake of the Woods 60 1,497.4 1007.6 22 388.7
Le Sueur 185 668.9 600.0 71 227.9
Lincoln 79 1,357.4 690.2 19 *
Lyon 203 784.1 683.1 64 264.2
McLeod 313 859.1 693.7 104 262.0
Mahnomen 53 971.4 857.3 32 568.3
Marshall 85 896.5 612.9 34 302.7
State/County/CHB
Premature Deaths
(Under 75 years)
Minnesota County Health Tables C-4
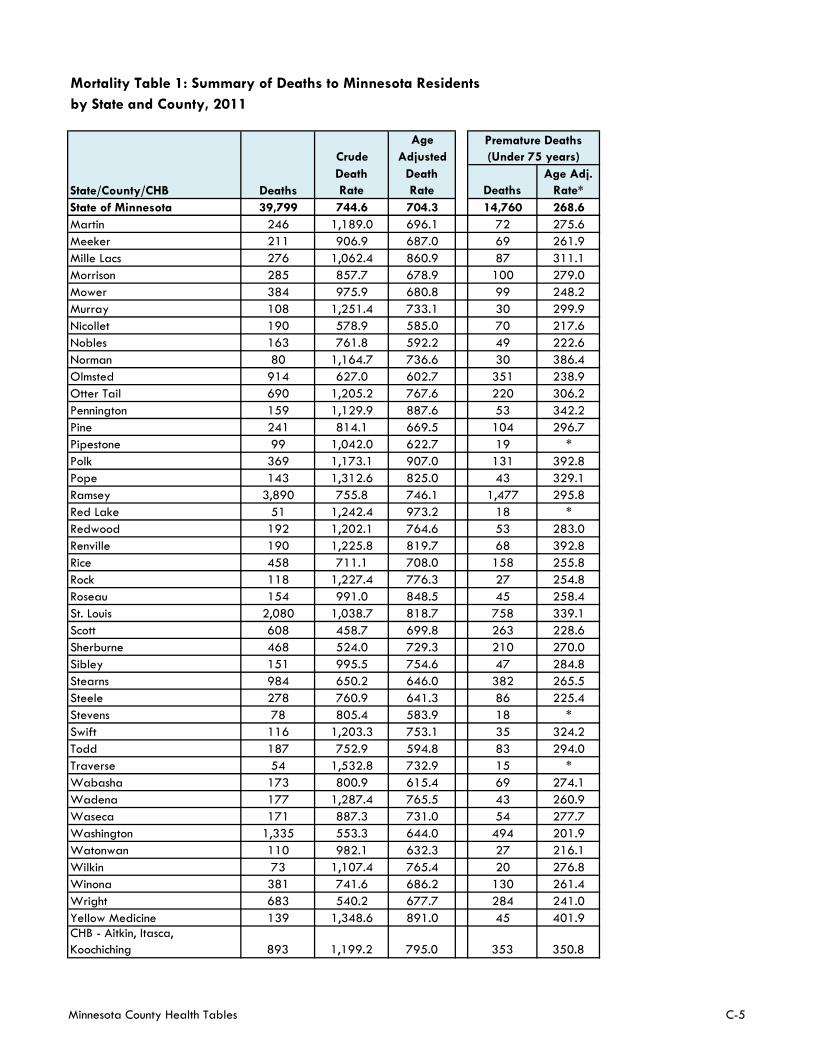
Mortality Table 1: Summary of Deaths to Minnesota Residents
by State and County, 2011
Age
Crude Adjusted
Deaths
Death
Rate
Death
Rate Deaths
Age Adj.
Rate*
State of Minnesota 39,799 744.6 704.3 14,760 268.6
State/County/CHB
Premature Deaths
(Under 75 years)
Martin 246 1,189.0 696.1 72 275.6
Meeker 211 906.9 687.0 69 261.9
Mille Lacs 276 1,062.4 860.9 87 311.1
Morrison 285 857.7 678.9 100 279.0
Mower 384 975.9 680.8 99 248.2
Murray 108 1,251.4 733.1 30 299.9
Nicollet 190 578.9 585.0 70 217.6
Nobles 163 761.8 592.2 49 222.6
Norman 80 1,164.7 736.6 30 386.4
Olmsted 914 627.0 602.7 351 238.9
Otter Tail 690 1,205.2 767.6 220 306.2
Pennington 159 1,129.9 887.6 53 342.2
Pine 241 814.1 669.5 104 296.7
Pipestone 99 1,042.0 622.7 19 *
Polk 369 1,173.1 907.0 131 392.8
Pope 143 1,312.6 825.0 43 329.1
Ramsey 3,890 755.8 746.1 1,477 295.8
Red Lake 51 1,242.4 973.2 18 *
Redwood 192 1,202.1 764.6 53 283.0
Renville 190 1,225.8 819.7 68 392.8
Rice 458 711.1 708.0 158 255.8
Rock 118 1,227.4 776.3 27 254.8
Roseau 154 991.0 848.5 45 258.4
St. Louis 2,080 1,038.7 818.7 758 339.1
Scott 608 458.7 699.8 263 228.6
Sherburne 468 524.0 729.3 210 270.0
Sibley 151 995.5 754.6 47 284.8
Stearns 984 650.2 646.0 382 265.5
Steele 278 760.9 641.3 86 225.4
Stevens 78 805.4 583.9 18 *
Swift 116 1,203.3 753.1 35 324.2
Todd 187 752.9 594.8 83 294.0
Traverse 54 1,532.8 732.9 15 *
Wabasha 173 800.9 615.4 69 274.1
Wadena 177 1,287.4 765.5 43 260.9
Waseca 171 887.3 731.0 54 277.7
Washington 1,335 553.3 644.0 494 201.9
Watonwan 110 982.1 632.3 27 216.1
Wilkin 73 1,107.4 765.4 20 276.8
Winona 381 741.6 686.2 130 261.4
Wright 683 540.2 677.7 284 241.0
Yellow Medicine 139 1,348.6 891.0 45 401.9CHB - Aitkin, Itasca,
Koochiching 893 1,199.2 795.0 353 350.8
Minnesota County Health Tables C-5

Mortality Table 1: Summary of Deaths to Minnesota Residents
by State and County, 2011
Age
Crude Adjusted
Deaths
Death
Rate
Death
Rate Deaths
Age Adj.
Rate*
State of Minnesota 39,799 744.6 704.3 14,760 268.6
State/County/CHB
Premature Deaths
(Under 75 years)
CHB - Beltrami, Clearwater,
Hubbard, Lake of the Woods 731 933.0 771.8 300 342.9CHB - Big Stone, Chippewa,
Lac qui Parle, Swift, Yellow 587 1,313.3 801.6 170 339.0
CHB - Brown, Nicollet 488 833.4 667.1 147 240.0CHB - Carlton, Cook, Lake, St.
Louis 2,574 1,022.4 797.0 924 324.9
CHB - Cottonwood, Jackson 255 1,165.0 725.9 77 315.2
CHB - Clay, Wilkin 528 795.2 767.7 199 331.5CHB - Douglas, Grant, Pope,
Stevens, Traverse 707 1,067.0 688.8 197 250.4
CHB - Dodge, Steele 400 704.5 627.8 126 217.6
CHB - Fillmore, Houston 407 1,022.8 670.7 91 197.5
CHB - Faribault, Martin 447 1,270.0 741.5 124 283.0
CHB - Isanti, Mille Lacs 546 849.6 776.0 201 286.8CHB - Kittson, Marshall,
Pennington, Red Lake, Roseau 502 1,052.1 786.5 160 293.6
CHB - Kanabec, Pine 384 838.9 688.1 170 311.2
CHB - Kandiyohi, Renville 569 986.6 731.6 189 304.0CHB - Lincoln, Lyon, Murray,
Pipestone, Redwood, Rock 799 1,059.3 716.9 212 265.0
CHB - LeSueur, Waseca 356 758.6 657.1 125 247.6
CHB - Meeker, McLeod, Sibley 675 901.6 703.7 220 266.1
CHB - Mahnomen, Norman, Polk 502 1,146.6 868.6 193 411.5
CHB - Morrison, Todd, Wadena 649 903.7 676.2 226 281.6
Source: Minnesota Department of Health, Center for Health Statistics
For more data on deaths in Minnesota go the Minnesota Vital Statistics Interactive Queries Website:
https://pqc.health.state.mn.us/mhsq/index.jsp
Crude death rate - the total number of deaths per 100,000 persons.
Age adjusted death rate - the total number of deaths per 100,000 persons, age adjusted to the
2000 U.S standard population.
Premature death rate - the number of deaths to residents under age 75 per 100,000 persons
age-adjusted to the 2000 U.S. standard population.
For more information on these rates and age adjusting, see the INTRO
*Rates not calculated for fewer than 20 deaths.
Minnesota County Health Tables C-6
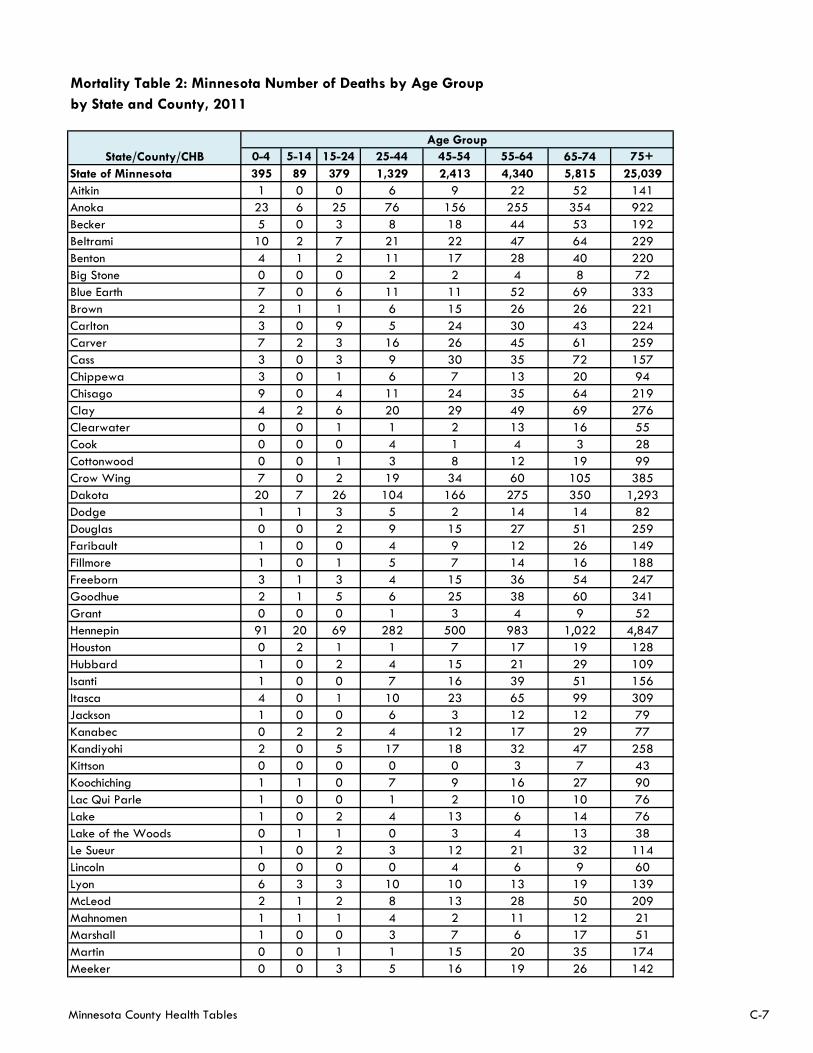
Mortality Table 2: Minnesota Number of Deaths by Age Group
by State and County, 2011
0-4 5-14 15-24 25-44 45-54 55-64 65-74 75+
State of Minnesota 395 89 379 1,329 2,413 4,340 5,815 25,039
Aitkin 1 0 0 6 9 22 52 141
Anoka 23 6 25 76 156 255 354 922
Becker 5 0 3 8 18 44 53 192
Beltrami 10 2 7 21 22 47 64 229
Benton 4 1 2 11 17 28 40 220
Big Stone 0 0 0 2 2 4 8 72
Blue Earth 7 0 6 11 11 52 69 333
Brown 2 1 1 6 15 26 26 221
Carlton 3 0 9 5 24 30 43 224
Carver 7 2 3 16 26 45 61 259
Cass 3 0 3 9 30 35 72 157
Chippewa 3 0 1 6 7 13 20 94
Chisago 9 0 4 11 24 35 64 219
Clay 4 2 6 20 29 49 69 276
Clearwater 0 0 1 1 2 13 16 55
Cook 0 0 0 4 1 4 3 28
Cottonwood 0 0 1 3 8 12 19 99
Crow Wing 7 0 2 19 34 60 105 385
Dakota 20 7 26 104 166 275 350 1,293
Dodge 1 1 3 5 2 14 14 82
Douglas 0 0 2 9 15 27 51 259
Faribault 1 0 0 4 9 12 26 149
Fillmore 1 0 1 5 7 14 16 188
Freeborn 3 1 3 4 15 36 54 247
Goodhue 2 1 5 6 25 38 60 341
Grant 0 0 0 1 3 4 9 52
Hennepin 91 20 69 282 500 983 1,022 4,847
Houston 0 2 1 1 7 17 19 128
Hubbard 1 0 2 4 15 21 29 109
Isanti 1 0 0 7 16 39 51 156
Itasca 4 0 1 10 23 65 99 309
Jackson 1 0 0 6 3 12 12 79
Kanabec 0 2 2 4 12 17 29 77
Kandiyohi 2 0 5 17 18 32 47 258
Kittson 0 0 0 0 0 3 7 43
Koochiching 1 1 0 7 9 16 27 90
Lac Qui Parle 1 0 0 1 2 10 10 76
Lake 1 0 2 4 13 6 14 76
Lake of the Woods 0 1 1 0 3 4 13 38
Le Sueur 1 0 2 3 12 21 32 114
Lincoln 0 0 0 0 4 6 9 60
Lyon 6 3 3 10 10 13 19 139
McLeod 2 1 2 8 13 28 50 209
Mahnomen 1 1 1 4 2 11 12 21
Marshall 1 0 0 3 7 6 17 51
Martin 0 0 1 1 15 20 35 174
Meeker 0 0 3 5 16 19 26 142
Age Group
State/County/CHB
Minnesota County Health Tables C-7
Mortality Table 2: Minnesota Number of Deaths by Age Group
by State and County, 2011
0-4 5-14 15-24 25-44 45-54 55-64 65-74 75+
State of Minnesota 395 89 379 1,329 2,413 4,340 5,815 25,039
Age Group
State/County/CHB
Mille Lacs 1 1 3 12 15 20 35 189
Morrison 4 4 4 10 18 27 33 185
Mower 2 0 2 10 17 26 42 285
Murray 0 0 0 5 3 6 16 78
Nicollet 2 0 2 6 16 18 26 120
Nobles 0 0 2 3 8 13 23 114
Norman 0 0 3 2 2 9 14 50
Olmsted 18 3 11 30 54 86 149 563
Otter Tail 2 2 8 14 35 63 96 470
Pennington 1 0 2 2 11 16 21 106
Pine 4 2 0 10 16 27 45 137
Pipestone 0 0 1 3 6 2 7 80
Polk 2 1 5 14 15 34 60 238
Pope 2 0 1 4 6 11 19 100
Ramsey 55 5 39 134 270 455 519 2,413
Red Lake 0 0 1 3 1 5 8 33
Redwood 0 0 3 1 4 20 25 139
Renville 1 1 4 6 10 25 21 122
Rice 2 0 4 23 16 38 75 300
Rock 0 0 0 2 3 7 15 91
Roseau 0 0 0 4 8 15 18 109
St. Louis 11 4 15 60 113 249 306 1,322
Scott 9 1 6 34 50 65 98 345
Sherburne 5 0 6 17 37 61 84 258
Sibley 0 1 0 4 8 9 25 104
Stearns 12 3 6 31 71 107 152 602
Steele 1 1 2 8 17 26 31 192
Stevens 0 0 0 2 4 4 8 60
Swift 0 0 2 3 4 12 14 81
Todd 3 0 3 9 13 23 32 104
Traverse 0 0 0 0 3 5 7 39
Wabasha 1 0 3 7 8 16 34 104
Wadena 0 0 1 3 10 7 22 134
Waseca 3 1 3 4 6 9 28 117
Washington 10 3 15 50 79 137 200 841
Watonwan 1 0 1 1 3 9 12 83
Wilkin 0 0 0 3 1 4 12 53
Winona 4 0 3 11 17 41 54 251
Wright 8 1 5 29 52 80 109 399
Yellow Medicine 0 0 4 5 4 10 22 94CHB - Aitkin, Itasca,
Koochiching 6 1 1 23 41 103 178 540CHB - Beltrami, Clearwater,
Hubbard, Lake of the Woods 11 3 11 26 42 85 122 431CHB - Big Stone, Chippewa,
Lac qui Parle, Swift, Yellow 4 0 7 17 19 49 74 417
Minnesota County Health Tables C-8
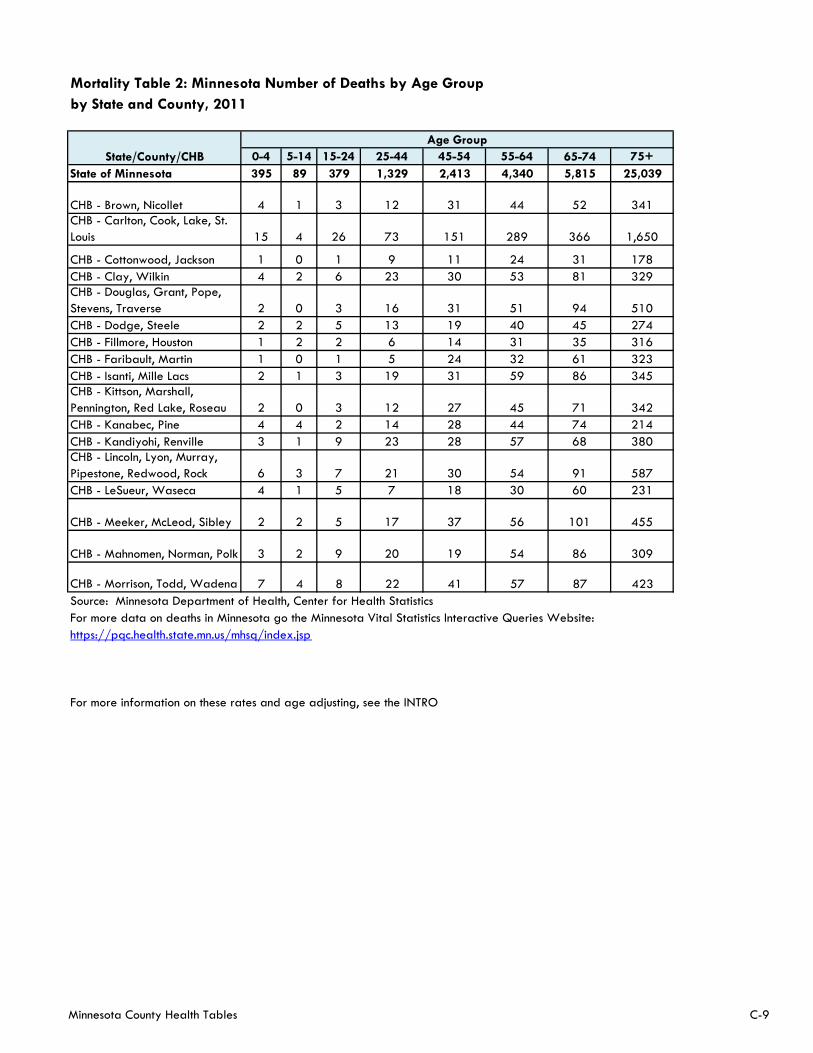
Mortality Table 2: Minnesota Number of Deaths by Age Group
by State and County, 2011
0-4 5-14 15-24 25-44 45-54 55-64 65-74 75+
State of Minnesota 395 89 379 1,329 2,413 4,340 5,815 25,039
Age Group
State/County/CHB
CHB - Brown, Nicollet 4 1 3 12 31 44 52 341CHB - Carlton, Cook, Lake, St.
Louis 15 4 26 73 151 289 366 1,650
CHB - Cottonwood, Jackson 1 0 1 9 11 24 31 178
CHB - Clay, Wilkin 4 2 6 23 30 53 81 329CHB - Douglas, Grant, Pope,
Stevens, Traverse 2 0 3 16 31 51 94 510
CHB - Dodge, Steele 2 2 5 13 19 40 45 274
CHB - Fillmore, Houston 1 2 2 6 14 31 35 316
CHB - Faribault, Martin 1 0 1 5 24 32 61 323
CHB - Isanti, Mille Lacs 2 1 3 19 31 59 86 345CHB - Kittson, Marshall,
Pennington, Red Lake, Roseau 2 0 3 12 27 45 71 342
CHB - Kanabec, Pine 4 4 2 14 28 44 74 214
CHB - Kandiyohi, Renville 3 1 9 23 28 57 68 380CHB - Lincoln, Lyon, Murray,
Pipestone, Redwood, Rock 6 3 7 21 30 54 91 587
CHB - LeSueur, Waseca 4 1 5 7 18 30 60 231
CHB - Meeker, McLeod, Sibley 2 2 5 17 37 56 101 455
CHB - Mahnomen, Norman, Polk 3 2 9 20 19 54 86 309
CHB - Morrison, Todd, Wadena 7 4 8 22 41 57 87 423
Source: Minnesota Department of Health, Center for Health Statistics
For more data on deaths in Minnesota go the Minnesota Vital Statistics Interactive Queries Website:
https://pqc.health.state.mn.us/mhsq/index.jsp
For more information on these rates and age adjusting, see the INTRO
Minnesota County Health Tables C-9
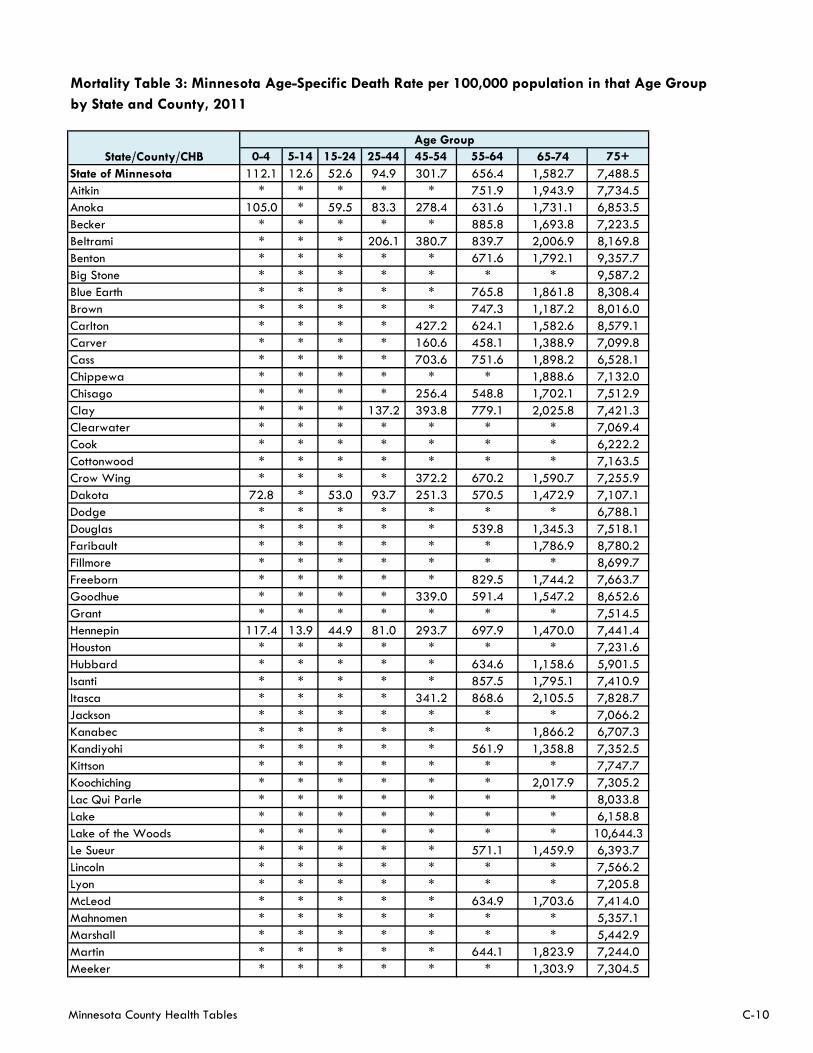
Mortality Table 3: Minnesota Age-Specific Death Rate per 100,000 population in that Age Group
by State and County, 2011
0-4 5-14 15-24 25-44 45-54 55-64 65-74 75+
State of Minnesota 112.1 12.6 52.6 94.9 301.7 656.4 1,582.7 7,488.5
Aitkin * * * * * 751.9 1,943.9 7,734.5
Anoka 105.0 * 59.5 83.3 278.4 631.6 1,731.1 6,853.5
Becker * * * * * 885.8 1,693.8 7,223.5
Beltrami * * * 206.1 380.7 839.7 2,006.9 8,169.8
Benton * * * * * 671.6 1,792.1 9,357.7
Big Stone * * * * * * * 9,587.2
Blue Earth * * * * * 765.8 1,861.8 8,308.4
Brown * * * * * 747.3 1,187.2 8,016.0
Carlton * * * * 427.2 624.1 1,582.6 8,579.1
Carver * * * * 160.6 458.1 1,388.9 7,099.8
Cass * * * * 703.6 751.6 1,898.2 6,528.1
Chippewa * * * * * * 1,888.6 7,132.0
Chisago * * * * 256.4 548.8 1,702.1 7,512.9
Clay * * * 137.2 393.8 779.1 2,025.8 7,421.3
Clearwater * * * * * * * 7,069.4
Cook * * * * * * * 6,222.2
Cottonwood * * * * * * * 7,163.5
Crow Wing * * * * 372.2 670.2 1,590.7 7,255.9
Dakota 72.8 * 53.0 93.7 251.3 570.5 1,472.9 7,107.1
Dodge * * * * * * * 6,788.1
Douglas * * * * * 539.8 1,345.3 7,518.1
Faribault * * * * * * 1,786.9 8,780.2
Fillmore * * * * * * * 8,699.7
Freeborn * * * * * 829.5 1,744.2 7,663.7
Goodhue * * * * 339.0 591.4 1,547.2 8,652.6
Grant * * * * * * * 7,514.5
Hennepin 117.4 13.9 44.9 81.0 293.7 697.9 1,470.0 7,441.4
Houston * * * * * * * 7,231.6
Hubbard * * * * * 634.6 1,158.6 5,901.5
Isanti * * * * * 857.5 1,795.1 7,410.9
Itasca * * * * 341.2 868.6 2,105.5 7,828.7
Jackson * * * * * * * 7,066.2
Kanabec * * * * * * 1,866.2 6,707.3
Kandiyohi * * * * * 561.9 1,358.8 7,352.5
Kittson * * * * * * * 7,747.7
Koochiching * * * * * * 2,017.9 7,305.2
Lac Qui Parle * * * * * * * 8,033.8
Lake * * * * * * * 6,158.8
Lake of the Woods * * * * * * * 10,644.3
Le Sueur * * * * * 571.1 1,459.9 6,393.7
Lincoln * * * * * * * 7,566.2
Lyon * * * * * * * 7,205.8
McLeod * * * * * 634.9 1,703.6 7,414.0
Mahnomen * * * * * * * 5,357.1
Marshall * * * * * * * 5,442.9
Martin * * * * * 644.1 1,823.9 7,244.0
Meeker * * * * * * 1,303.9 7,304.5
State/County/CHB
Age Group
Minnesota County Health Tables C-10
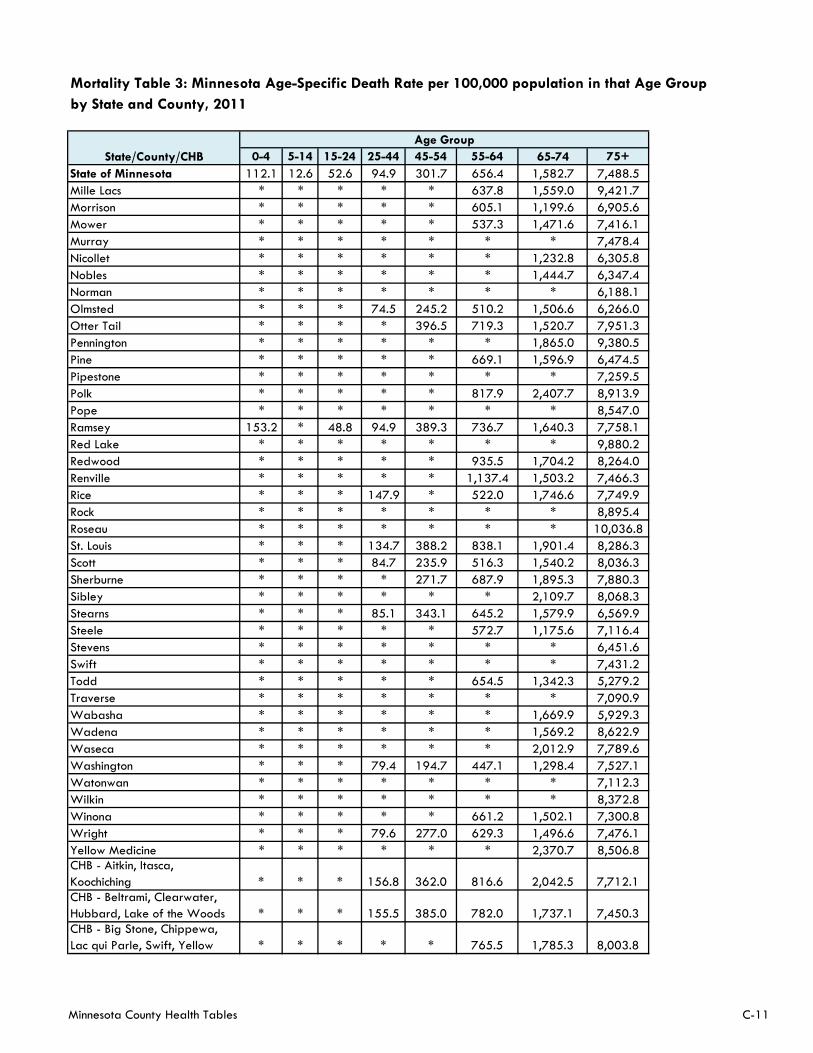
Mortality Table 3: Minnesota Age-Specific Death Rate per 100,000 population in that Age Group
by State and County, 2011
0-4 5-14 15-24 25-44 45-54 55-64 65-74 75+
State of Minnesota 112.1 12.6 52.6 94.9 301.7 656.4 1,582.7 7,488.5
State/County/CHB
Age Group
Mille Lacs * * * * * 637.8 1,559.0 9,421.7
Morrison * * * * * 605.1 1,199.6 6,905.6
Mower * * * * * 537.3 1,471.6 7,416.1
Murray * * * * * * * 7,478.4
Nicollet * * * * * * 1,232.8 6,305.8
Nobles * * * * * * 1,444.7 6,347.4
Norman * * * * * * * 6,188.1
Olmsted * * * 74.5 245.2 510.2 1,506.6 6,266.0
Otter Tail * * * * 396.5 719.3 1,520.7 7,951.3
Pennington * * * * * * 1,865.0 9,380.5
Pine * * * * * 669.1 1,596.9 6,474.5
Pipestone * * * * * * * 7,259.5
Polk * * * * * 817.9 2,407.7 8,913.9
Pope * * * * * * * 8,547.0
Ramsey 153.2 * 48.8 94.9 389.3 736.7 1,640.3 7,758.1
Red Lake * * * * * * * 9,880.2
Redwood * * * * * 935.5 1,704.2 8,264.0
Renville * * * * * 1,137.4 1,503.2 7,466.3
Rice * * * 147.9 * 522.0 1,746.6 7,749.9
Rock * * * * * * * 8,895.4
Roseau * * * * * * * 10,036.8
St. Louis * * * 134.7 388.2 838.1 1,901.4 8,286.3
Scott * * * 84.7 235.9 516.3 1,540.2 8,036.3
Sherburne * * * * 271.7 687.9 1,895.3 7,880.3
Sibley * * * * * * 2,109.7 8,068.3
Stearns * * * 85.1 343.1 645.2 1,579.9 6,569.9
Steele * * * * * 572.7 1,175.6 7,116.4
Stevens * * * * * * * 6,451.6
Swift * * * * * * * 7,431.2
Todd * * * * * 654.5 1,342.3 5,279.2
Traverse * * * * * * * 7,090.9
Wabasha * * * * * * 1,669.9 5,929.3
Wadena * * * * * * 1,569.2 8,622.9
Waseca * * * * * * 2,012.9 7,789.6
Washington * * * 79.4 194.7 447.1 1,298.4 7,527.1
Watonwan * * * * * * * 7,112.3
Wilkin * * * * * * * 8,372.8
Winona * * * * * 661.2 1,502.1 7,300.8
Wright * * * 79.6 277.0 629.3 1,496.6 7,476.1
Yellow Medicine * * * * * * 2,370.7 8,506.8CHB - Aitkin, Itasca,
Koochiching * * * 156.8 362.0 816.6 2,042.5 7,712.1CHB - Beltrami, Clearwater,
Hubbard, Lake of the Woods * * * 155.5 385.0 782.0 1,737.1 7,450.3CHB - Big Stone, Chippewa,
Lac qui Parle, Swift, Yellow * * * * * 765.5 1,785.3 8,003.8
Minnesota County Health Tables C-11
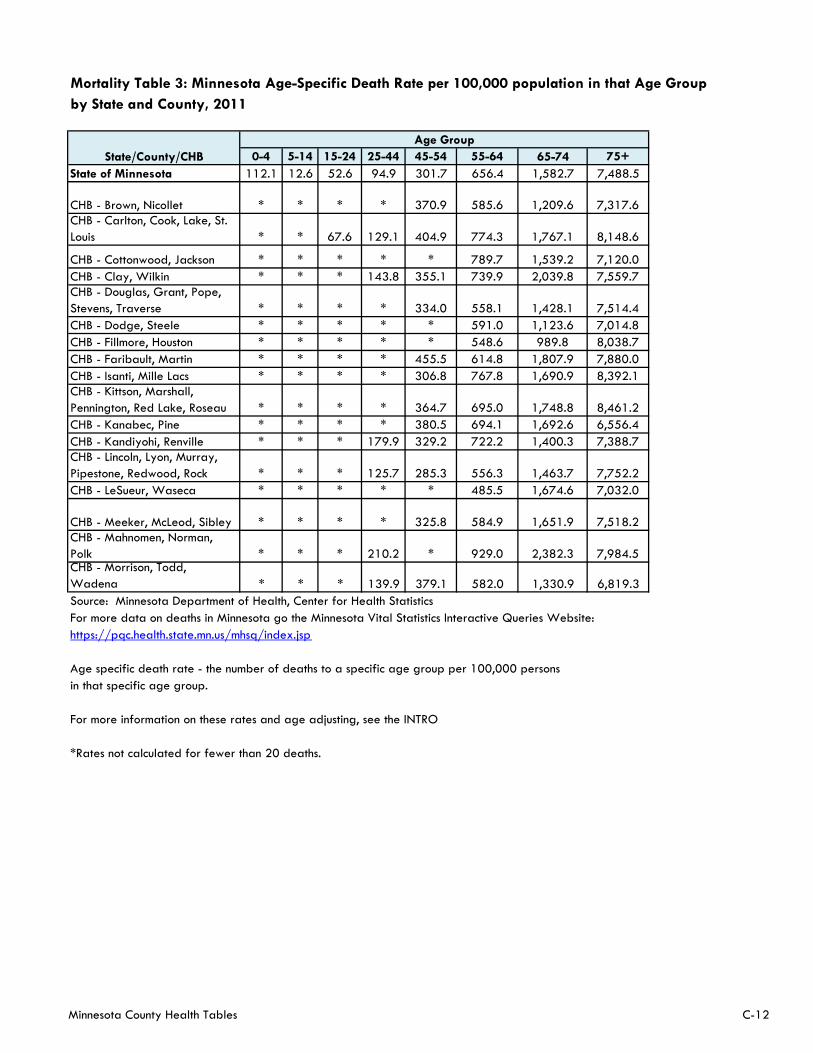
Mortality Table 3: Minnesota Age-Specific Death Rate per 100,000 population in that Age Group
by State and County, 2011
0-4 5-14 15-24 25-44 45-54 55-64 65-74 75+
State of Minnesota 112.1 12.6 52.6 94.9 301.7 656.4 1,582.7 7,488.5
State/County/CHB
Age Group
CHB - Brown, Nicollet * * * * 370.9 585.6 1,209.6 7,317.6CHB - Carlton, Cook, Lake, St.
Louis * * 67.6 129.1 404.9 774.3 1,767.1 8,148.6
CHB - Cottonwood, Jackson * * * * * 789.7 1,539.2 7,120.0
CHB - Clay, Wilkin * * * 143.8 355.1 739.9 2,039.8 7,559.7CHB - Douglas, Grant, Pope,
Stevens, Traverse * * * * 334.0 558.1 1,428.1 7,514.4
CHB - Dodge, Steele * * * * * 591.0 1,123.6 7,014.8
CHB - Fillmore, Houston * * * * * 548.6 989.8 8,038.7
CHB - Faribault, Martin * * * * 455.5 614.8 1,807.9 7,880.0
CHB - Isanti, Mille Lacs * * * * 306.8 767.8 1,690.9 8,392.1CHB - Kittson, Marshall,
Pennington, Red Lake, Roseau * * * * 364.7 695.0 1,748.8 8,461.2
CHB - Kanabec, Pine * * * * 380.5 694.1 1,692.6 6,556.4
CHB - Kandiyohi, Renville * * * 179.9 329.2 722.2 1,400.3 7,388.7CHB - Lincoln, Lyon, Murray,
Pipestone, Redwood, Rock * * * 125.7 285.3 556.3 1,463.7 7,752.2
CHB - LeSueur, Waseca * * * * * 485.5 1,674.6 7,032.0
CHB - Meeker, McLeod, Sibley * * * * 325.8 584.9 1,651.9 7,518.2CHB - Mahnomen, Norman,
Polk * * * 210.2 * 929.0 2,382.3 7,984.5CHB - Morrison, Todd,
Wadena * * * 139.9 379.1 582.0 1,330.9 6,819.3
Source: Minnesota Department of Health, Center for Health Statistics
For more data on deaths in Minnesota go the Minnesota Vital Statistics Interactive Queries Website:
https://pqc.health.state.mn.us/mhsq/index.jsp
Age specific death rate - the number of deaths to a specific age group per 100,000 persons
in that specific age group.
For more information on these rates and age adjusting, see the INTRO
*Rates not calculated for fewer than 20 deaths.
Minnesota County Health Tables C-12
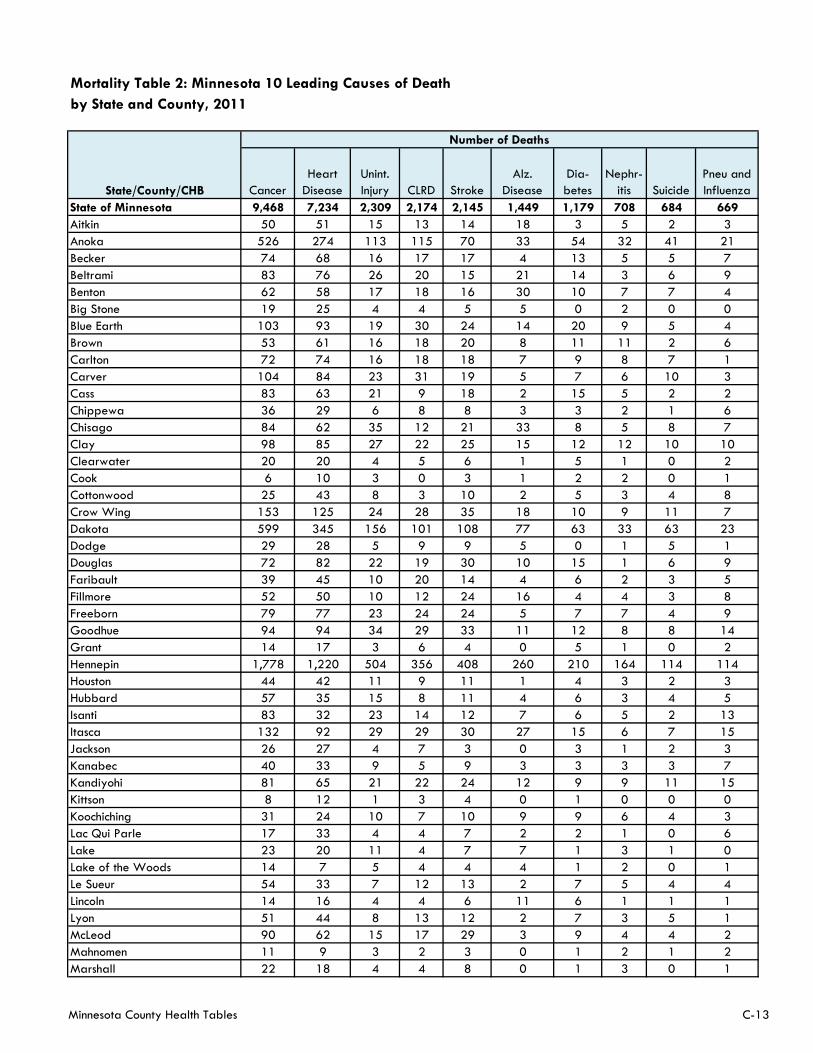
Mortality Table 2: Minnesota 10 Leading Causes of Death
by State and County, 2011
Cancer
Heart
Disease
Unint.
Injury CLRD Stroke
Alz.
Disease
Dia-
betes
Nephr-
itis Suicide
Pneu and
Influenza
State of Minnesota 9,468 7,234 2,309 2,174 2,145 1,449 1,179 708 684 669
Aitkin 50 51 15 13 14 18 3 5 2 3
Anoka 526 274 113 115 70 33 54 32 41 21
Becker 74 68 16 17 17 4 13 5 5 7
Beltrami 83 76 26 20 15 21 14 3 6 9
Benton 62 58 17 18 16 30 10 7 7 4
Big Stone 19 25 4 4 5 5 0 2 0 0
Blue Earth 103 93 19 30 24 14 20 9 5 4
Brown 53 61 16 18 20 8 11 11 2 6
Carlton 72 74 16 18 18 7 9 8 7 1
Carver 104 84 23 31 19 5 7 6 10 3
Cass 83 63 21 9 18 2 15 5 2 2
Chippewa 36 29 6 8 8 3 3 2 1 6
Chisago 84 62 35 12 21 33 8 5 8 7
Clay 98 85 27 22 25 15 12 12 10 10
Clearwater 20 20 4 5 6 1 5 1 0 2
Cook 6 10 3 0 3 1 2 2 0 1
Cottonwood 25 43 8 3 10 2 5 3 4 8
Crow Wing 153 125 24 28 35 18 10 9 11 7
Dakota 599 345 156 101 108 77 63 33 63 23
Dodge 29 28 5 9 9 5 0 1 5 1
Douglas 72 82 22 19 30 10 15 1 6 9
Faribault 39 45 10 20 14 4 6 2 3 5
Fillmore 52 50 10 12 24 16 4 4 3 8
Freeborn 79 77 23 24 24 5 7 7 4 9
Goodhue 94 94 34 29 33 11 12 8 8 14
Grant 14 17 3 6 4 0 5 1 0 2
Hennepin 1,778 1,220 504 356 408 260 210 164 114 114
Houston 44 42 11 9 11 1 4 3 2 3
Hubbard 57 35 15 8 11 4 6 3 4 5
Isanti 83 32 23 14 12 7 6 5 2 13
Itasca 132 92 29 29 30 27 15 6 7 15
Jackson 26 27 4 7 3 0 3 1 2 3
Kanabec 40 33 9 5 9 3 3 3 3 7
Kandiyohi 81 65 21 22 24 12 9 9 11 15
Kittson 8 12 1 3 4 0 1 0 0 0
Koochiching 31 24 10 7 10 9 9 6 4 3
Lac Qui Parle 17 33 4 4 7 2 2 1 0 6
Lake 23 20 11 4 7 7 1 3 1 0
Lake of the Woods 14 7 5 4 4 4 1 2 0 1
Le Sueur 54 33 7 12 13 2 7 5 4 4
Lincoln 14 16 4 4 6 11 6 1 1 1
Lyon 51 44 8 13 12 2 7 3 5 1
McLeod 90 62 15 17 29 3 9 4 4 2
Mahnomen 11 9 3 2 3 0 1 2 1 2
Marshall 22 18 4 4 8 0 1 3 0 1
State/County/CHB
Number of Deaths
Minnesota County Health Tables C-13
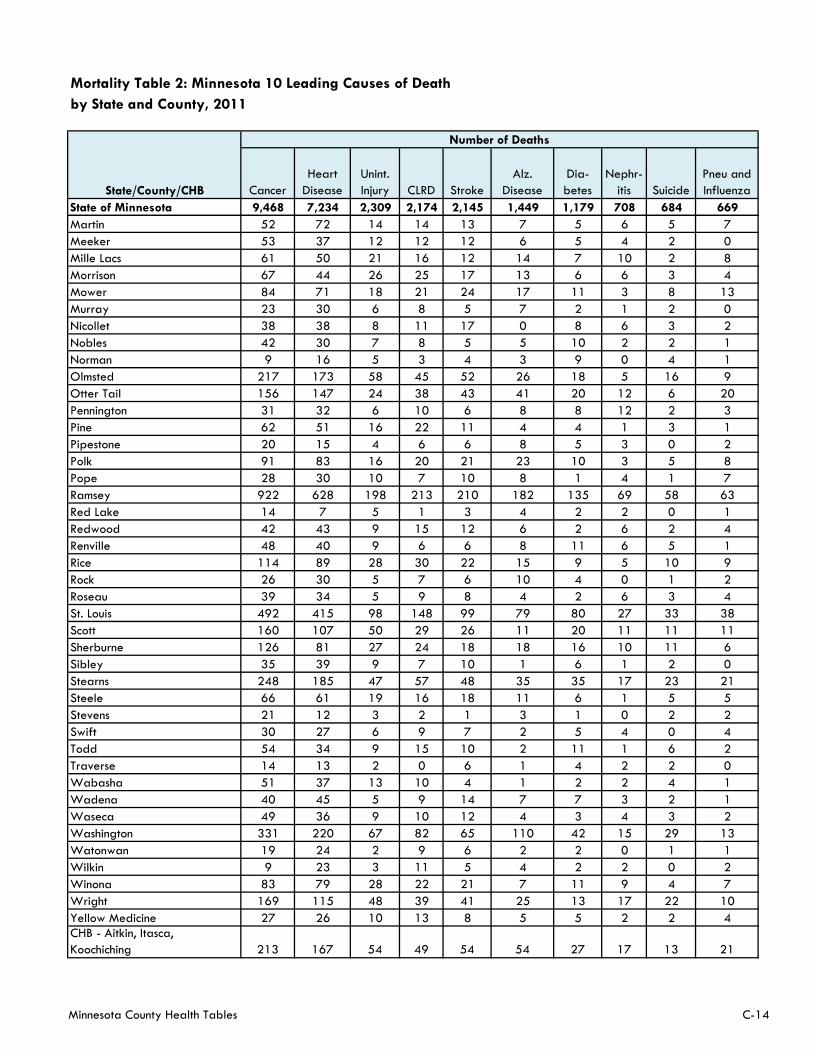
Mortality Table 2: Minnesota 10 Leading Causes of Death
by State and County, 2011
Cancer
Heart
Disease
Unint.
Injury CLRD Stroke
Alz.
Disease
Dia-
betes
Nephr-
itis Suicide
Pneu and
Influenza
State of Minnesota 9,468 7,234 2,309 2,174 2,145 1,449 1,179 708 684 669
State/County/CHB
Number of Deaths
Martin 52 72 14 14 13 7 5 6 5 7
Meeker 53 37 12 12 12 6 5 4 2 0
Mille Lacs 61 50 21 16 12 14 7 10 2 8
Morrison 67 44 26 25 17 13 6 6 3 4
Mower 84 71 18 21 24 17 11 3 8 13
Murray 23 30 6 8 5 7 2 1 2 0
Nicollet 38 38 8 11 17 0 8 6 3 2
Nobles 42 30 7 8 5 5 10 2 2 1
Norman 9 16 5 3 4 3 9 0 4 1
Olmsted 217 173 58 45 52 26 18 5 16 9
Otter Tail 156 147 24 38 43 41 20 12 6 20
Pennington 31 32 6 10 6 8 8 12 2 3
Pine 62 51 16 22 11 4 4 1 3 1
Pipestone 20 15 4 6 6 8 5 3 0 2
Polk 91 83 16 20 21 23 10 3 5 8
Pope 28 30 10 7 10 8 1 4 1 7
Ramsey 922 628 198 213 210 182 135 69 58 63
Red Lake 14 7 5 1 3 4 2 2 0 1
Redwood 42 43 9 15 12 6 2 6 2 4
Renville 48 40 9 6 6 8 11 6 5 1
Rice 114 89 28 30 22 15 9 5 10 9
Rock 26 30 5 7 6 10 4 0 1 2
Roseau 39 34 5 9 8 4 2 6 3 4
St. Louis 492 415 98 148 99 79 80 27 33 38
Scott 160 107 50 29 26 11 20 11 11 11
Sherburne 126 81 27 24 18 18 16 10 11 6
Sibley 35 39 9 7 10 1 6 1 2 0
Stearns 248 185 47 57 48 35 35 17 23 21
Steele 66 61 19 16 18 11 6 1 5 5
Stevens 21 12 3 2 1 3 1 0 2 2
Swift 30 27 6 9 7 2 5 4 0 4
Todd 54 34 9 15 10 2 11 1 6 2
Traverse 14 13 2 0 6 1 4 2 2 0
Wabasha 51 37 13 10 4 1 2 2 4 1
Wadena 40 45 5 9 14 7 7 3 2 1
Waseca 49 36 9 10 12 4 3 4 3 2
Washington 331 220 67 82 65 110 42 15 29 13
Watonwan 19 24 2 9 6 2 2 0 1 1
Wilkin 9 23 3 11 5 4 2 2 0 2
Winona 83 79 28 22 21 7 11 9 4 7
Wright 169 115 48 39 41 25 13 17 22 10
Yellow Medicine 27 26 10 13 8 5 5 2 2 4CHB - Aitkin, Itasca,
Koochiching 213 167 54 49 54 54 27 17 13 21
Minnesota County Health Tables C-14

Mortality Table 2: Minnesota 10 Leading Causes of Death
by State and County, 2011
Cancer
Heart
Disease
Unint.
Injury CLRD Stroke
Alz.
Disease
Dia-
betes
Nephr-
itis Suicide
Pneu and
Influenza
State of Minnesota 9,468 7,234 2,309 2,174 2,145 1,449 1,179 708 684 669
State/County/CHB
Number of Deaths
CHB - Beltrami, Clearwater,
Hubbard, Lake of the Woods 174 138 50 37 36 30 26 9 10 17CHB - Big Stone, Chippewa,
Lac qui Parle, Swift, Yellow 129 140 30 38 35 17 15 11 3 20
CHB - Brown, Nicollet 91 99 24 29 37 8 19 17 5 8CHB - Carlton, Cook, Lake, St.
Louis 593 519 128 170 127 94 92 40 41 40
CHB - Cottonwood, Jackson 51 70 12 10 13 2 8 4 6 11
CHB - Clay, Wilkin 107 108 30 33 30 19 14 14 10 12CHB - Douglas, Grant, Pope,
Stevens, Traverse 149 154 40 34 51 22 26 8 11 20
CHB - Dodge, Steele 95 89 24 25 27 16 6 2 10 6
CHB - Fillmore, Houston 96 92 21 21 35 17 8 7 5 11
CHB - Faribault, Martin 91 117 24 34 27 11 11 8 8 12
CHB - Isanti, Mille Lacs 144 82 44 30 24 21 13 15 4 21CHB - Kittson, Marshall,
Pennington, Red Lake, Roseau 114 103 21 27 29 16 14 23 5 9
CHB - Kanabec, Pine 102 84 25 27 20 7 7 4 6 8
CHB - Kandiyohi, Renville 129 105 30 28 30 20 20 15 16 16CHB - Lincoln, Lyon, Murray,
Pipestone, Redwood, Rock 176 178 36 53 47 44 26 14 11 10
CHB - LeSueur, Waseca 103 69 16 22 25 6 10 9 7 6
CHB - Meeker, McLeod, Sibley 178 138 36 36 51 10 20 9 8 2
CHB - Mahnomen, Norman, Polk 111 108 24 25 28 26 20 5 10 11
CHB - Morrison, Todd, Wadena 161 123 40 49 41 22 24 10 11 7
Source: Minnesota Department of Health, Center for Health Statistics
For more data on deaths in Minnesota go the Minnesota Vital Statistics Interactive Queries Website:
https://pqc.health.state.mn.us/mhsq/index.jspThese are the 10 leading causes of death for Minnesota in 2011, the causes may change from year to year
and are not necessarily the 10 leading causes of death for each county or CHB.
2011 Minnesota Major Causes of Death ICD-10 Codes
Alzheimer’s Disease G30
Cancer [Malignant Neoplasms] C00-C97
CLRD - Chronic Lower Respiratory Disease J40-J47
Diabetes E10-E14
Heart Disease I00-I09, I11, I13, I20-I51
Nephritis N00-N07, N17-N19, N25-N27
Pneumonia & Influenza J10-J18
Stroke [Cerebrovascular Disease] I60-I69
Suicide X60-X84, Y87.0
Unintentional Injury V01-X59, Y85-Y86
Minnesota County Health Tables C-15
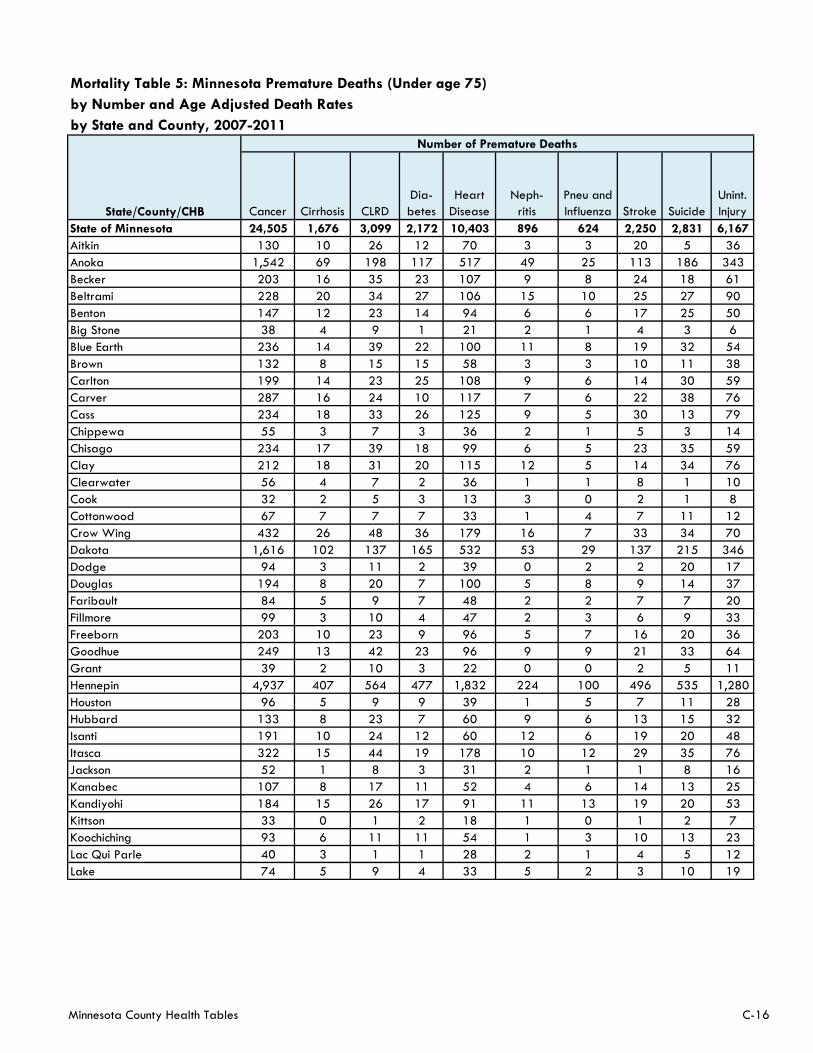
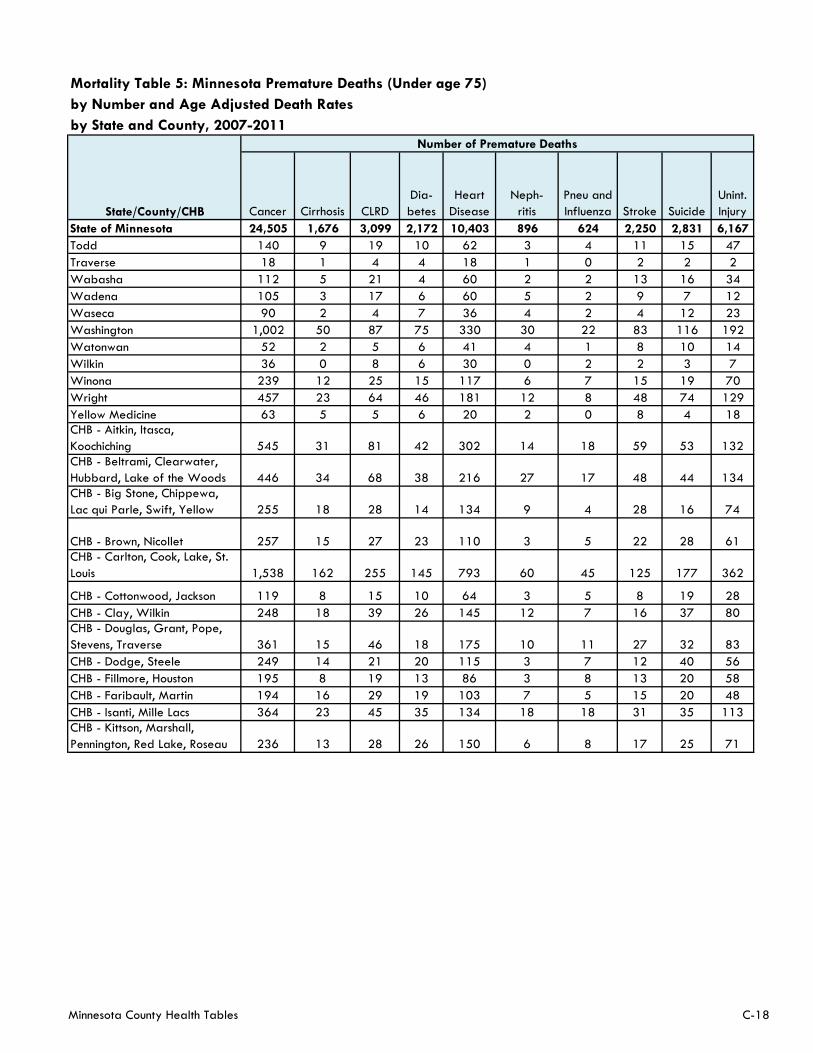
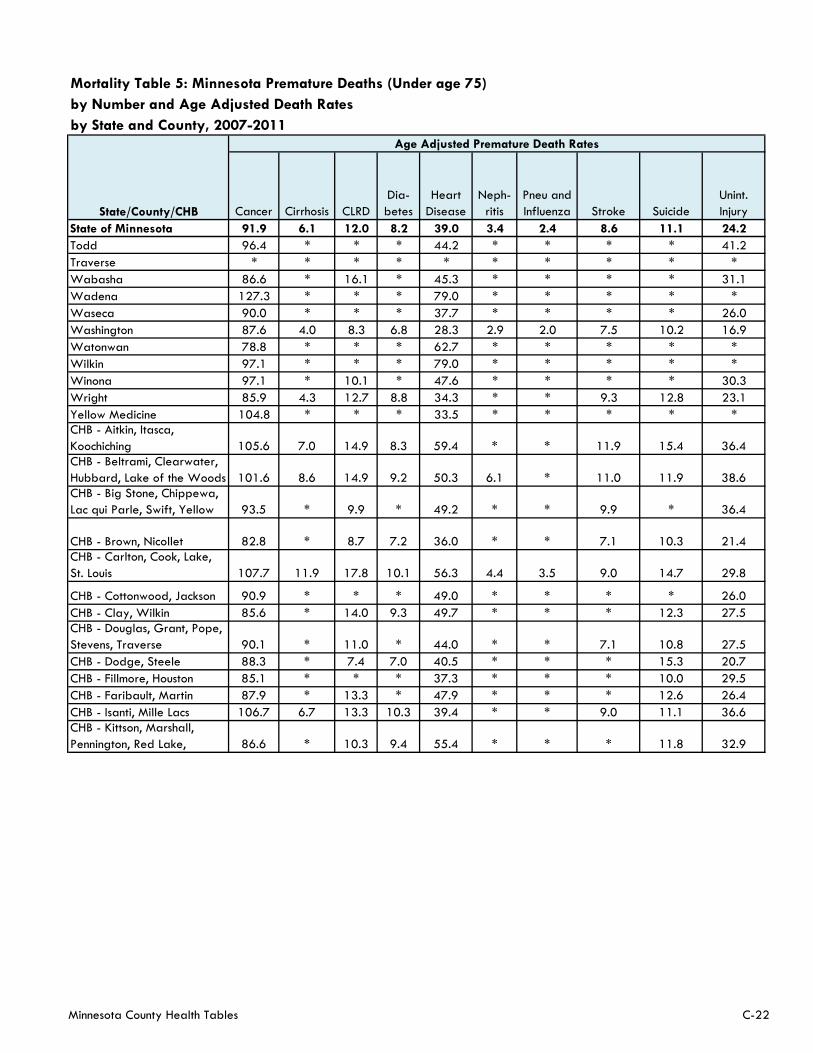
Mortality Table 5: Minnesota Premature Deaths (Under age 75)
by Number and Age Adjusted Death Rates
by State and County, 2007-2011
Cancer Cirrhosis CLRD
Dia-
betes
Heart
Disease
Neph-
ritis
Pneu and
Influenza Stroke Suicide
Unint.
Injury
State of Minnesota 24,505 1,676 3,099 2,172 10,403 896 624 2,250 2,831 6,167
Aitkin 130 10 26 12 70 3 3 20 5 36
Anoka 1,542 69 198 117 517 49 25 113 186 343
Becker 203 16 35 23 107 9 8 24 18 61
Beltrami 228 20 34 27 106 15 10 25 27 90
Benton 147 12 23 14 94 6 6 17 25 50
Big Stone 38 4 9 1 21 2 1 4 3 6
Blue Earth 236 14 39 22 100 11 8 19 32 54
Brown 132 8 15 15 58 3 3 10 11 38
Carlton 199 14 23 25 108 9 6 14 30 59
Carver 287 16 24 10 117 7 6 22 38 76
Cass 234 18 33 26 125 9 5 30 13 79
Chippewa 55 3 7 3 36 2 1 5 3 14
Chisago 234 17 39 18 99 6 5 23 35 59
Clay 212 18 31 20 115 12 5 14 34 76
Clearwater 56 4 7 2 36 1 1 8 1 10
Cook 32 2 5 3 13 3 0 2 1 8
Cottonwood 67 7 7 7 33 1 4 7 11 12
Crow Wing 432 26 48 36 179 16 7 33 34 70
Dakota 1,616 102 137 165 532 53 29 137 215 346
Dodge 94 3 11 2 39 0 2 2 20 17
Douglas 194 8 20 7 100 5 8 9 14 37
Faribault 84 5 9 7 48 2 2 7 7 20
Fillmore 99 3 10 4 47 2 3 6 9 33
Freeborn 203 10 23 9 96 5 7 16 20 36
Goodhue 249 13 42 23 96 9 9 21 33 64
Grant 39 2 10 3 22 0 0 2 5 11
Hennepin 4,937 407 564 477 1,832 224 100 496 535 1,280
Houston 96 5 9 9 39 1 5 7 11 28
Hubbard 133 8 23 7 60 9 6 13 15 32
Isanti 191 10 24 12 60 12 6 19 20 48
Itasca 322 15 44 19 178 10 12 29 35 76
Jackson 52 1 8 3 31 2 1 1 8 16
Kanabec 107 8 17 11 52 4 6 14 13 25
Kandiyohi 184 15 26 17 91 11 13 19 20 53
Kittson 33 0 1 2 18 1 0 1 2 7
Koochiching 93 6 11 11 54 1 3 10 13 23
Lac Qui Parle 40 3 1 1 28 2 1 4 5 12
Lake 74 5 9 4 33 5 2 3 10 19
State/County/CHB
Number of Premature Deaths
Minnesota County Health Tables C-16
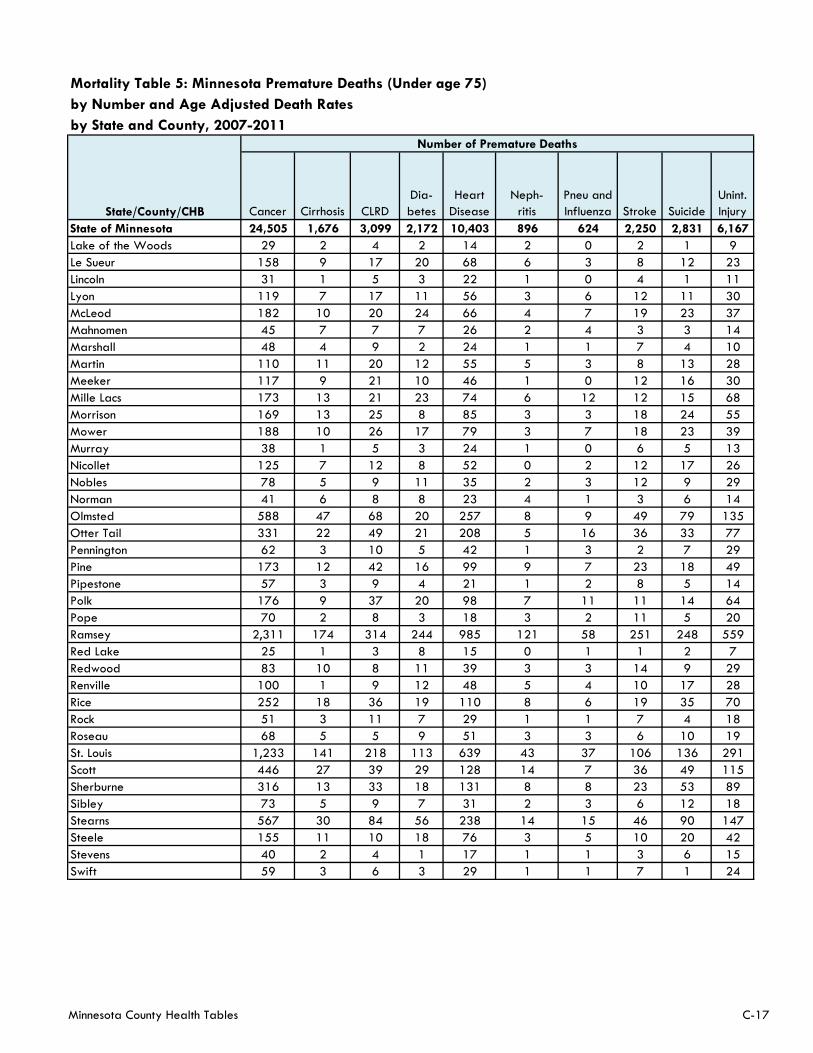
Mortality Table 5: Minnesota Premature Deaths (Under age 75)
by Number and Age Adjusted Death Rates
by State and County, 2007-2011
Cancer Cirrhosis CLRD
Dia-
betes
Heart
Disease
Neph-
ritis
Pneu and
Influenza Stroke Suicide
Unint.
Injury
State of Minnesota 24,505 1,676 3,099 2,172 10,403 896 624 2,250 2,831 6,167
State/County/CHB
Number of Premature Deaths
Lake of the Woods 29 2 4 2 14 2 0 2 1 9
Le Sueur 158 9 17 20 68 6 3 8 12 23
Lincoln 31 1 5 3 22 1 0 4 1 11
Lyon 119 7 17 11 56 3 6 12 11 30
McLeod 182 10 20 24 66 4 7 19 23 37
Mahnomen 45 7 7 7 26 2 4 3 3 14
Marshall 48 4 9 2 24 1 1 7 4 10
Martin 110 11 20 12 55 5 3 8 13 28
Meeker 117 9 21 10 46 1 0 12 16 30
Mille Lacs 173 13 21 23 74 6 12 12 15 68
Morrison 169 13 25 8 85 3 3 18 24 55
Mower 188 10 26 17 79 3 7 18 23 39
Murray 38 1 5 3 24 1 0 6 5 13
Nicollet 125 7 12 8 52 0 2 12 17 26
Nobles 78 5 9 11 35 2 3 12 9 29
Norman 41 6 8 8 23 4 1 3 6 14
Olmsted 588 47 68 20 257 8 9 49 79 135
Otter Tail 331 22 49 21 208 5 16 36 33 77
Pennington 62 3 10 5 42 1 3 2 7 29
Pine 173 12 42 16 99 9 7 23 18 49
Pipestone 57 3 9 4 21 1 2 8 5 14
Polk 176 9 37 20 98 7 11 11 14 64
Pope 70 2 8 3 18 3 2 11 5 20
Ramsey 2,311 174 314 244 985 121 58 251 248 559
Red Lake 25 1 3 8 15 0 1 1 2 7
Redwood 83 10 8 11 39 3 3 14 9 29
Renville 100 1 9 12 48 5 4 10 17 28
Rice 252 18 36 19 110 8 6 19 35 70
Rock 51 3 11 7 29 1 1 7 4 18
Roseau 68 5 5 9 51 3 3 6 10 19
St. Louis 1,233 141 218 113 639 43 37 106 136 291
Scott 446 27 39 29 128 14 7 36 49 115
Sherburne 316 13 33 18 131 8 8 23 53 89
Sibley 73 5 9 7 31 2 3 6 12 18
Stearns 567 30 84 56 238 14 15 46 90 147
Steele 155 11 10 18 76 3 5 10 20 42
Stevens 40 2 4 1 17 1 1 3 6 15
Swift 59 3 6 3 29 1 1 7 1 24
Minnesota County Health Tables C-17
Mortality Table 5: Minnesota Premature Deaths (Under age 75)
by Number and Age Adjusted Death Rates
by State and County, 2007-2011
Cancer Cirrhosis CLRD
Dia-
betes
Heart
Disease
Neph-
ritis
Pneu and
Influenza Stroke Suicide
Unint.
Injury
State of Minnesota 24,505 1,676 3,099 2,172 10,403 896 624 2,250 2,831 6,167
State/County/CHB
Number of Premature Deaths
Todd 140 9 19 10 62 3 4 11 15 47
Traverse 18 1 4 4 18 1 0 2 2 2
Wabasha 112 5 21 4 60 2 2 13 16 34
Wadena 105 3 17 6 60 5 2 9 7 12
Waseca 90 2 4 7 36 4 2 4 12 23
Washington 1,002 50 87 75 330 30 22 83 116 192
Watonwan 52 2 5 6 41 4 1 8 10 14
Wilkin 36 0 8 6 30 0 2 2 3 7
Winona 239 12 25 15 117 6 7 15 19 70
Wright 457 23 64 46 181 12 8 48 74 129
Yellow Medicine 63 5 5 6 20 2 0 8 4 18CHB - Aitkin, Itasca,
Koochiching 545 31 81 42 302 14 18 59 53 132CHB - Beltrami, Clearwater,
Hubbard, Lake of the Woods 446 34 68 38 216 27 17 48 44 134CHB - Big Stone, Chippewa,
Lac qui Parle, Swift, Yellow 255 18 28 14 134 9 4 28 16 74
CHB - Brown, Nicollet 257 15 27 23 110 3 5 22 28 61CHB - Carlton, Cook, Lake, St.
Louis 1,538 162 255 145 793 60 45 125 177 362
CHB - Cottonwood, Jackson 119 8 15 10 64 3 5 8 19 28
CHB - Clay, Wilkin 248 18 39 26 145 12 7 16 37 80CHB - Douglas, Grant, Pope,
Stevens, Traverse 361 15 46 18 175 10 11 27 32 83
CHB - Dodge, Steele 249 14 21 20 115 3 7 12 40 56
CHB - Fillmore, Houston 195 8 19 13 86 3 8 13 20 58
CHB - Faribault, Martin 194 16 29 19 103 7 5 15 20 48
CHB - Isanti, Mille Lacs 364 23 45 35 134 18 18 31 35 113CHB - Kittson, Marshall,
Pennington, Red Lake, Roseau 236 13 28 26 150 6 8 17 25 71
Minnesota County Health Tables C-18
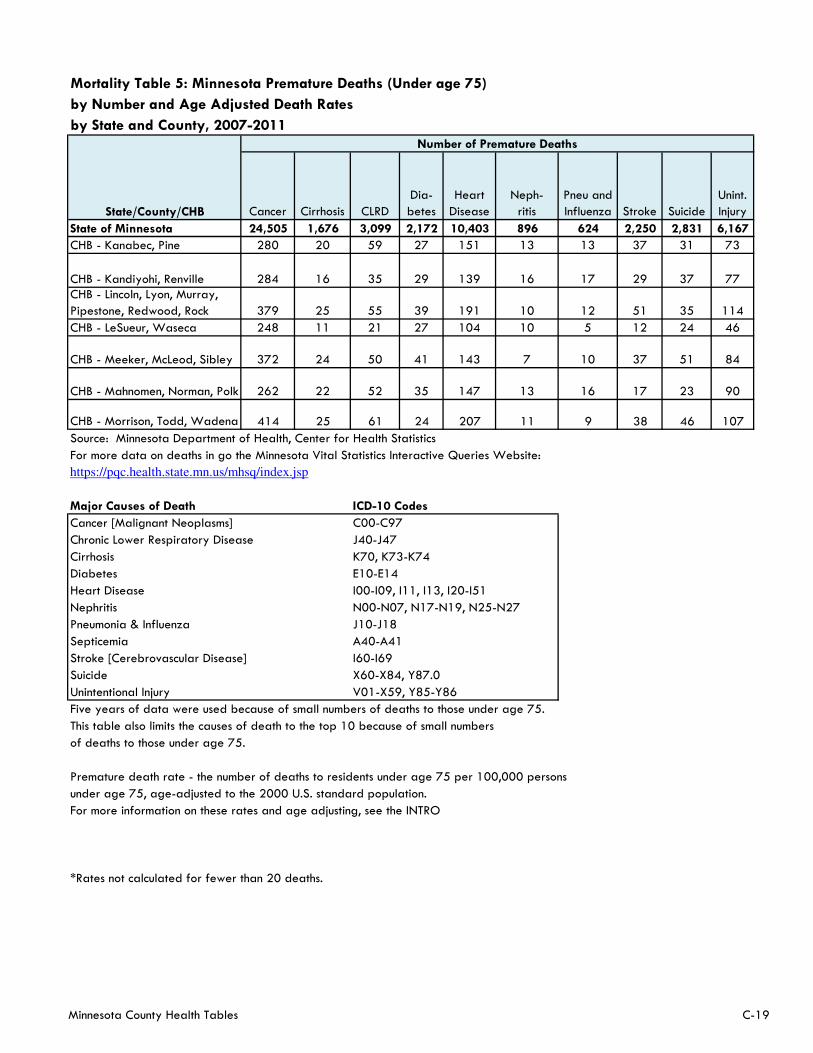
Mortality Table 5: Minnesota Premature Deaths (Under age 75)
by Number and Age Adjusted Death Rates
by State and County, 2007-2011
Cancer Cirrhosis CLRD
Dia-
betes
Heart
Disease
Neph-
ritis
Pneu and
Influenza Stroke Suicide
Unint.
Injury
State of Minnesota 24,505 1,676 3,099 2,172 10,403 896 624 2,250 2,831 6,167
State/County/CHB
Number of Premature Deaths
CHB - Kanabec, Pine 280 20 59 27 151 13 13 37 31 73
CHB - Kandiyohi, Renville 284 16 35 29 139 16 17 29 37 77CHB - Lincoln, Lyon, Murray,
Pipestone, Redwood, Rock 379 25 55 39 191 10 12 51 35 114
CHB - LeSueur, Waseca 248 11 21 27 104 10 5 12 24 46
CHB - Meeker, McLeod, Sibley 372 24 50 41 143 7 10 37 51 84
CHB - Mahnomen, Norman, Polk 262 22 52 35 147 13 16 17 23 90
CHB - Morrison, Todd, Wadena 414 25 61 24 207 11 9 38 46 107
Source: Minnesota Department of Health, Center for Health Statistics
For more data on deaths in go the Minnesota Vital Statistics Interactive Queries Website:
https://pqc.health.state.mn.us/mhsq/index.jsp
Major Causes of Death ICD-10 Codes
Cancer [Malignant Neoplasms] C00-C97
Chronic Lower Respiratory Disease J40-J47
Cirrhosis K70, K73-K74
Diabetes E10-E14
Heart Disease I00-I09, I11, I13, I20-I51
Nephritis N00-N07, N17-N19, N25-N27
Pneumonia & Influenza J10-J18
Septicemia A40-A41
Stroke [Cerebrovascular Disease] I60-I69
Suicide X60-X84, Y87.0
Unintentional Injury V01-X59, Y85-Y86
Five years of data were used because of small numbers of deaths to those under age 75.
This table also limits the causes of death to the top 10 because of small numbers
of deaths to those under age 75.
Premature death rate - the number of deaths to residents under age 75 per 100,000 persons
under age 75, age-adjusted to the 2000 U.S. standard population.
For more information on these rates and age adjusting, see the INTRO
*Rates not calculated for fewer than 20 deaths.
Minnesota County Health Tables C-19
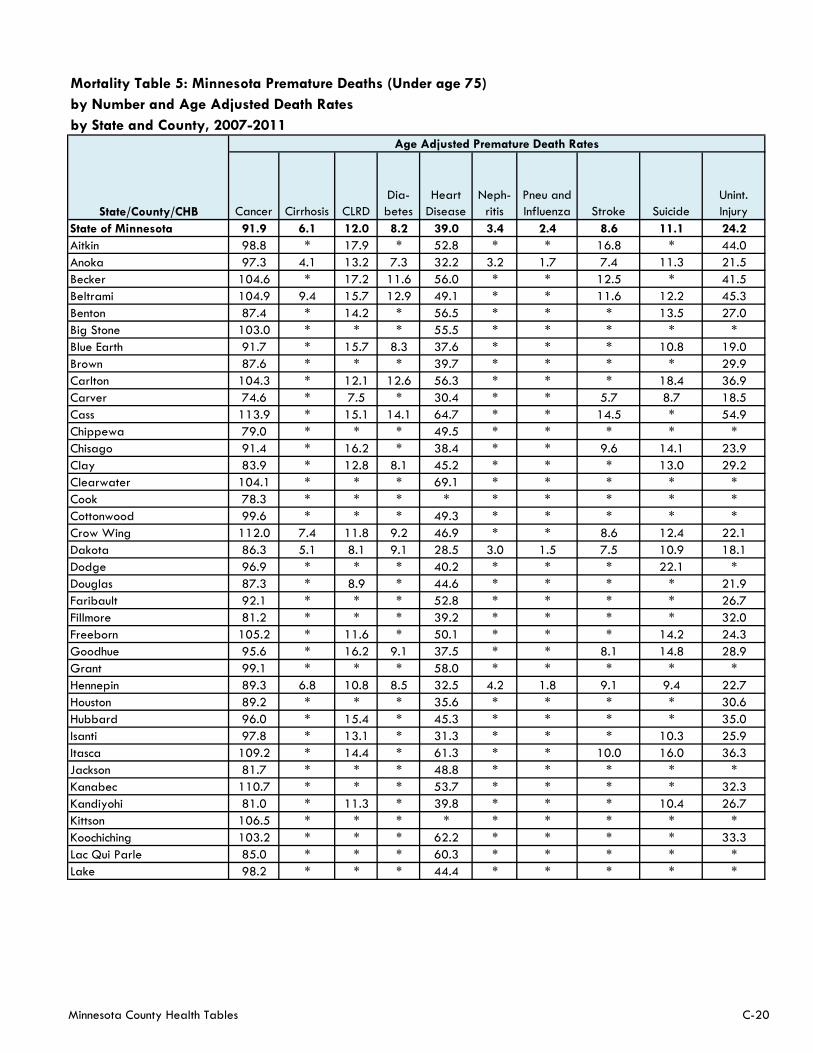
Mortality Table 5: Minnesota Premature Deaths (Under age 75)
by Number and Age Adjusted Death Rates
by State and County, 2007-2011
Cancer Cirrhosis CLRD
Dia-
betes
Heart
Disease
Neph-
ritis
Pneu and
Influenza Stroke Suicide
Unint.
Injury
State of Minnesota 91.9 6.1 12.0 8.2 39.0 3.4 2.4 8.6 11.1 24.2
Aitkin 98.8 * 17.9 * 52.8 * * 16.8 * 44.0
Anoka 97.3 4.1 13.2 7.3 32.2 3.2 1.7 7.4 11.3 21.5
Becker 104.6 * 17.2 11.6 56.0 * * 12.5 * 41.5
Beltrami 104.9 9.4 15.7 12.9 49.1 * * 11.6 12.2 45.3
Benton 87.4 * 14.2 * 56.5 * * * 13.5 27.0
Big Stone 103.0 * * * 55.5 * * * * *
Blue Earth 91.7 * 15.7 8.3 37.6 * * * 10.8 19.0
Brown 87.6 * * * 39.7 * * * * 29.9
Carlton 104.3 * 12.1 12.6 56.3 * * * 18.4 36.9
Carver 74.6 * 7.5 * 30.4 * * 5.7 8.7 18.5
Cass 113.9 * 15.1 14.1 64.7 * * 14.5 * 54.9
Chippewa 79.0 * * * 49.5 * * * * *
Chisago 91.4 * 16.2 * 38.4 * * 9.6 14.1 23.9
Clay 83.9 * 12.8 8.1 45.2 * * * 13.0 29.2
Clearwater 104.1 * * * 69.1 * * * * *
Cook 78.3 * * * * * * * * *
Cottonwood 99.6 * * * 49.3 * * * * *
Crow Wing 112.0 7.4 11.8 9.2 46.9 * * 8.6 12.4 22.1
Dakota 86.3 5.1 8.1 9.1 28.5 3.0 1.5 7.5 10.9 18.1
Dodge 96.9 * * * 40.2 * * * 22.1 *
Douglas 87.3 * 8.9 * 44.6 * * * * 21.9
Faribault 92.1 * * * 52.8 * * * * 26.7
Fillmore 81.2 * * * 39.2 * * * * 32.0
Freeborn 105.2 * 11.6 * 50.1 * * * 14.2 24.3
Goodhue 95.6 * 16.2 9.1 37.5 * * 8.1 14.8 28.9
Grant 99.1 * * * 58.0 * * * * *
Hennepin 89.3 6.8 10.8 8.5 32.5 4.2 1.8 9.1 9.4 22.7
Houston 89.2 * * * 35.6 * * * * 30.6
Hubbard 96.0 * 15.4 * 45.3 * * * * 35.0
Isanti 97.8 * 13.1 * 31.3 * * * 10.3 25.9
Itasca 109.2 * 14.4 * 61.3 * * 10.0 16.0 36.3
Jackson 81.7 * * * 48.8 * * * * *
Kanabec 110.7 * * * 53.7 * * * * 32.3
Kandiyohi 81.0 * 11.3 * 39.8 * * * 10.4 26.7
Kittson 106.5 * * * * * * * * *
Koochiching 103.2 * * * 62.2 * * * * 33.3
Lac Qui Parle 85.0 * * * 60.3 * * * * *
Lake 98.2 * * * 44.4 * * * * *
State/County/CHB
Age Adjusted Premature Death Rates
Minnesota County Health Tables C-20
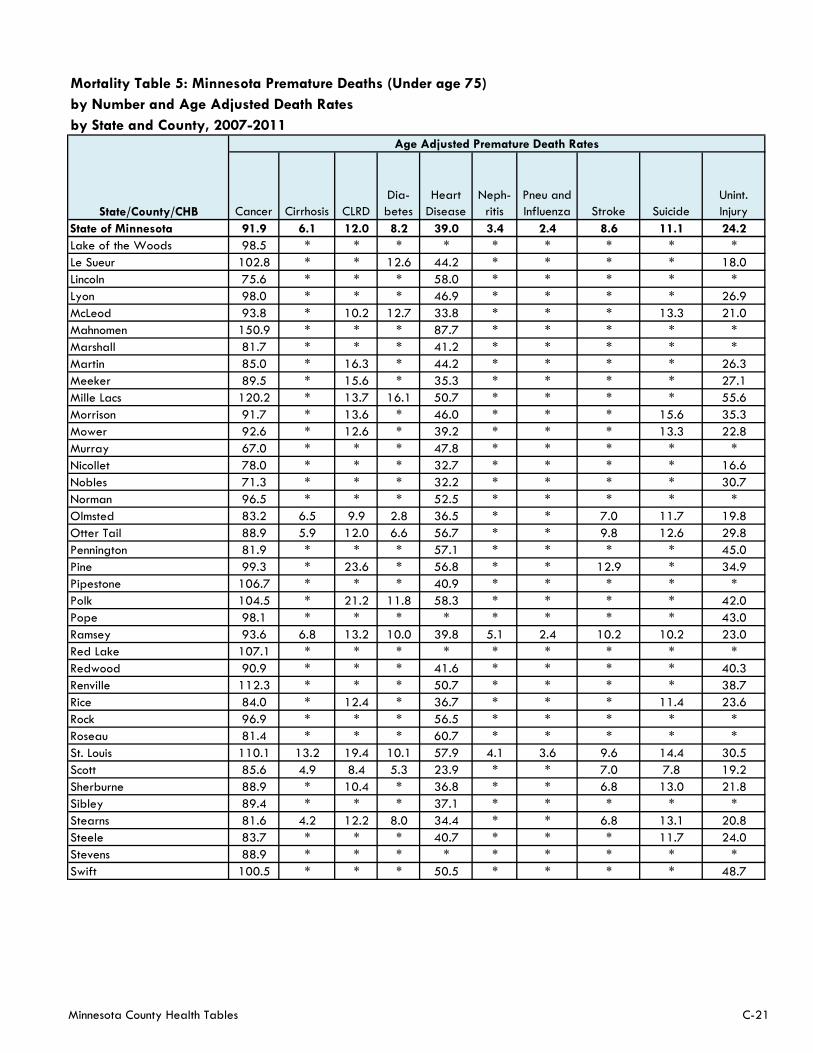
Mortality Table 5: Minnesota Premature Deaths (Under age 75)
by Number and Age Adjusted Death Rates
by State and County, 2007-2011
Cancer Cirrhosis CLRD
Dia-
betes
Heart
Disease
Neph-
ritis
Pneu and
Influenza Stroke Suicide
Unint.
Injury
State of Minnesota 91.9 6.1 12.0 8.2 39.0 3.4 2.4 8.6 11.1 24.2
State/County/CHB
Age Adjusted Premature Death Rates
Lake of the Woods 98.5 * * * * * * * * *
Le Sueur 102.8 * * 12.6 44.2 * * * * 18.0
Lincoln 75.6 * * * 58.0 * * * * *
Lyon 98.0 * * * 46.9 * * * * 26.9
McLeod 93.8 * 10.2 12.7 33.8 * * * 13.3 21.0
Mahnomen 150.9 * * * 87.7 * * * * *
Marshall 81.7 * * * 41.2 * * * * *
Martin 85.0 * 16.3 * 44.2 * * * * 26.3
Meeker 89.5 * 15.6 * 35.3 * * * * 27.1
Mille Lacs 120.2 * 13.7 16.1 50.7 * * * * 55.6
Morrison 91.7 * 13.6 * 46.0 * * * 15.6 35.3
Mower 92.6 * 12.6 * 39.2 * * * 13.3 22.8
Murray 67.0 * * * 47.8 * * * * *
Nicollet 78.0 * * * 32.7 * * * * 16.6
Nobles 71.3 * * * 32.2 * * * * 30.7
Norman 96.5 * * * 52.5 * * * * *
Olmsted 83.2 6.5 9.9 2.8 36.5 * * 7.0 11.7 19.8
Otter Tail 88.9 5.9 12.0 6.6 56.7 * * 9.8 12.6 29.8
Pennington 81.9 * * * 57.1 * * * * 45.0
Pine 99.3 * 23.6 * 56.8 * * 12.9 * 34.9
Pipestone 106.7 * * * 40.9 * * * * *
Polk 104.5 * 21.2 11.8 58.3 * * * * 42.0
Pope 98.1 * * * * * * * * 43.0
Ramsey 93.6 6.8 13.2 10.0 39.8 5.1 2.4 10.2 10.2 23.0
Red Lake 107.1 * * * * * * * * *
Redwood 90.9 * * * 41.6 * * * * 40.3
Renville 112.3 * * * 50.7 * * * * 38.7
Rice 84.0 * 12.4 * 36.7 * * * 11.4 23.6
Rock 96.9 * * * 56.5 * * * * *
Roseau 81.4 * * * 60.7 * * * * *
St. Louis 110.1 13.2 19.4 10.1 57.9 4.1 3.6 9.6 14.4 30.5
Scott 85.6 4.9 8.4 5.3 23.9 * * 7.0 7.8 19.2
Sherburne 88.9 * 10.4 * 36.8 * * 6.8 13.0 21.8
Sibley 89.4 * * * 37.1 * * * * *
Stearns 81.6 4.2 12.2 8.0 34.4 * * 6.8 13.1 20.8
Steele 83.7 * * * 40.7 * * * 11.7 24.0
Stevens 88.9 * * * * * * * * *
Swift 100.5 * * * 50.5 * * * * 48.7
Minnesota County Health Tables C-21
Mortality Table 5: Minnesota Premature Deaths (Under age 75)
by Number and Age Adjusted Death Rates
by State and County, 2007-2011
Cancer Cirrhosis CLRD
Dia-
betes
Heart
Disease
Neph-
ritis
Pneu and
Influenza Stroke Suicide
Unint.
Injury
State of Minnesota 91.9 6.1 12.0 8.2 39.0 3.4 2.4 8.6 11.1 24.2
State/County/CHB
Age Adjusted Premature Death Rates
Todd 96.4 * * * 44.2 * * * * 41.2
Traverse * * * * * * * * * *
Wabasha 86.6 * 16.1 * 45.3 * * * * 31.1
Wadena 127.3 * * * 79.0 * * * * *
Waseca 90.0 * * * 37.7 * * * * 26.0
Washington 87.6 4.0 8.3 6.8 28.3 2.9 2.0 7.5 10.2 16.9
Watonwan 78.8 * * * 62.7 * * * * *
Wilkin 97.1 * * * 79.0 * * * * *
Winona 97.1 * 10.1 * 47.6 * * * * 30.3
Wright 85.9 4.3 12.7 8.8 34.3 * * 9.3 12.8 23.1
Yellow Medicine 104.8 * * * 33.5 * * * * *CHB - Aitkin, Itasca,
Koochiching 105.6 7.0 14.9 8.3 59.4 * * 11.9 15.4 36.4CHB - Beltrami, Clearwater,
Hubbard, Lake of the Woods 101.6 8.6 14.9 9.2 50.3 6.1 * 11.0 11.9 38.6CHB - Big Stone, Chippewa,
Lac qui Parle, Swift, Yellow 93.5 * 9.9 * 49.2 * * 9.9 * 36.4
CHB - Brown, Nicollet 82.8 * 8.7 7.2 36.0 * * 7.1 10.3 21.4CHB - Carlton, Cook, Lake,
St. Louis 107.7 11.9 17.8 10.1 56.3 4.4 3.5 9.0 14.7 29.8
CHB - Cottonwood, Jackson 90.9 * * * 49.0 * * * * 26.0
CHB - Clay, Wilkin 85.6 * 14.0 9.3 49.7 * * * 12.3 27.5CHB - Douglas, Grant, Pope,
Stevens, Traverse 90.1 * 11.0 * 44.0 * * 7.1 10.8 27.5
CHB - Dodge, Steele 88.3 * 7.4 7.0 40.5 * * * 15.3 20.7
CHB - Fillmore, Houston 85.1 * * * 37.3 * * * 10.0 29.5
CHB - Faribault, Martin 87.9 * 13.3 * 47.9 * * * 12.6 26.4
CHB - Isanti, Mille Lacs 106.7 6.7 13.3 10.3 39.4 * * 9.0 11.1 36.6CHB - Kittson, Marshall,
Pennington, Red Lake, 86.6 * 10.3 9.4 55.4 * * * 11.8 32.9
Minnesota County Health Tables C-22
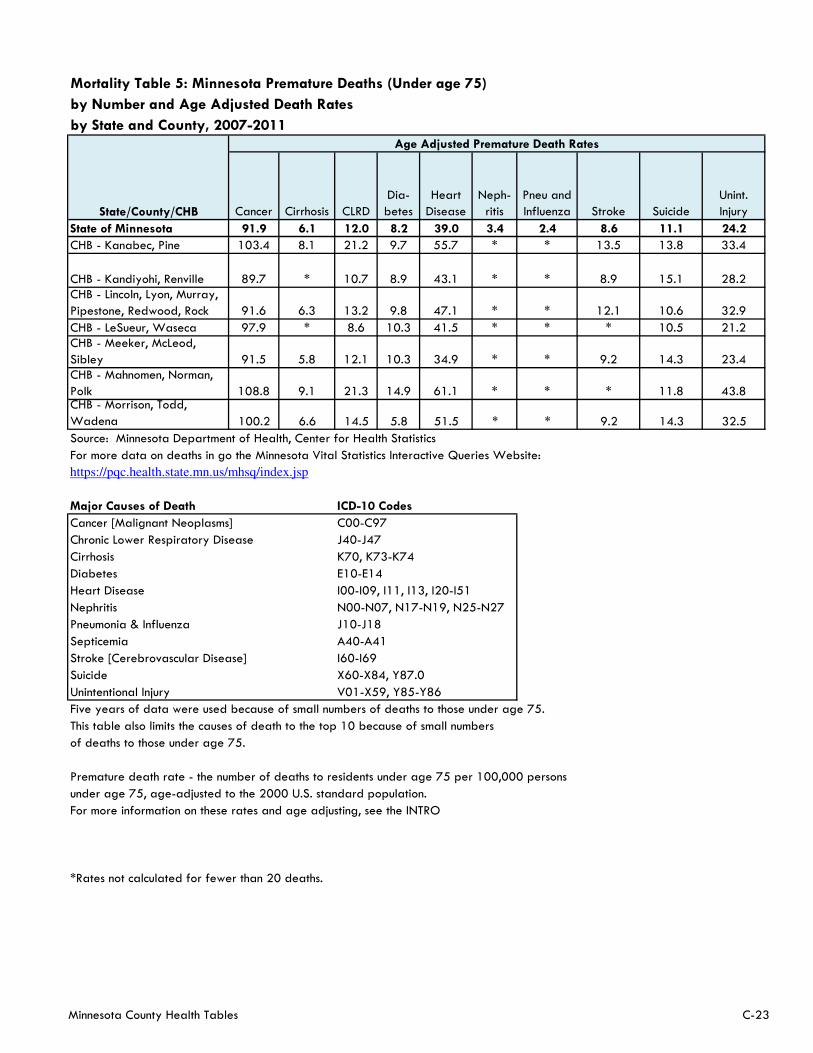
Mortality Table 5: Minnesota Premature Deaths (Under age 75)
by Number and Age Adjusted Death Rates
by State and County, 2007-2011
Cancer Cirrhosis CLRD
Dia-
betes
Heart
Disease
Neph-
ritis
Pneu and
Influenza Stroke Suicide
Unint.
Injury
State of Minnesota 91.9 6.1 12.0 8.2 39.0 3.4 2.4 8.6 11.1 24.2
State/County/CHB
Age Adjusted Premature Death Rates
CHB - Kanabec, Pine 103.4 8.1 21.2 9.7 55.7 * * 13.5 13.8 33.4
CHB - Kandiyohi, Renville 89.7 * 10.7 8.9 43.1 * * 8.9 15.1 28.2CHB - Lincoln, Lyon, Murray,
Pipestone, Redwood, Rock 91.6 6.3 13.2 9.8 47.1 * * 12.1 10.6 32.9
CHB - LeSueur, Waseca 97.9 * 8.6 10.3 41.5 * * * 10.5 21.2CHB - Meeker, McLeod,
Sibley 91.5 5.8 12.1 10.3 34.9 * * 9.2 14.3 23.4CHB - Mahnomen, Norman,
Polk 108.8 9.1 21.3 14.9 61.1 * * * 11.8 43.8CHB - Morrison, Todd,
Wadena 100.2 6.6 14.5 5.8 51.5 * * 9.2 14.3 32.5
Source: Minnesota Department of Health, Center for Health Statistics
For more data on deaths in go the Minnesota Vital Statistics Interactive Queries Website:
https://pqc.health.state.mn.us/mhsq/index.jsp
Major Causes of Death ICD-10 Codes
Cancer [Malignant Neoplasms] C00-C97
Chronic Lower Respiratory Disease J40-J47
Cirrhosis K70, K73-K74
Diabetes E10-E14
Heart Disease I00-I09, I11, I13, I20-I51
Nephritis N00-N07, N17-N19, N25-N27
Pneumonia & Influenza J10-J18
Septicemia A40-A41
Stroke [Cerebrovascular Disease] I60-I69
Suicide X60-X84, Y87.0
Unintentional Injury V01-X59, Y85-Y86
Five years of data were used because of small numbers of deaths to those under age 75.
This table also limits the causes of death to the top 10 because of small numbers
of deaths to those under age 75.
Premature death rate - the number of deaths to residents under age 75 per 100,000 persons
under age 75, age-adjusted to the 2000 U.S. standard population.
For more information on these rates and age adjusting, see the INTRO
*Rates not calculated for fewer than 20 deaths.
Minnesota County Health Tables C-23