Embed Size (px)
Citation preview
Table of Contents 1 Tobacco Use Prevention 7
County Demographics and
Socioeconomic Profile 2 Healthy People 2020 Table 8
Top 10 Leading Causes of Death 2 Health Care Costs Summary 9
Top 10 Leading Causes of Death Table 3 County Health Department Usage 10
Nutrition & Obesity 4 Health Education 11
Physical Activity & Fitness 4 Primary Care Map 11
Diabetes 5 Board of Health Map 12
Teen Births 5 Oklahoma Health Improvement Plan 12
Infant Mortality 6 Reference List 13
Low Birth Weight 6 Turning Point 14
Injury & Violence 7 Contact Information 14
Health is not simply the absence of disease. Health is comprised of our physical, mental,
and social well-being,1 and is influenced by a variety of factors called ‘determinants of
health’.2 These determinants include a range of personal, social, economic, and
environmental factors, such as our genetics, behaviors, and access to health care. The
determinants of health are inter-related; change in one area results in changes in other
areas. As such, interventions and policies that target more than one determinant will
have greater impact on our health.2
Oklahoma has historically ranked poorly in many key health indicators. Most of these
indicators relate to conditions that Oklahomans live with every day, such as poverty and
limited access to primary care. Such conditions, along with risky health behaviors like
smoking and physical inactivity, contribute to the poor health status of Oklahomans.
Recently, Oklahoma has experienced improvement in
some key areas, such as infant health (lower rates of
pre-term births and infant deaths) and smoking (lower
prevalence of adult smokers). The Oklahoma Health
Improvement Plan (OHIP) encourages Oklahomans to
work together across multiple health care systems to
strengthen resources and infrastructure, enabling
sustainable improvements in health status.3 Health is
on the horizon, and together we will Create a State of
Health.
Tulsa County
Spring 2014 Health on the Horizon
Title Tulsa County
County
Sta
te o
f th
e C
ou
nty
’s
Hea
lth
Rep
ort
OK
LA
HO
MA
ST
AT
E
DE
PA
RT
ME
NT
OF
HE
AL
TH
Inside This Issue
The top 10 leading causes of death table on the next page
displays a broad picture of the causes of death in Tulsa County.8
Since many health-related issues are unique to specific ages, this
table provides causes of death by age group at a glance. The
causes of death that are present across almost every age group
have been highlighted.
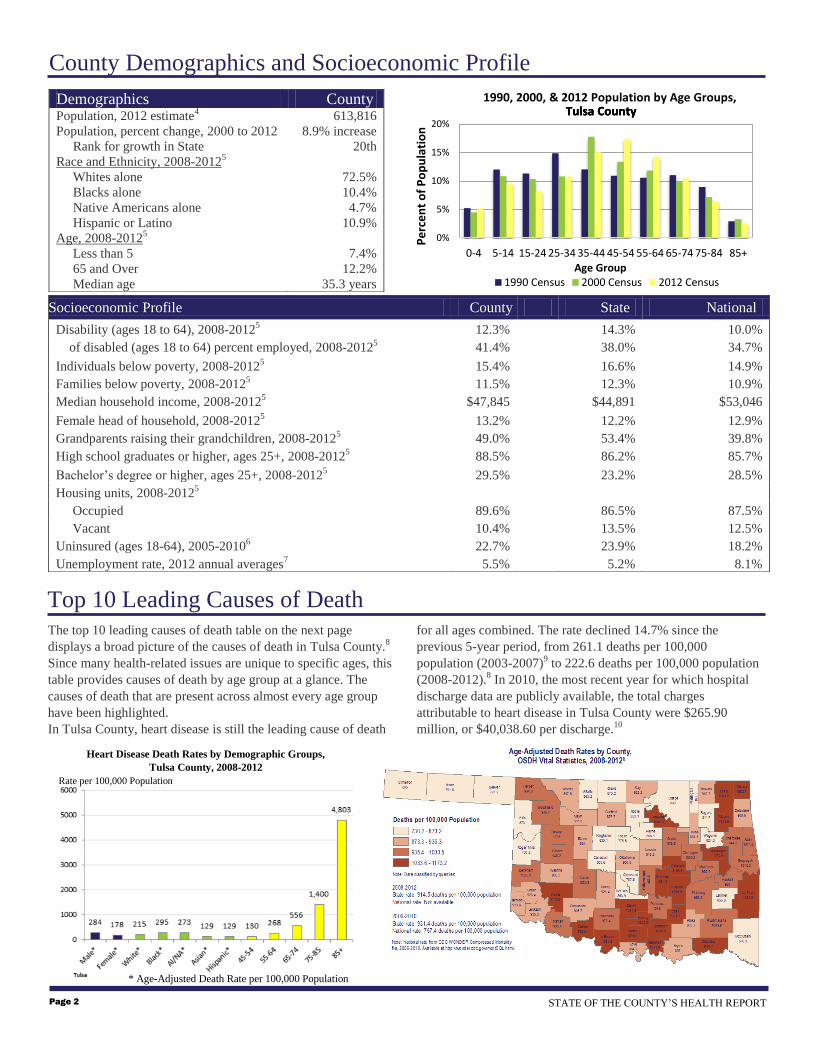
In Tulsa County, heart disease is still the leading cause of death
for all ages combined. The rate declined 14.7% since the
previous 5-year period, from 261.1 deaths per 100,000
population (2003-2007)9 to 222.6 deaths per 100,000 population
(2008-2012).8 In 2010, the most recent year for which hospital
discharge data are publicly available, the total charges
attributable to heart disease in Tulsa County were $265.90
million, or $40,038.60 per discharge.10
Demographics County Population, 2012 estimate
4 613,816
Population, percent change, 2000 to 2012 8.9% increase
Rank for growth in State 20th
Race and Ethnicity, 2008-20125
Whites alone 72.5%
Blacks alone 10.4%
Native Americans alone 4.7%
Hispanic or Latino 10.9%
Age, 2008-20125
Less than 5 7.4%
65 and Over 12.2%
Median age 35.3 years
Socioeconomic Profile
County State National
Disability (ages 18 to 64), 2008-20125 12.3% 14.3% 10.0%
of disabled (ages 18 to 64) percent employed, 2008-20125 41.4% 38.0% 34.7%
Individuals below poverty, 2008-20125 15.4% 16.6% 14.9%
Families below poverty, 2008-20125
11.5% 12.3% 10.9%
Median household income, 2008-20125 $47,845 $44,891 $53,046
Female head of household, 2008-20125 13.2% 12.2% 12.9%
Grandparents raising their grandchildren, 2008-20125 49.0% 53.4% 39.8%
High school graduates or higher, ages 25+, 2008-20125 88.5% 86.2% 85.7%
Bachelor’s degree or higher, ages 25+, 2008-20125 29.5% 23.2% 28.5%
Housing units, 2008-20125
Occupied 89.6% 86.5% 87.5%
Vacant 10.4% 13.5% 12.5%
Uninsured (ages 18-64), 2005-20106 22.7% 23.9% 18.2%
Unemployment rate, 2012 annual averages7 5.5% 5.2% 8.1%
County Demographics and Socioeconomic Profile
Heart Disease Death Rates by Demographic Groups,
Tulsa County, 2008-2012
Rate per 100,000 Population
* Age-Adjusted Death Rate per 100,000 Population
STATE OF THE COUNTY’S HEALTH REPORT Page 2
Top 10 Leading Causes of Death
0%
5%
10%
15%
20%
0-4 5-14 15-24 25-34 35-44 45-54 55-64 65-74 75-84 85+
Pe
rce
nt
of
Po
pu
lati
on
Age Group
1990, 2000, & 2012 Population by Age Groups,
1990 Census 2000 Census 2012 Census
Tulsa CountyTulsa CountyTulsa County

RANK 0-4 05-14 15-24 25-34 35-44 45-54 55-64 65+ ALL AGES
1
PERINATAL
PERIOD
146
UNINTENT.
INJURY
28
UNINTENT.
INJURY
167
UNINTENT.
INJURY
235
UNINTENT.
INJURY
236
HEART DISEASE
540
CANCER
1191
HEART DISEASE
5243
HEART DISEASE
6908
2
CONGENITAL
ANOMALIES
85
CONGENITAL
ANOMALIES
6
HOMICIDE
80
SUICIDE
96
HEART DISEASE
140
CANCER
508
HEART DISEASE
921
CANCER
3793
CANCER
5681
3
UNINTENT.
INJURY
28
CANCER
6
SUICIDE
70
HOMICIDE
77
SUICIDE
120
UNINTENT.
INJURY
299
BRONCHITIS/
EMPHYSEMA/
ASTHMA
232
BRONCHITIS/
EMPHYSEMA/
ASTHMA
1430
BRONCHITIS/
EMPHYSEMA/
ASTHMA
1764
4
CANCER
11
SUICIDE
5
CANCER
22
HEART DISEASE
42
CANCER
110
SUICIDE
112
UNINTENT.
INJURY
204
STROKE
1312
UNINTENT.
INJURY
1650
5
HEART DISEASE
7
OTHER CAUSES*
33
HEART DISEASE
12
CANCER
40
HOMICIDE
43
LIVER DISEASE
91
STROKE
159
ALZHEIMER'S
DISEASE
782
STROKE
1589
6
HOMICIDE
7
CONGENITAL
ANOMALIES
5
DIABETES
MELLITUS
13
LIVER DISEASE
34
BRONCHITIS/
EMPHYSEMA/
ASTHMA
84
LIVER DISEASE
125
INFLUENZA/
PNEUMONIA
453
ALZHEIMER'S
DISEASE
796
7
OTHER CAUSES*
119
OTHER CAUSES*
73
LIVER DISEASE
10
STROKE
28
STROKE
77
DIABETES
MELLITUS
95
UNINTENT.
INJURY
453
DIABETES
MELLITUS
582
8
STROKE
10
DIABETES
MELLITUS
19
VIRAL
HEPATITIS
50
SUICIDE
85
DIABETES
MELLITUS
408
INFLUENZA/
PNEUMONIA
563
9
THREE CAUSES
TIED
6
HIV
19
DIABETES
MELLITUS
43
INFLUENZA/
PNEUMONIA
54
NEPHRITIS
328
SUICIDE
555
10
INFLUENZA/
PNEUMONIA
14
HOMICIDE
41
VIRAL
HEPATITIS
47
HYPERTENSION
229
NEPHRITIS
371
Top 10 Causes of Death by Age Group
Tulsa County 2008-2012
Page 3 TULSA COUNTY
* Total deaths per age group were determined; cause of death was ordered (by frequency) when 5 or more deaths occurred for a specific cause;
and the number of deaths that occurred in frequencies fewer than 5 per cause were grouped together as “OTHER CAUSES.” Specific causes
could not be determined for those deaths in “OTHER CAUSES” because the data are suppressed on OK2SHARE (the source of this data) when
there are fewer than 5 deaths per search category.
Data source: Vital Statistics, Health Care Information Division, Oklahoma State Department of Health Produced by: Community Epidemiology and Evaluation, Oklahoma State Department of Health
Poor diet is a primary cause of adult deaths in the U.S.11
Poor diet can be characterized in many different ways, but a
common proxy measure of poor diet is assessing fruit and vegetable consumption. A recent study determined that fruit
and vegetable consumption is associated with reduced risk of death.12
Oklahoma has typically ranked as one of the worst
states for fruit and vegetable consumption among adults.
In 2009, the last year data were available for every state,
Oklahoma ranked last in consuming 5 or more daily
servings of fruits and vegetables.13
In Tulsa County,
16.4% of adults consumed the recommended servings of
fruits and vegetables daily.6
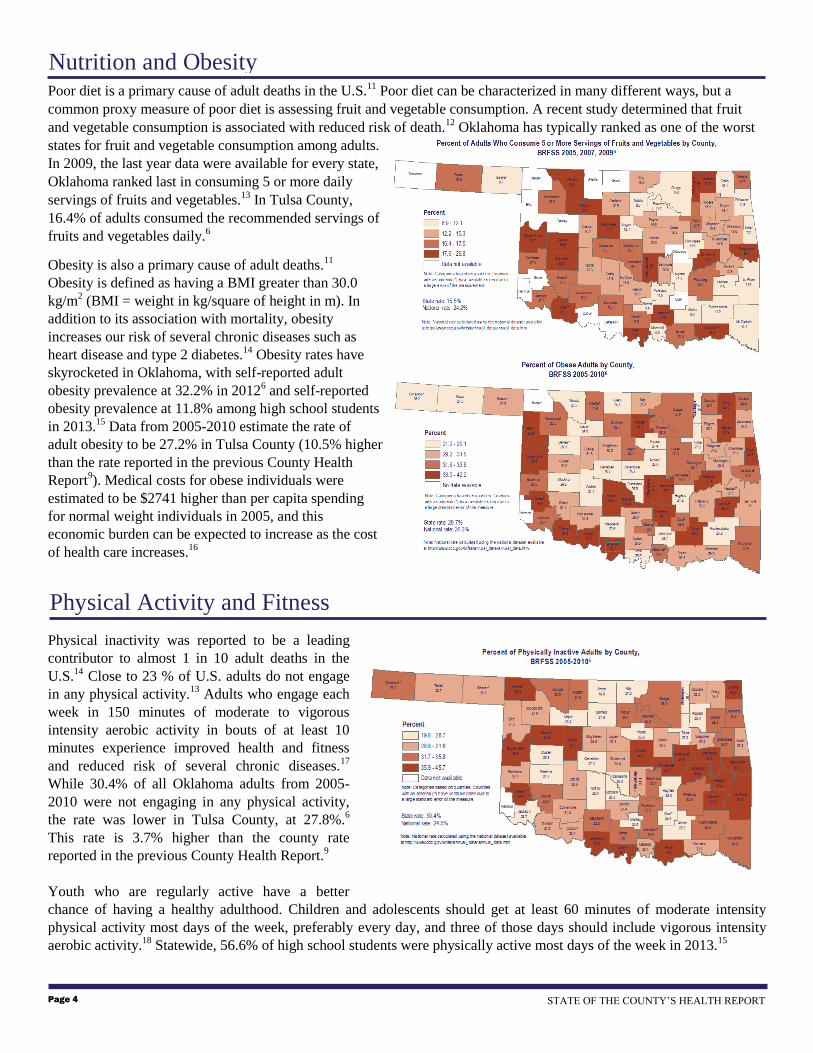
Obesity is also a primary cause of adult deaths.11
Obesity is defined as having a BMI greater than 30.0
kg/m2 (BMI = weight in kg/square of height in m). In
addition to its association with mortality, obesity
increases our risk of several chronic diseases such as
heart disease and type 2 diabetes.14
Obesity rates have
skyrocketed in Oklahoma, with self-reported adult
obesity prevalence at 32.2% in 20126 and self-reported
obesity prevalence at 11.8% among high school students
in 2013.15
Data from 2005-2010 estimate the rate of
adult obesity to be 27.2% in Tulsa County (10.5% higher
than the rate reported in the previous County Health
Report9). Medical costs for obese individuals were
estimated to be $2741 higher than per capita spending
for normal weight individuals in 2005, and this
economic burden can be expected to increase as the cost
of health care increases.16
Physical inactivity was reported to be a leading
contributor to almost 1 in 10 adult deaths in the
U.S.14
Close to 23 % of U.S. adults do not engage
in any physical activity.13
Adults who engage each
week in 150 minutes of moderate to vigorous
intensity aerobic activity in bouts of at least 10
minutes experience improved health and fitness
and reduced risk of several chronic diseases.17
While 30.4% of all Oklahoma adults from 2005-
2010 were not engaging in any physical activity,
the rate was lower in Tulsa County, at 27.8%.6
This rate is 3.7% higher than the county rate
reported in the previous County Health Report.9
Youth who are regularly active have a better
chance of having a healthy adulthood. Children and adolescents should get at least 60 minutes of moderate intensity
physical activity most days of the week, preferably every day, and three of those days should include vigorous intensity
aerobic activity.18
Statewide, 56.6% of high school students were physically active most days of the week in 2013.15
Nutrition and Obesity
Physical Activity and Fitness
STATE OF THE COUNTY’S HEALTH REPORT Page 4
Type II Diabetes Mellitus is a chronic disease characterized by high levels of sugar (i.e., glucose) in the bloodstream due
to the body’s resistance to insulin. If left untreated, serious complications can arise, including heart disease, renal failure,
retinopathy, and neuropathies. Several risk factors may increase the likelihood of developing diabetes. Some of these risk
factors cannot be changed (eg., aged 45 years and older, family history). Other risk factors relate to our behaviors, such as
prediabetes, overweight/obesity, being physically inactive, and having high blood pressure.19
The prevalence of diabetes has been on the rise in Oklahoma. Slightly more than 10% of Oklahoma adults from 2005-
2010 had been told by a health professional that they had diabetes.6 During this same time frame in Tulsa County, 9.3% of
adults had diabetes,6 which is a little more than the 8.7% of adults cited in the previous County Health Report.
9
The American Diabetes Association released
a report estimating the total cost of
diagnosed diabetes to be $245 billion in the
U.S. in 2012.20
This amount includes both
direct medical costs and reduced
productivity. They estimated the largest
component of direct medical costs to be
hospital inpatient care. In Tulsa County,
there were 1,224 hospital discharges
attributable to diabetes in 2010, the most
recent year that hospital data is available.10
This amounted to $27,120,464.00 in total
charges in 2010 alone, or 1.5% of total
hospitalization charges in the county.10
Although births to teen mothers have been declining in recent years,21
Oklahoma still has one of the highest teen birth
rates in the country,22
including a high rate of repeat births.23
Pregnant teens are more likely than older pregnant females to
experience medical complications, have low educational attainment, and engage in unhealthy behaviors that put their
unborn child at risk.24
Children of teen mothers are more likely than children of older mothers to display poor health and
social outcomes, such as premature birth, low birth weight, behavioral problems, and abuse and neglect.22
Additionally,
infant mortality rates are highest for babies of teen mothers.25
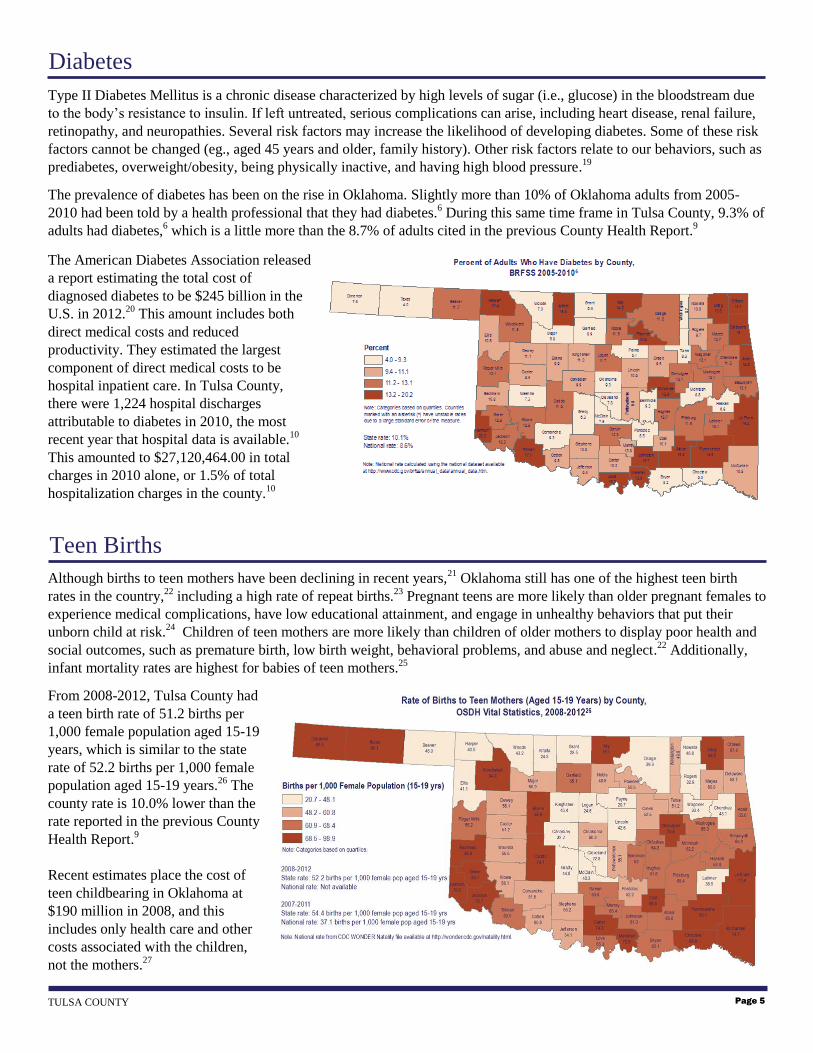
From 2008-2012, Tulsa County had
a teen birth rate of 51.2 births per
1,000 female population aged 15-19
years, which is similar to the state
rate of 52.2 births per 1,000 female
population aged 15-19 years.26
The
county rate is 10.0% lower than the
rate reported in the previous County
Health Report.9
Recent estimates place the cost of
teen childbearing in Oklahoma at
$190 million in 2008, and this
includes only health care and other
costs associated with the children,
not the mothers.27
Teen Births
Page 5 TULSA COUNTY
Diabetes

The infant mortality rate (IMR) is an important indicator of the health of a nation, and is also a reflection of maternal
health, accessibility and quality of primary health care, and the availability of supportive services in the community.28
The
leading causes of infant death include congenital malformations (i.e., medical conditions present at birth), disorders
related to short gestation (fewer than 37 weeks of pregnancy completed) and low birth weight (less than 5 lbs., 8 oz.), and
Sudden Infant Death Syndrome (SIDS).25
Oklahoma’s IMR has declined 12.8% from its recent high of 8.6 deaths per
1,000 live births in 2006 to 7.5 deaths per 1,000 live births in 2012.8 However, the rate is still significantly higher than the
national (preliminary) rate of 6.05 infant deaths per 1,000 live births in 2011.29
While organizations across Oklahoma
have been working together to reduce infant mortality as part of the Preparing for a Lifetime, It’s Everyone’s
Responsibility initiative,30
there is still much work to do.
Racial disparities exist in IMR, with rates among Oklahoma’s Black/African American infants being more than double the
rates of White and Asian/Pacific Island infants. The IMR for Black/African American infants declined between 2003-
2007 and 2008-2012 (16.4 to 14.6, respectively),8 but is still extremely high.
From 2008-2012, the overall IMR for Tulsa County was 7.3 deaths per 1,000 live births.8 This rate is similar to the state
rate of 7.5 deaths per 1,000 live births8 and
9% lower than the county rate from 2002-
2006.9 The IMR in Tulsa County accounted
for 25,725 years of potential life lost based
on an average age of death in Oklahoma of
75 years.8
Receiving timely prenatal care is believed to
reduce the risk of maternal and infant
sickness and death as well as preterm
delivery and low birth weight. From 2008-
2012, 62.7% of women who had a live birth
in Tulsa County accessed prenatal care
during the first trimester of their
pregnancy.26
Low birth weight and preterm births together are the second leading cause of death among children less than 1 year of
age.25
Low birth weight infants are more at risk of health problems compared to infants born of normal weight, including
infection, gastrointestinal problems, delayed motor and social development, and learning disabilities. Low birth weight
infants may also be at higher risk of high blood pressure, diabetes, and heart disease later in life.31
The percentage of Oklahoma babies born at low
birth weight (i.e., weighing fewer than 5 pounds
and 8 ounces, or 2500 grams) was 8.3% across
2008-2012.26
This rate is similar to the latest
national data (8.2% from 2007-2011).32
In Tulsa County, the rate of low birth weight
births was 9.0% from 2008-2012,26
which is
10% higher than the rate from 2003-2007.26
As is seen with infant mortality, the percentage
of low birth weight births is higher for
Black/African American babies (14.1%) than
babies of other races (White: 7.8%; American
Indian: 7.3%; Asian/Pacific Island: 7.4%).26
Infant Mortality
Low Birth Weight
STATE OF THE COUNTY’S HEALTH REPORT Page 6

Unintentional injury is the 4th leading cause of death in Oklahoma, and the leading cause of death among individuals aged
5-44 years.8 In 2010, the most recent year that data are publicly available, injuries accounted for almost $1.4 billion of
Oklahoma’s hospital inpatient charges, or almost $34,000 per discharge.10
This equates to more than 10% of total
inpatient charges in 2010,10
and does not consider other related medical expenses or lost productivity.
In Tulsa County, unintentional injury is the 4th leading cause of death at 54.5 deaths per 100,000 population.8 The county
rate is slightly higher than the rate of 50.6 which was reported in the previous County Health Report.9 The current rate is a
little lower than the state rate of 58.7 deaths per 100,000 population.8
Motor-vehicle accidents account for 26% of Tulsa County’s unintentional injury deaths per 100,000 population, resulting
in an estimated cost of $609.2 million in 2011.
This cost includes wage and productivity losses,
medical expenses, administrative expenses,
motor vehicle damage, and employers’
uninsured costs ($1.42 million per death).33
Violence-related deaths (suicide and homicide)
are also leading causes of death in Oklahoma.8
Tulsa County’s homicide rate of 9.1 deaths per
100,000 population is 38% higher than the state
rate of 6.6 deaths per 100,000 population, and
the suicide rate of 18.6 deaths per 100,000
population is 12% higher than the state rate of
16.6 deaths per 100,000 population.8
While smoking rates continue to decline in the United States, tobacco is still the leading contributor of preventable deaths
in the United States, resulting in 80-90% of lung cancer deaths, 90% of deaths from chronic lower respiratory disease, and
increasing risk of coronary heart disease and stroke deaths.34
Oklahoma has consistently had one of the highest rates of
adult smoking in the country, with an estimated 23.3% of Oklahoma adults being smokers in 2012.6 While this rate is
higher than the national rate of 19.6%,13
it represents a significant decline from Oklahoma’s 2011 rate of 26.1%.6 Total
cigarette sales have remained stable the last three years (at about 71 packs per capita, each year from 2010 through
2012),35
but have declined from 86.7 packs per capita in 2008 that was reported in the previous County Health Report.9
Across 2005-2010 in Tulsa County, 23.7% of adults were smokers.6 This is similar to the percentage of adult smokers
reported in the previous County Health Report9 and
is 5% less than the state rate of 25.0% across the
same time period. Health care costs associated with
smoking were approximately $1,927.8 million in
Tulsa County.36
Of concern are other types of tobacco use, such as
smokeless tobacco and now e-cigarettes. Almost
7% of Oklahoma adults use smokeless tobacco
products (6.9% in 2011 and 6.7% in 2012), with
almost 70% of smokeless tobacco users also being
smokers. Data is still being gathered about e-
cigarettes, but their usage has increased among
adults as well as middle and high school students
nationally.37,38
Injury and Violence
Tobacco Use Prevention
Page 7 TULSA COUNTY
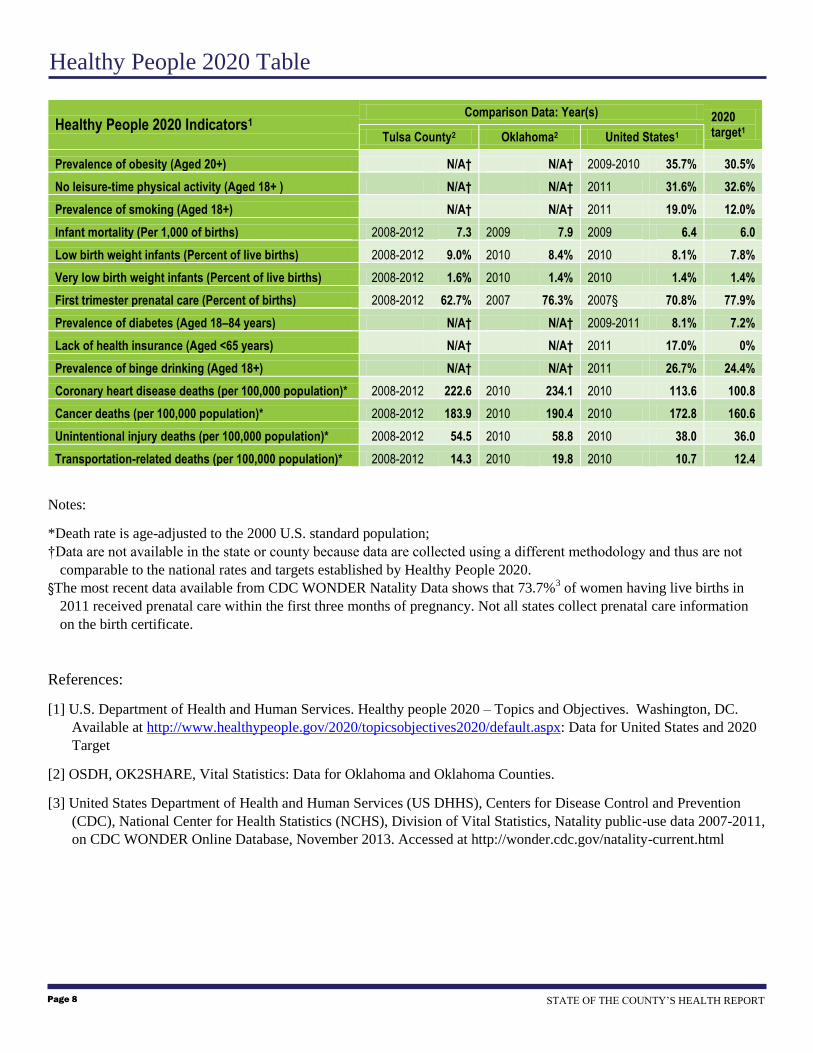
Healthy People 2020 Indicators1 Comparison Data: Year(s) 2020
target1 Tulsa County2 Oklahoma2 United States1
Prevalence of obesity (Aged 20+) N/A† N/A† 2009-2010 35.7% 30.5%
No leisure-time physical activity (Aged 18+ ) N/A† N/A† 2011 31.6% 32.6%
Prevalence of smoking (Aged 18+) N/A† N/A† 2011 19.0% 12.0%
Infant mortality (Per 1,000 of births) 2008-2012 7.3 2009 7.9 2009 6.4 6.0
Low birth weight infants (Percent of live births) 2008-2012 9.0% 2010 8.4% 2010 8.1% 7.8%
Very low birth weight infants (Percent of live births) 2008-2012 1.6% 2010 1.4% 2010 1.4% 1.4%
First trimester prenatal care (Percent of births) 2008-2012 62.7% 2007 76.3% 2007§ 70.8% 77.9%
Prevalence of diabetes (Aged 18–84 years) N/A† N/A† 2009-2011 8.1% 7.2%
Lack of health insurance (Aged <65 years) N/A† N/A† 2011 17.0% 0%
Prevalence of binge drinking (Aged 18+) N/A† N/A† 2011 26.7% 24.4%
Coronary heart disease deaths (per 100,000 population)* 2008-2012 222.6 2010 234.1 2010 113.6 100.8
Cancer deaths (per 100,000 population)* 2008-2012 183.9 2010 190.4 2010 172.8 160.6
Unintentional injury deaths (per 100,000 population)* 2008-2012 54.5 2010 58.8 2010 38.0 36.0
Transportation-related deaths (per 100,000 population)* 2008-2012 14.3 2010 19.8 2010 10.7 12.4
Notes:
*Death rate is age-adjusted to the 2000 U.S. standard population;
†Data are not available in the state or county because data are collected using a different methodology and thus are not
comparable to the national rates and targets established by Healthy People 2020.
§The most recent data available from CDC WONDER Natality Data shows that 73.7%3 of women having live births in
2011 received prenatal care within the first three months of pregnancy. Not all states collect prenatal care information
on the birth certificate.
References:
[1] U.S. Department of Health and Human Services. Healthy people 2020 – Topics and Objectives. Washington, DC.
Available at http://www.healthypeople.gov/2020/topicsobjectives2020/default.aspx: Data for United States and 2020
Target
[2] OSDH, OK2SHARE, Vital Statistics: Data for Oklahoma and Oklahoma Counties.
[3] United States Department of Health and Human Services (US DHHS), Centers for Disease Control and Prevention
(CDC), National Center for Health Statistics (NCHS), Division of Vital Statistics, Natality public-use data 2007-2011,
on CDC WONDER Online Database, November 2013. Accessed at http://wonder.cdc.gov/natality-current.html
Healthy People 2020 Table
STATE OF THE COUNTY’S HEALTH REPORT Page 8

Cardiovascular Disease (Heart Disease)
Average hospital discharges in 2010 = 6641
Average charges = $40,038.60 per discharge
Total—$265,896,362 in 2010
Obesity
27.2% of adult population (122,115) from 2005-
2010
$2,741.00 in additional medical costs per person
aged 18 and over
Total—$458,111,882 in 2010
Diabetes
Average hospital discharges in 2010 = 1,224
Average charges = $22,157.24 per discharge
Total—$27,120,464 in 2010
Health Care Cost Summary
Teen Pregnancy
5,139 births to females aged 15-19 from 2008-
2012
$3,807 in costs per year
Total—$3,912,073 in 2010
Motor Vehicle-Related Injury Death
429 deaths from 2008-2012
$1,420,000.00 in economic costs per death
Total—$121,836,000 in 2010
Tobacco Use
23.7% of adult population (584,175) from
2005-2010
$3,300 in health care costs per person
Total—$480,569,166 in 2010
Total Annual Cost* for
Tulsa County:
$1,357,445,947
Page 9 TULSA COUNTY
*Total cost is the minimum cost to the county for health care
related spending for the causes listed above in 2010. Other
health maladies, and costs unaccounted for in this report may
increase the total annual cost per county.
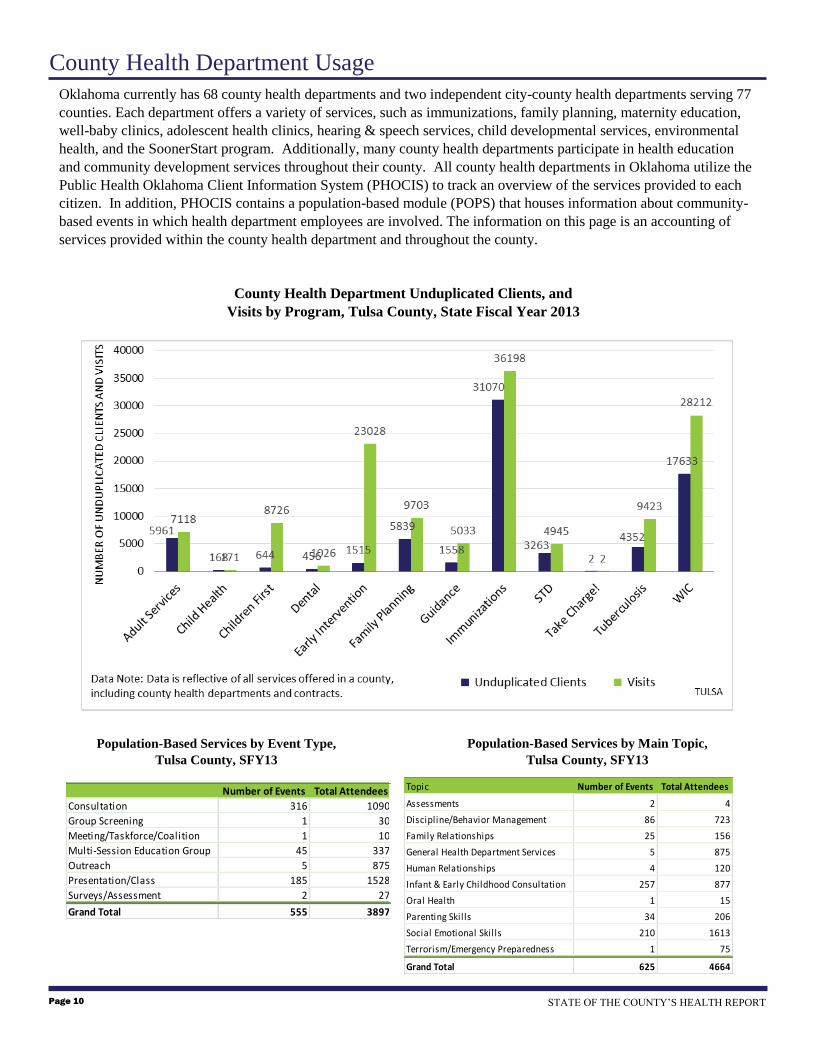
County Health Department Usage
County Health Department Unduplicated Clients, and
Visits by Program, Tulsa County, State Fiscal Year 2013
Population-Based Services by Event Type,
Tulsa County, SFY13
Population-Based Services by Main Topic,
Tulsa County, SFY13
STATE OF THE COUNTY’S HEALTH REPORT Page 10
Oklahoma currently has 68 county health departments and two independent city-county health departments serving 77
counties. Each department offers a variety of services, such as immunizations, family planning, maternity education,
well-baby clinics, adolescent health clinics, hearing & speech services, child developmental services, environmental
health, and the SoonerStart program. Additionally, many county health departments participate in health education
and community development services throughout their county. All county health departments in Oklahoma utilize the
Public Health Oklahoma Client Information System (PHOCIS) to track an overview of the services provided to each
citizen. In addition, PHOCIS contains a population-based module (POPS) that houses information about community-
based events in which health department employees are involved. The information on this page is an accounting of
services provided within the county health department and throughout the county.
Number of Events Total Attendees
Consultation 316 1090
Group Screening 1 30
Meeting/Taskforce/Coalition 1 10
Multi-Session Education Group 45 337
Outreach 5 875
Presentation/Class 185 1528
Surveys/Assessment 2 27
Grand Total 555 3897
Topic Number of Events Total Attendees
Assessments 2 4
Discipline/Behavior Management 86 723
Family Relationships 25 156
General Health Department Services 5 875
Human Relationships 4 120
Infant & Early Childhood Consultation 257 877
Oral Health 1 15
Parenting Skil ls 34 206
Social Emotional Skil ls 210 1613
Terrorism/Emergency Preparedness 1 75
Grand Total 625 4664
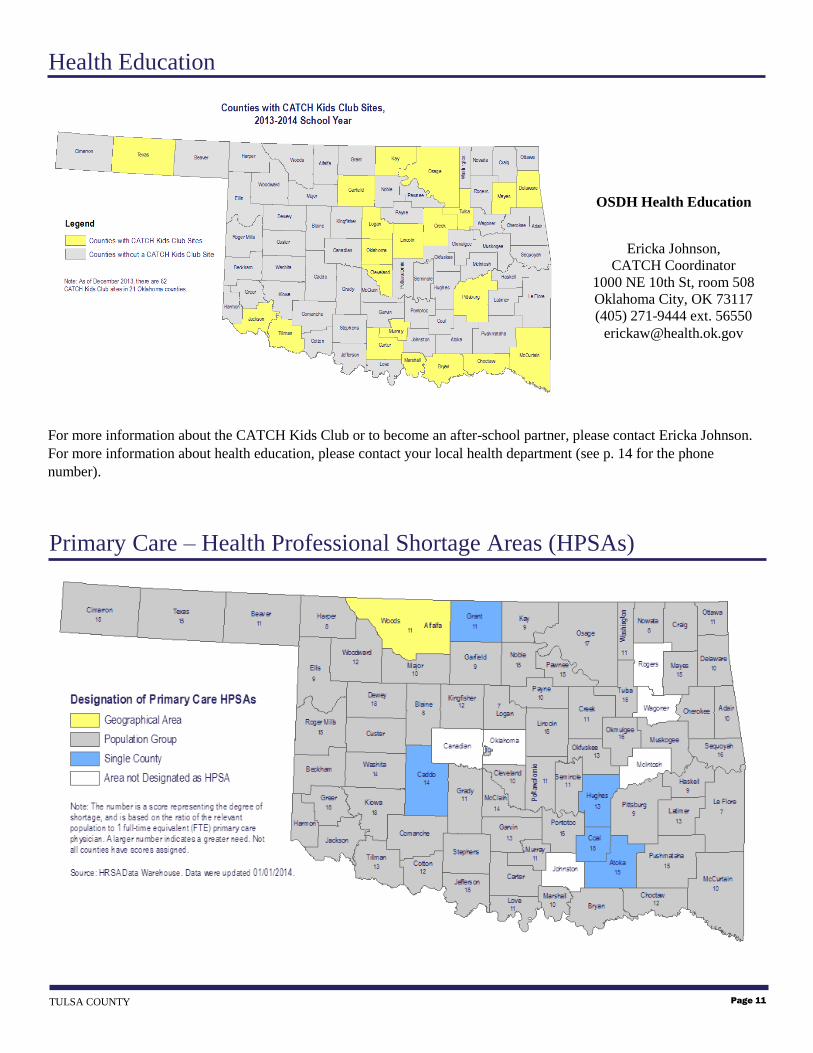
For more information about the CATCH Kids Club or to become an after-school partner, please contact Ericka Johnson.
For more information about health education, please contact your local health department (see p. 14 for the phone
number).
Health Education
OSDH Health Education
Ericka Johnson,
CATCH Coordinator
1000 NE 10th St, room 508
Oklahoma City, OK 73117
(405) 271-9444 ext. 56550
Page 11 TULSA COUNTY
Primary Care – Health Professional Shortage Areas (HPSAs)
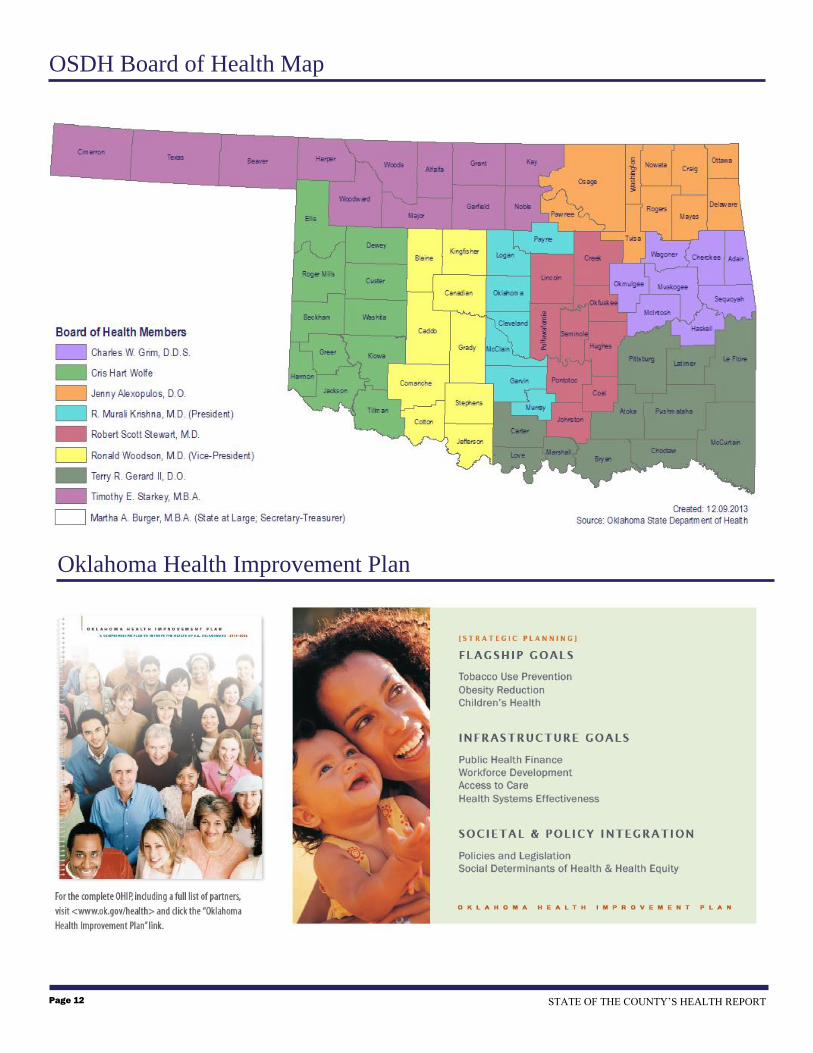
Oklahoma Health Improvement Plan
STATE OF THE COUNTY’S HEALTH REPORT Page 12
OSDH Board of Health Map

1. Preamble to the Constitution of the World Health Organization as adopted by the International Health Conference, New York, 19-22 Jun, 1946; signed on
22 Jul 1946 by the representatives of 61 States (Official Records of the World Health Organization, no. 2, p. 100) and entered into force on 7 Apr 1948.
2. U.S. Department of Health and Human Services. Office of Disease Prevention and Health Promotion. Healthy people 2020 - Determinants of Health.
Washington, DC. Available at http://www.healthypeople.gov/2020/about/DOHAbout.aspx. Accessed on Nov 18, 2013.
3. OSDH, Board of Health and OHIP Planning Team (2010). Oklahoma Health Improvement Plan. Available at
http://www.ok.gov/health2/documents/OHIP-viewing.pdf
4. U.S. Census Bureau, Population Estimates, Accessed Nov 7, 2013 from www.census.gov.
5. U.S. Census Bureau, 2008-2012 American Community Survey, Accessed Jan 13, 2014 from www.census.gov.
6. Oklahoma State Department of Health, Health Care Information, Behavioral Risk Factor Surveillance System (BRFSS).
7. U.S. Department of Labor, Bureau of Labor Statistics, Local Area Unemployment Statistics. www.bls.gov/LAU
8. Oklahoma State Department of Health, Health Care Information, OK2SHARE, Death Statistics – Final. www.health.ok.gov/ok2share.
9. Oklahoma State Department of Health, Community Health, Community Epidemiology, 2010 County Health Report. http://www.ok.gov/health.
10. Oklahoma State Department of Health, Health Care Information, OK2SHARE, Inpatient Discharge Statistics. www.health.ok.gov/ok2share.
11. Mokdad, A. H., Marks, J. S., Stroup, D. F., Gerberding, J. L., 2004. Actual Causes of Death in the United States, 2000. JAMA. 291(10):1238-1245.
12. Leenders, M. et.al. (2013). Fruit and vegetable consumption and mortality – European prospective investigation into cancer and nutrition. American
Journal of Epidemiology. 178 (4): 590-602.
13. United States Department of Health and Human Services (US DHHS), Centers of Disease Control and Prevention (CDC), Office of Surveillance,
Epidemiology, and Laboratory Services, Behavioral Risk Factor Surveillance System (BRFSS), Accessed Dec 6, 2013, http://www.cdc.gov/brfss/
14. Danaei, G., Ding, E. L., Mozaffarian, D., Taylor, B., Rehm, J., Murray, C. J., Ezzati, M., 2009.The preventable causes of death in the United States:
comparative risk assessment of dietary, lifestyle, and metabolic risk factors. PLoS Med. 6(4): e1000058.
15. Oklahoma State Department of Health, Health Care Information, OK2SHARE, Youth Risk Behavior Survey (YRBS), www.health.ok.gov/ok2share.
16. Cawley, J., Meyerhoefer, C., 2012. The medical care costs of obesity: An instrumental variables approach. Journal of Health Economics. 31 (1): 219.
17. Centers for Disease Control and Prevention. Division of Nutrition, Physical Activity, and Obesity, National Center for Chronic Disease Prevention and
Health Promotion. Physical Activity. Physical Activity for Everyone. How Much Physical Activity do Adults Need. Accessed on Nov 19, 2013.
http://www.cdc.gov/physicalactivity/everyone/guidelines/adults.html
18. U.S. Department of Health and Health Services. Office of Disease Prevention and Health Promotion. 2008 Physical Activity Guidelines for Americans.
Active Children and Adolescents. www.hhs.gov
19. American Diabetes Association. Diabetes Basics. Accessed on Dec 3, 2013. http://www.diabetes.org
20. American Diabetes Association. 2013. Economic costs of diabetes in the U.S. in 2012. Diabetes Care. Available at
http://care.diabetesjournals.org/content/early/2013/03/05/dc12-2625.full.pdf+html.
21. Ventura, S. J. and Hamilton, B. E. 2011.U.S. teenage birth rate resumes decline. NCHS Data Brief, no. 58. Hyattsville, MD: National Center for Health
Statistics.
22. Ventura, S. J., Hamilton, B. E., and Mathews, T.J., 2013. Pregnancy and Childbirth among Females Aged 10-19 Years – United States, 2007-2010.
Morbidity and Mortality Weekly Report, Supplement 62(03):71-76.
23. Gavin, L., Warner, L., Elizabeth O'Neil, M., Duong, L. M., Marshall, C., Hastings, P. A., Harrison, A. T., Barfield, W., 2013. Vital Signs: Repeat Births
among Teens – United States, 2007-2010. Morbidity and Mortality Weekly Report. 62(13); 249-255.
24. Centers for Disease Control and Prevention. National Center for Chronic Disease Prevention and Health Promotion. Teen Pregnancy. Accessed Nov 20,
2013 at http://www.cdc.gov/chronicdisease/resources/publications/aag/teen-preg.htm
25. Mathews, T. J. and MacDorman, M. F. 2011. Infant mortality statistics from the 2007 period linked birth/infant death data set. National Vital Statistics
Reports. 59(6).
26. Oklahoma State Department of Health, Health Care Information, OK2SHARE, Birth Statistics,—Final. www.health.ok.gov/ok2share.
27. The National Campaign to Prevent Teen and Unplanned Pregnancy, Counting It Up: The Public Costs of Teen Childbearing in Oklahoma in 2008, Jun
2011.
28. MacDorman, M. F. and Mathews, T. J. 2008. Recent trends in infant mortality in the United States. NCHS Data Brief. No. 9. October 2008. Available at
http://www.cdc.gov/nchs/data/databriefs/db09.pdf.
29. MacDorman, M. F., Hoyert, D. L., and Mathews, T. J., 2013. Recent declines in infant mortality in the United States, 2005-2011. NCHS Data Brief. No.
120. Hyattsville, MD: National Center for Health Statistics.
30. Oklahoma State Department of Health, Child and Family Health, Improving Infant Outcomes,
http://www.ok.gov/health/Child_and_Family_Health/Improving_Infant_Outcomes/index.html
31. March of Dimes. Low birthweight. Last reviewed Sept 2012. Accessed Dec 3, 2013. http://www.marchofdimes.com/baby/low-birthweight.aspx.
32. U.S. Department of Health and Human Services, Centers for Disease Control and Prevention, National Center for Health Statistics, Division of Vital
Statistics, Natality public-use data 2007-2011, on CDC WONDER Online Database. Accessed Dec 3, 2013
33. National Safety Council. Estimating the Costs of Unintentional Injuries, 2011. Accessed Dec 4, 2013 at
http://www.nsc.org/nsc_library/Documents/Estimating%20the%20Cost%20of%20Unintentional%20Injuries,%202011.pdf.
34. U.S. Department of Health and Human Services, Centers for Disease Control and Prevention, National Center for Chronic Disease Prevention and Health
Promotion, Office on Smoking and Health, The health consequences of smoking: a report of the Surgeon General. [Atlanta, Ga.]: Washington, D.C.: For
sale by the Supt. of Docs., U.S. G.P.O., 2004.
35. Oklahoma State Department of Health, Tobacco Use Prevention Service.
36. Centers for Disease Control and Prevention. Annual smoking‐attributable mortality, years of potential life lost, and economic costs-United States, 1995–
1999. MMWR 2002;51(14):300–303.
37. King, B. A., Alam, S., Promoff, G., Arrazola, R. and Dube, S. R., 2013. Awareness and ever-use of electronic cigarettes among U.S. adults, 2010-2011.
Nicotine & Tobacco Research. 15(9); 1623-1627.
38. Corey, C. et al., 2013. Notes from the Field: Electronic Cigarette Use Among Middle and High School Students — United States, 2011–2012. Morbidity
and Mortality Weekly Report. 62(35); 729-730.
Reference List
Page 13 TULSA COUNTY
Family Health Coalition
Partnership Priorities
1. Nutrition & Physical Activity
2. Perinatal Care and Women’s
health
3. Family Health including
Fatherhood issues
4. Social Marketing/Media
Advocacy
5. Complete Streets
6. Tobacco Use Prevention
2013 Outcomes/Impacts
Complete Streets Resolutions passed in Tulsa, Sand Springs, Collinsville
Local Food Systems assessment completed
Side Walk Stories Video Project completed
R&G grocers mobile truck launched
Community Health Improvement Plan
Pedestrian Safety Plan (City of Tulsa)
Healthy Congregation wellness policy passed in Mt. Zion Baptist Church
Nutrition policy passed at Explorer pipelines
Vending machine policy passed at Parks and Recreation, City of Tulsa
Jenks School District – Healthy School Incentive Grant
Healthy Communities Incentive Grants – Sand Springs, Collinsville,
Jenks
Restore Local Rights Resolutions passed
The Oklahoma Turning Point Initiative is public health improvement in
action. The success of the Turning Point process involves a partnership
between the state and county departments of health, local communities, and
policy-makers. The Oklahoma Turning Point engine is fueled by a
community-based decision making process whereby local communities tap
into the capacities, strengths, and vision of their citizens to create and promote
positive, sustainable changes in the public health system, and the public’s
health.
We are at a cross roads in our state and in Tulsa County. Please come
and be part of the solutions that will lead Oklahoma and Tulsa County to
becoming a healthy place to live, work and learn.
OKLAHOMA STATE
DEPARTMENT OF HEALTH
Community and Family Health Services Community Development Service
1000 NE 10th St, Room 508
Oklahoma City, OK 73117
Phone: 405-271-6127
Fax: 405-271-1225
Email: [email protected]
Tulsa County Health Department
5051 S. 129th East Avenue
Tulsa, OK 74134
918-595-4400
www.ok.gov/health
Report compiled by:
Jennifer Han, Ph.D., CHES Community Assessment and Evaluation Specialist
Miriam McGaugh, PhD Senior Epidemiologist
Arjina Shrestha Administrative Assistant (Seasonal)
Angela Watkins, MBA, MPH Program Assessment and Evaluation Specialist
Health on the Horizon
Oklahoma Community Partners
in Public Health Innovation
If you are interested in
learning more about
Turning Point or becoming
involved in local activities,
please contact:
Fauzia Khan, MBBS, MPH
Tulsa County
(918) 260-8110
Email: [email protected]
Website: www.okturningpoint.org
STATE OF THE COUNTY’S HEALTH REPORT Page 14

Supplement Table 1: Total Mortality Rate and Adult Prevalence of Sufficient Fruit and Vegetable Consumption (5 or More Daily
Servings), Obesity, Physical Inactivity, and Diabetes by County.
County
Total Mortality1
(deaths/100,000)
Fruit & Vegetable
Consumption2
(percent)
Obesity3
(percent)
Physical
Inactivity3
(percent)
Diabetes3
(percent)
Adair 1,014.6 7.2 35.4 30.9 15.6
Alfalfa 863.2 - 31.9* 31.9* 15.3
Atoka 875.7 9.0 34.5 28.5 16.8
Beaver 797.2 9.7 29.5* 31.1* 11.7
Beckham 1,030.3 17.0 32.5 31.3 10.8
Blaine 934.0 14.2* 31.5 36.3 9.9
Bryan 897.0 16.0 30.4 36.2 8.2
Caddo 1,033.5 13.3 29.1 28.9 11.9
Canadian 805.6 15.7 26.4 27.0 9.9
Carter 1,096.9 16.8 30.6 34.0 10.2
Cherokee 944.5 13.6 31.1 34.7 11.5
Choctaw 1,104.7 29.8* 30.0 30.8 9.0
Cimarron 805.0 - 26.2* 35.0* 7.8
Cleveland 787.6 16.1 26.5 24.0 7.8
Coal 1,091.1 - 33.6* 24.6* 10.1
Comanche 915.7 15.6 31.4 31.4 9.3
Cotton 1,035.1 - 37.9* 29.1* 9.8
Craig 1,061.2 10.1 36.8 31.6 13.8
Creek 979.5 12.2 32.3 29.8 9.5
Custer 940.2 18.9 29.8 26.3 9.4
Delaware 900.6 11.8 30.6 35.5 15.0
Dewey 1,026.0 - 29.1* 40.6* 11.1
Ellis 873.0 - 36.8* 31.3* 10.8
Garfield 897.7 12.5 33.7 27.9 8.9
Garvin 1,097.9 12.3 29.8 31.4 12.3
Grady 921.4 13.4 34.5 25.4 6.3
Grant 873.2 - 24.2 19.6 6.4
Greer 923.4 - 34.9* 45.7* 12.5

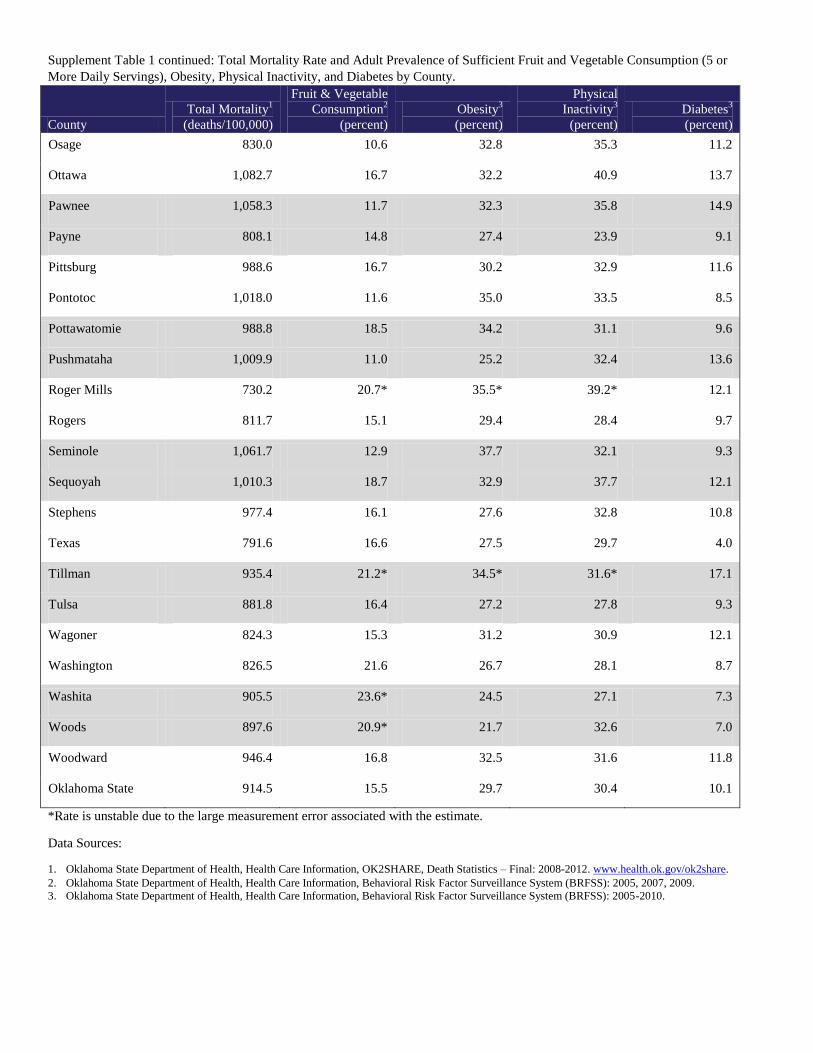
Supplement Table 1 continued: Total Mortality Rate and Adult Prevalence of Sufficient Fruit and Vegetable Consumption (5 or
More Daily Servings), Obesity, Physical Inactivity, and Diabetes by County.
County
Total Mortality1
(deaths/100,000)
Fruit & Vegetable
Consumption2
(percent)
Obesity3
(percent)
Physical
Inactivity3
(percent)
Diabetes3
(percent)
Harmon 913.8 - - - 20.2*
Harper 954.3 - - 38.9* 17.4*
Haskell 960.0 15.3 31.1* 36.4 6.9
Hughes 1,066.9 12.1 21.2 26.3 12.7
Jackson 935.3 17.2 31.7 28.7 12.5
Jefferson 1,084.8 - 39.3* 37.6* 9.4
Johnston 1,105.3 19.6* 24.7 33.6* 13.7
Kay 932.2 13.9 31.3 27.9 14.2
Kingfisher 835.1 21.0 30.5 29.6 11.0
Kiowa 1,173.2 17.5* 31.1 32.2* 12.5
Latimer 856.8 9.3 42.2* 41.6* 13.1
Le Flore 1,054.9 11.4 31.0 36.7 14.2
Lincoln 915.3 15.0 28.0 40.3 10.9
Logan 776.5 12.1 32.7 30.3 11.7
Love 934.7 17.9* 25.6 39.1* 18.0
Major 911.8 14.8 26.9* 28.2 6.8
Marshall 1,041.8 10.1 33.8* 30.1 13.9
Mayes 1,033.6 18.1 36.9 35.3 12.7
McClain 863.9 22.6* 34.8 26.3 7.5
McCurtain 870.9 6.9 33.4 33.8 10.5
McIntosh 992.7 14.1 37.4 38.3 8.8
Murray 1,042.2 9.4 32.1* 24.6 10.8
Muskogee 1,072.6 14.5 29.6 36.2 12.1
Noble 853.1 8.0 39.1* 34.7* 11.6
Nowata 910.7 20.4 33.1 29.2 10.0
Okfuskee 1,109.8 - 31.7 44.7* 15.9
Oklahoma 900.5 16.7 28.4 30.4 9.3
Okmulgee 1,030.3 11.9 33.7 36.6 13.1
Supplement Table 1 continued: Total Mortality Rate and Adult Prevalence of Sufficient Fruit and Vegetable Consumption (5 or
More Daily Servings), Obesity, Physical Inactivity, and Diabetes by County.
County
Total Mortality1
(deaths/100,000)
Fruit & Vegetable
Consumption2
(percent)
Obesity3
(percent)
Physical
Inactivity3
(percent)
Diabetes3
(percent)
Osage 830.0 10.6 32.8 35.3 11.2
Ottawa 1,082.7 16.7 32.2 40.9 13.7
Pawnee 1,058.3 11.7 32.3 35.8 14.9
Payne 808.1 14.8 27.4 23.9 9.1
Pittsburg 988.6 16.7 30.2 32.9 11.6
Pontotoc 1,018.0 11.6 35.0 33.5 8.5
Pottawatomie 988.8 18.5 34.2 31.1 9.6
Pushmataha 1,009.9 11.0 25.2 32.4 13.6
Roger Mills 730.2 20.7* 35.5* 39.2* 12.1
Rogers 811.7 15.1 29.4 28.4 9.7
Seminole 1,061.7 12.9 37.7 32.1 9.3
Sequoyah 1,010.3 18.7 32.9 37.7 12.1
Stephens 977.4 16.1 27.6 32.8 10.8
Texas 791.6 16.6 27.5 29.7 4.0
Tillman 935.4 21.2* 34.5* 31.6* 17.1
Tulsa 881.8 16.4 27.2 27.8 9.3
Wagoner 824.3 15.3 31.2 30.9 12.1
Washington 826.5 21.6 26.7 28.1 8.7
Washita 905.5 23.6* 24.5 27.1 7.3
Woods 897.6 20.9* 21.7 32.6 7.0
Woodward 946.4 16.8 32.5 31.6 11.8
Oklahoma State 914.5 15.5 29.7 30.4 10.1
*Rate is unstable due to the large measurement error associated with the estimate.
Data Sources:
1. Oklahoma State Department of Health, Health Care Information, OK2SHARE, Death Statistics – Final: 2008-2012. www.health.ok.gov/ok2share.
2. Oklahoma State Department of Health, Health Care Information, Behavioral Risk Factor Surveillance System (BRFSS): 2005, 2007, 2009.
3. Oklahoma State Department of Health, Health Care Information, Behavioral Risk Factor Surveillance System (BRFSS): 2005-2010.
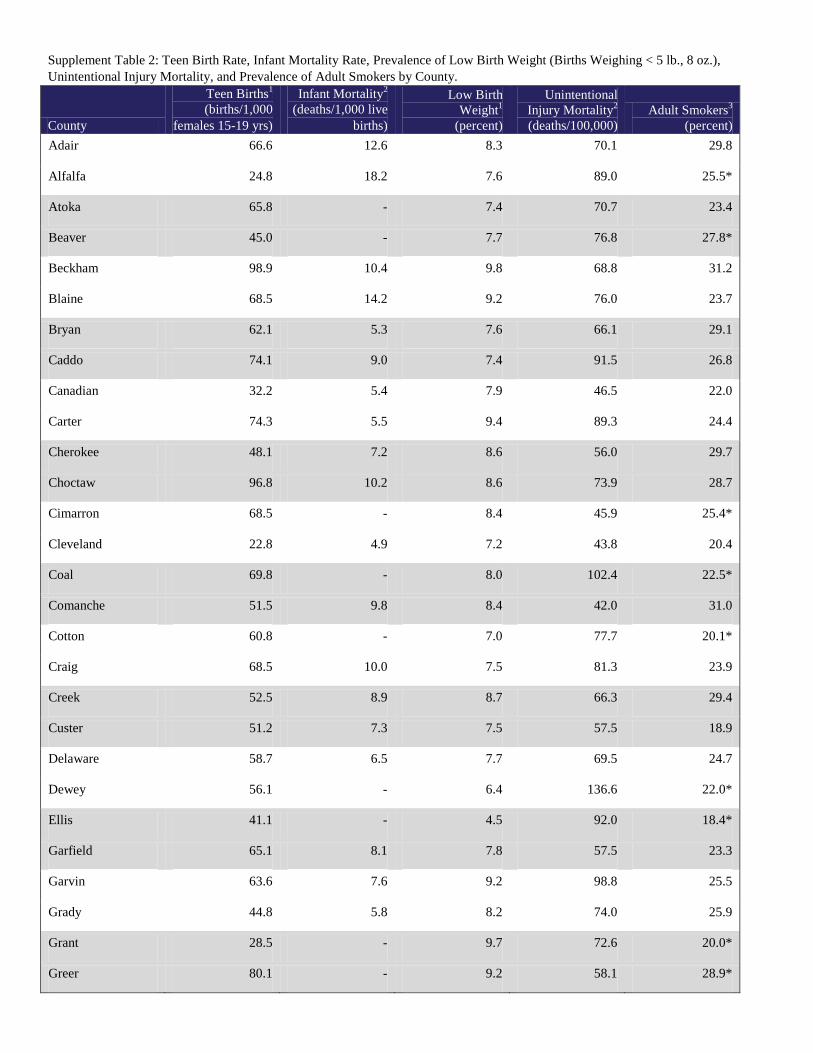
Supplement Table 2: Teen Birth Rate, Infant Mortality Rate, Prevalence of Low Birth Weight (Births Weighing < 5 lb., 8 oz.),
Unintentional Injury Mortality, and Prevalence of Adult Smokers by County.
County
Teen Births1
(births/1,000
females 15-19 yrs)
Infant Mortality2
(deaths/1,000 live
births)
Low Birth
Weight1
(percent)
Unintentional
Injury Mortality2
(deaths/100,000)
Adult Smokers3
(percent)
Adair 66.6 12.6 8.3 70.1 29.8
Alfalfa 24.8 18.2 7.6 89.0 25.5*
Atoka 65.8 - 7.4 70.7 23.4
Beaver 45.0 - 7.7 76.8 27.8*
Beckham 98.9 10.4 9.8 68.8 31.2
Blaine 68.5 14.2 9.2 76.0 23.7
Bryan 62.1 5.3 7.6 66.1 29.1
Caddo 74.1 9.0 7.4 91.5 26.8
Canadian 32.2 5.4 7.9 46.5 22.0
Carter 74.3 5.5 9.4 89.3 24.4
Cherokee 48.1 7.2 8.6 56.0 29.7
Choctaw 96.8 10.2 8.6 73.9 28.7
Cimarron 68.5 - 8.4 45.9 25.4*
Cleveland 22.8 4.9 7.2 43.8 20.4
Coal 69.8 - 8.0 102.4 22.5*
Comanche 51.5 9.8 8.4 42.0 31.0
Cotton 60.8 - 7.0 77.7 20.1*
Craig 68.5 10.0 7.5 81.3 23.9
Creek 52.5 8.9 8.7 66.3 29.4
Custer 51.2 7.3 7.5 57.5 18.9
Delaware 58.7 6.5 7.7 69.5 24.7
Dewey 56.1 - 6.4 136.6 22.0*
Ellis 41.1 - 4.5 92.0 18.4*
Garfield 65.1 8.1 7.8 57.5 23.3
Garvin 63.6 7.6 9.2 98.8 25.5
Grady 44.8 5.8 8.2 74.0 25.9
Grant 28.5 - 9.7 72.6 20.0*
Greer 80.1 - 9.2 58.1 28.9*

Supplement Table 2 continued: Teen Birth Rate, Infant Mortality Rate, Prevalence of Low Birth Weight (Births Weighing < 5 lb.,
8 oz.), Unintentional Injury Mortality, and Prevalence of Adult Smokers by County.
County
Teen Births1
(births/1,000
females 15-19 yrs)
Infant Mortality2
(deaths/1,000 live
births)
Low Birth
Weight1
(percent)
Unintentional
Injury Mortality2
(deaths/100,000)
Adult Smokers3
(percent)
Harmon 79.6 - 5.3 48.0 10.3*
Harper 40.0 - 6.5 96.6 16.8*
Haskell 62.4 9.4 9.8 77.2 19.7
Hughes 61.6 8.0 7.5 77.4 36.6*
Jackson 72.7 8.1 9.7 53.8 25.4
Jefferson 54.1 15.5 9.3 105.1 24.8*
Johnston 61.3 9.7 9.1 79.3 24.3*
Kay 75.1 7.2 8.0 67.6 24.3
Kingfisher 46.4 - 5.7 54.0 18.0
Kiowa 58.1 12.7 7.5 97.4 26.9*
Latimer 38.9 - 9.0 75.0 21.5
Le Flore 70.4 5.7 7.4 71.8 26.0
Lincoln 42.5 7.1 7.7 71.3 27.6
Logan 24.6 6.7 7.7 50.8 23.4
Love 66.3 - 7.6 72.2 35.5*
Major 50.9 19.5 8.4 60.4 11.4
Marshall 72.5 6.0 6.7 59.7 24.1*
Mayes 60.8 7.2 7.4 75.2 30.1
McClain 40.3 10.8 8.3 58.7 18.3
McCurtain 78.7 9.6 7.6 84.4 23.5
McIntosh 62.2 11.4 8.3 77.8 29.2
Murray 66.4 9.7 8.8 83.7 24.9
Muskogee 65.3 7.5 8.5 64.8 32.0
Noble 48.5 9.7 6.8 42.1 28.0*
Nowata 46.8 10.1 8.0 65.4 29.2
Okfuskee 64.3 7.0 7.8 80.2 31.9*
Oklahoma 60.2 7.9 8.9 49.8 24.1
Okmulgee 70.8 8.5 8.2 72.0 27.7

Supplement Table 2 continued: Teen Birth Rate, Infant Mortality Rate, Prevalence of Low Birth Weight (Births Weighing < 5 lb.,
8 oz.), Unintentional Injury Mortality, and Prevalence of Adult Smokers by County.
County
Teen Births1
(births/1,000
females 15-19 yrs)
Infant Mortality2
(deaths/1,000 live
births)
Low Birth
Weight1
(percent)
Unintentional
Injury Mortality2
(deaths/100,000)
Adult Smokers3
(percent)
Osage 39.3 7.3 8.8 57.4 27.2
Ottawa 67.8 9.9 8.1 74.3 32.2
Pawnee 50.5 7.1 7.0 128.0 27.2
Payne 20.7 5.0 5.9 50.8 18.2
Pittsburg 68.4 8.6 9.3 66.5 29.2
Pontotoc 52.2 7.6 7.2 82.3 27.1
Pottawatomie 55.1 9.0 7.5 66.6 30.0
Pushmataha 69.1 10.4 9.6 77.8 39.4
Roger Mills 66.2 - 4.7 93.4 17.7*
Rogers 32.9 7.1 8.1 47.2 24.8
Seminole 62.0 7.5 7.4 80.8 28.3
Sequoyah 66.2 5.5 7.5 62.4 30.7
Stephens 56.2 9.0 8.5 74.5 20.0
Texas 80.1 7.3 6.4 67.4 18.4
Tillman 62.0 - 6.4 67.7 25.4*
Tulsa 51.2 7.3 9.0 54.5 23.7
Wagoner 33.4 5.6 7.3 56.1 27.3
Washington 49.8 6.1 7.2 52.1 23.0
Washita 56.6 9.9 8.8 55.5 28.2*
Woods 43.2 - 8.8 79.8 16.2
Woodward 84.3 7.8 7.9 80.8 26.9
Oklahoma State 52.2 7.5 8.3 58.7 25.0
*Rate is unstable due to the large measurement error associated with the estimate.
Data Sources:
1. Oklahoma State Department of Health, Health Care Information, OK2SHARE, Birth Statistics,—Final: 2008-2012. www.health.ok.gov/ok2share.
2. Oklahoma State Department of Health, Health Care Information, OK2SHARE, Death Statistics – Final: 2008-2012. www.health.ok.gov/ok2share.
3. Oklahoma State Department of Health, Health Care Information, Behavioral Risk Factor Surveillance System (BRFSS): 2005-2010.