Embed Size (px)
Citation preview
IL NUOVO CIMENTO VOL. 13 C, N. 4 Luglio-Agosto 1990
Monthly Maps of Daily Global Incident Solar Radiation in Italy.
A. LAVAGNINI, S. MARTORELLI and C. CORETTI
Istituto di Fisica dell'Atmosfera del CNR - P.le Luigi Sturzo 31, 00144 Roma, Italia
(ricevuto il 29 Maggio 1989)
Summary. - - Measurements of daily sunshine hours and of global solar radiation for most of the existing stations in Italy, covering a period of (5+30)y, were analysed. Linear correlation coefficients were calculated between the above-cited measurement for 36 stations and for every month of the year. Italy has been divided in areas in which such coefficients are not much different among them. The mean values of these coefficients relative to each area were used to estimate the global radiation for the sunshine stations located in the same area. Using so radiation obtained values for about 140 stations, 12 month global radiation maps were realized for the Italian territory. Possible errors and limitations of the maps were discussed.
PACS 92.60 - Meteorology.
1. - In troduct ion .
Our knowledge of incident solar radiation in I taly is still limited to a small number of sites [1, 2]. Monthly maps of mean daily global solar radiation covering the Italian peninsula[3] have also been drawn up but the information they provide for sites distant from the point of measurement is unsat isfactory or unreliable as the data on which such maps are based come from too small a number of stations. On the other hand, it is not ye t possible to give a theoretical explanation of the climatic changes undergone by this quant i ty in the vicinity of the sea, the mountains, and on the boundaries of and inside the various different climatic zones. Therefore , the only remaining approach is the statistical one; the results obtained therefore depend mainly on the number, location and reliability of the stations used in the analysis.
769
770 A. LAVAGNINI~ S. M A R T O R E L L I and C. CORETTI
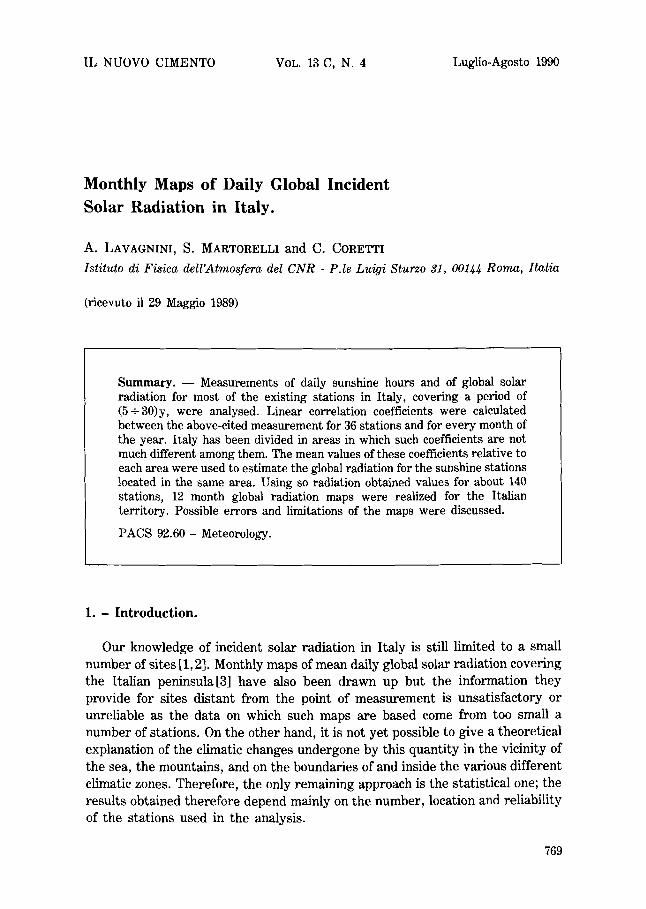
T A B L E I . - List of the selected stations.
- - i . . . . . . . . . . . ~ . . . . . + . . . . t
NUM,I STATION IYEARSIALT,:
I ITONEZZA 2 :BOLZANO 3 IBOLZANO
IVAL OEI FORNI 5 :~ARESER GHIAr 6:50NDALO 7 :S,MI{HELE ALL'AOIGE 8 :OOMODOSSOLA 9 :TRENTO
I0 :UDINE II :P, ROSA' 12 ICUASSO AL MONTE 13 IVERBANIA PALLANZA 14 IARCO 15 ICONEGLIANO VENETO 16 :TOR VIS~OSA 17 :NU5 5, BARTHELEMY 18 IISPRA 19 :MALQESINE 20 IVENEGONO INFER:ORE 21 IBERGAMO 22 IeOMO 23 :TRIESTE 24 ITRIESTE 25 IOROPA 26 ISALO' 27 IBORGO GROTTAGIGANTE 28 )VENEZIA 29 IMARQALLO 30 IMILANO BRERA 31 :MILANO 32 IVENEZIA 33 IPAOOVA 34 ICOLLE VENDA 35 :VER~ELLI 36 IPAVIA 37 IPAVIA 38 ITORINO 39 ISOLIERA 40 :ROVIGO 41 :ROVIGO 42 :PIA~ENZA 43 IPARMA 44 :MOOENA 45 :BOLOGNA 46 IBOLOGNA 47 I80LOGNA 48 :MARINA O: RAVENNA 49 :GENOVA 50 :GENOVA 51 :BAGNACAVALLO 52 :{UNEO 53 :BRANZOLINO 5~ ~SAVONA 55 IeHIAVARI 56 :FAENZA OSSERVATORIO 57 IFAENZA 58 IMONTE ~IMONE 59 ISUVIANA CAS, 01 C, 60 IPIETRALIGURE 61 :LA SPEZIA 62 [RIMINI 63 IALASSIO 64 :~APO MELE 65 ~PESARO 66 :PESETA 67 ~MONTE~ATINI 68 :IMPERIA 69 :VIAREGGIO 70 IlJRBINO
6 I 9351 20 I 241: 13 : "~ ' 26:23001 7 ', 3000:
25:1057: 20 : 227: 7 , 105,,
29 I 3091 20 I 92: 20 '~ ' ,,,488, 17 5,,~, 10 241: 14 112: 7 80:
15 5: 19 11638', 10 2201 15 90: 23 327l 19 222: 21 20D 20 ~0, 14 11~ 34:1180: 37 100:
20 61 21 156: 19 153l 20 103: i6 2', i0 13l 6 575:
26 3001 34 851 54 85 ', 20 282: 7 30: 6 23:
45 23: 39 72l 38 73 : 21 76l
49: 50 51 : 64 I00 16 2: 20 ~' !9 211 9 II',
30 540: 6 I,$l
31 2~',
22 56: 30 56: 20 12137: 16 446', 24 30 ', 28 50 ', 32 27 ', 41 32I 20 221 o~ I~', 'v-, 62: 14 32: 23 15', 3C "~' 5 451:
I NUM,: STAT ION :YEARSIALT,:
71 IPISA 20 I 1: 72 :ANSONA 73 :SANSEPOLCRO 74 :MACERATA 75:8AMER[NO 76 :PERUGIA 77 :TODI 78 :GROSSETO 79 :TERAMO 80 :PIANOSA 81 :TERN: 82 :MONTE TERMINILLO 83 :PESC~A 84 lelVITAVE~CHIA 85 :VIGNA O: VALLE 86 :SUB~ACO 87 :ROMA 88 IROMA 89 :QUINOICINELLA 90 :MANFREDONIA 91 :FOGGIA A~NOOLA 92 :POOERE 124 93 :GRETA 94 ILOCANIA 95 :BENEVENTO 96 :PODERE BALBIANI 97 IBARI 98 :SAN NIQOLA MELFI 99 :TORRE MASCOLI C,
I00 :SPINAZZOLA I01 :OLBIA 102 :RIONERO IN VULC. 103 :AVELLINO 104 :NAPOLI 105 INAPOLI UNIVERSITA' 106 :RESINA I07 :RESINA 108 :ALIAMURA 109 :S. BASILIO A, 110 :BRINDISI I i i IMATERA 112 ]ALGHERO 113 :MARTIN~FRAN~A 114 IPI~ERNO 115 IAMALFI 116 ILATIANO 117 :TARANTO 118 IS, GIORGIO IONI~O 119 :METAPONTO 120 :OAPO PALINURO 121 :TAURISANO 122 ILU~UGNANO 123 :~EQITA 124 :CE~ITR 125 :QAGLIARI 126 iCAGLIARI 127 :~ARLOFORTE 128 I~ROTONE 129 :QATANZARO 130 iUSTICA 131 IMESSINA 132 :MESSINA 133 :REGGIO CALABRIA 134 IREGGIO ~LABRIA 135 :TRAPANI 136 :~IREALE 137 IQATANIA 138 :LENTINI 139 :GELA
20 I 205: 22 ~ 330I ,,~ I 331: 27 6641 18 520: 5 411:
23 ?~' 29 407: 20 27: 26 1481 20:1875: 20 16: I0 23: 20 270: 20 5151 50 58: 20 131: I0 50: 10 2: 20 56: I0 90: 39 50: I0 90: 18 176~ 10 12: 1~ 28: 8 198:
I0 r 8 390:
20 2: 9 600:
14 352: 20 72: 34 721 22 608: 13 608: 6 395;
I0 2651 20 I0: I0 360: 20 40: I0 410: 23 731~ 23 30: 9 110:
38 50: 8 16: 9 4:
20 185: 10 110: 28 130: 12 11801 12:1180~ 20 18: 18 75: 9 21:
20 158: 7 320:
20 251: 27 54: 20 59: 26 381 7 20:
20 14: ~'~ 19~I
10 70~ fO 771 .. .J.a,
1701 MO IPANTELLERIA I 20
MONTHLY MAPS OF DAILY GLOBAL INCIDENT SOLAR RADIATION IN ITALY 771
2. -- Data used.
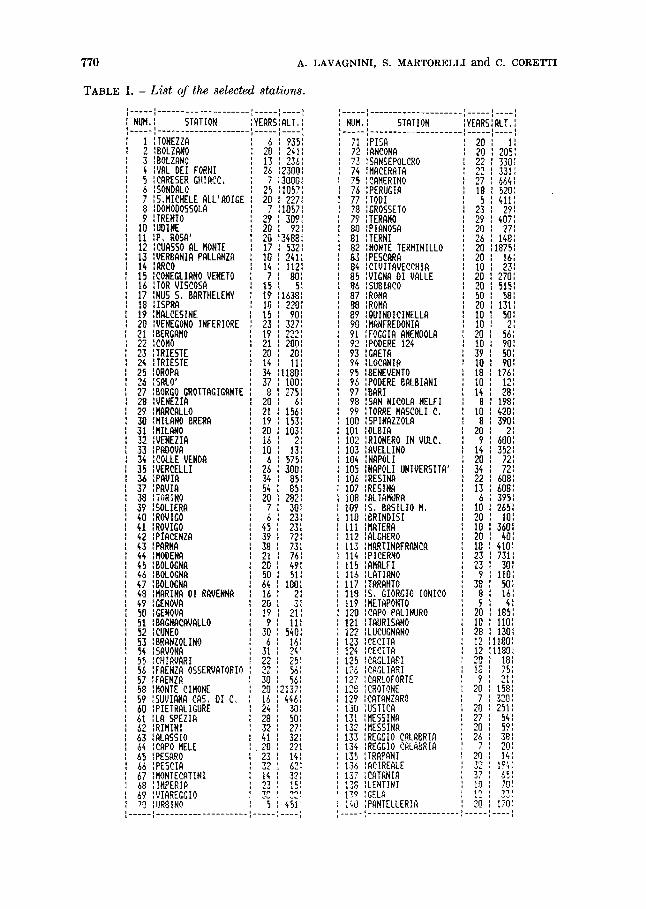
Total daily global radia t ion and sunshine values w e r e collected f rom 36 I ta l ian
s ta t ions and tota l daily sunshine values only f rom 160 s ta t ions in I ta ly . The
s ta t ions w e r e selected so tha t the m e a s u r e m e n t per iod was long enough to afford
f "~..J \
- .'~.~ 3 2 1 " ' ~ - ~
.S ._ ) . - - ~ 6 7. s (
'---. ~2 _ ~ 3 "~ ~ ~ ) ' ~ .,, ~ ~9 - ~ ,~ ~ v ,~l ). �9 55 ~.7r $ 1 " ~ . . ' IP '~,
i 78 �9 075 - �9
I \ / , N , , . ~ - I ,. ~ ~ . _ . _ 9 ~ - , , , ~
�9 ,-~,,,-, ~,~.,o~: ~,,::,.%_~, 115 114 119 11~116
Fig. 1. - Location of selected stations the names of which are listed in table I.
772 A. LAVAGNINI, S. MARTORELLI and C. CORETTI
climatic significance to the analyses. In most cases, global radiation was measured using Fluess-Robitzsch-type pyranometers; sunshine was measured using Campbell-Stokes apparatus. Stations equipped with both types of measuring apparatus comprised the 31 stations of the Air Force Meteorological Service and a further 5 stations belonging to Universities and Government Laboratories (labeled with stars in table II). Sunshine data from stations close together (for instance, in the same city) or which, for special reasons, were considered unreliable or had less than 5 years of daily measurements, were excluded. Therefore the stations selected and analysed are those shown in table I, which also gives the number of years of recordings analysed and the altitude above sea level in m. The locations of the stations are shown in fig. 1.
The problems related to instrument characteristics and measurement errors have been dealt with elsewere [4]. Here is briefly described the method used to correct the measurement carried out with instruments not periodically calibrated.
The pyranometers of the Metereological Service network have been used from 1958 to 1971 without any calibration. These pyranometers in 1972 were replaced with new ones, of the same type, intercalibrated among them and with a pyreliometer compared in an international campaign.
The maximum values of daily global radiation recorded in 1972 in each station (about (4 - 6) days per month), were interpolated by means of a graph, showing the daily global radiation in clear sky and minimum atmospheric turbidity conditions. This curve, characteristic of each station, is supposed to be independent of any year used to calculate it.
Then it was compared with similar graphs obtained for the years previous to 1972. From this comparison some coefficients were derived which were used to ,morrect,, the instruments calibration constants for those particular years.
An estimation of the goodness of this method was carried out for Genova and Vigna di Valle stations where, for some years, Robitzsch and Eppley pyranometers worked simultaneously. It was found that the ,(corrected), data are statistically higher than electric pyranometers measurements of 3% in Winter, 6% in Spring and Autumn, 8% in Summer.
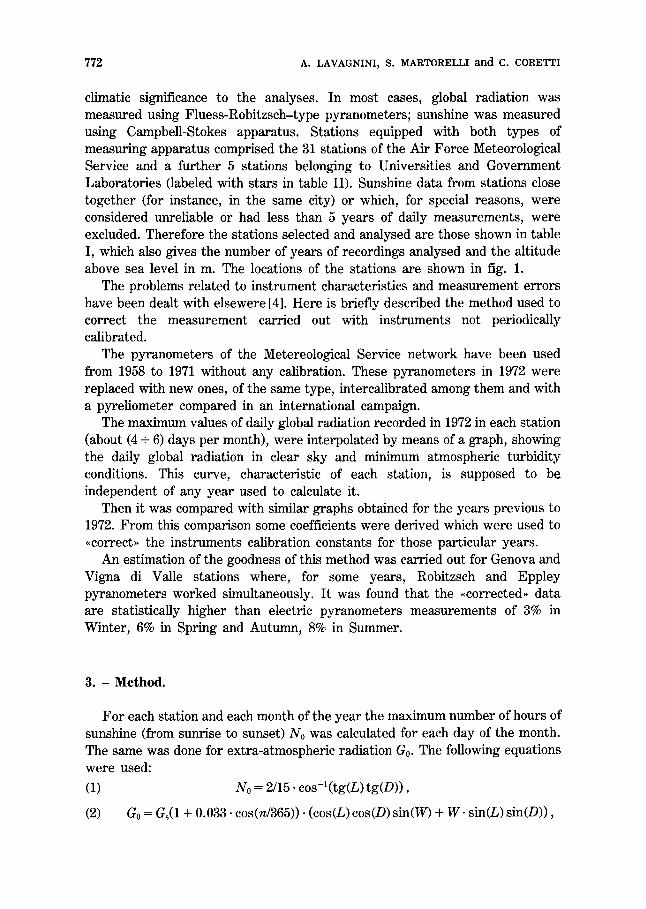
3 . - M e t h o d .
For each station and each month of the year the maximum number of hours of sunshine (from sunrise to sunset) No was calculated for each day of the month. The same was done for extra-atmospheric radiation Go. The following equations were used:
(1) No = 2/15. cos-l(tg(L) tg(D)),
(2) Go = Gs(1 + 0.033. cos(n/365)) �9 (cos(L) cos(D) sin(W) + W. sin(L) sin(D)),
MONTHLY MAPS OF DAILY GLOBAL I N C I D E N T SOLAR RADIATION IN ITALY 773
where
L is the site latitude; D is the declination; n is the progressive number corresponding to the day of the year; Gs is the solar constant, equal to 1365w/m-2; W is the hour angle.
The following equation was used to calculate the declination:
(3) D = 23.45. sin((284 + n)/365).
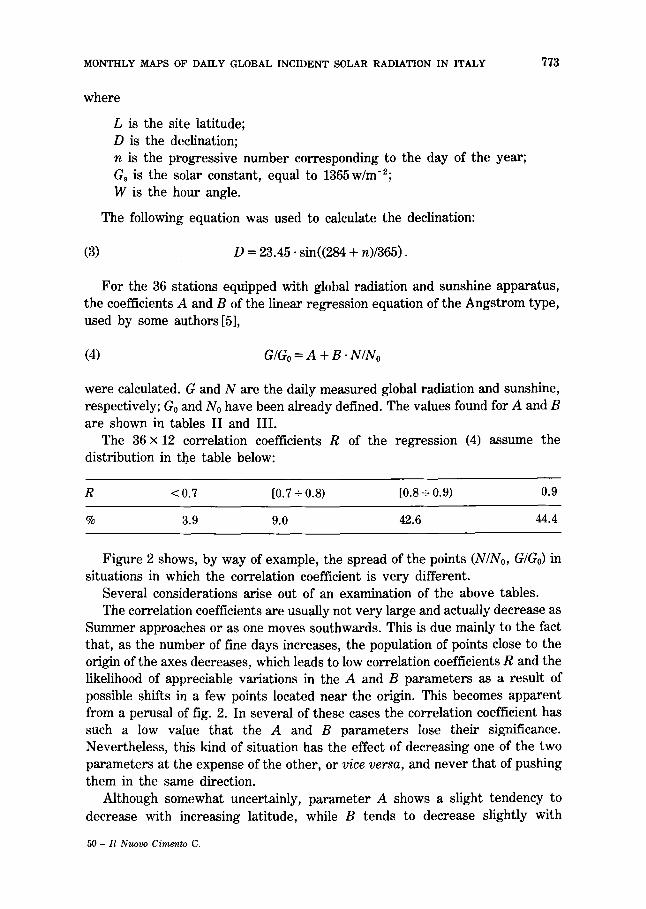
For the 36 stations equipped with global radiation and sunshine apparatus, the coefficients A and B of the linear regression equation of the Angstrom type, used by some authors [5],
(4) G/Go = A + B . N/No
were calculated. G and N are the daily measured global radiation and sunshine, respectively; Go and No have been already defined. The values found for A and B are shown in tables II and III.
The 36 • 12 correlation coefficients R of the regression (4) assume the distribution in th.e table below:
R < 0.7 [0.7 + 0.8) [0.8 § 0.9) 0.9
% 3.9 9.0 42.6 44.4
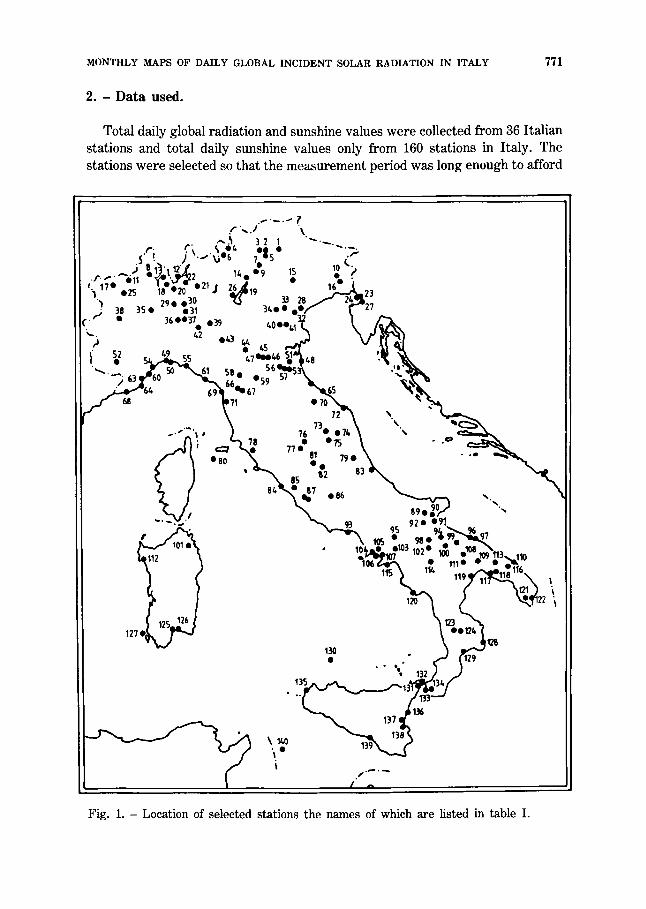
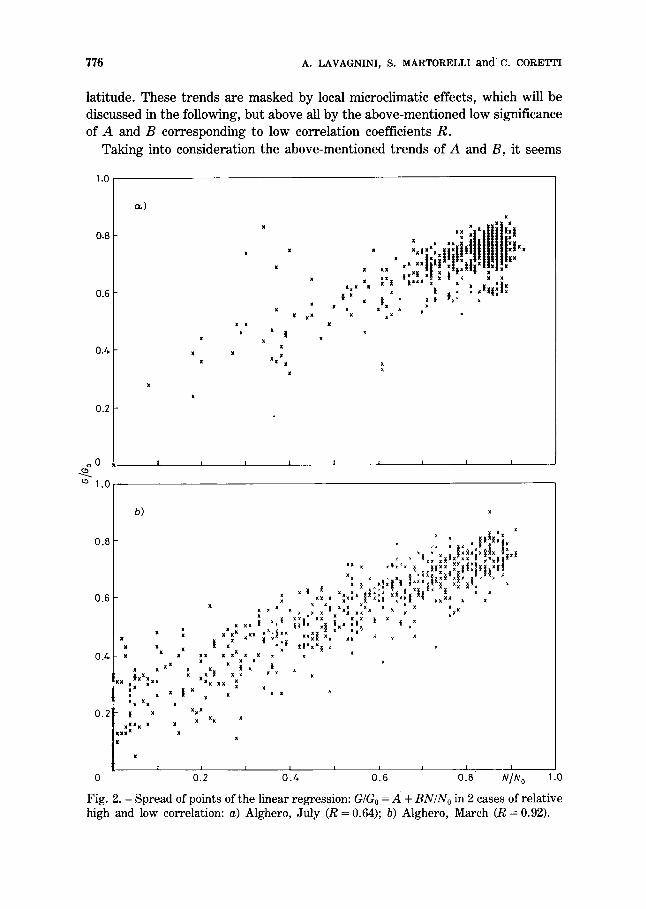
Figure 2 shows, by way of example, the spread of the points (N/No, G/Go) in situations in which the correlation coefficient is very different.
Several considerations arise out of an examination of the above tables. The correlation coefficients are usually not very large and actually decrease as
Summer approaches or as one moves southwards. This is due mainly to the fact that, as the number of fine days increases, the population of points close to the origin of the axes decreases, which leads to low correlation coefficients R and the likelihood of appreciable variations in the A and B parameters as a result of possible shifts in a few points located near the origin. This becomes apparent from a perusal of fig. 2. In several of these cases the correlation coefficient has such a low value that the A and B parameters lose their significance. Nevertheless, this kind of situation has the effect of decreasing one of the two parameters at the expense of the other, or vice versa, and never that of pushing them in the same direction.
Although somewhat uncertainly, parameter A shows a slight tendency to decrease with increasing latitude, while B tends to decrease slightly with
50 - I l Nuovo Cimento C.
774 A. LAVAGNINI, S. MARTORELLI and C. CORETTI
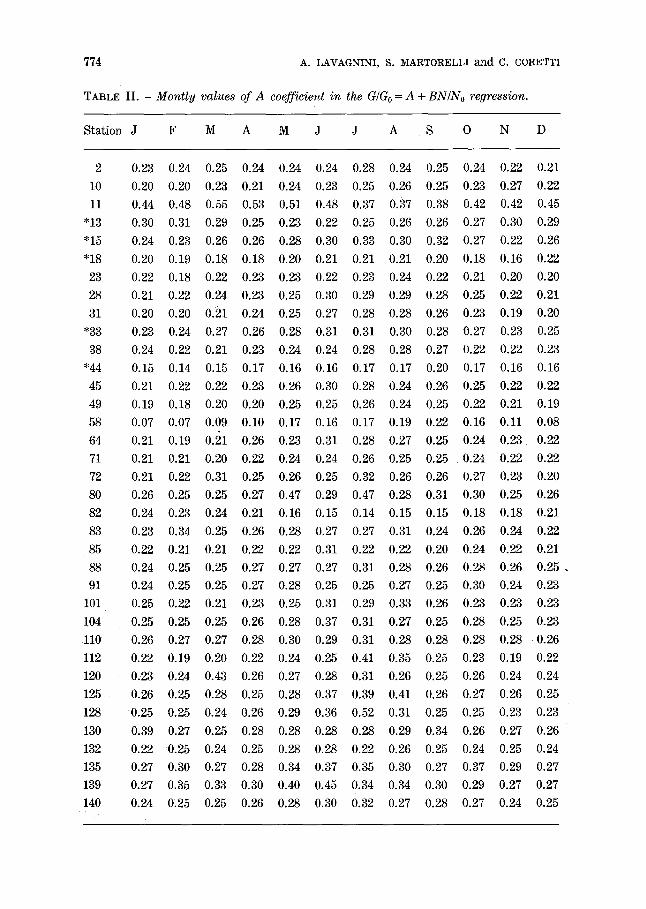
TABLE II. - Montly values of A coefficient in the G/Go = A + BN/No regression.
Station J F M A M J J A S 0 N D
2
10
11
"13
"15
"18
23
28
31
*33
38
*44
45
49
58
64
71
72
80
82
83
85
88
91
101
104
110
112
120
125
128
130
0.23 0.24 0.25 0.24 0.24 0.24 0.28 0.24 0.25 0.24 0.22 0.21
0.20 0.20 0.23 0.21 0.24 0.23 0.25 0.26 0.25 0.23 0.27 0.22
0.44 0.48 0.55 0.53 0.51 0.48 0.37 0.37 0.38 0.42 0.42 0.45
0.30 0.31 0.29 0.25 0.23 0.22 0.25 0.26 0.26 0.27 0.30 0.29
0,24 0.23 0.26 0.26 0.28 0.30 0.33 0.30 0.32 0.27 0.22 0.26
0.20 0.19 0.18 0.18 0.20 0.21 0.21 0.21 0.20 0.18 0.16 0.22
0.22 0.18 0.22 0.23 0.23 0.22 0.23 0.24 0.22 0.21 0.20 0.20
0.21 0.22 0.24 0.23 0.25 0.30 0.29 0.29 0.28 0.25 0.22 0.21
0.20 0.20 0.21 0.24 0.25 0.27 0.28 0.28 0.26 0.23 0.19 0.20
0.23 0.24 0.27 0.26 0.28 0.31 0.31 0.30 0.28 0.27 0.23 0.25
0.24 0.22 0.21 0.23 0.24 0.24 0.28 0.28 0.27 0.22 0.22 0.23
0.15 0.14 0.15 0.17 0.16 0.16 0.17 0.17 0.20 0.17 0.16 0.16
0.21 0.22 0.22 0.23 0.26 0.30 0.28 0.24 0.26 0.25 0.22 0.22
0.19 0.18 0.20 0.20 0.25 0.25 0.26 0.24 0.25 0.22 0.21 0.19
0.07 0.07 0.09 0.10 0.17 0.16 0.17 0.19 0.22 0.16 0.11 0.08
0.21 0.19 0.21 0.26 0.23 0.31 0.28 0.27 0.25 0.24 0.23 0.22
0.21 0.21 0.20 0.22 0.24 0.24 0.26 0.25 0.25 0.24 0.22 0.22
0.21 0.22 0.31 0.25 0.26 0.25 0.32 0.26 0.26 0.27 0.23 0.20
0.26 0.25 0.25 0.27 0.47 0.29 0.47 0.28 0.31 0.30 0.25 0.26
0.24 0.23 0.24 0.21 0.16 0.15 0.14 0.15 0.15 0.18 0.18 0.21
0.23 0.34 0.25 0.26 0.28 0.27 0.27 0.31 0.24 0.26 0.24 0.22
0.22 0.21 0.21 0.22 0.22 0.31 0.22 0.22 0.20 0.24 0.22 0.21
0.24 0.25 0.25 0.27 0.27 0.27 0.31 0.28 0.26 0.28 0.26 0.25 .
0.24 0.25 0.25 0.27 0.28 0.25 0.25 0.27 0.25 0.30 0.24 0.23
0.25 0.22 0.21 0.23 0.25 0.31 0.29 0.33 0.26 0.23 0.23 0.23
0.25 0.25 0.25 0.26 0.28 0.37 0.31 0.27 0.25 0.28 0.25 0.23
0.26 0.27 0.27 0.28 0.30 0.29 0.31 0.28 0.28 0.28 0.28 0.26
0.22 0.19 0.20 0.22 0.24 0.25 0.41 0.35 0.25 0.23 0.19 0.22
0.23 0.24 0.43 0.26 0.27 0.28 0.31 0.26 0.25 0.26 0.24 0.24
0.26 0.25 0.28 0.25 0.28 0.37 0.39 0.41 0.26 0.27 0.26 0.25
0.25 0.25 0.24 0.26 0.29 0.36 0.52 0.31 0.25 0.25 0.23 0.23
0.39 0.27 0.25 0.28 0.28 0.28 0.28 0.29 0.34 0.26 0.27 0.26
132 0.22 0.25 0.24 0.25 0.28 0.28 0.22 0.26 0.25 0.24 0.25 0.24
135 0.27 0.30 0.27 0.28 0.34 0.37 0.35 0.30 0.27 0.37 0.29 0.27
139 0.27 0.35 0.33 0.30 0.40 0.45 0.34 0.34 0.30 0.29 0.27 0.27
140 0.24 0,25 0.25 0.26 0.28 0.30 0.32 0.27 0.28 0.27 0.24 0.25
MONTHLY MAPS OF DAILY GLOBAL INCIDENT SOLAR RADIATION IN ITALY 775
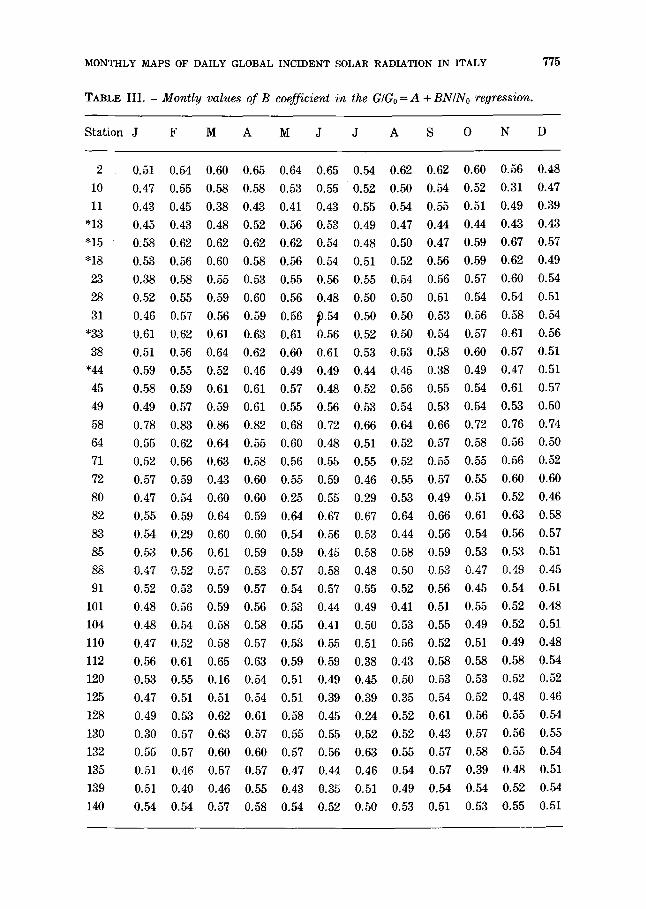
TABLE I I I . - Montly values of B coefficient in the G/Go = A + BN/No regression.
Station J F M A M J J A S 0 N D
2 0.51 0.54 0.60 0.65 0.64 0.65 0.54 0.62 0.62 0.60 0.56 0.48
10 0.47 0.55 0.58 0.58 0.53 0.55 0.52 0.50 0.54 0.52 0.31 0.47
11 0.43 0.45 0.38 0.43 0.41 0.43 0.55 0.54 0.55 0.51 0.49 0.39
"13 0.45 0.43 0.48 0.52 0.56 0.53 0.49 0.47 0.44 0.44 0.43 0.43
"15 0,58 0.62 0.62 0.62 0.62 0.54 0.48 0.50 0.47 0.59 0.67 0.57
"18
23
28
31
*33
38
*44
45
49
58
64
71
72
80
82
83
85
88
91
101
104
110
112
120
125
128
130
132
135
139
140
0.53 0.56 0.60 0.58 0.56 0.54 0.51 0.52 0.56 0.59 0.62 0.49
0.38 0.58 0.55 0.53 0.55 0.56 0.55 0.54 0.56 0.57 0.60 0.54
0.52 0.55 0.59 0.60 0.56 0.48 0.50 0.50 0.51 0.54 0.54 0.51
0.46 0.57 0.56 0.59 0.56 ~54 0.50 0.50 0.53 0.56 0.58 0.54
0.61 0.62 0.61 0.63 0.61 0.56 0.52 0.50 0.54 0.57 0.61 0.56
0.51 0.56 0.64 0.62 0.60 0.61 0.53 0.53 0.58 0.60 0.57 0.51
0.59 0.55 0.52 0.46 0.49 0.49 0.44 0.45 0.38 0.49 0.47 0.51
0.58 0.59 0.61 0.61 0.57 0.48 0.52 0.56 0.55 0.54 0.61 0.57
0.49 0.57 0.59 0.61 0.55 0.56 0.53 0.54 0.53 0.54 0.53 0.50
0.78 0.83 0.86 0.82 0.68 0.72 0.66 0.64 0.66 0.72 0.76 0.74
0.55 0.62 0.64 0.55 0.60 0.48 0.51 0.52 0.57 0.58 0.56 0.50
0.52 0.56 0.63 0.58 0.56 0.55 0.55 0.52 0.55 0.55 0.56 0.52
0.57 0.59 0.43 0.60 0.55 0.59 0.46 0.55 0.57 0.55 0.60 0.60
0.47 0.54 0.60 0.60 0.25 0.55 0.29 0.53 0.49 0.51 0.52 0.46
0.55 0.59 0.64 0.59 0.64 0.67 0.67 0.64 0.66 0.61 0.63 0.58
0.54 0.29 0.60 0.60 0.54 0.56 0.53 0.44 0.56 0.54 0.56 0.57
0.53 0.56 0.61 0.59 0.59 0.45 0.58 0.58 0.59 0.53 0.53 0.51
0.47 0.52 0.57 0.53 0.57 0.58 0.48 0.50 0.53 0.47 0.49 0.45
0.52 0.53 0.59 0.57 0.54 0.57 0.55 0.52 0.56 0.45 0.54 0.51
0.48 0.56 0.59 0.56 0.53 0.44 0.49 0.41 0.51 0.55 0.52 0.48
0.48 0.54 0.58 0.58 0.55 0.41 0.50 0.53 0.55 0.49 0.52 0.51
0.47 0.52 0.58 0.57 0.53 0.55 0.51 0.56 0.52 0.51 0.49 0.48
0.56 0.61 0.65 0.63 0.59 0.59 0.38 0.43 0.58 0.58 0.58 0.54
0.53 0.55 0.16 0.54 0.51 0.49 0.45 0.50 0.53 0.53 0.52 0.52
0.47 0.51 0.51 0.54 0.51 0.39 0.39 0.35 0.54 0.52 0.48 0.46
0.49 0.53 0.62 0.61 0.58 0.45 0.24 0.52 0.61 0.56 0.55 0.54
0.30 0.57 0.63 0.57 0.55 0.55 0.52 0.52 0.43 0.57 0.56 0.55
0.55 0.57 0.60 0.60 0.57 0.56 0.63 0.55 0.57 0.58 0.55 0.54
0.51 0.46 0.57 0.57 0.47 0.44 0.46 0.54 0.57 0.39 0.48 0.51
0.51 0.40 0.46 0.55 0.43 0.35 0.51 0.49 0.54 0.54 0.52 0.54
0.54 0.54 0.57 0.58 0.54 0.52 0.50 0.53 0.51 0.53 0.55 0.51
~ ' 6 A. L A V A G N I N I , S. M A R T O R E L L I and c . C O R E T T I
latitude. These t rends are masked by local microclimatic effects, which will be discussed in the following, but above all by the above-mentioned low significance of A and B corresponding to low correlation coefficients R.
Taking into consideration the above-mentioned t rends of A and B, it seems
1.0
0.8
0.6
0.~.
0 .2
o 0
c~ 1 .0
~ )
x
x
x �9 x
:K x X
x x �9 x
x ]~ x x x
X
X x X ~
�9 X X
x x x x
, , , , ' , l h I , , t , , , , , " " : 1 1 , , ,
x ]~ x x . . . , , . , . t i l l td |N | ~ Ah x
I t x | ] z ~ x x x x x ~ x x x �9 z . | x �9
�9 II , , f l t i t x t . { x
x x x �9 x > x i x
I I l I i i i i [
b ) x
x
o . B . , . , . , , , | ~ f :
�9 ,, x x x x x x x z
x x �9 �9 . { } �9 >
0.6 ~ t . . : ' , �9 { " '.' I �9 �9 x ~ x x x X X ~ x~ ~ ][ x )L x x
�9 x �9 ~ x x Xx x x x x x x �9 x ~ ), x x ~ X x x x x x x ~ �9 x x �9 x x ~ x X . x x
x x x x I t x x Q : x x x x ~ x x x - ~ x ~ x x x~ [ x .<
x " | �9 x x x x x ~ x
0 . 4 �9 x xx x x x �9 x x �9 x x x x x " x
. x x x t . ,, t
I x x x x x �9 ]~ x x x ~ x x x x
X x X x x
O . 2 ]1 x xxx x X x x
x x x x x X x x x x
x
1 I I I 1 I I t I
0 0 . 2 0 . 4 0 . 6 0 . 8 N / N o 1 .0
Fig. 2. - Spread of points of the linear regression: G/Go = A + B N / N e in 2 cases of relative high and low correlation: a) Alghero, July (R = 0.64); b) Alghero, March (R = 0.92).
MONTHLY MAPS OF DAILY GLOBAL INCIDENT SOLAR RADIATION IN ITALY 777
reasonable to assume that the parameter T = A + B is practically invariant with
latitude. As can be easily calculated from tables II and III, this quantity has a practically constant value throughout Italian territory. The seasonal variation is quite small, with a mean value of 0.75 in Winter, 0.82 in Spring, 0.79 in Summer and Autumn. The variation around these values, except in the case of rare exceptions which can usually be explained, is about 10%.
Since the aim of the present work was to evaluate the A and B parameters for vast areas of territory, the term T was taken as a mean reference value and each month for which, the T value of the station considered differed by more than 10% from the mean value, it was deemed to be affected by local microclimatic conditions or by error and therefore excluded from the computation of the mean value of A or B in the area concerned.
In consideration of the above criteria, Italy has been divided up, for each month, into 8-9 areas, to each of them mean values of A and B have been associated.
In order to evaluate how much such an extrapolation moves away from the experimental data, the A and B values, characteristic of each area, have been used for calculating, by means of eq. (4), the global radiation also for the 36 stations (listed in tables II and III) in which this parameter was available because measured. Excluding the station of Modena, the differences between calculated and measured values are not greater than ___ 10%. Table IV shows the histogram of such differences.
The method described was thus deemed suitable for computing the radiation for the remaining 104 sunshine stations.
TABLE IV. - Frequency distribution of percentage differences between monthly mean global radiation measured and calculated for 36 Italian stations.
differ- [- 10, - 6) [- 6, - 2) [- 2, + 2) [+ 2, + 6) [+ 6, + 10) farther _+ 10 ence (%)
frequen- 5.0 11.9 52.9 22.1 6.4 1.7 cy (%)
4 . - R e s u l t s .
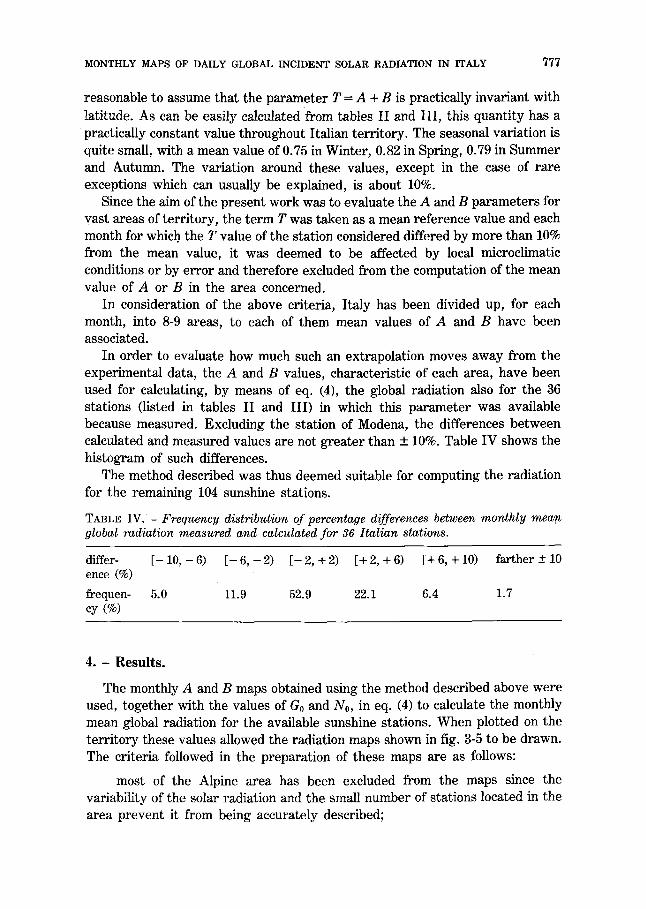
The monthly A and B maps obtained using the method described above were used, together with the values of Go and No, in eq. (4) to calculate the monthly mean global radiation for the available sunshine stations. When plotted on the territory these values allowed the radiation maps shown in fig. 3-5 to be drawn. The criteria followed in the preparation of these maps are as follows:
most of the Alpine area has been excluded from the maps since the variability of the solar radiation and the small number of stations located in the area prevent it from being accurately described;
778 A. LAVAGNINI, S. MARTORELLI and C. CORETTI
Fig. 3. - Mean daily global radiation in MJ. m -2. d -1 for January (a)), F e b r u a r y (b)), March (c)) and Apri l (d)).
MONTHLY MAPS OF DAILY GLOBAL INCIDENT SOLAR RADIATION IN ITALY 779
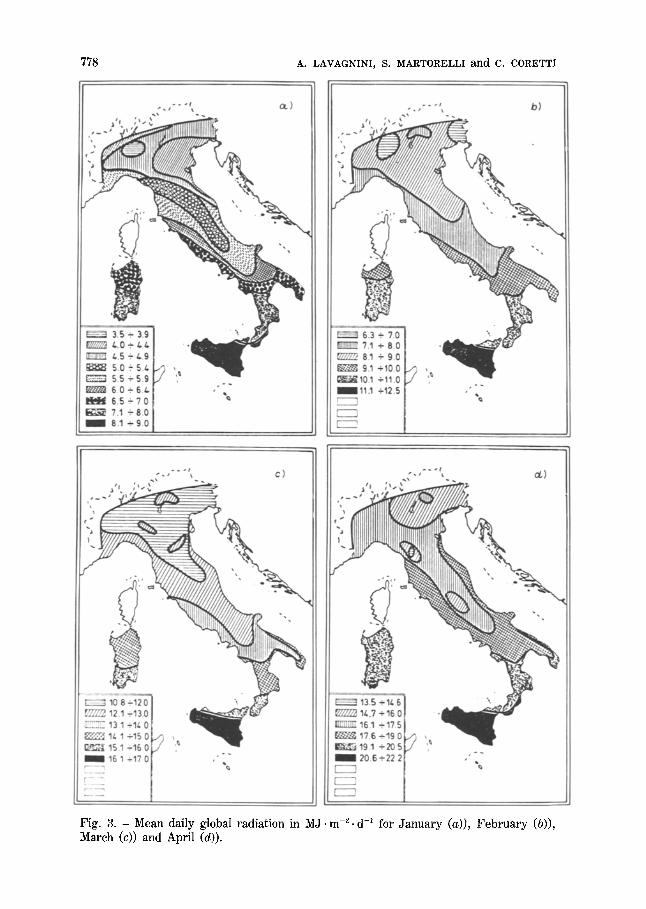
Fig. 4. - The same as fig. 3 bu t for May (a)), J u n e (b)), Ju ly (c)) and Augus t (d)).
780 A. LAVAGNINI, S. MARTORELLI and c. CORETTI
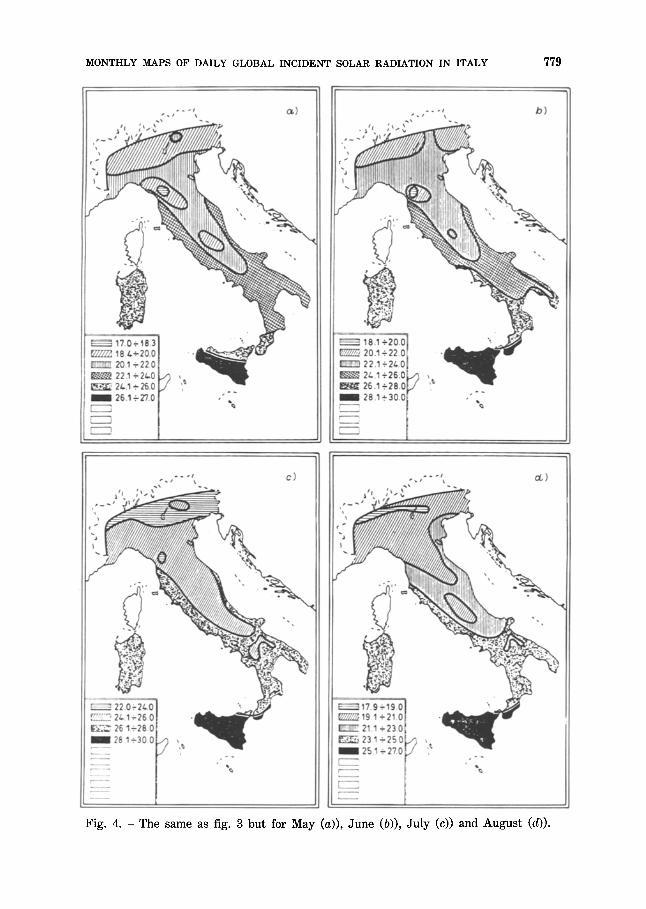
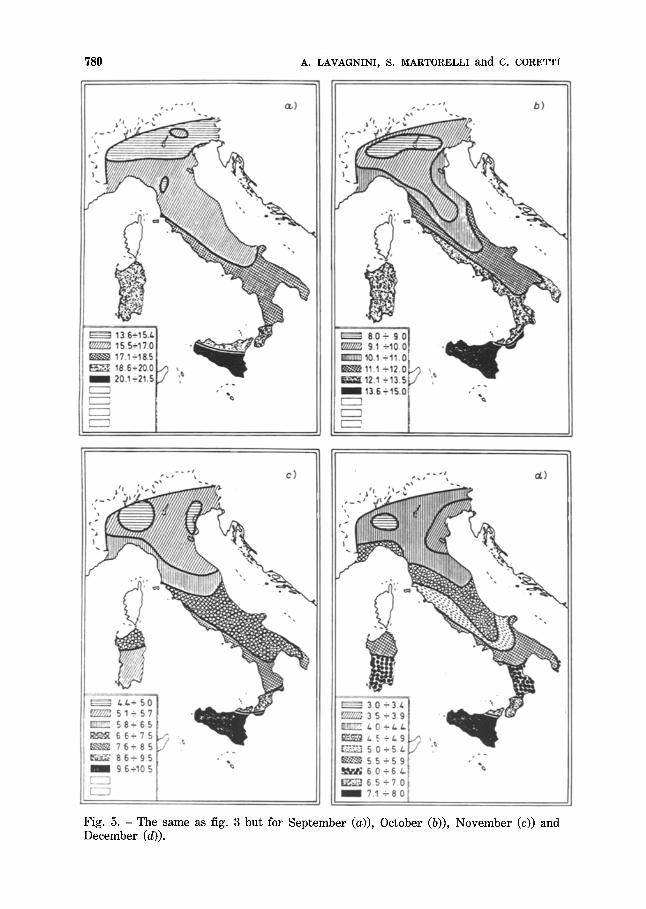
Fig. 5. - The same as fig. 3 bu t for Sep tember (a)), October (b)), November (c)) and December (d)).
M O N T H L Y M A P S OF D A I L Y G L O B A L I N C I D E N T S O L A R R A D I A T I O N I N I T A L Y 7 8 1
if a single station (e.g., Mt. Cimone or Mt. Terminillo) has a different radiation value from that of neighbouring stations it is not taken into account when defining the areas of equal radiation;
the lines delimiting equal radiation areas vary among themselves by about 10%.
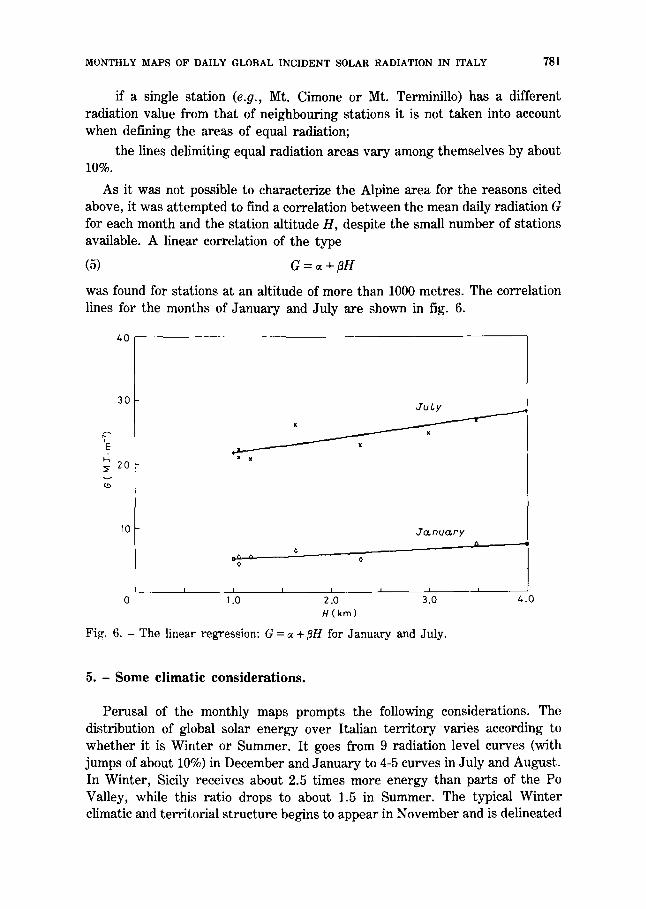
As it was not possible to characterize the Alpine area for the reasons cited above, it was attempted to find a correlation between the mean daily radiation G for each month and the station altitude H, despite the small number of stations available. A linear correlation of the type
(5) G = ~ + ;~H
was found for stations at an altitude of more than 1000 metres. The correlation lines for the months of January and July are shown in fig. 6.
40
30
'E
: ~ 2 0
10
x J~t y
r
,.T~nu~r'y
i J0 I I . i i 0 I. 2.0 3.0
H(km)
Fig. 6. - The linear regression: G = a + ~H for January and July.
4 . 0
5. - S o m e c l i m a t i c c o n s i d e r a t i o n s .
Perusal of the monthly maps prompts the following considerations. The distribution of global solar energy over Italian territory varies according to whether it is Winter or Summer. It goes from 9 radiation level curves (with jumps of about 10%) in December and January to 4-5 curves in July and August. In Winter, Sicily receives about 2.5 times more energy than parts of the Po Valley, while this ratio drops to about 1.5 in Summer. The typical Winter climatic and territorial structure begins to appear in November and is delineated
782 A. LAVAGNINI~ S. MARTORELLI and C. CORETTI
more clearly in December and January. The Summer structure emerges in June and July when, except for a few small areas in the Apennines and the Alpine slopes, extensive areas of the peninsula appear to be uniform: in June some 70% of the Italian peninsula (excluding the islands) is included in only 2 energy zones (between 22 and 26 MJ/m -2 per day); in July the same climate is extended to most of the Po Valley, Molise, and penetrates parts of Puglia and Lucania. At the same latitudes, the Tyrrhenian Coast seems to get more sunshine than the Adriatic, something which is much more evident in the six months between August and January than between February and July.
6 . - C o n c l u s i o n s .
The climatic zones resulting from the survey of global incident radiation in the present investigation still appear to be unsatisfactolily defined in some areas of the Peninsula, such as Sicily, Sardinia, Appennine range and Alps mountains.
Too few stations and all along the coast in Sicily and in Sardinia have been analysed. That means that the global radiation in the interland has been calculated only on the basis of the coast line measurements. In these areas too discretion is still left to the map-maker.
The linear relationship between radiation and altitude for Alpine stations located above 1000 metres can, in the absence of any other information, allow the mean daily energy available to be computed, although further confirmation will be needed as soon as a larger data set is available.
The authors wish to thank Messrs. P. Mollo and C. Transerici for drawing the tables, the graphs and the maps, as well as Miss M. P. Passeri for typing the manuscript.
REFERENCES
[1] A. GUERRINI, A. LAVAGNINI and F. M. VIVONA: L'insolazione sull'Italia. IFA report SP 11 (1976), p. 112.
[2] D. CAMUFFO and A. LAVAGNINI: Insolation over Italy: Percentages of Daily Totals of Global Radiation on 31 Sites, Measured from 1958 to 1977, in Revue Internationale d'Heliotecnique de la COMPLES, 2 Sem. 6-10 (1980).
[3] Commission of European Communities: European Solar Radiation Atlas, Vol. 1: Global radiation on Horizontal Surfaces (Grosschen-Verlag, Dortmund, 1979), p. 218.
[4] A. LAVAGNINI and S. MARTORELLI: La radiazione solare in Italia: frequenze cumulate della radiazione globale giornaliera, IFA report 83/08 (1983), p. xx.
[5] J. K. PAGE: Methods for the estimation of solar energy on vertical and inclined surfaces, Sheffield, University of Sheffield, Department of Bilding Science, BS No. 46 (1978).