Embed Size (px)
Citation preview
FAST COMPUTATION OF INCIDENT SOLAR RADIATION FROM PRELIMINARY TO FINAL BUILDING DESIGN
Nathaniel L. Jones and Donald P. Greenberg
Program of Computer Graphics, Cornell University, Ithaca, New York, USA
ABSTRACT Accurate calculation of direct solar radiation with current methods is slow and frequently requires over-simplification of building geometry to obtain expedient performance simulations. This paper describes the use of a fast new method for calculating direct solar gains on architectural CAD models at any stage in design. A pre-processing module computes direct incident solar radiation with high accuracy several orders of magnitude faster than common analytical approaches. The technique is illustrated using preliminary CAD models of two existing buildings that are gradually made more complex through the addition of intricate louvered shading devices, foliage, and adjacent urban structures. Each refinement allows EnergyPlus to calculate much more accurate direct solar gain data with only minimal increase in pre-processing time and no effect on energy simulation time.
INTRODUCTION Accurate calculation of direct solar radiation is necessary for predicting the thermal performance of the built environment. Due to the sun’s continuously changing position, the potential complexity of a building’s geometry and shading devices, and the occlusion effects of the surrounding environment, current methods used by validated simulation software require excessive computation time. As a result, designers rarely perform simulations during conceptual or schematic design, and building models are frequently over-simplified for performance simulations, even at the end of the design process. Modern computer-aided design (CAD) software enables architects to generate increasingly complex forms in early design stages. Preliminary design models often include the proposed building’s site and may incorporate intricate sunscreens and shading devices. Unfortunately, building energy simulation (BES) software has not kept pace with this trend toward more geometrically complicated building models. Most architectural firms do not generate thermal building simulation results in-house and instead forward their designs to an energy consultant for evaluation only after the design is substantially complete. Consulting engineers in turn typically produce their own simplified models for BES
analysis, so the architect receives little feedback on the thermal effects of complex geometry, and this only after many design decisions are finalized. This paper describes the use of a fast new method for calculating direct solar gains on architectural CAD models using a pre-processing module prior to simulation with EnergyPlus (LBNL, 2010). The pre-processor implements two novel procedures previously described in Jones et al. (2011). First, it uses modern computer graphics algorithms built into the graphics pipeline to render images from the sun’s point-of-view and counts the illuminated pixels in an off-screen depth buffer to predict the sunlit fraction of each surface. This procedure has the flexibility to handle concave polygons, polygons with holes, and curved shapes, and can account for shading from other building components, foliage, and urban surroundings without any significant increase in computation time. Second, the pre-processor stores and interpolates data for each external building surface using a parametric B-spline surface representation. This allows it to measure the fraction of each external surface receiving solar radiation infrequently while still providing accurate data for each building surface at any time during the year. The speed and effectiveness of these techniques are demonstrated through application to the design process of two buildings. The Blaas General Partnership headquarters in Bolzano, Italy, and The New York Times Building in Manhattan, New York, both exemplify the complexity of shading geometry found in real buildings. In each case study, a CAD model of the selected building was gradually made more complex through the addition of intricate shading devices, adjacent urban structures, and foliage, as is typical in schematic design. Each refinement significantly improves accuracy with little or no increase in pre-processing time and no effect on EnergyPlus simulation time. The speed-up is especially significant for large, geometrically complex models that have previously been impractical to analyse with standard BES software.
ALGORITHM Previous Work EnergyPlus calculates direct incident solar radiation using an algorithm inherited from BLAST (CERL,
Proceedings of Building Simulation 2011: 12th Conference of International Building Performance Simulation Association, Sydney, 14-16 November.
- 577 -
1977). The direct incident radiation quantity is given by
where Ib is the intensity of direct radiation, As and At are the sunlit and total areas of the surface of interest, respectively, and is the incidence angle of the sun’s rays (EnergyPlus Development Team, 2010). The computationally intensive part of this calculation is finding the area of the sunlit portion of the surface. EnergyPlus uses polygon Boolean operations for this step (Groth and Lokmanhekim, 1969; Walton, 1979). However, this method is limited in application by the algorithm used for Boolean operations.
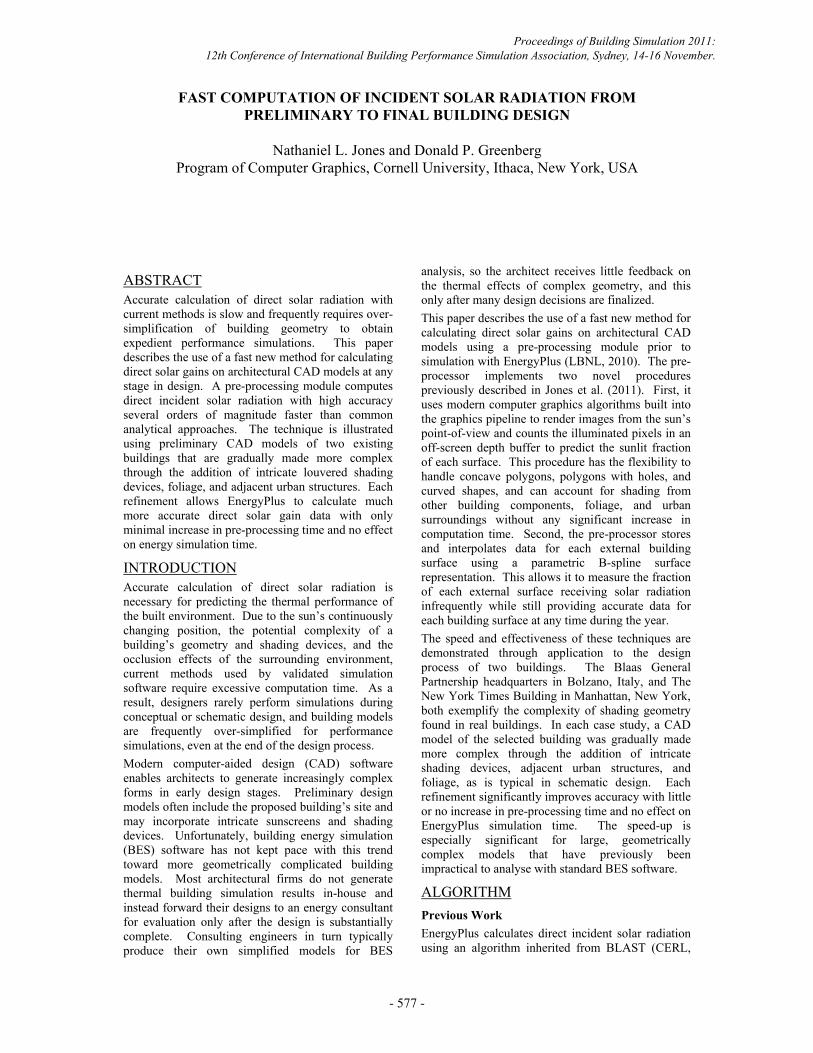
Pixel Counting The algorithm used in this paper is briefly described here, with details available in the reference. It avoids analytical polygon Boolean operations altogether and instead uses digital graphic rendering to create a depth map image of the receiving surface from the sun’s vantage point. For a given receiving surface and solar position, a projection matrix is calculated such that the left, right, top, and bottom clipping planes of the orthogonal view frustum are oriented parallel to the sun’s rays. These clipping planes are set so that they tightly enclose the receiving surface (Figure 1). Portions of the surface in shadow are obscured in the image, so the number of pixels N rendered as part of the surface is proportional to its sunlit area. This is approximate because pixels partially overlapping the receiving surface will be counted as either wholly in or out, but the error introduced by this aliasing effect is negligible. An image of 512 × 512 pixels produces results accurate to three decimal places (Jones et al., 2011). Given the constant area Ap of a pixel derived from the projection matrix, a substitution may be made that bypasses analytical calculation of As and vastly speeds up computation of the factor in equation (1):
In graphics hardware, N can be obtained by drawing the receiving surface while using an occlusion query (Bartz et al., 1999). The rendering steps occur very quickly and with a small memory footprint.
Figure 1 Orthogonal view frustum clipping planes are fit to a receiving surface, shown highlighted, to
create a pixelated image for counting
B-Splines A B-spline is a parametric curve in n-dimensional space with a variation diminishing property such that
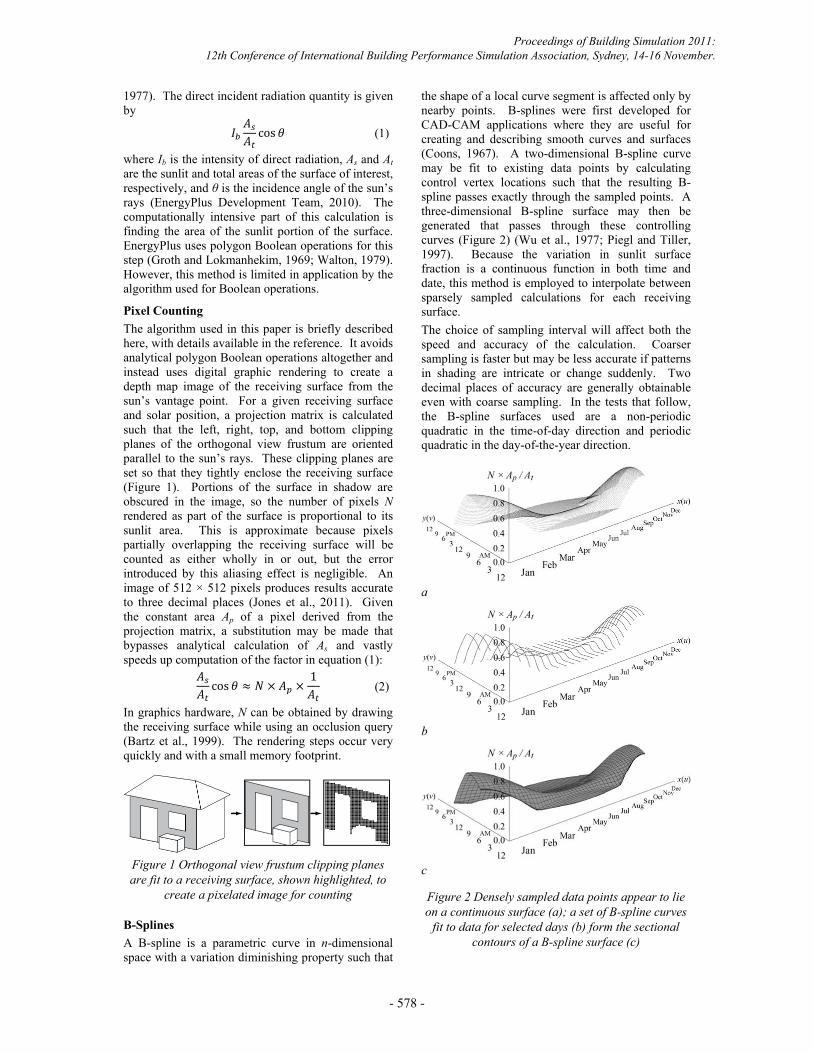
the shape of a local curve segment is affected only by nearby points. B-splines were first developed for CAD-CAM applications where they are useful for creating and describing smooth curves and surfaces (Coons, 1967). A two-dimensional B-spline curve may be fit to existing data points by calculating control vertex locations such that the resulting B-spline passes exactly through the sampled points. A three-dimensional B-spline surface may then be generated that passes through these controlling curves (Figure 2) (Wu et al., 1977; Piegl and Tiller, 1997). Because the variation in sunlit surface fraction is a continuous function in both time and date, this method is employed to interpolate between sparsely sampled calculations for each receiving surface. The choice of sampling interval will affect both the speed and accuracy of the calculation. Coarser sampling is faster but may be less accurate if patterns in shading are intricate or change suddenly. Two decimal places of accuracy are generally obtainable even with coarse sampling. In the tests that follow, the B-spline surfaces used are a non-periodic quadratic in the time-of-day direction and periodic quadratic in the day-of-the-year direction.
a
b
c
Figure 2 Densely sampled data points appear to lie on a continuous surface (a); a set of B-spline curves
fit to data for selected days (b) form the sectional contours of a B-spline surface (c)
(1)
(2)
Proceedings of Building Simulation 2011: 12th Conference of International Building Performance Simulation Association, Sydney, 14-16 November.
- 578 -
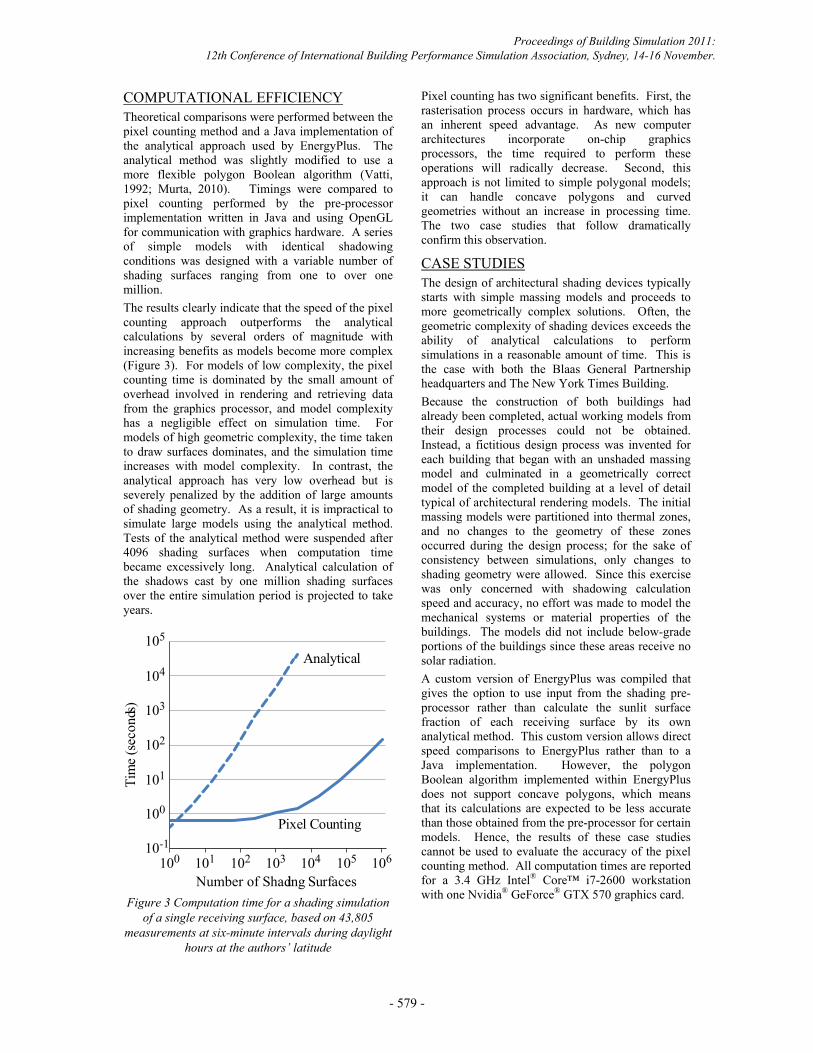
COMPUTATIONAL EFFICIENCY Theoretical comparisons were performed between the pixel counting method and a Java implementation of the analytical approach used by EnergyPlus. The analytical method was slightly modified to use a more flexible polygon Boolean algorithm (Vatti, 1992; Murta, 2010). Timings were compared to pixel counting performed by the pre-processor implementation written in Java and using OpenGL for communication with graphics hardware. A series of simple models with identical shadowing conditions was designed with a variable number of shading surfaces ranging from one to over one million. The results clearly indicate that the speed of the pixel counting approach outperforms the analytical calculations by several orders of magnitude with increasing benefits as models become more complex (Figure 3). For models of low complexity, the pixel counting time is dominated by the small amount of overhead involved in rendering and retrieving data from the graphics processor, and model complexity has a negligible effect on simulation time. For models of high geometric complexity, the time taken to draw surfaces dominates, and the simulation time increases with model complexity. In contrast, the analytical approach has very low overhead but is severely penalized by the addition of large amounts of shading geometry. As a result, it is impractical to simulate large models using the analytical method. Tests of the analytical method were suspended after 4096 shading surfaces when computation time became excessively long. Analytical calculation of the shadows cast by one million shading surfaces over the entire simulation period is projected to take years.
Figure 3 Computation time for a shading simulation
of a single receiving surface, based on 43,805 measurements at six-minute intervals during daylight
hours at the authors�’ latitude
Pixel counting has two significant benefits. First, the rasterisation process occurs in hardware, which has an inherent speed advantage. As new computer architectures incorporate on-chip graphics processors, the time required to perform these operations will radically decrease. Second, this approach is not limited to simple polygonal models; it can handle concave polygons and curved geometries without an increase in processing time. The two case studies that follow dramatically confirm this observation.
CASE STUDIES The design of architectural shading devices typically starts with simple massing models and proceeds to more geometrically complex solutions. Often, the geometric complexity of shading devices exceeds the ability of analytical calculations to perform simulations in a reasonable amount of time. This is the case with both the Blaas General Partnership headquarters and The New York Times Building. Because the construction of both buildings had already been completed, actual working models from their design processes could not be obtained. Instead, a fictitious design process was invented for each building that began with an unshaded massing model and culminated in a geometrically correct model of the completed building at a level of detail typical of architectural rendering models. The initial massing models were partitioned into thermal zones, and no changes to the geometry of these zones occurred during the design process; for the sake of consistency between simulations, only changes to shading geometry were allowed. Since this exercise was only concerned with shadowing calculation speed and accuracy, no effort was made to model the mechanical systems or material properties of the buildings. The models did not include below-grade portions of the buildings since these areas receive no solar radiation. A custom version of EnergyPlus was compiled that gives the option to use input from the shading pre-processor rather than calculate the sunlit surface fraction of each receiving surface by its own analytical method. This custom version allows direct speed comparisons to EnergyPlus rather than to a Java implementation. However, the polygon Boolean algorithm implemented within EnergyPlus does not support concave polygons, which means that its calculations are expected to be less accurate than those obtained from the pre-processor for certain models. Hence, the results of these case studies cannot be used to evaluate the accuracy of the pixel counting method. All computation times are reported for a 3.4 GHz Intel® Core™ i7-2600 workstation with one Nvidia® GeForce® GTX 570 graphics card.
101
100
100
Tim
e(s
econ
ds)
Number of Shading Surfaces
Analytical
Pixel Counting
102
103
104
105
101 102 103 104 105 10610-1
Proceedings of Building Simulation 2011: 12th Conference of International Building Performance Simulation Association, Sydney, 14-16 November.
- 579 -
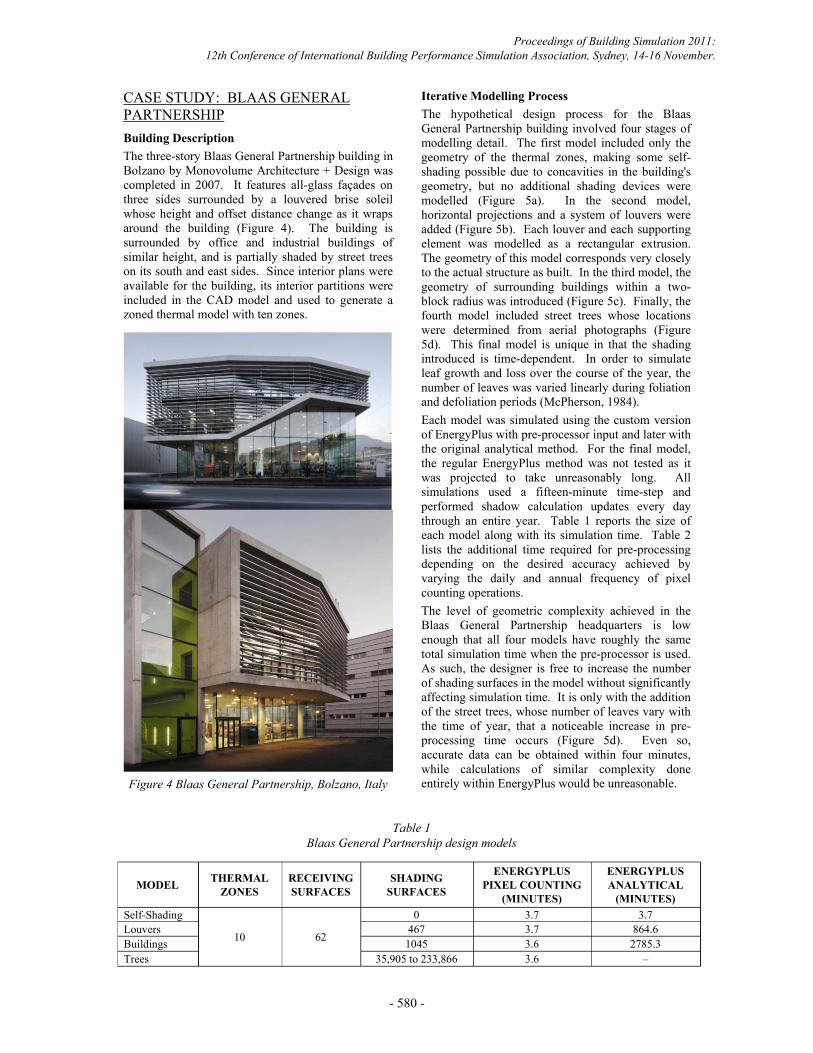
CASE STUDY: BLAAS GENERAL PARTNERSHIP Building Description The three-story Blaas General Partnership building in Bolzano by Monovolume Architecture + Design was completed in 2007. It features all-glass façades on three sides surrounded by a louvered brise soleil whose height and offset distance change as it wraps around the building (Figure 4). The building is surrounded by office and industrial buildings of similar height, and is partially shaded by street trees on its south and east sides. Since interior plans were available for the building, its interior partitions were included in the CAD model and used to generate a zoned thermal model with ten zones.
Figure 4 Blaas General Partnership, Bolzano, Italy
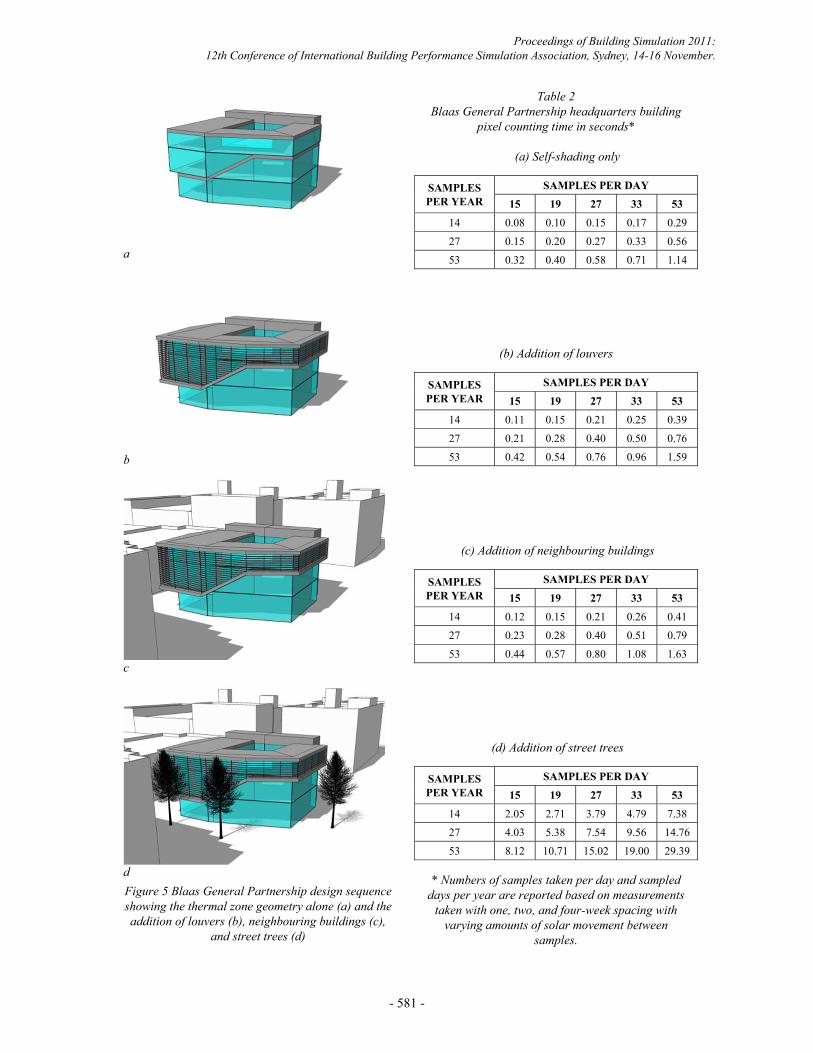
Iterative Modelling Process The hypothetical design process for the Blaas General Partnership building involved four stages of modelling detail. The first model included only the geometry of the thermal zones, making some self-shading possible due to concavities in the building's geometry, but no additional shading devices were modelled (Figure 5a). In the second model, horizontal projections and a system of louvers were added (Figure 5b). Each louver and each supporting element was modelled as a rectangular extrusion. The geometry of this model corresponds very closely to the actual structure as built. In the third model, the geometry of surrounding buildings within a two-block radius was introduced (Figure 5c). Finally, the fourth model included street trees whose locations were determined from aerial photographs (Figure 5d). This final model is unique in that the shading introduced is time-dependent. In order to simulate leaf growth and loss over the course of the year, the number of leaves was varied linearly during foliation and defoliation periods (McPherson, 1984). Each model was simulated using the custom version of EnergyPlus with pre-processor input and later with the original analytical method. For the final model, the regular EnergyPlus method was not tested as it was projected to take unreasonably long. All simulations used a fifteen-minute time-step and performed shadow calculation updates every day through an entire year. Table 1 reports the size of each model along with its simulation time. Table 2 lists the additional time required for pre-processing depending on the desired accuracy achieved by varying the daily and annual frequency of pixel counting operations. The level of geometric complexity achieved in the Blaas General Partnership headquarters is low enough that all four models have roughly the same total simulation time when the pre-processor is used. As such, the designer is free to increase the number of shading surfaces in the model without significantly affecting simulation time. It is only with the addition of the street trees, whose number of leaves vary with the time of year, that a noticeable increase in pre-processing time occurs (Figure 5d). Even so, accurate data can be obtained within four minutes, while calculations of similar complexity done entirely within EnergyPlus would be unreasonable.
Table 1 Blaas General Partnership design models
MODEL THERMAL ZONES
RECEIVING SURFACES
SHADING SURFACES
ENERGYPLUS PIXEL COUNTING
(MINUTES)
ENERGYPLUS ANALYTICAL
(MINUTES) Self-Shading
10 62
0 3.7 3.7 Louvers 467 3.7 864.6 Buildings 1045 3.6 2785.3 Trees 35,905 to 233,866 3.6 –
Proceedings of Building Simulation 2011: 12th Conference of International Building Performance Simulation Association, Sydney, 14-16 November.
- 580 -
a
b
c
d
Figure 5 Blaas General Partnership design sequence showing the thermal zone geometry alone (a) and the addition of louvers (b), neighbouring buildings (c),
and street trees (d)
Table 2 Blaas General Partnership headquarters building
pixel counting time in seconds*
(a) Self-shading only
SAMPLES PER YEAR
SAMPLES PER DAY 15 19 27 33 53
14 0.08 0.10 0.15 0.17 0.29
27 0.15 0.20 0.27 0.33 0.56
53 0.32 0.40 0.58 0.71 1.14
(b) Addition of louvers
SAMPLES PER YEAR
SAMPLES PER DAY 15 19 27 33 53
14 0.11 0.15 0.21 0.25 0.39
27 0.21 0.28 0.40 0.50 0.76
53 0.42 0.54 0.76 0.96 1.59
(c) Addition of neighbouring buildings
SAMPLES PER YEAR
SAMPLES PER DAY
15 19 27 33 53
14 0.12 0.15 0.21 0.26 0.41
27 0.23 0.28 0.40 0.51 0.79
53 0.44 0.57 0.80 1.08 1.63
(d) Addition of street trees
SAMPLES PER YEAR
SAMPLES PER DAY
15 19 27 33 53
14 2.05 2.71 3.79 4.79 7.38
27 4.03 5.38 7.54 9.56 14.76
53 8.12 10.71 15.02 19.00 29.39
* Numbers of samples taken per day and sampled days per year are reported based on measurements
taken with one, two, and four-week spacing with varying amounts of solar movement between
samples.
Proceedings of Building Simulation 2011: 12th Conference of International Building Performance Simulation Association, Sydney, 14-16 November.
- 581 -
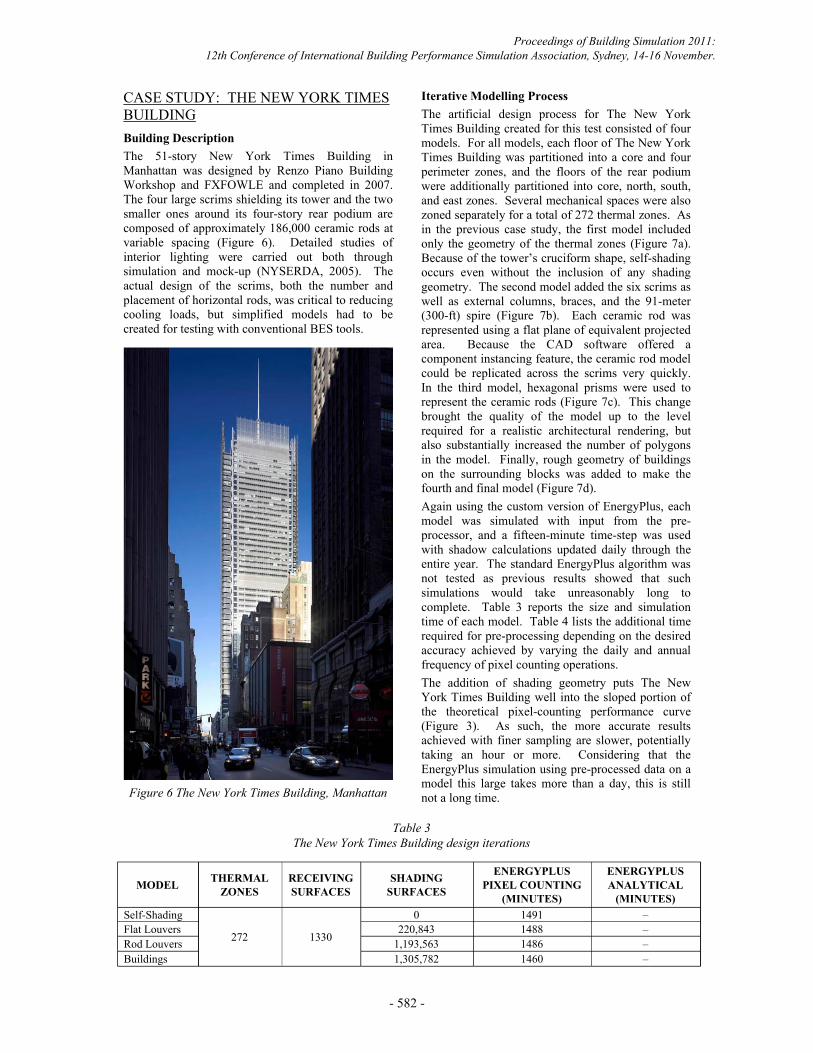
CASE STUDY: THE NEW YORK TIMES BUILDING Building Description The 51-story New York Times Building in Manhattan was designed by Renzo Piano Building Workshop and FXFOWLE and completed in 2007. The four large scrims shielding its tower and the two smaller ones around its four-story rear podium are composed of approximately 186,000 ceramic rods at variable spacing (Figure 6). Detailed studies of interior lighting were carried out both through simulation and mock-up (NYSERDA, 2005). The actual design of the scrims, both the number and placement of horizontal rods, was critical to reducing cooling loads, but simplified models had to be created for testing with conventional BES tools.
Figure 6 The New York Times Building, Manhattan
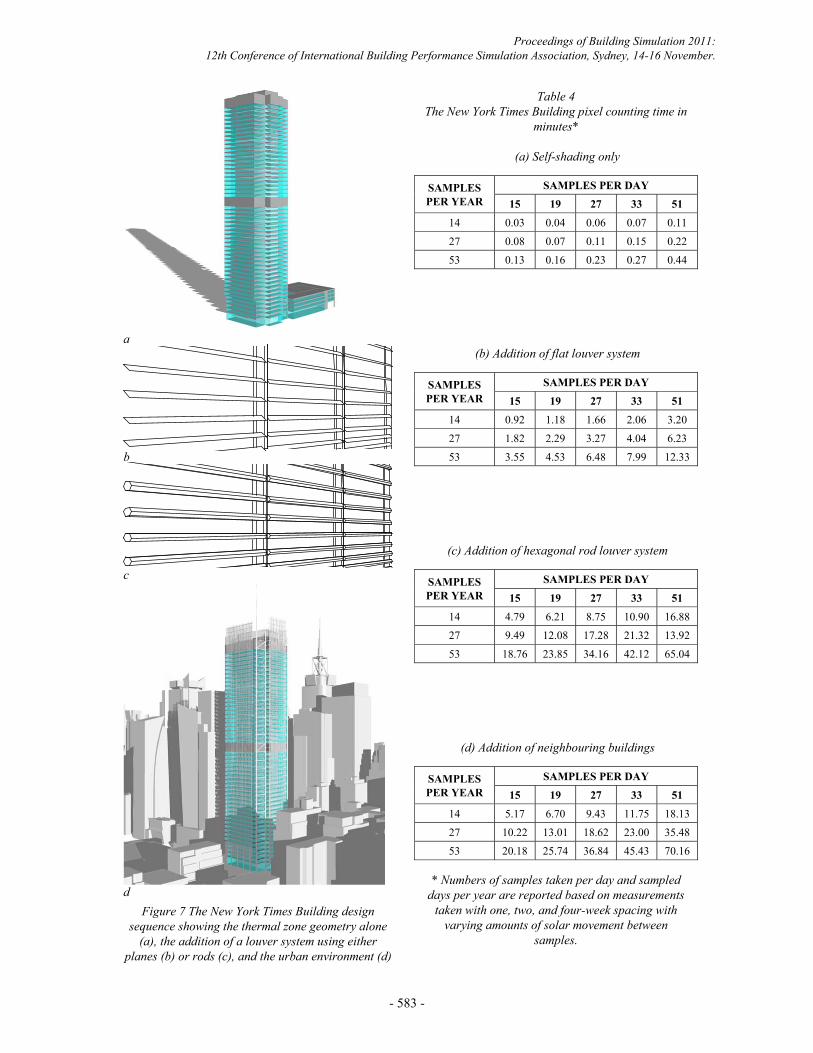
Iterative Modelling Process The artificial design process for The New York Times Building created for this test consisted of four models. For all models, each floor of The New York Times Building was partitioned into a core and four perimeter zones, and the floors of the rear podium were additionally partitioned into core, north, south, and east zones. Several mechanical spaces were also zoned separately for a total of 272 thermal zones. As in the previous case study, the first model included only the geometry of the thermal zones (Figure 7a). Because of the tower’s cruciform shape, self-shading occurs even without the inclusion of any shading geometry. The second model added the six scrims as well as external columns, braces, and the 91-meter (300-ft) spire (Figure 7b). Each ceramic rod was represented using a flat plane of equivalent projected area. Because the CAD software offered a component instancing feature, the ceramic rod model could be replicated across the scrims very quickly. In the third model, hexagonal prisms were used to represent the ceramic rods (Figure 7c). This change brought the quality of the model up to the level required for a realistic architectural rendering, but also substantially increased the number of polygons in the model. Finally, rough geometry of buildings on the surrounding blocks was added to make the fourth and final model (Figure 7d). Again using the custom version of EnergyPlus, each model was simulated with input from the pre-processor, and a fifteen-minute time-step was used with shadow calculations updated daily through the entire year. The standard EnergyPlus algorithm was not tested as previous results showed that such simulations would take unreasonably long to complete. Table 3 reports the size and simulation time of each model. Table 4 lists the additional time required for pre-processing depending on the desired accuracy achieved by varying the daily and annual frequency of pixel counting operations. The addition of shading geometry puts The New York Times Building well into the sloped portion of the theoretical pixel-counting performance curve (Figure 3). As such, the more accurate results achieved with finer sampling are slower, potentially taking an hour or more. Considering that the EnergyPlus simulation using pre-processed data on a model this large takes more than a day, this is still not a long time.
Table 3 The New York Times Building design iterations
MODEL THERMAL ZONES
RECEIVING SURFACES
SHADING SURFACES
ENERGYPLUS PIXEL COUNTING
(MINUTES)
ENERGYPLUS ANALYTICAL
(MINUTES) Self-Shading
272 1330
0 1491 – Flat Louvers 220,843 1488 – Rod Louvers 1,193,563 1486 – Buildings 1,305,782 1460 –
Proceedings of Building Simulation 2011: 12th Conference of International Building Performance Simulation Association, Sydney, 14-16 November.
- 582 -
a
b
c
d
Figure 7 The New York Times Building design sequence showing the thermal zone geometry alone
(a), the addition of a louver system using either planes (b) or rods (c), and the urban environment (d)
Table 4 The New York Times Building pixel counting time in
minutes*
(a) Self-shading only
SAMPLES PER YEAR
SAMPLES PER DAY 15 19 27 33 51
14 0.03 0.04 0.06 0.07 0.11
27 0.08 0.07 0.11 0.15 0.22
53 0.13 0.16 0.23 0.27 0.44
(b) Addition of flat louver system
SAMPLES PER YEAR
SAMPLES PER DAY 15 19 27 33 51
14 0.92 1.18 1.66 2.06 3.20
27 1.82 2.29 3.27 4.04 6.23
53 3.55 4.53 6.48 7.99 12.33
(c) Addition of hexagonal rod louver system
SAMPLES PER YEAR
SAMPLES PER DAY
15 19 27 33 51
14 4.79 6.21 8.75 10.90 16.88
27 9.49 12.08 17.28 21.32 13.92
53 18.76 23.85 34.16 42.12 65.04
(d) Addition of neighbouring buildings
SAMPLES PER YEAR
SAMPLES PER DAY
15 19 27 33 51
14 5.17 6.70 9.43 11.75 18.13
27 10.22 13.01 18.62 23.00 35.48
53 20.18 25.74 36.84 45.43 70.16
* Numbers of samples taken per day and sampled days per year are reported based on measurements
taken with one, two, and four-week spacing with varying amounts of solar movement between
samples.
Proceedings of Building Simulation 2011: 12th Conference of International Building Performance Simulation Association, Sydney, 14-16 November.
- 583 -

CONCLUSION A fast new method for calculating the solar gain on architectural CAD models at any stage in design has been presented. The method relies on two novel procedures, hardware pixel counting combined with B-spline surface interpolation, to compute sunlit surface fractions of all polygons defining a building’s external geometry many times faster than traditional analytical methods. This speed-up is especially significant for large models, complex shading devices, and detailed urban environments that have previously been impractical to analyse with BES software. By incorporating these procedures into a pre-processor and feeding the results directly into EnergyPlus, complex models can be simulated without geometric simplifications or approximations that may cause loss of accuracy. These results are significant to the building design process because they allow non-expert users to quickly produce accurate shadowing calculations early in schematic design. Fast simulation results enable informed decision-making early in the design process and eliminate the need for simplification of building models. This is particularly important since parametric models are now frequently used to generate façade alternatives at early stages of design. As BES software becomes more capable of analysing large models with complex geometry, the need to create specialized models for BES will diminish, and the user base for BES software will expand. This is in keeping with the greater goal to encourage accurate thermal analysis of buildings early in the design process when there are more opportunities to positively affect building performance.
ACKNOWLEDGEMENTS This material is based upon work supported by the Department of Energy under Award Number DE-EE0003921. Tests were run on prototype software created with the assistance of Lars Schumann and David Bosworth. Building models were made with assistance from James Sherman. The authors thank Dan Kaplan from FXFOWLE and Dan Nall from WSP Flack + Kurtz for their consultation on The New York Times Building.
DISCLAIMER This report was prepared as an account of work sponsored by an agency of the United States Government. Neither the United States Government nor any agency thereof, nor any of their employees, makes any warranty, express or implied, or assumes any legal liability or responsibility for the accuracy, completeness, or usefulness of any information, apparatus, product, or process disclosed, or represents that its use would not infringe privately owned rights. Reference herein to any specific commercial product, process, or service by trade name, trademark, manufacturer, or otherwise does not necessarily constitute or imply its endorsement,
recommendation, or favoring by the United States Government or any agency thereof. The views and opinions of authors expressed herein do not necessarily state or reflect those of the United States Government or any agency thereof.
REFERENCES Bartz, D., Meißner, M. and Hütter, T., 1999. OpenGL-
assisted occlusion culling for large polygonal models. Computers & Graphics, 23 (5), 667-679.
CERL, 1977. Building Loads Analysis and System Thermodynamics (BLAST). Construction Engineering Research Laboratory, Champaign, IL.
Coons, S.A., 1967. Surfaces for computer-aided design of space forms. Report MAC-TR-41, Project MAC, Massachusetts Institute of Technology, Cambridge, MA.
EnergyPlus Development Team, 2010. EnergyPlus engineering reference: The reference to EnergyPlus calculations. EnergyPlus Version 6.0. US Department of Energy.
Groth, C.C. and Lokmanhekim, M., 1969. Shadow — A new technique for the calculation of shadow shapes and areas by digital computer. In: Second Hawaii International Conference on System Sciences, 22-24 January 1969 Honolulu, HI. 471-474.
Jones, N.L., Greenberg, D.P. and Pratt, K.B., 2011. Fast computer graphics techniques for calculating direct solar radiation on complex building surfaces. Journal of Building Performance Simulation. DOI: 10.1080/19401493.2011.582154.
LBNL, 2010. EnergyPlus, Version 6.0. Lawrence Berkeley National Laboratory, Berkely, CA.
McPherson, E.G., 1984. Planting Desgin for Solar Control. Energy-Conserving Site Design. E.G. McPherson, ed. Washington, D.C.: American Society of Landscape Architects.
Murta, A. 2010. General polygon clipper library. www.cs.man.ac.uk/~toby/alan/software/.
NYSERDA, 2005. Daylighting the New York Times Headquarters Building. Final Report 06-05, New York State Energy Research and Development Authority, Albany, NY.
Piegl, L. and Tiller, W., 1995. The NURBS Book. Heidelberg: Springer.
Vatti, B.R., 1992. A generic solution to polygon clipping. Communications of the ACM, 35 (7), 56-63.
Walton, G.N., 1979. The application of homogeneous coordinates to shadowing calculations. ASHRAE Transactions, 84 (1), 174-180.
Wu, S.C., Abel, J.F. and Greenberg, D.P., 1977. An interactive computer graphics approach to surface representation. Communications of the ACM, 20 (10), 703-712.
Proceedings of Building Simulation 2011: 12th Conference of International Building Performance Simulation Association, Sydney, 14-16 November.
- 584 -