Embed Size (px)
Citation preview
© 2009 The AuthorJournal Compilation © 2009 Blackwell Publishing Ltd
Geography Compass 3/1 (2009): 64–88, 10.1111/j.1749-8198.2008.00207.x
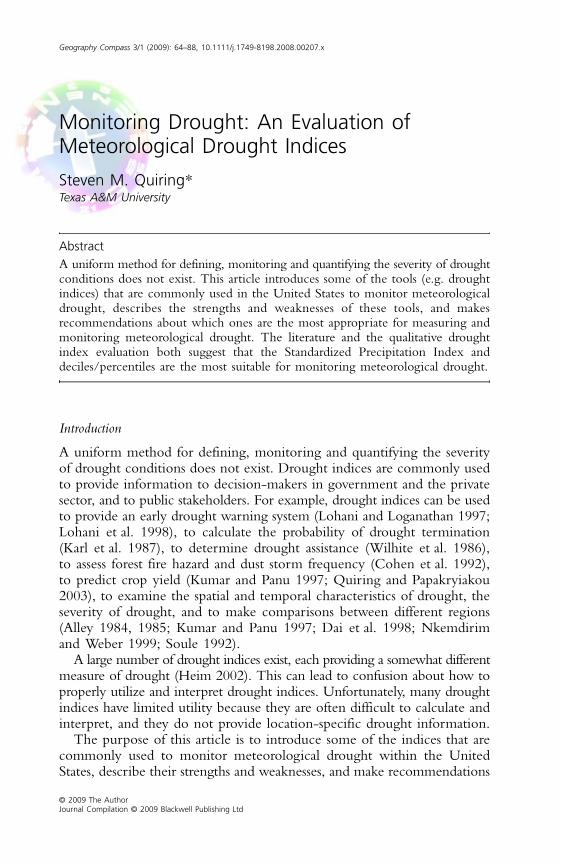
Monitoring Drought: An Evaluation of Meteorological Drought Indices
Steven M. Quiring*Texas A&M University
AbstractA uniform method for defining, monitoring and quantifying the severity of droughtconditions does not exist. This article introduces some of the tools (e.g. droughtindices) that are commonly used in the United States to monitor meteorologicaldrought, describes the strengths and weaknesses of these tools, and makesrecommendations about which ones are the most appropriate for measuring andmonitoring meteorological drought. The literature and the qualitative droughtindex evaluation both suggest that the Standardized Precipitation Index anddeciles/percentiles are the most suitable for monitoring meteorological drought.
Introduction
A uniform method for defining, monitoring and quantifying the severityof drought conditions does not exist. Drought indices are commonly usedto provide information to decision-makers in government and the privatesector, and to public stakeholders. For example, drought indices can be usedto provide an early drought warning system (Lohani and Loganathan 1997;Lohani et al. 1998), to calculate the probability of drought termination(Karl et al. 1987), to determine drought assistance (Wilhite et al. 1986),to assess forest fire hazard and dust storm frequency (Cohen et al. 1992),to predict crop yield (Kumar and Panu 1997; Quiring and Papakryiakou2003), to examine the spatial and temporal characteristics of drought, theseverity of drought, and to make comparisons between different regions(Alley 1984, 1985; Kumar and Panu 1997; Dai et al. 1998; Nkemdirimand Weber 1999; Soule 1992).
A large number of drought indices exist, each providing a somewhat differentmeasure of drought (Heim 2002). This can lead to confusion about how toproperly utilize and interpret drought indices. Unfortunately, many droughtindices have limited utility because they are often difficult to calculate andinterpret, and they do not provide location-specific drought information.
The purpose of this article is to introduce some of the indices that arecommonly used to monitor meteorological drought within the UnitedStates, describe their strengths and weaknesses, and make recommendations
© 2009 The Author Geography Compass 3/1 (2009): 64–88, 10.1111/j.1749-8198.2008.00207.xJournal Compilation © 2009 Blackwell Publishing Ltd
Evaluation of Meteorological Drought Indices 65
about which ones are the most appropriate for monitoring meteorologicaldrought. Unlike previous reviews (e.g. Heim 2002), this article onlyfocuses on commonly used meteorological drought indices; it describestheir known strengths and weaknesses, and each index is evaluated basedon the six important characteristics of an ideal drought index.
Review of Meteorological Drought Indices
Meteorological drought is usually defined as a shortage of precipitation (ormoisture supply) over some period of time (e.g. weekly, monthly, seasonalor annual timescales). Definitions of meteorological drought, therefore, arelocation specific since normal precipitation is a function of the climate.Some definitions of meteorological drought focus on the length of timesince the last precipitation event (e.g. number of consecutive dry days),while others focus on the magnitude of the precipitation departure fromnormal. Just like there are numerous definitions of meteorologicaldrought, there are also numerous meteorological drought indices. In thisarticle particular attention will be paid to those that are currently beingused operationally within the United States (Table 1). This section willbriefly review the seven meteorological drought indices evaluated in thisarticle; namely, Palmer Drought Severity Index (PDSI) and MoistureAnomaly Index (Z), Standardized Precipitation Index (SPI), EffectiveDrought Index (EDI), Vegetation Condition Index (VCI), percent normal,and deciles/percentiles.
PALMER DROUGHT SEVERITY INDEX AND MOISTURE ANOMALY INDEX
The PDSI and the Z-index were both developed by Palmer (1965) andhave been widely used in the scientific literature (Alley 1984; Karl et al.1987). The PDSI and Z-index are derived using a soil moisture/waterbalance algorithm that requires a time series of daily air temperature andprecipitation, and information on the available water content of the soil.
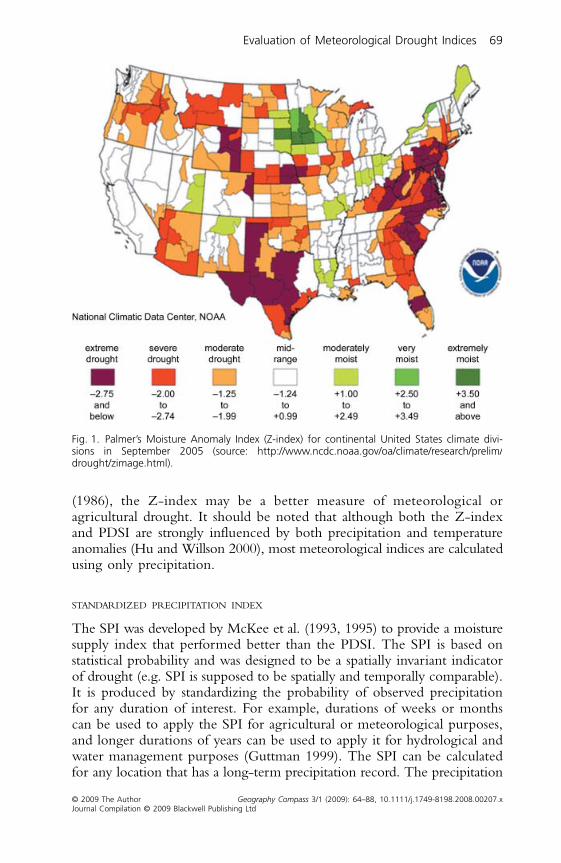
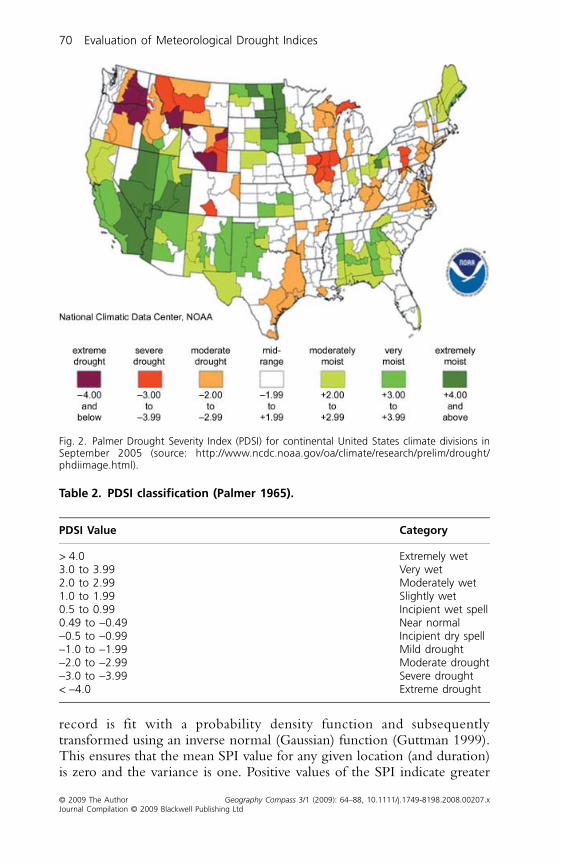
The Z-index is a measure of how observed moisture conditions compareto normal (or climatically appropriate) moisture conditions (Heim 2002).Normal evapotranspiration, runoff, soil moisture loss and recharge ratesare determined using at least a 30-year time series. While both theZ-index and the PDSI are derived using the same data, their monthlyvalues are quite different. The Z-index is not affected by weather conditions inprevious months, so it can vary dramatically from month to month (Figure 1).On the other hand, the PDSI varies more slowly because antecedentconditions account for two-thirds of its value (Figure 2). Complete detailson how PDSI and Z-index are calculated are available in Palmer (1965).
Although the PDSI was designed to measure meteorological drought(Table 2), it may be more appropriate as a measure of hydrological drought(Akinremi et al. 1996; Strommen and Motha 1987) and, according to Karl
66Evaluation of M
eteorological Drought Indices
© 2009 The A
uthorG
eography Com
pass 3/1 (2009): 64–88, 10.1111/j.1749-8198.2008.00207.xJournal C
ompilation ©
2009 Blackwell Publishing Ltd
Table 1. Selected drought monitoring products that are currently available in the United States.
Source URL Indices/Data Available Update Frequency Spatial Coverage
Spatial Resolution
Climate Prediction Center
http://www.cpc.ncep.noaa.gov/ PDSI, PDSI Percentile Weekly USA Climate DivisionCrop Moisture Index Weekly USA Climate DivisionSoil Moisture Anomaly Daily, monthly, 12 month USA, global ½ degreeEvaporation Anomaly Daily, monthly, 12 month USA, global ½ degreeRunoff Anomaly Daily, monthly, 12 month USA, global ½ degreePrecipitation Anomaly Daily, monthly, 12 month USA, global ½ degreeExperimental Drought Indicator Blends (Short & Long)
Weekly USA Climate Division
Topsoil Moisture Weekly, 5 and 10 year means
USA State
National Climatic Data Center
http://www.ncdc.noaa.gov/climate/research/monitoring.html
PDI, PHDI, Z-index Weekly, monthly USA Climate DivisionStandardized Precipitation Index (1–24 months)
Monthly USA Climate Division
Precipitation Ranks Monthly USA State, Climate Division
Percent of Long-term Precipitation (6, 12, 24, 36, 48, & 60 months)
Monthly USA, Mexico
Climate Division
Percent of Pasture and Range Land in Poor Condition
Monthly USA State
http://www.ncdc.noaa.gov/oa/climate/research/cie/cmsi.html
Corn (Soybean) Moisture Stress Index
Annual USA Climate Division
http://www.ncdc.noaa.gov/oa/climate/research/snow/snow.html
Snow Monitoring 1–7 day snowfall, monthly
National or State
Individual stations
© 2009 The A
uthorG
eography Com
pass 3/1 (2009): 64–88, 10.1111/j.1749-8198.2008.00207.xJournal C
ompilation ©
2009 Blackwell Publishing Ltd
Evaluation of Meteorological D
rought Indices67
Spatial Climate Analysis Service
http://www.ocs.orst.edu/prism/ Precipitation Anomaly Monthly, monthly climatology (1971–2000)
USA 2.5 arc-minute (~ 4 km)
Texas Water Development Board (Texas WaterInfo.net)
PDSI, PDSI Probability, Crop Moisture Index,
http://www.texaswaterinfo.net/ Standardized Precipitation Index
Monthly Texas Climate Division
http://www.tceq.state.tx.us/permitting/water_supply/pdw/trot/location.html
Community Water Systems Monthly Texas Individual communities
http://www.twdb.state.tx.us/publications/reports/waterconditions/conservationstorage/conservation_storage.htm
Reservoir Storage Monthly Texas Individual reservoirs
Texas Forest Service http://www.tamu.edu/ticc/rgmap.jpg
Relative Greenness Weekly Texas 4 km
http://webgis.tamu.edu/kbdi-map.aspx
Keetch-Byram Drought Index
Daily Texas 4 km
NOAA Drought Information Center
http://www.drought.noaa.gov/ U.S. National Drought Overview
Monthly USA Climate Division
http://www.orbit.nesdis.noaa.gov/smcd/emb/vci/index.html
Vegetation Health Index & Fire Risk Index
Weekly, annual USA, Global 1.1 km
http://lwf.ncdc.noaa.gov/oa/climate/research/drought/drought.html
Drought Calculator NA USA Climate Division
Source URL Indices/Data Available Update Frequency Spatial Coverage
Spatial Resolution
Table 1. Continued
68Evaluation of M
eteorological Drought Indices
© 2009 The A
uthorG
eography Com
pass 3/1 (2009): 64–88, 10.1111/j.1749-8198.2008.00207.xJournal C
ompilation ©
2009 Blackwell Publishing Ltd
US Geological Survey
http://waterdata.usgs.gov/tx/nwis/rt Streamflow Condition Daily, 7-day, monthly USA, state Individual stream gauges
http://waterdata.usgs.gov/nwis/current/?type = gw
Groundwater Condition Daily USA Individual gauges
http://www.cpc.ncep.noaa.gov/products/predictions/experimental/edb/usdm-streamflows-overlay.gif
7-day Streamflow percentiles and Drought Monitor Overlay
Weekly USA Individual stream gauges
Southeast Regional Climatic Center
http://www.sercc.com/climateinfo/drought.html
Percent Field Capacity Weekly Southeast USA
Climate Division
National Drought Mitigation Center
http://www.drought.unl.edu/monitor/spi-dailygridded.html
Gridded Standardized Precipitation Index
Daily USA ½ degree
http://droughtreporter.unl.edu/ Drought Impact Reporter Daily USA Countyhttp://www.drought.unl.edu/dm/index.html
Drought Monitor Weekly USA, North America
Climate Division
http://drought.unl.edu/monitor/raindry/precipitationdays.html
Number of Rain days, Number of Dry Days, Number of days since last rain
Weekly USA ½ degree
Joint Agricultural Weather Facility
http://www.usda.gov/oce/waob/jawf/wwcb.html
Weekly Weather and Crop Bulletin (1971–present)
Weekly USA, global NA
University of Washington Surface Water Monitor
http://www.hydro.washington.edu/forecast/monitor/index.shtml
Soil Moisture Percentile Daily USA ½ degree
Wildfire Assessment System
http://www.fs.fed.us/land/wfas/ Keetch-Byram Drought Index
Daily USA Interpolated from station data
Source URL Indices/Data Available Update Frequency Spatial Coverage
Spatial Resolution
Table 1. Continued
© 2009 The Author Geography Compass 3/1 (2009): 64–88, 10.1111/j.1749-8198.2008.00207.xJournal Compilation © 2009 Blackwell Publishing Ltd
Evaluation of Meteorological Drought Indices 69
(1986), the Z-index may be a better measure of meteorological oragricultural drought. It should be noted that although both the Z-indexand PDSI are strongly influenced by both precipitation and temperatureanomalies (Hu and Willson 2000), most meteorological indices are calculatedusing only precipitation.
STANDARDIZED PRECIPITATION INDEX
The SPI was developed by McKee et al. (1993, 1995) to provide a moisturesupply index that performed better than the PDSI. The SPI is based onstatistical probability and was designed to be a spatially invariant indicatorof drought (e.g. SPI is supposed to be spatially and temporally comparable).It is produced by standardizing the probability of observed precipitationfor any duration of interest. For example, durations of weeks or monthscan be used to apply the SPI for agricultural or meteorological purposes,and longer durations of years can be used to apply it for hydrological andwater management purposes (Guttman 1999). The SPI can be calculatedfor any location that has a long-term precipitation record. The precipitation
Fig. 1. Palmer’s Moisture Anomaly Index (Z-index) for continental United States climate divi-sions in September 2005 (source: http://www.ncdc.noaa.gov/oa/climate/research/prelim/drought/zimage.html).
70 Evaluation of Meteorological Drought Indices
© 2009 The Author Geography Compass 3/1 (2009): 64–88, 10.1111/j.1749-8198.2008.00207.xJournal Compilation © 2009 Blackwell Publishing Ltd
record is fit with a probability density function and subsequentlytransformed using an inverse normal (Gaussian) function (Guttman 1999).This ensures that the mean SPI value for any given location (and duration)is zero and the variance is one. Positive values of the SPI indicate greater
Fig. 2. Palmer Drought Severity Index (PDSI) for continental United States climate divisions inSeptember 2005 (source: http://www.ncdc.noaa.gov/oa/climate/research/prelim/drought/phdiimage.html).
Table 2. PDSI classification (Palmer 1965).
PDSI Value Category
> 4.0 Extremely wet3.0 to 3.99 Very wet2.0 to 2.99 Moderately wet1.0 to 1.99 Slightly wet0.5 to 0.99 Incipient wet spell0.49 to −0.49 Near normal−0.5 to −0.99 Incipient dry spell−1.0 to −1.99 Mild drought−2.0 to −2.99 Moderate drought−3.0 to −3.99 Severe drought< −4.0 Extreme drought
© 2009 The Author Geography Compass 3/1 (2009): 64–88, 10.1111/j.1749-8198.2008.00207.xJournal Compilation © 2009 Blackwell Publishing Ltd
Evaluation of Meteorological Drought Indices 71
than median precipitation, while negative values indicate less than medianprecipitation (Table 3).
There are at least two different probability distributions (e.g. Pearson TypeIII or Gamma) that are used to calculate the SPI. This is important to notebecause using a different probability distribution will produce differentSPI values, even with the same input data. Guttman (1999) experimentedwith different probability distributions and concluded that the Pearsontype III distribution provides the best model for calculating the SPI.However, this remains a matter of debate since other studies have identifieddifferent probability distributions as being the most appropriate for evaluatingmonthly precipitation probabilities (Husak et al. 2007; Legates 1991). Forexample, the National Drought Mitigation Center (drought.unl.edu) uses the2-parameter gamma PDF to fit the frequency distribution of precipitationand calculate the SPI (Wu et al. 2007). The 2-parameter gamma model hasalso been implemented in the SPI software distributed by the NationalAgricultural Decision Support System (nadss.unl.edu).
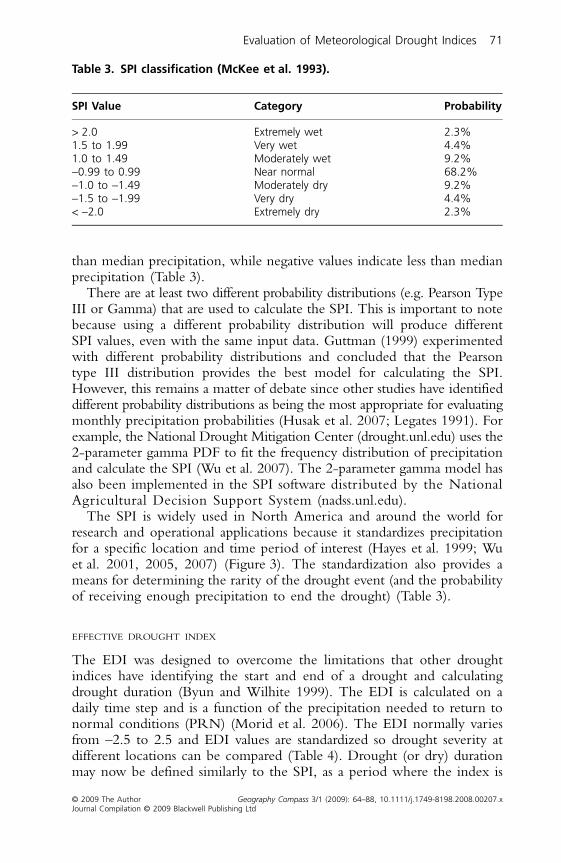
The SPI is widely used in North America and around the world forresearch and operational applications because it standardizes precipitationfor a specific location and time period of interest (Hayes et al. 1999; Wuet al. 2001, 2005, 2007) (Figure 3). The standardization also provides ameans for determining the rarity of the drought event (and the probabilityof receiving enough precipitation to end the drought) (Table 3).
EFFECTIVE DROUGHT INDEX
The EDI was designed to overcome the limitations that other droughtindices have identifying the start and end of a drought and calculatingdrought duration (Byun and Wilhite 1999). The EDI is calculated on adaily time step and is a function of the precipitation needed to return tonormal conditions (PRN) (Morid et al. 2006). The EDI normally variesfrom –2.5 to 2.5 and EDI values are standardized so drought severity atdifferent locations can be compared (Table 4). Drought (or dry) durationmay now be defined similarly to the SPI, as a period where the index is
Table 3. SPI classification (McKee et al. 1993).
SPI Value Category Probability
> 2.0 Extremely wet 2.3%1.5 to 1.99 Very wet 4.4%1.0 to 1.49 Moderately wet 9.2%−0.99 to 0.99 Near normal 68.2%−1.0 to −1.49 Moderately dry 9.2%−1.5 to −1.99 Very dry 4.4%< −2.0 Extremely dry 2.3%
72 Evaluation of Meteorological Drought Indices
© 2009 The Author Geography Compass 3/1 (2009): 64–88, 10.1111/j.1749-8198.2008.00207.xJournal Compilation © 2009 Blackwell Publishing Ltd
consistently negative. More details on calculating the EDI are availablefrom Byun and Wilhite (1999).
VEGETATION CONDITION INDEX
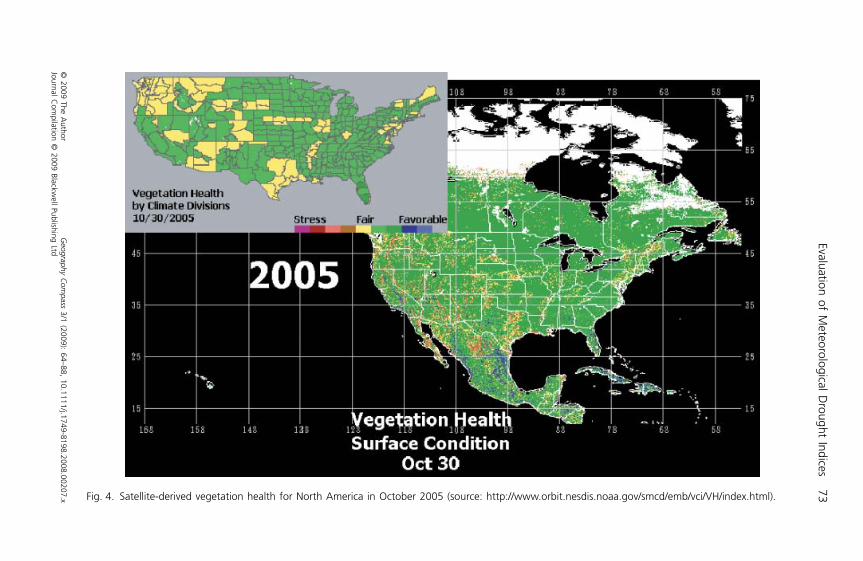
Drought/vegetation indices derived from satellite data have been used fordrought studies since the beginning of the 1980s (Kogan 1995). Kogan(1995) developed the VCI to measure vegetation health in a way thatcontrols for local differences in ecosystem productivity (Figure 4). It is
Fig. 3. Standardized Precipitation Index (SPI) for continental United States climate divisions inSeptember 2005 (source: http://www.ncdc.noaa.gov/img/climate/research/prelim/drought/spi01_pg.gif).
Table 4. EDI classification (Morid et al. 2006).
EDI Value Category
> 2.5 Extremely wet1.5 to 2.49 Severely wet0.7 to 1.49 Moderately wet−0.69 to 0.69 Near normal−0.7 to −1.49 Moderate drought−1.5 to −2.49 Severe drought< −2.5 Extreme drought
© 2009 The A
uthorG
eography Com
pass 3/1 (2009): 64–88, 10.1111/j.1749-8198.2008.00207.xJournal C
ompilation ©
2009 Blackwell Publishing Ltd
Evaluation of Meteorological D
rought Indices73Fig. 4. Satellite-derived vegetation health for North America in October 2005 (source: http://www.orbit.nesdis.noaa.gov/smcd/emb/vci/VH/index.html).
74 Evaluation of Meteorological Drought Indices
© 2009 The Author Geography Compass 3/1 (2009): 64–88, 10.1111/j.1749-8198.2008.00207.xJournal Compilation © 2009 Blackwell Publishing Ltd
calculated using AVHRR-based Normalized Difference Vegetation Index(NDVI) data. The VCI is a pixel-wise normalization of NDVI that isuseful for making relative assessments (e.g. pixel-specific) of changes inthe NDVI signal by filtering out the contribution of local geographicresources to the spatial variability of NDVI. The VCI measures howweather conditions have influenced the relative vigor of the vegetationwith respect to the ecologically defined limits. A complete description ofhow the VCI is calculated is provided in Kogan (1995, 1997).
PERCENT NORMAL
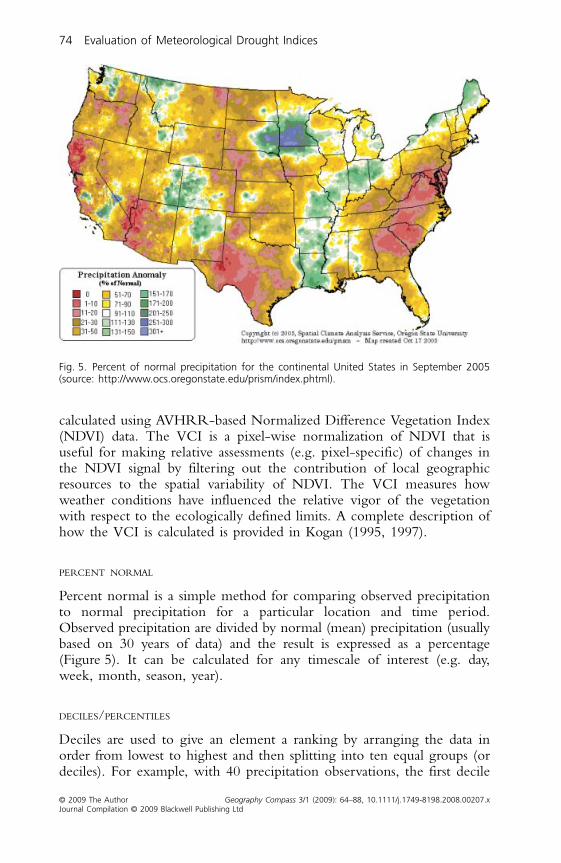
Percent normal is a simple method for comparing observed precipitationto normal precipitation for a particular location and time period.Observed precipitation are divided by normal (mean) precipitation (usuallybased on 30 years of data) and the result is expressed as a percentage(Figure 5). It can be calculated for any timescale of interest (e.g. day,week, month, season, year).
DECILES/PERCENTILES
Deciles are used to give an element a ranking by arranging the data inorder from lowest to highest and then splitting into ten equal groups (ordeciles). For example, with 40 precipitation observations, the first decile
Fig. 5. Percent of normal precipitation for the continental United States in September 2005(source: http://www.ocs.oregonstate.edu/prism/index.phtml).
© 2009 The Author Geography Compass 3/1 (2009): 64–88, 10.1111/j.1749-8198.2008.00207.xJournal Compilation © 2009 Blackwell Publishing Ltd
Evaluation of Meteorological Drought Indices 75
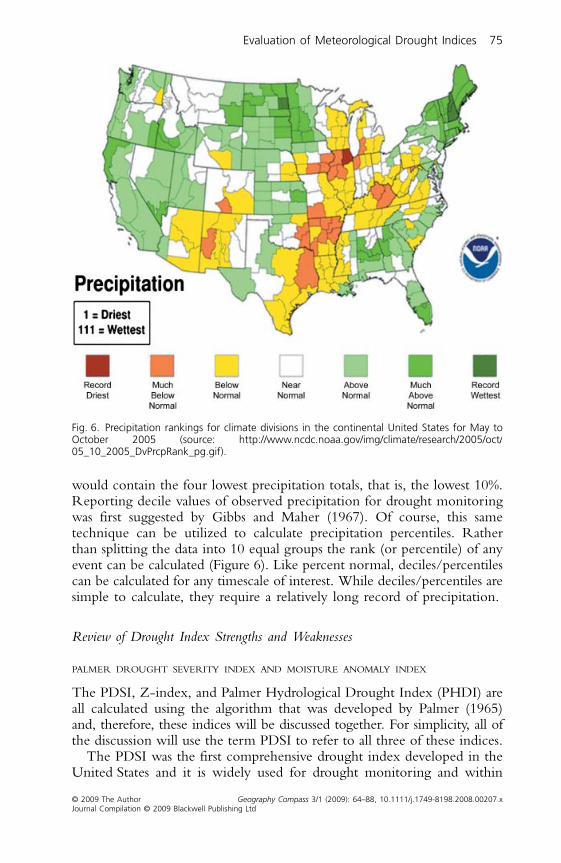
would contain the four lowest precipitation totals, that is, the lowest 10%.Reporting decile values of observed precipitation for drought monitoringwas first suggested by Gibbs and Maher (1967). Of course, this sametechnique can be utilized to calculate precipitation percentiles. Ratherthan splitting the data into 10 equal groups the rank (or percentile) of anyevent can be calculated (Figure 6). Like percent normal, deciles/percentilescan be calculated for any timescale of interest. While deciles/percentiles aresimple to calculate, they require a relatively long record of precipitation.
Review of Drought Index Strengths and Weaknesses
PALMER DROUGHT SEVERITY INDEX AND MOISTURE ANOMALY INDEX
The PDSI, Z-index, and Palmer Hydrological Drought Index (PHDI) areall calculated using the algorithm that was developed by Palmer (1965)and, therefore, these indices will be discussed together. For simplicity, all ofthe discussion will use the term PDSI to refer to all three of these indices.
The PDSI was the first comprehensive drought index developed in theUnited States and it is widely used for drought monitoring and within
Fig. 6. Precipitation rankings for climate divisions in the continental United States for May toOctober 2005 (source: http://www.ncdc.noaa.gov/img/climate/research/2005/oct/05_10_2005_DvPrcpRank_pg.gif).
76 Evaluation of Meteorological Drought Indices
© 2009 The Author Geography Compass 3/1 (2009): 64–88, 10.1111/j.1749-8198.2008.00207.xJournal Compilation © 2009 Blackwell Publishing Ltd
state drought plans (Heim 2002). Despite its widespread use, the PDSI hasmany limitations. One of the limitations of the PDSI is that PET isestimated using Thornthwaite’s method, which only considers monthlytemperatures (Narasimhan and Srinivasan 2005). More realistic estimatesof PET can be generated by using a physically based method such as theFAO Penman-Montieth equation (Allen et al. 1998).
Another limitation of the PDSI is that it uses a two-layer soil modelwith just a single parameter for the available water holding capacity of thesoil. This may be reasonable when calculating the PDSI for a singlelocation (e.g. station), but it is inappropriate for calculating the PDSIfor regions, such as climate divisions where the soil is highly spatiallyheterogeneous (Narasimhan and Srinivasan 2005). For example, climatedivisions in Texas range in size from 7870 to 100,880 km2 and so eachencompasses a wide range of soil types. There is no way to represent thehorizontal and vertical heteorogeneity of soil properties in the PDSI waterbalance. It is important to use an appropriate value for the available waterholding capacity of the soil because it has been demonstrated that thePDSI is sensitive to changes in this parameter (Karl 1983).
The PDSI also assumes that runoff only occurs when both soil layersare completely saturated. In reality runoff varies due to differences inprecipitation intensity, slope, soil type, land use, land cover, and landmanagement practices (Narasimhan and Srinivasan 2005). None of thesefactors are accounted for in the PDSI. Alley (1984) noted that there areproblems with how runoff is generated because the model does notaccount for the distribution (or intensity) of precipitation within the weekor month. The PDSI also does not account for the seasonal changes invegetation growth and root development and it is not designed to dealwith a snowpack or frozen soil (Alley 1984; Karl 1986; Karl et al. 1987).
PDSI is highly dependent on the weighting factor used to make itcomparable between different regions (and months) (Heim 2002). Palmer(1965) calculated the regional correction factor (K) based on data fromonly nine locations in seven states (Wells et al. 2004). Akinremi et al. (1996)found Palmer’s original value of 17.67 artificially inflated the droughtindex values when applied to the Canadian prairies and used a revisedregional correction factor of 14.2. Palmer (1965) calculated the durationfactors based on data from western Kansas and central Iowa and they affectthe sensitivity of the index to precipitation events (Wells et al. 2004). Animprovement proposed by Wells et al. (2004) is meant to correct the lackof spatial comparability by dynamically calculating the regional correctionfactor (K) and the duration factors using historical climate data from eachlocation. This revised PDSI is called the self-calibrating PDSI. The originalformulation of the PDSI is not spatially and temporally invariant and,therefore, it cannot be compared across the United States or betweenmonths (Alley 1984; Guttman 1998; Guttman et al. 1992; Heim 2002).This means that severe and extreme droughts as defined by the PDSI
© 2009 The Author Geography Compass 3/1 (2009): 64–88, 10.1111/j.1749-8198.2008.00207.xJournal Compilation © 2009 Blackwell Publishing Ltd
Evaluation of Meteorological Drought Indices 77
occur more often in some parts of the country than others (Wells et al.2004). The self-calibrating PDSI is supposed to correct these problems bydynamically calculating all of the empirical constants. However, the lengthof the calibration period (historical record) will have an influence on thestability of the estimated parameters. Longer calibration periods tend toprovide more consistent PDSI values (Karl 1986). For comparison purposes,the same calibration period should be used for all locations.
Interpreting the PDSI can also be a challenge since it is a function ofboth temperature and precipitation data (Hu and Willson 2000). It hasbeen demonstrated that the PDSI responds in a non-linear fashion tochanges in precipitation (Hu and Willson 2000). Although the PDSI isoften defined as a meteorological drought index the PDSI responds ratherslowly to changes in moisture conditions. According to Guttman (1998), thePDSI has a ‘memory’ (its spectrum conforms to that of an autoregressiveprocess) and it is highly correlated with the 12-month SPI (Heim 2002).This means that both the PDSI and PHDI are more appropriate formeasuring hydrological droughts. The Z-index can be used for measuringagricultural and meteorological drought since it only accounts for the moistureconditions during the current month (Quiring and Papakryiakou 2003).
The drought classification that was proposed by Palmer (1965) (Table 2)was arbitrarily determined, so it is not appropriate for making watermanagement decisions, or triggering drought response programs ordeclarations of drought emergency (Alley 1984; Quiring forthcoming). Ithas also been demonstrated that the calculation procedure for transitioningbetween wet and dry spells tends to produce an asymmetrical and bimodaldistribution of PDSI values (Alley 1984; Heim 2002).
Alley (1984), Karl (1986) and Guttman (1998) have completed detailedevaluations of the limitations of the PDSI and Z-index, their work, alongwith the work of other researchers, has been summarized by Heim (2002).
STANDARDIZED PRECIPITATION INDEX
The SPI is a popular drought index because of its simplicity and versatility.To calculate the SPI one only needs weekly or monthly precipitation data(depending on the timescale on the intended application). The SPI canbe calculated for any time period of interest. It is commonly calculatedusing 1-month, 3-month, 6-month, 9-month, 12-month and 24-monthintervals because these timescales are appropriate for monitoring differenttypes of drought (e.g. agricultural, meteorological, hydrological) andcorrespond to drought impacts.
Unlike the PDSI, the SPI is spatially invariant (Guttman 1998; Heim2002; Wu et al. 2007) and, therefore, it can readily be compared acrosstime and space. Although the SPI can be calculated in all climatic regions(Heim 2002), its interpretation may be problematic in arid regions (e.g.locations with many months with zero precipitation) depending on which
78 Evaluation of Meteorological Drought Indices
© 2009 The Author Geography Compass 3/1 (2009): 64–88, 10.1111/j.1749-8198.2008.00207.xJournal Compilation © 2009 Blackwell Publishing Ltd
PDF is used to normalize precipitation (Wu et al. 2007). The SPI is alsoeasier to understand and interpret than the PDSI since its value is onlybased on precipitation and since it is reported in standard deviations awayfrom the mean.
However, there are some limitations associated with the SPI. Like thePDSI, it is computationally complex and it requires specialized code (e.g. itcannot be calculated by hand or with a spreadsheet). The SPI also requiresa long (and complete) precipitation record. It has been demonstrated thatthe SPI is strongly influenced by record length (Wu et al. 2005). Therefore,when comparing stations to each other, it is best if they have the samelength of precipitation record. The minimum precipitation record forcalculating the SPI is 30 years, but it is recommended to use 50+ yearsof data and the extreme values of the SPI may only be accurate wheneven longer precipitation records are used (80+ years) (Wu et al. 2005).
The SPI is also influenced by normalization procedure (e.g. PDF) thatis used. The National Drought Mitigation Center, Western RegionalClimate Center, and National Agricultural Decision Support System alluse the 2-parameter gamma PDF to calculate SPI. However, there is littleconsensus about what normalization procedure is best. Guttman (1999)analyzed six different PDFs (e.g. two-parameter gamma; two-parametergamma, for which the parameters are estimated by the maximum likelihoodmethod; three-parameter Pearson type III; three-parameter generalizedextreme value; four-parameter kappa; five-parameter Wakeby) anddetermined that the Pearson type III was the most appropriate PDF forcalculating SPI. Changing the PDF will produce different SPI values.
The SPI requires accurate precipitation data. Although collecting accurateprecipitation data is important for all of the precipitation-based droughtindices, it is particularly important for the SPI because it is sensitive toprecipitation events in both tails of the distribution. Because precipitation ishighly spatially heterogeneous and the density of precipitation gages is relativelylow in most regions of the United States, this means that individual gagesmay miss some heavy convective precipitation events. It also means thatcare should be taken when aggregating precipitation records to determinemean county (or climate division) precipitation. Averaging precipitationover space (and time) will tend to smooth the data and distort the truedistribution of precipitation. This has implications for how precipitationdata should be handled and aggregated prior to calculating the SPI.
EFFECTIVE DROUGHT INDEX
The EDI is calculated using daily precipitation data and it was designedfor detecting the onset and termination of drought events. The EDI was alsodesigned to use a time-dependent weighting function that places moreemphasis on recent precipitation surpluses or deficits and less emphasis onconditions a number of months in the past (Byun and Wilhite 1999).
© 2009 The Author Geography Compass 3/1 (2009): 64–88, 10.1111/j.1749-8198.2008.00207.xJournal Compilation © 2009 Blackwell Publishing Ltd
Evaluation of Meteorological Drought Indices 79
One of the major weaknesses of the EDI is that it is relatively unknownso its ability to accurately monitor drought conditions remains largelyuntested (Morid et al. 2006). In addition, the methodology for calculatingthe EDI is not straightforward. Even though both the SPI and EDI arecalculated using precipitation data, they are essentially uncorrelated witheach other (Quiring et al. 2007). Therefore, the EDI cannot be easilyinterpreted. Another major disadvantage to using the EDI is that it lacksthe nice statistical properties of some of the other precipitation-basedindices (e.g. SPI, deciles/percentiles). For example, Morid et al. (2006)demonstrated that the EDI is not normally distributed.
VEGETATION CONDITION INDEX
The use of satellites for drought monitoring provides several key advantagesover other methods. One of the main advantages of the VCI is that,because it is a satellite-based drought product, it can provide near real-timedata over the globe at a relatively high spatial resolution. In addition, theVCI uses a completely independent methodology for monitoring drought,while all of the other meteorological indices rely, to some extent, on station-based meteorological data. Although the station-based indices may provideaccurate point estimates of drought conditions, they cannot provide the samespatial resolution as the VCI because of the relatively sparse station network(particularly if when considering only those meteorological stations thathave at least 30+ years of continuous data). Satellites have proven to be a usefulmeans for detecting drought onset and measuring the intensity, duration,and impact of drought in regions around the world (Anyamba et al. 2001;Gutman 1990; Ji and Peters 2003; Kogan 1995; Nicholson and Farrar1994; Seiler et al. 2000; Unganai and Kogan 1998; Wang et al. 2001).
The VCI is most useful during the growing season because it is ameasure of vegetation vigor, when the vegetation is dormant (or there issnow cover) the VCI cannot be used to measure moisture stress ordrought. Interpretation of the VCI may be more complicated than otherdrought indices because it provides an indirect measure of moisture(drought) conditions. Anything that stresses the vegetation includinginsects, disease, and lack of nutrients will result in decreases in plantgrowth and therefore lower VCI values (Vicente-Serrano 2007). Also,areas that have significant irrigation may not respond to precipitationdeficiencies (Quiring et al. 2007).
One of the main limitations of the VCI is that it requires specializedsoftware to calculate and because the VCI is calculated using the entiretime series of AVHRR data, data volumes are relatively large. In addition,there are some challenges to using satellite data for monitoring droughtbecause there have been changes in satellites and sensor and sensor degradationcan bias the AVHRR data (Kogan 1995). There is also contamination ofthe vegetation response signal by clouds. The compositing procedure is
80 Evaluation of Meteorological Drought Indices
© 2009 The Author Geography Compass 3/1 (2009): 64–88, 10.1111/j.1749-8198.2008.00207.xJournal Compilation © 2009 Blackwell Publishing Ltd
meant to reduce the influence of clouds, but in some locations and seasonscloud contamination may still be an issue (Vicente-Serrano 2007). Inaddition, there are numerous other sources of atmospheric attenuation andthe atmospheric correction, smoothing and compositing procedures willnot remove all of these influences.
The VCI is most appropriate for monitoring meteorological andagricultural drought ( Ji and Peters 2003; Kogan 1995; Seiler et al. 2000;Vicente-Serrano 2007). It has not been demonstrated that the VCI canbe used to monitor hydrological droughts. The VCI is not suitable forcomparing current drought conditions with historical droughts becauseAVHRR data is only available since 1981. It is also difficult to comparedroughts that occur in different locations because the response of VCI isecosystem dependent (Vicente-Serrano 2007).
PERCENT NORMAL AND DECILES/PERCENTILES
Due to the similarity of percent normal and deciles/percentiles and thelack of published literature that critiques these two methods, they will betreated together. Both of these indices require only precipitation data.Percent normal and deciles/percentiles are easy to calculate (e.g. they donot require any specialized software) and interpret. Both indices providean accurate, statistical measurement of precipitation, and can be calculatedfor any period of interest. Deciles/percentiles also provide an estimateof how rare a particular precipitation event is in relation to thehistorical record.
The main limitations of these two indices are that, like the SPI, theyrequire long data records. For percent normal, the most recent 30 yearsof data are typically used, but some applications use the entire period ofrecord. For deciles/percentiles, more than three decades are desirable, thelonger the better. Percent normal is based on the statistical concept of‘normal’ (mean) which may not have much meaning in regards to droughtimpacts. The idea of normal is not well understood by the general publicsince it does not necessarily correspond with expected weather conditions.Percent normal also does not account for precipitation variability (standarddeviation) since it is only based on the first moment. It is also inappropriateto compare percent normal between locations, since 30% of normal in anarid location (e.g. southwestern United States) will refer to a much differentprecipitation deficit than 30% of normal in humid location (e.g. southeasternUnited States) and may be associated with very different impacts.
Qualitative Drought Index Evaluation
Six criteria were identified, based on the characteristics of an ideal droughtindex, to judge the overall utility of the seven meteorological indicesdescribed in this article (Keyantash and Dracup 2002; Narasimhan and
© 2009 The Author Geography Compass 3/1 (2009): 64–88, 10.1111/j.1749-8198.2008.00207.xJournal Compilation © 2009 Blackwell Publishing Ltd
Evaluation of Meteorological Drought Indices 81
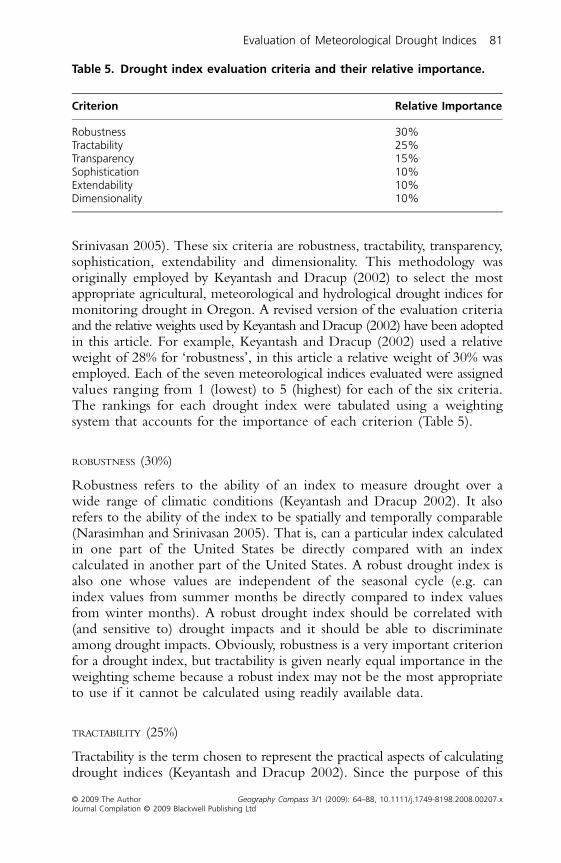
Srinivasan 2005). These six criteria are robustness, tractability, transparency,sophistication, extendability and dimensionality. This methodology wasoriginally employed by Keyantash and Dracup (2002) to select the mostappropriate agricultural, meteorological and hydrological drought indices formonitoring drought in Oregon. A revised version of the evaluation criteriaand the relative weights used by Keyantash and Dracup (2002) have been adoptedin this article. For example, Keyantash and Dracup (2002) used a relativeweight of 28% for ‘robustness’, in this article a relative weight of 30% wasemployed. Each of the seven meteorological indices evaluated were assignedvalues ranging from 1 (lowest) to 5 (highest) for each of the six criteria.The rankings for each drought index were tabulated using a weightingsystem that accounts for the importance of each criterion (Table 5).
ROBUSTNESS (30%)
Robustness refers to the ability of an index to measure drought over awide range of climatic conditions (Keyantash and Dracup 2002). It alsorefers to the ability of the index to be spatially and temporally comparable(Narasimhan and Srinivasan 2005). That is, can a particular index calculatedin one part of the United States be directly compared with an indexcalculated in another part of the United States. A robust drought index isalso one whose values are independent of the seasonal cycle (e.g. canindex values from summer months be directly compared to index valuesfrom winter months). A robust drought index should be correlated with(and sensitive to) drought impacts and it should be able to discriminateamong drought impacts. Obviously, robustness is a very important criterionfor a drought index, but tractability is given nearly equal importance in theweighting scheme because a robust index may not be the most appropriateto use if it cannot be calculated using readily available data.
TRACTABILITY (25%)
Tractability is the term chosen to represent the practical aspects of calculatingdrought indices (Keyantash and Dracup 2002). Since the purpose of this
Table 5. Drought index evaluation criteria and their relative importance.
Criterion Relative Importance
Robustness 30%Tractability 25%Transparency 15%Sophistication 10%Extendability 10%Dimensionality 10%
82 Evaluation of Meteorological Drought Indices
© 2009 The Author Geography Compass 3/1 (2009): 64–88, 10.1111/j.1749-8198.2008.00207.xJournal Compilation © 2009 Blackwell Publishing Ltd
study is to recommend the most appropriate tools for measuring/monitoringmeteorological drought in United States, it is extremely important thatthe recommended indices are easy to calculate using readily available data.There are three main questions that need to be answered to determinewhether a given drought index is tractable: Is the drought index easy tocalculate? Is the data required to calculate the drought index readily available?Is the drought index useful in United States? Affirmative answers to thesethree questions indicate that an index is tractable.
TRANSPARENCY (15%)
Transparency is used to evaluate whether an index is clear, rational, andeasy to understand (Keyantash and Dracup 2002). A good drought indexis one that is readily understandable to decision-makers and the user-community. A good drought index is one that is both scientificallydefensible and understandable to the public.
SOPHISTICATION (10%)
Although sophistication is somewhat counter to transparency, it is nonethelessan important characteristic of a good drought index (Keyantash and Dracup2002). A sophisticated drought index is one that has conceptual (scientific)merit. Therefore, even if a drought index is not easy to understand, it maystill be valuable if it accurately represents important physical aspects ofdrought. Of course, one of the drawbacks with sophisticated approachesto measuring drought is that they typically require more data (and higherquality data) and this means that not only are they less transparent, butthey are also less tractable. Since the purpose of this evaluation is toidentify indices that can be used for monitoring meteorological droughtin the United States, the weighting system will give more credit to anindex that is easy to use and easy to understand, than to an index that issophisticated, but difficult to calculate.
EXTENDABILITY (10%)
Extendability refers to whether an index can be extended back in time.For example, an index that only relies on precipitation data can be appliedto measure drought all the way back to the start of the instrumental record(100+ years), while an index that utilizes satellite or radar data is limitedto the last few decades (Keyantash and Dracup 2002). An index that isextendable is of value because it can place current (and future) droughtsinto historical context. This is of particular importance to decision-makerswho have designed drought response plans based on past droughts.Extendability is not as important as the other criteria and therefore it hasa lower weight.
© 2009 The Author Geography Compass 3/1 (2009): 64–88, 10.1111/j.1749-8198.2008.00207.xJournal Compilation © 2009 Blackwell Publishing Ltd
Evaluation of Meteorological Drought Indices 83
DIMENSIONALITY (10%)
Dimensionality refers to the connection between the drought index andthe physical world (Keyantash and Dracup 2002). It is ideal if a droughtindex has a unit that has physical meaning (e.g., mm of soil water, percentof normal precipitation), rather than a strictly dimensionless unit. Thereshould be a clear connection between the drought index and the physicalworld. It is also desirable if a drought index uses simple units.
EVALUATION RESULTS
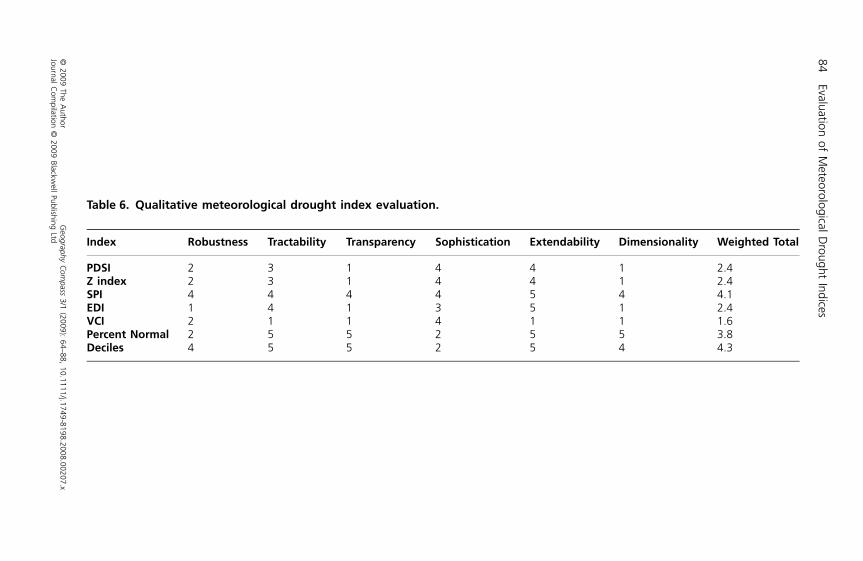
Based on the qualitative evaluation the SPI and deciles/percentiles are themost highly ranked meteorological drought indices (Table 6). Theseresults are supported by the work of Keyantash and Dracup (2002) whodetermined that SPI and deciles were the two indices most appropriatefor monitoring meteorological drought in Oregon. SPI was also identifiedas one of the most appropriate drought indices for monitoring meteoro-logical drought in Iran (Morid et al. 2006).
SPI and deciles/percentiles were highly ranked in all six categories. Bothof these indices have the ability to measure drought over a wide range ofconditions, they can be calculated for any period of interest (week, month,season, year), and they are spatially and temporally comparable. However, theyhave difficulty with arid locations that have seasons/years that receive noprecipitation. Therefore both were given 4 out 5 for robustness. In termsof tractability, deciles/precentiles has a slight advantage over the SPI sinceit is easy to calculate and only requires precipitation data. The SPI alsoonly uses precipitation data, but it is calculated using specialized computerprograms. Therefore, deciles/percentiles is given 5 out 5, while SPI receiveda 4 out 5. Deciles/percentiles also have an advantage over the SPI when itcomes to transparency because even though SPI values are easy to understand(e.g. positive values indicate that conditions are wetter than normal andnegative values indicate that conditions are drier than normal) the methodused to calculate these values are not as easy to grasp. This does give theSPI an edge with regard to sophistication because it uses a PDF (e.g. gamma)that may be more appropriate for characterizing precipitation variabilitythan the empirical distribution (e.g. percentiles). Both indices can be readilycalculated for all stations that have a long record of precipitation and theycan be extended back in time (based on the availability of precipitationdata). This allows current droughts to be placed in proper historical contextand gives them a perfect rating for extendability. SPI and deciles/percentilesare both reported in units that can easily related to precipitation values.The main drawback of these indices is that they only consider precipitation(atmospheric moisture supply) and not evapotranspiration (atmosphericmoisture demand). Overall the SPI and deciles/precentiles have a meanqualitative rating of 4.1 and 4.3, respectively.
84Evaluation of M
eteorological Drought Indices
© 2009 The A
uthorG
eography Com
pass 3/1 (2009): 64–88, 10.1111/j.1749-8198.2008.00207.xJournal C
ompilation ©
2009 Blackwell Publishing Ltd
Table 6. Qualitative meteorological drought index evaluation.
Index Robustness Tractability Transparency Sophistication Extendability Dimensionality Weighted Total
PDSI 2 3 1 4 4 1 2.4Z index 2 3 1 4 4 1 2.4SPI 4 4 4 4 5 4 4.1EDI 1 4 1 3 5 1 2.4VCI 2 1 1 4 1 1 1.6Percent Normal 2 5 5 2 5 5 3.8Deciles 4 5 5 2 5 4 4.3
© 2009 The Author Geography Compass 3/1 (2009): 64–88, 10.1111/j.1749-8198.2008.00207.xJournal Compilation © 2009 Blackwell Publishing Ltd
Evaluation of Meteorological Drought Indices 85
Percent normal has the next highest rating. Although it shares many ofthe same strengths as deciles/percentiles (e.g. trability, transparency, andextendability), it is not a robust measure of drought conditions. That is,percent normal can not be used to compare drought conditions over spaceor time. For example, 50% of normal in Phoenix, Arizona, has a muchdifferent meaning than 50% of normal in Miami, Florida. Similarly, 50%of normal precipitation in January may have a much different meaningthan 50% of normal in July. This limitation with using percent normal (ordepartures from normal) is one of the main reasons that so many droughtindices have been created.
Even though the PDSI and Z-index are commonly used for droughtmonitoring, they were not highly ranked in the qualitative evaluationbecause they are complicated to calculate, require more detailed informationthan the precipitation-based indices, and report drought conditions usinga dimensionless index. In addition, it has been demonstrated that thePDSI, as originally formulated by Palmer (1965) is spatially variant andtherefore it is not appropriate to compare PDSI values from differentlocations (Quiring forthcoming).
Conclusions
This article introduced seven drought indices that are commonly used inthe United States to monitor meteorological drought and described thestrengths and weaknesses of these indices. Both the literature and thequalitative drought index evaluation suggest that the SPI and deciles/percentiles are the most suitable for monitoring meteorological drought.Other indices such as the percent normal, PDSI, Z-index, and VCI didnot perform well in the qualitative evaluation and should be used withcaution. Overall, no single index can represent all aspects of meteorologicaldrought so it is best to use a multi-index approach for operational droughtmonitoring.
Acknowledgments
This research was partially supported by contract 2005483028 from theTexas Water Development Board.
Short Biography
Steven Quiring is an Assistant Professor in the Department of Geographyat Texas A&M University, College Station, TX, USA. His research interestsinclude hydroclimatology, drought monitoring, drought prediction, appliedclimatology, and hurricanes. He has authored or co-authored articles inthese areas for journals such as Agricultural and Forest Meteorology, ClimateResearch, International Journal of Climatology, Journal of Hydrometeorology, and
86 Evaluation of Meteorological Drought Indices
© 2009 The Author Geography Compass 3/1 (2009): 64–88, 10.1111/j.1749-8198.2008.00207.xJournal Compilation © 2009 Blackwell Publishing Ltd
The Professional Geographer. He holds an MA in Geography from Univer-sity of Manitoba and a PhD in Climatology from University of Delaware.
Note
* Correspondence address: Steven M. Quiring, Department of Geography, Texas A&M University,College Station, TX 77843-3147, USA. E-mail: [email protected].
References
Akinremi, O. O., McGinn, S. M., and Barr, A. G. (1996). Evaluation of the palmer droughtindex on the Canadian prairies. Journal of Climate 9, pp. 897–905.
Allen, R. G., et al. (1998). Crop evapotranspiration. Guidelines for computing crop water requirements.FAO Irrigation and Drainage Paper 56. Rome, Italy: Land and Water Development Division,FAO.
Alley, W. M. (1984). The Palmer Drought Severity Index: limitation and assumptions. Journalof Climate and Applied Meteorology 23, pp. 1100–1109.
Alley, W. M. (1985). The Palmer Drought Severity Index as a measure of hydrologic drought.Water Resources Bulletin 21, pp. 105–114.
Anyamba, A., Tucker, C. J., and Eastman, J. R. (2001). NDVI anomaly patterns over Africaduring the 1997/98 ENSO warm event. International Journal of Remote Sensing 22, pp. 1847–1859.
Byun, H. R., and Wilhite, D. A. (1999). Objective quantification of drought severity andduration. Journal of Climate 12, pp. 2747–2756.
Cohen, S., Wheaton, E. E., and Masterton, J. (1992). Impacts of climatic change scenarios inthe prairie provinces: a case study from Canada. SRC Publication No E-2900-4-D-92.Saskatchewan Research Council, Saskatoon, Canada.
Dai, A., Trenberth, K. E., and Karl, T. R. (1998). Global variations in droughts and wetspells: 1900–1995. Geophysical Research Letters 25, pp. 3367–3370.
Gibbs, W. J., and Maher, J. V. (1967). Rainfall deciles as drought indicators. Bureau of MeteorologyBulletin No. 48. Canberra, ACT: Commenwealth of Australia.
Gutman, G. G. (1990). Towards monitoring drought from space. Journal of Climate 3, pp. 282–295.Guttman, N. B. (1998). Comparing the palmer drought index and the standardized precipitation
index. Journal of the American Water Resources Association 34, pp. 113–121.——. (1999). Accepting the standardized precipitation index: a calculation algorithm. Journal of
the American Water Resources Association 35, pp. 311–322.Guttman, N. B., Wallis, J. R., and Hosking, J. R. M. (1992). Spatial comparability of the
Palmer Drought Severity Index. Water Resources Bulletin 28, pp. 1111–1119.Hayes, M. J., et al. (1999). Monitoring the 1996 drought using the standardized precipitation
index. Bulletin of the American Meteorological Society 80, pp. 429–438.Heim, R. R. Jr. (2002). A review of twentieth century drought indices used in the United
States. Bulletin of the American Meteorological Society 83, pp. 1149–1165.Hu, Q., and Willson, G. D. (2000). Effects of temperature anomalies on the Palmer Drought
Severity Index in the central United States. International Journal of Climatology 20, pp. 1899–1911.
Husak, G. J., Michaelson, J., and Funk, C. (2007). Use of the gamma distribution to representmonthly rainfall in Africa for drought monitoring applications. International Journal of Climatology27, pp. 935–944.
Ji, L., and Peters, A. (2003). Assessing vegetation response to drought in the northern GreatPlains using vegetation and drought indices. Remote Sensing of Environment 87, pp. 85–89.
Karl, T. (1986). The sensitivity of the Palmer Drought Severity Index and Palmer’s Z-Index totheir calibration coefficients including potential evapotranspiration. Journal of Climate andApplied Meteorology 25, pp. 77–86.
Karl, T., Quinlan, F., and Ezell, D. S. (1987). Drought termination and amelioration: itsclimatological probability. Journal of Climate and Applied Meteorology 26, pp. 1198–1209.
© 2009 The Author Geography Compass 3/1 (2009): 64–88, 10.1111/j.1749-8198.2008.00207.xJournal Compilation © 2009 Blackwell Publishing Ltd
Evaluation of Meteorological Drought Indices 87
Karl, T. R. (1983). Some spatial characteristics of drought duration in the United States. Journalof Climate and Applied Meteorology 22, pp. 1356–1366.
Keyantash, J., and Dracup, J. A. (2002). The quantification of drought: an evaluation of droughtindices. Bulletin of the American Meteorological Society 83, pp. 1167–1180.
Kogan, F. N. (1995). Droughts of the late 1980s in the United States as derived from NOAApolar-orbiting satellite data. Bulletin of the American Meteorological Society 76, pp. 655–668.
——. (1997). Global drought watch from space. Bulletin of the American Meteorological Society 78,pp. 621–636.
Kumar, V., and Panu, U. (1997). Predictive assessment of severity of agricultural droughts basedon agro-climatic factors. Journal of the American Water Resources Association 33, pp. 1255–1264.
Legates, D. R. (1991). An evaluation of procedures to estimate monthly precipitation probabilities.Journal of Hydrology 122, pp. 129–140.
Lohani, V. K., and Loganathan, G. V. (1997). An early warning system for drought managementusing the Palmer Drought Index. Journal of the American Water Resources Association 33, pp.1375–1386.
Lohani, V. K., Loganathan, G. V., and Mostaghimi, S. (1998). Long-term analysis and short-termforecasting of dry spells by Palmer Drought Severity Index. Nordic Hydrology 29, pp. 21–40.
McKee, T. B., Doesken, N. J., and Kleist, J. (1993). The relationship of drought frequency andduration to time scales. 8th Conference on Applied Climatology. Anaheim, CA, 17–22January 1993.
——. (1995). Drought monitoring with multiple time scales. 9th Conference on AppliedClimatology, Dallas, TX, 15–20 January 1995.
Morid, S., Smakhtin, V., and Moghaddasi, M., (2006). Comparison of seven meteorologicalindices for drought monitoring in Iran. International Journal of Climatology 26, pp. 971–985.
Narasimhan, B., and Srinivasan, R. (2005). Development and evaluation of Soil MoistureDeficit Index (SMDI) and Evapotranspiration Deficit Index (ETDI) for agricultural droughtmonitoring. Agricultural and Forest Meteorology 133, pp. 69–88.
Nicholson, S. E., and Farrar, T. J. (1994). The influence of soil type on the relationshipsbetween NDVI, rainfall, and soil moisture in semarid Botswana: I. NDVI response to rainfall.Remote Sensing of Environment 50, pp. 107–120.
Nkemdirim, L., and Weber, L. (1999). Comparison between the droughts of the 1930s and the1980s in the southern Canadian prairies. Journal of Climate 12, pp. 2434–2450.
Palmer, W. C. (1965). Meteorological drought. Research Paper No. 45. Washington, DC: USWeather Bureau.
Quiring, S. M. (forthcoming). Developing objective operational definitions for monitoringdrought. Journal of Applied Meteorology and Climatology.
Quiring, S. M., and Papakryiakou, T. N. (2003). An evaluation of agricultural drought indicesfor the Canadian prairies. Agricultural and Forest Meteorology 118, pp. 49–62.
Quiring, S. M, Nielsen-Gammon, J. W., Srinivasan, R., Miller, T., and Narasimhan, B. (2007).Drought monitoring index for Texas. Texas Water Development Board: Austin, TX.
Seiler, R. A., Kogan, F., and Wei, G. (2000). Monitoring weather impact and crop yield fromNOAA AVHRR data in Argentina. Advances in Space Research 26, pp. 1177–1185.
Soule, P. T. (1992). Spatial patterns of drought frequency and duration in the contiguous USAbased on multiple drought event definitions. International Journal of Climatology 12, pp. 11–24.
Strommen, N. D., and Motha, R. P. (1987). An operational early warning agricultural weathersystem. In: Wilhite, D. A., Easterling, W. E., and Wood, D. A. (eds.) Planning for drought:Toward a reduction of societal vulnerability. Boulder, CO: Westview Press, pp. 153–164.
Unganai, L. S., and Kogan, F. N. (1998). Southern Africa’s recent droughts from space. Advancesin Space Research 21, pp. 507–511.
Vicente-Serrano, S. M. (2007). Evaluating the impact of drought using remote sensing in aMediterranean, semi-arid region. Natural Hazards 40, pp. 173–208.
Wang, J., Price, K. P., and Rich, P. M. (2001). Spatial patterns of NDVI in response toprecipitation and temperature in the central Great Plains. International Journal of Remote Sensing22, pp. 3827–3844.
Wells, N., Goddard, S., and Hayes, M. J. (2004). A self-calibrating palmer drought severityindex. Journal of Climate 17, pp. 2335–2351.
88 Evaluation of Meteorological Drought Indices
© 2009 The Author Geography Compass 3/1 (2009): 64–88, 10.1111/j.1749-8198.2008.00207.xJournal Compilation © 2009 Blackwell Publishing Ltd
Wilhite, D. A., Rosenberg, N. J., and Glantz, M. H. (1986). Improving federal response todrought. Journal of Climate and Applied Meteorology 25, pp. 332–342.
Wu, H., et al. (2001). An evaluation of the Standardized Precipitation Index, the China-ZIndex, and the statistical Z-score. International Journal of Climatology 21, pp. 745–758.
Wu, H., et al. (2005). The effect of the length of record on the Standardized PrecipitationIndex. International Journal of Climatology 25, pp. 505–520.
Wu, H., et al. (2007). Appropriate application of the Standardized Precipitation Index in aridlocations and dry seasons. International Journal of Climatology 27, pp. 65–79.