Embed Size (px)
Citation preview
Drought over East Asia: A Review
LIXIA ZHANG
LASG, Institute of Atmospheric Physics, Chinese Academy of Sciences, Beijing, and Collaborative Innovation
Center on Forecast and Evaluation of Meteorological Disasters, Nanjing University of Information
Science and Technology, Nanjing, China
TIANJUN ZHOU
LASG, Institute of Atmospheric Physics, Chinese Academy of Sciences, and Joint Center for
Global Change Studies, Beijing, China
(Manuscript received 8 April 2014, in final form 3 January 2015)
ABSTRACT
East Asia is greatly impacted by drought. North and southwest China are the regions with the highest drought
frequency andmaximumduration.At the interannual time scale, drought in the eastern part of EastAsia ismainly
dominated by two teleconnection patterns (i.e., the Pacific–Japan and Silk Road teleconnections). The former is
forced by SST anomalies in the westernNorth Pacific and the tropical IndianOcean during El Niño decaying yearsummers. The precipitation anomaly features a meridional tripolar or sandwich pattern. The latter is forced byIndian monsoon heating and is a propagation of stationary Rossby waves along the Asian jet in the upper tro-posphere. It can significantly influence the precipitation over north China. Regarding the long-term trend, thereexists an increasing drought trend over central parts of northern China and a decreasing tendency over north-western China from the 1950s to the present. The increased drought in north China results from a weakenedtendency of summer monsoons, which is mainly driven by the phase transition of the Pacific decadal oscillation.East Asian summer precipitation is poorly simulated and predicted by current state-of-the-art climate models.Encouragingly, the predictability of atmospheric circulation is high because of the forcing of ENSO and the as-sociated teleconnection patterns. Under the SRES A1B scenario and doubled CO2 simulations, most climate
models project an increasing drought frequency and intensity over southeastern Asia. Nevertheless, uncertainties
exist in the projections as a result of the selection of climate models and the choice of drought index.
1. Introduction
Drought, characterized by below-normal precip-
itation over a period of months to years, has become an
increasing concern in recent years. Of all natural di-
sasters, the economic and environmental consequences
of drought are among the most serious, because of its
longevity and widespread spatial extent. Associated with
global warming, the occurrence and durations of drought
show an increasing tendency. Its impact is becoming more
and more severe, particularly to the people of East Asia
(Zhai et al. 2010).
East Asia, which mainly includes China, Japan, Korea
Peninsula, and Mongolia, is highly impacted by drought
every year. East Asia is dominated by different climate
zones. Its western part, located in the north of the
Qinghai–Xizang Plateau, is a typical arid and semiarid
area. In contrast, east of 102.58E is the typical monsoon
domain. The drought and flooding over this region are
closely related to the variability of the East Asian mon-
soon system, which features strong southerly wind in
summer and northerly wind in winter. The location of
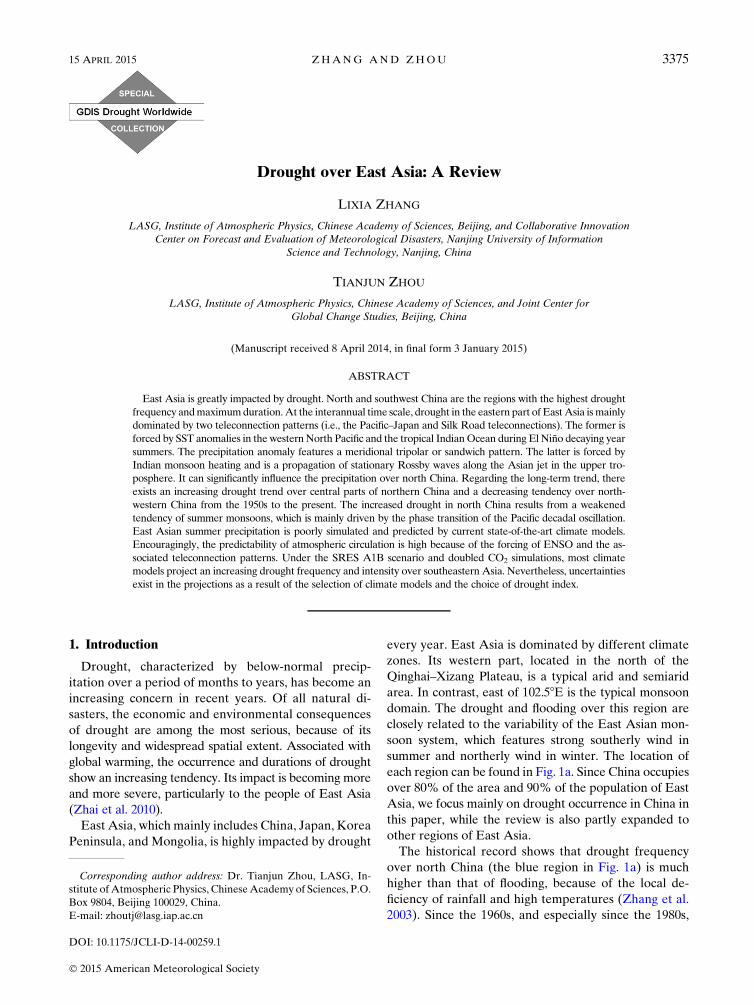
each region can be found in Fig. 1a. Since China occupies
over 80% of the area and 90% of the population of East
Asia, we focus mainly on drought occurrence in China in
this paper, while the review is also partly expanded to
other regions of East Asia.
The historical record shows that drought frequency
over north China (the blue region in Fig. 1a) is much
higher than that of flooding, because of the local de-
ficiency of rainfall and high temperatures (Zhang et al.
2003). Since the 1960s, and especially since the 1980s,
Corresponding author address: Dr. Tianjun Zhou, LASG, In-
stitute of Atmospheric Physics, ChineseAcademy of Sciences, P.O.
Box 9804, Beijing 100029, China.
E-mail: [email protected]
15 APRIL 2015 ZHANG AND ZHOU 3375
DOI: 10.1175/JCLI-D-14-00259.1
� 2015 American Meteorological Society
north China has experienced consecutive drought pe-
riods, two of which caused a drying up of the Yellow
River in 1972 and 1997 (Zhang et al. 2009). Besides
north China, southwestern China has also experienced
a severe drought lasting from autumn 2009 to spring
2010, during which time approximately 21 million peo-
ple were short of drinking water and economic losses
reached nearly USD 30 billion (Yang et al. 2012). Ac-
cording to statistics, droughts in China cause grain losses
of 20–253 109 kg, which effects 200–300 million people,
and economic losses of CNY 15–20 billion every year
(Zhang et al. 2008).
Since the 1970s, aridity over north China has in-
creased substantially, and the extreme drought fre-
quency is increasing in the central part of northern China,
northeast China, and the eastern part of northwest (NW)
China (Ma and Fu 2006). Because of the increasing
drought, the grassland area of Jilin Province (418–468N,
1228–1318E) is decreasing at a rate of 2.8% per year, the
semiarid boundary of northern China has shifted south-
eastward during the last 50 years (1950–98), and the dis-
charge of the Yellow River is decreasing (Ma and Fu
2006). Owing to the destruction of forest cover and
a history of poor water management, severe drought in
theYunnan Province (208–308N, 988–1058E) of southwestChina has been exacerbated for many years (Qiu 2010).
To monitor and study drought and its variation, many
drought indices have been defined. An extensive listing
of available indices can be found in Heim (2000). Eval-
uations of drought indices have been performed by
Keyantash and Dracup (2002) and Dai (2011a). Reviews
on four categories (meteorology, agriculture, hydrology,
and socioeconomics) of drought indices used in China
have been carried out bymany scientists (Yuan and Zhou
2004; J. Wang et al. 2007; Yao et al. 2007). The most
commonly used drought indices over East Asia include
the precipitation anomaly percentage (PA), the Palmer
drought severity index (PDSI), standardized precipitation
index (SPI), composite drought index (CDI), and effec-
tive drought index (EDI); their strengths and weaknesses
for describing local drought are listed in Table 1.
The main advantage of PA is that it can reflect droughts
induced by precipitation anomalies. However, it does not
consider evaporation and is highly dependent on the cli-
matology rainfall. The unified classification is not appro-
priate in NW China, where precipitation is extremely
heterogeneous (Zhang et al. 1998). PDSI is a meteorolog-
ical drought index used widely throughout the world and
provides a good reflection of soilmoisture deficit or surplus
(Palmer 1965; Dai et al. 1998, 2004). To date, PDSI has
mostly been used in drought assessment, comparisons, and
assessments of spatial and temporal changes of drought.
Because of the complicated topography of East Asia, the
determination and computation of empirical parameters in
PDSI is difficult. It is hard to use PDSI for drought mon-
itoring and application in East Asia. In China, SPI can
detect droughts and wet periods at different time scales,
while it is greatly affected by the length of the precipitation
record and probability distributions. Specifically, pre-
cipitation is seasonal in nature, and zero values are com-
mon in NW China, where the calculated SPI values at
short time scales may not be normally distributed because
of the highly skewed underlying precipitation distribution
and the limitation of the fitted gamma distribution
(Mishra and Singh 2010). CDI, a combination of SPI and
FIG. 1. (a) The location of each region used in this paper. (b),(c)
The yearly drought-affected area and drought disaster area
(1 3 104 ha) during 1950–2010, respectively. The datasets of agri-
cultural areas influenced by drought are from the China planting
industry information network.
3376 JOURNAL OF CL IMATE VOLUME 28
relative moisture, is provided by the National Climate
Center (NCC) of the China Meteorological Administra-
tion to monitor provincial meteorological drought (Zou
and Zhang 2008). Comparisons between drought events
at different regions are allowed. EDI, which is calculated
by using daily precipitation and can measure drought
onset and end dates, is a widely used drought index over
the Korea Peninsula and Japan.
Since different climatic zones dominate East Asia, the
topography and vegetation types differ greatly among
these climatic zones, the distribution of precipitation is
inhomogeneous. It is difficult to use one drought index
to reasonably represent all features of droughts over the
whole of East Asia. In northwest China, which is an arid/
semiarid area, no drought index is able to represent the
drought types and severity levels (J. Wang et al. 2007).
Great efforts have been devoted to monitoring, un-
derstanding, and forecasting drought over East Asia.
The scientific committee of the Global Drought In-
formation System (GDIS) sponsored a special collection
of review papers that address the causes of drought
worldwide. This paper is a part of that collection. In this
paper, we review the occurrence of severe drought over
East Asia, the key regional circulation in East Asia re-
lated to drought and possiblemechanisms, the long-term
trend of drought severity and extent, and predictions
and projections of drought over East Asia.
The remainder of the paper is organized as follows.
The data and drought indices used in this paper are
introduced in section 2. Sections 3 and 4 introduce the
occurrence of severe droughts in East Asia and the
climate states of East Asian drought, respectively. In
section 5 the physical mechanisms responsible for
drought occurrence at the interannual time scale are
summarized. Section 6 reviews the long-term trend of
droughts over East Asia and possible mechanisms.
Section 7 discusses predictability and projections. And
finally, a summary is provided in section 8.
2. Data and drought indices
Two observational precipitation datasets are used here:
the Global Precipitation Climatology Project (GPCP)
from 1979 to 2012 with a resolution of 2.58 3 2.58 (Adler
et al. 2003) and the latest version of the Climatic Re-
search Unit (CRU) dataset from 1950 to 2009 with
a resolution of 0.58 3 0.58 (Mitchell and Jones 2005).
The reanalysis dataset used here is the National Cen-
ters for Environmental Prediction (NCEP)–National
Center for Atmospheric Research (NCAR) reanalysis
for 1950–2009 (Kalnay et al. 1996).
Two drought indices are used in this study: a self-
calibrating PDSI (sc-PDSI; Dai 2011b) and SPI.
Because PDSI is dependent on climatologically appro-
priate rainfall, which is different in each region of China,
it shows some deficiencies in depicting East Asian
drought, as described in Table 1. The sc-PDSI calibrates
the PDSI by using local coefficients; thus, the sc-PDSI is
more comparable spatially than the original PDSI. In ad-
dition, the Penman–Monteith method is considered to be
the most physics based and reliable method for calculating
potential evapotranspiration (Dai 2011b). Therefore, an
sc-PDSI with the Penman–Monteith equation is used in
this paper. The sc-PDSI data used in the study are from the
Climate Data Guide website (https://climatedataguide.
ucar.edu/climate-data/palmer-drought-severity-index-
pdsi), with a 2.58 3 2.58 resolution. Since SPI is one of theoperational monitoring indices used in the NCC, we use
SPI to show the climatic characteristics of drought over
China. The SPI is calculated by using monthly CRU
precipitation dataset, with a resolution 0.58 3 0.58. In the
review of interannual variability of East Asian drought,
SPI for 1 month time scale (SPI-1) is employed. In
studying the long-term changes of East Asian drought,
12-month SPI (SPI-12) is used here and is interpolated
into 2.58 3 2.58 grid to compare with sc-PDSI, because sc-
PDSI is unable to depict droughts on time scales shorter
than 12 months when monthly PDSI values are used
(Vicente-Serrano et al. 2010).
To show the impact of historical droughts that have
occurred inChina, a dataset of agricultural areas influenced
by drought from the China planting industry informa-
tion network is used here (http://202.127.42.157/moazzys/
zaiqing.aspx). The drought- (disaster-) affected areas are
those areas in which a crop yield reduction due to drought
occurred in more than 10% (30%) of normal years.
3. Historical review of severe drought over EastAsia
Using the area percentage of eastern China under
very dry conditions based on the historical records and
instrumental data of the past 500 years, Shen et al.
(2007) identified three exceptional drought events that
occurred over the monsoon region of China: 1586–89,
1638–41, and 1965–66.During these droughts, more than
40% of the area was affected, and there was a 50% or
more reduction of precipitation in the drought center.
Each of the events developed first in north China and
then expanded to the Yangtze River valley along 308Nand then on into south China. The drought of 1638–41
occurred under the background of the Little Ice Age,
when the East Asian summer monsoon circulation was
generally weak (Man et al. 2012).
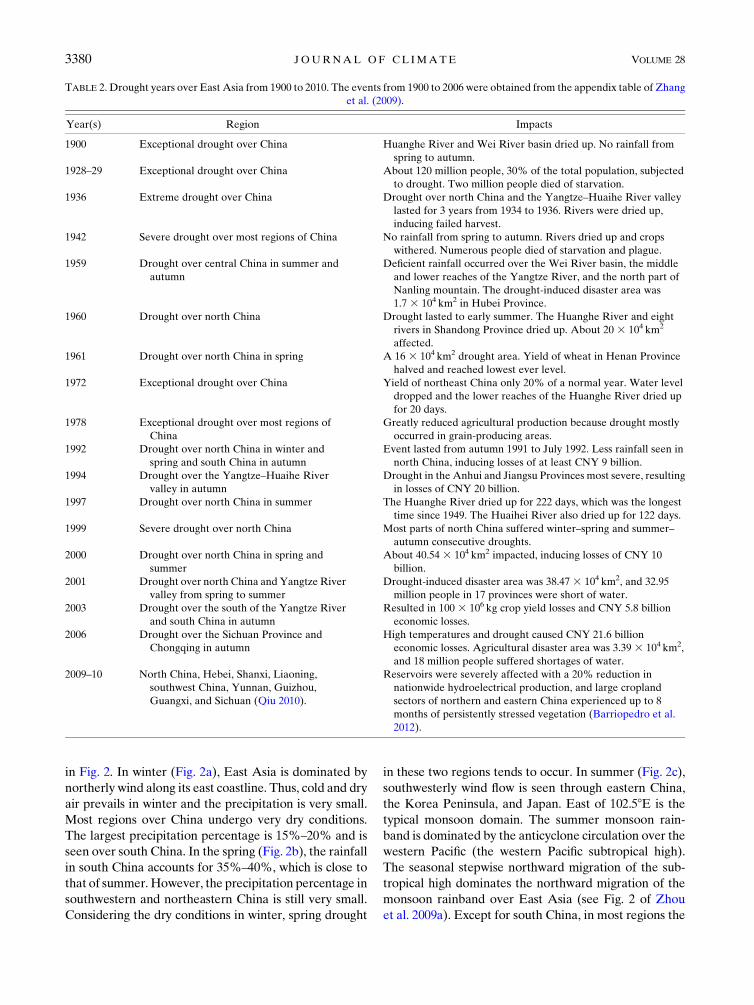
Drought years and the associated impacts in China
for the period 1900–2012 are summarized in Table 2
15 APRIL 2015 ZHANG AND ZHOU 3377

TABLE1.Mostcommonly
usedmeteorological
droughtindicesto
monitorandstudydroughtoverEastAsia.
Indexname
Calculation
Droughtclassification
Strength
Weakness
Appliedarea
Precipitationanomaly
percentage
Precipitationanomaly
percentageagainst
30-yrclim
atological
mean.
There
are
threedrought
classificationsformonthly,
seasonal,andannualmean
precipitationanomalies.
Fortheseasonaldrought,
Itcanreflect
the
droughtinduced
byprecipitation
anomaly.
There
isnoconsiderationof
evaporationanditishighly
dependentontheclim
atological
rainfall.Theunified
classification
isnotappropriate
inNW
China,
where
precipitationisextremely
heterogeneo
us(Z
hangetal.
1998).
Itisusedin
thesemihumid
andsemiaridregions
when
theairtemperature
ishigher
than
108C
(Zhan
get
al.2006).
Nearnorm
al:25to
225
Mild:250to
225
Moderate:270to
250
Severe:280to
270
Extreme:
280orless
Palm
erdroughtseverity
index(Palm
er1965;
Daietal.1998,2004)
Departure
ofmoisture
balance
from
anorm
al
conditionbasedona
2-layerbucket-type
waterbalance
model.
Nearnorm
al:20.49to
0.49
Itconsiders
both
watersupply
and
demandandprovides
agoodreflectionof
soilmoisture
deficitor
surplus.
Determ
inationofempirical
parameters
isdifficult.Because
theempiricalconstantsin
the
index
are
basedontheclim
ate
conditionsin
theUnitedStates,
itisnotsuitedforEastAsia.The
absolute
valueofPDSI
exaggeratestherealdrought
intensity
intheHuaiheRiver
valley(W
angandXu2012).
Accordingto
theobservational
data
inChina,thePDSIis
modifiedbymanystudies(A
n
andXing1986;
Liu
etal.2004;
Yangetal.2005a,b).
Frequentlyusedin
drought
studyoverChina,such
as
thedroughtvariations
for1951–2003(Z
ouetal.
2005),itsrelationto
streamflow(Z
haietal.
2010),andsomeregional
droughtassessments.
Incipientdry
spell:20.5
to
20.99
Mild:21.0
to21.99
Moderate:22.0
to22.99
Severe:23.0
to23.99
Extreme:24.0
orless
Standardized
precipitationindex
(McK
eeetal.1993;
EdwardsandMcK
ee
1997)
Fittingandtransform
ing
along-term
precipitation
record
into
anorm
al
distributionwithrespect
totheSPI,whichhas
zero
meanandunit
stddev.
Nearnorm
al:20.50to
0.50
Itcanbecalculatedfor
avariety
oftime
scalesto
monitor
short-term
water
suppliesandlong-
term
waterresources.
InNW
China,
zero
values
of
precipitationare
common.The
calculatedSPIvaluesatshort
timescalesmaynotbenorm
ally
distributed.
Studyingwetanddry
conditionsoverthePearl
Riverbasinin
south
ChinaandXinjiang
Province
innorthwestern
China(Z
han
get
al.2009,
2012)an
dtheassessmen
t
ofdrough
thazard(H
e
etal.2011).
Abnorm
al:20.79to
20.51
Moderate:21.29to
20.80
Severe:21.59to
21.30
Extreme:
21.99to
21.60
Exceptional:22.00orless
Composite
droughtindex
(ZouandZhang2008)
Combinationof30-day
meanand90-daymean
standardized
precipitationindex
and
30-daymean
relative
moisture.
Nearnorm
al:20.6
to0.6
Itcanstandardize
droughtondifferent
timescalesandallows
comparisonsbetw
een
droughteventsat
differentstations.
Whenmonitoringthe2009/10
droughtover
China,an
‘‘unreasonable
drought
aggravate’’problem
emerged.
Itisprovided
bytheNCC
andusedin
provincial
meteorologicalm
onitoring
(Liu
etal.2009;
Lietal.
2009;Yan
gandXie2009;
ZouandZhang2008).
Abnorm
al:21.2
to20.6
Moderate:2
1.8
to21.2
Severe:2
2.4
to21.8
Extreme:
22.4
orless
3378 JOURNAL OF CL IMATE VOLUME 28

(Zhang et al. 2009). The droughts that occurred in the
1920s and the 1940s caused huge damage to the society
and have been described in many Chinese pieces of lit-
erature and journals (e.g., Wang et al. 2000, 2002; Gong
2007; Zhang et al. 2009). Although rain gauge observa-
tions were rare in China prior to 1950, these two severe
droughts were evident in the limited observational data
(see Fig. 1 of Zhou et al. 2009a). Based on soil moisture,
a total of 76 droughts were identified during 1950–2006
for drought areas greater than 150 000 km2 and dura-
tions longer than 3 months. They identified the five most
prominent droughts (i.e., 1997–2003, 1964–70, 1974–79,
2004–06, and 1962–64); and the drought of 1997–2003
was the most severe and lasted for 76 months (Wang
et al. 2011). The yearly drought-affected areas and
drought disaster–affected areas in China for the period
1949–2012 are shown in Fig. 1. The time series of
drought-affected areas shows severe drought in 1959,
1960, 1961, 1972, 1978, 1986, 1988, 1992, 1994, 1997,
1999, 2000, 2001, and 2010, with a drought area larger
than 300 3 104 ha. The top three years in terms of the
maximum drought disaster area are 2000, 2001, and
1997, in which the area was greater than 200 3 104 ha.
Judging by its impact, the 1965–66 drought identified by
Shen et al. (2007) is not among the most severe drought
events. Nevertheless, if we compare the drought area
percentage ranked by the severity of certain drought
indices, the drought of 1965–66 can be identified: for
example, the 3-month standardized precipitation in-
dex (SPI3), the 3-month reconnaissance drought index
(RDI3), and the 3-month standardized precipitation
evapotranspiration index (SPEI3) in Xu et al. (2014).
From 1902 to 2009 themost extreme droughts in Japan
occurred in 1939–41 and 1984–85 (Lee et al. 2012). An
examination of the spatial and temporal changes of EDI
over the Korea Peninsula showed that extreme droughts
in the Korea Peninsula occurred in 1927–30, 1938–45,
1951–52, 1967–69, and 1994–96, mainly caused by con-
secutive shortages of summer rainfall lasting for two or
more years (Kim et al. 2011). In 1939–45 and 1994–96,
both Japan and the Korea Peninsula underwent severe
drought periods (Lee et al. 2012; Kim et al. 2011).
4. Climate states of East Asian drought
Most of East Asia is dominated by monsoonal circu-
lation, and precipitation shows large seasonal variation.
The summer monsoon rainfall accounts for 40%–50%
(60%–70%) of the annual precipitation in south (north)
China [Gong (2007); seeZhou et al. (2009a) for a review].
The percentage contribution to annual total rainfall ac-
counted by each season and the associated climatological
distribution of seasonal mean wind at 850hPa are shown
TABLE1.(C
ontinued)
Indexname
Calculation
Droughtclassification
Strength
Weakness
Appliedarea
Effectivedroughtindex
(ByunandW
ilhite
1999)
Itisdefinedasalack
ofprecipitationin
comparisonwiththe
clim
atological
average.
Nearnorm
al:21.0
to1.0
Candeterm
inedrought
onsetandenddates
andismore
precise
than
SPIinquan
tifying
drough
t(M
oridet
al.
2006;Pan
dey
etal.
2007;Kim
etal.2009).
Itiswidely
usedin
the
studyofdrought
occurringin
theKorea
Peninsula
andJapan
(Kim
andByun2009;
Kim
etal.2011;Lee
etal.
2012;
Ohetal.2014).
Moderate:21.5
to21.0
Severe
drought:22.0
to21.5
Extreme:22.0
orless
15 APRIL 2015 ZHANG AND ZHOU 3379
in Fig. 2. In winter (Fig. 2a), East Asia is dominated by
northerly wind along its east coastline. Thus, cold and dry
air prevails in winter and the precipitation is very small.
Most regions over China undergo very dry conditions.
The largest precipitation percentage is 15%–20% and is
seen over south China. In the spring (Fig. 2b), the rainfall
in south China accounts for 35%–40%, which is close to
that of summer. However, the precipitation percentage in
southwestern and northeastern China is still very small.
Considering the dry conditions in winter, spring drought
in these two regions tends to occur. In summer (Fig. 2c),
southwesterly wind flow is seen through eastern China,
the Korea Peninsula, and Japan. East of 102.58E is the
typical monsoon domain. The summer monsoon rain-
band is dominated by the anticyclone circulation over the
western Pacific (the western Pacific subtropical high).
The seasonal stepwise northward migration of the sub-
tropical high dominates the northward migration of the
monsoon rainband over East Asia (see Fig. 2 of Zhou
et al. 2009a). Except for south China, in most regions the
TABLE 2. Drought years over East Asia from 1900 to 2010. The events from 1900 to 2006 were obtained from the appendix table of Zhang
et al. (2009).
Year(s) Region Impacts
1900 Exceptional drought over China Huanghe River and Wei River basin dried up. No rainfall from
spring to autumn.
1928–29 Exceptional drought over China About 120 million people, 30% of the total population, subjected
to drought. Two million people died of starvation.
1936 Extreme drought over China Drought over north China and the Yangtze–Huaihe River valley
lasted for 3 years from 1934 to 1936. Rivers were dried up,
inducing failed harvest.
1942 Severe drought over most regions of China No rainfall from spring to autumn. Rivers dried up and crops
withered. Numerous people died of starvation and plague.
1959 Drought over central China in summer and
autumn
Deficient rainfall occurred over the Wei River basin, the middle
and lower reaches of the Yangtze River, and the north part of
Nanling mountain. The drought-induced disaster area was
1.7 3 104 km2 in Hubei Province.
1960 Drought over north China Drought lasted to early summer. The Huanghe River and eight
rivers in Shandong Province dried up. About 20 3 104 km2
affected.
1961 Drought over north China in spring A 16 3 104 km2 drought area. Yield of wheat in Henan Province
halved and reached lowest ever level.
1972 Exceptional drought over China Yield of northeast China only 20% of a normal year. Water level
dropped and the lower reaches of the Huanghe River dried up
for 20 days.
1978 Exceptional drought over most regions of
China
Greatly reduced agricultural production because drought mostly
occurred in grain-producing areas.
1992 Drought over north China in winter and
spring and south China in autumn
Event lasted from autumn 1991 to July 1992. Less rainfall seen in
north China, inducing losses of at least CNY 9 billion.
1994 Drought over the Yangtze–Huaihe River
valley in autumn
Drought in the Anhui and Jiangsu Provinces most severe, resulting
in losses of CNY 20 billion.
1997 Drought over north China in summer The Huanghe River dried up for 222 days, which was the longest
time since 1949. The Huaihei River also dried up for 122 days.
1999 Severe drought over north China Most parts of north China suffered winter–spring and summer–
autumn consecutive droughts.
2000 Drought over north China in spring and
summer
About 40.54 3 104 km2 impacted, inducing losses of CNY 10
billion.
2001 Drought over north China and Yangtze River
valley from spring to summer
Drought-induced disaster area was 38.47 3 104 km2, and 32.95
million people in 17 provinces were short of water.
2003 Drought over the south of the Yangtze River
and south China in autumn
Resulted in 100 3 106 kg crop yield losses and CNY 5.8 billion
economic losses.
2006 Drought over the Sichuan Province and
Chongqing in autumn
High temperatures and drought caused CNY 21.6 billion
economic losses. Agricultural disaster area was 3.39 3 104 km2,
and 18 million people suffered shortages of water.
2009–10 North China, Hebei, Shanxi, Liaoning,
southwest China, Yunnan, Guizhou,
Guangxi, and Sichuan (Qiu 2010).
Reservoirs were severely affected with a 20% reduction in
nationwide hydroelectrical production, and large cropland
sectors of northern and eastern China experienced up to 8
months of persistently stressed vegetation (Barriopedro et al.
2012).
3380 JOURNAL OF CL IMATE VOLUME 28
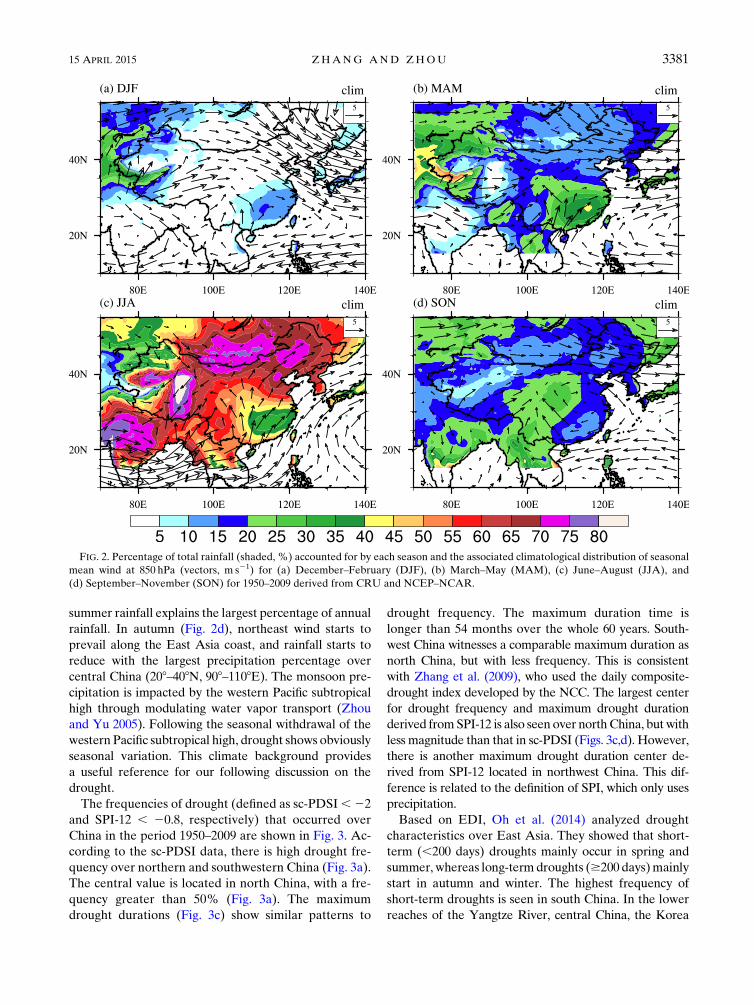
summer rainfall explains the largest percentage of annual
rainfall. In autumn (Fig. 2d), northeast wind starts to
prevail along the East Asia coast, and rainfall starts to
reduce with the largest precipitation percentage over
central China (208–408N, 908–1108E). The monsoon pre-
cipitation is impacted by the western Pacific subtropical
high through modulating water vapor transport (Zhou
and Yu 2005). Following the seasonal withdrawal of the
western Pacific subtropical high, drought shows obviously
seasonal variation. This climate background provides
a useful reference for our following discussion on the
drought.
The frequencies of drought (defined as sc-PDSI,22
and SPI-12 , 20.8, respectively) that occurred over
China in the period 1950–2009 are shown in Fig. 3. Ac-
cording to the sc-PDSI data, there is high drought fre-
quency over northern and southwestern China (Fig. 3a).
The central value is located in north China, with a fre-
quency greater than 50% (Fig. 3a). The maximum
drought durations (Fig. 3c) show similar patterns to
drought frequency. The maximum duration time is
longer than 54 months over the whole 60 years. South-
west China witnesses a comparable maximum duration as
north China, but with less frequency. This is consistent
with Zhang et al. (2009), who used the daily composite-
drought index developed by the NCC. The largest center
for drought frequency and maximum drought duration
derived fromSPI-12 is also seen over northChina, butwith
less magnitude than that in sc-PDSI (Figs. 3c,d). However,
there is another maximum drought duration center de-
rived from SPI-12 located in northwest China. This dif-
ference is related to the definition of SPI, which only uses
precipitation.
Based on EDI, Oh et al. (2014) analyzed drought
characteristics over East Asia. They showed that short-
term (,200 days) droughts mainly occur in spring and
summer, whereas long-termdroughts ($200 days)mainly
start in autumn and winter. The highest frequency of
short-term droughts is seen in south China. In the lower
reaches of the Yangtze River, central China, the Korea
FIG. 2. Percentage of total rainfall (shaded, %) accounted for by each season and the associated climatological distribution of seasonal
mean wind at 850 hPa (vectors, m s21) for (a) December–February (DJF), (b) March–May (MAM), (c) June–August (JJA), and
(d) September–November (SON) for 1950–2009 derived from CRU and NCEP–NCAR.
15 APRIL 2015 ZHANG AND ZHOU 3381

Peninsula, and central–south Japan, short-term droughts
occur more frequently than longer-term droughts, but in
NW China, the middle reaches of the Yangtze River,
northeast China, and north Japan, longer-term droughts
occur more frequently.
5. Atmospheric circulation changes associated withthe interannual variation of drought and possiblemechanisms
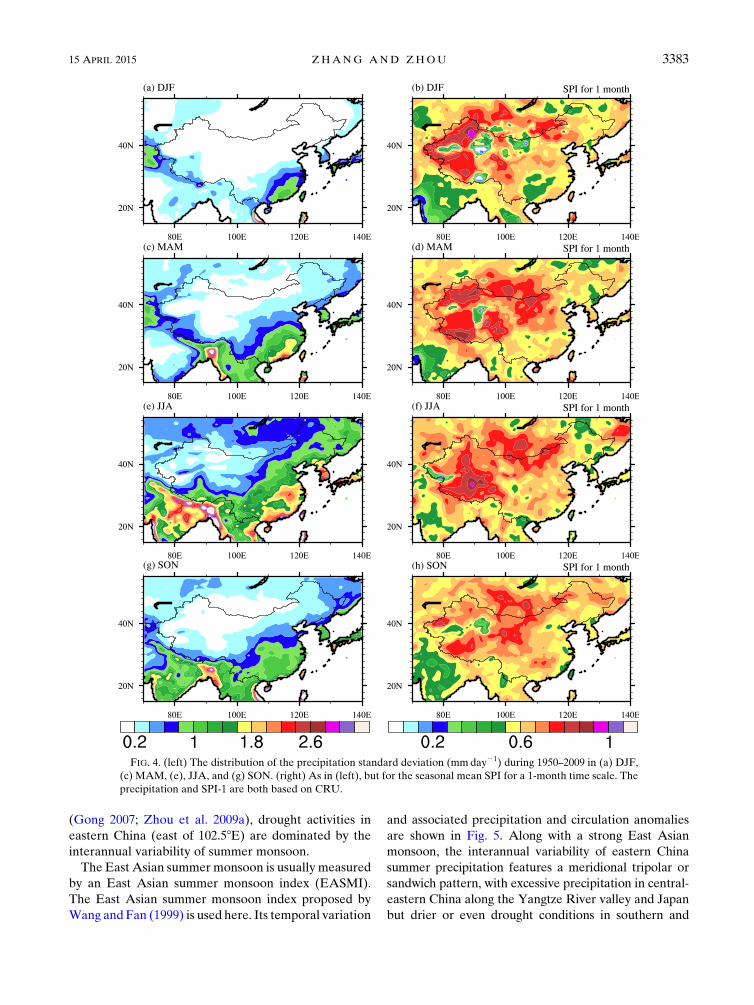
The standard deviations of seasonal precipitation are
shown in the left column of Fig. 4. In every season, the
precipitation standard deviation shows a decrease from
southeast China to northwest China, with the largest
variation over south China and the smallest variation
over northwest China. The largest standard deviation of
precipitation is seen in summer (Fig. 4e), with two cen-
ters [i.e., south China and the mei-yu/baiu/changma
rainband region (288–388N, 1058–1508E)]. However,
the variation of seasonal SPI shows a different pattern
from precipitation. The largest variation of SPI is seen
over northwest China in all seasons, with the center
value exceeding 0.8. The SPI over north China also wit-
nesses large variation, especially in spring and summer
(Figs. 4d,f). Because both the features and the forcing
mechanisms of the droughts in northwest China and the
East Asian monsoon region are different, we review
studies of droughts in these two regions separately in this
section, with a focus on the year-by-year changes.
a. Drought in the East Asian monsoon region
The East Asian monsoon climate has complex spa-
tiotemporal structures and shows distinct interannual
variation modes. Seasonal drought in the East Asian
monsoon region is dominated by the monsoonal circu-
lation. The onset time of monsoon exerts an important
influence on East Asian monsoon precipitation and
temperature. If the onset of the summer monsoon is
later and the duration is shorter, drought tends to occur
in south China, the Yunnan Province, and north China,
while severe flooding occurs in the Yangtze River and
Huaihe River valleys (see Fig. 5 of Huang et al. 2007).
Since summer rainfall accounts for 40%–50% (60%–
70%) of the annual precipitation in south (north) China
FIG. 3. The (a),(b) drought frequency (%) and (c),(d)maximumdrought duration (months) derived from (left) sc-PDSI and (right) SPI-12
during 1950–2009.
3382 JOURNAL OF CL IMATE VOLUME 28
(Gong 2007; Zhou et al. 2009a), drought activities in
eastern China (east of 102.58E) are dominated by the
interannual variability of summer monsoon.
The East Asian summer monsoon is usually measured
by an East Asian summer monsoon index (EASMI).
The East Asian summer monsoon index proposed by
Wang and Fan (1999) is used here. Its temporal variation
and associated precipitation and circulation anomalies
are shown in Fig. 5. Along with a strong East Asian
monsoon, the interannual variability of eastern China
summer precipitation features a meridional tripolar or
sandwich pattern, with excessive precipitation in central-
eastern China along the Yangtze River valley and Japan
but drier or even drought conditions in southern and
FIG. 4. (left) The distribution of the precipitation standard deviation (mmday21) during 1950–2009 in (a) DJF,
(c) MAM, (e), JJA, and (g) SON. (right) As in (left), but for the seasonal mean SPI for a 1-month time scale. The
precipitation and SPI-1 are both based on CRU.
15 APRIL 2015 ZHANG AND ZHOU 3383

northern China (Fig. 5b; Huang et al. 2012). The SPI
anomaly (Fig. 5e) shows a similar pattern with that of
precipitation, but only the correlation coefficient over the
YangtzeRiver valley and Japan is statistically significant at
the 5% level. Alongwith the tripolar precipitation pattern,
a meridional Rossby wave train is seen along the East
Asian coast, with an anomalous anticyclone appearing
over the western North Pacific (WNPAC) north of 508Nand an anomalous cyclone from the Yangtze River valley
to Japan (Fig. 5b). It is referred as the Pacific–Japan (PJ) or
East Asian–Pacific teleconnection pattern (Nitta 1987;
Huang et al. 2007). Increased southwesterly winds are seen
over southeastern China and westerly along the Yangtze
River valley and Japan, and they lead to excessive
FIG. 5. (a) Normalized time series of the EASMI (blue line) for
1979–2012 and the Niño-3.4 index (red line). The EASMI is de-fined as the normalized zonal wind shear between 850 and 200 hPaaveraged over 208–408N, 1108–1408E. (b) The horizontal distri-
bution of precipitation (shaded; mmday21) and 850-hPa wind
(vectors; m s21) regressed on the EASMI. (c) As in (b), but for the
total tropospheric (850–200 hPa) temperature (shaded; K) and
200-hPa wind (vectors; m s21). (d) As in (b), but for the SST
(shaded; K) and 850-hPa wind (vectors; m s21). (e) The horizontal
distribution of summer SPI regressed on the EASMI. The dotted
areas in (b)–(e) denote that the quantities mapped are statistically
significant at the 10% level by the Student’s t test. Panels (a)–(d)
are from Song and Zhou 2014. The EASMI and SPI in (e) are
derived from NCEP–NCAR and CRU, respectively.
3384 JOURNAL OF CL IMATE VOLUME 28

precipitation from central China to southern Japan but
drier conditions in southern China.
This wave train is forced by the anomalous heating
over the western Pacific, especially near the Philippines,
induced by anomalous precipitation associated with
WNPAC (Li et al. 2008; Xie et al. 2009; Wu et al. 2009,
2010), which results from the atmospheric circulation
changes driven by sea surface temperature anomalies
associated with ENSO (Huang et al. 2007; Wu et al.
2009). The correlation coefficient between EASMI and
the preceding winter Niño-3.4 index is 0.53 (Fig. 5a),statistically significant at the 95% confidence level. The
corresponding SST anomalies and teleconnection are
shown in Figs. 5c,d. An Indian Ocean basinwide warm-
ing is seen during El Niño decaying summer. It alreadyexists in the El Niño mature winters and the subsequentspring but does not have a significant impact on anom-alous circulation in the western North Pacific (WNP),because convection over the tropical Indian Ocean issuppressed by the remote forcing from the equatorialcentral-eastern Pacific. The basinwide warming plays anactive role in impacting the WNPAC during ENSO de-caying summers (Wu et al. 2009; Xie et al. 2009). The
positive SST anomalies and associated precipitation
anomalies over the Indian Ocean can warm the total
troposphere and induce the upper-level circulation
changes. Tropospheric warming emerges as a Matsuno–
Gill (Matsuno 1966; Gill 1980) pattern with the heating
anchored over the tropical Indian Ocean and exhibits
a wedge penetrating into the WNP (Fig. 5c). Westerly
winds dominate the equatorial Indo–western Pacific
region, as the high-level Kelvin wave response of the
Matsuno–Gill pattern, leading to an anomalous anticy-
clone over the WNP (Fig. 5d). A recent numerical
modeling study demonstrates that the cold SST anomaly
(SSTA) in the WNP is also active in maintaining the
anomalous anticyclone. The negative SSTA in theWNP
is crucial for the maintenance of the anticyclone in early
summer, whereas in late summer, the Indian Ocean
warming plays amore important role (Wu et al. 2010). In
the following autumn, dry conditions appear over
southeastern China. The anomalous precipitation pat-
tern persists throughout the subsequent winter and
spring (Wu et al. 2009). These kinds of observational
patterns have been used as observational metrics to
gauge the performances of climate models in simulating
the interannual variability of the East Asian summer
monsoon (Song and Zhou 2014).
Besides the PJ teleconnection pattern, another dom-
inant teleconnection pattern is called the Silk Road
pattern (Enomoto et al. 2003), which exerts significant
influence on the East Asian monsoon climate. The Silk
Road teleconnection is a teleconnection along the
westerly jet stream in the upper troposphere over
the Asian continent. Following Kosaka et al. (2012), the
Silk Road pattern is identified by performing an EOF on
200-hPa meridional wind velocity over (308–508N, 308–1308E) in summer. Both of the first two leading modes
can be seen as a Silk Road pattern. Considering the ro-
bust correlation with the East Asian summer rainfall, only
the first leading mode (EOF1) and the corresponding
principal component (PC1) are shown in Figs. 6a,b. The
fractional variance explained by the EOF1 is 39.8% and
can well separate from other modes based on the north’s
criteria (North et al. 1982). The SilkRoad pattern features
a wave train structure along the Asian jet (Fig. 6a), with
four centers located near 408, 658, 958, and 1308E. Thecenter near 1308E in EOF1 was associated with the Bonin
high, as discussed by Enomoto et al. (2003). The wave
activity flux propagated eastward along the Asian jet east
of 608E and finally moved southward again to the exit of
the jet (Fig. 6a). The flux indicates that the eastward-
propagatingwave train originated from theNorth Sea and
the Caspian Sea (Sato and Takahashi 2006). Associated
with the Silk Road teleconnection, a significant enhance-
ment of precipitation is seen over north China, but sig-
nificant deficient rainfall dominates over SouthKorea and
Japan (Fig. 6c). The distribution of drought is consistent
with that of precipitation anomalies (Fig. 6d), which in-
dicates that the summer drought over north China is
mainly caused by the precipitation deficient.
Most studies documented that the Silk Road tele-
connection is forced by Indian monsoon heating and is
a propagation of stationary Rossby waves along the
Asian jet in the upper troposphere (Wu et al. 2003; Wu
et al. 2003). We can see significant increased rainfall
over the Indian monsoon region in Fig. 6c. Ding and
Wang (2005) showed that the Silk Road pattern is a re-
gional manifestation of a circumglobal teleconnection
(CGT) that is recurrent in the Northern Hemispheric
summer. The CGT pattern is closely associated with
Indian summer monsoon (ISM) variability and may also
be indirectly influenced by ENSO during periods of
strong interactions between ISM and ENSO. Ding et al.
(2011) further found that CGT appears preferentially in
summers preceding the peak phases of the cycle when an
ISM precipitation anomaly is evident. During ENSO
developing summer, for instance the El Niño years, thewarm SST anomaly has attained a certain magnitude inthe eastern Pacific; this warm SST anomaly, through theequatorial anomalous heating, may induce subsidenceanomalies over the Maritime Continent, which furthersuppresses the ISM through the Rossby wave responseto the suppressed convection over the Maritime Conti-nent (Wang et al. 2003). Ding and Wang (2005) showed
that the ISM acts as a ‘‘conductor’’ connecting the CGT
15 APRIL 2015 ZHANG AND ZHOU 3385
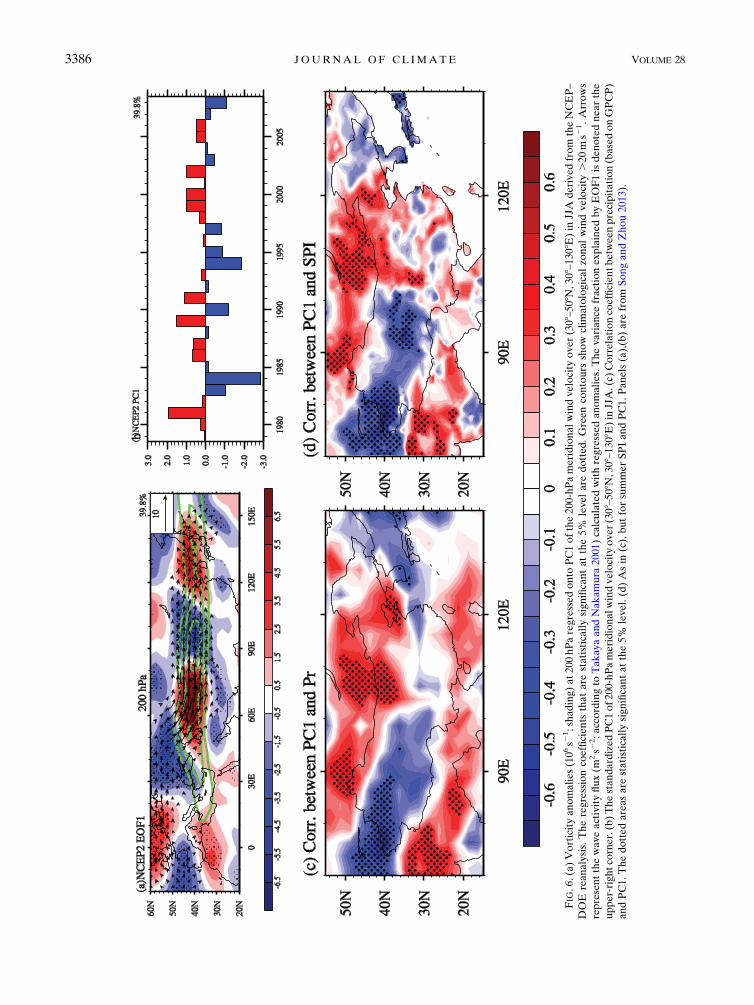
FIG.6.(a)Vorticityanomalies(106s2
1;shad
ing)
at200hParegressedonto
PC1ofthe200-hPameridionalwindvelocity
over
(308–508N
,308–1308E
)in
JJA
derived
from
theNCEP–
DOE
reanalysis.Theregressioncoefficients
thatare
statisticallysign
ificantatthe5%
levelare
dotted.Greencontours
show
clim
atologicalzonalwindvelocity
.20m
s21.Arrows
representthewaveactivityflux(m
2s2
2;accordingto
Tak
ayaandNakam
ura
2001)
calculatedwithregressedanomalies.Thevariance
fractionexplainedbyEOF1isdenotednearthe
upper-rightcorner.(b)ThestandardizedPC1of200-hPameridionalw
indvelocity
over(308–508N,308–1308E)in
JJA.(c)
Correlationcoefficientbetw
eenprecipitation(basedonGPCP)
andPC1.Thedottedareas
are
statisticallysign
ificantatthe5%
level.(d)Asin
(c),butforsummerSPIandPC1.Panels(a),(b)are
from
SongandZhou2013).
3386 JOURNAL OF CL IMATE VOLUME 28

and ENSO.When the interaction between the ISM and
ENSO is active, ENSO may influence north China via
the ISM and the CGT. This mechanism explains why
the drought in India has been in phase with that in
north China (Guo 1992; Wu et al. 2003; Liu and Ding
2008).
The impact of ENSO on eastern Asian drought activ-
ities exhibits interdecadal variability. Since the late 1970s,
the overall coupling between the East Asian system and
the ENSO has become strengthened (Wang et al. 2008).
Pre-1979, El Niño events dissipated more quickly thanthose that occurred post-1979. Since the late 1970s, thewarming in the equatorial eastern Pacific has been able topersist from boreal winter to the following spring andeven the summer, leading to an enhanced delayed re-lationship between the East Asian monsoon and ENSO.Thus, more droughts tend to occur in southern China inyears involving an El Niño decaying summer (Wang et al.
2008).
In addition to the above-mentioned two tele-
connection patterns forced by tropical SST anomalies,
some other factors, such as the North Atlantic Oscilla-
tion (NAO) and the thermal condition of the Tibetan
Plateau, are also regarded as possible impacting factors
of East Asian drought. In winter, the NAO can modu-
late the extratropical atmospheric circulation system
(Siberian high and East Asian jet stream) to influence
the variability of East Asian precipitation (Z. Wang and
Y.Ding 2006; Mao et al. 2007). Gong andHo (2003) also
documented that a positive NAO in late spring could
lead to a northward shift of the East Asian summer jet
stream and change the precipitation over the Yangtze
River valley. Xin et al. (2010) suggested that the in-
creased Tibetan Plateau snow depth is an indicator of
the connection between enhancedwinter NAOand late-
spring tropospheric cooling over East Asia. The late
spring tropospheric cooling over East Asia further led to
a drought over southern China (Xin et al. 2006). Zhang
et al. (2003) found the existence of a close relationship
between the interdecadal increase of snow depth over the
Tibetan Plateau during the preceding spring and the ex-
cessive summer rainfall over Yangtze River basin. Ding
and Sun (2003) proposed that the excessive snow results
in a decrease in heat sources over the Tibetan Plateau,
through the increased albedo and spring snow melting,
thus reducing the land–sea thermal contrast, the driving
force of the Asian summer monsoon. For a specific
drought event, the influences of individual factors might
be different. The severe drought of 2010/11 may be at-
tributed to the combined effects of La Niña, a positivephase of NAO, and the weak thermal condition of theTibetan Plateau (Sun and Yang 2012). Therefore, the
formation of drought is quite complicated.
b. Drought over NW China
NW China is located at the inland of the Eurasian
continent and is far away from the surrounding oceans.
Precipitable water in summer is only 1/2–1/3 of that in the
East Asian monsoon region. Ye and Gao (1979) and Xu
and Zhang (1983) were the first to describe the thermal
and dynamical impact of the Tibetan Plateau (TP) on
the formation of the climate of NW China. First of all,
the high topography of the TP blocks the warm and wet
air from southwest toNWChina. Second, the TP is a heat
source relative to the surrounding regions. In summer, an
upward motion dominates the TP and leads to compen-
sative descending motion over NW China. In the upper
troposphere, a southerly windmoves northward from the
TP, while in the midtroposphere (500hPa) a northerly
windmoves back to the TP (Wu andQian 1996; Qian and
Zhu 2001). The long persistence of these circulations
results in a deficiency of rainfall in the region. This is the
climatological drought background of NWChina (Zhang
et al. 2009).
On the interannual time scale, drought is associated
with the prevailing anomalous circulation. Wu and Qian
(1996) examined the circulation in wet and dry summers
of NW China and documented that these circulation
anomalies are caused by the anomalous surface heating
of the TP. We replotted the circulation anomalies for
wet and dry years of NW China using recent data. As in
Wu and Qian (1996), the wet (dry) years are 1979, 1981,
and 1983 (1980, 1985, and 1986). The precipitation and
circulation distribution in wet and dry years of NW
China is shown in Fig. 7. In wet years (Fig. 7a), the South
Asian high at 100 hPa shifts more east than that in dry
years, the midtroposphere is dominated by an anoma-
lous cyclone, and the westerly jet at 200 hPa north of the
TP is weaker than that in dry years. This is beneficial for
upward motion over the north of the TP (Fig. 7c) and,
thereby, excessive rainfall over NW China. In contrast,
for dry years (Fig. 7b), the South Asian high is located
west of 1008E, the 500-hPa circulation is dominated by
an anomalous anticyclone over NW China, and the
westerly jet at 200 hPa over the north of the TP is
stronger. The above circulation would weaken the up-
ward motion over the TP but enhance descending mo-
tion over NWChina, leading to a deficiency of rainfall in
the region (Fig. 7d; Wu and Qian 1996). The majority of
TP (258–408N, 708–1008E) is dominated by anomalous
upward motion in wet years but descending motion in
dry years. They documented that the circulation anom-
alies are related with the heating of the TP. In wet years,
the heating of the TP is larger than normal, and the
heating effect of the TP is intensified, while it is weaker
than normal in dry years. The impact of the TP on the
15 APRIL 2015 ZHANG AND ZHOU 3387

atmospheric hydrological cycle and thermodynamic ef-
fects was verified by Fan and Cheng (2003a,b) using
a climate model.
Besides the heating of the TP, many other factors
might affect drought in NW China. For instance, the
snow depth of the TP (Wu et al. 1998), the summer
Arctic Oscillation (AO) (P. Wang et al. 2007), and
ENSO (Li and Li 2004). When the summer AO is
weaker, a cyclonic anomaly appears in Baikal and its
southern region at 700 hPa, with an anomalous westerly
wind over NW China. The enhanced westerly wind is
conducive to more rainfall over NW China (P. Wang
et al. 2007). During El Niño developing years, rainfall isdeficient, and temperatures are high over most areas ofNW China, but low temperatures and more rain domi-nate the Xinjiang Province (358–508N, 758–958E). In the
FIG. 7. The distribution of geopotential height at 100 hPa (contours; 10 3 gpm) and anomalous precipitation (shaded; mmday21) and
wind at 500 hPa (vectors; m s21) for (a) wet years and (b) dry years. Only the precipitation anomalies over NW China and at 16 820 gpm
(standing for the location of the South Asian high) are shown. (c),(d) The distribution of zonal wind at 200 hPa (contours; m s21) and
anomalous vertical velocity at 500 hPa (shaded; pa s21) in wet years and dry years, respectively. The selected period is 1979–90, and thewet
and dry years are as in Wu and Qian (1996). The atmospheric circulations and precipitation anomalies are based on NCEP–NCAR and
CRU, respectively.
3388 JOURNAL OF CL IMATE VOLUME 28
years following El Niño years, Xinjiang and the east sideof the Qinghai–Xizang Plateau are wetter and colder
than normal (Li and Li 2004).
Since NW China is an arid/semiarid region, it is more
sensitive to drought disasters. Although many studies
have noticed the relationship between drought in NW
China and the two types of oscillation (ENSO and AO),
they have done so based largely on statistical analyses;
the underlying mechanisms remain unclear.
6. Long-term trend of drought severity and extentover East Asia
a. Observational evidence for the long-term trendof drought
Drought trends have been well documented by many
works in terms of drought occurrence, area, and in-
tensity. For example, by examining the dryness and
wetness trends for the period 1470–1999 derived from
Chinese historical documents and instrumental obser-
vations, Qian et al. (2003) showed that the frequency of
severe dryness and severe wetness has increased in
eastern China since the early twentieth century, co-
inciding with recent global warming. Qian and Zhu
(2001) analyzed the droughts of seven regions over China
from 1880 to 1998, and found that the aridification trend
has become more serious since the 1970s in north China,
and drought in north China reached a high during the
1990s; while along the Yangtze River valley, drought
mainly appeared from the 1920s to early 1940s. Qiu et al.
(2013) showed that the cumulative frequency and grain
loss has a good power-law relationship in China for the
period 1950–2010.
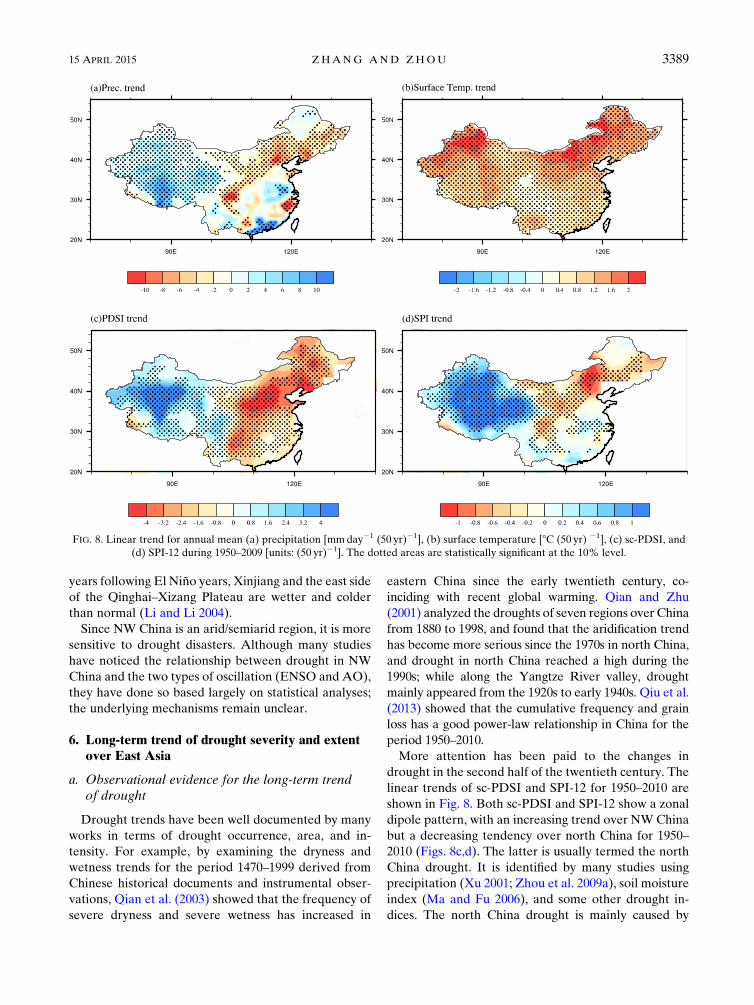
More attention has been paid to the changes in
drought in the second half of the twentieth century. The
linear trends of sc-PDSI and SPI-12 for 1950–2010 are
shown in Fig. 8. Both sc-PDSI and SPI-12 show a zonal
dipole pattern, with an increasing trend over NW China
but a decreasing tendency over north China for 1950–
2010 (Figs. 8c,d). The latter is usually termed the north
China drought. It is identified by many studies using
precipitation (Xu 2001; Zhou et al. 2009a), soil moisture
index (Ma and Fu 2006), and some other drought in-
dices. The north China drought is mainly caused by
FIG. 8. Linear trend for annual mean (a) precipitation [mmday21 (50 yr)21], (b) surface temperature [8C (50 yr) 21], (c) sc-PDSI, and
(d) SPI-12 during 1950–2009 [units: (50 yr)21]. The dotted areas are statistically significant at the 10% level.
15 APRIL 2015 ZHANG AND ZHOU 3389
decreased precipitation and intensified by increasing
temperature (Figs. 8a,b).
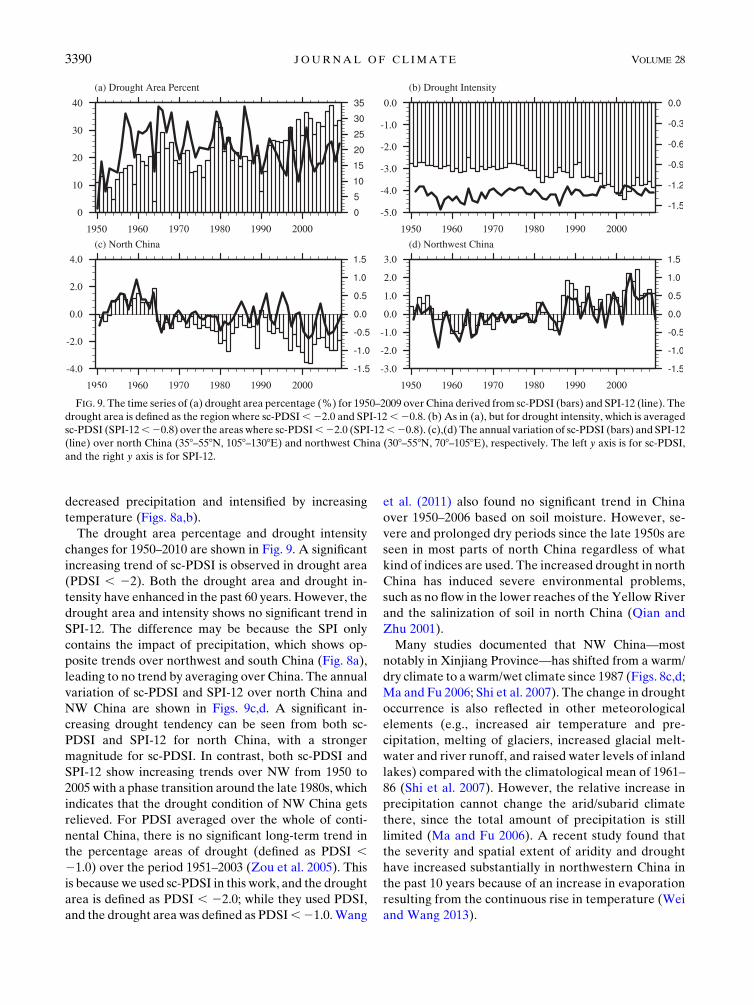
The drought area percentage and drought intensity
changes for 1950–2010 are shown in Fig. 9. A significant
increasing trend of sc-PDSI is observed in drought area
(PDSI , 22). Both the drought area and drought in-
tensity have enhanced in the past 60 years. However, the
drought area and intensity shows no significant trend in
SPI-12. The difference may be because the SPI only
contains the impact of precipitation, which shows op-
posite trends over northwest and south China (Fig. 8a),
leading to no trend by averaging over China. The annual
variation of sc-PDSI and SPI-12 over north China and
NW China are shown in Figs. 9c,d. A significant in-
creasing drought tendency can be seen from both sc-
PDSI and SPI-12 for north China, with a stronger
magnitude for sc-PDSI. In contrast, both sc-PDSI and
SPI-12 show increasing trends over NW from 1950 to
2005 with a phase transition around the late 1980s, which
indicates that the drought condition of NW China gets
relieved. For PDSI averaged over the whole of conti-
nental China, there is no significant long-term trend in
the percentage areas of drought (defined as PDSI ,21.0) over the period 1951–2003 (Zou et al. 2005). This
is because we used sc-PDSI in this work, and the drought
area is defined as PDSI , 22.0; while they used PDSI,
and the drought area was defined as PDSI,21.0.Wang
et al. (2011) also found no significant trend in China
over 1950–2006 based on soil moisture. However, se-
vere and prolonged dry periods since the late 1950s are
seen in most parts of north China regardless of what
kind of indices are used. The increased drought in north
China has induced severe environmental problems,
such as no flow in the lower reaches of the YellowRiver
and the salinization of soil in north China (Qian and
Zhu 2001).
Many studies documented that NW China—most
notably in Xinjiang Province—has shifted from a warm/
dry climate to a warm/wet climate since 1987 (Figs. 8c,d;
Ma and Fu 2006; Shi et al. 2007). The change in drought
occurrence is also reflected in other meteorological
elements (e.g., increased air temperature and pre-
cipitation, melting of glaciers, increased glacial melt-
water and river runoff, and raised water levels of inland
lakes) compared with the climatological mean of 1961–
86 (Shi et al. 2007). However, the relative increase in
precipitation cannot change the arid/subarid climate
there, since the total amount of precipitation is still
limited (Ma and Fu 2006). A recent study found that
the severity and spatial extent of aridity and drought
have increased substantially in northwestern China in
the past 10 years because of an increase in evaporation
resulting from the continuous rise in temperature (Wei
and Wang 2013).
FIG. 9. The time series of (a) drought area percentage (%) for 1950–2009 over China derived from sc-PDSI (bars) and SPI-12 (line). The
drought area is defined as the region where sc-PDSI,22.0 and SPI-12,20.8. (b) As in (a), but for drought intensity, which is averaged
sc-PDSI (SPI-12,20.8) over the areas where sc-PDSI,22.0 (SPI-12,20.8). (c),(d) The annual variation of sc-PDSI (bars) and SPI-12
(line) over north China (358–558N, 1058–1308E) and northwest China (308–558N, 708–1058E), respectively. The left y axis is for sc-PDSI,
and the right y axis is for SPI-12.
3390 JOURNAL OF CL IMATE VOLUME 28
b. Mechanisms for the drought trend over East Asianmonsoon regions
The drying trend over north China in the second half
of the twentieth century is associated with a persistent
warming and less precipitation (Figs. 8a,b). A shift from
wet to dry conditions in north China can be seen from
the mid and late 1970s to the present (Ma 2007). This
transition is related to the interdecadal scale weakening
of the East Asian summer monsoon (EASM) circula-
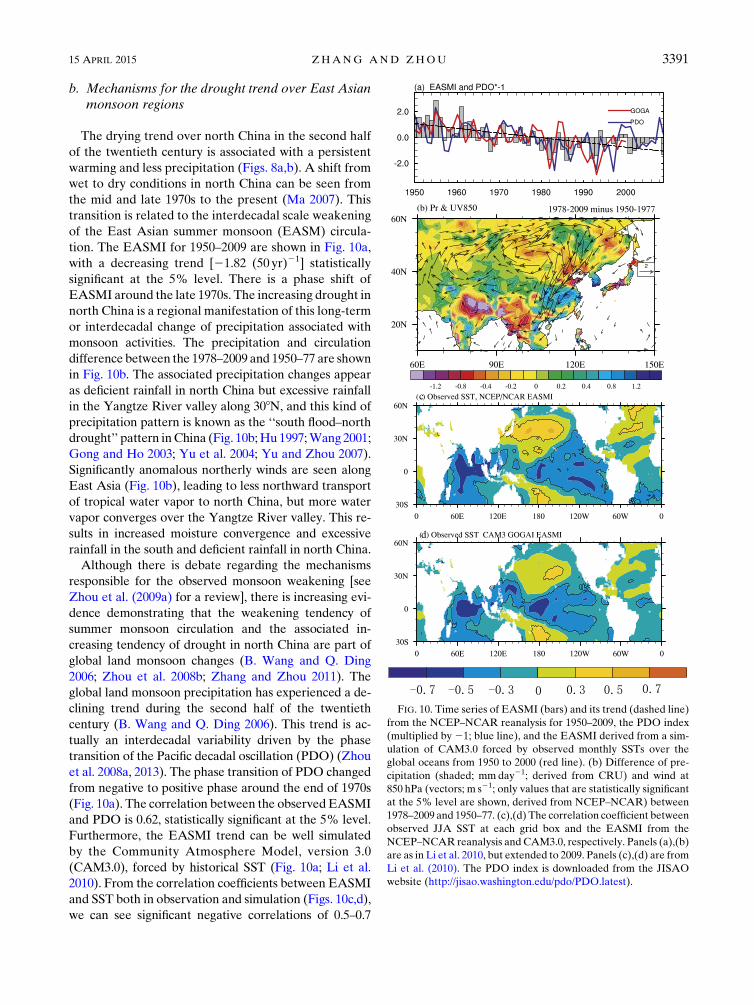
tion. The EASMI for 1950–2009 are shown in Fig. 10a,
with a decreasing trend [21.82 (50 yr)21] statistically
significant at the 5% level. There is a phase shift of
EASMI around the late 1970s. The increasing drought in
north China is a regional manifestation of this long-term
or interdecadal change of precipitation associated with
monsoon activities. The precipitation and circulation
difference between the 1978–2009 and 1950–77 are shown
in Fig. 10b. The associated precipitation changes appear
as deficient rainfall in north China but excessive rainfall
in the Yangtze River valley along 308N, and this kind of
precipitation pattern is known as the ‘‘south flood–north
drought’’ pattern inChina (Fig. 10b;Hu 1997;Wang 2001;
Gong and Ho 2003; Yu et al. 2004; Yu and Zhou 2007).
Significantly anomalous northerly winds are seen along
East Asia (Fig. 10b), leading to less northward transport
of tropical water vapor to north China, but more water
vapor converges over the Yangtze River valley. This re-
sults in increased moisture convergence and excessive
rainfall in the south and deficient rainfall in north China.
Although there is debate regarding the mechanisms
responsible for the observed monsoon weakening [see
Zhou et al. (2009a) for a review], there is increasing evi-
dence demonstrating that the weakening tendency of
summer monsoon circulation and the associated in-
creasing tendency of drought in north China are part of
global land monsoon changes (B. Wang and Q. Ding
2006; Zhou et al. 2008b; Zhang and Zhou 2011). The
global land monsoon precipitation has experienced a de-
clining trend during the second half of the twentieth
century (B. Wang and Q. Ding 2006). This trend is ac-
tually an interdecadal variability driven by the phase
transition of the Pacific decadal oscillation (PDO) (Zhou
et al. 2008a, 2013). The phase transition of PDO changed
from negative to positive phase around the end of 1970s
(Fig. 10a). The correlation between the observedEASMI
and PDO is 0.62, statistically significant at the 5% level.
Furthermore, the EASMI trend can be well simulated
by the Community Atmosphere Model, version 3.0
(CAM3.0), forced by historical SST (Fig. 10a; Li et al.
2010). From the correlation coefficients between EASMI
and SST both in observation and simulation (Figs. 10c,d),
we can see significant negative correlations of 0.5–0.7
FIG. 10. Time series of EASMI (bars) and its trend (dashed line)
from the NCEP–NCAR reanalysis for 1950–2009, the PDO index
(multiplied by 21; blue line), and the EASMI derived from a sim-
ulation of CAM3.0 forced by observed monthly SSTs over the
global oceans from 1950 to 2000 (red line). (b) Difference of pre-
cipitation (shaded; mmday21; derived from CRU) and wind at
850 hPa (vectors; m s21; only values that are statistically significant
at the 5% level are shown, derived from NCEP–NCAR) between
1978–2009 and 1950–77. (c),(d) The correlation coefficient between
observed JJA SST at each grid box and the EASMI from the
NCEP–NCAR reanalysis and CAM3.0, respectively. Panels (a),(b)
are as in Li et al. 2010, but extended to 2009. Panels (c),(d) are from
Li et al. (2010). The PDO index is downloaded from the JISAO
website (http://jisao.washington.edu/pdo/PDO.latest).
15 APRIL 2015 ZHANG AND ZHOU 3391

over the tropical central and eastern Pacific and central
Indian Ocean, while positive correlations exist over the
North and South Pacific. The phase transition of PDOhas
led to a weakened land–sea thermal contrast and thereby
a weakened EASM circulation (Li et al. 2010), followed
by an increasing drought tendency in north China.
The forcing of PDO to the EASM circulation and
thereby drought activities is more evident if we extend
our analysis to the changes of drought during the whole
of the twentieth century. Qian and Zhou (2014) exam-
ined the dry–wet changes in north China during 1900–
2010 on the basis of self-calibrated PDSI data. The en-
semble empirical mode decompositionmethod was used
to detect multidecadal variability. They highlighted that
approximately 70% of the drying trend during 1960–90
originated from 50–70-yr multidecadal variability re-
lated to PDOphase changes. The PDSI in north China is
significantly negatively correlated with the PDO index,
particularly at the 50–70-yr time scale. This negative
correlation relationship is stable during 1900–2010
(Qian and Zhou 2014).
In addition to the natural forcing of PDO, the TP
thermal forcing (Duan andWu 2008) and anthropogenic
forcing agents including aerosols (Menon et al. 2002;
Wang et al. 2013) have also been suggested as mecha-
nisms that have driven the long-term monsoon and
thereby drought changes over East Asia. A regional
model study on land-use effects showed that the land use
modified by anthropogenic activities may result in a re-
duction of precipitation and an increase of temperature
over north China (Gao et al. 2007). A recent analysis of
17 models from phase 5 of the Coupled Model In-
tercomparison Project (CMIP5) found that, although the
aerosol forcing can drive a weakened monsoon circula-
tion in the model experiments, the models’ responses are
far weaker than the observation. The models fail to re-
produce the observed precipitation changes, including
the drought trend in north China (Song et al. 2014). They
suggest that the internal variability mode of the PDO has
played a dominant role in the monsoon weakening, while
the aerosol forcing plays a secondary or complementary
role. The emission of greenhouse gases favors an en-
hanced monsoon circulation, but the model response is
weaker than that of aerosols.
In summary, the increasing drought in north China in
the second half of the twentieth century is consistent
with the weakening tendency of EASM circulation. The
monsoon weakening is a regional manifestation of
global land monsoon changes driven by the phase tran-
sition of the PDO (Zhou et al. 2013). Thus, natural
variability is the dominant factor that determines the
long-term drought changes in north China. Simulation
experiments using CAM3.0 demonstrate that greenhouse
gases plus aerosol forcing (direct effect) increases the
land–sea thermal contrast and thus enhances the EASM
circulation (Li et al. 2010), which will lead to excessive
rainfall in north China. Recent studies have also reported
a recovery of EASM circulation in the present century
(Zhu et al. 2011; Liu et al. 2012; Lin et al. 2014), and
whether or not this indicates drought in north China is
weakening deserves further study.
7. Prediction and projection of drought in China
a. Studies on drought prediction
The prediction of the East Asian monsoon is a topic
with a long history and is still of concern today both in the
scientific research community and operational fore-
casting groups. The prediction over East Asia mostly
concentrates on precipitation. SST-constrained Atmo-
spheric Model Intercomparison Project (AMIP)-type
atmospheric general circulation model (AGCM) simu-
lations show low skill in predicting East Asian monsoon
precipitation, including its climatological position, annual
cycle, and interannual variation (Chen et al. 2010; Zhou
et al. 2009b; Li et al. 2010; Li and Zhou 2011). The recent
work by Sperber et al. (2013) showed that the climate
models that participated in CMIP5 show better perfor-
mance in simulating East Asian monsoon circulation and
precipitation but still cannot satisfactorily reproduce its
onset and retreat. Song and Zhou (2014) investigated the
interannual variability of EASMsimulated byAGCMs in
phase 3 of CMIP (CMIP3) and CMIP5, and found that
the rainband known as mei-yu/baiu/changma (288–388N,
1058–1508E) is poorly simulated, although significant
improvement is seen from CMIP3 to CMIP5. The in-
terannual EASM pattern is partly reproduced in the
CMIP3 and CMIP5 multimodel ensemble (MME), but
with weaker magnitude and a southward shift of the di-
pole rainfall pattern. They documented that a successful
reproduction of interannual EASM pattern depends
highly on the Indian Ocean–western Pacific anticyclone
teleconnection. This provides lights to the prediction of
droughts in the East Asian monsoon area.
Dynamic seasonal forecasting systems based on cou-
pled atmosphere–ocean–land general circulation models
(CGCMs) have been widely used for drought prediction
in recent years (Luo and Wood 2007; Dutra et al. 2013;
Yuan and Wood 2013). Kang et al. (2004) showed that
extratropical precipitation is less predictable than in the
tropics because of the large contribution of internal at-
mospheric processes. Their work was based on the sea-
sonal prediction experiment of the Climate and Ocean:
Variability, Predictability and Change (CLIVAR) Sea-
sonal Prediction Model Intercomparison Project II
(SMIP II). High forecasting skill of surface temperature
3392 JOURNAL OF CL IMATE VOLUME 28
and precipitation is mostly seen in the tropics, while it is
almost zero in East Asia, as derived from the Asia–Pacific
Economic Cooperation (APEC) Climate Center (APCC)/
ClimatePrediction and itsApplication to Society (CliPAS)
hindcast results (Wang et al. 2009). The poor prediction of
East Asian monsoon precipitation is also seen in the sea-
sonal forecasts of ECMWF System 4 and NCEP Climate
Forecast System, version 2 (CFSv2), and the DEMETER
project (Kim et al. 2012; Kang et al. 2004; Luo et al. 2013;
Yang et al. 2008; Liu et al. 2014). The seasonal hindcast
results of theAPCC/CliPAS andDEMETERprojects can
satisfactorily predict the four observed EOF modes of
Asian winter temperature variability, which are related
with ENSO and AO (Lee et al. 2013). Using 28-yr (1982–
2009) North American Multimodel Ensemble (NMME)
hindcast data with 110 ensemble members, Yuan and
Wood (2013) found that the multimodal ensemble in-
creases the drought detectability over some tropical areas
where individual models have better performance but
cannot help over most extratropical regions, such as East
Asia.
Although the precipitation of East Asia is poorly
predicted, the climatological and interannual variation
of circulation can be reproduced well by climate models.
Yang et al. (2008) showed that the NCEP Climate
Forecast System (CFS) can successfully predict the
major dynamical monsoon indices and monsoon pre-
cipitation patterns several months in advance, and the
skill mainly derives from the impact of ENSO. Kim et al.
(2012) pointed out that the Asian monsoon appears to
be well predicted during years with strong ENSO forc-
ing. The two dominant teleconnections that influence
East Asia [i.e., the Pacific–Japan pattern (Nitta 1987)
and the Silk Road pattern (Xiao et al. 2009; Kosaka and
Nakamura 2006)] are key factors for East Asian climate
prediction. The former is associated with ENSO and can
generally be captured by climatemodels, while the latter
cannot be predicted because of its lack of correlation
with ENSO. Zhou and Zou (2010) examined the reason
for the predictability of EASM from the reproduction of
land–sea thermal contrast change in AMIP-type simu-
lations and found that the prediction skill mainly comes
from the predictability of the meridional land–sea ther-
mal contrast. Through comparing two ensembles of
AGCM simulations forced with observed monthly SST
and their climatological annual cycle, Ferguson et al.
(2010) investigated the influence of SST forcing on sto-
chastic characteristics of simulated seasonal precipitation
and drought. They showed that SST anomalies have no
significant influence on simulated drought frequency,
duration, and magnitude over East Asia, and severe and
sustained drought events may occur in the absence of
persistent SST forcing.
Two principle reasons are responsible for the poor
level of skill in simulating EASMbyAGCMs: one is that
many defects still exist in the physical processes of these
models, and the other is that air–sea interaction is not
taken into consideration in SST-forced AGCM simula-
tions (Wu and Kirtman 2005, 2007; Wang et al. 2005). In
contrast to studies of precipitation and atmospheric
circulation, less effort has been devoted to the seasonal
prediction of East Asian drought. In addition, most at-
tention is paid to the East Asian monsoon region, while
examinations of NW China are few in number. There-
fore, a systematic examination of drought simulation
and prediction is needed. In particular, an intensive
analysis of drought in NW China should be carried out.
b. Projection of future changes in drought
Previous studies have indicated that global warming
might contribute to more frequent and severe drought.
It is crucial to study the impact of warming related to
greenhouse gases on East Asian drought by comparing
projected climates. Kim and Byun (2009) investigated
the drought pattern based on the simulations of 15
coupled climate models under the SRES A1B scenario.
They found that Asian monsoon regions show a greater
increase in the standard deviation of precipitation than
the mean precipitation, with an amplified seasonal cycle
of precipitation, which results in a slight increase in
drought frequency and intensity over parts of the Asian
monsoon regions. Simulations by RegCM2 nested with
a CSIRO model indicate that the warm/wet climate over
NW China will continue under a doubling of CO2, but
aerosols and natural factors might reduce this increase of
magnitude (Shi et al. 2007).
Using the Hadley Centre climate model under the
SRES A2 scenario, Burke et al. (2006) examined the
projected global drought for the twenty-first century and
found a drying tendency over easternAsia. Sheffield and
Wood (2008) investigated the projected changes of
drought occurrence under future global warming in
multimodel, multiscenario IPCC AR4 simulations, and
found that the models show decreases in soil moisture
globally under all scenarios with a corresponding dou-
bling of the spatial extent of severe soil moisture deficits
and frequency of short-term (4–6-month duration)
droughts from the mid-twentieth century to the end of
the twenty-first century. Nevertheless, the changes over
East Asia are predicted to be relatively small. The PDSI
change projected by 22 CMIP3 climate models under
the SRES A1B scenario (Dai 2011a) exhibits an in-
creasing trend of drought in Southeast Asia. Zhou and
Hong (2013) compared the potential change of global
drought using PDSI with two potential evapotranspira-
tion equations using a coupled climate system model
15 APRIL 2015 ZHANG AND ZHOU 3393
(FGOALS-s2) under the representative concentration
pathway 8.5 (RCP8.5) scenario. They found that the
algorithm of the Thornthwaite equation overestimates
the impact of surface temperature on evaporation and
leads to an unrealistic increasing of drought frequency,
while the algorithm based on the Penman–Monteith
equation is physically reasonable and necessary for cli-
mate change projections. This model projects an in-
creasing trend of drought during 2051–2100 in Southeast
Asia under the RCP8.5 scenario. The 14-model ensem-
ble mean from CMIP5 also projects an increasing trend
in Southeast Asia (Dai 2013), similar to the changes
simulated by FGOALS-s2. Sillman et al. (2013) ana-
lyzed global changes in the consecutive dry-day (CDD)
index over the twenty-first century relative to the ref-
erence period 1981–2000 using the CMIP5 multimodel
ensemble under different emission scenarios. They
showed that CDD increases in Southeast Asia, which is
combined with increases in the heavy precipitation days
index (R10mm) and maximum 5-day precipitation in-
dex, indicating an intensification of both wet and dry
seasons in this region. Using two ensembles from the
Hadley Centre AGCM and other AGCM 2 3 CO2
equilibrium runs, Burke and Brown (2008) computed
four different drought indices and found that in Indo-
china the sign and magnitude of the change in drought is
dependent on index definition and ensemble number.
The above analysis shows that, under the SRES A1B
scenario and doubled CO2 simulations, most climate
models project an increasing drought frequency and in-
tensity based on soil moisture, PDSI, and precipitation.
However, the projection pattern and severity depend on
the climate model and drought index. Burke and Brown
(2008) pointed out that it is only those regions where
there is a consistent increase in drought across all indices
and ensembles where the annual average precipitation
decreases. East Asia is covered by different climate
zones, and the precipitation changes show distinct re-
gional characteristics. Therefore, the selection of appro-
priate indices is important for drought impact studies.
8. Summary
In this paper, we reviewed the occurrence and known
areas of severe drought, the atmospheric circulation and
potential mechanisms that impact the interannual vari-
ation of drought, and the long-term trend and associated
mechanisms, predictability, and projection of East
Asian drought. The following is the synthesis of the
above aspects of East Asian drought:
1) Drought events that occurred over the past 100 years
can be clustered into several periods. During 1950–
2010, the major drought periods of China occurred in
1959–61, 1978–82, 1987–94, and 1997–2002. Themain
drought events in China and the associated impacts
are described in this paper, and a summary can be
found in Table 2.
2) Dominated by the monsoonal circulation, drought
over East Asia shows apparent seasonal variation.
The seasonal drought over the East Asian monsoon
region is closely related with the onset, duration, and
ending of monsoon circulation. In spring, drought
mostly occurs over north China and southwest China.
North China and southwest China are the regions
with the highest drought frequency and maximum
duration areas.
3) The circulation and possible mechanisms responsible
for the interannual variation of East Asian drought
were discussed. The drought in eastern China, Japan,
and the Korea Peninsula is dominated by the East
Asianmonsoon variability. There are two teleconnec-
tions that dominant the interannual variability of
eastern China’s summer precipitation. One is the
Pacific–Japan (PJ) or East Asian–Pacific teleconnec-
tion pattern. The precipitation anomaly features
a meridional tripolar or sandwich pattern, with exces-
sive precipitation in central-eastern China along the
Yangtze River valley and Japan but drier or even
drought conditions in southern and northern China. It
is forced by an anomalous anticyclone that appears
over the WNP, which is forced by the SST anomalies
over the WNP and the Indian Ocean during El Niñodecaying summer. The other teleconnection is the SilkRoad teleconnection, which is forced by Indian mon-soon heating and a propagation of stationary Rossbywaves along the Asian jet in the upper troposphereover the Asian continent. It can significantly influencethe precipitation over north China and the YangtzeRiver valley and Japan. The Silk Road pattern isa regional manifestation of a circumglobal teleconnec-tion and appears preferentially in summers precedingthe peak phases of the cycle when an Indian monsoonprecipitation anomaly is evident.
4) NW China is an arid–semiarid area. The surface
heating of the TP is themain forcing of local drought.
When the surface heating of the TP is weaker than
normal, the South Asian high at 100 hPa is located
west of 1008E, and an anomalous anticyclone dom-
inant at 500 hPa and westerly jet at 200 hPa in the
north of the TP is stronger than normal. They lead to
stronger descending motion over NW China and
local drought. Although both ENSO and AO show
significant correlations with NW China drought, the
underlying mechanisms are yet to be elucidated.
5) In terms of the long-term trend and underlying
physical mechanisms of East Asian drought from
3394 JOURNAL OF CL IMATE VOLUME 28
1950 to the present, a zonal dipole pattern of drought
trend is seen over China, with an increasing drought
trend over north China and a decreasing tendency
overNWChina.Drought in northernChina is mainly
caused by the decreased precipitation and intensified
by the increasing temperature and accompanied by
decreased EASM and flooding in southern China.
The increasing drought in north China in the second
half of the twentieth century is consistent with the
weakening tendency of EASM, which is driven by
the phase transition of the PDO. Anthropogenic
agents may only play complementary roles in shap-
ing the monsoon and thereby drought changes in
China.
6) Studies on the predictability of East Asian drought
are limited, while most prediction studies focus on
precipitation and circulation over East Asia. AMIP-
type simulations and seasonal hindcasts of climate
models show limited skill in simulating the climato-
logical position, annual cycle, and interannual varia-
tions of East Asian summer precipitation. In contrast,
the circulation related to the interannual variation of
East Asian precipitation can be predicted well. ENSO
and a good reproduction of the associated teleconnec-
tion are the main sources of prediction. Under the
SRES A1B scenario and doubled CO2 simulations,
most climate models project an increasing drought
frequency and intensity over East Asia, mainly in
southeastern Asia. However, the projection patterns
and severity are dependent on the climate model and
drought index used.Multimodel intercomparisons and
an appropriate choice of drought index are necessary
in future studies.
Understanding the variation mechanisms of East
Asian droughts and their prediction is a challenging
task. In terms of the future of this field, there are
some important issues–questions that call for further
investigation:
1) A reasonable drought index for NW China needs to
be developed, because there is no drought index
currently able to represent the drought type and
severity of the region. The drought index should also
consider the detection of drought onset, end point,
and the accumulated effect and relationship between
drought and the natural ecosystem.
2) How can we better understand the influence of
ENSO on short-term atmospheric variability associ-
atedwith drought?And besides ENSO, are there any
other factors that can contribute to the occurrence of
drought in East Asia?
3) Despite many studies having noticed the relationship
between NW China drought and ENSO–AO, they
have done so largely on the basis of statistical analyses;
the underlying mechanisms remain unknown.
4) To date, simulation and prediction studies over East
Asia have concentrated on precipitation; the simu-
lation and prediction skills of climate models with
respect to East Asian drought are yet to be properly
examined.
Acknowledgments. This work was jointly supported
by the National Natural Science Foundation of China
under Grants 41305072, 41330423, and 41023002, and
the open Program of NUIST under Grant KLME1306.
We thank Dr. Fengfei Song for providing us with some
plots in their papers. The authors thank the anonymous
reviewers of this paper for their helpful comments.
REFERENCES
Adler, R. F., and Coauthors, 2003: The Version-2 Global Pre-
cipitation Climatology Project (GPCP) monthly precipitation
analysis (1979–present). J. Hydrometeor., 4, 1147–1167,
doi:10.1175/1525-7541(2003)004,1147:TVGPCP.2.0.CO;2.
An, S., and J. Xing, 1986: A modified Palmer’s Drought Index (in
Chinese). J. Acad. Meteor. Sci., 1, 75–82.
Barriopedro, D., C. M. Gouveia, R. M. Trigo, and L. Wang, 2012:
The 2009/10 drought in China: Possible causes and impacts
on vegetation. J. Hydrometeor., 13, 1251–1267, doi:10.1175/JHM-D-11-074.1.
Burke, E. J., and S. J. Brown, 2008: Evaluating uncertainties in the
projection of future drought. J. Hydrometeor., 9, 292–299,
doi:10.1175/2007JHM929.1.
——, ——, and N. Christidis, 2006: Modeling the recent evolution
of global drought and projections for the twenty-first century
with the Hadley Centre climate model. J. Hydrometeor., 7,1113–1125, doi:10.1175/JHM544.1.
Byun, H. R., and D. A. Wilhite, 1999: Objective quantification of
drought severity and duration. J. Climate, 12, 2747–2756,
doi:10.1175/1520-0442(1999)012,2747:OQODSA.2.0.CO;2.
Chen, H., T. Zhou, R. B. Neale, X. Wu, and G. J. Zhang, 2010:
Performance of the new NCAR CAM3.5 in East Asian sum-
mer monsoon simulations: Sensitivity to modifications of the
convection scheme. J. Climate, 23, 3657–3675, doi:10.1175/2010JCLI3022.1.
Dai, A., 2011a: Drought under global warming: A review. Wiley
Interdiscip. Rev.: Climate Change, 2, 45–65, doi:10.1002/
wcc.81.
——, 2011b: Characteristics and trends in various forms of the
Palmer drought severity index during 1900–2008. J. Geophys.
Res., 116, D12115, doi:10.1029/2010JD015541.
——, 2013: Increasing drought under global warming in observa-
tions and models. Nat. Climate Change, 3, 52–58, doi:10.1038/
nclimate1633.
——, K. E. Trenberth, and T. R. Karl, 1998: Global variations in
droughts and wet spells: 1900–1995. Geophys. Res. Lett., 25,
3367–3370, doi:10.1029/98GL52511.
——, ——, and T. T. Qian, 2004: A global dataset of Palmer
drought severity index for 1870–2002: Relationship with soil
moisture and effects of surface warming. J. Hydrometeor., 5,
1117–1130, doi:10.1175/JHM-386.1.
15 APRIL 2015 ZHANG AND ZHOU 3395

Ding, Q., and B. Wang, 2005: Circumglobal teleconnection in the
Northern Hemisphere summer. J. Climate, 18, 3483–3503,
doi:10.1175/JCLI3473.1.
——, ——, J. M. Wallace, and G. Branstator, 2011: Tropical–
extratropical teleconnections in boreal summer: Observed
interannual variability. J. Climate, 24, 1878–1896, doi:
10.1175/2011JCLI3621.1.
Ding, Y. H., and Y. Sun, 2003: Inter-decadal variation of the
temperature and precipitation patterns in East Asian mon-
soon region. Proc. Int. Symp. on Climate Change (ISCC),
Beijing, China, World Meteorological Organization, 66–71.
Duan, A., and G. Wu, 2008: Weakening trend in the atmospheric
heat source over the Tibetan Plateau during recent decades.
Part I: Observations. J. Climate, 21, 3149–3164, doi:10.1175/
2007JCLI1912.1.
Dutra, E., L. Magnusson, F. Wetterhall, H. L. Cloke, G. Balsamo,
S. Boussetta, and F. Pappenberger, 2013: The 2010–2011
drought in the Horn of Africa in ECMWF reanalysis and
seasonal forecast products. Int. J. Climatol., 33, 1720–1729,doi:10.1002/joc.3545.
Edwards, D. C., and T. B. McKee, 1997: Characteristics of 20th
century drought in the United States at multiple time scales.
Department of Atmospheric Science, Colorado State Uni-
versity, Atmospheric Science Paper 634, 155 pp.
Enomoto, T., B. J. Hoskins, and Y. Matsuda, 2003: The formation
mechanismof theBonin high inAugust.Quart. J. Roy.Meteor.
Soc., 129, 157–178, doi:10.1256/qj.01.211.
Fan, G. Z., and G. D. Cheng, 2003a: Reason analysis of the in-
fluence of Qinghai–Xizang Plateau uplifting on arid climate
forming in northwest China (I): Influence on general circula-
tion of atmosphere (in Chinese). Plateau Meteor., 22, 45–57.
——, and ——, 2003b: Simulation of influence of Qinghai–Xizang
Plateau uplifting on NW China arid climate forming (II):
Changing of atmosphere hydrological cycle and dynamical
and thermal effects of Plateau (in Chinese). Plateau Meteor.,
22, 58–66.
Ferguson, I.M., J.A.Dracup, P. B.Duffy, P. Pegion, andS. Schubert,
2010: Influence of SST forcing on stochastic characteristics of
simulated precipitation and drought. J. Hydrometeor., 11,
754–769, doi:10.1175/2009JHM1132.1.
Gao, X. J., D. Zhang, Z. Chen, J. S. Pal, and F. Giorgi, 2007:
Land use effects on climate in China as simulated by a re-
gional climate model. Sci. China, 50D, 620–628, doi:10.1007/
s11430-007-2060-y.
Gill, A. E., 1980: Some simple solutions for heat-induced tropical
circulation. Quart. J. Roy. Meteor. Soc., 106, 447–462,
doi:10.1002/qj.49710644905.
Gong,D.Y., 2007: Climate of China.ClimateDisasters, S.W.Wang
and W. Li, Eds., China Meteor. Press, 138–176.
——, and C. H. Ho, 2003: Arctic oscillation signals in the East
Asian summer monsoon. J. Geophys. Res., 108, 4066,
doi:10.1029/2002JD002193.
Guo, Q., 1992: Teleconnection between the floods/droughts in
North China and Indian summer monsoon rainfall (in Chi-
nese). Acta Geogr. Sin., 47, 394–402.
He, B., A. F. Lü, J. Wu, L. Zhao, andM. Liu, 2011: Drought hazard
assessment and spatial characteristics analysis in China.
J. Geogr. Sci., 21, 235–249, doi:10.1007/s11442-011-0841-x.
Heim, R. R., Jr., 2000: Drought indices: A review. Drought: A
Global Assessment, D. A. White, Ed., Hazards and Disasters,
Vol. 2, Routledge, 159–167.
Hu, Z. Z., 1997: Interdecadal variability of summer climate over
East Asia and its association with 500 hPa height and global
sea surface temperature. J. Geophys. Res., 102, 19 403–19 412,
doi:10.1029/97JD01052.
Huang, R. H., J. L. Chen, and G. Huang, 2007: Characteristics and
variations of the East Asian monsoon system and its impacts
on climate disasters in China. Adv. Atmos. Sci., 24, 993–1023,
doi:10.1007/s00376-007-0993-x.
——, ——, L. Wang, and Z. D. Lin, 2012: Characteristics, pro-
cesses, and causes of the spatio-temporal variabilities of the
East Asian monsoon system. Adv. Atmos. Sci., 29, 910–942,
doi:10.1007/s00376-012-2015-x.
Kalnay, E., and Coauthors, 1996: The NCEP/NCAR 40-Year Re-
analysis Project. Bull. Amer. Meteor. Soc., 77, 437–470,
doi:10.1175/1520-0477(1996)077,0437:TNYRP.2.0.CO;2.
Kang, I. S., J. Y. Lee, and C. K. Park, 2004: Potential predictability
of summer mean precipitation in a dynamical seasonal
prediction system with systematic error correction. J. Cli-
mate, 17, 834–844, doi:10.1175/1520-0442(2004)017,0834:
PPOSMP.2.0.CO;2.
Keyantash, J., and J.A.Dracup, 2002: The quantification of drought:
An evaluation of drought indices. Bull. Amer. Meteor.
Soc., 83, 1167–1180, doi:10.1175/1520-0477(2002)083,1191:
TQODAE.2.3.CO;2.
Kim,D.W., andH. R. Byun, 2009: Future pattern of Asian drought
under global warming scenario. Theor. Appl. Climatol., 98,
137–150, doi:10.1007/s00704-008-0100-y.
——, ——, and K. S. Choi, 2009: Evaluation, modification, and
application of the effective drought index to 200-year drought
climatology of Seoul, Korea. J. Hydrol., 378, 1–12, doi:10.1016/
j.jhydrol.2009.08.021.
——, ——, ——, and S. B. Oh, 2011: A spatiotemporal analysis of
historical droughts in Korea. J. Appl. Meteor. Climatol., 50,
1895–1912, doi:10.1175/2011JAMC2664.1.
Kim,H.M., P. J.Webster, J. A. Curry, andV. E. Toma, 2012: Asian
summer monsoon prediction in ECMWF System 4 and NCEP
CFSv2 retrospective seasonal forecasts. Climate Dyn., 39,
2975–2991, doi:10.1007/s00382-012-1470-5.
Kosaka, Y., and H. Nakamura, 2006: Structure and dynamics of
the summertime Pacific–Japan teleconnection pattern.
Quart. J. Roy. Meteor. Soc., 132, 2009–2030, doi:10.1256/
qj.05.204.
——, J. S. Chowdary, S. P. Xie, Y. M. Min, and J. Y. Lee, 2012:
Limitations of seasonal predictability for summer climate over
East Asia and the northwestern Pacific. J. Climate, 25, 7574–
7589, doi:10.1175/JCLI-D-12-00009.1.
Lee, J., S. Lee, B.Wang, K.Ha, and J. Jhun, 2013: Seasonal prediction
and predictability of the Asian winter temperature variability.
Climate Dyn., 41, 573–587, doi:10.1007/s00382-012-1588-5.
Lee, S.-M., H.-R. Byun, and H. L. Tanaka, 2012: Spatiotemporal
characteristics of drought occurrences over Japan. J. Appl. Me-
teor. Climatol., 51, 1087–1098, doi:10.1175/JAMC-D-11-0157.1.
Li, B., and T. J. Zhou, 2011: El Niño–Southern Oscillation–related
principal interannual variability modes of early and late
summer rainfall over East Asia in sea surface temperature-
driven atmospheric general circulation model simulations.
J. Geophys. Res., 116, D14118, doi:10.1029/2011JD015691.
Li, H., A. Dai, T. Zhou, and J. Lu, 2010: Responses of East Asian
summer monsoon to historical SST and atmospheric forcing
during 1950–2000. Climate Dyn., 34, 501–514, doi:10.1007/
s00382-008-0482-7.
Li, S., R. Liu, L. Shi, and Z. Ma, 2009: Analysis on drought
characteristic of He’nan in recent 40 years based on meteo-
rological drought composite index. J. Arid Meteor., 27, 97–
102.
3396 JOURNAL OF CL IMATE VOLUME 28

Li, S. L., J. Lu, G. Huang, and K. M. Hu, 2008: Tropical Indian
Ocean basin warming and East Asian summer monsoon: A
multiple AGCM study. J. Climate, 21, 6080–6088, doi:10.1175/
2008JCLI2433.1.
Li, Y. H., and D. L. Li, 2004: Effects of ENSO cycle on the summer
climate anomaly over northwest China (in Chinese). Plateau
Meteor., 23, 930–935.
Lin, R., T. Zhou, and Y. Qian, 2014: Evaluation of global monsoon
precipitation changes based on five reanalysis datasets.
J. Climate, 27, 1271–1289, doi:10.1175/JCLI-D-13-00215.1.
Liu, H., T. Zhou, Y. Zhu, and Y. Lin, 2012: The strengthening East
Asia summer monsoon since the early 1990s. Chin. Sci. Bull.,
57, 1553–1558, doi:10.1007/s11434-012-4991-8.
Liu, W., S. An, G. Liu, and A. Guo, 2004: The further modification
of the Palmer Drought Severity Model (in Chinese). J. Appl.
Meteor. Sci., 15, 207–216.
Liu, X., S. Yang, Q. Li, A. Kumar, S. Weaver, and S. Liu, 2014:
Subseasonal forecast skills and biases of global summer
monsoons in the NCEP Climate Forecast System version 2.
Climate Dyn., 42, 1487–1508, doi:10.1007/s00382-013-1831-8.
Liu, X. M., J. Li, Z. H. Lu, M. Liu, and W. R. Xing, 2009: Dynamic
changes of composite drought index in Liaoning Province in
recent 50 years (in Chinese). Chin. J. Ecol., 28, 938–942.Liu, Y., and Y. Ding, 2008: Analysis and numerical simulations of the
teleconnection between Indian summer monsoon and pre-
cipitation in North China (in Chinese). Acta Meteor. Sin., 22,489–501.
Luo, L., and E. F. Wood, 2007: Monitoring and predicting the 2007
U.S. drought. Geophys. Res. Lett., 34, L22702, doi:10.1029/
2007GL031673.
——, W. Tang, Z. Lin, and E. Wood, 2013: Evaluation of summer
temperature and precipitation predictions from NCEP CFSv2
retrospective forecast over China. Climate Dyn., 41, 2213–
2230, doi:10.1007/s00382-013-1927-1.
Ma, Z., 2007: The interdecadal trend and shift of dry/wet over the
central part of North China and their relationship to the Pa-
cific Decadal Oscillation (PDO). Chin. Sci. Bull., 52, 2130–2139, doi:10.1007/s11434-007-0284-z.
——, andC. Fu, 2006: Some evidence of drying trend over northern
China from 1951 to 2004. Chin. Sci. Bull., 51, 2913–2925,
doi:10.1007/s11434-006-2159-0.
Man,W., T. Zhou, and J. H. Jungclaus, 2012: Simulation of the East
Asian summer monsoon during the last millennium with
the MPI Earth System Model. J. Climate, 25, 7852–7866,
doi:10.1175/JCLI-D-11-00462.1.
Mao, R., D. Gong, and Q. Fang, 2007: Influences of the East Asian
jet stream on winter climate in China (in Chinese). J. Appl.
Meteor. Sci., 18, 137–146.
Matsuno, T., 1966: Quasi-geostrophic motions in the equatorial
area. J. Meteor. Soc. Japan, 44, 25–43.
McKee, T. B., N. J. Doesken, and J. Kleist, 1993: The relationship
of drought frequency and duration to time scales. Proc. 8th
Conf. on Applied Climatology,Anaheim, CA, Amer. Meteor.
Soc., 179–184.
Menon, S., J. Hansen, L. Nazarenko, and Y. Luo, 2002: Climate
effects of black carbon aerosols in China and India. Science,
27, 2250–2253, doi:10.1126/science.1075159.
Mishra, A. K., and V. P. Singh, 2010: A review of drought concepts.
J. Hydrol., 391, 202–216, doi:10.1016/j.jhydrol.2010.07.012.
Mitchell, T. D., and P. D. Jones, 2005: An improved method of
constructing a database of monthly climate observations and
associated high resolution grids. Int. J. Climatol., 25, 693–712,
doi:10.1002/joc.1181.
Morid, S., V. Smakhtin, and M. Moghaddasi, 2006: Comparison of
seven meteorological indices for drought monitoring in Iran.
Int. J. Climatol., 26, 971–985, doi:10.1002/joc.1264.
Nitta, T., 1987: Convective activities in the tropical western Pacific
and their impact on the Northern Hemisphere summer cir-
culation. J. Meteor. Soc. Japan, 65, 373–390.
North, G., T. L. Bell, R. F. Cahalan, and F. J. Moeng, 1982: Sampling
errors in the estimation of empirical orthogonal functions.Mon.
Wea. Rev., 110, 699–706, doi:10.1175/1520-0493(1982)110,0699:
SEITEO.2.0.CO;2.
Oh, S.-B., H.-R. Byun, and D.-W. Kim, 2014: Spatiotemporal char-
acteristics of regional drought occurrence in East Asia. Theor.
Appl. Climatol., 117, 89–101, doi:10.1007/s00704-013-0980-3.
Palmer, W. C., 1965: Meteorologic drought. U.S. Department of
Commerce, Weather Bureau, Research Paper 45, 58 pp.
Pandey, R. P., B. B. Dash, S. K. Mishra, and R. Singh, 2007: Study of
indices for drought characterization in KBK districts in Orissa
(India). Hydrol. Processes, 22, 1895–1907, doi:10.1002/hyp.6774.
Qian, C., and T. Zhou, 2014: Multidecadal variability of North
China aridity and its relationship to PDO during 1900–2010.
J. Climate, 27, 1210–1222, doi:10.1175/JCLI-D-13-00235.1.
Qian, W., and Y. L. Zhu, 2001: Climate change in China from 1880
to 1998 and its impact on the environmental condition. Cli-
matic Change, 50, 419–444, doi:10.1023/A:1010673212131.
——, Q. Hu, Y. Zhu, and D.-K. Lee, 2003: Centennial-scale dry–
wet variations in East Asia. Climate Dyn., 21, 77–89,
doi:10.1007/s00382-003-0319-3.
Qiu, H. J., M. Cao, J. Hao, Y. Wang, and Y. Wang, 2013: Re-
lationship between frequency and magnitude of drought
damage in China in 1950–2010. Sci. Geogr. Sin., 33, 576–580.Qiu, J., 2010: China drought highlights future climate threats. Na-
ture, 465, 142–143, doi:10.1038/465142a.
Sato, N., and M. Takahashi, 2006: Dynamical processes related to
the appearance of quasi-stationary waves on the subtropical
jet in the midsummer Northern Hemisphere. J. Climate, 19,
1531–1544, doi:10.1175/JCLI3697.1.
Sheffield, J., and E. Wood, 2008: Projected changes in drought
occurrence under future global warming from multi-model,
multi-scenario, IPCC AR4 simulations. Climate Dyn., 31, 79–
105, doi:10.1007/s00382-007-0340-z.
Shen, C. M., W. C. Wang, Z. Hao, and W. Dong, 2007: Exceptional
drought events over eastern China during the last five centuries.
Climatic Change, 85, 453–471, doi:10.1007/s10584-007-9283-y.
Shi, Y., Y. Shen, E. Kang, D. Li, Y. Ding, G. Zhang, and R. Hu,
2007: Recent and future climate change in northwest China.
Climatic Change, 80, 379–393, doi:10.1007/s10584-006-9121-7.
Sillman, J., V. V. Kharin, F.W. Zwiers, X. Zhang, andD. Bronaugh,
2013: Climate extremes indices in the CMIP5 multimodel en-
semble: Part 2. Future climate projections. J. Geophys. Res.
Atmos., 118, 2473–2493, doi:10.1002/jgrd.50188.
Song, F., and T. Zhou, 2013: FGOALS-s2 simulation of upper-level jet
streams over East Asia: Mean state bias and synoptic-scale tran-
sient eddy activity. Adv. Atmos. Sci., 30, 739–753, doi:10.1007/
s00376-012-2212-7.
——, and ——, 2014: Interannual variability of East Asian sum-
mer monsoon simulated by CMIP3 and CMIP5 AGCMs:
Skill dependence on Indian Ocean–western Pacific anticy-
clone teleconnection. J. Climate, 27, 1679–1697, doi:10.1175/
JCLI-D-13-00248.1.
——, ——, and Y. Qian, 2014: Responses of East Asian summer
monsoon to natural and anthropogenic forcings in the 17 latest
CMIP5 models.Geophys. Res. Lett., 41, 596–603, doi:10.1002/
2013GL058705.
15 APRIL 2015 ZHANG AND ZHOU 3397
Sperber, K. R., H. Annamalai, I.-S. Kang, A. Kitoh, A. Moise,
A. Turner, B. Wang, and T. Zhou, 2013: The Asian summer
monsoon: An intercomparison of CMIP5 vs. CMIP3 simula-
tions of the late 20th century. Climate Dyn., 41, 2711–2744,doi:10.1007/s00382-012-1607-6.
Sun, C., and S. Yang, 2012: Persistent severe drought in southern
China during winter–spring 2011: Large-scale circulation
patterns and possible impacting factors. J. Geophys. Res., 117,D10112, doi:10.1029/2012JD017500.
Takaya, K., and H. Nakamura, 2001: A formulation of a phase-
independent wave-activity flux for stationary and migratory
quasigeostrophic eddies on a zonally varying basic flow. J. At-
mos. Sci., 58, 608–627, doi:10.1175/1520-0469(2001)058,0608:
AFOAPI.2.0.CO;2.
Vicente-Serrano, S. M., S. Beguería, and J. I. López-Moreno, 2010:A multiscalar drought index sensitive to global warming: The
standardized precipitation evapotranspiration index. J. Cli-
mate, 23, 1696–1718, doi:10.1175/2009JCLI2909.1.
Wang, A., D. P. Lettenmaier, and J. Sheffield, 2011: Soil moisture
drought in China, 1950–2006. J. Climate, 24, 3257–3271,
doi:10.1175/2011JCLI3733.1.
Wang, B., and Z. Fan, 1999: Choice of South Asian summer
monsoon indices. Bull. Amer. Meteor. Soc., 80, 629–638,
doi:10.1175/1520-0477(1999)080,0629:COSASM.2.0.CO;2.
——, and Q. Ding, 2006: Changes in global monsoon precipitation
over the past 56 years. Geophys. Res. Lett., 33, L06711,
doi:10.1029/2005GL025347.
——, R.Wu, and T. Li, 2003: Atmosphere–warm ocean interaction
and its impacts on Asian–Australian monsoon variation.
J. Climate, 16, 1195–1211, doi:10.1175/1520-0442(2003)16,1195:
AOIAII.2.0.CO;2.
——, Q. Ding, X. Fu, I.-S. Kang, K. Jin, J. Shukla, and F. Doblas-
Reyes, 2005: Fundamental challenge in simulation and pre-
diction of summer monsoon rainfall. Geophys. Res. Lett., 32,L15711, doi:10.1029/2005GL022734.
——, J. Yang, T. Zhou, andB.Wang, 2008: Interdecadal changes in
the major modes of Asian–Australian monsoon variability:
Strengthening relationship with ENSO since the late 1970s.
J. Climate, 21, 1771–1789, doi:10.1175/2007JCLI1981.1.
——, and Coauthors, 2009: Advance and prospectus of seasonal
prediction: Assessment of the APCC/CliPAS 14-model en-
semble retrospective seasonal prediction (1980–2004).Climate
Dyn., 33, 93–117, doi:10.1007/s00382-008-0460-0.
Wang, H., 2001: The weakening of Asianmonsoon circulation after
the end of 1970’s. Adv. Atmos. Sci., 18, 376–386, doi:10.1007/BF02919316.
Wang, J., J. Guo, Y. Zhou, and L. Yang, 2007: Progress and pros-
pect on drought indices research (in Chinese). Arid Land
Geogr., 30, 60–65.Wang, P. X., J. H. He, Y. F. Zheng, and Q. Zhang, 2007: Inter-
decadal relationship between summer Arctic Oscillation and
aridity–wettness feature in northwest China (in Chinese).
J. Desert Res., 27, 883–889.
Wang, S. W., D. Gong, J. Ye, and Z. Chen, 2000: Seasonal pre-
cipitation series over China since 1880 (in Chinese). Acta
Geogr. Sin., 55, 281–293.——, J. Cai, and J. Zhu, 2002: The interdecadal variations of annual
precipitation in China during 1880s–1990s (in Chinese). Acta
Meteor. Sin., 60, 637–639.
Wang, T.,H.Wang,O.Ottera,Y.Gao,L. Suo, T. Furevik, andL.Yu,
2013: Anthropogenic agent implicated as a prime driver of shift
in precipitation in eastern China in the late 1970s.Atmos. Chem.
Phys., 13, 12 433–12 450, doi:10.5194/acp-13-12433-2013.
Wang, W., H. Xu, 2012: The modification of Palmer drought severity
index in the research of drought in the Huaihe area. Adv. Earth
Sci., 27, 60–67, doi:10.11867/j.issn.1001-8166.2012.01.0060.
Wang, Z., and Y. Ding, 2006: Climate change of the cold wave
frequency of China in the last 53 years and the possible reasons
(in Chinese). Chin. J. Atmos. Sci., 30, 1068–1076.
Wei, K., and L. Wang, 2013: Reexamination of the aridity condi-
tions in arid northwesternChina for the last decade. J. Climate,
26, 9594–9602, doi:10.1175/JCLI-D-12-00605.1.
Wu, B., T. Zhou, and T. Li, 2009: Seasonally evolving dominant
interannual variability modes of East Asian climate. J. Cli-
mate, 22, 2992–3005, doi:10.1175/2008JCLI2710.1.——, T. Li, and T. Zhou, 2010: Relative contributions of the Indian
Ocean and local SST anomalies to the maintenance of the
western North Pacific anomalous anticyclone during the El
Niño decaying summer. J. Climate, 23, 2974–2986, doi:10.1175/
2010JCLI3300.1.
Wu, R., and B. P. Kirtman, 2005: Roles of Indian and PacificOcean
air–sea coupling in tropical atmospheric variability. Climate
Dyn., 25, 155–170, doi:10.1007/s00382-005-0003-x.
——, and ——, 2007: Regimes of seasonal air–sea interaction and
implications for performance of forced simulations. Climate
Dyn., 29, 393–410, doi:10.1007/s00382-007-0246-9.——, Z. Hu, and B. Kirtman, 2003: Evolution of ENSO-related
rainfall anomalies in East Asia. J. Climate, 16, 3742–3758,
doi:10.1175/1520-0442(2003)016,3742:EOERAI.2.0.CO;2.
Wu, T., and Z. Qian, 1996: Comparative analyses of differences
between circulation and dynamical effect of Qinghai–Xizang
Plateau over NWChina drought area in dry- and wet-summer.
Plateau Meteor., 15, 387–396.——, ——, P. Li, M. Song, and X. Ma, 1998: Some comparative
analyses of subsequent precipitation over northwest China
drought area in winter heavy- and light-snow years over
Qinghai–Xizang Plateau (in Chinese). Plateau Meteor., 17,364–372.
Xiao, J., Q. Zhuang, E. Liang, X. Shao, A. D. McGuire, A. Moody,
D. W. Kicklighter, and J. M. Melillo, 2009: Twentieth-century
drought and their impacts on terrestrial carbon cycling in
China. Earth Interact., 13, doi:10.1175/2009EI275.1.
Xie, S.-P., K. Hu, J. Hafner, H. Tokinaga, Y. Du, G. Huang, and
T. Sampe, 2009: Indian Ocean capacitor effect on Indo–
western Pacific climate during the summer following El Niño.J. Climate, 22, 730–747, doi:10.1175/2008JCLI2544.1.
Xin, X. G., R. Yu, T. Zhou, and B. Wang, 2006: Drought in late
spring of South China in recent decades. J. Climate, 19, 3197–3206, doi:10.1175/JCLI3794.1.
——, T. Zhou, and R. Yu, 2010: Increased Tibetan Plateau snow
depth:An indicator of the connection between enhancedwinter
NAOand late-spring tropospheric cooling over East Asia.Adv.
Atmos. Sci., 27, 788–794, doi:10.1007/s00376-009-9071-x.
Xu, G. C., and Z. Y. Zhang, 1983: The effect of Qinghai–Xizang
Plateau on the formation of dry climate over the northwest
China (in Chinese). Plateau Meteor., 2, 9–16.
Xu, K., D. Young, H. Yang, Z. Li, Y. Qin, and Y. Shen, 2014:
Spatio-temporal variation of drought in China during 1961–
2012: A climatic perspective. J. Hydrol., doi:10.1016/
j.jhydrol.2014.09.047, in press.
Xu, Q., 2001: Abrupt change of the mid-summer climate in central
east China by the influence of atmospheric pollution. Atmos.
Environ., 35, 5029–5040, doi:10.1016/S1352-2310(01)00315-6.Yang, J., D. Gong, W. Wang, M. Hu, and R. Mao, 2012: Extreme
drought event of 2009/2010 over southwestern China.Meteor.
Atmos. Phys., 115, 173–184, doi:10.1007/s00703-011-0172-6.
3398 JOURNAL OF CL IMATE VOLUME 28
Yang, L. F., and W. S. Xie, 2009: Drought-flood monitoring and
index test in Anhui Province (in Chinese). J. Anhui Agric. Sci.,
37, 3848–3850.
Yang, S., Z. Zhang, V. Kousky, R. Higgins, S. Yoo, J. Liang, and
Y. Fan, 2008: Simulations and seasonal prediction of theAsian
summer monsoon in the NCEP Climate Forecast System.
J. Climate, 21, 3755–3775, doi:10.1175/2008JCLI1961.1.
Yang, X., G. Liu, X. Yang, and R. Wang, 2005a: The modification
of Palmer Drought Severity Model for Gansu Loess Plateau
(in Chinese). Arid Meteor., 23, 8–12.
——, X. Yang, P. Ma, R. Wang, and Y. Dong, 2005b: Modification
and applications of PDSI for mid and eastern Gansu Province
(in Chinese). Adv. Earth Sci., 20, 1022–1028.
Yao, Y., C. Zhang, Z. Deng, A. Dong, X. Zhang, F.Wei, and J. Yang,
2007: Overview of meteorological and agricultural drought in-
dices (in Chinese). Agric. Res. Arid Areas, 25, 185–189.
Ye, D. Z., and Y. X. Gao, 1979: Tibetan Plateau Meteorology (in
Chinese). Science Press, 278 pp.
Yu, R. C., and T. J. Zhou, 2007: Seasonality and three-dimensional
structure of the interdecadal change in East Asian monsoon.
J. Climate, 20, 5344–5355, doi:10.1175/2007JCLI1559.1.
——, B. Wang, and T. Zhou, 2004: Tropospheric cooling and
summer monsoon weakening trend over East Asia. Geophys.
Res. Lett., 31, L22212, doi:10.1029/2004GL021270.
Yuan, W. P., and G. S. Zhou, 2004: Theoretical study and research
prospect on drought indices (in Chinese). Adv. Earth Sci., 19,982–991.
Yuan, X., and E. F. Wood, 2013: Multimodel seasonal forecasting
of global drought onset. Geophys. Res. Lett., 40, 4900–4905,
doi:10.1002/grl.50949.
Zhai, J., B. Su, V. Krysanova, T. Vetter, C. Gao, and T. Jiang, 2010:
Spatial variation and trends in PDSI and SPI indices and their
relation to streamflow in 10 large regions of China. J. Climate,
23, 649–663, doi:10.1175/2009JCLI2968.1.Zhang, C., B.Wang, D. Liu, and Z. Cai, 1998: Research on drought
and flood indices in the northwest China (in Chinese). Plateau
Meteor., 17, 381–389.Zhang, L. X., and T. Zhou, 2011: An assessment of monsoon pre-
cipitation changes during 1901–2001. Climate Dyn., 37, 279–
296, doi:10.1007/s00382-011-0993-5.
Zhang, Q., J. Wei, and S. Tao, 2003: The decadal and interannual
variations of drought in the northernChina and associationwith
the circulations (in Chinese).Climate Environ. Res., 8, 318–328.
——, X. Zou, and F. Xiao, 2006: Classification of meteorological
droughts. Standards Press of China Tech. Rep. GB/T20481-
2006, 17 pp.
——, and Coauthors, 2009: Drought (in Chinese). China Meteo-
rological Press, 199 pp.
Zhang Q., J. F. Li, V. P. Singh, and Y. G. Bai, 2012: SPI-based
evaluation of drought events in Xinjiang, China.Nat. Hazards,
64, 481–492, doi:10.1007/s11069-012-0251-0.
Zhang, S. Y., and Coauthors, 2008:Arid Meteorology (in Chinese).
China Meteorological Press, 292 pp.
Zhou, T. J., and R. C. Yu, 2005: Atmospheric water vapor transport
associated with typical anomalous summer rainfall patterns in
China. J. Geophys. Res., 110,D08104, doi:10.1029/2004JD005413.
——, and L. Zou, 2010: Understanding the predictability of East
Asian summer monsoon from the reproduction of land–sea
thermal contrast change in AMIP-type simulation. J. Climate,
23, 6009–6026, doi:10.1175/2010JCLI3546.1.
——, and T. Hong, 2013: Projected changes of Palmer drought
severity index under an RCP8.5 scenario. Atmos. Oceanic Sci.
Lett., 6, 273–278, doi:10.3878/j.issn.1674-2834.13.0032.
——, R. Yu, H. Li, and B. Wang, 2008a: Ocean forcing to changes
in global monsoon precipitation over the recent half-century.
J. Climate, 21, 3833–3852, doi:10.1175/2008JCLI2067.1.
——, L. Zhang, and H. Li, 2008b: Changes in global land monsoon
area and total rainfall accumulation over the last half century.
Geophys. Res. Lett., 35, L16707, doi:10.1029/2008GL034881.
——,D.Gong, J. Li, and B. Li, 2009a:Detecting and understanding
the multi-decadal variability of the East Asian summer mon-
soon—Recent progress and state of affairs. Meteor. Z., 18,455–467, doi:10.1127/0941-2948/2009/0396.
——, B. Wu, and B. Wang, 2009b: How well do atmospheric gen-
eral circulation models capture the leading modes of the in-
terannual variability of the Asian–Australian monsoon?
J. Climate, 22, 1159–1173, doi:10.1175/2008JCLI2245.1.
——, F. Song, R. Lin, X. Chen, and X. Chen, 2013: The 2012 North
China floods: Explaining an extreme rainfall event in the
context of a long-term drying tendency [in ‘‘Explaining Ex-
treme Events of 2012 from a Climate Perspective’’]. Bull.
Amer. Meteor. Soc., 94 (9), S49–S51.
Zhu, Y. L., H. J. Wang, W. Zhou, and J. Ma, 2011: Recent changes
in the summer precipitation pattern in East China and
the background circulation. Climate Dyn., 36, 1463–1473,
doi:10.1007/s00382-010-0852-9.
Zou, X., and Q. Zhang, 2008: Preliminary studies on variations in
droughts over China during past 50 years (in Chinese). J. Appl.
Meteor. Sci., 19, 679–687.
——, P. Zhai, and Q. Zhang, 2005: Variations in droughts over
China: 1951–2003.Geophys. Res. Lett., 32, L04707, doi:10.1029/2004GL021853.
15 APRIL 2015 ZHANG AND ZHOU 3399