Embed Size (px)
Citation preview

Monitor-Alert-Manage at Scale withActiveIQ Unified Manager
August 2019 | SL10557 Version 4.0.0

Monitor-Alert-Manage at Scale with ActiveIQ Unified Manager2 © 2019 NetApp, Inc. All rights reserved. NetApp Proprietary
TABLE OF CONTENTS
1 Introduction...................................................................................................................................... 3
2 Lab Environment............................................................................................................................. 4
3 Lab Limitations................................................................................................................................ 7
4 Lab Activities................................................................................................................................... 8
4.1 Interface Overview.....................................................................................................................8
4.2 Data Protection Relationships............................................................................................... 14
4.3 Annotations and Groups........................................................................................................ 19
4.4 Favorites Page......................................................................................................................... 32
4.5 Capacity and Utilization..........................................................................................................37
4.6 Alerts.........................................................................................................................................42
5 References......................................................................................................................................50
6 Version History.............................................................................................................................. 51
Monitor-Alert-Manage at Scale with ActiveIQ Unified Manager3 © 2019 NetApp, Inc. All rights reserved. NetApp Proprietary
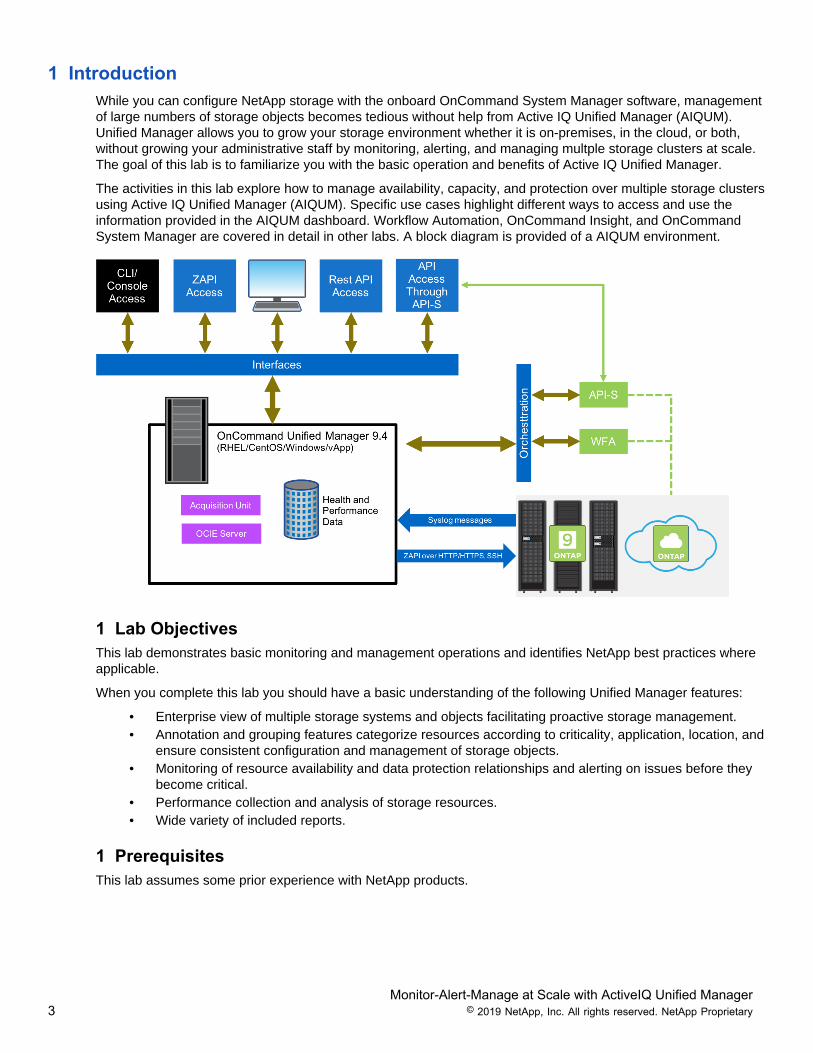
1 IntroductionWhile you can configure NetApp storage with the onboard OnCommand System Manager software, managementof large numbers of storage objects becomes tedious without help from Active IQ Unified Manager (AIQUM).Unified Manager allows you to grow your storage environment whether it is on-premises, in the cloud, or both,without growing your administrative staff by monitoring, alerting, and managing multple storage clusters at scale.The goal of this lab is to familiarize you with the basic operation and benefits of Active IQ Unified Manager.
The activities in this lab explore how to manage availability, capacity, and protection over multiple storage clustersusing Active IQ Unified Manager (AIQUM). Specific use cases highlight different ways to access and use theinformation provided in the AIQUM dashboard. Workflow Automation, OnCommand Insight, and OnCommandSystem Manager are covered in detail in other labs. A block diagram is provided of a AIQUM environment.
1 Lab ObjectivesThis lab demonstrates basic monitoring and management operations and identifies NetApp best practices whereapplicable.
When you complete this lab you should have a basic understanding of the following Unified Manager features:
• Enterprise view of multiple storage systems and objects facilitating proactive storage management.• Annotation and grouping features categorize resources according to criticality, application, location, and
ensure consistent configuration and management of storage objects.• Monitoring of resource availability and data protection relationships and alerting on issues before they
become critical.• Performance collection and analysis of storage resources.• Wide variety of included reports.
1 PrerequisitesThis lab assumes some prior experience with NetApp products.
Monitor-Alert-Manage at Scale with ActiveIQ Unified Manager4 © 2019 NetApp, Inc. All rights reserved. NetApp Proprietary
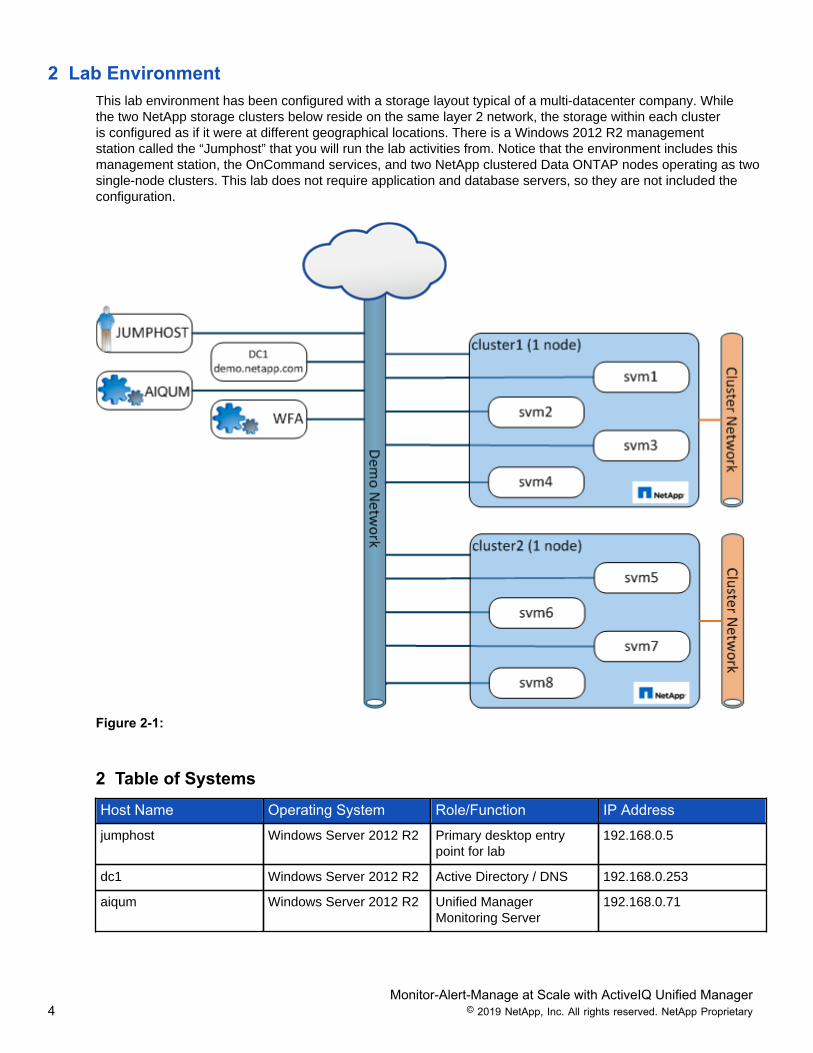
2 Lab EnvironmentThis lab environment has been configured with a storage layout typical of a multi-datacenter company. Whilethe two NetApp storage clusters below reside on the same layer 2 network, the storage within each clusteris configured as if it were at different geographical locations. There is a Windows 2012 R2 managementstation called the “Jumphost” that you will run the lab activities from. Notice that the environment includes thismanagement station, the OnCommand services, and two NetApp clustered Data ONTAP nodes operating as twosingle-node clusters. This lab does not require application and database servers, so they are not included theconfiguration.
Figure 2-1:
2 Table of Systems
Host Name Operating System Role/Function IP Address
jumphost Windows Server 2012 R2 Primary desktop entrypoint for lab
192.168.0.5
dc1 Windows Server 2012 R2 Active Directory / DNS 192.168.0.253
aiqum Windows Server 2012 R2 Unified ManagerMonitoring Server
192.168.0.71
Monitor-Alert-Manage at Scale with ActiveIQ Unified Manager5 © 2019 NetApp, Inc. All rights reserved. NetApp Proprietary
Host Name Operating System Role/Function IP Address
wfa Windows Server 2012 R2 OnCommand WorkflowAutomation
192.168.0.73
cluster1 clustered Data ONTAP 9.4 cluster for LA datacenterstorage
192.168.0.101
cluster2 clustered Data ONTAP 9.4 cluster for NYC datacenterstorage
192.168.0.102
2 User IDs and Passwords
Host Name User ID Password Comments
jumphost DEMO\Administrator Netapp1! Domain Administrator
cluster1 admin Netapp1! Same for individual clusternodes
cluster2 admin Netapp1! Same for individual clusternodes
svm[x] vsadmin Netapp1! SVM administrator
aiqum admin Netapp1! AIQUM administrator
2 Storage Volume and LUN Layout ReviewAttention: Please take your time to orient yourself with the current lab configuration.
In order to demonstrate the capabilities of AIQUM, you need many objects to monitor and manage. Havingan understanding of the geographical location, business units, and applications for this hypothetical companyenvironment is crucial to understanding why the Annotations and Groups features of the product are used in theexamples that follow.
The Finance and Sales business units operate out of Los Angeles, CA, while the Support, Engineering, and asecond sales office operate out of New York, NY. The main applications for the company are Oracle, Exchange,vSphere virtualization, and basic file shares.
Note: This lab environment does not include the application servers. Instead, it focuses on the data layoutfor a company that needs to support those applications.

Monitor-Alert-Manage at Scale with ActiveIQ Unified Manager6 © 2019 NetApp, Inc. All rights reserved. NetApp Proprietary
Figure 2-2:
Monitor-Alert-Manage at Scale with ActiveIQ Unified Manager7 © 2019 NetApp, Inc. All rights reserved. NetApp Proprietary
3 Lab LimitationsThis lab has the following limitations:
• All of the servers and storage controllers presented in this lab are virtual devices. Consequently, anyoperations involving movement of large quantities of data will not exhibit performance representative ofreal systems.
• Due to the inability to provide active load or historical performance data, the performance monitoringand analysis capability will not be covered in this lab.

Monitor-Alert-Manage at Scale with ActiveIQ Unified Manager8 © 2019 NetApp, Inc. All rights reserved. NetApp Proprietary
4 Lab ActivitiesThis lab has the following activities for you to perform:
• Interface Overview on page 8• Data Protection Relationships• Annotations and Groups• Favorites Page on page 32• Capacity and Utilization• Alerts
4.1 Interface Overview
Active IQ Unified Manager (AIQUM) provides a consolidated view of your storage resources over a numberof different storage clusters and sites. AIQUM not only collects availability statistics, but it also collects andanalyzes capacity statistics that alert you on capacity trends that need attention. Data protection relationshipsare monitored for compliance with replication lag time thresholds. Through the integration with OnCommandWorkflow Automation, protection relationships can be created and repaired independantly of OnCommandSystem Manager.
For performance alerts and trending, OnCommand Performance Manager capabilities are now integrated intothe AIQUM dashboard. This allows performance events to be consolidated into AIQUM, and allows the storageadministrator to observe more details of a performance event through the central AIQUM interface.
This activity familiarizes you with the overall interface of Active IQ Unified Manager. The tasks you will perform inthis activity are listed below:
Tasks
Log into Active IQ Unified Manager.
Review the Dashboard.
View Information Across multiple storage clusters.
View information at an individual cluster level.
View information down at a volume level.
These steps help provide a view into the details available on the AIQUM Dashboard.
1. Open Chrome. The default home page is set to http://aiqum.demo.netapp.com.2. Click Advanced.

Monitor-Alert-Manage at Scale with ActiveIQ Unified Manager9 © 2019 NetApp, Inc. All rights reserved. NetApp Proprietary
2
Figure 4-1:
3. Click Proceed to aiqum.demo.netapp.com.

Monitor-Alert-Manage at Scale with ActiveIQ Unified Manager10 © 2019 NetApp, Inc. All rights reserved. NetApp Proprietary
3Figure 4-2:
4. Login to AIQUM as admin.5. Enter Netapp1! for the password.6. Click Sign In.

Monitor-Alert-Manage at Scale with ActiveIQ Unified Manager11 © 2019 NetApp, Inc. All rights reserved. NetApp Proprietary
45
6
Figure 4-3:
7. The Unified Manager dashboard is displayed. The dashboard provides an overall look at the health ofthe storage environment managed by AIQUM.
8. The Unified Manager dashboard overview includes four major sections:
• Availability—Any events related to storage availability will show up in this section. Eventsincluded here are down network interfaces, down cluster interconnects, or missing lun paths. Acluster node that no longer has spare disks available would also be reported here.
• Capacity—Aggregate, volume, and LUN capacity issues are reported in this section. Alsoincluded are capacity trending events that alert you if a particular storage object is anticipatedto fill up in the near future (The “time until full” thresholds are configurable).
• Performance—While AIQUM collects data at 15 minute intervals, performance events arecollected at 5 minute intervals. Baseline performance data is collected on storage objects, andpredictive analysis is performend when the access patterns vary from the norm. This lab doesnot go into the details of performance capabilities.
• Protection—Data protection mirror or vault relationships are monitored to insure compliancewith the desired update frequencies for each relationship. If the data in the mirror or vaultis delayed by more than the allowed “lag time”, AIQUM will show an event in this section.The Workflow Automator services are integrated with AIQUM to enable you to correct dataprotection events without having to leave the AIQUM interface.
9. Take a look at the cluster level. Click on the 2 under the “Clusters” graph in the “Availability” tile of thedashboard.

Monitor-Alert-Manage at Scale with ActiveIQ Unified Manager12 © 2019 NetApp, Inc. All rights reserved. NetApp Proprietary
9
Figure 4-4:
10. Click on the name cluster1.
10
Figure 4-5:
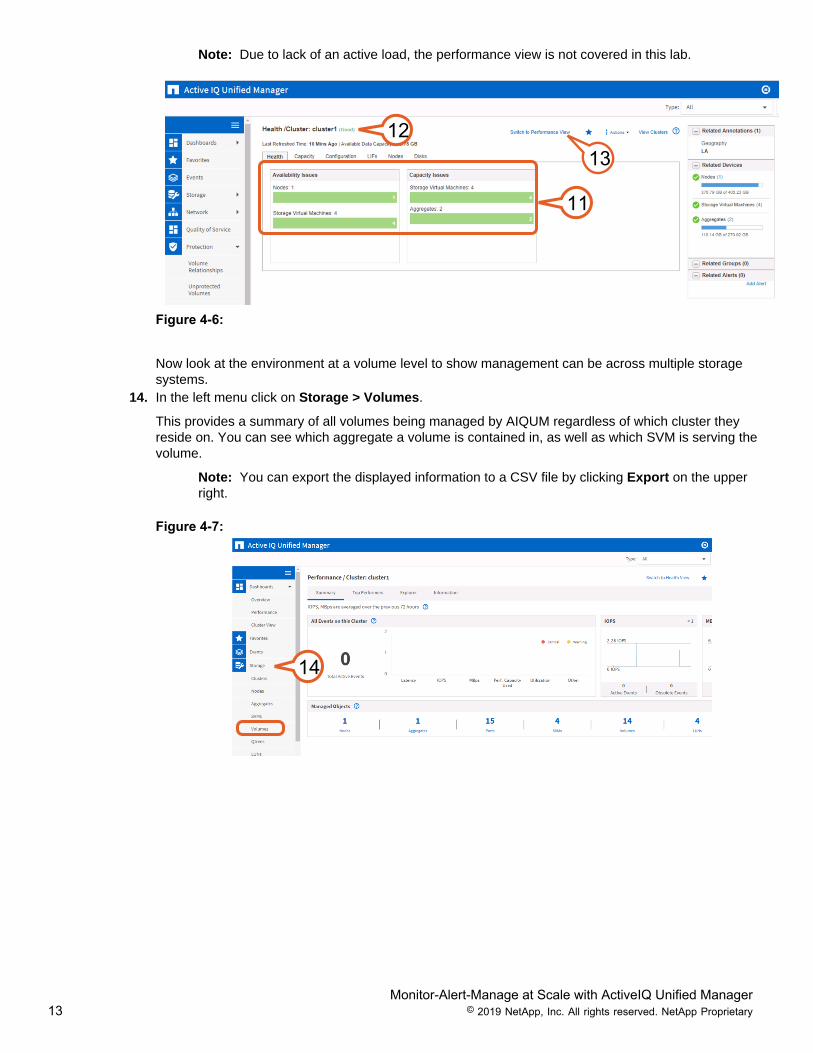
11. The default view of the cluster is from an overall health perspective. Notice the overall health is green.12. Take time to click on each of the tabs to view the information provided for the selected cluster.13. You can also view the cluster from a performance perspective. Click the Switch to performance view
check box to select that view.
Monitor-Alert-Manage at Scale with ActiveIQ Unified Manager13 © 2019 NetApp, Inc. All rights reserved. NetApp Proprietary
Note: Due to lack of an active load, the performance view is not covered in this lab.
12
11
13
Figure 4-6:
Now look at the environment at a volume level to show management can be across multiple storagesystems.
14. In the left menu click on Storage > Volumes.
This provides a summary of all volumes being managed by AIQUM regardless of which cluster theyreside on. You can see which aggregate a volume is contained in, as well as which SVM is serving thevolume.
Note: You can export the displayed information to a CSV file by clicking Export on the upperright.
Figure 4-7:
14

Monitor-Alert-Manage at Scale with ActiveIQ Unified Manager14 © 2019 NetApp, Inc. All rights reserved. NetApp Proprietary
15. You can filter this view by selecting the filter criteria. For example, you can sort “Protection Role” to seeall of the volumes that are not currently protected, in order to set up protection relationships for them.
Figure 4-8:
15
16. You may want to take a moment to return to the Dashboard and explore information at the cluster,SVM, or aggregate level as well.
This activity illustrates how the Active IQ Unified Manager interface can provide summary and detailedlevel health and performance information across multiple clusters, and enable effective management ofstorage resources at any level.
4.2 Data Protection Relationships
Active IQ Unified Manager provides the ability to monitor and manage existing data protection relationshipsacross multiple storage clusters. This is important to make sure the relationship updates successfully occur atthe necessary frequency for the desired level of protection. AIQUM can also be integrated with OnCommandWorkflow Automation to create data protection relationships.
This activity familiarizes you with Active IQ Unified Manager ability to monitor and manage data protectionrelationships, and respond to issues that may affect data protection. The tasks you will perform in this activity arelisted below:
Tasks
Log into AIQUM and view the overall protection health for the storage managed by Unified manager.
View the existing protection relationships across all storage clusters.
Investigate a problem with a data protection relationship.
Take corrective action to resolve the problem.
As you click down into an event to get more details, note the other information present in AIQUM. Each object-specific page in AIQUM contains a wealth of collateral information related to that object, including links to thoserelated objects.
1. If you have not already logged into AIQUM, log in and view the dashboard.2. Note that in the “Protection” tile of the dashboard, there is an event on the lag status graph. This is a
data protection lag event on one of nine data protection relationships.3. To get a closer look at this issue, click on the 9 just below the red bar graph display where it shows “9
total” Protection Lag Status indicators.

Monitor-Alert-Manage at Scale with ActiveIQ Unified Manager15 © 2019 NetApp, Inc. All rights reserved. NetApp Proprietary
This will bring us to the listing of all data protection relationships currently being managed by UnifiedManager. Take a moment to note the information available for each relationship.
Figure 4-9:
2
3
4. Find the entry with the error indicator in the “Lag Status” column.5. The volume effected by this error is “finance”.
Figure 4-10:
4 5
6. Scroll to the right and find the “Schedule” column.
Notice there is a broken update schedule associated with the “finance” volume. This is the reason for the“Lag Status” error. The volume was created and a SnapMirror data protection relationship was initialized;however, the mirror is now lagging behind the source volume due to the broken update schedule.
To correct the error, a schedule has to be applied to the volume, and an on-demand update of the mirrorrelationship must be performed.
7. Click the svm4_finance_mirror “Destination Volume” name.

Monitor-Alert-Manage at Scale with ActiveIQ Unified Manager16 © 2019 NetApp, Inc. All rights reserved. NetApp Proprietary
6
7
Figure 4-11:
8. Click Actions > Relationship > Edit.
8
Figure 4-12:
9. Click the SnapMirror Schedule drop down menu, and select daily.10. Click Submit.
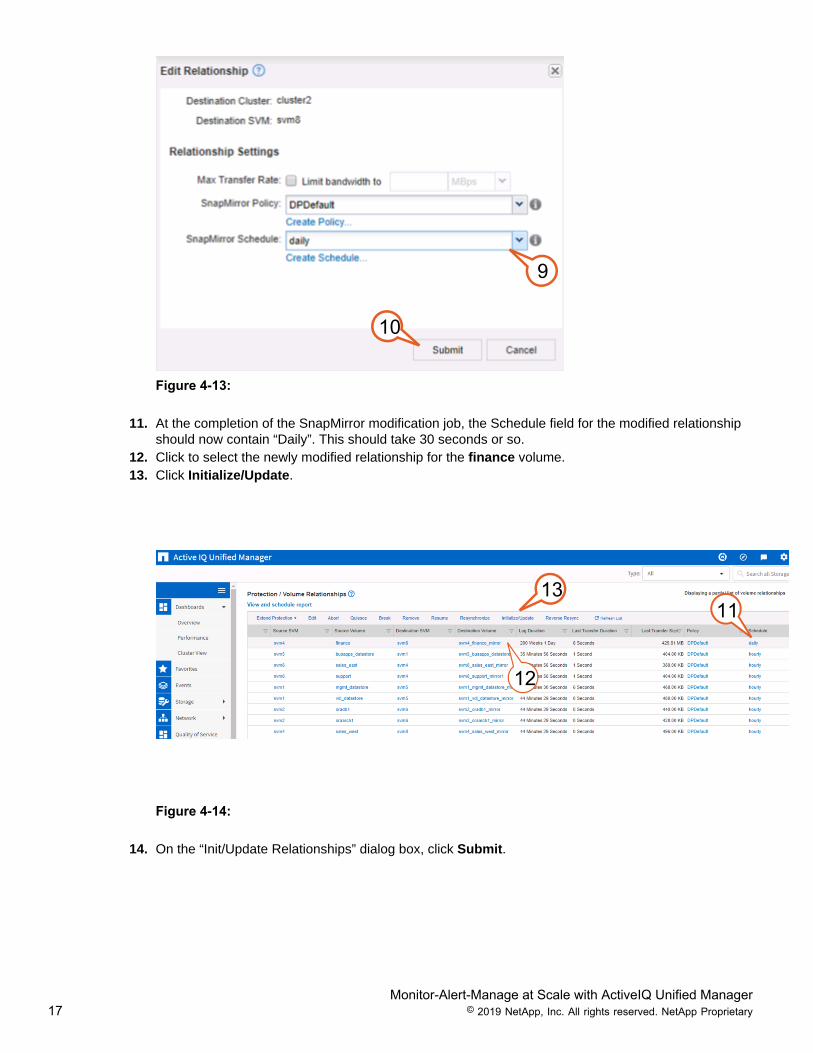
Monitor-Alert-Manage at Scale with ActiveIQ Unified Manager17 © 2019 NetApp, Inc. All rights reserved. NetApp Proprietary
9
10
Figure 4-13:
11. At the completion of the SnapMirror modification job, the Schedule field for the modified relationshipshould now contain “Daily”. This should take 30 seconds or so.
12. Click to select the newly modified relationship for the finance volume.13. Click Initialize/Update.
11
12
13
Figure 4-14:
14. On the “Init/Update Relationships” dialog box, click Submit.

Monitor-Alert-Manage at Scale with ActiveIQ Unified Manager18 © 2019 NetApp, Inc. All rights reserved. NetApp Proprietary
14
Figure 4-15:
15. A prompt is displayed to view job status details. Click View Details
15Figure 4-16:
16. The Job status is displayed. Click Refresh to update the status and wait for Complete.
16
Figure 4-17:
17. Select Dashboard > Overviewfrom the menu on the left.

Monitor-Alert-Manage at Scale with ActiveIQ Unified Manager19 © 2019 NetApp, Inc. All rights reserved. NetApp Proprietary
17
18
Figure 4-18:
18. Notice the “Protection” status section of the “Dashboard” now shows all green indicators.
In this activity you viewed the health of data protection across all storage systems managed by AIQUM,responded to a problem, and took the necessary corrective action all from a single console.
4.3 Annotations and Groups
Even in small IT environments, managing storage objects in a meaningful way is a challenge. Scaling the numberand size of these objects out over many nodes, clusters, and geographically separate datacenters only addscomplexity to storage management.
ActiveIQ Unified Manager’s Annotations and Groups allow a storage architect to better organize these storageobjects. When set up properly, Annotations allow you to instantly understand the business impacts of an event, oralert in AIQUM. Administrators can associate any storage object to an annotation without the need to apply rule-based annotation. Groups allow an action to be applied to all storage objects that are a member of that group,thus eliminating repetitive tasks on similar objects and improving consistency of management. These featuresalso allow for quick tailoring of reports generated from AIQUM.
4.3 AnnotationsIn this lab environment, Annotations are used to specify where a storage object resides, which application thestorage object is supporting, and which business units rely on the storage object for daily activities. Annotationscan be manually applied to a storage object; however, there are often some simple rules you can use toautomatically annotate an object depending on its name, which Storage Virtual Machine is managing it, or whichcluster it is in. The following lab activity explores the defined annotations as well as the rules that are in place toassociate the annotations with the related storage objects.
Tasks
Open AIQUM and Administrative Menu and locate access to annotations and groups

Monitor-Alert-Manage at Scale with ActiveIQ Unified Manager20 © 2019 NetApp, Inc. All rights reserved. NetApp Proprietary
Tasks
Review default annotations and annotation rules and how they can be used to organize storage objects andautomatically assign annotations to new objects as they are created
Select a volume storage object and manually assign an annotation.
View the default groups how rules determine membership of a group and actions determine what operations canbe performed across all group members.
1. If you have not already logged into AIQUM, log in and view the dashboard.2. Click on the gear icon at the upper right to go to the “Administrative options” menu.
Figure 4-19:
2
3. There are four default annotations in AIQUM, each with one or more rules. Additional annotations can becreated. If not already selected, click on theApplication annotation.
Under “Values” you see that this environment has been configured with four possible values for anapplication. These values are configured by the AIQUM administrator, and can be anything that makessense for organizing storage objects. As you can see there are already Application annotations, orvalues for Exchange, Oracle, File Shares, etc.

Monitor-Alert-Manage at Scale with ActiveIQ Unified Manager21 © 2019 NetApp, Inc. All rights reserved. NetApp Proprietary
4. Click Manage Rules. .
Figure 4-20:
3
4
This is a list of annotation rules that define which objects will have the “Application” annotation values.5. Select the Exchange annotation rule for volume objects.
Note: There is also an Exchange rule that applies to SVM objects.6. Click Edit.
5
6
Figure 4-21:
While annotations can be manually applied to any object, this rule shows how annotations can bedynamically applied to all current and future storage objects that match the rule. In this example, “SVM3”and “SVM7” are Storage Virtual Machines that are dedicated to serving Exchange data. As a result,all volume objects owned by either SVM3 or SVM7 will automatically have the “Application” annotationapplied with a value of “Exchange”. This eases the management burden of making sure new objects areproperly categorized.
7. Click Cancel.

Monitor-Alert-Manage at Scale with ActiveIQ Unified Manager22 © 2019 NetApp, Inc. All rights reserved. NetApp Proprietary
7
Figure 4-22:
8. Take time to edit the other annotation rules to see how their conditions differ. The “Exchange” and“File_Share” values are applied to objects owned by certain SVMs, while the “Oracle” and “vSphere”values are applied by matching a part of the object name.
Note: As was the case with annotations, new annotation rules can be created to meetorganizational needs.
Figure 4-23:
Monitor-Alert-Manage at Scale with ActiveIQ Unified Manager23 © 2019 NetApp, Inc. All rights reserved. NetApp Proprietary
8
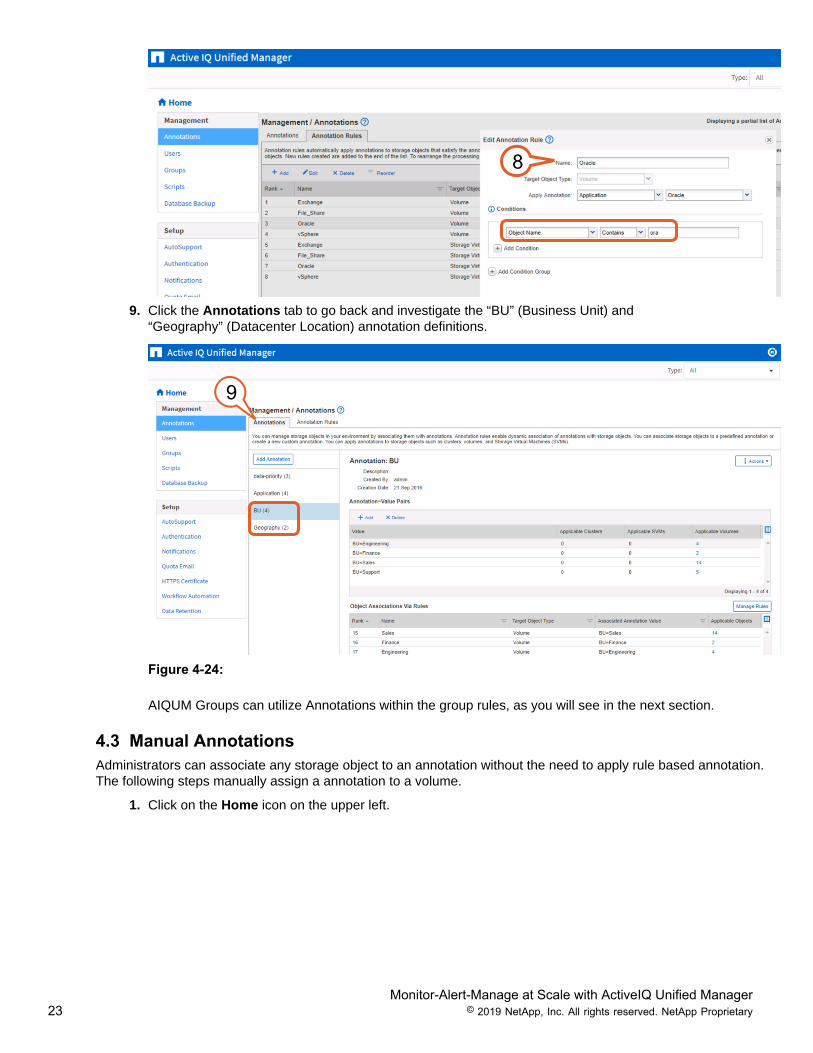
9. Click the Annotations tab to go back and investigate the “BU” (Business Unit) and“Geography” (Datacenter Location) annotation definitions.
9
Figure 4-24:
AIQUM Groups can utilize Annotations within the group rules, as you will see in the next section.
4.3 Manual AnnotationsAdministrators can associate any storage object to an annotation without the need to apply rule based annotation.The following steps manually assign a annotation to a volume.
1. Click on the Home icon on the upper left.

Monitor-Alert-Manage at Scale with ActiveIQ Unified Manager24 © 2019 NetApp, Inc. All rights reserved. NetApp Proprietary
1
Figure 4-25:
2. Navigate to Storage > Volumes.3. Click on the mgmt_datastore volume.
23
Figure 4-26:

Monitor-Alert-Manage at Scale with ActiveIQ Unified Manager25 © 2019 NetApp, Inc. All rights reserved. NetApp Proprietary
4. On the menu bar, select Actions > Annotate
Note: You can only assign a storage object to an available annotation. You cannot create a newannotation with this process. To create a new annotation, navigate to Settings (gear icon) > Annotations, click the Add Annotation button, and complete the form.
4
Figure 4-27:
5. On the “Annotate Volumes” window, select the data-priority > high annotation and value.
This annotation is applied to storage objects that contain high-priority data. For example, objects that arehosting business applications can be considered high priority.
6. Click on Apply.

Monitor-Alert-Manage at Scale with ActiveIQ Unified Manager26 © 2019 NetApp, Inc. All rights reserved. NetApp Proprietary
5
6
Figure 4-28:
7. Hit the refresh button on your browser. Notice this new annotation is now associated with the volume.You can also see that there are two other annotations that have been automatically applied to thisvolume. vSphere is associated with this volume because its name contains the string “datastore”, and LAis associated with this volume because the volume is owned by “cluster1”.
Note: If these automatic associations are not clear, review the annotation rules using the steps inthe previous section .

Monitor-Alert-Manage at Scale with ActiveIQ Unified Manager27 © 2019 NetApp, Inc. All rights reserved. NetApp Proprietary
7
Figure 4-29:
Now that you have reviewed Annotations and their purpose, along with how they can be automatically applied tonew storage objects, take a look at how groups can simplify storage management.
4.3 GroupsThe goal behind groups is to define a collection of objects that a single action can be applied to. Because theaction is applied across all objects in a group, the members of that group should have very similar characteristics.They could be all file share volumes, all volumes containing LUNs, all vSphere datastore volumes, all SVM rootvolumes, etc.
In this lab environment, objects have been defined in the following groups:
• Database_LUNs• Database_NFS• SVM_root_vols• Unstructured_data• VM_storage
This activity focuses on applying a new volume threshold to all members of the “SVM_root_vols” object group.
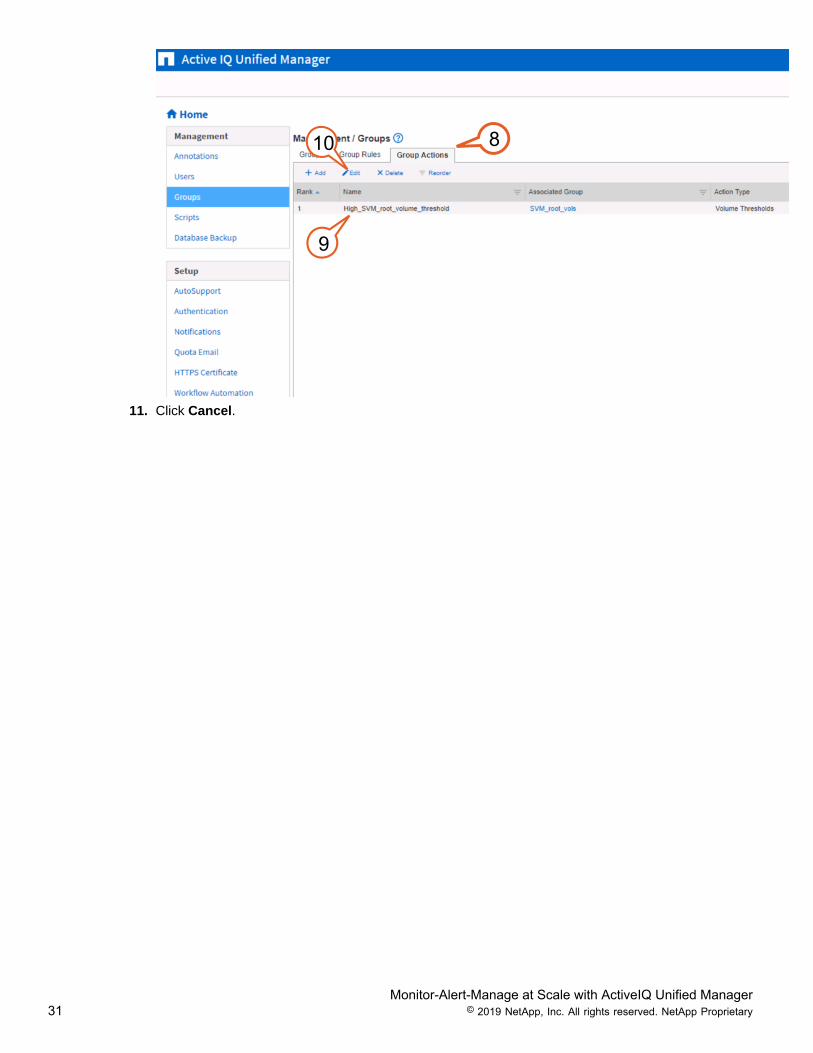
1. Click on the gear icon at the upper right to go to the Administrative options menu.
2. Select Groups in the Management section on the left menu.
Notice that the groups in this environment are applied to only Volume objects. Clusters and SVMs canalso be members of a group.
3. Click SVM_root_vols.

Monitor-Alert-Manage at Scale with ActiveIQ Unified Manager28 © 2019 NetApp, Inc. All rights reserved. NetApp Proprietary
2
3
Figure 4-30:
You can see in this view that the “SVM_root_vols” group has an associated rule as well as an associatedaction.
Note: A rule is a condition or a set of conditions that must be met for an object to be a member ofthat group.
4. Click Manage Group Rules to discover how objects become members of this group.
4
Figure 4-31:
5. Click the SVM_root_vols name to highlight the entry.6. Click Edit.

Monitor-Alert-Manage at Scale with ActiveIQ Unified Manager29 © 2019 NetApp, Inc. All rights reserved. NetApp Proprietary
5
6
Figure 4-32:
This group rule is very simple, as it matches any volume containing “_root” in its name. Remember thatthe objects allowed in a group are clusters, SVMs, and volumes. The “Target Object Type” on this ruleis set to “Volume”. The “Conditions” section allows for both “and” and “or” conditions to be set in order tocreate very specific rules that include multiple conditions.
7. Click Cancel.

Monitor-Alert-Manage at Scale with ActiveIQ Unified Manager30 © 2019 NetApp, Inc. All rights reserved. NetApp Proprietary
7
Figure 4-33:
8. Click Group Actions to view the actions that have been established and can be applied to a group.9. Click on the name of the action to highlight the entry.10. Click Edit. .
This group action overrides the global capacity threshold values. Since the volumes in this group areSVM root volumes, they are very small, and are not anticipated to grow much.
Note: In certain conditions, log files can build up and require clean up, or increasing the volumesize may be necessary, so it is still a good practice to alert when they get full.
Monitor-Alert-Manage at Scale with ActiveIQ Unified Manager31 © 2019 NetApp, Inc. All rights reserved. NetApp Proprietary
8
9
10
11. Click Cancel.

Monitor-Alert-Manage at Scale with ActiveIQ Unified Manager32 © 2019 NetApp, Inc. All rights reserved. NetApp Proprietary
11
Figure 4-34:
Note: Take time to investigate the other groups, and what conditions are required for objectsto be in those groups. Because rules are used to populate the groups, any new storage objectsthat are created with those same conditions will automatically be added to the group, and theassociated actions will apply to them as well.
In this lab activity, you have reviewed annotations and annotation rules, and how they can be used to organizestorage objects and automatically assign annotations to new objects as they are created. You also reviewed howgroups can provide consistency across like storage objects as they are created. Both lead to more effective andconsistent storage management.
4.4 Favorites Page
The Favorites dashboard provides faster access to critical storage objects. Cluster, aggregate and volumes canbe added to the favorites dashboard. This page intelligently provides relevant information based on the storageobject type. For example, an aggregate would display capacity utilization and performance statistics, whereas avolume will display capacity utilization, protection, and performance statistics.
In this activity you look at the default favorites that are included with AIQUM, view the information available for afavorite, and finally add a favorite to your Favorites dashboard.

Monitor-Alert-Manage at Scale with ActiveIQ Unified Manager33 © 2019 NetApp, Inc. All rights reserved. NetApp Proprietary
Tasks
Review currently installed Favorites
Review advantages of using Favorites and ability to easily get more details
Add a new Favorite
4.4 Overview of Favorites1. If you have not already logged into AIQUM, log in and view the dashboard.2. Select Favorites on the left
menu..
2
Figure 4-35: 3.4-1
Note: Notice that for each favorite item on this page there are different details provided in thisview that are closely related to the object type. Take a moment to examine the page. At a quickglance you can see that the engineering volume does not have a data protection relationshipassociated with it. This is just one example of how important details will pop up on this view ofitems you deem to be “Favorite”.
Monitor-Alert-Manage at Scale with ActiveIQ Unified Manager34 © 2019 NetApp, Inc. All rights reserved. NetApp Proprietary
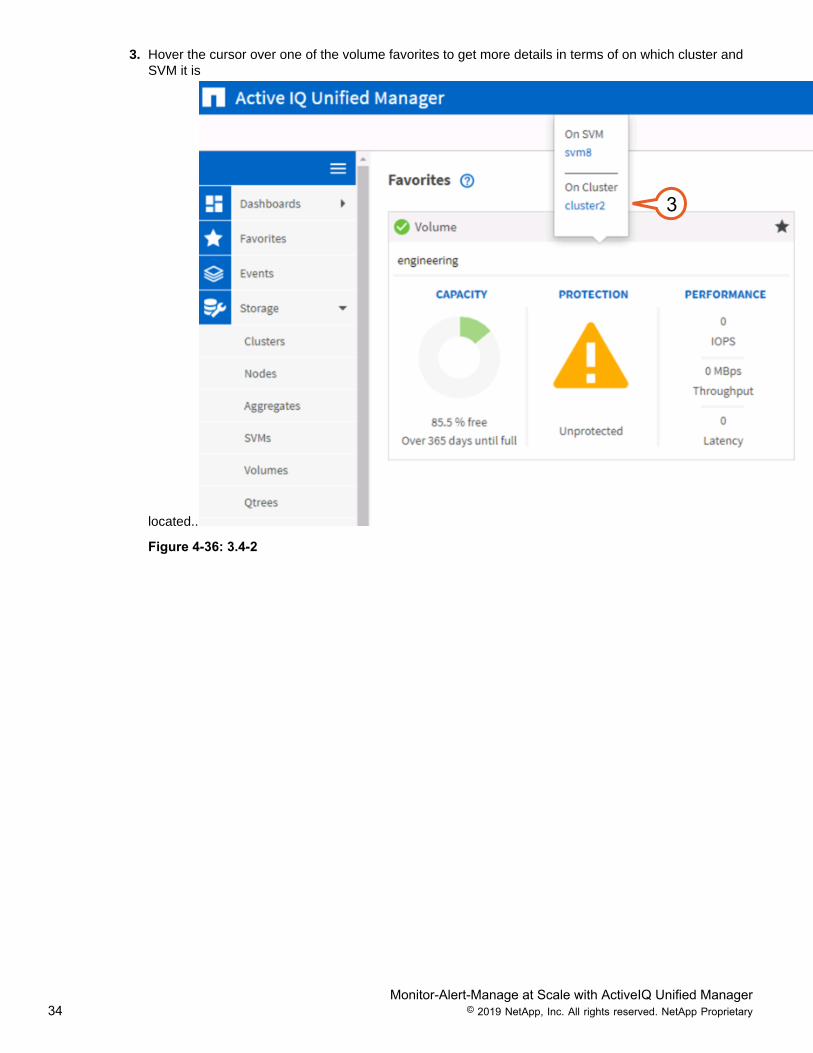
3. Hover the cursor over one of the volume favorites to get more details in terms of on which cluster andSVM it is
located..
3
Figure 4-36: 3.4-2
Monitor-Alert-Manage at Scale with ActiveIQ Unified Manager35 © 2019 NetApp, Inc. All rights reserved. NetApp Proprietary
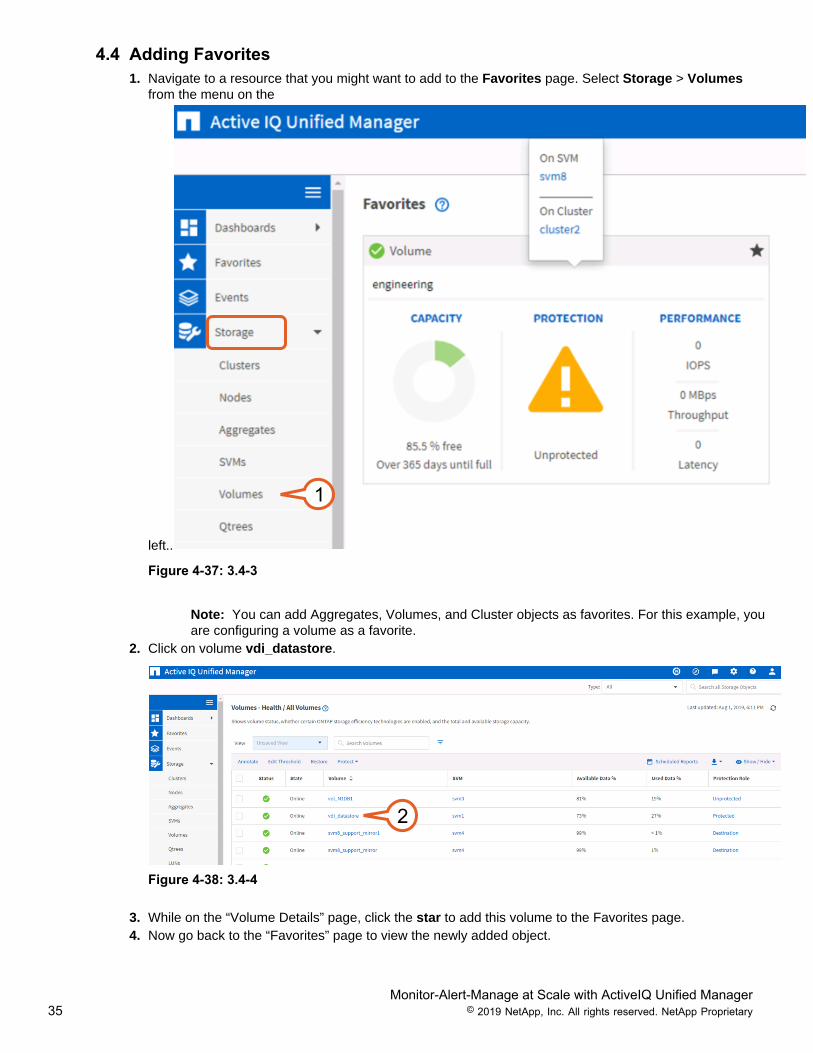
4.4 Adding Favorites1. Navigate to a resource that you might want to add to the Favorites page. Select Storage > Volumes
from the menu on the
left..
1
Figure 4-37: 3.4-3
Note: You can add Aggregates, Volumes, and Cluster objects as favorites. For this example, youare configuring a volume as a favorite.
2. Click on volume vdi_datastore.
2
Figure 4-38: 3.4-4
3. While on the “Volume Details” page, click the star to add this volume to the Favorites page.4. Now go back to the “Favorites” page to view the newly added object.

Monitor-Alert-Manage at Scale with ActiveIQ Unified Manager36 © 2019 NetApp, Inc. All rights reserved. NetApp Proprietary
34
Figure 4-39: 3.4-5
5. Notice the “vdi_datastore” volume is now listed on the favorites page. See how simple it is to populatethis page with the most important storage objects for quick access to their associated details!
5
Figure 4-40: 3.4-6
In this activity you have seen AIQUM Favorites and the details viewed for each. You have also added a Favoriteto the dashboard so that the status details of critical objects can be easily monitored.

Monitor-Alert-Manage at Scale with ActiveIQ Unified Manager37 © 2019 NetApp, Inc. All rights reserved. NetApp Proprietary
4.5 Capacity and Utilization
The key to effective capacity management is being proactive. ActiveIQ Unified Manager enables that by providingearly warning of potential capacity issues before they become critical, and reports at an aggregate or volumelevel of daily growth rates and "days to full" statistics. Through the use of Annotations, capacity utilization can bemonitored at a application, business unit, or geographic level.
Note: Reports and Annotations are covered in other activities of this lab.
The “Capacity” pane on the Overview dashboard, displays, as a graph, information about the capacity ofaggregates and storage virtual machines (SVMs) that are monitored by Unified Manager. The storage objectsare categorized as “Healthy”, “At Risk”, or “Have Incidents”. For example, the status of an aggregate whose usedcapacity has reached the full threshold value is displayed as “At Risk”. This pane also displays the number ofstorage objects in each of the categories.
In this activity you will locate the details for the yellow capacity event, and resolve the issue.
1. If you have not already logged into AIQUM, log in and navigate to Dashboards > Overview on the left.2. Look at the error, which is yellow under the “Capacity” section below, and click on the 1 above the yellow
SVMs bar graph.
2
1
Figure 4-41:
3. The capacity error is related to the “sales_east” volume being full.4. This time acknowledge the error before correcting it. Click the checkbox on the left side of this entry.5. Click Acknowledge.

Monitor-Alert-Manage at Scale with ActiveIQ Unified Manager38 © 2019 NetApp, Inc. All rights reserved. NetApp Proprietary
34
5
Figure 4-42:
6. Notice the “State” changed for this event. This will communicate to other AIQUM users that someone isworking on the issue.
7. To resolve the event, click on the source volume name svm8:/sales_east.
6
7
Figure 4-43:
8. Notice that this volume has a “Full Threshold” set to 40%. Since the volume has sufficient space, adjustthe threshold level to a more appropriate value.
9. Click Actions > Edit Thresholds.

Monitor-Alert-Manage at Scale with ActiveIQ Unified Manager39 © 2019 NetApp, Inc. All rights reserved. NetApp Proprietary
8
9
Figure 4-44:
10. Click Restore to Defaults to remove the custom thresholds for this volume, and set them back to theglobal capacity threshold defaults.

Monitor-Alert-Manage at Scale with ActiveIQ Unified Manager40 © 2019 NetApp, Inc. All rights reserved. NetApp Proprietary
10
Figure 4-45:
11. Notice the “Space Nearly Full”, and “Space Full” thresholds that will be applied with this change.12. Click OK.

Monitor-Alert-Manage at Scale with ActiveIQ Unified Manager41 © 2019 NetApp, Inc. All rights reserved. NetApp Proprietary
11
12
Figure 4-46:
13. Click Close on the “Success” confirmation window.
13
Figure 4-47:
14. Navigate to Dashboards > Overview on the left.
Note: The yellow indicator on the Capacity pane in the SVMs graph may take a while takea few minutes to show the new (green) status. You can either wait for this update on thedashboard, or continue with the next activity and notice it turn green as you finish other tasks.

Monitor-Alert-Manage at Scale with ActiveIQ Unified Manager42 © 2019 NetApp, Inc. All rights reserved. NetApp Proprietary
14
Figure 4-48: 3.5-8
15. Now that you resolved the issue, mark the event as “Resolved”. Click on Events on the left.16. Click the checkbox on the left of the event, and click Mark as Resolved.
15
16
Figure 4-49:
In this activity you discovered a capacity issue with one of the SVMs, acknowledged the event to let others knowyou were working on it, then quickly corrected the problem. This was all done from a single tool. This activityshowed quick and proactive storage management at work.
4.6 Alerts
In order to enable quick response to events when they occur, and minimize potential disruption to users,OnCommand Unified Manager can be configured to send notifications that alert you about events in yourenvironment. These notifications can be in the form of SNMP traps, or emails to appropriate individuals or groups.
In addition to SNMP traps and email notifications, an alert can also trigger a pre-defined script. These customerwritten scripts can provide additional information about the event, or possibly take corrective action. The scriptmust be written in Perl, Shell, PowerShell, or be a batch file. The OCUM Alert can pass the following argumentsto the script being called: eventID, eventSourceID, eventSourceName, eventSourceType, eventState, eventArgs.
When you create an alert you will define:
• What resources this alert will apply to.• What category and type of event(S) to which it applies.• What action(s) are taken. (Email, SNMP trap, script).
In the following activity you are going to create an alert based on data aggregate events.
1. If you have not already logged into OCUM, log in, and view the dashboard.
Monitor-Alert-Manage at Scale with ActiveIQ Unified Manager43 © 2019 NetApp, Inc. All rights reserved. NetApp Proprietary
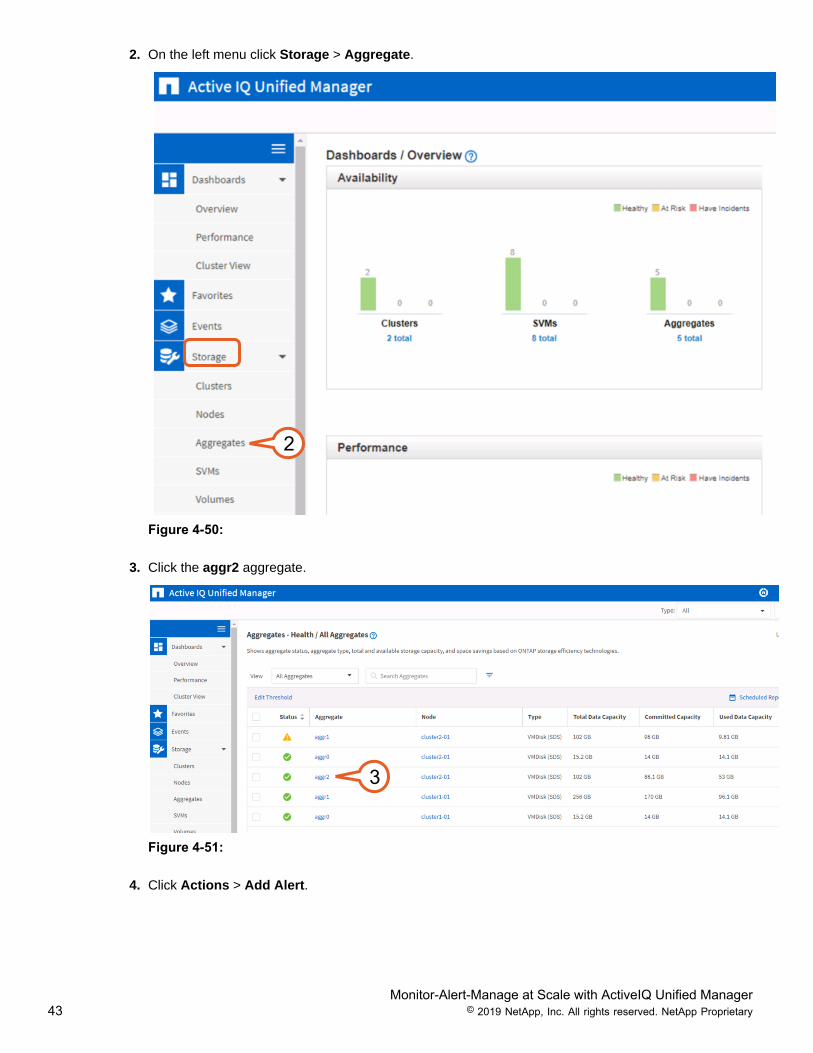
2. On the left menu click Storage > Aggregate.
2
Figure 4-50:
3. Click the aggr2 aggregate.
3
Figure 4-51:
4. Click Actions > Add Alert.
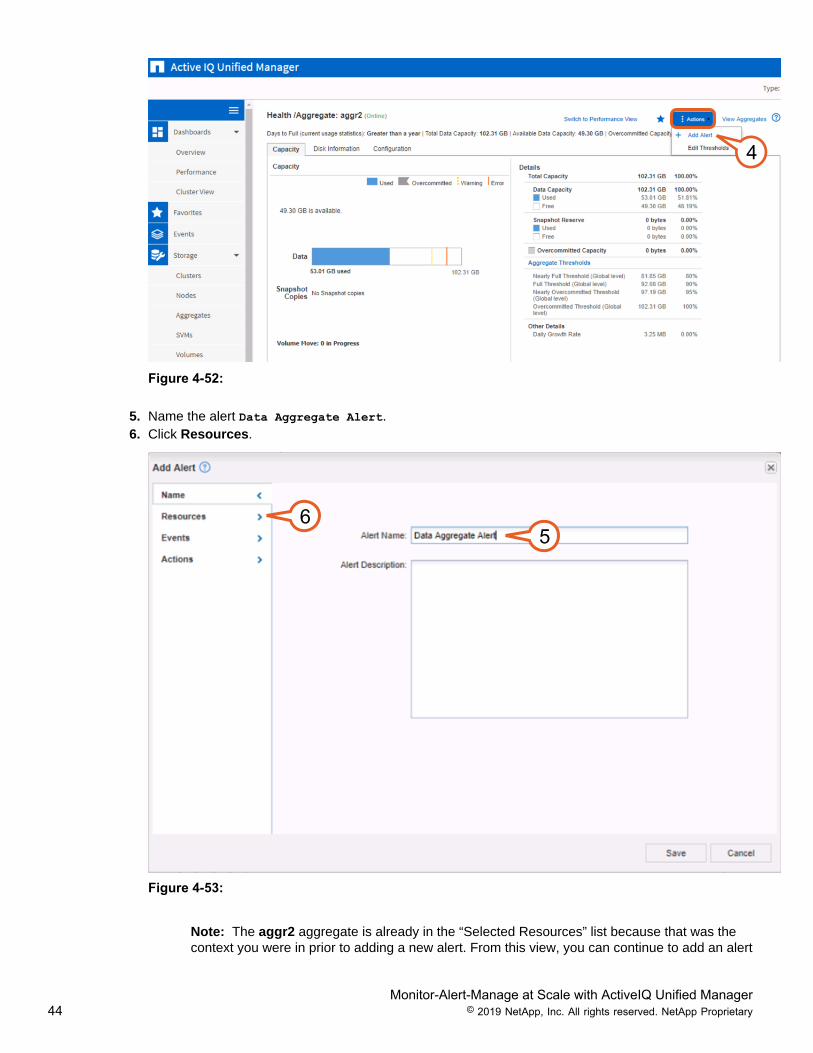
Monitor-Alert-Manage at Scale with ActiveIQ Unified Manager44 © 2019 NetApp, Inc. All rights reserved. NetApp Proprietary
4
Figure 4-52:
5. Name the alert Data Aggregate Alert.6. Click Resources.
56
Figure 4-53:
Note: The aggr2 aggregate is already in the “Selected Resources” list because that was thecontext you were in prior to adding a new alert. From this view, you can continue to add an alert

Monitor-Alert-Manage at Scale with ActiveIQ Unified Manager45 © 2019 NetApp, Inc. All rights reserved. NetApp Proprietary
for the one object you selected (aggr2), or you can modify the alert to include/exclude otherobjects. Because this activity is mainly focused on data aggregate events, you are going toremove the specific object, add all aggregates, then exclude the non-data aggregates (aggr0).
7. Click on the double-left arrow <<- to remove all currently selected aggregates (aggr2).8. Click the << All Aggregates >> resource.9. Click the right arrow -> to move it under “Selected Resources”.
7
8
9
Figure 4-54:
10. Click the Exclude tab.
Note: The Exclude tab will be greyed out until you put << All Aggregates >> in the selectedresource list.
11. Enter aggr0 in the “Name contains” field, and click Add.
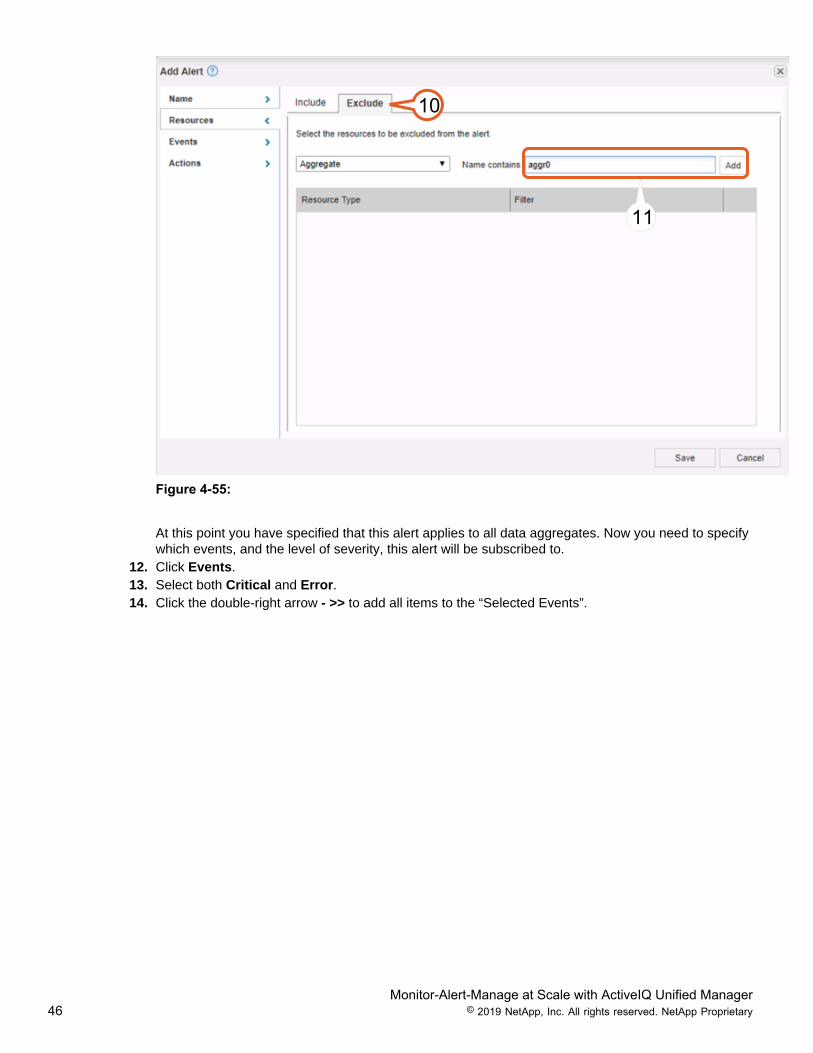
Monitor-Alert-Manage at Scale with ActiveIQ Unified Manager46 © 2019 NetApp, Inc. All rights reserved. NetApp Proprietary
10
11
Figure 4-55:
At this point you have specified that this alert applies to all data aggregates. Now you need to specifywhich events, and the level of severity, this alert will be subscribed to.
12. Click Events.13. Select both Critical and Error.14. Click the double-right arrow - >> to add all items to the “Selected Events”.

Monitor-Alert-Manage at Scale with ActiveIQ Unified Manager47 © 2019 NetApp, Inc. All rights reserved. NetApp Proprietary
12 13
14
Figure 4-56:
This specifies that this alert applies to all Critical and Error events for all non-data aggregates.
Now specify what notification or action will be taken when one of these events occur.15. Click Actions.16. Click the Alert these users: drop down list, and select admin.
Note: This can be a user, or a group of users.17. Set the “Notification Frequency” to Remind every 15 minutes.18. Click Save.

Monitor-Alert-Manage at Scale with ActiveIQ Unified Manager48 © 2019 NetApp, Inc. All rights reserved. NetApp Proprietary
1516
17
18
Figure 4-57:
Note: You can also attach a script for remedial actions on a type of event. To perform this,simply add the script in the “Select script to execute”. You are not actually configuring this in thissession.
19. To view this new alert, along with all other defined alerts, in the left menu click Configuration >Alerting.
Note: Notice that this is the only alert that has been created in this environment to date.20. Select the alert, and you will see the alert details appear at the bottom of the
page. .19
20

Monitor-Alert-Manage at Scale with ActiveIQ Unified Manager49 © 2019 NetApp, Inc. All rights reserved. NetApp Proprietary
You have just extended Unified Manager's event detection capability to provide alert notification forthose events that are most critical to storage operations. This enables administrators to react quicklyand minimize or eliminate disruption to users.

Monitor-Alert-Manage at Scale with ActiveIQ Unified Manager50 © 2019 NetApp, Inc. All rights reserved. NetApp Proprietary
5 ReferencesThe following references were used to create this lab guide.
• Unified Manager 9.6 Documentation Center• ActiveIQ Unified Manager 9.6 Workflow Guide for Managing Cluster Health

Monitor-Alert-Manage at Scale with ActiveIQ Unified Manager51 © 2019 NetApp, Inc. All rights reserved. NetApp Proprietary
6 Version History
Version Date Document Version History
1.0 August 2018 Initial Release
1.1 August 2019 Update to AIQUM 9.6/ONTAP 9.6

Refer to the Interoperability Matrix Tool (IMT) on the NetApp Support site to validate that the exactproduct and feature versions described in this document are supported for your specific environment.The NetApp IMT defines the product components and versions that can be used to constructconfigurations that are supported by NetApp. Specific results depend on each customer's installation inaccordance with published specifications.
NetApp provides no representations or warranties regarding the accuracy, reliability, or serviceability of anyinformation or recommendations provided in this publication, or with respect to any results that may be obtainedby the use of the information or observance of any recommendations provided herein. The information in thisdocument is distributed AS IS, and the use of this information or the implementation of any recommendations ortechniques herein is a customer’s responsibility and depends on the customer’s ability to evaluate and integratethem into the customer’s operational environment. This document and the information contained herein may beused solely in connection with the NetApp products discussed in this document.
Go further, faster®
© 2019NetApp, Inc. All rights reserved. No portions of this document may be reproduced without prior written consentof NetApp, Inc. Specifications are subject to change without notice. NetApp, the NetApp logo, Data ONTAP®,ONTAP®, OnCommand®, SANtricity®, FlexPod®, SnapCenter®, and SolidFire® are trademarks or registeredtrademarks of NetApp, Inc. in the United States and/or other countries. All other brands or products are trademarks orregistered trademarks of their respective holders and should be treated as such.